

Abstract
Increased production of reactive oxygen species plays an essential role in the pathogenesis of several diseases, including cardiac hypertrophy. In our search to identify redox-sensitive targets that contribute to redox signaling, we found that protein tyrosine phosphatase 1B (PTP1B) was reversibly oxidized and inactivated in hearts undergoing hypertrophy. Cardiomyocyte-specific deletion of PTP1B in mice (PTP1B cKO mice) caused a hypertrophic phenotype that was exacerbated by pressure overload. Furthermore, we showed that argonaute 2 (AGO2), a key component of the RNA-induced silencing complex, was a substrate of PTP1B in cardiomyocytes and in the heart. Our results revealed that phosphorylation at Tyr393 and inactivation of AGO2 in PTP1B cKO mice prevented miR-208b-mediated repression of thyroid hormone receptor-associated protein 1 (THRAP1, also known as MED13) and contributed to thyroid hormone-mediated cardiac hypertrophy. In support of this conclusion, inhibiting the synthesis of triiodothyronine (T3) with propylthiouracil rescued pressure overload-induced hypertrophy and improved myocardial contractility and systolic function in PTP1B cKO mice. Together, our data illustrate that PTP1B activity is cardioprotective and that redox signaling is linked to thyroid hormone responsiveness and microRNA-mediated gene silencing in pathological hypertrophy.
INTRODUCTION
The precise role of reactive oxygen species (ROS) in cardiovascular disease progression continues to be controversial despite numerous studies associating ROS with cardiac hypertrophy, ischemia and heart failure (1–3). Although ROS may be perceived as players or drivers in most pathologies, whether oxidative stress - caused by an abnormally high level of cellular oxidants in cells - exacerbates redox signaling is unclear. In the mouse heart, decreasing ROS levels either genetically or pharmacologically prevents the transition from cardiac hypertrophy to heart failure (4–6) and protects the heart from ischemia-reperfusion injury (7). Furthermore, mice ectopically expressing a tunable hydrogen peroxide-generating oxidase in the heart display systolic dysfunction and hypertrophy (8). However, the majority of redox-regulated signaling events that promote cardiac hypertrophy have yet to be elucidated.
Regulation of protein phosphorylation by redox signaling has emerged as a determining factor that separates physiological from pathological signaling (9–11). During homeostasis, reversible oxidation of the catalytic cysteine residue of members of the protein tyrosine phosphatase (PTP) superfamily allows changes in the cellular redox microenvironment to fine-tune dephosphorylation by transiently inhibiting the catalytic activity of PTPs (11–13). However, to date, the identity of PTPs that become reversibly oxidized in cardiac hypertrophy and heart failure progression is unknown. The genetic inactivation of mitogen-activated protein kinase phosphatases (MKPs) and Src-homology 2 domain-containing phosphatase (SHP2) results in cardiac growth and remodeling (14–16). In contrast, global deletion of protein tyrosine phosphatase 1B (PTP1B, encoded by the PTPN1 gene) or systemic pharmacological inhibition of the phosphatase in mice confers cardioprotective effects by an unknown mechanism (16, 17). Given that studies using tissue-specific PTP1B knockout (KO) mice have revealed that PTP1B controls complex organ- and cell-type-specific signaling events (18–23), we sought to determine whether cardioprotection observed in the whole-body KO was conferred by cardiomyocyte-targeted PTP1B inactivation.
In testing this hypothesis, we identified PTP1B as a target of ROS signaling in pressure overload-induced hypertrophy. To better understand how PTP1B inactivation contributes to cardiac hypertrophy, we generated cardiomyocyte-specific PTP1B KO (PTP1B cKO) mice. We showed that ablation of PTP1B in cardiomyocytes exacerbated pressure overload-mediated pathological remodeling. We observed that inactivation of PTP1B increased phosphorylation of its substrate, argonaute 2 (AGO2) at Tyr393, a phosphorylation event that prevents microRNA (miRNA) loading onto AGO2 (24). Moreover, we showed that loading of miR-208b onto AGO2 was compromised when PTP1B was inactivated, leading to defective miRNA-mediated repression of thyroid hormone receptor-associated protein 1 (THRAP1, also known as MED13) and triiodothyronine (T3)-mediated hypertrophy. Our findings shed light on the role of PTP1B inactivation by ROS in regulating gene silencing and the thyroid hormone response in pathological cardiac hypertrophy.
RESULTS
Cardiomyocyte-specific deletion of PTP1B exacerbates hypertrophy
To gain insight into the cardiac function of PTP1B, we first assessed whether PTP1B was reversibly oxidized and inactivated in hearts undergoing hypertrophy. We measured the reversible oxidation and inactivation of PTP1B using a recombinant antibody (scFv45) that recognizes selectively the oxidized, inactive conformation of PTP1B (25, 26). Using scFv45, we purified and detected oxidized PTP1B in lysates from mice that sustained constriction of the transverse aorta (TAC) to induce pressure overload-induced hypertrophy. We demonstrated that reversible oxidation of PTP1B increased ~5-fold 1-week post-TAC and ~10-fold 2- and 4-weeks post-TAC (Fig. 1A), when hearts were developing concentric hypertrophy of the left ventricle (Fig. 1B, Table S1). In comparison, animals subjected to sham surgery did not show increased hypertrophy or PTP1B oxidation over the same 4-week period. Because knocking out a PTP gene mimics ROS-mediated PTP inactivation and increases the phosphorylation of its substrates, we generated a line of cardiomyocyte-specific PTP1B knockout (PTP1B cKO) mice to understand how PTP1B inactivation in cardiomyocytes affects the development of hypertrophy. Cardiomyocyte-specific deletion of PTP1B was achieved by crossing mice with loxP sites flanking exons 6 to 8 of PTP1B (the catalytic domain is contained in exons 7 and 8) (23) with a line of α-MHC-Cre mice previously validated for their lack of cardiotoxicity (Fig. S1A) (27). PCR genotyping of PTP1BF/+, PTP1BF/F and α-MHC-Cre/PTP1BF/F (PTP1B cKO) mice revealed a two-band pattern corresponding to heterozygotes possessing one WT (230 bp) and one floxed allele (280 bp) (Fig. S1B). A single band at 280 bp was observed for PTP1BF/F mice also possessing the α-MHC-Cre mice allele. PCR analysis of Ptpn1 mRNA from hearts, lungs and livers of α-MHC-Cre/PTP1BF/F mice confirmed that PTPN1 was effectively and specifically knocked out in cardiac tissue (Fig. S1C). PCR analysis of Ptpn1 in cardiac fibroblasts and cardiomyocytes further confirmed a cardiomyocyte-specific gene knockout (Fig. S1D), which was further substantiated by PTP1B immunoblots from PTP1BF/F or PTP1B cKO adult cardiomyocyte lysates (Fig. S1E). As anticipated based on previous studies using global PTP1B KO mice, PTP1B cKO mice were healthy and showed no apparent phenotype under basal conditions (18). However, echocardiographic imaging of 6–8 week-old PTP1B cKO mice revealed differences between PTP1BF/F and PTP1B cKO (Table S2). Specifically, PTP1B cKO mice showed small but significant bradycardia (R-R), left ventricular enlargement (LVDd), decreased left ventricular ejection fraction (EF) and fractional shortening (FS), and a nonsignificant increase in left ventricular mass (LV mass) (Fig. S2, A to E). Control PTP1BF/F and PTP1B cKO mice were examined 4 weeks after sham surgery or TAC. As expected, PTP1BF/F mice subjected to TAC had larger hearts and increased left ventricular wall thickness compared to those subjected to sham surgery (Fig. 1C, Sham compared to TAC PTP1BF/F). In PTP1B cKO mice, these TAC-induced morphological changes were increased (Fig. 1C, TAC PTP1BF/F compared to TAC PTP1B cKO), and as was the increase in heart weight to tibia length ratio (HW/TL) (Fig. 1D). Furthermore, the increased heart weight of PTP1B cKO mice correlated with an increase in cardiomyocyte cross-sectional area, an index of cardiomyocyte size (Fig. 1E, F). Collectively, these data demonstrate that PTP1B inactivation in cardiomyocytes promotes cardiac hypertrophy in vivo.
Figure 1. PTP1B is reversibly oxidized in hypertrophic hearts and deletion of PTP1B in cardiomyocytes exacerbates development of cardiac hypertrophy.
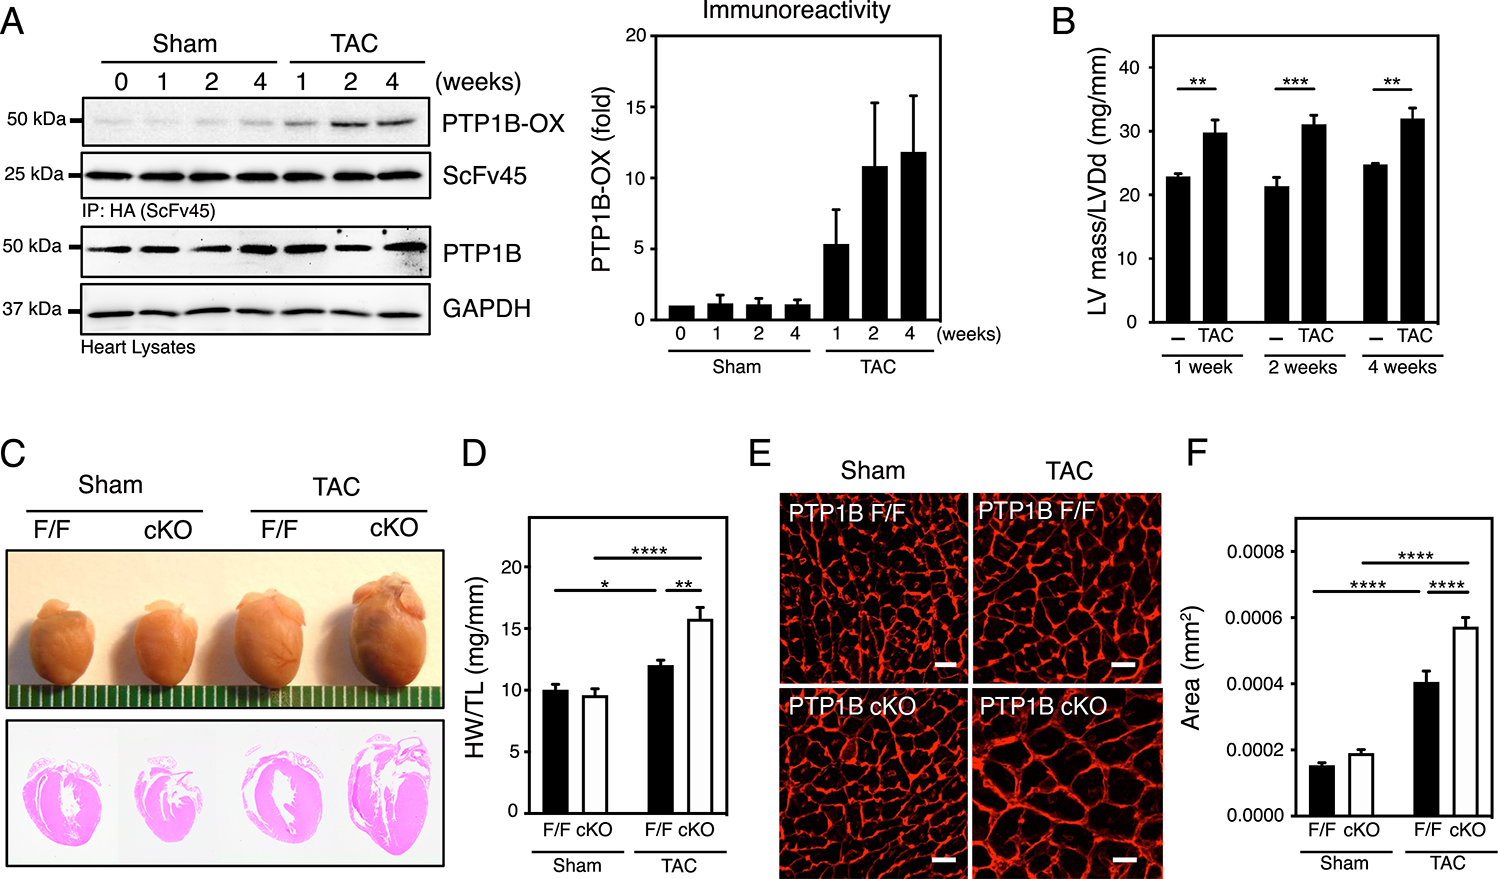
A) Oxidation of PTP1B was measured in Sham or TAC heart samples using a pulldown assay with scFv45, an intrabody specific for the oxidized form of PTP1B (PTP1B-OX). A representative set of immunoblots (left) and quantification of the aggregate data (right) for N=3 mice in each group are shown. Immunoblots were quantified using ImageJ software and presented as the means ± SEM. B) Left ventricular hypertrophy is reported as the ratio of left ventricular mass (LVM) / left ventricular end-diastolic diameter (LVDd) as assessed by echocardiography. Two-way ANOVA followed by Holm-Sidak post hoc tests, to compare Sham and TAC at each time of sacrifice, was performed on N=4 and N=6 mice for Sham and TAC respectively, at each time of sacrifice. See Table S1 for additional information. C) Anatomical view and histological hematoxylin and eosin (HE)-stained sections from hearts from sham and TAC PTP1BF/F and PTP1B cKO mice 4 weeks post-surgery. Representative of 3 mice for each group. D) Quantitative analysis of heart weight normalized to tibia length (HW/TL) for hearts from sham and TAC PTP1BF/F (black bars) and PTP1B cKO (white bars) mice 4 weeks post-surgery. Two-way ANOVA followed by Tukey’s post hoc tests was performed on N=8, N=10, N=6, and N=9 mice for sham PTP1BF/F, sham PTP1B cKO, TAC PTP1BF/F and PTP1B cKO, respectively. E) Representative left ventricular cross-sectional sections from hearts from sham and TAC PTP1BF/F and PTP1B cKO mice 4 weeks post-surgery labeled with Texas Red-X conjugated wheat germ agglutinin (WGA). Scale bars = 50 μm. F) Quantification of left ventricular cardiac myocyte cross-sectional area from WGA-labeled cardiomyocytes from sham and TAC PTP1BF/F (black bars) and PTP1B cKO (white bars) mice 4 weeks post-surgery. The area of N=24, N=20, N=20, N=25 myocytes from N=3 mice each from sham PTP1BF/F, sham PTP1B cKO, TAC PTP1BF/F and PTP1B cKO groups were measured. The measured areas were averaged for each mouse and a two-way ANOVA followed by Tukey’s post hoc tests was performed on the average. Data are presented as means ± SEM.
PTP1B exerts a cardioprotective function in response to pressure overload
Echocardiographic imaging to evaluate cardiac function revealed that 4 weeks post-TAC, the left ventricular filling patterns of PTP1B cKO hearts mice were substantially altered (Fig. 2A) and confirmed left ventricular hypertrophy as indicated by thickened LVAWd and LVPWd and increased LV mass, LV mass/LVDd and LV mass/BW (Fig. 2B, Table S3) in both PTP1BF/F and PTP1B cKO mice subjected to TAC for 4 weeks. 4 weeks post-TAC, PTP1B cKO mice showed greater left ventricular hypertrophy (as indicated by increased LV mass, LV mass/LVDd and LVmass/BW) and left ventricular dilation (as indicated by increased LVD and LVDd/BW). Echocardiography also revealed that TAC reduced left ventricular systolic function, as indicated by decreased fractional shortening (FS) and ejection fraction (EF), signs of early diastolic dysfunction (shortened EDT in TAC PTP1B cKO mice), and an overall decrease in myocardial performance as indicated by an increase in global MPI (Fig. 2C–E and Table S3) in PTP1B cKO mice compared to TAC PTP1BF/F littermates. Differences between PTP1BF/F and PTP1B cKO observed by echocardiographic imaging of ~8 week-old mice were blunted in ~12-week old mice that were sham-operated (Table S3). At the molecular level, cardiac hypertrophy is characterized by increased expression of fetal genes such as Myh7 (which encodes β-myosin heavy chain or β-MHC), Nppa (which encodes atrial natriuretic peptide or ANP) and Nppb (which encodes brain natriuretic peptide or BNP) in the adult heart (28, 29). Consistent with our morphometric and hemodynamic observations, qPCR analysis revealed that TAC increased Myh7, Nppa and Nppb mRNA expression in control PTP1BF/F mice (Fig. 2F). Whereas Nppa and Nppb mRNA abundance was also higher in PTP1B cKO mice subjected to TAC, the expected increase in Myh7 expression leading to the switch in MHC isoform expression in control TAC PTP1BF/F mice did not occur in TAC PTP1B cKO littermates. In addition to markers of hypertrophy, TAC induced significantly greater expression of Col1A1 (which encodes for collagen type 1 α1), suggestive of increased fibrosis, in PTP1B cKO mice than in TAC PTP1BF/F mice (Fig. 2 G). Together, these data indicate that loss of PTP1B function exacerbates both hypertrophy and the impairment of cardiac function induced by pressure overload.
Figure 2. Cardiomyocyte-specific deletion of PTP1B impairs left ventricular performance and β-MHC gene expression.
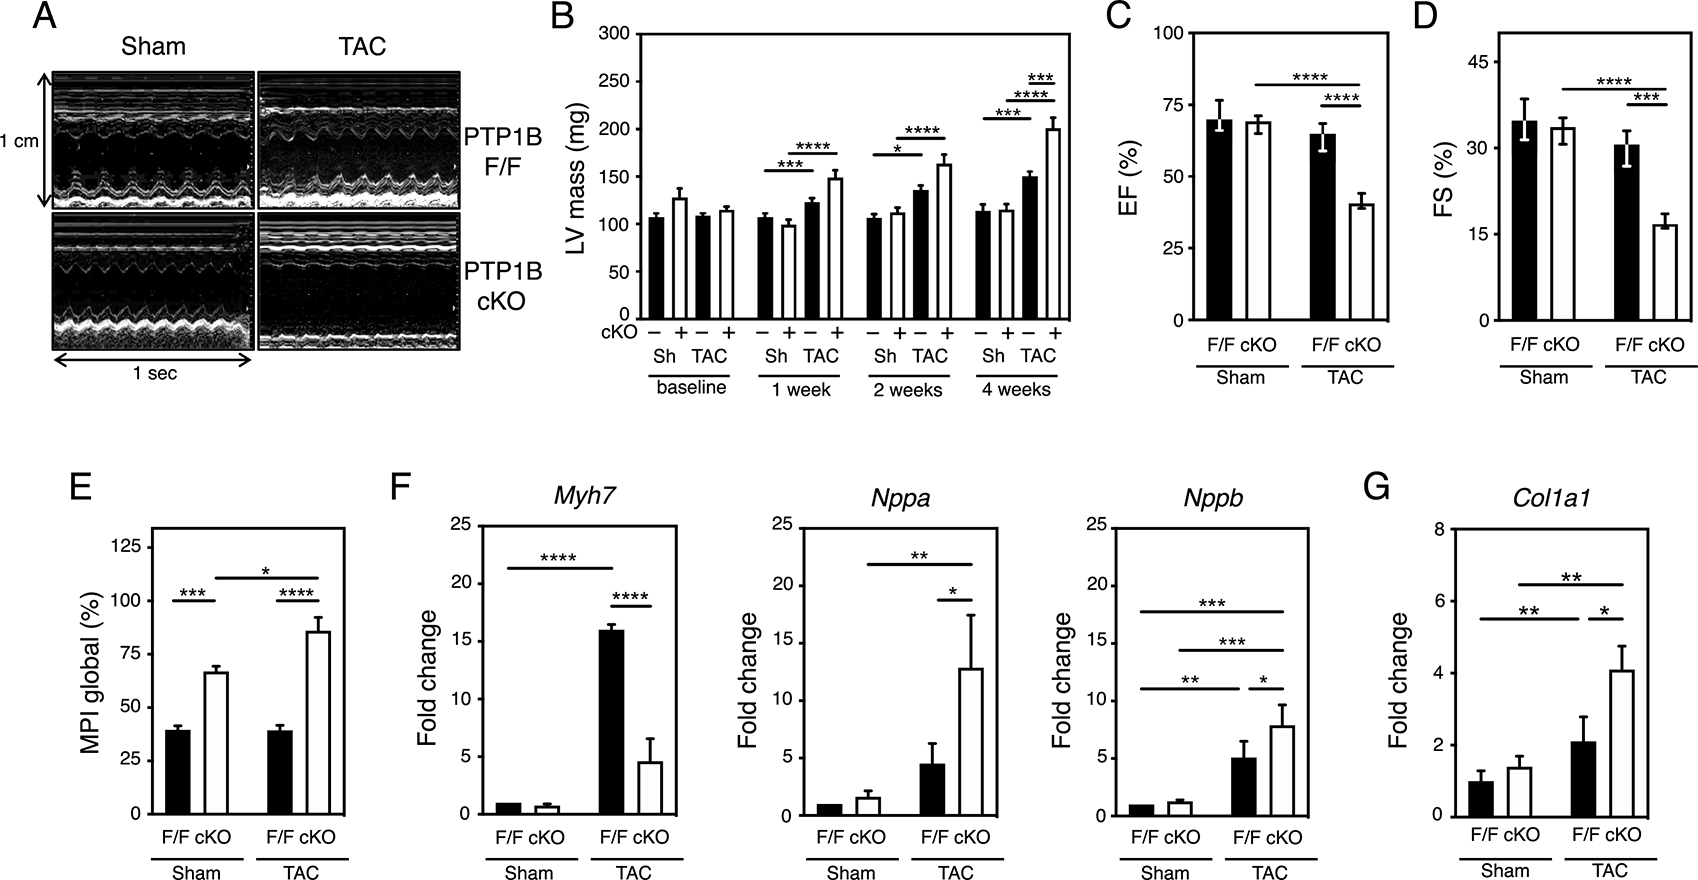
A) Representative M-mode echocardiograms of sham and TAC PTP1BF/F and PTP1B cKO mice 4 weeks post-surgery. B) Increase in left ventricular mass post TAC was determined by echography. Three-way ANOVA followed by Tukey’s post hoc tests was performed on N=7 to 12 mice for sham (sh) PTP1BF/F or PTP1B cKO and TAC PTP1BF/F or PTP1B cKO at each timepoint. C) Decreased left ventricular ejection fraction (LVEF) and D) left ventricular fractional shortening (LVFS) in PTP1BF/F and PTP1B cKO mice 4 weeks after being subjected to TAC. E) Impaired left ventricular myocardial performance (MPI) in PTP1BF/F and PTP1B cKO mice 4 weeks after being subjected to TAC. N=9 to 12 mice for each group (see Table S3 for additional information). F) Quantitation of molecular indicators of hypertrophy Myh7, Nppa and Nppb mRNA normalized to Gapdh mRNA by qRT-PCR analysis. Values from N=6 mice for each group are presented. G) Quantitation of Col1A1 mRNA, which encodes an indicator of cardiac fibrosis, normalized to Gapdh mRNA by qRT-PCR analysis. Values from N=3 mice for each group are presented. For C) to G), a two-way ANOVA followed by Tukey’s post hoc tests was performed. Data are presented as means ± SEM for normally distributed data and as median (1st quartile, 3rd quartile) for non-normally distributed data (C and D). Black bars represent PTP1BF/F and white bars represent PTP1B cKO mice.
PTP1B regulates the association between miRNA-208b and AGO2 in cardiac hypertrophy
The α and β MHC isoforms differ in their ability to generate velocity of shortening (30). The switch from the faster α-MHC to the slower β-MHC isoform in cardiac hypertrophy is generally thought to reduce contractile performance and contribute to functional maladaptation (31–33). Because exacerbated hypertrophy was observed in the absence of Myh7 expression in PTP1B cKO mice, we reasoned that understanding how PTP1B inactivation prevents Myh7 expression would shed some light on the molecular pathways underlying the PTP1B cKO hypertrophic phenotype. The MHC switch is regulated by miRNAs and thyroid hormones in development and hypertrophy (33–35). Hence, we first tested whether miRNA populations were affected by PTP1B inactivation and TAC by analyzing the expression status of 1908 murine miRNAs. At four weeks post-TAC, the pattern of induced and repressed miRNAs partially overlapped in PTP1BF/F or PTP1B cKO mice (Fig. S3). Because PTP1B inactivation leads to phosphorylation and inactivation of AGO2 in cells (24, 36), we identified miRNAs that were abundant in TAC PTP1BF/F mice and aberrantly regulated in PTP1B cKO hearts. We identified miR-208b (indicated by * in Fig. S3), a cardiac-restricted miRNA (myomiR) that regulates the MHC switch, as being one of the top 20 miRNAs showing the greatest increase in expression in PTP1BF/F and PTP1B cKO hearts 4 weeks post-TAC (as assessed by log2 values relative to sham-operated hearts) (34). miR-208a and miR-208b, which are encoded by the myosin genes Myh6 (which also encodes α-MHC) and Myh7 (which also encodes β-MHC), respectively, mediate the actions of thyroid hormone in the heart (35). Although they possess the same seed sequence and are thought to silence an overlapping selection of transcripts in the heart (34), their regulation in cardiac hypertrophy is unclear. Quantitative PCR analysis confirmed that the abundance of miR-208b but not miR-208a increased in cardiac hypertrophy (Fig. 3A, B). We reported that PTP1B maintains the RNA-induced silencing complex (RISC) gene silencing machinery active by directly dephosphorylating AGO2 on Tyr393 in cells (24, 36); consequently, specific miRNAs are not loaded unto AGO2, despite being highly abundant when PTP1B is inactivated. Because TAC-induced Myh7 transcript expression was compromised in PTP1B cKO hearts (Fig. 2F), we investigated if the difference in Myh7 expression in PTP1B cKO hearts resulted from decreased silencing by miR-208b. Quantitative PCR analysis of AGO2 immunoprecipitates revealed that the association of miR-208a with AGO2 was not affected by lack of PTP1B or TAC (Fig. 3C). In contrast, the association of AGO2 with miR-208b increased approximately ~1000-fold in hypertrophic TAC PTP1BF/F hearts; however, miR-208b did not associate with AGO2 in TAC PTP1B cKO hearts, despite increased abundance of the miRNA (Fig. 3D). This result suggests that PTP1B inactivation uncouples the expression of specific miRNAs from their ability to posttranscriptionally repress genes in cardiomyocytes.
Figure 3. PTP1B regulates the association of miR-208b with AGO2 in hypertrophic hearts.
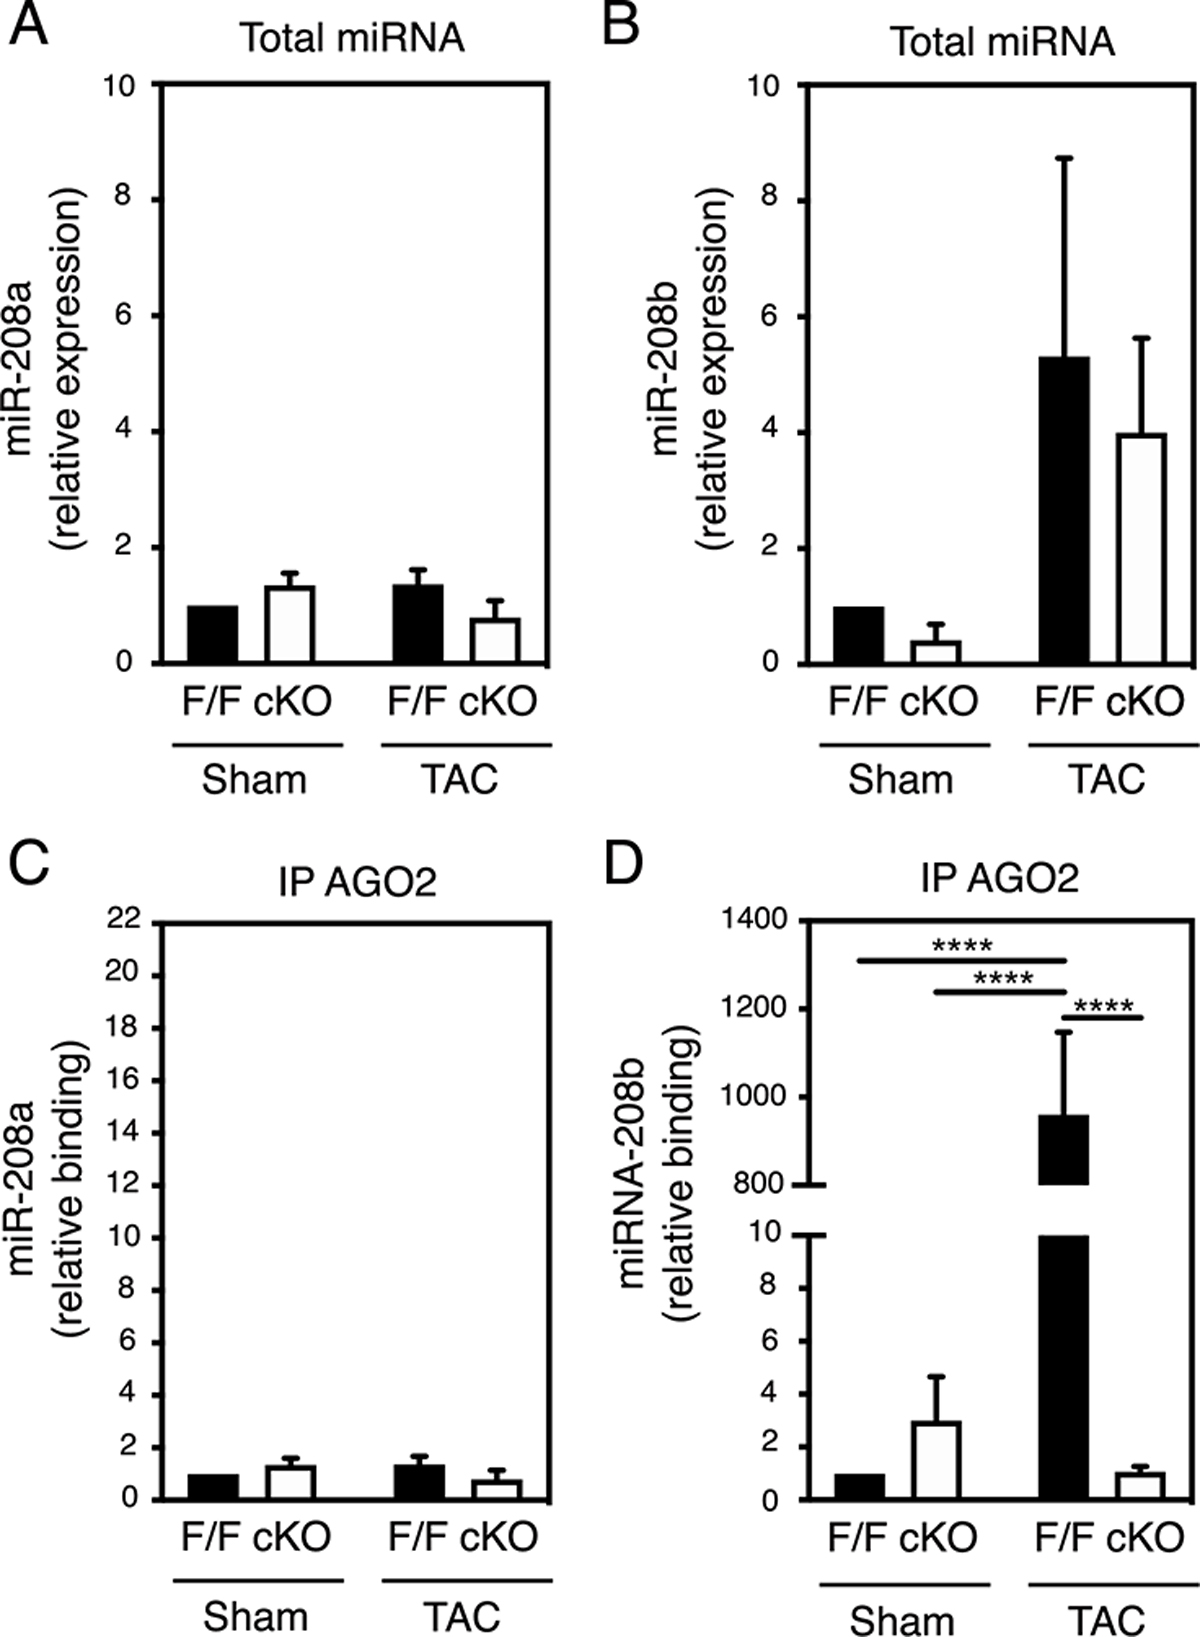
A) and B) Quantitation of miR-208a (A) and miR-208b (B) levels by qRT-PCR analysis in hearts from sham and TAC PTP1BF/F and PTP1B cKO mice 4 weeks post-surgery. C) and D) AGO2 was immunoprecipitated from heart lysates from sham and TAC PTP1BF/F and PTP1B cKO mice 4 weeks post-surgery, and AGO2-associated miRNAs were extracted. After cDNAs were synthesized, AGO2-bound miR-208a (C) and miR-208b (D) were assessed by qRT-PCR analysis. miRNA expression levels and AGO2-enrichment were normalized to 1 in sham PTP1BF/F hearts. Data from N=3 mice for each group are presented as mean ± SEM. Black bars represent PTP1BF/F and white bars represent PTP1B cKO mice. Two-way ANOVA followed by Tukey’s post hoc tests was performed.
AGO2 is a substrate of PTP1B in cardiomyocytes and hearts undergoing hypertrophy
miRNAs are important in cardiovascular development and disease (34, 37, 38). Phosphorylation of Tyr393 impairs miRNA loading onto AGO2 in cells (24, 39) and PTP1B promotes gene silencing through dephosphorylation of AGO2 at this residue (24). We therefore tested if the inactivation of PTP1B contributes to AGO2 phosphorylation in cardiomyocytes by using a PTP1B-substrate trapping mutant. The D181A mutation creates a catalytically impaired form of PTP1B, which maintains a high affinity for substrates (40) (Fig. 4A). His-tagged PTP1B D181A was used to capture substrates from cellular extracts of cardiomyocytes stimulated with the hypertrophic agents endothelin-1 (ET-1) or angiotensin II (Ang II). This approach confirmed that AGO2 was part of the PTP1B D181A immune complex and a potential substrate of the phosphatase in cardiomyocytes stimulated with hypertrophic agents (Fig. 4B). To further assess whether AGO2 is a substrate for PTP1B in the hypertrophying myocardium, we generated Cre/loxP conditional Rosa26-targeted transgenic mice that overexpressed a 3X-Flag-PTPN1 D181A transgene and an eGFP/luciferase reporter (Fig. S4A) and crossed these mice with Meox2-Cre mice. Excision of the STOP cassette was assessed by live imaging as previously described (Fig. S4B) (41). Analysis of Flag-PTP1B immunoprecipitates from hearts of Rosa26PTPN1-D181A/WT mice two weeks post-TAC revealed that AGO2 was a substrate of PTP1B in vivo (Fig. 4C).
Figure 4. Identification of Argonaute 2 as a substrate of PTP1B in cardiac myocytes and in the heart.
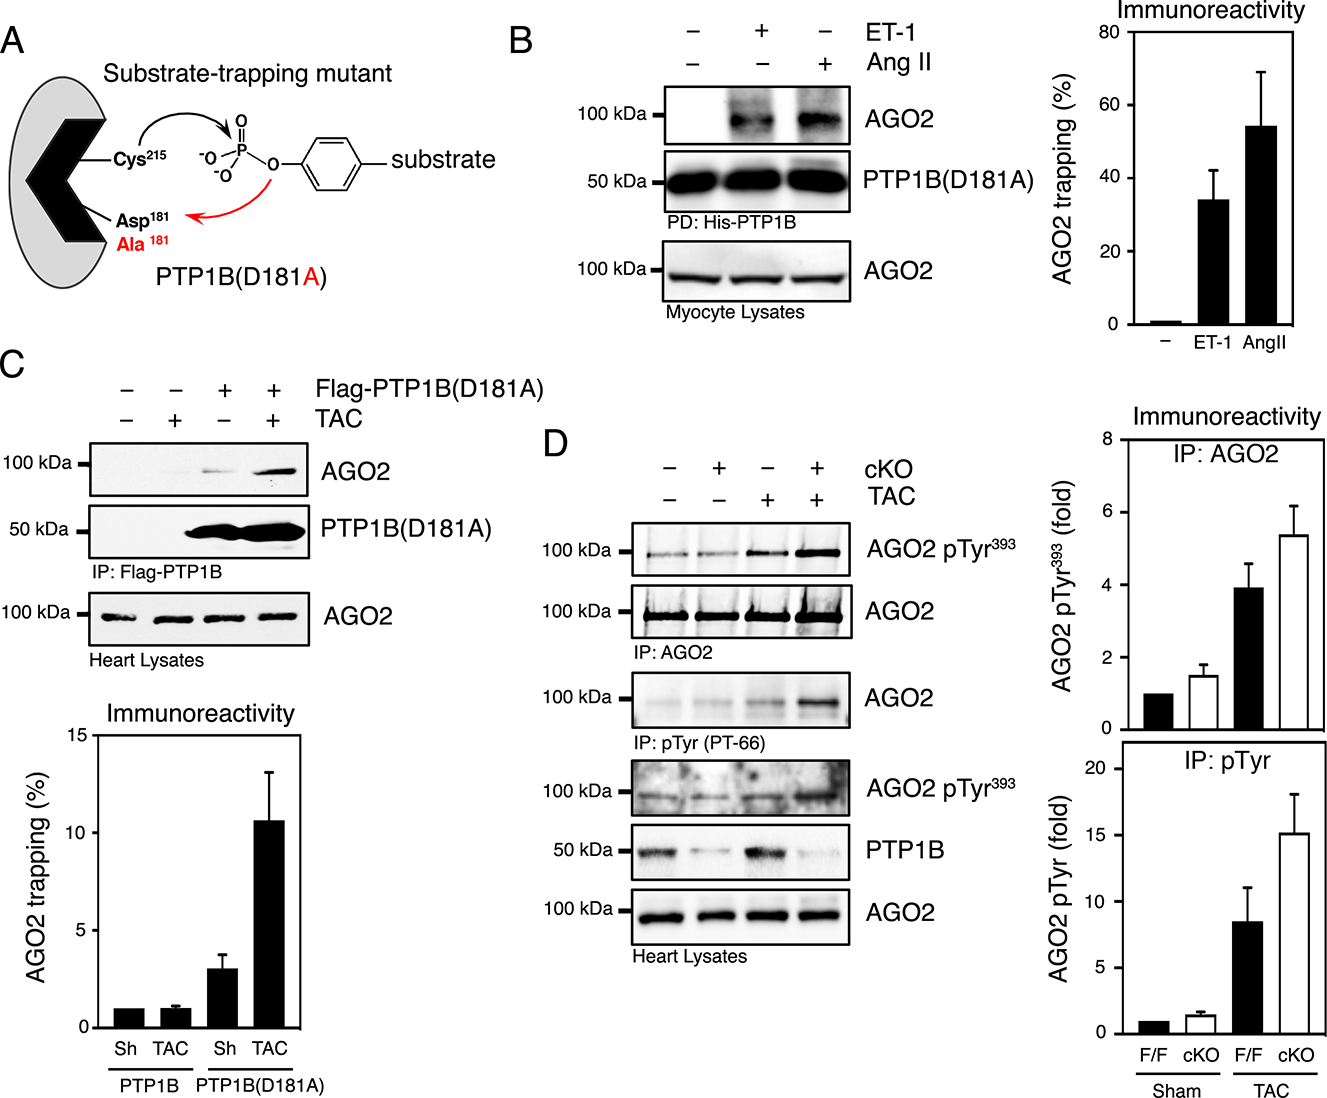
A) Substrate-trapping mutant of PTP1B. Mutation of Asp181, the residue that functions as a general acid in the first step of catalysis, to Ala creates a catalytically impaired mutant of PTP1B that maintains a high affinity for substrates but does not catalyze dephosphorylation effectively. B) Substrate-trapping using PTP1B(D181A) in lysates from cardiomyocytes treated with vehicle, endothelin-1 or Angiotensin II (100 nM). Purified PTP-substrate complexes were immunoblotted with an anti-AGO2 antibody. Lysates were probed for AGO2 immunoreactivity to confirm the expression of AGO2. Representative Western blot images (left) and quantification of the aggregate data (right) for N=3 mice in each group are shown. Immunoblots were quantified and presented as the means ± SEM with the basal value set to 1 as a reference and agonist-dependent increase in AGO2 substrate-trapping expressed relative to basal. C) Lysates from sham or TAC hearts from control transgenic mice (Rosa26WT/WT) or from transgenic mice expressing Flag-PTP1B(D181A) (Rosa26PTPN1-D181A/WT) two weeks post-surgery were subjected to substrate-trapping and blotted with an anti-AGO2 antibody. The efficiency of the immunoprecipitation was monitored by immunoblotting for Flag and AGO2. AGO2 levels were also examined in heart lysates. N=3 independent experiments. Immunoblots were quantified and presented as the means ± SEM with the basal value (sham-Rosa26WT/WT) set to 1 as a reference. D) AGO2 and tyrosine phosphorylated AGO2 were immunoprecipitated from sham and TAC PTP1BF/F and PTP1B cKO mice 4 weeks post-surgery using anti-AGO2 or PT-66 antibodies. Immunoprecipitates were immunoblotted using an anti-phospho-Tyr393 AGO2 and reprobed with an anti-AGO2 antibody (top panel) and tyrosine-phosphorylated proteins were immunoblotted using an anti-AGO2 antibody (middle panel). Heart lysates were resolved and immunoblotted using an anti-phospho-Tyr393 AGO2, anti-AGO2 and anti-PTP1B antibodies to illustrate phosphorylation and expression levels in PTP1B cKO mice. N=3 independent experiments. Immunoblots were quantified and presented as the means ± SEM. Black bars represent PTP1BF/F and white bars represent PTP1B cKO mice.
We next asked whether PTP1B inhibition increases AGO2 phosphorylation during hypertrophy. Immunoblotting of AGO2 immunoprecipitates revealed increased AGO2 phosphorylation at Tyr393 in PTP1BF/F and PTP1B cKO hearts 4 weeks post-TAC. To assess the overall phosphorylation state of AGO2, we immunoblotted tyrosine-phosphorylated protein immunoprecipitates. As expected, TAC induced the tyrosine phosphorylation of AGO2 in either genotype, but to a greater extent in PTP1B cKO hearts (Fig. 4D). These increases were also evident in heart lysates (Fig. 4D). These results support that PTP1B dephosphorylates AGO2 in hearts. However, in response to pressure overload, reversible oxidation of PTP1B leads to phosphorylation and inactivation of a population of AGO2 in cardiac hypertrophy.
PTP1B inactivation impairs translational repression of Thrap1
High target-prediction using web-databases (42, 43) combined with validated studies (44, 45) indicated that miR-208 isoforms target sites within the 3’UTR of Thrap1 transcripts, which encodes a component of the Mediator complex that represses Myh7 transcription in a thyroid hormone-dependent manner (34, 35). Therefore, we assessed THRAP1 (also known as MED13) expression in PTP1B cKO mice subjected to TAC. Because Tyr393 phosphorylation prevents AGO2 from interacting with and repressing mRNA targets (24), we investigated whether AGO2 inactivation affected its association with Thrap1 transcripts. qPCR analysis of AGO2 immunoprecipitates revealed that the association between AGO2 and Thrap1 mRNA was minimal in sham-operated hearts and that TAC induced an approximately 4-fold increase in PTP1BF/F hearts, in which AGO2 was minimally phosphorylated (Fig. 5A). In contrast, the association between AGO2 and Thrap1 mRNA did not increase in TAC PTP1B cKO hearts in which AGO2 was phosphorylated and did not interact with miR-208b (Fig. 3D). This result suggests that phosphorylation of AGO2 at Tyr393 decreases its ability to repress Thrap1. Accordingly, although cellular Thrap1 mRNA levels were not affected by TAC (Fig. 5B), THRAP1 immunoreactivity was markedly increased PTP1B cKO hearts subjected to TAC (Fig. 5C). This result suggests that the phosphorylation of AGO2 at Tyr393 impairs the translational repression of Thrap1 mRNA in hypertrophic hearts, despite the abundance of miR-208 isoforms. TRβ1 associates with THRAP1 to repress Myh7 (44, 45), and TRβ1 abundance was lower in PTP1BF/F hearts subjected to TAC than in PTP1B cKO hearts, whether sham-operated or subjected to TAC (Fig. 5C). The abundance of thyroid hormone receptor α1 (TRα1) was also increased in PTP1B cKO hearts subjected to pressure overload, supporting the idea that PTP1B expression affects thyroid hormone responsiveness in the hypertrophic heart.
Figure 5. Argonaute 2 inactivation facilitates THRAP1 expression in hypertrophic hearts from PTP1B cKO mice.
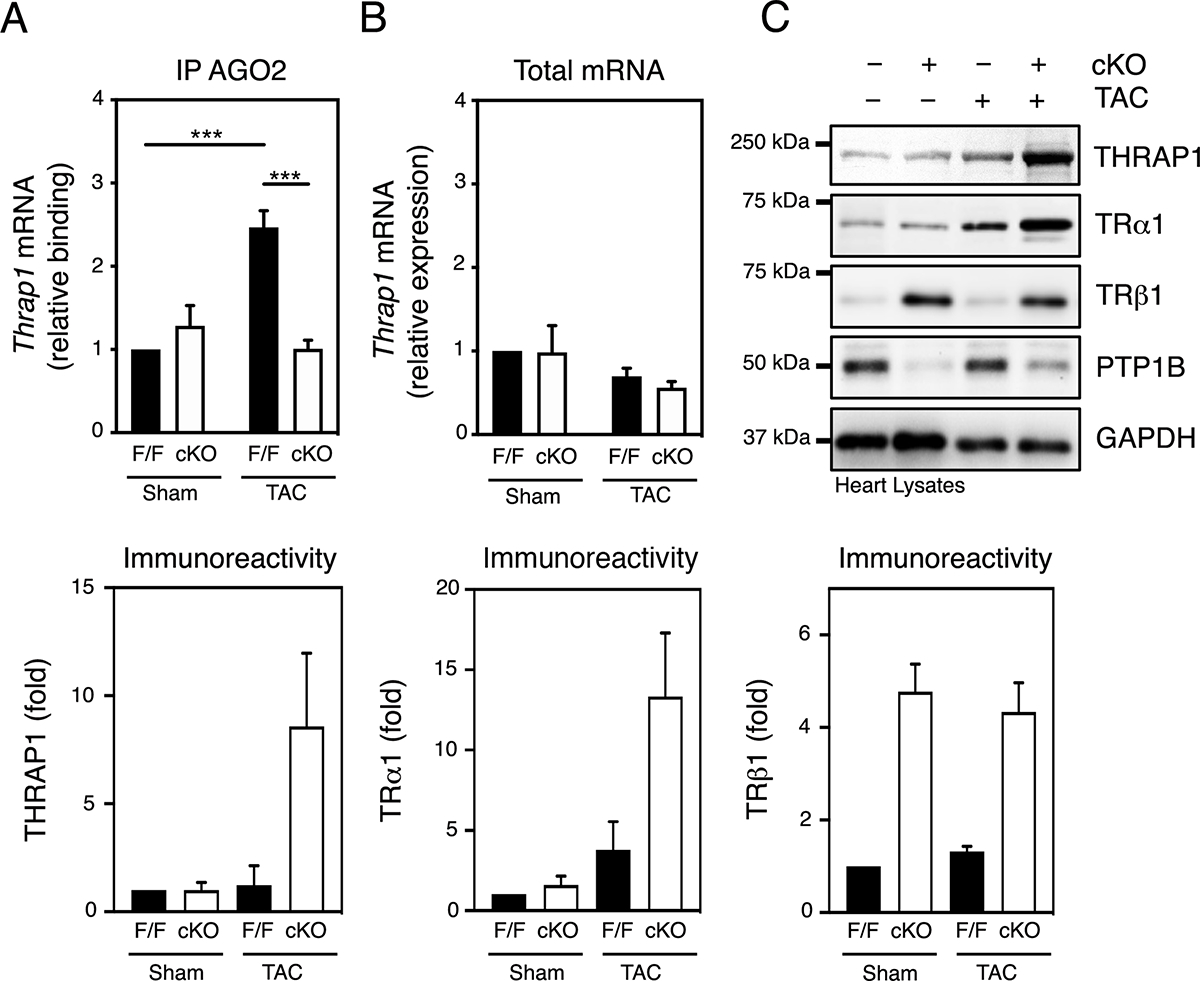
A) AGO2 was immunoprecipitated from lysates of hearts from sham and TAC PTP1BF/F and PTP1B cKO mice 4 weeks post-surgery and qRT-PCR analysis of AGO2-associated mRNAs for Thrap1 was performed. mRNA enrichment levels were normalized to 100% in sham PTP1BF/F hearts. B) Quantitation of Thrap1 levels by qRT-PCR analysis in hearts from sham and TAC PTP1BF/F and PTP1B cKO mice 4 weeks post-surgery. Thrap1 mRNA levels were normalized to 100% in sham PTP1BF/F hearts. C) Heart lysates from sham and TAC PTP1BF/F and PTP1B cKO mice 4 weeks post-surgery were immunoblotted for THRAP1, TRα1, TRβ1, PTP1B and GAPDH. Representative Western blot images (top) and quantification of the aggregate data (bottom) for N=3 mice in each group are shown. For A), B) and C), values from N=3 mice for each combination of sham/TAC surgery and PTP1BF/F/PTP1B cKO genotype are presented as mean ± SEM. Black bars represent PTP1BF/F and white bars represent PTP1B cKO mice. A two-way ANOVA followed by Tukey’s post hoc tests was performed.
Inhibition of T3 synthesis protects PTP1B cKO hearts from pressure-overload
Thyroid hormone signaling plays a critical role in the MHC isoform switch that occurs in hypertrophy and heart failure through enhancer and repressor cis-acting elements located in the promoters of MYH6 and MYH7 genes, respectively (33). In this context, THRAP1 and TRβ1 co-repress Myh7 expression in a T3-dependent manner (44, 45). We examined whether thyroid signaling contributed to an impaired myosin switch, exacerbated hypertrophy and cardiac dysfunction observed in PTP1B cKO mice subjected to pressure overload. To test this hypothesis, we fed propylthiouracil (PTU)-containing chow to PTP1B cKO and control mice for 4 weeks post-surgery to inhibit triiodothyronine (T3) synthesis and induce hypothyroidism. By blocking T3 signaling in this manner, the exacerbated TAC-induced cardiac hypertrophy in PTP1B cKO mice was ablated (Fig. 6A). In addition, echocardiographic imaging 4 weeks post-sham surgery or TAC revealed that the left ventricular filling patterns of hearts from PTU-treated mice appeared altered (Fig. S5) when compared to those of non-PTU treated animals (Fig. 2A). PTU-treated PTP1B cKO mice were protected from TAC-induced left ventricular hypertrophy and dilation (Table S4, Fig. S6A) and systolic dysfunction as indicated from preserved fractional shortening and ejection fraction values (Fig. 6B, C). Likewise, the global myocardial performance index (MPI), which deteriorated after TAC in PTP1B cKO mice, were preserved by PTU treatment (Table S4, Fig. S6B). PTU treatment also caused bradycardia and weight loss (Fig. S6C,D, Table S4). These observations suggest that preventing thyroid hormone signaling maintains systolic and cardiac function and prevents the development of cardiac hypertrophy when PTP1B is inactivated in response to pressure overload.
Figure 6. PTP1B regulates thyroid hormone responsiveness of MYH7 transcription and cardiac hypertrophy.
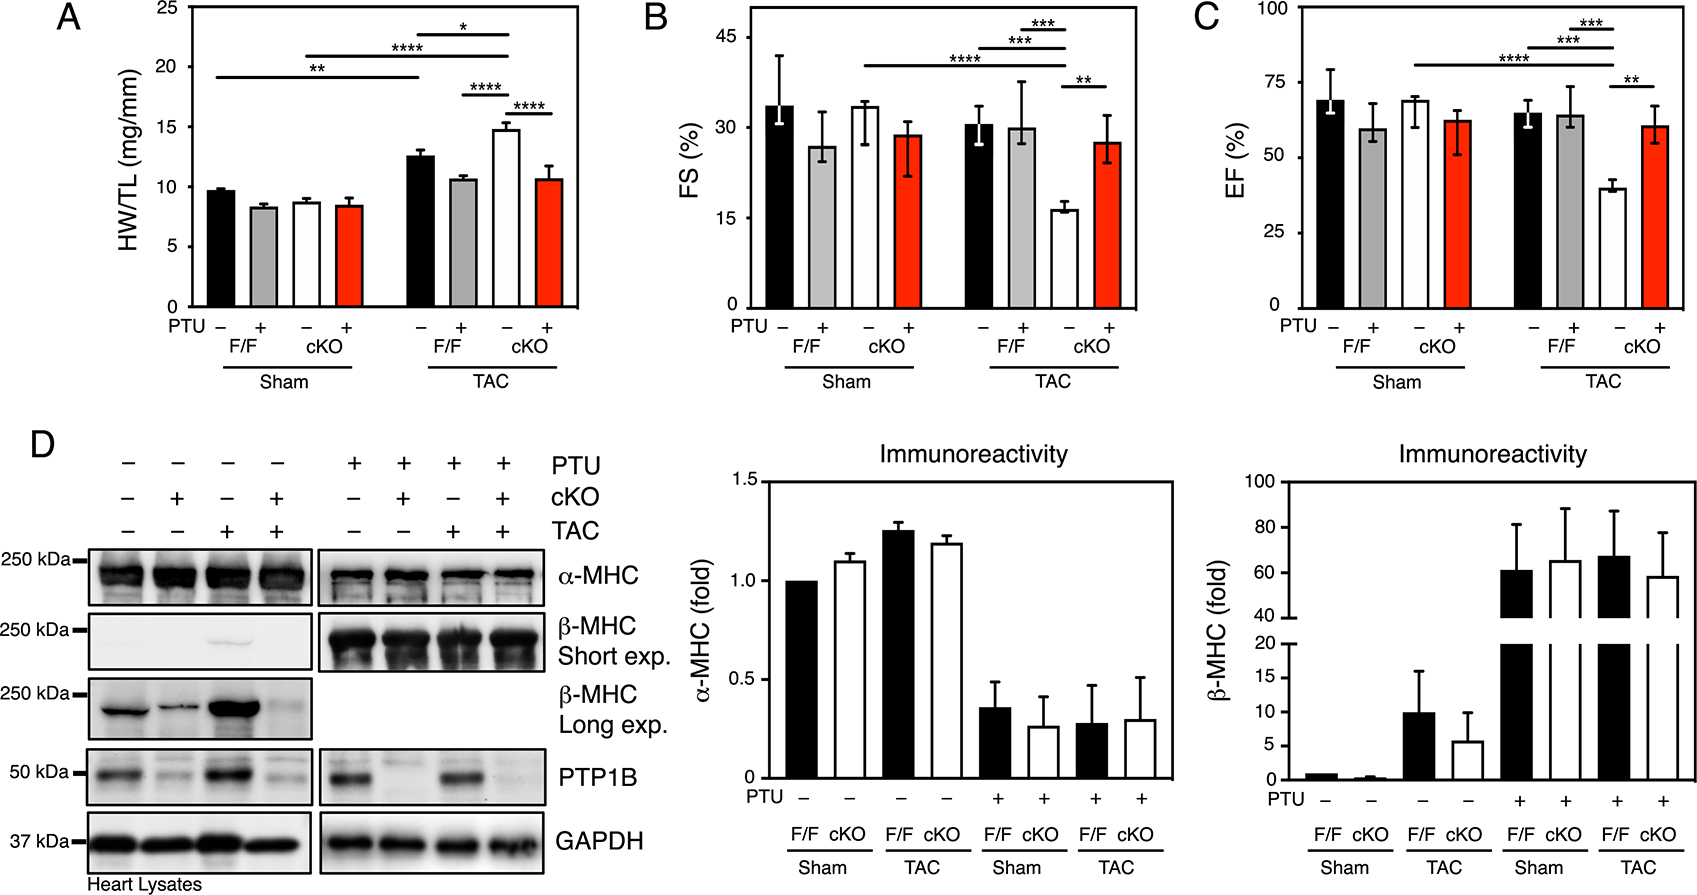
A) Quantitative analysis of heart weight normalized to tibia length (HW/TL) for sham and TAC PTP1BF/F and PTP1B cKO mice 4 weeks post-surgery, treated or not with PTU. B) Echocardiographic analysis of left ventricular fractional shortening (FS) and C) ejection fraction (EF) in sham and TAC PTP1BF/F and PTP1B cKO mice 4 weeks post-surgery, treated or not with PTU. For A), B) and C), N=5 to 11 mice for each group. Data are presented as means ± SEM for normally distributed data and as median (1st quartile, 3rd quartile) for non-normally distributed data (B and C). Three-way ANOVA followed by Tukey’s post hoc tests was performed. D) Western blot analysis of α-MHC, β-MHC and PTP1B in hearts from PTP1BF/F and PTP1B cKO mice 4 weeks after sham operation or TAC and treated or not with PTU. Representative Western blot images (top) and quantification of the aggregate data (bottom) for N=3 mice in each group are shown. Values for N=3 mice for each group are presented as the means ± SEM. Black bars represent PTP1BF/F and white bars represent PTP1B cKO mice.
To gain insight into the underlying mechanism of the PTU-induced suppression of the hypertrophic response, we monitored the α-MHC to β-MHC switch as an indicator of T3 signaling in PTU-treated mice subjected to TAC. α-MHC protein abundance was similar in all non-PTU-fed mice (Fig. 6D). However, preventing T3 synthesis with PTU caused a ~ 3-fold decrease in α-MHC immunoreactivity under all conditions and genotypes (Fig. 6D). In contrast, we observed that β-MHC immunoreactivity was markedly reduced in PTP1B cKO mice subjected to either sham surgery or TAC compared to PTP1BF/F mice (Fig. 6D). PTU treatment caused a ~ 60-fold increase in β-MHC immunoreactivity (Fig. 6D) and a marked increase in mRNA levels (Fig. S7A, B) in PTP1B cKO mice, regardless of surgical treatment, as well as in PTP1BF/F mice. This result supports the notion that T3 signaling is blunted and that TRβ1 and THRAP1 do not repress β-MHC transcription in hypothyroid PTP1B cKO mice. Quantification of MHC immunoreactivity indicated that β-MHC represented ~ 80% of MHC expression in PTU-treated hearts (Fig. S8). Thus, increased abundance of the slower β-MHC isoform can occur and contribute to contractile performance in hearts subjected to pressure overload. Together, our data suggest a model that involves increased transcriptional activity by T3 following inhibition of PTP1B by ROS and decreased AGO2-mediated silencing as hypertrophy progresses into cardiac dysfunction and heart failure (Fig. 7).
Figure 7. Model of redox regulation of PTP1B, AGO2 and thyroid hormone responsiveness in cardiac hypertrophy.
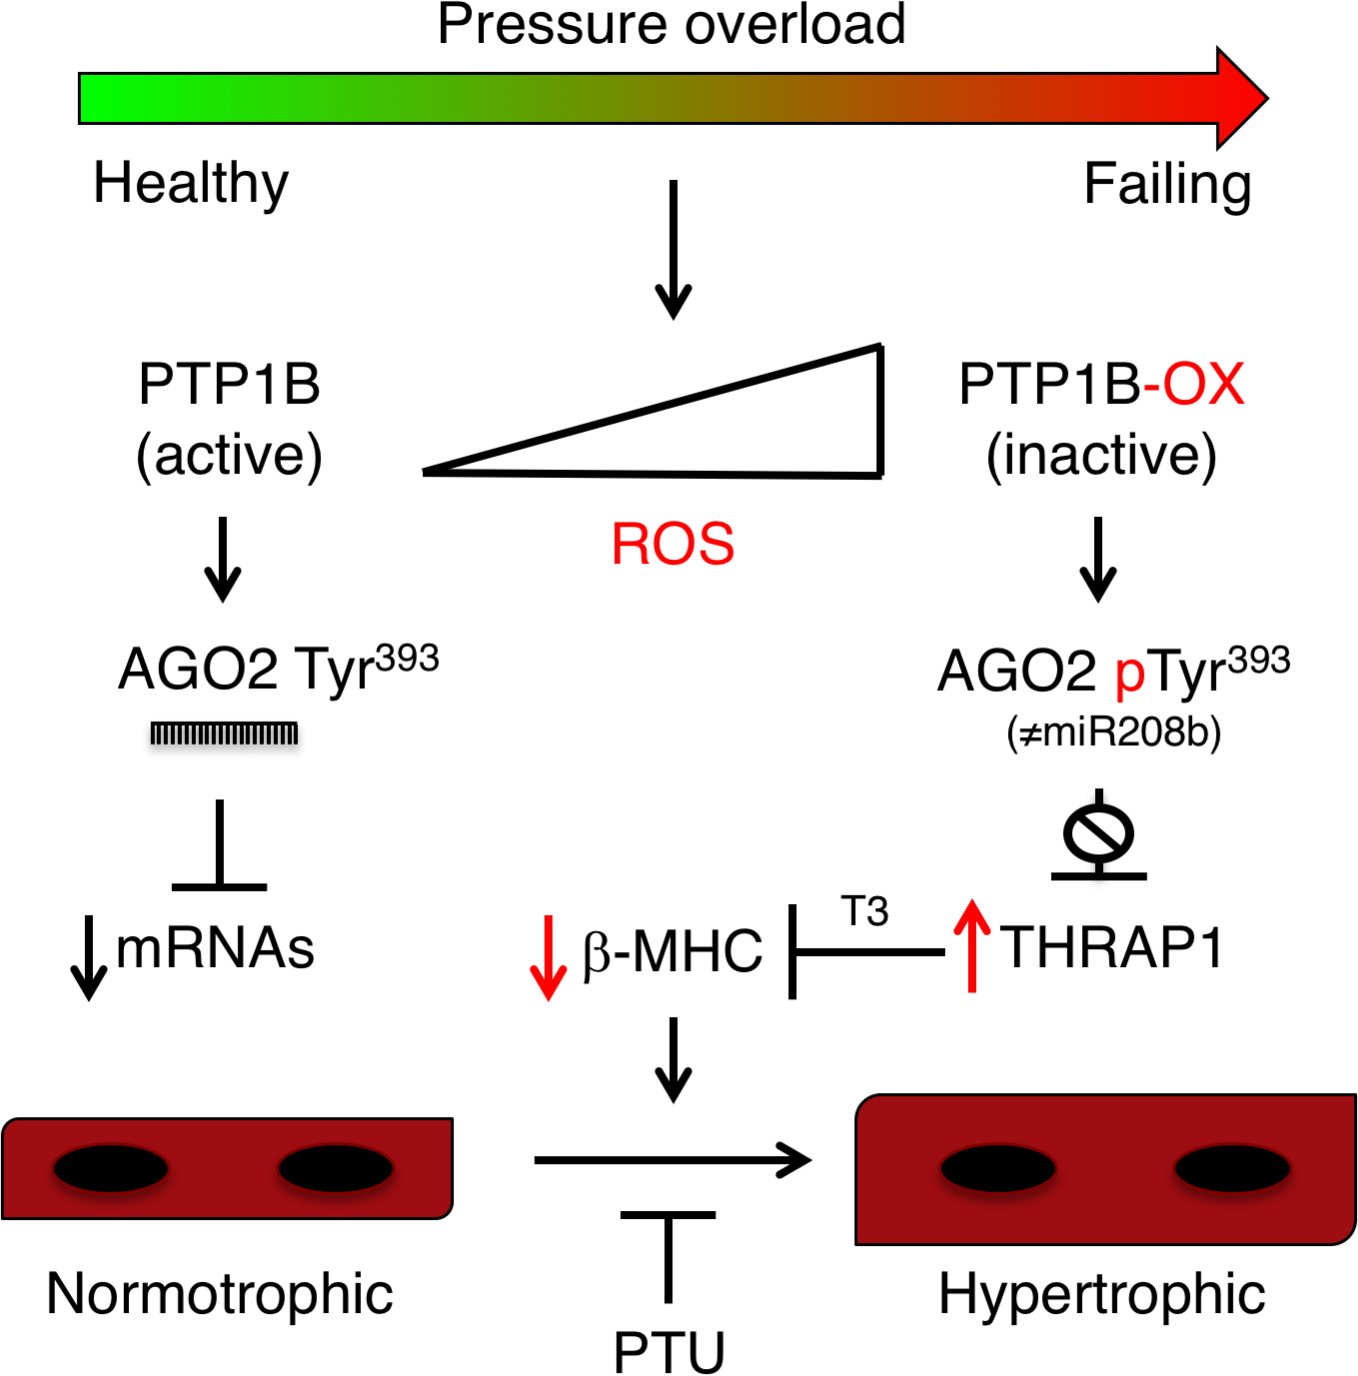
Schematic model for pressure-overload induced hypertrophy that involves derepression of Thrap1 mRNA due to inhibition of miR-208b-mediated silencing as a consequence of PTP1B oxidation by reactive oxygen species (ROS) and decreased tyrosine dephosphorylation of AGO2. Our results suggest that ROS-mediated inhibition of PTP1B and phosphorylation AGO2 allows the expression of THRAP1, which in turn represses MYH7 and β-MHC expression in a triiodothyronine (T3)-dependent manner. Increased thyroid responsiveness, which can be prevented by propylthiouracil (PTU), likely also involves TRα1 and TRβ1, which are both highly expressed in PTP1B cKO hearts subjected to pressure overload.
DISCUSSION
Although cardiac redox signaling regulates the activity of proteins and pathways involved in pathological hypertrophy and heart failure, the redox regulation and inactivation of members of the PTP family has not been explored in the heart (1). We addressed the cardiac function of PTP1B by monitoring its inactivation by reversible oxidation with a recombinant antibody that specifically recognizes the conformation change of PTP1B when it becomes oxidized on its catalytic cysteine residue (25, 26) and by generating a line of cardiac-specific PTP1B KO mice. Our results demonstrated that PTP1B inactivation was an integral part of the signaling events leading to pressure overload-induced cardiac hypertrophy. Our data also indicated that inactivation of PTP1B led to sustained phosphorylation of AGO2, which in turn prevented the association between AGO2 and miR-208b and AGO2-mediated silencing of Thrap1. This mechanism contributes to increased thyroid hormone-mediated cardiac dysfunction and hypertrophy (Fig. 7). Together, the results from our study shed new light on the role of PTP1B in regulating thyroid hormone responsiveness in the heart and on how redox signaling is tightly linked to gene silencing and cardiac remodeling.
Members of the PTP family display substrate specificity in a cell-specific manner (12) and gene-targeting studies, using mice with either global PTP1B KO or tissue-specific PTP1B KO (including muscle, liver, adipose tissue, endothelium and bone), demonstrate that PTP1B engages in complex cell-specific functions, such as attenuation of insulin receptor signaling and enhancing HER2 signaling in breast cancer (18–23, 46, 47). Hence, in addition to AGO2, other substrates of PTP1B involved in cell growth will need to be validated in cardiomyocytes to understand their impact in cardiac hypertrophy. In this context, global gene inactivation or systemic inhibition of PTP1B decreases cardiac remodeling and dysfunction following myocardial infarction; however, the peripheral effects of these approaches, off-target effects of PTP1B inhibitors and cell-specific functions of the phosphatase preclude one from drawing conclusions on the role of PTP1B in heart (17). We identified PTP1B as a target of ROS in pressure overload-induced hypertrophy and showed that disruption of PTP1B function is involved in pathological remodeling in vivo. Our experimental results demonstrated that cardiomyocyte-specific deletion of PTP1B exacerbated pressure-overload-induced hypertrophy, identifying a cardioprotective function for PTP1B in heart failure. PTP1B is widely expressed in the cardiovascular system (48), and the cardioprotective function of PTP1B in cardiomyocytes points to a specific role for PTP1B in these cells. Thus, it will be necessary to further characterize the role of PTP1B in non-cardiomyocytes to clarify the mechanisms underlying the peripheral cardioprotective function of PTP1B inhibition.
Several lines of genetic evidence indicate that miRNAs play critical roles in mediating stress responses and in cardiovascular development and disease (38). Genetic deletion and overexpression of miR-208a in mice show the importance of myomiRs in regulating MHC isoforms in heart disease (44, 45, 49). Knockout of miR-208a, which is encoded by intron 27 of α-MHC, not only suppresses the expression of β-MHC, but also that of miR-208b, which is located within intron 31 of the MYH7 gene that encodes β-MHC. Knocking out miR-208a blunts the hypertrophic response in the hearts of mice subjected to TAC and transgenic expression of miR-208a is sufficient to induce hypertrophy (44, 45). Because miR-208a levels are not affected by TAC-induced pressure overload, it is important to understand how miR-208a contributes to cardiac hypertrophy. Our results stress that preventing AGO2 from interacting with miR-208b promotes pathological cardiac hypertrophy and suggest that part of the signaling attributed to miR-208a gene deletion (44, 45) may be caused by the repression of miR-208b in these mice, because mice deficient in miR-208a are effectively miR-208a and miR-208b double KOs (49). Our data indicated miR-208b was the only isoform whose abundance increased in cardiac hypertrophy. We showed that miR-208b expression was augmented several fold and that its association with AGO2 increases 1000-fold in cardiac hypertrophy, in contrast to the lack of change in the association between miR-208a and AGO2. Revealing different patterns of AGO2 and miR208a/b association, which is regulated by PTP1B, supports the existence of unique AGO2 complexes in the heart and suggests that further defining miRNA and AGO-specific complexes may yield important insight into post-transcriptional regulation.
Phosphorylation of Tyr393, which is located close to the DICER-binding domain, impairs both the AGO2-DICER interaction and miRNA loading onto AGO2 in cells (24, 39, 50, 51) and therefore inhibits AGO2. We previously demonstrated that dephosphorylation of AGO2 at Tyr393 was performed by PTP1B and that the reversible oxidation of PTP1B and the resulting inactivation of AGO2 can suppress miRNA processing and compromise post-transcriptional regulation of a subset of genes in senescent fibroblasts (24, 36). Our data presented here establishes a function for this pathway in myocytes and in the heart. We showed that despite the increased expression of miR-208b, the association between miR-208b and AGO2 was prevented in hypertrophic PTP1B cKO hearts when AGO2 was phosphorylated at Tyr393. We also showed that endothelin-1 and angiotensin II, two hypertrophic agents, are involved in AGO2 phosphorylation at Tyr393. These data are consistent with the inactivation of a population of AGO2 in hypertrophic PTP1B cKO hearts. Moreover, our data showed that the increase in inactive AGO2 in hypertrophic PTP1B cKO hearts prevented miR-208b from targeting and repressing Thrap1, which is involved in thyroid hormone signaling and repression of Myh7 transcription. We also showed that TRβ1 expression was increased in PTP1B cKO hearts. Collectively, our data suggest that decreased repression of THRAP1 through AGO2 inactivation is part of a mechanism by which PTP1B inactivation affects thyroid hormone responsiveness during pressure overload-induced hypertrophy. However, increased TRβ1 expression in PTP1B cKO hearts suggests that regulation of T3-signaling by PTP1B may also occur in other tissues.
The expression of β-MHC and α-MHC isoforms is regulated in a developmental stage-specific and thyroid hormone-dependent manner. In mice, there is a β-MHC to α-MHC transition immediately before birth, with the faster isoform, α-MHC, becoming the major isoform (~ 90%), whereas in humans and other large mammals, the slower β-MHC isoform becomes the predominant isoform in the adult heart (33). In both rodents and humans, β-MHC expression increases at the expense of α-MHC in cardiac hypertrophy and hypothyroidism. However, its role as a pathological hypertrophy marker remains unclear because studies have also reported that cellular hypertrophy is not always accompanied by β-MHC re-expression (52, 53), and that β-MHC re-expression occurs only in non-hypertrophic (or normotrophic), α-MHC-expressing-myocytes in pressure-overload hypertrophy (54). Our results showed that PTP1B cKO mice only weakly expressed β-MHC after 4 weeks of pressure-overload. These mice presented with systolic dysfunction and increased left ventricular hypertrophy when compared to control mice subjected to TAC. Inhibiting T3 synthesis prevented the pro-hypertrophic phenotype observed in PTP1B cKO mice subjected to pressure-overload, suggesting that T3-mediated hypertrophy occurs downstream of PTP1B. Notably, PTU-treated mice expressed nearly 60-times the amount of β-MHC compared to non-PTU treated mice without showing proportional repression of α-MHC expression. Instead, a 2-fold repression of α-MHC expression was observed in PTU-treated mice. Because the absence of α-MHC is deleterious to the heart in mice (32) and humans (55), we should perhaps consider that β-MHC expression, which causes slower but efficient contractility (33, 56), can be beneficial to the cardiac function, depending on the expression level of α-MHC in hypertrophic myocardium.
The signaling pathway identified herein reveals that PTP1B is a regulator of thyroid hormone-mediated cardiac hypertrophy. We showed that inactivation of PTP1B by ROS led to phosphorylation of AGO2 at Tyr393 and prevented AGO2 from associating with miR-208b and from post-transcriptionally regulating Thrap1 mRNA as well as other unidentified transcripts. Our results support the hypothesis that prolonged inactivation of specific PTPs by increased redox signaling is an important factor in cardiac pathology and contributes to the expanding number of studies characterizing the molecular mechanisms that regulate the activity of miRNA-mediated gene silencing. We anticipate that further characterization of the reversibly oxidized PTPs in the heart will identify additional roles for these enzymes in advanced stages of pathological cardiac hypertrophy and heart failure.
MATERIALS AND METHODS
Reagents and antibodies
PTP1B and α-MHC antibodies were purchased from Abcam. AGO2 antibodies were purchased from Cell Signaling Technology. Anti-Flag antibody, Dynabeads protein A and protein G were from Thermo Scientific. The β-actin and anti-phosphotyrosine, β-MHC PT-66 beads were from Sigma. HRP-conjugated secondary antibodies were from Jackson Laboratories. Protein A/G Plus agarose beads, GAPDH, THRAP1/MED13 and TRβ1 antibodies were from Santa Cruz Biotechnology. HA-HRP antibodies were from Roche. Anti-AGO2 phospho-Tyr393 antibodies were generated against N289-T-D-P-Yp-V-R-E-F-G-I-M400 and affinity-purified at the MRC Protein Phosphorylation and Ubiquitylation Unit (Dundee). Streptavidin-Sepharose beads were purchased from GE Healthcare. Protease inhibitor cocktail tablets and DNase were from Roche. Trizol, cDNA synthesis kit, SYBR Green master mix and TaqMan were from Thermo Scientific. Catalase and superoxide dismutase were from Calbiochem. Surfact-Amps Nonidet P-40, Zeba desalt spin columns and Ni-NTA beads were from Thermo Scientific. RNasin was from Promega. The vectors pET21b-PTP1B(D181A) and pET22b-scFv45 were generous gifts from Dr. Nicholas K. Tonks.
Generation of PTP1B cKO mice
To specifically delete PTP1B in cardiomyocytes (PTP1B cKO), C57BL/6 mice harboring two loxP sites flanking the catalytic domain of PTP1B at exons 6 and 8 (23) were crossed with mice expressing the α-MHC-Cre transgene (Jackson Laboratory). Genotyping was performed by PCR using DNA extraction from tail clips (57) and gene-specific primers corresponding to PTP1B lox (forward: 5’-CCTGGACTGAGGCTTTCTAGGC-3’; reverse: 5’-GTCTCTGGTGCTGCTCTGAATTGC-3’) and Cre (forward: 5’-CGTACTGACGGTGGGAGAAT-3’; reverse : 5’-ACCAGGCCAGGTATCACTGA-3’). Cardiac knockout was confirmed by RT-PCR. Total RNA was isolated from various tissues of PTP1BF/F or PTP1B cKO mouse neonates and was subjected to semi-quantitative RT-PCR using SuperScript One-Step (Invitrogen) and primers detecting a 171bp region within PTP1B exon 6 (forward: 5’-CACATGGCCTGACTTTGGAG-3’; reverse: 5’- AGTAAGAGGCAGGTGTCAGC-3’). All mice were housed in a temperature-controlled barrier facility on a 12-h light-dark circadian cycle with access to standard chow and water. Animal procedures described in this study were approved by the Ethics Committee at the Montreal Heart Institute.
Generation of PTPN1-D181A mice
A Gateway-compatible Rosa26 locus targeting vector (58) was used to generate a Cre/loxP conditional Rosa26-targeted transgenic mouse that overexpresses human PTP1B D181A mutant using a strategy described previously (41) (Fig. S4A). Whole-body PTP1B(D181A) expression was achieved by crossing Rosa26PTPN1-D181A/WT animals to Meox2-Cre mice (Jackson Laboratory). Once the excision of the STOP cassette was validated by live imaging, Rosa26PTPN1-D181A/WT animals were mated with C57BL/6 mice and compared to Rosa26PTPN1-WT/WT littermates. Animal procedures described in this study were approved by the McGill University Ethics Committee.
Live imaging
Mice were anesthetized with 2-chloro-2-(difluoromethoxy)-1,1,1-trifluoro-ethane (isoflurane), injected intraperitoneally with 50 μL luciferin (Caliper Life Sciences), and imaged with the use of the IVIS Spectrum preclinical in vivo imaging system (Perkin Elmer), according to the manufacturer’s instructions.
Pressure overload hypertrophy
8- and 10-week old male C57BL/6, PTP1B cKO and PTP1BF/F mice were randomly assigned to groups undergoing sham surgery or constriction of the transverse aorta (TAC) (59). We used permanent TAC as an experimental model to obtain a gradual time course in the development of cardiac hypertrophy. There is very little variability in this parameter; it can be detected within days and persists for the life of the animal. Mice were sacrificed 3, 7, 14, or 28 days post-TAC, as indicated. Hearts were harvested, ventricles rapidly removed, snap-frozen in liquid N2, and stored at −80°C for protein and RNA extraction.
PTU treatment
Thyroid hormone deficiency was induced by maintaining animals on an iodine-free chow supplemented with 0.15% propylthiouracil (PTU; TD 97061, Harlan Teklad) for 28 days (44).
Transthoracic echocardiography
Transthoracic echocardiography was performed in mice sedated by 1.5–2% isofluorane with an i13L probe (10–14 MHz) linked to a Vivid 7 Dimension system (GE Healthcare Ultrasound). Two-dimensional echocardiography was used to measure the dimensions of the left ventricular outflow tract (LVOT), and of the ascending aorta proximal to the banding area, banding area, and of the descending aorta distal to the banding area. Cross banding peak velocity, peak and mean gradient (V Peak, G Peak, G Mean) were measured by enlarged pulsed wave Doppler. The thickness of LV anterior and posterior wall at end diastole (LVAWd, LVPWd), LV dimension at end diastole and systole (LVDd, LVDs), and left atrium dimension at end cardiac systole (LADs) were measured by M-mode echocardiography. LV mass was calculated using appropriate formulae (60). LV fractional shortening and ejection fraction (FS, EF) were obtained by formulae available within Vivid 7. PW was used to measure trans mitral flow peak velocity in early (E) and atrial (A) filling, E deceleration time (EDT), deceleration rate (EDR), time interval from mitral valve closure to opening (MVCO), velocity of systolic and diastolic (S, D) wave in both left lower and upper pulmonary venous flow (PVF), and S wave deceleration slope in lower PVF. LV ejection time (LVET), stroke volume (SV) and cardiac output (CO) were measured from LVOT flow obtained by PW. LV global myocardial performance index (MPI Global) was calculated as (MVCO−LVET)/LVET × 100 %. LV iso-volumetric relaxation time (IVRT) was measured by enlarged PW and corrected by R-R interval on simultaneously recorded ECG. Mitral lateral and septal annulus moving velocity in systole (SL, SS), early and atrial diastole (e’, a’), or fused diastole (f’), and time interval from ending of a’ to beginning of e’(b), from beginning to ending of SL / SS (a) were measured by tissue Doppler imaging. The average of three consecutive cardiac cycles was used for all measurements. The experimenter was blinded to the genotype of the mice.
Gravimetric analysis
Mice were weighed and executed by cervical vertebra luxation. Hearts were excised, briefly washed with PBS, weighed and snap-frozen in liquid N2-cooled isopentane. A Vernier caliper was employed to measure the left tibia length of mice.
Histology and morphology
Staining and determination of cardiomyocyte area were performed in the histology facility in the laboratory of Dr. Martin Sirois at the Montreal Heart Institute by personnel blinded to the genotype and treatment of mice. Hearts were excised and immediately placed in 10% neutral-buffered formalin at room temperature for 24 h after a brief rinse with PBS. Specimens were embedded in paraffin and sliced into 1 mm sections for hematoxylin and eosin (H&E) staining. Images were taken using an Olympus BX46 microscope. For Texas Red-X conjugated wheat germ agglutinin staining (WGA), hearts were snap-frozen in liquid N2-cooled isopentane before cutting into 14 μm sections with a cryostat. The sections were fixed with 4% neutral-buffered formalin, rinsed with PBS then blocked using donkey serum. Sections were stained with Texas Red-X conjugated WGA (Molecular probes) for 60 min and washed with PBS. Cardiomyocyte cross-sectional areas were calculated on a digital microscope using the Image Pro Plus software.
Adult mouse ventricular cardiomyocyte isolation
Adult mouse ventricular cardiomyocytes were isolated by enzymatic dispersion on a modified Langendorff apparatus as previously described (61). Briefly, after cannulation, hearts were rapidly perfused with solution A (130 mM NaCl, 15 mM KCl, 0.6 mM KH2PO4, 0.6 mM Na2HPO4, 1.2 mM MgSO4-7H2O, 10 mM HEPES, 4.6 mM NaHCO3, 30 mM taurine, 5.5 mM glucose, 5 μM blebbistatin) for 5 min at 3 ml/min. The pH of solution A was adjusted to 7.4 with NaOH. Next, the digestion buffer consisting of 50 ml of solution A supplemented with 120 mg of collagenase type II (290 U/ml, Worthington) was used for enzymatic dispersion. After 7 to 9 min of digestion, a stopping buffer made from solution A supplemented with 10% FBS and 12.5 μM Ca2+ was used. The ventricles were cut, minced, and triturated to yield individual rod-shaped cardiomyocytes. Animal procedures described in this study were approved by the Ethics Committee at the Montreal Heart Institute and at the SUNY Polytechnic Institute.
Isolation of neonatal rat ventricular cardiomyocyte
Neonatal rat ventricular cardiomyocytes (NRVM) were isolated as previously described (62). Briefly, hearts were removed from 2-day old rats killed by decapitation. Ventricular tissues were digested with 0.1% trypsin (Worthington) in HBSS (140 mM NaCl, 5 mM KCl, 1 mM CaCl2, 0.4 mM MgSO4, 0.5 mM MgCl2, 0.3 mM Na2HPO4, 0.4 mM KH2PO4, 6 mM D-Glucose, 4 mM NaHCO3) overnight at 4°C. Ventricular cells were recovered by repeated digestions of the tissue in 10 ml of 0.1% collagenase in HBSS. The supernatants collected from each digestion were centrifuged at 2000 rpm for 5 min at 4°C. The pellets were resuspended in ice cold HBSS, pooled and centrifuged at 2000 rpm for 5 min at 4°C. Cells were resuspended in DME containing 7% FBS and preplated on 10-cm cell dishes for 45–60 min two times to enrich for myocytes and decrease contamination by non-muscle cells. Non-adherent cells were plated at a density of 1000 cells/mm2 in 60 mm dishes. After 24 h, the culture medium was changed to serum-free medium containing insulin (5 μg/ml), transferrin (5 pg/ml), and sodium selenite (5 ng/ml) (ITS media). Experiments were performed 24 h later. Animal procedures described in this study were approved by the Ethics Committee at the Montreal Heart Institute and at the SUNY Polytechnic Institute.
Isolation of adult mouse ventricular myocytes and fibroblasts for RNA isolation
Cardiac fibroblasts and ventricular myocytes were isolated from 8 to 10-week-old PTP1B cKO and PTP1BF/F mice as previously described with minor modifications (63). Briefly, mice were sacrificed by cervical dislocation. The heart was excised and placed in HBSS (140 mM NaCl, 5 mM KCl, 1 mM CaCl2, 0.4 mM MgSO4, 0.5 mM MgCl2, 0.3 mM Na2HPO4, 0.4 mM KH2PO4, 6 mM D-Glucose, 4 mM NaHCO3) at room temperature. The atria were removed, and ventricles were cut into small pieces using scissors and transferred into a p100 petri dish containing 2 ml of ice-cold HBSS. Ventricular tissues were transferred into a bottle containing 50 ml of HBSS supplemented with 0.1% trypsin and digested overnight on a shaker (150 rpm) at 4°C. Trypsin was inactivated by adding 10 ml of 37°C low glucose DMEM supplemented with 7% FBS and 1% penicillin/streptomycin and mixing gently for 5 min on a shaker. The supernatant was removed and the ventricles were subjected to a series of digestions in dissociation medium (HBSS supplemented with 0.1 % collagenase, 37°C). Digestion was aided by gentle shaking at 180 rpm. Digests were kept on ice, pooled and centrifuged at 2000 rpm for 5 min at 4°C. The pellet was gently resuspended in 10 ml of 37°C low glucose DMEM supplemented with 7% FBS and 1% penicillin/streptomycin and cell media was added to a final volume of 40 ml. Fibroblasts were separated from myocytes by plating the cardiac cells in four 10-cm cell dishes for 45 min in a humidified incubator at 37°C in a 5% CO2 atmosphere. The cell media was transferred onto 4 more plates for a 45-min period in an incubator. Plated cells were considered to be cardiac fibroblasts. Non-adherent cells (cardiomyocytes) were centrifuged at 10,000 rpm for 10 min at 4°C. RNA was isolated from plated fibroblasts and pelleted myocytes using a QIAzol lysis reagent following the manufacturer’s protocol. Following DNase treatment, cDNAs were synthesized using a cDNA synthesis kit. The cDNA library was used as template to perform polymerase chain reaction using 2X Phusion Master mix (Thermo Scientific, using the manufacturer’s protocol). Primers used for PCR are as follows: mouse Ptpn1, forward 5’-AGGCAGGAAGAGGA-GTAGCA-3’ and reverse 5’-CTGATCCTGCACTGACGA-3’; mouse Myh6, forward 5’-GA-GATTTCTCCAACCCAGGA-3’ and reverse 5’-CAGGTGTCAGCCAGACAGA-3’; mouse Vim, forward 5’-CCGTTCAAGGTCAAGACGTGCCA-3’ and reverse 5’-AGGAG-GCCGAAAGCACCCTGC-3’; mouse Gapdh, forward 5’-CTGCACCACCAACTGCTTAC-3’ and reverse 5’-ACTGTGGTCATGAGCCCTCA-3’. PCR products were analyzed on the 1.5% agarose gel. Animal procedures described in this study were approved by the Ethics Committee at the SUNY Polytechnic Institute.
Lysate preparation, immunoprecipitation, and immunoblotting
At the end of each treatment, hearts were harvested and ventricles were rapidly removed, snap-frozen in liquid N2, and stored at −80°C. Ventricles were pulverized under liquid N2 and the powder was resuspended, using a Potter-Elvehjem tissue grinder (10 strokes), in 1 ml of ice-cold lysis buffer (50 mM Tris (pH 7.5), 150 mM NaCl, 50 mM NaF, 2 mM EDTA, 5 mM Na3VO4, 0.1% SDS, 0.5% v/v deoxycholic acid, 10 μg/ml RNase A, 5 mM DTT, and 1% v/v NP40 and proteases inhibitors). For immunoprecipitations, 400 μg of protein were incubated with 20 μl of PT-66 anti-phosphotyrosine antibody cross-linked to Protein A-Sepharose (Pharmacia) at 4°C for 3 h as previously described (24). Immune complexes were washed 3 times with lysis buffer. Washed immunoprecipitates were eluted by the addition of 20 μl of 4x Laemmli sample buffer. The proteins were separated by electrophoresis on 10% SDS-PAGE, samples were transferred at 100 V and 5 °C for 90 min onto 0.2 μM nitrocellulose membranes in a transfer buffer containing CAPS (10 mM CAPS, 10% methanol, pH 11) to transfer AGO2, or a Tris-glycine transfer buffer (25 mM Tris, 192 mM glycine, 5% methanol) for all other proteins. Membranes were blocked for 1 h in a solution comprising 5% (w/v) skimmed milk powder (Carnation) in TBST (25 mM Tris (pH 7.5), 150 mM NaCl and 0.05% (v/v) Tween-20). Membranes were incubated with primary antibodies in 1% BSA in TBST for 16 h at 4°C. After washing 3 times with TBST, membranes were reblocked with TBST containing 5% skimmed milk for a 10 min period and incubated in the presence of HRP-coupled secondary antibodies. Following a final round of washes with TBST, phosphorylated proteins were visualized using ECL according to the manufacturer’s instructions and visualized using BML or BMR films (Kodak), or ChemiDoc MP Imaging System (BioRad).
Expression and purification of the intrabody scFv45 and the PTP1B trapping mutant
Recombinant scFv45 and PTP1B(D181A) were purified as previously reported with minor modifications (25, 65). Briefly, His-tagged proteins were expressed in BL21 Escherichia coli using LB. Cells were resuspended in lysis buffer (20 mM NaH2PO4, 300 mM NaCl, 1 mM TCEP, pH 8.0) containing cOmplete EDTA-free Protease Inhibitor Cocktail (Roche) and lysed by sonication (Amplitude-40%, 5 s ON, 10 s OFF, on ice) for 10 min. Lysates were clarified by centrifugation and the supernatant was incubated with Ni-NTA beads which had been previously equilibrated with binding buffer (20 mM NaH2PO4, 300 mM NaCl, 1 mM TCEP, pH 8.0) for 1 h on a rotator at 4°C. Protein purification was performed by gravity-flow chromatography using binding buffer supplemented with 20 mM imidazole for washes or with 250 mM imidazole for elution. A buffer exchange was performed using Zeba spin columns according to the manufacturer’s protocol. Proteins were stored in 50 mM HEPES, 150 mM NaCl, pH 8.0, 1 mM TCEP and used within one week from purification.
Measurement of PTP1B oxidation in vivo.
Male C57BL/6 mice between 8 and 10 weeks of age were subjected to sham surgery or to TAC (59). Mice were sacrificed 0, 7, 14, or 28 days post-surgery, as indicated. Hearts were harvested, ventricles rapidly removed, snap-frozen in liquid N2, and stored at −80°C. For PTP oxidation, ventricles were pulverized under liquid N2 in an argon-filled hypoxic glove box. The powder was resuspended using a Potter-Elvehjem tissue grinder (10 strokes), in 1 ml of ice-cold degassed lysis buffer (66) (25 mM HEPES (pH 7.45), 100 mM NaCl, 0.25% v/v deoxycholic acid, 1% Surfact-Amp NP-40, 100 U/ml SOD, 100 U/ml catalase, and cOmplete protease inhibitor cocktail). Lysis was completed by mixing for 30 min at 4°C on a clinical rotator. Lysates were clarified by centrifugation at 10,000 rpm and supernatants were quantitated by the method of Bradford. One mg of each lysate was incubated with 20 μg scFv45 for 90 min. The protein complexes were precipitated with anti-HA-agarose beads and washed 3X with lysis buffer. Complexes were separated by SDS-PAGE and immunoblotted.
PTP1B substrate-trapping assay
AGO2 was confirmed as a substrate of PTP1B in cardiomyocytes and in hearts following a modification of a previously described protocol (24, 40). Briefly, NRVMs seeded into a 10-cm cell culture dish containing low glucose DMEM supplemented with 7% FBS and 1% penicillin/streptomycin were serum starved in low glucose DMEM supplemented with 1% ITS (insulin transferrin selenium) and 1% penicillin/streptomycin for 16 h. Cells were treated with 100 nM ET-1 or 100 nM Ang II in presence of 100 μM pervanadate for 30 min. Cells were harvested in a substrate trapping lysis buffer containing 50 mM Tris-HCl, pH 7.4, 150 mM NaCl, 1% Triton X-100, 5 mM iodoacetic acid, protease inhibitor (Complete, Roche) supplemented with 10 μg/ml RNAse A and allowed to lyse at 4°C for 30 min on a clinical rotator. Lysates were centrifuged at 10,000 rpm for 10 min at 4°C and protein concentrations of the supernatants were determined by the Bradford method. 200 μg of cell lysate was incubated with 2 μg of His-tagged PTP1B DA trapping mutant for 3 h at 4°C on a rotator. PTP-substrates complexes were incubated with Ni-NTA beads for 60 min at 4°C, centrifuged at 3000 rpm and washed 3 times using ice cold PBS. Beads were resuspended in Laemmli sample buffer and stored at −20°C for Western blot analysis. Hearts from transgenic mice expressing a Flag-tagged PTP1B trapping mutant (Flag-PTP1B D181A) were similarly lysed in a substrate-trapping lysis buffer. Lysates were incubated with anti-Flag beads (Dynabeads) for 90 min at 4°C, and the immunoprecipitated proteins were washed with LB. Analysis was performed by Western blot.
RNA isolation and microarray analysis
Hearts were harvested and ventricles were rapidly removed, snap-frozen in liquid N2, and stored at −80°C. Ventricles were pulverized under liquid N2 and total RNA was extracted using Trizol. Microarray analysis was performed in the Genome Quebec facility at McGill University, using the GeneChip miRNA 4.0 Array (Affimetrix) following manufacturer’s instructions. Differential analysis was performed using LIMMA, a linear model fit to each gene separately. Normalized expression values were reported, together with expression values centered in reference to a specific control group. A heatmap was generated where Euclidean distance was used for hierarchical clustering of miRNA hits.
AGO2 immunoprecipitation
AGO2 immunoprecipitation was performed as previously described (24) with minor modifications. Ventricles were pulverized under liquid N2 and the powder was resuspended in lysis buffer LB AGO (10 mM HEPES pH 7.0, 100 mM KCl, 5 mM MgCl2, 0,5% NP-40, 1% Triton X-100, 10% glycerol, 1 mM DTT, EDTA free protease inhibitors, RNASE out), homogenized (Dounce homogenizer, 20 passes) and incubated on a clinical rotator at 4°C for 30 min. Lysates were centrifuged at 14,000 × g for 10 min at 4°C. Protein concentrations were determined using the Bradford method (67). 2 mg of ventricular lysate were incubated with AGO2 antibody (pre-bound to protein A Dynabeads) on a clinical rotator for 4 h at 4°C. The beads were collected using a magnetic stand and washed twice with NT2 buffer (50 mM Tris (pH 7.4), 150 mM NaCl, 1 mM MgCl2, 0.05% NP-40, 100 U/ml RNasin, 1 mM DTT) for 10–15 min and two additional times with a higher salt-containing NT2 buffer (300 mM NaCl). Tubes were changed for the last wash. As a control, total RNA extraction was performed with 10% of lysate. RNAs were extracted from both lysates and immunoprecipitates using Trizol.
Quantitation of AGO2-bound RNAs
qRT-PCR of AGO2-bound mRNAs was performed as described previously (24). Briefly, RNAs from immunoprecipitated AGO2 and lysates were extracted using Trizol and treated with RNase-free DNase. Following DNase treatment, cDNAs were synthesized using a cDNA synthesis kit. The cDNA library was used as template for qRT-PCR using a SYBR Green master mix>. AGO2-bound miRNA were quantified as described with some modifications (68). Briefly, miRNAs were reverse-transcribed using miRNA-specific stem-loop primers. Following a pre-amplification step to increase the amount of cDNA and to improve the sensitivity of the TaqMan qPCR reaction, quantitation of AGO2-bound miRNAs was performed in a 20 μl volume containing multiplexed AGO2-bound cDNAs, TaqMan Universal PCR Master Mix and TaqMan specific probe with RT-qPCR amplifications conducted as recommended by the manufacturer.
Real-time quantitative PCR
qRT-PCR was performed to quantify relative transcript levels of hypertrophy markers in our treated and untreated mouse groups. Snap-frozen ventricles were pulverized under liquid N2 and total RNA was extracted using Trizol. cDNA was synthesized using M-MLV reverse transcriptase (Invitrogen) using random primers. RT-PCR results from each primer pair were normalized to those of Gapdh (forward: 5’-CTGCACCACCAACTGCTTAGC-3’, reverse: 5’-ACTGTGGTCATGAGCCCTTCCA-3’) gene expression and were compared across conditions. The primers used for fetal cardiac genes, Nppa (forward: 5’-GTGCGGTGTCCAACACAGA-3’, reverse: 5’-TTCTACCGGCATCTTCTCCTC-3’), Nppb (forward: 5’-GTTTGGGCTGTAACGCACTGA-3’, reverse: 5’-GAAAGAGACCCAGGCAGAGTCA-3’) and Myh7 (forward: 5’-AGGGTGGCAAAGTCACTGCT-3’, reverse: 5’-CATCACCTGGTCCTCCTTCA-3’). All RT-qPCRs were carried out in duplicate and were performed on a Stratagene MX3000p thermal cycler system with the following conditions: one denaturing step at 95°C for 10 min, 40 cycles consisting of denaturing at 95°C for 15 s and annealing and elongation at 60°C for 60 s, and an inactivation step of 10 min at 99.9°C.
Statistical Analysis
Normality tests (Shapiro-Wilk) were performed on echocardiographic data to assess normality. Difference in means between 2 groups was tested using either an unpaired t-test or a Mann-Whitney test (for non-normally distributed data). For multiple comparisons of means involving a combination of 2 or 3 independent factors such as surgery (TAC, Sham), time of sacrifice (1, 2, 4 weeks), genotype (PTP1BF/F, PTP1B cKO) or PTU treatment (treated, not treated), 2- or 3-way ANOVA, respectively, followed by Tukey’s (to compare all pairs of means) or Holm-Šidák (to compare selected pairs of means) post tests were performed. When a lognormal distribution was indicated, data was log-transformed before conducting the ANOVA. All tests were two-sided. Results were considered statistically significant when P values were <0.05. Significance was indicated as follows on graphs: **** P<0.0001; *** P<0.001; ** P<0.01; * P<0.05. Results are presented as mean ± SEM or median (1st quartile, 3rd quartile) for non-normally distributed data. Statistical analyses were performed using Prism version 9.1 for Mac OS X (GraphPad Software, La Jolla, CA).
Supplementary Material
Acknowledgements:
We thank Nicholas Tonks for the pWZL-PTP1B D181A-Hygro and the pET22b-scFv45 expression constructs. We thank Marc-Antoine Gillis, Louis Villeneuve and Noriko Uetani for their technical expertise, and Terence Hébert, Bruce Allen, Markus Dagnell, Michael Kapiloff and the members of the Boivin laboratory for helpful discussions.
Funding:
This research was supported by NIH grant HL138605 and an American Heart Association grant 17GRNT33700265 to BB, by Heart and Stroke Foundation of Canada grant G-18-00222227 to BGA, and by Canadian Institutes of Health Research grant MOP-62887 to MLT. BB is also grateful for support from the following foundations: Heart and Stroke Foundation of Canada, SUNY Research Foundation, The Montreal Heart Institute Foundation, Fond de Recherche du Quebec en Santé (FRQS). BB and DPL are FRQS Research Scholars. DPL is a Lewis Katz Young Investigator of the Prostate Cancer Foundation and the recipient of a Scholarship for the Next Generation of Scientists from the Cancer Research Society. AB was the recipient of scholarship from the FRQS.
Footnotes
Data and Material Availability:
The microarray data have been deposited in the GEO repository under the accession number GSE199769. All other data needed to evaluate the conclusions in the paper are present in the paper or the Supplementary Materials. PTP1BF/F mice are available from Gerard Karsenty under a material transfer agreement with Columbia University.
REFERENCES AND NOTES
- 1.Burgoyne JR, Mongue-Din H, Eaton P, Shah AM, Redox signaling in cardiac physiology and pathology. Circ Res 111, 1091–1106 (2012). [DOI] [PubMed] [Google Scholar]
- 2.Brown DI, Griendling KK, Regulation of Signal Transduction by Reactive Oxygen Species in the Cardiovascular System. Circ Res 116, 531–549 (2015). [DOI] [PMC free article] [PubMed] [Google Scholar]
- 3.Cadenas S, ROS and redox signaling in myocardial ischemia-reperfusion injury and cardioprotection. Free Radic. Biol. Med 117, 76–89 (2018). [DOI] [PubMed] [Google Scholar]
- 4.Dai DF et al. , Mitochondrial oxidative stress mediates angiotensin II-induced cardiac hypertrophy and Galphaq overexpression-induced heart failure. Circ. Res. 108, 837–846 (2011). [DOI] [PMC free article] [PubMed] [Google Scholar]
- 5.Dai DF et al. , Mitochondrial targeted antioxidant Peptide ameliorates hypertensive cardiomyopathy. J Am Coll Cardiol 58, 73–82 (2011). [DOI] [PMC free article] [PubMed] [Google Scholar]
- 6.Graham D et al. , Mitochondria-targeted antioxidant MitoQ10 improves endothelial function and attenuates cardiac hypertrophy. Hypertension 54, 322–328 (2009). [DOI] [PubMed] [Google Scholar]
- 7.Adlam VJ et al. , Targeting an antioxidant to mitochondria decreases cardiac ischemia-reperfusion injury. FASEB J. 19, 1088–1095 (2005). [DOI] [PubMed] [Google Scholar]
- 8.Steinhorn B et al. , Chemogenetic generation of hydrogen peroxide in the heart induces severe cardiac dysfunction. Nat Commun 9, 4044 (2018). [DOI] [PMC free article] [PubMed] [Google Scholar]
- 9.Rhee SG, Cell signaling. H2O2, a necessary evil for cell signaling. Science 312, 1882–1883 (2006). [DOI] [PubMed] [Google Scholar]
- 10.Janssen-Heininger YM et al. , Redox-based regulation of signal transduction: principles, pitfalls, and promises. Free Radic Biol Med 45, 1–17 (2008). [DOI] [PMC free article] [PubMed] [Google Scholar]
- 11.Holmström KM, Finkel T, Cellular mechanisms and physiological consequences of redox-dependent signalling. Nat Rev Mol Cell Biol 15, 411–421 (2014). [DOI] [PubMed] [Google Scholar]
- 12.Tonks NK, Protein tyrosine phosphatases: from genes, to function, to disease. Nat. Rev. Mol. Cell. Biol. 7, 833–846 (2006). [DOI] [PubMed] [Google Scholar]
- 13.Ostman A, Frijhoff J, Sandin A, Böhmer FD, Regulation of protein tyrosine phosphatases by reversible oxidation. J Biochem. 150, 345–356 (2011). [DOI] [PubMed] [Google Scholar]
- 14.Liu R, Molkentin JD, Regulation of cardiac hypertrophy and remodeling through the dual-specificity MAPK phosphatases (DUSPs). J Mol Cell Cardiol 101, 44–49 (2016). [DOI] [PMC free article] [PubMed] [Google Scholar]
- 15.Tilley DG, Sabri A, DUSPs as critical regulators of cardiac hypertrophy. Clin Sci (Lond) 131, 155–158 (2017). [DOI] [PubMed] [Google Scholar]
- 16.Wade F, Belhaj K, Poizat C, Protein tyrosine phosphatases in cardiac physiology and pathophysiology. Heart Fail Rev 23, 261–272 (2018). [DOI] [PMC free article] [PubMed] [Google Scholar]
- 17.Thiebaut PA et al. , Protein tyrosine phosphatase 1B regulates endothelial endoplasmic reticulum stress; role in endothelial dysfunction. Vascul Pharmacol 109, 36–44 (2018). [DOI] [PubMed] [Google Scholar]
- 18.Elchebly M et al. , Increased insulin sensitivity and obesity resistance in mice lacking the protein tyrosine phosphatase-1B gene [see comments]. Science 283, 1544–1548 (1999). [DOI] [PubMed] [Google Scholar]
- 19.Klaman LD et al. , Increased energy expenditure, decreased adiposity, and tissue-specific insulin sensitivity in protein-tyrosine phosphatase 1B-deficient mice. Mol Cell Biol 20, 5479–5489 (2000). [DOI] [PMC free article] [PubMed] [Google Scholar]
- 20.Delibegovic M et al. , Liver-specific deletion of protein-tyrosine phosphatase 1B (PTP1B) improves metabolic syndrome and attenuates diet-induced endoplasmic reticulum stress. Diabetes 58, 590–599 (2009). [DOI] [PMC free article] [PubMed] [Google Scholar]
- 21.Delibegovic M et al. , Improved glucose homeostasis in mice with muscle-specific deletion of protein-tyrosine phosphatase 1B. Mol Cell Biol 27, 7727–7734 (2007). [DOI] [PMC free article] [PubMed] [Google Scholar]
- 22.Owen C et al. , Adipocyte-specific protein tyrosine phosphatase 1B deletion increases lipogenesis, adipocyte cell size and is a minor regulator of glucose homeostasis. PLoS One 7, e32700 (2012). [DOI] [PMC free article] [PubMed] [Google Scholar]
- 23.Zee T, Settembre C, Levine RL, Karsenty G, T-cell protein tyrosine phosphatase regulates bone resorption and whole-body insulin sensitivity through its expression in osteoblasts. Mol Cell Biol 32, 1080–1088 (2012). [DOI] [PMC free article] [PubMed] [Google Scholar]
- 24.Yang M et al. , Dephosphorylation of Tyrosine 393 in Argonaute 2 by Protein Tyrosine Phosphatase 1B Regulates Gene Silencing in Oncogenic RAS-Induced Senescence. Mol Cell 55, 782–790 (2014). [DOI] [PMC free article] [PubMed] [Google Scholar]
- 25.Haque A, Andersen JN, Salmeen A, Barford D, Tonks NK, Conformation-sensing antibodies stabilize the oxidized form of PTP1B and inhibit its phosphatase activity. Cell 147, 185–198 (2011). [DOI] [PMC free article] [PubMed] [Google Scholar]
- 26.Krishnan N et al. , Harnessing insulin- and leptin-induced oxidation of PTP1B for therapeutic development. Nat Commu 9, 283 (2018). [DOI] [PMC free article] [PubMed] [Google Scholar]
- 27.Oka T et al. , Cardiac-specific deletion of Gata4 reveals its requirement for hypertrophy, compensation, and myocyte viability. Circ Res 98, 837–845 (2006). [DOI] [PubMed] [Google Scholar]
- 28.Heineke J, Molkentin JD, Regulation of cardiac hypertrophy by intracellular signalling pathways. Nat Rev Mol Cell Biol 7, 589–600 (2006). [DOI] [PubMed] [Google Scholar]
- 29.Bernardo BC, Weeks KL, Pretorius L, McMullen JR, Molecular distinction between physiological and pathological cardiac hypertrophy: experimental findings and therapeutic strategies. Pharmacol Ther 128, 191–227 (2010). [DOI] [PubMed] [Google Scholar]
- 30.Barany M, ATPase activity of myosin correlated with speed of muscle shortening. J Gen Physiol 50, 197–218 (1967). [DOI] [PMC free article] [PubMed] [Google Scholar]
- 31.Tardiff JC et al. , Expression of the beta (slow)-isoform of MHC in the adult mouse heart causes dominant negative functional effects. Am J Physiol Heart Circ Physiol 278, H412–H419 (2000). [DOI] [PubMed] [Google Scholar]
- 32.Krenz M, Robbins J, Impact of betamyosin heavy chain expression on cardiac function during stress. J. Am. Coll. Cardiol 44, 2390–2397 (2004). [DOI] [PubMed] [Google Scholar]
- 33.Gupta MP, Factors controlling cardiac myosin-isoform shift during hypertrophy and heart failure. J. Mol. Cell. Cardiol. 43, 388–403 (2007). [DOI] [PMC free article] [PubMed] [Google Scholar]
- 34.Abdellatif M, Differential Expression of MicroRNAs in Different Disease States. Circ Res 110, 638–650 (2012). [DOI] [PMC free article] [PubMed] [Google Scholar]
- 35.Zhang D et al. , microRNA and thyroid hormone signaling in cardiac and skeletal muscle. Cell Biosci 7, 14 (2017). [DOI] [PMC free article] [PubMed] [Google Scholar]
- 36.Boivin B, Tonks NK, PTP1B: mediating ROS signaling to silence genes. Mol Cell Oncol 2, e975633 (2015). [DOI] [PMC free article] [PubMed] [Google Scholar]
- 37.Liu J et al. , Argonaute2 is the catalytic engine of mammalian RNAi. Science 305, 1437–1441 (2004). [DOI] [PubMed] [Google Scholar]
- 38.Small EM, Olson EN, Pervasive roles of microRNAs in cardiovascular biology. Nature 469, 336–342 (2011). [DOI] [PMC free article] [PubMed] [Google Scholar]
- 39.Shen J et al. , EGFR modulates microRNA maturation in response to hypoxia through phosphorylation of AGO2. Nature 497, 383–387 (2013). [DOI] [PMC free article] [PubMed] [Google Scholar]
- 40.Flint AJ, Tiganis T, Barford D, Tonks NK, Development of “substrate trapping” mutants to identify physiological substrates of protein tyrosine phosphatases. Proc Natl Acad Sci USA 94, 1680–1685 (1997). [DOI] [PMC free article] [PubMed] [Google Scholar]
- 41.Labbé DP et al. , PTP1B Deficiency Enables the Ability of a High-Fat Diet to Drive the Invasive Character of PTEN-Deficient Prostate Cancers. Cancer Res 76, 3130–3135 (2016). [DOI] [PMC free article] [PubMed] [Google Scholar]
- 42.Chou CH et al. , miRTarBase update 2018: a resource for experimentally validated microRNA-target interactions. Nucleic Acids Research, (2017). [DOI] [PMC free article] [PubMed] [Google Scholar]
- 43.Agarwal V, Bell GW, Nam JW, Bartel DP, Predicting effective microRNA target sites in mammalian mRNAs. Elife 4, (2015). [DOI] [PMC free article] [PubMed] [Google Scholar]
- 44.van Rooij E et al. , Control of stress-dependent cardiac growth and gene expression by a microRNA. Science 316, 575–579 (2007). [DOI] [PubMed] [Google Scholar]
- 45.Callis TE et al. , MicroRNA-208a is a regulator of cardiac hypertrophy and conduction in mice. J Clin Invest 119, 2772–2786 (2009). [DOI] [PMC free article] [PubMed] [Google Scholar]
- 46.Julien SG et al. , Protein tyrosine phosphatase 1B deficiency or inhibition delays ErbB2-induced mammary tumorigenesis and protects from lung metastasis. Nat Genet 39, 338–346 (2007). [DOI] [PubMed] [Google Scholar]
- 47.Bentires-Alj M, Neel BG, Protein-tyrosine phosphatase 1B is required for HER2/Neu-induced breast cancer. Cancer Res 67, 2420–2024 (2007). [DOI] [PubMed] [Google Scholar]
- 48.Thiebaut PA, Besnier M, Gomez E, Richard V, Role of protein tyrosine phosphatase 1B in cardiovascular diseases. J Mol Cell Cardiol 101, 50–57 (2016). [DOI] [PubMed] [Google Scholar]
- 49.van Rooij E et al. , A family of microRNAs encoded by myosin genes governs myosin expression and muscle performance. Dev Cell 17, 662–673 (2009). [DOI] [PMC free article] [PubMed] [Google Scholar]
- 50.Tahbaz N et al. , Characterization of the interactions between mammalian PAZ PIWI domain proteins and Dicer. EMBO Rep 5, 189–194 (2004). [DOI] [PMC free article] [PubMed] [Google Scholar]
- 51.Wang HW et al. , Structural insights into RNA processing by the human RISC-loading complex. Nat Struct Mol Biol 16, 1148–1153 (2009). [DOI] [PMC free article] [PubMed] [Google Scholar]
- 52.Schiaffino S et al. , Nonsynchronous accumulation of alpha-skeletal actin and beta-myosin heavy chain mRNAs during early stages of pressure-overload--induced cardiac hypertrophy demonstrated by in situ hybridization. Circ Res 64, 937–948 (1989). [DOI] [PubMed] [Google Scholar]
- 53.Pandya K, Kim HS, Smithies O, Fibrosis, not cell size, delineates beta-myosin heavy chain reexpression during cardiac hypertrophy and normal aging in vivo. Proc Natl Acad Sci U S A 103, 16864–16869 (2006). [DOI] [PMC free article] [PubMed] [Google Scholar]
- 54.López JE et al. ,.Lópezpez2006).n is induced by pressure overload in a minor subpopulation of smaller mouse cardiac myocytes. Circ Res 109, 629–638 (2011). [DOI] [PMC free article] [PubMed] [Google Scholar]
- 55.Miyata S, Minobe W, Bristow MR, Leinwand LA, Myosin heavy chain isoform expression in the failing and nonfailing human heart. Circ. Res. 86, 386–390 (2000). [DOI] [PubMed] [Google Scholar]
- 56.Alpert NR, Mulieri LA, Increased myothermal economy of isometric force generation in compensated cardiac hypertrophy induced by pulmonary artery constriction in the rabbit. A characterization of heat liberation in normal and hypertrophied right ventricular papillary muscles. Circ Res 50, 491–500 (1982). [DOI] [PubMed] [Google Scholar]
- 57.Truett GE et al. , Preparation of PCR-quality mouse genomic DNA with hot sodium hydroxide and tris (HotSHOT). Biotechniques 29, 52, 54 (2000). [DOI] [PubMed] [Google Scholar]
- 58.Nyabi O et al. , Efficient mouse transgenesis using Gateway-compatible ROSA26 locus targeting vectors and F1 hybrid ES cells. Nucleic Acids Res 37, e55 (2009). [DOI] [PMC free article] [PubMed] [Google Scholar]
- 59.Rockman HA et al. , Segregation of atrial-specific and inducible expression of an atrial natriuretic factor transgene in an in vivo murine model of cardiac hypertrophy. Proc. Natl. Acad. Sci. USA 88, 8277–8281 (1991). [DOI] [PMC free article] [PubMed] [Google Scholar]
- 60.Liao Y et al. , Echocardiographic assessment of LV hypertrophy and function in aortic-banded mice: necropsy validation. Am J Physiol Heart Circ Physiol 282, H1703–1708 (2002). [DOI] [PubMed] [Google Scholar]
- 61.Grandy SA, Fiset C, Ventricular K+ currents are reduced in mice with elevated levels of serum TNFalpha. J Mol Cell Cardiol 47, 238–246 (2009). [DOI] [PubMed] [Google Scholar]
- 62.Calderone A, Abdelaziz N, Colombo F, Schreiber KL, Rindt H, A farnesyltransferase inhibitor attenuates cardiac myocyte hypertrophy and gene expression. J Mol Cell Cardiol 32, 1127–1140 (2000). [DOI] [PubMed] [Google Scholar]
- 63.Nawaito SA et al. , Transcript levels for extracellular matrix proteins are altered in MK5-deficient cardiac ventricular fibroblasts. J Mol Cell Cardiol. 132, 164–177 (2019). [DOI] [PubMed] [Google Scholar]
- 64.Wang X, McManus M, Lentivirus production. J Vis Exp 32, 1499 (2009). [DOI] [PMC free article] [PubMed] [Google Scholar]
- 65.Chang YC et al. , Tyrosine phosphoproteomics and identification of substrates of protein tyrosine phosphatase dPTP61F in Drosophila S2 cells by mass spectrometry-based substrate trapping strategy. J Proteome Res 7, 1055–1066 (2008). [DOI] [PubMed] [Google Scholar]
- 66.Londhe AD, Rizvi SHM, Boivin B, In Vitro Activity Assays to Quantitatively Assess the Endogenous Reversible Oxidation State of Protein Tyrosine Phosphatases in Cells. Curr Protoc Chem Biol. 12, e84 (2020). [DOI] [PMC free article] [PubMed] [Google Scholar]
- 67.Bradford MM, A rapid and sensitive method for the quantitation of microgram quantities of protein utilizing the principle of protein-dye binding. Anal Biochem 72, 248–254 (1976). [DOI] [PubMed] [Google Scholar]
- 68.Le Carré J, Lamon S, Léger B, Validation of a multiplex reverse transcription and pre-amplification method using TaqMan MicroRNA assays. Front Genet 5, 413 (2014). [DOI] [PMC free article] [PubMed] [Google Scholar]
Associated Data
This section collects any data citations, data availability statements, or supplementary materials included in this article.
Supplementary Materials
Data Availability Statement
The microarray data have been deposited in the GEO repository under the accession number GSE199769. All other data needed to evaluate the conclusions in the paper are present in the paper or the Supplementary Materials. PTP1BF/F mice are available from Gerard Karsenty under a material transfer agreement with Columbia University.