

Summary
Cell state is controlled by master transcription factors (mTFs) that determine the cellular gene expression program. Cancer cells acquire dysregulated gene expression programs by mutational and non-mutational processes. Intratumoral heterogeneity can result from cells displaying distinct mTF-regulated cell states, which co-exist within the tumor. One archetypal tumor associated with transcriptionally regulated heterogeneity is high-risk neuroblastoma (NB). Patients with NB have poor overall survival despite intensive therapies, and relapsed patients are commonly refractory to treatment. The cellular populations that comprise NB are marked by different cohorts of mTFs and differential sensitivity to conventional therapies. Recent studies have highlighted mechanisms by which NB cells dynamically shift the cell state with treatment, revealing new opportunities to control the cellular response to treatment by manipulating cell-state-defining transcriptional programs. Here, we review recent advances in understanding transcriptionally defined cancer heterogeneity. We offer challenges to the field to encourage translation of basic science into clinical benefit.
Keywords: neuroblastoma, cell state, core regulatory circuitry, epigenetics, heterogeneity
Graphical abstract
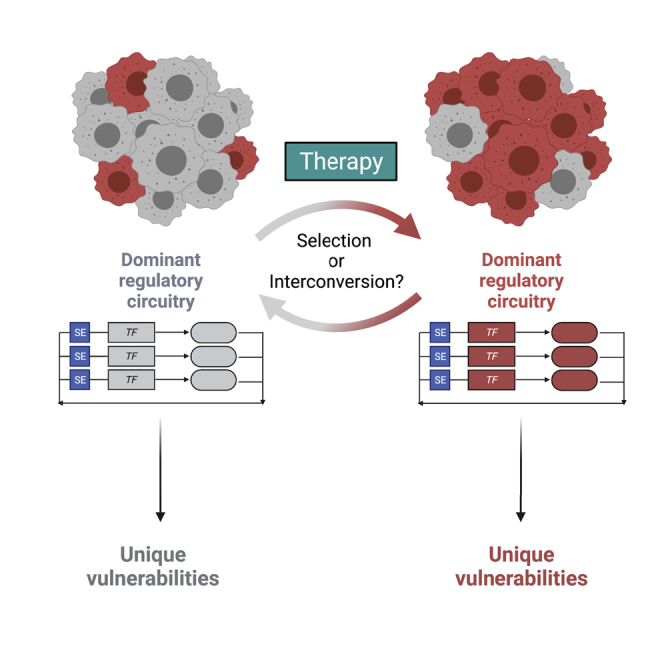
Evidence has implic ated intratumoral heterogeneity as a driver of resistance to cancer therapies. Shendy et al. review how intratumoral heterogeneity is controlled by flexible transcriptional circuitries in the pediatric high-risk malignancy neuroblastoma. They highlight mechanisms that maintain heterogeneity, providing areas for potential therapeutic interventions focusing on regulation of the cell state.
Introduction
The collective activities of the expressed master transcription factors (mTFs) in a given cell type result in the recruitment of co-factors and the licensing of the RNA polymerase II complex to perform mRNA transcription at gene enhancers and promoters. This process establishes the transcriptome of a cell, which manifests the identity of that cell (reviewed in Bradner et al.1). This fundamental process is dysregulated in cancer by a variety of alterations in mTF activity. This may include changes in upstream signaling, chromosomal translocations yielding de novo fusion TFs, overexpression/amplification, or epigenetic dysregulation resulting in changes in chromatin accessibility to TFs (reviewed in Bradner et al.1). The capacity of mTFs to determine a cell state are shaped in cancer by superimposed mutational processes. The combined effects of the underlying transcriptional cell state and superimposed mutational effects result in dysregulation of transcription, facilitating lineage-specific oncogenesis and heightened tumor-cell dependency on transcriptional processes (so-called “transcriptional addiction”).1, 2, 3, 4 Within individual tumors, distinct subpopulations of tumor cells form a complex and dynamic heterogeneous entity. These different subpopulations may respond differently to exogenous stimuli, resulting in selected tumor evolution in the context of cancer therapy.
Tumor heterogeneity is a fundamental property of several different types of cancer and has been described in acute lymphoblastic leukemia,5 non-small cell lung carcinoma,6 colorectal carcinoma,7 breast carcinoma,8,9 pancreatic carcinoma,10 melanoma,11 diffuse intrinsic pontine glioma,12 and malignant glioma and medulloblastoma,13 among others. One tumor displaying hallmark cellular heterogeneity associated with intrinsic transcriptional heterogeneity is pediatric high-risk neuroblastoma (NB).14, 15, 16 NB is the most common extracranial solid tumor of childhood, and despite multimodality chemotherapy, radiation, surgery, immunotherapy, and differentiation therapy, patients still have poor overall survival.17 Notably, there are no available curative options for patients at relapse,17 a time when tumors have endured the enormous selective pressures of conventional therapies. NB tumors are commonly characterized by mutational events that drive the high-level expression of members of the MYC family of oncogenic TFs.18 This occurs by multiple mechanisms, including gene amplification,19 stabilized protein expression20 or enhancer hijacking.21 Among other oncogenic effects, dysregulated MYC proteins cause amplification of transcriptional output, resulting in selective reliance on transcriptional processes.2, 3, 4 Notably, other than these, the high-risk NB tumor genome has very few other recurrent mutations, save for mutations in either ALK (∼9%), ATRX (∼7.1% deletion, 2.5% mutation), or PTPN11 (2.9%) cases.18 Compared with other malignancies, the presence of relatively few mutations in the NB genome14, 15, 16,22,23 presents it as an ideal model to study transcriptionally driven tumor heterogeneity.
Recent evidence, including that derived from single-cell mRNA sequencing atlases, indicates that NB tumors are heterogeneous entities composed of transcriptionally distinct groups of cells that together comprise a complex and dynamic primary tumor.14, 15, 16,24, 25, 26, 27 This heterogeneity poses a therapeutic challenge since a primary tumor may alter its composition of subpopulations in response to the selective pressure of cancer therapy, resulting in the enrichment of a different cell state at relapse, as compared with diagnosis.16 These distinct cell states are characterized by fundamental differences in expression and activity of mTFs, which drive different transcriptional networks. Dissecting intratumoral heterogeneity by studying these subpopulations in an isolated manner is a reductionist approach to identifying therapeutic strategies for each of these populations independently, termed “subpopulation-directed therapy.” However, understanding the co-existence of these subpopulations also forms the basis for approaches that aim to understand how they cooperatively promote the growth of a primary tumor.
Core regulatory circuitries establish the transcriptome of the cell
The potency of mTFs in establishing transcriptional networks and cell identity was conclusively demonstrated by Yamanaka and colleagues.28 They identified that the transcriptome of a cell, which determines cell state, is flexible and can be rewired in the context of forced expression of small, selected sets of mTFs.28 The concept of re-programming cells from terminally differentiated to pluripotent states was transformative to the paradigm that postulated terminal differentiation to be an irreversible, “hard-wired” state. Thus, the transcriptional program must be malleable and controlled by the coordinated activities of networks of mTFs that establish it,28 and individual cohorts of mTFs induce different transcriptional programs that yield distinct cell states and phenotypes.
Further evidence indicates that these mTFs form autoregulatory positive-feedback loops, in which each mTF regulates its own expression and that of the others29 (model in Figure 1A). The regulation of each mTF gene is accomplished by the physical binding of each mTF protein to enhancer regulatory elements distal to the gene body. This network organization model is termed the “core regulatory circuitry” (CRC).29, 30, 31 The coordinated binding to and regulation of other effector genes by CRC mTFs establishes the transcriptome of the cell, termed the “extended regulatory network” (ERN).30
Figure 1.

Conceptual mechanisms by which changes in core regulatory circuitry members result in dysfunctional circuitries and oncogenesis
(A) Regulatory circuitries are shown as genes (boxes) regulated by super-enhancer elements (SEs). These genes produce transcription factor protein products (ovals) that autoregulate their own loci and that of other TFs within the network. This produces a “balanced” core regulatory circuitry state.
(B) This balanced state may be dysregulated by acquisition of a new oncogenic transcription factor member (TF4), which introduces protein-protein or protein-DNA interactions, interactions with RNA species, or co-activators, to co-opt the regulatory circuitry to an oncogenic outcome.
(C) Loss of a transcription factor (TF3) that suppresses tumorigenesis, resulting in altered transcriptional activity, re-targeting of residual complexes to different gene loci, or both, resulting in oncogenesis.
(D) Invasion of regulatory elements by oncogenic effectors (red box) such as MYC family TFs can induce mRNA amplification across single, collections of, or all genes, resulting in a dysregulated CRC.
A CRC is a meta-stable arrangement of mTFs and regulatory elements. By this model, the effects of slight and transient reductions in the protein expression of one mTF can reverberate throughout the other TFs within the network, as they bind to the promoter and/or enhancers that regulate the mTF.30 This results in feedforward pressure exerted by the other TFs in the network and restored gene expression of the previously reduced mTF.30 In E. coli, positive autoregulation loops slowly respond to changes in TF concentration, yielding cell-to-cell variability in expression that enhances the ability of a population of cells to respond to environmental stimuli.32,33 Changes in mTF composition also occur during development, implying that flexibility in control of the transcriptome is sufficient to drive morphologic and phenotypic change in cells. For example, pluripotency and self-renewal of embryonic stem cells are maintained by a well-defined CRC, including the mTFs NANOG, OCT4, and SOX2.29 During development, specification of pluripotent stem cells in the inner cell mass into the primitive endoderm is induced by expression of the fibroblast growth factor FGF4.34 Pluripotent embryonic stem cells in the epiblast produce and secrete FGF4, which causes downregulation of NANOG and upregulation of GATA6 in other cells within the inner cell mass, leading to the formation of the primitive endoderm.34 Thus, loss of one CRC member (NANOG) and gain of a new member (GATA6) in response to extracellular stimuli result in changes in cell fate.34,35 Notably, these networks are primed for collapse in pathological conditions, as loss of a single TF member of the CRC by sporadically occurring endogenous mechanisms (mutation, deletion, translocation) or by exogenous, experimental methods may yield an “unraveling” of the network. This collapse can occur if the expression of a CRC member falls below a threshold such that the above-mentioned and other mechanisms, including collaboration with signaling TFs, are unable to instantly support cooperative gene expression. Thus, a CRC presents a meta-stable population-based arrangement whereby cells may dynamically respond to external factors that drive slight changes in gene expression but may also be incapable of responding to considerable disruption of these networks by genetic or perhaps pharmacologic manipulation.
The constituent members of the CRC are typically DNA-binding TFs. However, linker proteins, co-factors, and non-coding RNAs are also involved in CRC-anchored regulation, such as in the case of microRNAs that suppress the expression of CRC TFs.36 Further, mTFs can co-localize with RNAs within transcriptional condensates,37,38 suggesting possible RNA-based regulatory mechanisms through physical interactions.
CRCs in cancer
Multiple orthogonal approaches have been used to define CRCs in a range of tissue and disease settings. One of the most common approaches is to associate specific TF-encoding genes with super-enhancers (SEs), usually identified as extensive stretches of acetylation on histone H3, lysine-27 (H3K27ac).39, 40, 41, 42 SEs are a helpful surrogate to identify CRCs since they are often associated with lineage-specific genes and oncogenes, and the technique used to resolve them, H3K27ac chromatin immunoprecipitation sequencing (ChIP-seq) to the H3K27ac mark, is an unbiased and relatively simple experiment to perform.41,43, 44, 45, 46 This association has led to a model by which SE-regulated mTFs define the component members of the CRC.30
The model of SE-controlled mTFs forming CRCs was initially identified in murine embryonic stem cells29 but subsequently expanded from untransformed to transformed cells by several key findings. First, SE-marked loci were found to be enriched for tumor oncogenes in addition to lineage-specific genes.41,47 Second, mTFs and their circuitries were demonstrated to be dysregulated by known oncogenic drivers in cancers such as T cell acute lymphoblastic leukemia (T-ALL).31,46 This example also provided critical insight into the mechanisms by which tumor-specific CRCs differ from those found in untransformed cells. In some T-ALL samples, the activity of the CRC formed by GATA3, TAL1, RUNX1, LMO1/2, E2A, and HEB is co-opted by mutationally derived non-coding insertions that cause ectopic binding of the hematopoietic mediator and the T-ALL oncogene MYB at the TAL1 locus.31,46 This finding provides an example of a more general phenomenon: dysregulation of transcriptional networks may occur by mutationally derived addition of an “extra” mTF oncogene.48 This example informs a generalized hypothesis for ectopic, oncogenic activities of CRCs, wherein oncogenic dysregulation of CRCs may conceptually result from either the addition of an oncogene, loss of a repressive TF, or inclusion of a factor that globally dysregulates transcription (Figures 1B–1D). This hypothesis is rooted in the growing descriptions of CRCs in cancer (reviewed in Chen et al.49) and, indeed, in evidence from other species such as Candida, where the addition or subtraction of distinct sets of TFs results in the rewiring of transcriptional circuitries and acquisition of new biological activities.50,51
Subsequently, by the combined effort of multiple groups, CRCs have been defined for many tumor types, including NB,14,15,44 chronic lymphocytic leukemia,52 dedifferentiated liposarcoma,53 esophageal carcinoma subtypes,54,55 rhabdomyosarcoma,56,57 and others (recently discussed in Chen et al.49). Further, given the central role of CRCs in establishing cell fate,29,30,44 and the broad dependence of cancer cells on CRC mTFs for growth,58 others have attempted to perturb or control these TFs for therapeutic benefit. For further details on the general role and structure of CRCs in cancer, the reader is referred to a recent review.49 Herein, our discussion of the CRC will focus on advancements as they relate to definition and control of NB transcriptional cell state and tumor heterogeneity.
The role of CRCs in establishing NB heterogeneity
Several studies have demonstrated that individual NBs display heterogeneity in the cell state. By pairing SE analysis with principal-component analysis on H3K27ac ChIP-seq performed in various NB patient-derived xenograft (PDX) and cell-line samples, NB cell lines could be subdivided into two distinct SE landscapes, termed neural-crest-like or noradrenergic.14 Separately, transcriptional signatures were used to distinguish different subtypes of NB cell lines and isogenic tumor-cell-line pairs, termed mesenchymal (MES) or adrenergic (ADRN) cell states.15 In both cases, the transcriptional and SE loci signatures were interlinked. Individual cell lines could be distinguished that dominantly belonged to either group—mesenchymal/neural-crest-like (now commonly referred to as MES) or noradrenergic/adrenergic (now widely referred to as ADRN)—based on either transcriptional signatures or SE profiles.14,15 Importantly, cell lines that were mixtures of these subpopulations could be separated into populations enriched for one or the other. For example, while the cell line SK-N-SH was demonstrated to be composed of predominantly ADRN cells, single-cell subclones of this cell line, SH-EP and SH-SY5Y, produced largely MES or ADRN states, respectively.14,15 These findings are somewhat reminiscent of foundational studies in the transformed human mammary epithelial cell (HMLER) engineered models of breast cancer, which display populations of cells existing predominantly in an epithelial or MES state.59,60 In contrast to this model where restricted epithelial or MES cells are rare within the larger tumor population,59 the majority of NB cells and tumors appear to be in either the MES or ADRN state.16,25
Further supporting that distinct ADRN and MES subpopulations exist in vivo, individual human NB tumor transcriptomes cluster with those of either ADRN- or MES-dominant cell lines.58,61 These two cell states may be plastic, since ADRN or MES single-cell subclones from NB cell lines appear to be capable of re-populating both transcriptional states.15,62 Further, the generation of heterogeneous cell pools from single-cell subcloned pools implies that flexibility in the cell state may be independent of mutational status.15,16,24,62 The prominence of several specific TFs was recurrently highlighted across these analyses, including the presence of SEs at their loci and exceptionally high mRNA expression. These TFs include PHOX2B, GATA3, and HAND2 in the ADRN cell state and a large and highly variable number of TFs including PRRX1, RUNX1/2, FOSL1/2, IRF1/2, TCF7L2, and JUN in the MES state.14,15
In parallel to these analyses, exome-wide CRISPR-Cas9 dropout screens on >350 cancer cell lines, including 11 NB cell lines, were used to identify genes selectively required for NB cell growth.44 In this analysis, several TFs, including HAND2, ISL1, PHOX2B, GATA3, TBX2, ASCL1, and TFAP2β were each marked by SEs and are also commonly required to promote the growth of high-risk NB cells.44,63,64 The function of most of these TFs was specifically defined using transient small interfering RNA (siRNA) to disrupt each gene, which demonstrated loss of growth phenotypes and, indeed, loss of gene expression of each other member.44 These findings established that these mTFs, which co-bound at each other’s enhancers, represented a CRC in high-risk NB.44,63 Importantly, most cell lines in this analysis had more dominant ADRN subpopulations. However, the two MES-dominant cell lines in this analysis, SKNAS and CHP212, were equally dependent on many of these TFs, including HAND2, ISL1, PHOX2B, GATA3, and TBX2.44 Thus, while the transcriptomes of MES- and ADRN-dominant subtypes of NB cluster distinctly,14,58,61 there is a significant overlap in expression of HAND2, ISL1, GATA3, TBX2, and ASCL1, which may reflect a critical role for these genes as lineage-specifying factors across all subtypes of NB. PHOX2B, in contrast, appears to be either lowly expressed or absent in some MES cell lines.14 Importantly, these TFs, including PHOX2B, are generally exceptionally highly expressed in ADRN subtypes relative to MES subtypes.14,15 A different set of TFs are exceptionally highly expressed in MES subtypes, compared with ADRN, including PRRX1, RUNX1/2, FOSL1/2, IRF1/2, TCF7L2, and JUN. However, the specific mTFs that form the MES CRC have yet to be determined. Comparing transcriptional signatures by RNA-seq across many tumor types has demonstrated that while ADRN NB develops a well-defined cluster, MES NB displays a large variability in expressed genes and clustering.58,61 This suggests that the mTFs responsible for driving the MES CRC may be more varied. This is echoed in a recent study by Gartlgruber et al., where MES cells displayed many more putative mTFs than ADRN cells.16 While NBs dominated by either subtype express different levels of HAND2, ISL1, PHOX2B, GATA3, TBX2, and ASCL1, the expression of these mTFs in NBs as a whole, regardless of subtype, is collectively typically high when compared with other tumor types.44 Coupled with CRISPR-Cas9 dropout data, this suggests these TFs may be required for the growth of both ADRN and MES cells and may reflect a fundamental central NB CRC based in cell lineage.
Further, there are functional implications to these distinct cell states where MES and ADRN cells also have different capacities to form tumors in animal models. ADRN cells display enhanced tumorigenesis in xenograft assays compared with MES cells.62 Here, Lecca et al. transplanted ADRN- or MES-dominant subclones from the same cell line, subdivided by CD133 status (ADRN demonstrating low CD133 levels and MES cells showing high).62 This finding is consistent with early work on NB tumor-initiating cells, which were CD133-negative65,66 and therefore presumably correlate with the ADRN subtype. These results, viewed through the lens of CRCs, are essentially now explained by cell lines and primary tumors existing in heterogeneous populations of both MES and ADRN subtypes.14, 15, 16,24,44,58,62 Intriguingly, sorting NB cells into CD133LOW and CD133HIGH populations, followed by xenografting, resulted in tumors with a mixed population of cells.62 These data provide a hypothesis that these subpopulations may interconvert between each other; however, these experiments did not rule the possibility of contaminating cells of either the ADRN or MES subtype within the xenografted populations.67 Thus, while there is a possibility that ADRN and MES cells may spontaneously interconvert between transcriptional cell states, further examination of this point is needed. In addition, in this study, cell-line xenografts composed of MES-dominant tumor clones grew more slowly than ADRN-enriched ones.62 This is reminiscent of patients who appear to have no evidence of disease at the end of therapy but experience a late relapse. To this end, analysis of primary and relapsed tumors by single-cell RNA-seq has demonstrated enrichment for MES cells at relapse.16 If MES cells are enriched at relapse and are relatively resistant to commonly used forms of chemotherapy, then a complete description of the signals and switches that drive MES to ADRN subtypes and vice versa will have significant implications for the clinical management of patients with NB.
Expanded complexity of CRCs in NB
Further expanding the complexity of regulatory circuitries in NB, Gartlgruber et al. demonstrated that additional SE profiles exist among NBs. These correspond to an MES subtype, along with other clinically relevant groupings: (1) MYCN-amplified, (2) MYCN-non-amplified high risk, and (3) MYCN-non-amplified low risk. The identities of the MYCN-amplified and MYCN-non-amplified high-risk groups appear to overlap with the ADRN group, suggesting that these represent distinct subgroupings of ADRN cells.16 These subgroups appear to converge on cell-cycle regulation through cyclin D1, a common dependency across NB subtypes.16,44,58 While the mechanisms by which this convergence occurs are unknown, genetic modeling indicates that this may be mediated by loss of ARID1A in MYCN-amplified tumors and by loss of CHD5 in MYCN-non-amplified tumors.68
The MYCN-non-amplified low-risk group is a distinct subgroup of patients with a disease strikingly different than typical high-risk NB. This group is characterized by excellent overall survival.17 While little is known about the transcriptional cell state of MYCN-non-amplified low-risk tumors and the causes of their excellent prognosis and occasional involution, Gartlgruber et al. identified a group of TFs, including MEIS2, that appear to be SE regulated in these specimens.16 These data reflect prior findings where MEIS2A, an alternatively spliced isoform of MEIS2, is highly expressed and implicated in metastatic-stage-4S tumors,69 a self-involuting form of low-risk NB. This indicates that a TF isoform may be involved in establishing the transcriptome within a self-involuting tumor. In contrast, other recent findings have implicated MEIS2 as an ADRN CRC factor,70 suggesting that isoform-specific regulation of MEIS2 may be critical to growth. The identification of SE-regulated loci in MYCN-non-amplified low-risk groups also includes other TFs, including RORA, STAT3, TCF4, SOX6, and EBF1, which provides a tantalizing selection of genes for further study of differences in transcriptional regulation between metastatic high- and low-risk tumors, which include the enigmatic self-involuting stage-4S NB.
Perturbation of cell state alters tumor heterogeneity in NB
Genetic perturbations
The roles of few mTFs in the regulation of the NB cell state have been specifically examined. PHOX2B, which is mutated in germline predisposition syndromes of high-risk NB,67,71 is associated with the ADRN cell state, with low expression in MES cells.14,15,24 Further, PHOX2B is a genetic dependency in NB,44 and downregulation of PHOX2B expression is associated with slower, but not ablated, tumor growth in ADRN cell xenografts.14 In contrast, stable knockout of another ADRN CRC mTF, GATA3, in ADRN SH-SY5Y cells yields rare cell clones that are viable and that have a more MES-like gene expression pattern.72 Importantly, PHOX2B and GATA3 both have homologs that are common NB dependencies and similarly expressed in NB, PHOX2A and GATA2, suggesting an incomplete “buffering” capacity within these transcriptional networks on the transcriptome that may be sufficient to maintain some component of cell growth in the absence of the first gene. In contrast, expression of the TF PRRX1 appears to be restricted to MES cells, with overexpression of this protein leading to conversion of ADRN to MES cells.15 These genetic experiments imply that PHOX2B, GATA3, and PRRX1 may be mTF controllers of these two cell states.
These experiments also imply that external stimuli impacting upon PHOX2B, GATA3, or PRRX1 expression may be sufficient to induce interconversion between transcriptional cell states. Indeed, this concept is echoed in the HMLER model, where cellular plasticity is controlled by extracellular canonical and noncanonical WNT signaling.59 In NB, experimental evidence indicates that overexpression of NOTCH3 in SH-SY5Y ADRN cells is sufficient to downregulate PHOX2B and reprogram to a MES cell state that eventually also results in transcriptional downregulation of the other ADRN CRC members TFAP2β, GATA3, ISL1, and ASCL1.24 Associated with this downregulation is re-programming at the ASCL1 locus, with loss of the SE at this site. Since SH-SY5Y is a strongly ADRN cell line, these data indicate that forced expression of NOTCH3 may be sufficient to alter the expression of mTF networks, yielding a switch in cell state from ADRN toward MES.14 Associated with these findings are enhanced resistance to chemotherapies in NOTCH3-induced MES-like SH-SY5Y cells, including doxorubicin, etoposide, and cisplatin.14 These findings echo prior work, demonstrating that MES cells may be more chemoresistant than ADRN cells.14,15,62 Similarly, in zebrafish models of NB, ARID1A loss results in increased penetrance of MYCN-driven tumors, associated with loss of the ADRN and acquisition of an MES cell state.73 Paradoxically, however, the NBs formed in this study display a more rapid onset and are more highly penetrant, despite being of MES state.73 These data that conflict with the slower growth rate identified in MES, as compared with ADRN, xenografts.62 Further, genetic deletion of ARID1A in the human ADRN NB cell line NGP did not affect cell growth but induced a motility and invasiveness phenotype in vitro.73 These findings indicate key disparities between human cell lines, murine and zebrafish genetic models, and animal xenografts of NB that need to be further explored to fully understand the different growth, invasion, and metastatic properties of ADRN and MES cells.
Chemical perturbations
Identifying CRCs in high-risk NB and other tumors has ignited an eagerness to target them with small molecules, intending to modulate the cell state for potential therapeutic benefit. Early studies using the BET bromodomain inhibitor compound JQ1 demonstrated that disruption of BRD4 reader activity was associated with loss of c-MYC expression in acute myeloid leukemia.74 These results led to an explosion in inquiry in various tumors, yielding numerous epigenetic targets for study in distinct tumor states (reviewed in Wimalasena et al.75). Save for a few exceptions, the direct physical targeting of TFs by small molecules, however, has been challenging to accomplish in vitro or in vivo (reviewed in Wimalasena et al.75). Thus, most efforts in NB have focused on disrupting regulators of TFs such as epigenetic enzymes and binding factors (Table 1). In NB, disruption of transcriptional processes in single-agent or combination strategies involving inhibition of BRD4 with JQ1,76 CDK7-, 12-, and 13-mediated transcriptional elongation with THZ1 or THZ531,77 have striking effects on the collapse of CRCs. Inhibition of CDK9 also causes generalized loss of transcriptional output by suppressing MYCN-regulated transcription in MYCN-amplified NB. Intriguingly, CDK9 inhibition is also associated with the selective loss of ADRN transcripts such as HAND2, HAND1, PHOX2A, PHOX2B, GATA3, ISL1, and KLF7 without the induction of MES transcripts, yielding growth suppression of ADRN NB cells.78
Table 1.
Indirect targeting of CRC members in neuroblastoma
| Molecule and reference | Type of neuroblastoma targeted | Target | Mechanism of action | Effect on CRC or CRC members | Phenotype |
|---|---|---|---|---|---|
| 5′azacytidine79 | human MYCN-amplified neuroblastoma cell lines induced to form lung metastases | DNMT1, DNMT3A, DNMT3B | epigenetic control of transcription | suppressed expression of PHOX2B | not reported |
| GSK126 and JQEZ580 | MYCN amplified and non-amplified | EZH2 | inhibition of epigenetic-mediated transcriptional repression | EZH2 inhibition upregulates expression of a 37 gene module including the MES transcription factors PRRX1 and TCF7L1 | inhibition of cell growth in vitro; GSK126 inhibits xenograft growth (MYCN amplified and non-amplified) |
| BRD843081 | MYCN amplified and non-amplified | HDAC1, HDAC2, HDAC3 | epigenetic control of transcription | loss of HDAC1 and HDAC2 by siRNA inhibits expression of GATA3 and ASCL1 | decreased cell viability and induced differentiation |
| JQ182 | MYCN amplified and non-amplified | BRD4, BRD2, BRD3, BRDT | epigenetic control of transcription | indirect suppression of MYCN protein levels | induces differentiation, loss of proliferation, reduced xenograft growth |
| OTX01583 | MYCN amplified | BRD4, BRD2, BRD3, BRDT | epigenetic control of transcription | loss of c-MYC or MYCN expression with associated loss of MYC-driven gene expression | enhanced killing of MYCN-amplified cells, xenograft growth. |
| THZ177 | MYCN amplified and non-amplified | CDK7, CDK12, CDK13 | transcriptional initiation/elongation | loss of active transcription causing suppression of MYCN-induced global transcriptional amplification; loss of super-enhancers compared with typical enhancers and loss of H3K27ac notably at the MYCN, PHOX2B, and GATA2 loci | enhanced effects on cell-cycle arrest and apoptosis in MYCN-amplified cell lines; tumor regression in MYCN-amplified xenografts |
| THZ1+ JQ144 | MYCN-amplified | CDK7, CDK12, CDK13 (THZ1); BRD4, BRD3, BRD2, BRDT (JQ1) | inhibition of transcriptional initiation/elongation and epigenetic control of transcription | inhibits expression of ADRN CRC members MYCN, HAND2, PHOX2B, ISL1, GATA3, and TBX2 | synergistic inhibition of cell-line and xenograft growth |
| THZ1+ panobinostat84 | MYCN amplified and non-amplified | CDK7, CDK12, CDK13 (THZ1); non-selective HDAC inhibition (panobinostat) | inhibition of transcriptional initiation/elongation and epigenetic control of transcription. | inhibits c-MYC and MYCN protein levels | synergistic inhibition of cell-line growth in cell culture and xenografts |
| JQAD164 | MYCN amplified and non-amplified | EP300 degradation | epigenetic control of transcription | inhibition of MYCN mRNA expression; loss of genome-wide H3K27ac with enhanced loss at CRC super-enhancers | apoptosis in cell lines, reduced xenograft growth |
| CYC06578 | MYCN-amplified | CDK9 and CDK2 | inhibition of transcriptional initiation/elongation; G1 cell-cycle arrest. | loss of MYCN-regulated transcripts including HAND2, PHOX2A, PHOX2B, GATA3, ISL1, TBX2, HAND1, and KLF7; minimal change in MES-associated transcription factors | reduced tumor growth in xenografts of MYCN-amplified Kelly cells; reduced murine TH-MYCN; TH-ALKF1174 growth, enhanced effects with co-treatment with temozolamide |
| Retinoic acid85 | MYC amplified | agonism of retinoic acid receptor dimers | epigenetic and transcriptional re-programming | loss of PHOX2B gene expression; proteasomal degradation of PHOX2A with prolonged treatment | not reported |
| Retinoic acid86 | adrenergic MYCN amplified | agonism of retinoic acid receptor dimers | epigenetic and transcriptional re-programming | decreased MYCN expression with loss of PHOX2B, GATA3, and ASCL1; ADRN CRC is replaced by a new retino-sympathetic CRC containing SOX4, MEIS1, and RARA | differentiation |
Other approaches, including the use of targeted inhibitors of histone deacetylases (HDACs) 1 and 2, resulted in enhanced NB differentiation,81 and non-selective HDAC inhibition synergizes with THZ1 to suppress xenograft growth.84 Mechanistically, siRNA-mediated targeting of HDAC1 and HDAC2 together resulted in selective suppression of the ADRN CRC members GATA3 and ASCL1, indicating that these mTFs may play a role in repressing normal neuroblastic differentiation.81 Independently, using the clinically active agent retinoic acid to drive NB differentiation, Zimmerman et al. demonstrated that retinoic acid causes loss of GATA3, ASCL1, and PHOX2B expression, concurrent with acquisition of SE elements at the loci of SOX4, MEIS1, and RARA, associated with upregulation of these transcripts.86 These data indicate that loss of these specific members of the ADRN CRC and gain of expression of other, distinct TFs is associated with neuroblastic differentiation. In total, these data indicate that global dysregulation of transcription by targeting transcriptional regulators can cause a range of phenotypic changes, ranging from collapse to subtle rewiring of transcriptional circuitries. These alterations in transcriptional circuitries are associated with the acquisition of new cell states and phenotypes (Figure 2). However, since most of these studies have focused on ADRN-dominant cell lines and tumors, there remains pivotal questions to be answered about the relevance of these approaches in phenotypically distinct MES cells.
Figure 2.

Alterations in transcriptional circuitries results in acquisition of new phenotypes
Regulatory circuitries are demonstrated genes (boxes) regulated by SEs. These genes produce transcription factor protein products (ovals) that autoregulate their own loci and that of other TFs within the network. Perturbation of this circuitry, by loss of TF3 and acquisition of TF4, results in a newly generated regulatory circuitry, with new genomic-binding loci. This causes alterations in the transcriptome, with a new cellular phenotype.
Cell-fate switching caused by CRC plasticity engenders drug resistance
Loss of individual members of CRCs without substitution of other new TF members is typically lethal to the NB cell.44 However, recent studies have demonstrated that changes in cellular phenotype may be driven by subtle alterations in CRCs, where some members may be lost and new members gained. These findings provide insight into the mechanisms by which the cell state is governed, demonstrating that cellular phenotypes, such as drug resistance, proliferation, invasion, or differentiation, may be derived by changes in regulatory circuitries (Figure 2). Further, two recent studies have shown that changes in the constituent members of the CRC promote NB differentiation. In both studies, cis-retinoic acid, a clinically used differentiation agent in high-risk NB, led to fundamental rewiring of the CRC, with loss of members of the ADRN CRC and acquisition of new members previously unrelated to either the ADRN or MES cell states, such as MEIS1 and SOX4.86,87 When SOX4 knockout NB cells were treated with cis-retinoic acid, they failed to differentiate and instead were committed to apoptotic cell death.86 These findings indicate a conserved mechanism by which cis-retinoic acid drives changes in cellular phenotype through modulation of CRC members and implies the necessity of these transcriptional changes for achieving the phenotypic outcome of differentiation.
The concept of changes in NB CRC members resulting in altered cellular phenotype has also been demonstrated in the context of drug resistance. For example, resistance to ALK inhibition in MYCN-driven NB is mediated in part by upregulation of the CTCF-like protein BORIS.88 BORIS causes changes in three-dimensional chromatin architecture, resulting in genomic reorganization and newly formed SEs at, and upregulation of, TF genes that are typically upregulated during neuronal differentiation, such as SIX1, NEUROD1, NEUROD4, NEUROG1, SOX2, and SOX9.88 While the status of conventional ADRN or MES TF loci and gene expression was not commented on in this work, the BORIS-induced cell state is resistant to both ALK and BRD4 inhibitors.88 These data indicate that BORIS activity reprograms cells to drive a new cell state marked by altered mTF expression and resistance to multiple agents that target transcription.88
Beyond targeted therapies, broad-spectra chemotherapies used in the management of NB also differentially affect the heterogeneous components of individual NB tumors. In these studies, MES cells such as SH-EP display enhanced endogenous resistance to the conventional agents etoposide, cisplatin, and doxorubicin, as compared with ADRN cells such as SH-SY5Y. Further, treatment of the “intermediate” cell line SK-N-SH with cisplatin or doxorubicin resulted in changes in gene expression such that the resultant pool clustered more with MES cell lines.14 Separately, studies of both ADRN and MES cell lines treated with escalating doses of cisplatin to isolate relatively resistant cell lines demonstrated that resistant clones are marked by an enhanced MES gene expression pattern.89 These data indicate that MES and ADRN cells may show fundamentally distinct responses to conventional chemotherapeutic agents and that these states may exist along a continuum. Further, these data provide potential insights into the mechanisms by which chemotherapies shape tumor evolution, resulting in the reported finding of enhanced MES cell phenotypes at patient relapse.16 These data suggest two attractive potential hypotheses: (1) MES cells are enriched at relapse due to enhanced intrinsic chemoresistance programmed by MES gene expression patterns or (2) NB tumor cells are a dynamic entity capable of “switching” between ADRN and MES cell states, and conventional chemotherapies favor switching to an MES gene expression pattern (Figure 3). Evidence exists to support both hypotheses; however, a deeper understanding of how these mechanisms interact to engender NB relapse will be critical to developing strategies to target the disease at relapse.
Figure 3.

Principles of selection or interconversion of heterogeneous cancer-cell clones
Two distinct models of adrenergic and mesenchymal clonal selection due to therapy in high-risk neuroblastoma are shown.
(A) Tumors at diagnosis are heterogeneous populations. Adrenergic cells are depleted by conventional therapies, resulting in residual mesenchymal cells that repopulate the tumor, yielding a mesenchymal-dominant relapsed tumor. Here, adrenergic cells are found in the relapsed tumor due to subsequent stochastic interconversion of mesenchymal to adrenergic cells.
(B) Tumor populations are globally reduced by therapy, affecting both adrenergic and mesenchymal cells. Residual cells undergo cell state switching, and treatment with conventional chemotherapies favor switching to a mesenchymal (MES) gene expression pattern. This results in re-population of tumors yielding mesenchymal-dominant relapsed tumors.
Intriguingly, relapsed NB demonstrates enrichment for RAS-pathway member mutations90, 91, 92 and MES gene signatures.16 This leads to a tempting hypothesis that Ras-pathway mutations are, in some way, linked to MES phenotypes and chemoresistance. This hypothesis remains unproven in NB, though activated Ras pathways have long been implicated in driving chemoresistance in other diseases, such as melanoma.93 It is notable that MES-enriched cell lines commonly contain activating RAS-pathway mutations, such as mutations in K-RAS (KPNSI9S), N-RAS (CHP212, SK-N-SH, SKNAS), and B-RAF (NB1, ACN). Other mutations of genes in the RAS pathway implicated in relapsed NB90,91 include NF1, PTPN11, and ALK, which are rarely demonstrated in MES cell lines. Whether these findings reflect small numbers of sequenced MES-enriched cell lines, adaptation to laboratory study conditions, or the fundamental biology of these cells in vivo remains to be identified.
By comparing three pairs of primary and relapsed samples, Gartlgruber et al. also made the critical observation that relapsed tumors may be enriched for cells of the MES state.16 Further, these samples appeared to be associated with a RAS-driven gene expression signature.16 These data suggest one of two potential explanations: (1) therapy selects for rare clones containing RAS-pathway mutations that are present at diagnosis or (2) MES lineage clones may preferentially acquire mutations that yield a selective growth advantage by the pro-mutational activity of treatment (Figure 3). Again, these distinct possibilities warrant further exploration and accelerated drug-discovery efforts to identify mechanisms to selectively target rare MES clones present at diagnosis in the first case or, alternatively, to replace mutagenic agents that induce these clones during therapy in the second.
Conclusions and future directions
Recent studies of transcriptional heterogeneity in high-risk NB and other tumors have yielded important insights into the mechanisms by which transcriptional heterogeneity forms and is controlled. These studies have highlighted heretofore unappreciated complexities in the interplay between enhancer remodeling, transcriptional changes, and the acquisition of new cellular phenotypes in complex tumor microenvironments and have led to hypotheses of how exogenous control of one of these aspects may impact the others. In the setting of single-cell RNA-seq approaches identifying higher-resolution transcriptional networks based on the highly expressed genes in clinical samples of NB and, indeed, other tumors, the insights of such study will be profound.25, 26, 27 Mapping these regulatory circuitries to fetal and developmental stages will also yield impactful insights into the origins of the disease, the mechanisms by which normal cells become malignant and, ultimately, produce new therapeutic strategies that harness the heterogeneity of NB to identify strategies to ablate distinct tumor-cell populations.
To do so, however, several critical questions must be answered to develop practical approaches that target these distinct subsets of tumor cells for subpopulation-directed therapy. First, single-cell-sequencing technologies have been used extensively to try to pinpoint the cell of origin for NB.25, 26, 27 Knowledge of the CRC of the cell of origin would grant insights into the mechanisms of NB tumorigenesis. Equally important is to determine whether cells existing at relapse represent the clonal outgrowth of a rare mutationally derived cell state enriched by current therapies or interconversion events of existing subpopulations within the primary tumor (Figure 3). Tools such as recent chimeric antigen receptor (CAR)-T cell therapies directed against antigens derived from PHOX2B will be helpful in this regard, as they are likely to solely and persistently ablate ADRN cells.94 Similarly important are recent findings suggesting that MES cells are more sensitive to immunotherapeutic approaches than are ADRN cells.95 How strategies such as these that apply selective pressure to one subpopulation within the larger tumor affect tumor growth, cellular heterogeneity, chemoresistance, and relapse are crucial.
Further, it is essential to identify whether all CRC TFs are equivalently and specifically required for NB growth or if some are only critical for specific phenotypic conversion events. Evidence indicates that the ADRN CRC members HAND2, ISL1, GATA3, and TBX2 may be required for survival of both ADRN- and MES-dominant NBs44—does this indicate that loss of these factors unravels a “master” CRC and commits all NB to death? Does this imply that other TFs, such as PRRX1, are uniquely required to mediate and maintain a cell-fate switch without effects on growth? If so, then perhaps a nomenclature identifying a master CRC and “accessory” CRCs responsible for the acquisition of phenotypes other than growth is necessary (Figure 2). How deeply must the regulatory circuitry be perturbed to cause a “collapse”? Are some factors within the CRC more dominantly required for survival or alternative behaviors, and if so, is there a potential therapeutic window, given the generation of first-generation tools for degradation of TFs?96 Is the strategy of targeting CRCs by indirect treatment with epigenetically targeted agents (Table 1) selective and effective enough to cause tumor death while limiting toxicity to untransformed cells, especially progenitor and stem cells?
Before addressing these more advanced questions, however, fundamental ones exist. Efforts to date have demonstrated the mechanisms by which ADRN subpopulations of NB can be induced to switch to an MES fate. Given that MES cell states are relatively chemotherapy resistant, the opposite—switching from MES to ADRN states—may be a separate approach. To clarify this, analytic prediction of regulatory circuitries may predict drivers of such an interconversion, which may be experimentally validated. These cell-fate switches are clearly of critical importance to the disease, as evidenced by enrichment of the MES state at relapse,16 and must be understood to be harnessed. After determining genetic drivers of interconversion, identifying minimally toxic compounds that can force interconversion between MES and ADRN cell states and thereby engender sensitivity to chemotherapies, targeted therapies, or immunotherapies would be a critical step forward to help to realize more effective treatments in the relapsed setting. Given the difficulty in drugging the types of sequence-specific TFs known to drive differential CRCs, an alternative strategy might be to reprogram SE landscapes, thereby affecting the transcriptional state, to convert high-risk NB to an involuting, type-4S NB. Much is left to be done, but in the setting of exciting advances in tools, insights, and new mechanisms to describe tumor development, we anticipate significant advances in NB biology and medicine in the coming years.
Acknowledgments
We apologize to authors of studies that were not acknowledged in this manuscript due to space concerns. We thank Drs. Anand Patel and Michael Dyer of St. Jude Children’s Research Hospital for helpful discussions related to this work. This work was supported by National Institutes of Health (NIH) grants K08-CA24525 to A.D.D and P30-CA021765 to the St. Jude Children’s Research Hospital Comprehensive Cancer Center. We gratefully acknowledge support from the Rally Foundation for Childhood Cancer Research, the CureSearch for Children’s Cancer Foundation, and the Alex’s Lemonade Stand Foundation for Childhood Cancer. A.D.D., B.J.A., and N.A.M.S. are supported by the American Lebanese Syrian Associated Charities (ALSAC). M.W.Z. was supported by the Claudia Adams Barr Foundation. B.J.A., A.D.D., and N.A.M.S. are supported by the St. Jude Children's Research Hospital Collaborative Research Consortium on Cohesin, CTCF, and the 3D Regulatory Nuclear Landscape of Pediatric Cancer Cells. B.J.A. is a shareholder in Syros Pharmaceuticals. Figures were created using biorender.com.
References
- 1.Bradner J.E., Hnisz D., Young R.A. Transcriptional addiction in cancer. Cell. 2017;168:629–643. doi: 10.1016/j.cell.2016.12.013. [DOI] [PMC free article] [PubMed] [Google Scholar]
- 2.Zeid R., Lawlor M.A., Poon E., Reyes J.M., Fulciniti M., Lopez M.A., Scott T.G., Nabet B., Erb M.A., Winter G.E., et al. Enhancer invasion shapes MYCN-dependent transcriptional amplification in neuroblastoma. Nat. Genet. 2018;50:515–523. doi: 10.1038/s41588-018-0044-9. [DOI] [PMC free article] [PubMed] [Google Scholar]
- 3.Lin C.Y., Lovén J., Rahl P.B., Paranal R.M., Burge C.B., Bradner J.E., Lee T.I., Young R.A. Transcriptional amplification in tumor cells with elevated c-Myc. Cell. 2012;151:56–67. doi: 10.1016/j.cell.2012.08.026. [DOI] [PMC free article] [PubMed] [Google Scholar]
- 4.Nie Z., Hu G., Wei G., Cui K., Yamane A., Resch W., Wang R., Green D.R., Tessarollo L., Casellas R., et al. c-Myc is a universal amplifier of expressed genes in lymphocytes and embryonic stem cells. Cell. 2012;151:68–79. doi: 10.1016/j.cell.2012.08.033. [DOI] [PMC free article] [PubMed] [Google Scholar]
- 5.Turati V.A., Guerra-Assunção J.A., Potter N.E., Gupta R., Ecker S., Daneviciute A., Tarabichi M., Webster A.P., Ding C., May G., et al. Chemotherapy induces canalization of cell state in childhood B-cell precursor acute lymphoblastic leukemia. Nat. Cancer. 2021;2:835–852. doi: 10.1038/s43018-021-00219-3. [DOI] [PMC free article] [PubMed] [Google Scholar]
- 6.Aissa A.F., Islam A.B.M.M.K., Ariss M.M., Go C.C., Rader A.E., Conrardy R.D., Gajda A.M., Rubio-Perez C., Valyi-Nagy K., Pasquinelli M., et al. Single-cell transcriptional changes associated with drug tolerance and response to combination therapies in cancer. Nat. Commun. 2021;12:1628. doi: 10.1038/s41467-021-21884-z. [DOI] [PMC free article] [PubMed] [Google Scholar]
- 7.Meir Z., Mukamel Z., Chomsky E., Lifshitz A., Tanay A. Single-cell analysis of clonal maintenance of transcriptional and epigenetic states in cancer cells. Nat. Genet. 2020;52:709–718. doi: 10.1038/s41588-020-0645-y. [DOI] [PMC free article] [PubMed] [Google Scholar]
- 8.Yeo S.K., Zhu X., Okamoto T., Hao M., Wang C., Lu P., Lu L.J., Guan J.L. Single-cell RNA-sequencing reveals distinct patterns of cell state heterogeneity in mouse models of breast cancer. Elife. 2020;9:58810. doi: 10.7554/eLife.58810. [DOI] [PMC free article] [PubMed] [Google Scholar]
- 9.Nguyen A., Yoshida M., Goodarzi H., Tavazoie S.F. Highly variable cancer subpopulations that exhibit enhanced transcriptome variability and metastatic fitness. Nat. Commun. 2016;7:11246. doi: 10.1038/ncomms11246. [DOI] [PMC free article] [PubMed] [Google Scholar]
- 10.Raghavan S., Winter P.S., Navia A.W., Williams H.L., DenAdel A., Lowder K.E., Galvez-Reyes J., Kalekar R.L., Mulugeta N., Kapner K.S., et al. Microenvironment drives cell state, plasticity, and drug response in pancreatic cancer. Cell. 2021;184:6119–6137.e26. doi: 10.1016/j.cell.2021.11.017. [DOI] [PMC free article] [PubMed] [Google Scholar]
- 11.Wouters J., Kalender-Atak Z., Minnoye L., Spanier K.I., De Waegeneer M., Bravo Gonzalez-Blas C., Mauduit D., Davie K., Hulselmans G., Najem A., et al. Robust gene expression programs underlie recurrent cell states and phenotype switching in melanoma. Nat. Cell Biol. 2020;22:986–998. doi: 10.1038/s41556-020-0547-3. [DOI] [PubMed] [Google Scholar]
- 12.Nikbakht H., Panditharatna E., Mikael L.G., Li R., Gayden T., Osmond M., Ho C.Y., Kambhampati M., Hwang E.I., Faury D., et al. Spatial and temporal homogeneity of driver mutations in diffuse intrinsic pontine glioma. Nat. Commun. 2016;7:11185. doi: 10.1038/ncomms11185. [DOI] [PMC free article] [PubMed] [Google Scholar]
- 13.Morrissy A.S., Cavalli F.M.G., Remke M., Ramaswamy V., Shih D.J.H., Holgado B.L., Farooq H., Donovan L.K., Garzia L., Agnihotri S., et al. Spatial heterogeneity in medulloblastoma. Nat. Genet. 2017;49:780–788. doi: 10.1038/ng.3838. [DOI] [PMC free article] [PubMed] [Google Scholar]
- 14.Boeva V., Louis-Brennetot C., Peltier A., Durand S., Pierre-Eugene C., Raynal V., Etchevers H.C., Thomas S., Lermine A., Daudigeos-Dubus E., et al. Heterogeneity of neuroblastoma cell identity defined by transcriptional circuitries. Nat. Genet. 2017;49:1408–1413. doi: 10.1038/ng.3921. [DOI] [PubMed] [Google Scholar]
- 15.van Groningen T., Koster J., Valentijn L.J., Zwijnenburg D.A., Akogul N., Hasselt N.E., Broekmans M., Haneveld F., Nowakowska N.E., Bras J., et al. Neuroblastoma is composed of two super-enhancer-associated differentiation states. Nat. Genet. 2017;49:1261–1266. doi: 10.1038/ng.3899. [DOI] [PubMed] [Google Scholar]
- 16.Gartlgruber M., Sharma A.K., Quintero A., Dreidax D., Jansky S., Park Y.G., Kreth S., Meder J., Doncevic D., Saary P., et al. Super enhancers define regulatory subtypes and cell identity in neuroblastoma. Nat. Cancer. 2021;2:114–128. doi: 10.1038/s43018-020-00145-w. [DOI] [PubMed] [Google Scholar]
- 17.Matthay K.K., Maris J.M., Schleiermacher G., Nakagawara A., Mackall C.L., Diller L., Weiss W.A. Neuroblastoma. Nat. Rev. Dis. Primers. 2016;2:16078. doi: 10.1038/nrdp.2016.78. [DOI] [PubMed] [Google Scholar]
- 18.Pugh T.J., Morozova O., Attiyeh E.F., Asgharzadeh S., Wei J.S., Auclair D., Carter S.L., Cibulskis K., Hanna M., Kiezun A., et al. The genetic landscape of high-risk neuroblastoma. Nat. Genet. 2013;45:279–284. doi: 10.1038/ng.2529. [DOI] [PMC free article] [PubMed] [Google Scholar]
- 19.Brodeur G.M., Seeger R.C., Schwab M., Varmus H.E., Bishop J.M. Amplification of N-myc in untreated human neuroblastomas correlates with advanced disease stage. Science. 1984;224:1121–1124. doi: 10.1126/science.6719137. [DOI] [PubMed] [Google Scholar]
- 20.Schmitt-Hoffner F., van Rijn S., Toprak U.H., Mauermann M., Rosemann F., Heit-Mondrzyk A., Hubner J.M., Camgoz A., Hartlieb S., Pfister S.M., et al. FOXR2 stabilizes MYCN protein and identifies non-MYCN-amplified neuroblastoma patients with unfavorable outcome. J. Clin. Oncol. 2021;39:3217–3228. doi: 10.1200/JCO.20.02540. [DOI] [PMC free article] [PubMed] [Google Scholar]
- 21.Zimmerman M.W., Liu Y., He S., Durbin A.D., Abraham B.J., Easton J., Shao Y., Xu B., Zhu S., Zhang X., et al. MYC drives a subset of high-risk pediatric neuroblastomas and is activated through mechanisms including enhancer hijacking and focal enhancer amplification. Cancer Discov. 2018;8:320–335. doi: 10.1158/2159-8290.CD-17-0993. [DOI] [PMC free article] [PubMed] [Google Scholar]
- 22.Grobner S.N., Worst B.C., Weischenfeldt J., Buchhalter I., Kleinheinz K., Rudneva V.A., Johann P.D., Balasubramanian G.P., Segura-Wang M., Brabetz S., et al. ICGC MMML-Seq Project The landscape of genomic alterations across childhood cancers. Nature. 2018;555:321–327. doi: 10.1038/nature25480. [DOI] [PubMed] [Google Scholar]
- 23.Ma X., Liu Y., Liu Y., Alexandrov L.B., Edmonson M.N., Gawad C., Zhou X., Li Y., Rusch M.C., Easton J., et al. Pan-cancer genome and transcriptome analyses of 1,699 paediatric leukaemias and solid tumours. Nature. 2018;555:371–376. doi: 10.1038/nature25795. [DOI] [PMC free article] [PubMed] [Google Scholar]
- 24.van Groningen T., Akogul N., Westerhout E.M., Chan A., Hasselt N.E., Zwijnenburg D.A., Broekmans M., Stroeken P., Haneveld F., Hooijer G.K.J., et al. A NOTCH feed-forward loop drives reprogramming from adrenergic to mesenchymal state in neuroblastoma. Nat. Commun. 2019;10:1530. doi: 10.1038/s41467-019-09470-w. [DOI] [PMC free article] [PubMed] [Google Scholar]
- 25.Jansky S., Sharma A.K., Korber V., Quintero A., Toprak U.H., Wecht E.M., Gartlgruber M., Greco A., Chomsky E., Grunewald T.G.P., et al. Single-cell transcriptomic analyses provide insights into the developmental origins of neuroblastoma. Nat. Genet. 2021;53:683–693. doi: 10.1038/s41588-021-00806-1. [DOI] [PubMed] [Google Scholar]
- 26.Dong R., Yang R., Zhan Y., Lai H.D., Ye C.J., Yao X.Y., Luo W.Q., Cheng X.M., Miao J.J., Wang J.F., et al. Single-cell characterization of malignant phenotypes and developmental trajectories of adrenal neuroblastoma. Cancer Cell. 2020;38:716–733.e6. doi: 10.1016/j.ccell.2020.08.014. [DOI] [PubMed] [Google Scholar]
- 27.Kildisiute G., Kholosy W.M., Young M.D., Roberts K., Elmentaite R., van Hooff S.R., Pacyna C.N., Khabirova E., Piapi A., Thevanesan C., et al. Tumor to normal single-cell mRNA comparisons reveal a pan-neuroblastoma cancer cell. Sci. Adv. 2021;7:abd3311. doi: 10.1126/sciadv.abd3311. [DOI] [PMC free article] [PubMed] [Google Scholar]
- 28.Takahashi K., Yamanaka S. Induction of pluripotent stem cells from mouse embryonic and adult fibroblast cultures by defined factors. Cell. 2006;126:663–676. doi: 10.1016/j.cell.2006.07.024. [DOI] [PubMed] [Google Scholar]
- 29.Boyer L.A., Lee T.I., Cole M.F., Johnstone S.E., Levine S.S., Zucker J.P., Guenther M.G., Kumar R.M., Murray H.L., Jenner R.G., et al. Core transcriptional regulatory circuitry in human embryonic stem cells. Cell. 2005;122:947–956. doi: 10.1016/j.cell.2005.08.020. [DOI] [PMC free article] [PubMed] [Google Scholar]
- 30.Saint-André V., Federation A.J., Lin C.Y., Abraham B.J., Reddy J., Lee T.I., Bradner J.E., Young R.A. Models of human core transcriptional regulatory circuitries. Genome Res. 2016;26:385–396. doi: 10.1101/gr.197590.115. [DOI] [PMC free article] [PubMed] [Google Scholar]
- 31.Sanda T., Lawton L.N., Barrasa M.I., Fan Z.P., Kohlhammer H., Gutierrez A., Ma W., Tatarek J., Ahn Y., Kelliher M.A., et al. Core transcriptional regulatory circuit controlled by the TAL1 complex in human T cell acute lymphoblastic leukemia. Cancer Cell. 2012;22:209–221. doi: 10.1016/j.ccr.2012.06.007. [DOI] [PMC free article] [PubMed] [Google Scholar]
- 32.Alon U. Network motifs: theory and experimental approaches. Nat. Rev. Genet. 2007;8:450–461. doi: 10.1038/nrg2102. [DOI] [PubMed] [Google Scholar]
- 33.Maeda Y.T., Sano M. Regulatory dynamics of synthetic gene networks with positive feedback. J. Mol. Biol. 2006;359:1107–1124. doi: 10.1016/j.jmb.2006.03.064. [DOI] [PubMed] [Google Scholar]
- 34.Schrode N., Saiz N., Di Talia S., Hadjantonakis A.K. GATA6 levels modulate primitive endoderm cell fate choice and timing in the mouse blastocyst. Dev. Cell. 2014;29:454–467. doi: 10.1016/j.devcel.2014.04.011. [DOI] [PMC free article] [PubMed] [Google Scholar]
- 35.Chazaud C., Yamanaka Y., Pawson T., Rossant J. Early lineage segregation between epiblast and primitive endoderm in mouse blastocysts through the Grb2-MAPK pathway. Dev. Cell. 2006;10:615–624. doi: 10.1016/j.devcel.2006.02.020. [DOI] [PubMed] [Google Scholar]
- 36.Suzuki H.I., Young R.A., Sharp P.A. Super-enhancer-mediated RNA processing revealed by integrative MicroRNA network analysis. Cell. 2017;168:1000–1014.e15. doi: 10.1016/j.cell.2017.02.015. [DOI] [PMC free article] [PubMed] [Google Scholar]
- 37.Sabari B.R., Dall'Agnese A., Boija A., Klein I.A., Coffey E.L., Shrinivas K., Abraham B.J., Hannett N.M., Zamudio A.V., Manteiga J.C., et al. Coactivator condensation at super-enhancers links phase separation and gene control. Science. 2018;361:aar3958. doi: 10.1126/science.aar3958. [DOI] [PMC free article] [PubMed] [Google Scholar]
- 38.Hnisz D., Shrinivas K., Young R.A., Chakraborty A.K., Sharp P.A. A phase separation model for transcriptional control. Cell. 2017;169:13–23. doi: 10.1016/j.cell.2017.02.007. [DOI] [PMC free article] [PubMed] [Google Scholar]
- 39.Parker S.C.J., Stitzel M.L., Taylor D.L., Orozco J.M., Erdos M.R., Akiyama J.A., van Bueren K.L., Chines P.S., Narisu N., Black B.L., et al. NISC Comparative Sequencing Program. National Institutes of Health Intramural Sequencing Center Comparative Sequencing Program Authors. NISC Comparative Sequencing Program Authors Chromatin stretch enhancer states drive cell-specific gene regulation and harbor human disease risk variants. Proc. Natl. Acad. Sci. U S A. 2013;110:17921–17926. doi: 10.1073/pnas.1317023110. [DOI] [PMC free article] [PubMed] [Google Scholar]
- 40.Hnisz D., Abraham B.J., Lee T.I., Lau A., Saint-André V., Sigova A.A., Hoke H.A., Young R.A. Super-enhancers in the control of cell identity and disease. Cell. 2013;155:934–947. doi: 10.1016/j.cell.2013.09.053. [DOI] [PMC free article] [PubMed] [Google Scholar]
- 41.Whyte W.A., Orlando D.A., Hnisz D., Abraham B.J., Lin C.Y., Kagey M.H., Rahl P.B., Lee T.I., Young R.A. Master transcription factors and mediator establish super-enhancers at key cell identity genes. Cell. 2013;153:307–319. doi: 10.1016/j.cell.2013.03.035. [DOI] [PMC free article] [PubMed] [Google Scholar]
- 42.Creyghton M.P., Cheng A.W., Welstead G.G., Kooistra T., Carey B.W., Steine E.J., Hanna J., Lodato M.A., Frampton G.M., Sharp P.A., et al. Histone H3K27ac separates active from poised enhancers and predicts developmental state. Proc. Natl. Acad. Sci. U S A. 2010;107:21931–21936. doi: 10.1073/pnas.1016071107. [DOI] [PMC free article] [PubMed] [Google Scholar]
- 43.Hnisz D., Schuijers J., Lin C.Y., Weintraub A.S., Abraham B.J., Lee T.I., Bradner J.E., Young R.A. Convergence of developmental and oncogenic signaling pathways at transcriptional super-enhancers. Mol. Cell. 2015;58:362–370. doi: 10.1016/j.molcel.2015.02.014. [DOI] [PMC free article] [PubMed] [Google Scholar]
- 44.Durbin A.D., Zimmerman M.W., Dharia N.V., Abraham B.J., Iniguez A.B., Weichert-Leahey N., He S., Krill-Burger J.M., Root D.E., Vazquez F., et al. Selective gene dependencies in MYCN-amplified neuroblastoma include the core transcriptional regulatory circuitry. Nat. Genet. 2018;50:1240–1246. doi: 10.1038/s41588-018-0191-z. [DOI] [PMC free article] [PubMed] [Google Scholar]
- 45.Oldridge D.A., Wood A.C., Weichert-Leahey N., Crimmins I., Sussman R., Winter C., McDaniel L.D., Diamond M., Hart L.S., Zhu S., et al. Genetic predisposition to neuroblastoma mediated by a LMO1 super-enhancer polymorphism. Nature. 2015;528:418–421. doi: 10.1038/nature15540. [DOI] [PMC free article] [PubMed] [Google Scholar]
- 46.Mansour M.R., Abraham B.J., Anders L., Berezovskaya A., Gutierrez A., Durbin A.D., Etchin J., Lawton L., Sallan S.E., Silverman L.B., et al. An oncogenic super-enhancer formed through somatic mutation of a noncoding intergenic element. Science. 2014;346:1373–1377. doi: 10.1126/science.1259037. [DOI] [PMC free article] [PubMed] [Google Scholar]
- 47.Chapuy B., McKeown M.R., Lin C.Y., Monti S., Roemer M.G., Qi J., Rahl P.B., Sun H.H., Yeda K.T., Doench J.G., et al. Discovery and characterization of super-enhancer-associated dependencies in diffuse large B cell lymphoma. Cancer Cell. 2013;24:777–790. doi: 10.1016/j.ccr.2013.11.003. [DOI] [PMC free article] [PubMed] [Google Scholar]
- 48.Abraham B.J., Hnisz D., Weintraub A.S., Kwiatkowski N., Li C.H., Li Z., Weichert-Leahey N., Rahman S., Liu Y., Etchin J., et al. Small genomic insertions form enhancers that misregulate oncogenes. Nat. Commun. 2017;8:14385. doi: 10.1038/ncomms14385. [DOI] [PMC free article] [PubMed] [Google Scholar]
- 49.Chen Y., Xu L., Lin R.Y.T., Muschen M., Koeffler H.P. Core transcriptional regulatory circuitries in cancer. Oncogene. 2020;39:6633–6646. doi: 10.1038/s41388-020-01459-w. [DOI] [PMC free article] [PubMed] [Google Scholar]
- 50.Nocedal I., Mancera E., Johnson A.D. Gene regulatory network plasticity predates a switch in function of a conserved transcription regulator. Elife. 2017;6:23250. doi: 10.7554/eLife.23250. [DOI] [PMC free article] [PubMed] [Google Scholar]
- 51.Nobile C.J., Fox E.P., Nett J.E., Sorrells T.R., Mitrovich Q.M., Hernday A.D., Tuch B.B., Andes D.R., Johnson A.D. A recently evolved transcriptional network controls biofilm development in Candida albicans. Cell. 2012;148:126–138. doi: 10.1016/j.cell.2011.10.048. [DOI] [PMC free article] [PubMed] [Google Scholar]
- 52.Ott C.J., Federation A.J., Schwartz L.S., Kasar S., Klitgaard J.L., Lenci R., Li Q., Lawlor M., Fernandes S.M., Souza A., et al. Enhancer architecture and essential core regulatory circuitry of chronic lymphocytic leukemia. Cancer Cell. 2018;34:982–995.e7. doi: 10.1016/j.ccell.2018.11.001. [DOI] [PMC free article] [PubMed] [Google Scholar]
- 53.Chen Y., Xu L., Mayakonda A., Huang M.L., Kanojia D., Tan T.Z., Dakle P., Lin R.Y.T., Ke X.Y., Said J.W., et al. Bromodomain and extraterminal proteins foster the core transcriptional regulatory programs and confer vulnerability in liposarcoma. Nat. Commun. 2019;10:1353. doi: 10.1038/s41467-019-09257-z. [DOI] [PMC free article] [PubMed] [Google Scholar]
- 54.Chen L., Huang M., Plummer J., Pan J., Jiang Y.Y., Yang Q., Silva T.C., Gull N., Chen S., Ding L.W., et al. Master transcription factors form interconnected circuitry and orchestrate transcriptional networks in oesophageal adenocarcinoma. Gut. 2020;69:630–640. doi: 10.1136/gutjnl-2019-318325. [DOI] [PMC free article] [PubMed] [Google Scholar]
- 55.Jiang Y.Y., Jiang Y., Li C.Q., Zhang Y., Dakle P., Kaur H., Deng J.W., Yan Y., Doan N., Zheng Y., et al. TP63, SOX2, and KLF5 establish a core regulatory circuitry that controls epigenetic and transcription patterns in esophageal squamous cell carcinoma cell lines. Gastroenterology. 2020;159:1311–1327.e19. doi: 10.1053/j.gastro.2020.06.050. [DOI] [PubMed] [Google Scholar]
- 56.Gryder B.E., Yohe M.E., Chou H.C., Zhang X., Marques J., Wachtel M., Schaefer B., Sen N., Song Y., Gualtieri A., et al. PAX3-FOXO1 establishes myogenic super enhancers and confers BET bromodomain vulnerability. Cancer Discov. 2017;7:884–899. doi: 10.1158/2159-8290.CD-16-1297. [DOI] [PMC free article] [PubMed] [Google Scholar]
- 57.Stewart E., McEvoy J., Wang H., Chen X., Honnell V., Ocarz M., Gordon B., Dapper J., Blankenship K., Yang Y., et al. Identification of therapeutic targets in rhabdomyosarcoma through integrated genomic, epigenomic, and proteomic analyses. Cancer Cell. 2018;34:411–426.e19. doi: 10.1016/j.ccell.2018.07.012. [DOI] [PMC free article] [PubMed] [Google Scholar]
- 58.Dharia N.V., Kugener G., Guenther L.M., Malone C.F., Durbin A.D., Hong A.L., Howard T.P., Bandopadhayay P., Wechsler C.S., Fung I., et al. A first-generation pediatric cancer dependency map. Nat. Genet. 2021;53:529–538. doi: 10.1038/s41588-021-00819-w. [DOI] [PMC free article] [PubMed] [Google Scholar]
- 59.Kroger C., Afeyan A., Mraz J., Eaton E.N., Reinhardt F., Khodor Y.L., Thiru P., Bierie B., Ye X., Burge C.B., Weinberg R.A. Acquisition of a hybrid E/M state is essential for tumorigenicity of basal breast cancer cells. Proc. Natl. Acad. Sci. U S A. 2019;116:7353–7362. doi: 10.1073/pnas.1812876116. [DOI] [PMC free article] [PubMed] [Google Scholar]
- 60.Ince T.A., Richardson A.L., Bell G.W., Saitoh M., Godar S., Karnoub A.E., Iglehart J.D., Weinberg R.A. Transformation of different human breast epithelial cell types leads to distinct tumor phenotypes. Cancer Cell. 2007;12:160–170. doi: 10.1016/j.ccr.2007.06.013. [DOI] [PubMed] [Google Scholar]
- 61.Warren A., Chen Y., Jones A., Shibue T., Hahn W.C., Boehm J.S., Vazquez F., Tsherniak A., McFarland J.M. Global computational alignment of tumor and cell line transcriptional profiles. Nat. Commun. 2021;12:22. doi: 10.1038/s41467-020-20294-x. [DOI] [PMC free article] [PubMed] [Google Scholar]
- 62.Lecca M.C., Jonker M.A., Abdul U.K., Kucukosmanoglu A., van Wieringen W., Westerman B.A. Adrenergic to mesenchymal fate switching of neuroblastoma occurs spontaneously in vivo resulting in different tumorigenic potential. J. Mol. Clin. Med. 2018;1:219–226. [Google Scholar]
- 63.Wang L., Tan T.K., Durbin A.D., Zimmerman M.W., Abraham B.J., Tan S.H., Ngoc P.C.T., Weichert-Leahey N., Akahane K., Lawton L.N., et al. ASCL1 is a MYCN- and LMO1-dependent member of the adrenergic neuroblastoma core regulatory circuitry. Nat. Commun. 2019;10:5622. doi: 10.1038/s41467-019-13515-5. [DOI] [PMC free article] [PubMed] [Google Scholar]
- 64.Durbin A.D., Wang T., Wimasalena V., Zimmerman M.W., Li D., Dharia N.V., Mariani L., Shendy N.A.M., Nance S., Patel A., et al. EP300 controls the oncogenic enhancer landscape of high-risk neuroblastoma. Cancer Discov. 2021;12:730–751. doi: 10.1158/2159-8290.CD-21-0385. [DOI] [PMC free article] [PubMed] [Google Scholar]
- 65.Smith K.M., Datti A., Fujitani M., Grinshtein N., Zhang L., Morozova O., Blakely K.M., Rotenberg S.A., Hansford L.M., Miller F.D., et al. Selective targeting of neuroblastoma tumour-initiating cells by compounds identified in stem cell-based small molecule screens. EMBO Mol. Med. 2010;2:371–384. doi: 10.1002/emmm.201000093. [DOI] [PMC free article] [PubMed] [Google Scholar]
- 66.Hansford L.M., McKee A.E., Zhang L., George R.E., Gerstle J.T., Thorner P.S., Smith K.M., Look A.T., Yeger H., Miller F.D., et al. Neuroblastoma cells isolated from bone marrow metastases contain a naturally enriched tumor-initiating cell. Cancer Res. 2007;67:11234–11243. doi: 10.1158/0008-5472.CAN-07-0718. [DOI] [PubMed] [Google Scholar]
- 67.Trochet D., Bourdeaut F., Janoueix-Lerosey I., Deville A., de Pontual L., Schleiermacher G., Coze C., Philip N., Frebourg T., Munnich A., et al. Germline mutations of the paired-like homeobox 2B (PHOX2B) gene in neuroblastoma. Am. J. Hum. Genet. 2004;74:761–764. doi: 10.1086/383253. [DOI] [PMC free article] [PubMed] [Google Scholar]
- 68.Garcia-Lopez J., Wallace K., Otero J.H., Olsen R., Wang Y.D., Finkelstein D., Gudenas B.L., Rehg J.E., Northcott P., Davidoff A.M., Freeman K.W. Large 1p36 deletions affecting Arid1a locus facilitate mycn-driven oncogenesis in neuroblastoma. Cell Rep. 2020;30:454–464.e5. doi: 10.1016/j.celrep.2019.12.048. [DOI] [PMC free article] [PubMed] [Google Scholar]
- 69.Groß A., Schulz C., Kolb J., Koster J., Wehner S., Czaplinski S., Khilan A., Rohrer H., Harter P.N., Klingebiel T., et al. Tumorigenic and antiproliferative properties of the TALE-transcription factors MEIS2D and MEIS2A in neuroblastoma. Cancer Res. 2018;78:1935–1947. doi: 10.1158/0008-5472.CAN-17-1860. [DOI] [PubMed] [Google Scholar]
- 70.De Wyn J., Zimmerman M.W., Weichert-Leahey N., Nunes C., Cheung B.B., Abraham B.J., Beckers A., Volders P.J., Decaesteker B., Carter D.R., et al. MEIS2 is an adrenergic core regulatory transcription factor involved in early initiation of TH-MYCN-driven neuroblastoma formation. Cancers (Basel) 2021;13:4783. doi: 10.3390/cancers13194783. [DOI] [PMC free article] [PubMed] [Google Scholar]
- 71.Weese-Mayer D.E., Marazita M.L., Rand C.M., Berry-Kravis E.M. In: GeneReviews. Adam M.P., Ardinger H.H., Pagon R.A., Wallace S.E., Bean L.J.H., Stephens K., Amemiya A., editors. University of Washington, Seattle; Seattle (WA): 1993. Congenital Central Hypoventilation Syndrome. [Google Scholar]
- 72.Thirant C., Peltier A., Durand S., Kramdi A., Louis-Brennetot C., Pierre-Eugène C., Costa A., Grelier A., Zaïdi S., Gruel N., et al. Interplay between intrinsic reprogramming potential and microenvironment controls neuroblastoma cell plasticity and identity. bioRxiv. 2021 doi: 10.1101/2021.01.07.425710. Preprint at. [DOI] [Google Scholar]
- 73.Shi H., Tao T., Abraham B.J., Durbin A.D., Zimmerman M.W., Kadoch C., Look A.T. ARID1A loss in neuroblastoma promotes the adrenergic-to-mesenchymal transition by regulating enhancer-mediated gene expression. Sci. Adv. 2020;6:1–12. doi: 10.1126/sciadv.aaz3440. [DOI] [PMC free article] [PubMed] [Google Scholar]
- 74.Delmore J.E., Issa G.C., Lemieux M.E., Rahl P.B., Shi J., Jacobs H.M., Kastritis E., Gilpatrick T., Paranal R.M., Qi J., et al. BET bromodomain inhibition as a therapeutic strategy to target c-Myc. Cell. 2011;146:904–917. doi: 10.1016/j.cell.2011.08.017. [DOI] [PMC free article] [PubMed] [Google Scholar]
- 75.Wimalasena V.K., Wang T., Sigua L.H., Durbin A.D., Qi J. Using chemical epigenetics to target cancer. Mol. Cell. 2020;78:1086–1095. doi: 10.1016/j.molcel.2020.04.023. [DOI] [PMC free article] [PubMed] [Google Scholar]
- 76.Puissant A., Frumm S.M., Alexe G., Bassil C.F., Qi J., Chanthery Y.H., Nekritz E.A., Zeid R., Gustafson W.C., Greninger P., et al. Targeting MYCN in neuroblastoma by BET bromodomain inhibition. Cancer Discov. 2013;3:308–323. doi: 10.1158/2159-8290.cd-12-0418. [DOI] [PMC free article] [PubMed] [Google Scholar]
- 77.Chipumuro E., Marco E., Christensen C.L., Kwiatkowski N., Zhang T., Hatheway C.M., Abraham B.J., Sharma B., Yeung C., Altabef A., et al. CDK7 inhibition suppresses super-enhancer-linked oncogenic transcription in MYCN-driven cancer. Cell. 2014;159:1126–1139. doi: 10.1016/j.cell.2014.10.024. [DOI] [PMC free article] [PubMed] [Google Scholar]
- 78.Poon E., Liang T., Jamin Y., Walz S., Kwok C., Hakkert A., Barker K., Urban Z., Thway K., Zeid R., et al. Orally bioavailable CDK9/2 inhibitor shows mechanism-based therapeutic potential in MYCN-driven neuroblastoma. J. Clin. Invest. 2020;130:5875–5892. doi: 10.1172/JCI134132. [DOI] [PMC free article] [PubMed] [Google Scholar]
- 79.Naftali O., Maman S., Meshel T., Sagi-Assif O., Ginat R., Witz I.P. PHOX2B is a suppressor of neuroblastoma metastasis. Oncotarget. 2016;7:10627–10637. doi: 10.18632/oncotarget.7056. [DOI] [PMC free article] [PubMed] [Google Scholar]
- 80.Chen L., Alexe G., Dharia N.V., Ross L., Iniguez A.B., Conway A.S., Wang E.J., Veschi V., Lam N., Qi J., Gustafson W.C., Nasholm N., Vazquez F., Weir B.A., Cowley G.S., Ali L.D., Pantel S., Jiang G., Harrington W.F., Lee Y., Goodale A., Lubonja R., Krill-Burger J.M., Meyers R.M., Tsherniak A., Root D.E., Bradner J.E., Golub T.R., Roberts C.W., Hahn W.C., Weiss W.A., Thiele C.J., Stegmaier K. CRISPR-Cas9 screen reveals a MYCN-amplified neuroblastoma dependency on EZH2. J. Clin. Invest. 2017;128:446–462. doi: 10.1172/jci90793. [DOI] [PMC free article] [PubMed] [Google Scholar]
- 81.Frumm S.M., Fan Z.P., Ross K.N., Duvall J.R., Gupta S., VerPlank L., Suh B.C., Holson E., Wagner F.F., Smith W.B., et al. Selective HDAC1/HDAC2 inhibitors induce neuroblastoma differentiation. Chem. Biol. 2013;20:713–725. doi: 10.1016/j.chembiol.2013.03.020. [DOI] [PMC free article] [PubMed] [Google Scholar]
- 82.Lee S., Rellinger E.J., Kim K.W., Craig B.T., Romain C.V., Qiao J., Chung D.H. Bromodomain and extraterminal inhibition blocks tumor progression and promotes differentiation in neuroblastoma. Surgery. 2015;158:819–826. doi: 10.1016/j.surg.2015.04.017. [DOI] [PMC free article] [PubMed] [Google Scholar]
- 83.Henssen A., Althoff K., Odersky A., Beckers A., Koche R., Speleman F., Schafers S., Bell E., Nortmeyer M., Westermann F., et al. Targeting MYCN-driven transcription by BET-bromodomain inhibition. Clin. Cancer Res. 2016;22:2470–2481. doi: 10.1158/1078-0432.CCR-15-1449. [DOI] [PubMed] [Google Scholar]
- 84.Wong M., Sun Y., Xi Z., Milazzo G., Poulos R.C., Bartenhagen C., Bell J.L., Mayoh C., Ho N., Tee A.E., et al. JMJD6 is a tumorigenic factor and therapeutic target in neuroblastoma. Nat. Commun. 2019;10:3319. doi: 10.1038/s41467-019-11132-w. [DOI] [PMC free article] [PubMed] [Google Scholar]
- 85.Di Lascio S., Saba E., Belperio D., Raimondi A., Lucchetti H., Fornasari D., Benfante R. PHOX2A and PHOX2B are differentially regulated during retinoic acid-driven differentiation of SK-N-BE(2)C neuroblastoma cell line. Exp. Cell Res. 2016;342:62–71. doi: 10.1016/j.yexcr.2016.02.014. [DOI] [PMC free article] [PubMed] [Google Scholar]
- 86.Zimmerman M.W., Durbin A.D., He S., Oppel F., Shi H., Tao T., Li Z., Berezovskaya A., Liu Y., Zhang J., et al. Retinoic acid rewires the adrenergic core regulatory circuitry of childhood neuroblastoma. Sci. Adv. 2021;7:eabe0834. doi: 10.1126/sciadv.abe0834. [DOI] [PMC free article] [PubMed] [Google Scholar]
- 87.Banerjee D., Gryder B., Bagchi S., Liu Z., Chen H.C., Xu M., Sun M., Vaksman Z., Diskin S.J., Khan J., Thiele C.J. Lineage specific transcription factor waves reprogram neuroblastoma from self-renewal to differentiation. bioRxiv. 2020 doi: 10.1101/2020.07.23.218503. Preprint at. 07.23.218503. [DOI] [PMC free article] [PubMed] [Google Scholar]
- 88.Debruyne D.N., Dries R., Sengupta S., Seruggia D., Gao Y., Sharma B., Huang H., Moreau L., McLane M., Day D.S., et al. BORIS promotes chromatin regulatory interactions in treatment-resistant cancer cells. Nature. 2019;572:676–680. doi: 10.1038/s41586-019-1472-0. [DOI] [PMC free article] [PubMed] [Google Scholar]
- 89.Piskareva O., Harvey H., Nolan J., Conlon R., Alcock L., Buckley P., Dowling P., Henry M., O'Sullivan F., Bray I., Stallings R.L. The development of cisplatin resistance in neuroblastoma is accompanied by epithelial to mesenchymal transition in vitro. Cancer Lett. 2015;364:142–155. doi: 10.1016/j.canlet.2015.05.004. [DOI] [PubMed] [Google Scholar]
- 90.Eleveld T.F., Oldridge D.A., Bernard V., Koster J., Daage L.C., Diskin S.J., Schild L., Bentahar N.B., Bellini A., Chicard M., et al. Relapsed neuroblastomas show frequent RAS-MAPK pathway mutations. Nat. Genet. 2015;47:864–871. doi: 10.1038/ng.3333. [DOI] [PMC free article] [PubMed] [Google Scholar]
- 91.Schramm A., Koster J., Assenov Y., Althoff K., Peifer M., Mahlow E., Odersky A., Beisser D., Ernst C., Henssen A.G., et al. Mutational dynamics between primary and relapse neuroblastomas. Nat. Genet. 2015;47:872–877. doi: 10.1038/ng.3349. [DOI] [PubMed] [Google Scholar]
- 92.Padovan-Merhar O.M., Raman P., Ostrovnaya I., Kalletla K., Rubnitz K.R., Sanford E.M., Ali S.M., Miller V.A., Mosse Y.P., Granger M.P., et al. Enrichment of targetable mutations in the relapsed neuroblastoma genome. PLoS Genet. 2016;12:e1006501. doi: 10.1371/journal.pgen.1006501. [DOI] [PMC free article] [PubMed] [Google Scholar]
- 93.Jansen B., Schlagbauer-Wadl H., Eichler H.G., Wolff K., van Elsas A., Schrier P.I., Pehamberger H. Activated N-ras contributes to the chemoresistance of human melanoma in severe combined immunodeficiency (SCID) mice by blocking apoptosis. Cancer Res. 1997;57:362–365. [PubMed] [Google Scholar]
- 94.Yarmarkovich M., Marshall Q.F., Warrington J.M., Premaratne R., Farrel A., Groff D., Li W., di Marco M., Runbeck E., Truong H., et al. Cross-HLA targeting of intracellular oncoproteins with peptide-centric CARs. Nature. 2021;599:477–484. doi: 10.1038/s41586-021-04061-6. [DOI] [PMC free article] [PubMed] [Google Scholar] [Retracted]
- 95.Wolpaw A.J., Grossmann L.D., Dessau J.L., Dong M.M., Aaron B.J., Brafford P.A., Volgina D., Pascual-Pasto G., Rodriguez-Garcia A., Uzun Y., et al. Epigenetic state determines inflammatory sensing in neuroblastoma. Proc. Natl. Acad. Sci. U S A. 2022;119 doi: 10.1073/pnas.2102358119. e2102358119. [DOI] [PMC free article] [PubMed] [Google Scholar]
- 96.Samarasinghe K.T.G., Jaime-Figueroa S., Burgess M., Nalawansha D.A., Dai K., Hu Z., Bebenek A., Holley S.A., Crews C.M. Targeted degradation of transcription factors by TRAFTACs: TRAnscription Factor TArgeting Chimeras. Cell Chem. Biol. 2021;28:648–661.e5. doi: 10.1016/j.chembiol.2021.03.011. [DOI] [PMC free article] [PubMed] [Google Scholar]