Abstract
Endophytic fungi are a promising source of bioactive metabolites with a wide range of pharmacological activities. In the present study, MS-based metabolomics was conducted to study the metabolomes variations of endophytic Diaporthe fraxini ED2 grown in different culture media. Total phenolic content (TPC), total flavonoid content (TFC), 2,2-diphenyl-1-picrylhydrazyl (DPPH) radical scavenging, 2,2-azinobis(3-ethylbenzothiazoline-6-sulfonic acid (ABTS), and ferric reducing antioxidant power (FRAP) assays were conducted to assess the antioxidant potential of the fungal extracts. Multivariate data analysis (MVDA) was employed in data analysis and interpretation to elucidate the complex metabolite profile. The supplemented culture medium of D. fraxini fungal extract stimulated the production of metabolites not occurring in the normal culture medium. Antioxidant activity studies revealed the potential of supplemented cultured fungal extract of D. fraxini as a source of antioxidants. The present findings highlight that fungal culture medium supplementation is an effective approach to unravelling the hidden metabolome in plant-associated fungal diversity.
Keywords: antioxidant, Diaporthe fraxini, endophytic, LC-HRMS, metabolomics
1. Introduction
The plant kingdom houses a diverse group of beneficial endophytic species. Endophytes inhabit host plant tissues without causing any apparent disease symptoms to them. This plant–endophyte relationship is mutualistic and important in plant micro-ecosystems. The host provides habitation and nutrients for endophytes to complete their life cycles. Meanwhile, endophytes enhance the host’s ability to tolerate biotic and abiotic stress conditions by producing functional metabolites [1,2]. The literature has reported that each plant accommodates at least one endophyte [3]. Among the endophytes, endophytic fungi have attracted substantial attention as a potential source of biologically active metabolites. They produce metabolites with various biological activities, such as antioxidant, antimicrobial, antiviral, antidiabetic, anticancer, insecticidal, and immunosuppressive. These natural bioactive metabolites are useful for medicinal and pharmaceutical applications [4,5].
Research in endophytic fungi associated with medicinal plants has emerged as an exciting field in discovering novel bioactive metabolites. The literature has shown that medicinal plant–associated endophytic fungi possess structurally diverse chemical entities, such as alkaloids, phenolics, flavonoids, terpenoids, steroids, peptides, and polyketides [6]. In a study conducted by Kusari and colleagues, endophytic fungi– derived metabolites have been reported to possess novel and rare chemical structures. This interesting group of microorganisms is worth extensive investigation in revealing the metabolic interactions of the fungal endophyte with its host to trigger the biosynthesis of bioactive metabolites [7]. Moreover, it has been reported that the chemical profile of medicinal plants could affect the bioactive metabolites derived from fungal endophytes [8]. For instance, Taxol was first isolated as a potent anticancer drug from the bark of the Pacific yew tree (Taxus brevifolia). This natural product was then discovered from the yew-associated fungus Taxomyces andreanae [9].
Orthosiphon stamineus is a perennial herb belonging to the Lamiaceae family. The plant has long been used as a traditional medicine in Southeast Asia for diabetes, hypertension, fever, and jaundice [10]. The literature has reported that O. stamineus possesses a high content of phenolics, particularly rosmarinic acid. The presence of rosmarinic acid as the primary phenolic compound in O. stamineus has contributed to its excellent antioxidant activity [11,12]. Diaporthe fraxini ED2 is an endophytic fungus residing in O. stamineus. It was reported that the fungal culture medium supplemented with rosmarinic acid–rich extract stimulated the production of a potent anti-candidal metabolite, phomopsidione [13]. Thus, changes in the culture media and/or conditions could be utilised as an alternative approach to optimise fungal biosynthetic pathways, leading to the production of novel bioactive metabolites [14].
Metabolomics is an emerging analytical technique used to measure and compare the chemical fingerprints of biological samples at a specific condition. It is an essential component of systems biology that focuses on studying metabolites of various metabolic pathways and/or biochemical reactions [15]. In this aspect, the mass spectrometry (MS)-based metabolomics approach offers a unique opportunity for researchers to separate and analyse a vast number of structurally diverse metabolites with important biological information. Liquid chromatography-high resolution mass spectrometry (LC-HRMS)-based metabolomics is favored due to its high throughput, sensitivity, and selectivity. LC-HRMS can detect samples up to nanomolar (nM) concentrations, making it the preferred option for a large scale biological sample study with comprehensive coverage of metabolites [5,16]. Owing to the generation of multiple metabolomics datasets, a statistical approach such as MVDA is employed to aid the understanding of the data trends through visualisation plots [17]. Thus, the present study focused on the discrimination of the chemical profile of D. fraxini cultivated in different media through the MS-based metabolomics approach and its antioxidant potential.
2. Materials and Methods
2.1. Fungal Strain
The endophytic fungus D. fraxini ED2 was previously isolated from O. stamineus Benth. by Yenn et al., 2017 [13]. It was deposited at Universiti Kuala Lumpur (UniKL), Malaysian Institute of Chemical and Bioengineering Technology (MICET), Melaka, Malaysia. The fungal isolate was cultivated on potato dextrose agar (PDA) and stored at 4 °C prior to use. It was sub-cultured on fresh medium every four weeks to ensure its purity and viability.
2.2. Fermentation and Extraction
D. fraxini was cultured in two different media: yeast extract sucrose broth (DFC) and yeast extract sucrose broth supplemented with 5 mg/L rosmarinic acid (DFS). The inoculum from each culture medium was prepared by introducing two mycelial agar plugs from seven-day-old fungal culture into an Erlenmeyer flask containing 100 mL of medium. The culture was grown at 30 °C in a shaker at 120 rpm. The fermentative broth and fungal biomass were then separated by centrifugation after 20 days of incubation. Then the supernatant was extracted three times with an equal volume of ethyl acetate (1:1). The organic phase was collected and concentrated to dryness using a rotary evaporator under reduced pressure to yield the fungal extract. The concentrated extract was stored in an amber bottle in a freezer at −80 °C and lyophilized in a freeze dryer. The obtained extract was then stored in an amber bottle in a refrigerator at −20 °C until the analysis. Six individual culture media from each medium group were used as biological replicates to prepare the fungal extracts.
2.3. Total Phenolic Content (TPC)
TPC was performed according to the Folin–Ciocalteu method as described by Bobo-Garcia et al. (2015) [18]. In a flat-bottom 96-well microplate, 20 µL of 1 mg/mL extract was mixed with 100 µL of 1:4 diluted Folin–Ciocalteu reagent (R&M Chemicals, Subang, Malaysia) and gently shaken. After 2 min, 75 µL of 100 mg/mL Na2CO3 (Bendosen, Shah Alam, Malaysia) solution was added and the mixture was briefly shaken. After 2 h of incubation at room temperature, the absorbance was measured at 750 nm. The calibration curve was constructed using gallic acid (Sigma-Aldrich, Burlington, MA, USA) at concentrations ranging from 0.2 to 400 µg/mL. TPC was estimated as gallic acid equivalent (GAE) in µg per mg of extract.
2.4. Total Flavonoid Content (TFC)
TFC was measured following Horszwald & Andlauer (2011) with slight modifications [19]. The AlCl3 solution was prepared by mixing 10% (w/v) AlCl3.6H2O (Fisher Scientific, Waltham, MA, USA), 1 M sodium acetate (Sigma-Aldrich, Burlington, MA, USA), and deionised water in a 1:1:28 (v/v/v) ratio. A total of 100 µL of 1 mg/mL extract prepared in 95% ethanol were mixed with 150 µL freshly prepared AlCl3 solution in a 96-well plate and incubated at room temperature for 30 min. The absorbance was then measured at 415 nm against the AlCl3 solution as a blank. The standard curve was generated using quercetin (Sigma-Aldrich, Burlington, MA, USA) at concentrations ranging from 1 to 63 µg/mL in 95% ethanol. The results obtained were expressed as µg quercetin equivalent (QE) per mg of extract.
2.5. DPPH Free-Radical Scavenging Activity Assay
The DPPH radical scavenging activity was measured in a solvent system buffered at pH 6.0 using a 50 mmol/L sodium phosphate buffer (R&M Chemicals, Subang, Malaysia) and ethanol (95%) at a 1:1 (v/v) ratio [20]. In a 96-well microplate, 260 µL of DPPH radical (Alfa Aesar, Haverhill, MA, USA) solution (100 µM) was mixed with 40 µL of extract at various concentrations (1–1000 g/mL). The positive control was 0.06–31 µg/mL ascorbic acid (R&M Chemicals, Subang, Malaysia). After 30 min reaction at room temperature, absorbance was taken at 525 nm against the blank (300 µL of solvent). The percentage of DPPH scavenging activity was calculated using the following formula:
where
abs0 = absorbance of negative control
absextract = absorbance of extract
A plot of % DPPH scavenging activity against concentration was constructed to evaluate the activity–concentration curve. An online tool, QuestGraphTM IC50 Calculator, AAT Bioquest, Sunnyvale, CA, USA (https://www.aatbio.com/tools/ic50-calculator, accessed on 24 April 2022) was used to compute the concentration of extract required to reduce the DPPH radical by 50% (IC50). The ascorbic acid equivalent antioxidant activity (AAEA) [21] was determined using the IC50 value (µg/mL) acquired using the QuestGraphTM IC50 Calculator:
where
IC50 AA = IC50 value of ascorbic acid
IC50 E = IC50 value of extract
2.6. Ferric Reducing Antioxidant Power (FRAP) Assay
FRAP assay was performed according to Santos et al. (2017) [20]. The FRAP reagent was made fresh by mixing 300 mM sodium acetate buffer, pH 3.6 (Sigma-Aldrich, Burlington, MA, USA) into 10 mM 2,4,6-tri(2-pyridyl)-1,3,5-triazine (TPTZ) (Acros Organics, Geel, Belgium) prepared in 40 mM HCl (QRec, Rawang, Malaysia) followed by 20 mM FeCl3.6H2O (Sigma-Aldrich, Burlington, MA, USA) in the ratio of 10:1:1 (v/v/v). In a 96-well microplate, an aliquot of 280 µL FRAP reagent was mixed with 20 µL of 1 mg/mL extract. Absorbance at 593 nm was measured after 30 min of reaction. A standard curve with concentrations ranging 3–200 µg/mL ascorbic acid (R&M Chemicals, Subang, Malaysia) was plotted to evaluate the extract ferric reducing antioxidant power. The results were expressed in µg ascorbic acid equivalent per mg (µg AAE/mg) extract.
2.7. ABTS Cation-Radical Reduction Activity Assay
The ABTS cation-radical reduction activity of the samples was determined using the method described by Seo et al. (2015) [22]. The ABTS powder (Roche Life Science, Indianapolis, IN, USA) was first dissolved in deionised water to produce a 7 mM ABTS solution. The ABTS cation-radical was generated during 16 h reaction period with 2.45 mM potassium persulfate (Sigma-Aldrich, Burlington, MA, USA) in the dark at room temperature. Before the assay, the solution was diluted with deionised water to an absorbance of 0.7 at 734 nm. The ABTS cation-radical solution (100 µL) was then added to a 96-well plate containing the 100 µL of 0.005–5000 µg/mL test sample. Trolox (Acros Organics, Geel, Belgium) was used as a positive control, with a concentration of 0.06–31 µg/mL. After 5 min incubation, the absorbance was immediately measured at 734 nm using a microplate reader. The following equation was used to calculate the extract scavenging activity:
where
abs0 = absorbance of negative control
absextract = absorbance of extract
The activity–concentration curve was evaluated using a plot of percentage ABTS scavenging activity against concentration. The concentration of extract required for 50% reduction in ABTS radical (IC50) was calculated using the QuestGraphTM IC50 Calculator. The Trolox equivalent antioxidant activity (TEAA) was calculated using IC50 value (µg/mL) obtained from the QuestGraphTM IC50 Calculator as follows [21]:
where
IC50 T = IC50 value of Trolox
IC50 E = IC50 value of extract
2.8. Statistical Analysis
The results were expressed as the means ± standard deviation (SD) of six independent experiments (n = 6). The statistical significance of differences between means was established by an unpaired t-test using GraphPad Prism 9. p values < 0.05 were considered to indicate statistical significance.
2.9. LC-HRMS Metabolomic Analysis
Six biological fungal extracts from each DFC and DFS were analysed using an Agilent 1290 Infinity LC system coupled to Agilent 6520 Accurate-Mass Q-TOF mass spectrometer with a dual ESI source. One mg/mL of extract was analysed using an Agilent Zorbax Eclipse column (XDB-C18, Narrow-Bore 2.1 × 150 mm, 3.5 µm) in positive mode. The gradient elution was conducted at the 0.5 mL/min flow rate using purified water (A) and acetonitrile (B) with 0.1% formic acid in each mobile phase. The gradient program started with 5% B and increased gradually to 100% B. The total analysis period for each extract was 25 min. The injection volume was 1 μL, and the column temperature was maintained at 20 °C. HRMS analysis was performed in positive ESI ionisation modes coupled with a spray voltage at 4.0 kV; nitrogen gas was used as the drying gas at 320 °C with a flow rate of 10 L/min, nebuliser pressure: 45 psig, fragmentor voltage: 125 V, and mass range from 100 to 3200 m/z at a resolving power up to 20,000 (1 s acquisition). The obtained raw MS data files were converted to mzML format using ProteoWizard software (Palo Alto, CA, USA) and MS-DIAL version 4.8 for peak discrimination, filtering, and alignment. Dereplication and metabolite identification for the positive ionisation mode dataset were carried out using the METLIN and DNP databases. The level of identification was L2—putatively identified metabolites through library matching [23]. ChemDraw Professional 20.0 (PerkinElmer, Waltham, MA, USA) software was used for chemical structure drawing.
2.10. Multivariate Data Analysis (MVDA)
MetaboAnalyst 5.0 is employed to perform MVDA in the present study. It is a web-based metabolomics data processing platform for statistical, functional, and meta-analyses [24]. A data file (.csv) containing a table with the information of sample name, sample group, peak list, and peak intensity was uploaded onto MetaboAnalyst 5.0 server (https://www.metaboanalyst.ca/, accessed on 24 April 2022). Data were subjected to log transformation and Pareto scaling. Subsequently, univariate analysis was performed followed by multivariate analysis (principal component analysis (PCA), supervised partial least squares-discriminant analysis (PLS-DA), hierarchical clustering, and K-means partitional clustering) [25].
3. Results and Discussion
3.1. Effects of Culture Medium Supplementation on TPC and TFC
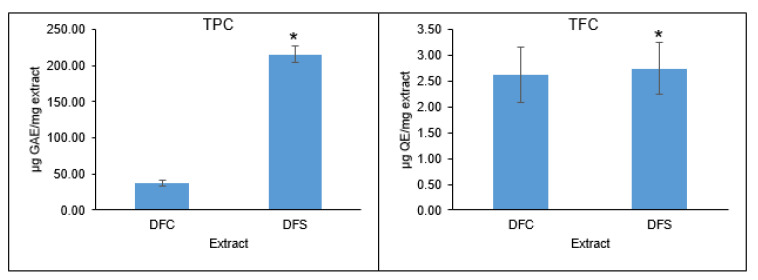
The effects of supplementation in the culture medium of D. fraxini on the TPC and TFC are shown in Figure 1. Overall, DFS exhibited higher TPC (215.63 µg GAE/mg extract) and TFC (2.74 µg QE/mg extract) than DFC (TPC: 36.98 µg GAE/mg extract; TFC: 2.62 µg QE/mg extract). It is known that phenolic and its derivatives are the major contributors to antioxidant activity by exhibiting free radical inhibition in biological systems. They are regarded as good electron donors due to the presence of aromatic hydroxyl groups that play a key role in scavenging free radicals [26]. According to a study conducted by Verma et al. (2022), Diaporthe sp. SAUCC194 extract has been shown to give a TPC of 78.91 µg GAE/mg extract. Thus, different endophytic fungal extracts exhibited different phenolic profiles that could affect their biological activities, particularly antioxidants [27]. According to the literature, flavonoids constituted a small portion of the TPC [28]. The obtained TFC was lower than other fungal extracts from Diaporthe sp. [29]. It was reported that fungal endophytes produced bioactive secondary metabolites to inhibit pathogen attacks and self-survival in their specific niches [7]. Thus, a rosmarinic acid–supplemented culture medium may have stimulated the production of related phenolic metabolites in D. fraxini, contributing to its high TPC.
Figure 1.
Effects of culture medium supplementation on TPC and TFC in DFC and DFS. Values given are means ± SD, with n = 6. * Significantly different from DFC.
3.2. Effects of Culture Medium Supplementation on DPPH and ABTS Radical Scavenging and FRAP Reducing Activities
In assessing the antioxidant potential of DFC and DFS, different antioxidant assays were employed. This is due to the fact that complex chemical interactions may occur within the sample. Thus, several assays are warranted to assess different modes of action of antioxidants within a biological system [30]. DPPH, FRAP, and ABTS assays are widely used to evaluate the antioxidant capacities of samples owing to their fast and reproducible results [31]. Generally, DFS showed higher antioxidant activity than DFC in all the assays (Table 1). DPPH assay measures the reducing or scavenging ability of the sample towards the free radicals using the spectrophotometric method. The colour change occurs when there is a reduction of an oxidant. Additionally, the degree of colour change is positively correlated to the concentration of antioxidants in the sample [32]. Based on the results, DFC and DFS recorded an activity of 9.71 ± 2.64 and 332.20 ± 51.07 μg AAE/mg extract, respectively. Additionally, IC50 values were obtained and compared with the standard, ascorbic acid. IC50 is the amount of sample required for 50% inhibition of a given biological activity. Thus, a lower IC50 value exhibited by the sample indicates higher biological activity [33]. The IC50 for DFC and DFS were 250.66 and 7.11 µg/mL, respectively, as compared to the standard (IC50: 2.31 µg/mL). In a study conducted by Rai et al. (2022), extracts from Diaporthe tulliensis and Diaporthe tectonendophytica showed an IC50 of >200 µg/mL when evaluated using a DPPH assay [34]. Weak activity (IC50: >200 µg/mL) was also recorded by fungal extract of Diaporthe sp. SAUCC194 isolated from a medicinal plant, Oroxylum indicum (L.) Kurz [26]. The present findings highlight the significant DPPH radical scavenging activity displayed by DFS when cultured in a supplemented medium. In FRAP assay, DFS recorded 188.41 ± 18.67 μg AAE/mg extract as compared to DFC (53.88 ± 4.31 μg AAE/mg extract). This assay is based on the reduction of Fe3+–TPTZ to give Fe2+–TPTZ complex by antioxidants that give an intense blue colour [32]. Meanwhile, the ABTS assay is one of the widely used antioxidant assays. It is also known as the TEAA assay. The stable radical cation ABTS will lose its blue-green colour when reacting with hydrogen-donating antioxidants. It absorbs at a wavelength of 734 nm, which has advantages over the elimination of colour interference and reduction in sample turbidity [35,36]. It is worth noting that DFS (1159.44 ± 67.70 μg TE/mg extract) showed an exceptionally higher antioxidant potential than DFC (37.77 ± 6.13 μg TE/mg extract). In addition, DFS (IC50: 17.83 μg/mL) exhibited potent IC50 as compared to DFC (IC50: 560.32 μg/mL) and the standard trolox (IC50: 20.61 μg/mL) in ABTS assay. Compared to fungal extracts from Diaporthe sp. isolated from mangrove plants which displayed IC50 ranging from 0.77 to 13.56 mg/mL, the present findings suggested the potential of DFS as a source of natural antioxidants [37].
Table 1.
Effects of culture medium supplementation on DPPH and ABTS radical scavenging and FRAP reducing activities in DFC and DFS.
| Extract | DPPH (μg AAE/mg Extract) |
FRAP (μg AAE/mg Extract) |
ABTS (μg TE/mg Extract) |
|---|---|---|---|
| DFC | 9.71 ± 2.64 | 53.88 ± 4.31 | 37.77 ± 6.13 |
| DFS | 332.20 ± 51.07 * | 188.41 ± 18.67 * | 1159.44 ± 67.70 * |
Values given are means ± SD, with n = 6. * Significantly different from DFC.
3.3. LC-HRMS-Based Metabolomics Analysis
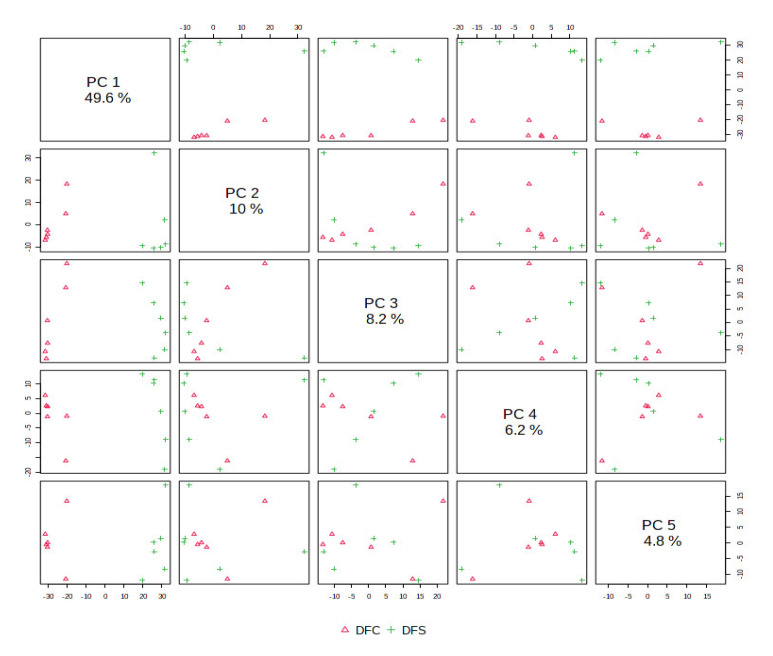
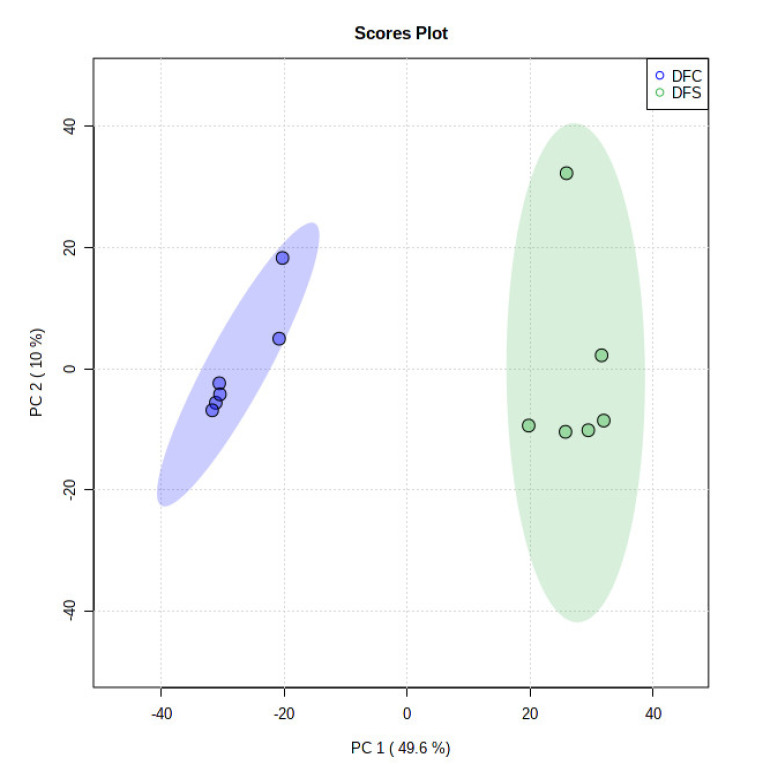
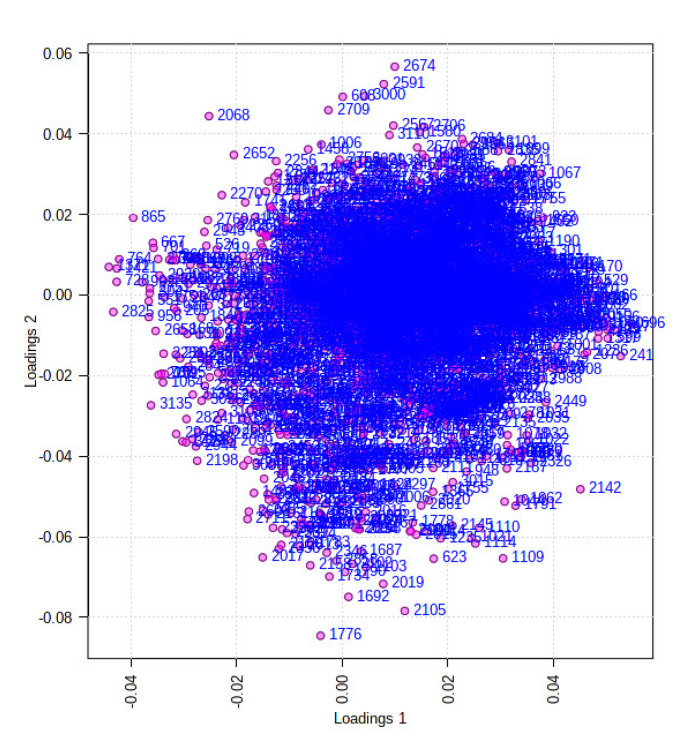
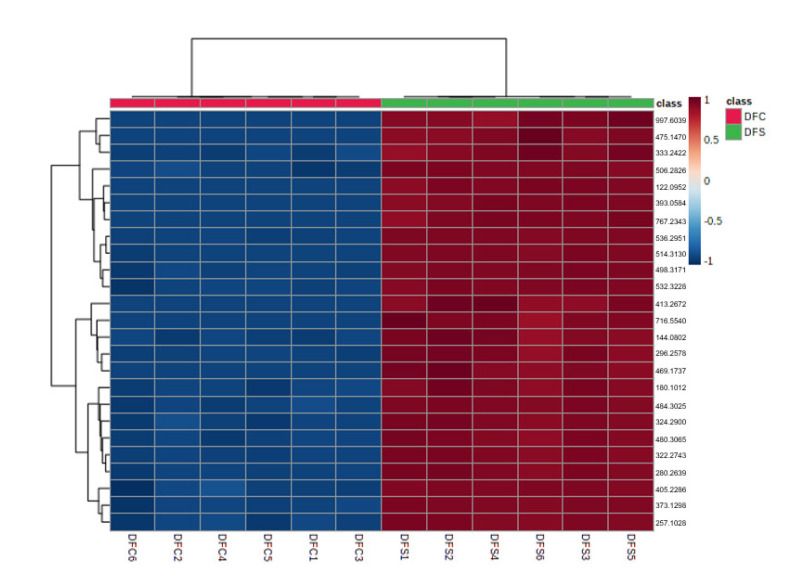
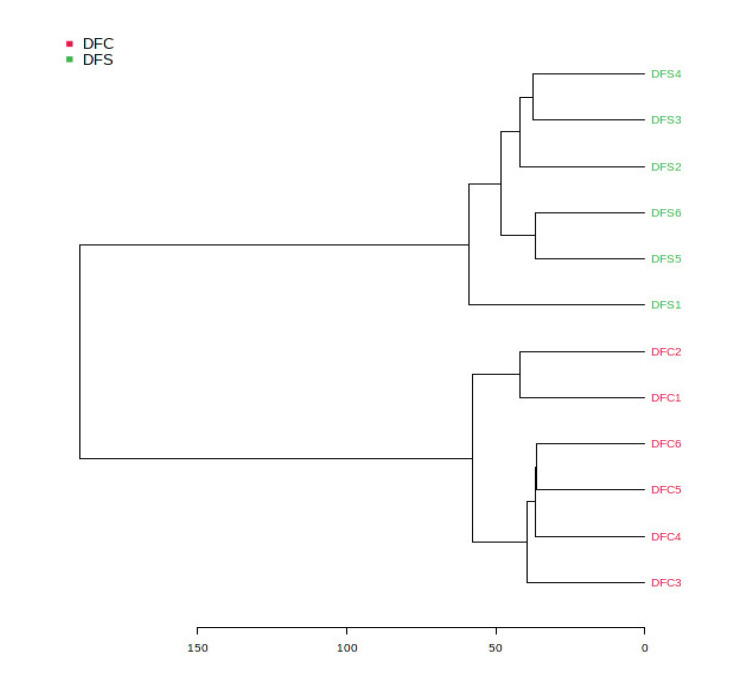
The ethyl acetate extracts of D. fraxini grown in different media were analysed in positive ion mode using LC-HRMS. An untargeted metabolomics approach was conducted to characterize the metabolites present in the 12 extracts by considering the low molecular weight ionisable molecules. Six independent biological replicates were used for each culture medium to explore the metabolome differences between the fungal extracts. A total of 3164 features were detected in the 12 fungal extracts. The dataset from LC-HRMS analysis was subjected to MetaboAnalyst 5.0 to interpret and analyse the large metabolomics data generated from the samples. In unsupervised analysis, principal component analysis (PCA) was performed to distinguish the key differences between the sample groups. Generally, it is used to reduce many dimensionalities into important essential factors, thus providing an overview of the dataset [38]. Figure 2 shows the PCA pairwise score plots between the principal components (PCs). It was depicted that five PCs explained 78.8% of the total variation. In detail, PC1 and PC2 contributed to 59.6% of the total variation while PC1, PC2, and PC3 accounted for 67.8% of the total variation. Different culture media extracts were clearly distinguished based on the PCA 2D scores plot (Figure 3). The fungal extracts DFC and DFS were distributed into two distinct areas indicating these two extracts are statistically different from each other. It was observed that the six replicates from each DFC and DFS showed the scores closely, indicating the reproducibility of the fungal culture extracts. Moreover, the PCA was depicted in loading plot to distinguish the discrimination of the metabolites (Figure 4). The PCA analysis exhibited clear discrimination of the fungal extracts DFC and DFS, suggesting their unique patterns as shown in the heatmap (Figure 5). In clustering analysis, it was distinctive that samples were grouped into two main clusters. Hierarchical cluster analysis (HCA) demonstrated a better distance matrix of the relationship between the culture extracts. HCA was found in accordance with the PCA results and allowed a better resolution of classification of the sample replicates [39]. HCA utilises a similarity metric between pairs of samples to give a dendrogram of nested clusters [40]. Based on the dendrogram (Figure 6), the vertical axis showed the arrangement of the cluster while the horizontal axis showed the clusters’ similarity. In this aspect, each sample begins with its own cluster and similar clusters will then be merged as the hierarchy shifts to the left [41]. Thus, HCA further strengthened the PCA findings that DFC and DFS were well discriminated. According to previous literature, the metabolite variations were noticed among the different fungal cultures. Fungal interactions were believed to be the determining factor in contributing to the differences of the metabolite profiles [42]. In a study conducted by Tawfike and co-workers, different culture extracts of endophytic Curvularia sp. showed changes in their chemical profiles when examined using heatmap analysis. On different culture media, the occurrence of the metabolites was well discriminated, indicating chemical diversity of the studied fungal extracts [43].
Figure 2.
PCA pairwise score plot in unsupervised analysis of DFC and DFS. Different PCs illustrate variability in the spatial distribution of the sample groups.
Figure 3.
PCA scores plot in unsupervised analysis. PC1 versus PC2 showing the discrimination of DFC and DFS growing in different culture media.
Figure 4.
PCA loading plot in unsupervised analysis obtained from DFC and DFS. Shown data are the Var ID (peak number).
Figure 5.
Heatmap overview showing the discriminations of DFC and DFS. The colour scale was set to default ranging from red (high) to blue (low).
Figure 6.
HCA plot showed as dendrogram in unsupervised analysis for DFC and DFS corresponding to the PCA model.
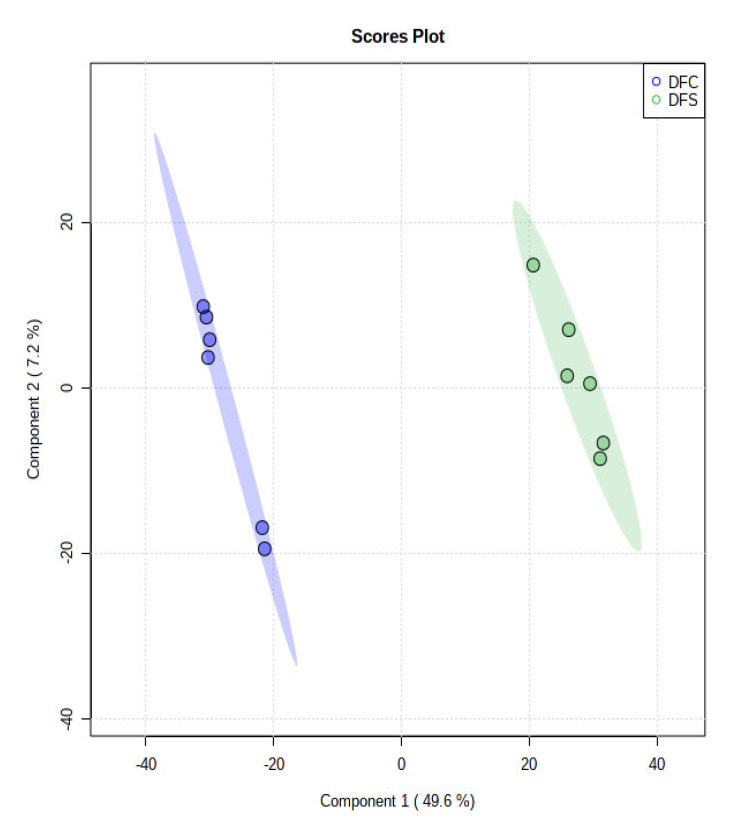
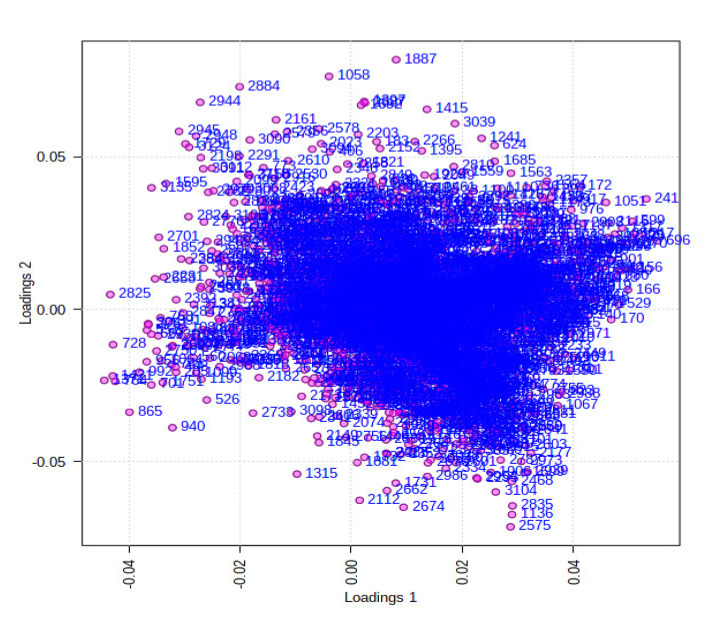
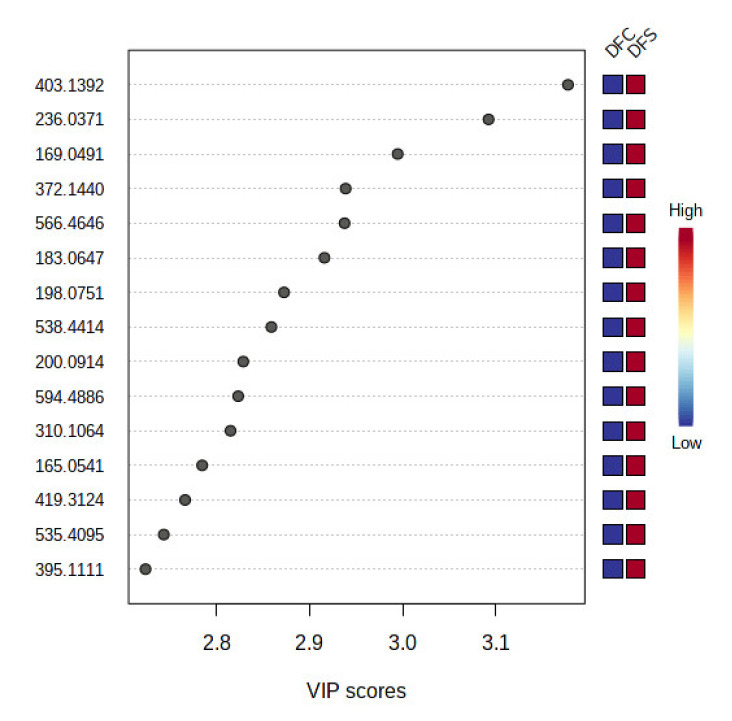
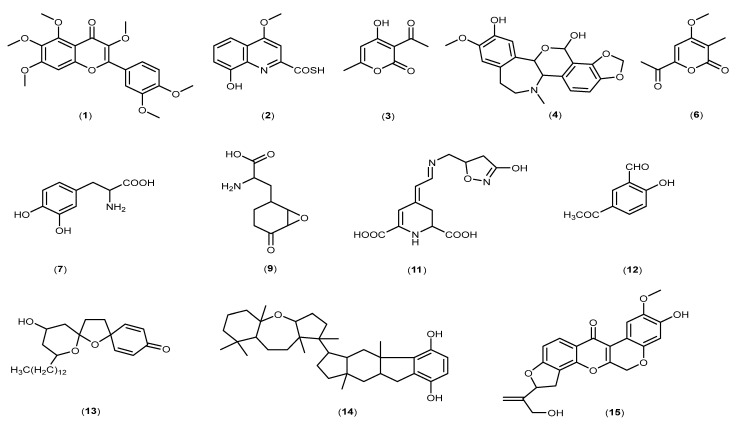
In supervised analysis, partial least squares-discriminant analysis (PLS-DA) is performed to distinguish biological samples within-group variation from between-group variation. It is a widely used supervised technique that integrates the extracted features and discriminants into one algorithm [44]. The accuracy, correlation coefficient R2 as well as the cross-validation correlation coefficient Q2 of the dataset were more than 0.8, suggesting good predictability of the model. PLS-DA 2D scores and loading plots are shown in Figure 7 and Figure 8. In PLS-DA scores plot, 56.8% of the total variations were explained by the two PLS components. The first and second components recorded 49.6% and 7.2%, respectively. In addition to that, PLS-DA established the 15 highest values of variable importance in projection (VIP) scores, as shown in Figure 9. The most 15 important features were shown on the vertical axis in an ascending order. These metabolites were dereplicated using METLIN and DNP to give 12 metabolites (Figure 10) and three unknowns (Table 2). The [M+H]+ ion peaks at m/z 403.1392, 236.0371, 169.0491 and 372.1440 suggested the presence of hexamethylquercetagetin (C21H22O8) (1), thioquinolactobactin (C11H9NO3S) (2), 3-acetyl-4-hydroxy-6-methyl-2H-pyran-2-one (C8H8O4) (3) and N-methyl-14-O-demethylepiporphyroxine (C20H21NO6) (4), respectively. Hexamethylquercetagetin was previously isolated as a new metabolite in Citrus plant [45], while thioquinolactobactin was found as a siderophore from Pseudomonas. This metabolite possessed significant antimicrobial activity with iron-chelating property [46]. 3-Acetyl-4-hydroxy-6-methyl-2H-pyran-2-one, also known as methylacetopyronone, was detected in the chloroform extract of Solandra nitida [47]. Meanwhile, N-methyl-14-O-demethylepiporphyroxine is an alkaloid previously found in Papaver somniferum. This medicinal plant contains various alkaloids with potent pharmacological and bioactive properties [48]. Vermopyrone (6), an α-pyrone, was first isolated from the fungus Gliocladium vermoesenii [49]. This metabolite was also present in Cephalotaxus hainanensis for anticancer activity [50]. Metabolite 2-amino-3-(3,4-dihydroxyphenyl)propanoic acid (7) is a catechol α-amino acid. Commonly, it is known as 3,4-dihydroxyphenylalanine and is used to treat Parkinson’s disease [51]. A [M+H]+ peak at m/z 200.0914 suggested the presence of α-amino-5-oxo-7-oxabicyclo[4.1.0]heptane-2-propanoic acid (anticapsin) (9). This metabolite was found to act as an inhibitor of glucosamine synthetase in Staphylococcus aureus [52]. Additionally, 12-decarboxy-4′,5′-dihydromuscaaurin I (11) was reported as a pigment from Amanita muscaria [53], while 5-acetyl-2-hydroxybenzaldehyde (12) was found as a new p-hydroxyacetophenone derivative from Senecro graveolens [54]. Metabolite aculeatin A (13) was isolated as a novel dioxadispiro[5.1.5.2]pentadeca-9,12-dien-11-one derivative from Amomum aculeatum. It showed a potent cytotoxic effect against KB cells and anti-protozoal activities on Plasmodium strains [55]. Interestingly, metabolite toxicol B (14) was previously isolated as a novel structure from the extract of Toxiclona toxius, which showed activity on human immunodeficiency virus type 1 (HIV-1) reverse transcriptase (RT) [56]. 3-O-Demethyldehydroamorphigenin (15) was previously isolated as a bioactive phenolic from the fruits of Amorpha fruticosa. Nonetheless, the metabolite exhibited weak antibacterial and cytotoxic activities [57]. The literature has reported that the fungal metabolomes depend on various experimental parameters. To date, there are various techniques to conduct metabolomics analyses to identify the fungal metabolites from the extracts [58]. Plant-associated fungal endophytes could produce bioactive metabolites that may be used as therapeutic agents against several diseases. The possibilities of discovering novel bioactive metabolites are exciting, particularly in unknown structures. Thus, searching for novel chemical skeletons from endophytic fungi is essential for the sustainable production of desirable natural products [7].
Figure 7.
PLS-DA scores plot in supervised analysis. Predictive components 1 versus 2 showing the supervised separation between the two sample groups (DFC and DFS) based upon the culture supplementation.
Figure 8.
PLS-DA loading plot in supervised analysis obtained from DFC and DFS. Shown data are the Var ID (peak number).
Figure 9.
VIP score plot of the most important discriminant metabolites by PLS-DA for DFC and DFS. The relative abundance of each important metabolite is indicated with a colour code scaled from blue (low) to red (high). A high VIP score indicates a high impact of the metabolite as a discriminant feature among the sample groups.
Figure 10.
Chemical structures of discriminant putatively identified metabolites in DFC and DFS.
Table 2.
Dereplication of discriminant putatively identified metabolites in DFC and DFS. The level of identification was L2—putatively identified metabolites through library matching [23].
| No. | Retention Time | [M+H]+ | Molecular Mass | Mass Error (mDa) | Molecular Formula | Putative Identification | |
|---|---|---|---|---|---|---|---|
| Observed | Calculated | ||||||
| 1. | 12.61 | 403.1392 | 402.1319 | 402.1315 | 0.4 | C21H22O8 | Hexamethylquercetagetin |
| 2. | 12.24 | 236.0371 | 235.0298 | 235.0303 | −0.5 | C11H9NO3S | Thioquinolactobactin |
| 3. | 7.27 | 169.0491 | 168.0418 | 168.0423 | −0.5 | C8H8O4 | 3-Acetyl-4-hydroxy-6-methyl-2H-pyran-2-one |
| 4. | 9.81 | 372.1440 | 371.1367 | 371.1369 | −0.2 | C20H21NO6 | N-Methyl-14-O-demethylepiporphyroxine |
| 5. | 22.16 | 566.4646 | - | - | - | - | Unknown |
| 6. | 7.00 | 183.0647 | 182.0574 | 182.0579 | −0.5 | C9H10O4 | Vermopyrone |
| 7. | 7.00 | 198.0751 | 197.0678 | 197.0688 | −1.0 | C9H11NO4 | 2-Amino-3-(3,4-dihydroxyphenyl)propanoic acid |
| 8. | 20.71 | 538.4414 | - | - | - | - | Unknown |
| 9. | 7.00 | 200.0914 | 199.0842 | 199.0845 | -0.3 | C9H13NO4 | α-Amino-5-oxo-7-oxabicyclo[4.1.0]heptane-2-propanoic acid |
| 10. | 17.24 | 594.4886 | - | - | - | - | Unknown |
| 11. | 10.76 | 310.1064 | 309.0991 | 309.0961 | 3.0 | C13H15N3O6 | 12-Decarboxy-4′,5′-dihydromuscaaurin I |
| 12. | 7.00 | 165.0541 | 164.0468 | 164.0473 | −0.5 | C9H8O3 | 5-Acetyl-2-hydroxybenzaldehyde |
| 13. | 17.24 | 419.3124 | 418.3051 | 418.3083 | −3.2 | C26H42O4 | Aculeatin A |
| 14. | 23.46 | 535.4095 | 534.4022 | 534.4073 | −5.1 | C36H54O3 | Toxicol B |
| 15. | 12.25 | 395.1111 | 394.1038 | 394.1053 | −1.5 | C22H18O7 | 3-O-Demethyldehydroamorphigenin |
4. Conclusions
Plant-associated fungal research has developed over the past decades along with the advancement of new technologies. In this aspect, metabolomics is tremendously contributing to the generation of comprehensive information to uncover the metabolomes of a fungal biological system. It is an indispensable technique used to study the global fungal metabolites at a particular condition and/or state. Moreover, MVDA in a metabolomics study is crucial to modeling variances, and thus, to presenting an overview of the dataset. An untargeted metabolomics approach was performed by employing an LC-HRMS to characterize the fungal extracts of D. fraxini grown in different culture media. A supplemented culture medium of D. fraxini exhibited potent antioxidant activity when evaluated using DPPH, ABTS, and FRAP assays. Metabolites discrimination was generated using unsupervised analysis for visual representation and explorative study. Additionally, the application of supervised PLS-DA analysis allowed the extraction of important metabolites features, which contributed to the discrimination of the fungal culture media. These metabolite markers are warranted for targeted metabolomics profiling for specific culture media conditions. The present study offers an important reference to producing bioactive metabolites from fungal endophytes residing in medicinal plants.
Acknowledgments
The authors would like to acknowledge the Ministry of Higher Education Malaysia for the Fundamental Research Grant Scheme with Project Code: FRGS/1/2018/STG01/USM/02/3 and Universiti Sains Malaysia for facilities and support.
Abbreviations
| AAEA | Ascorbic acid equivalent antioxidant activity |
| ABTS | 2,2-Azinobis (3-ethylbenzothiazoline-6-sulfonic acid |
| DFC | D. fraxini cultured in yeast extract sucrose broth |
| DFS | D. fraxini cultured in yeast extract sucrose broth supplemented with 5 mg/L rosmarinic acid |
| DNP | Dictionary of Natural Products |
| DPPH | 2,2-Diphenyl-1-picrylhydrazyl |
| FRAP | Ferric reducing antioxidant power |
| GAE | Gallic acid equivalent |
| HCA | Hierarchical cluster analysis |
| HIV-1 | Human immunodeficiency virus type 1 |
| LC-HRMS | Liquid chromatography-high resolution mass spectrometry |
| MS | Mass spectrometry |
| MVDA | Multivariate data analysis |
| nM | Nanomolar |
| PCs | Principal components |
| PCA | Principal component analysis |
| PDA | Potato dextrose agar |
| PLS-DA | Partial least squares-discriminant analysis |
| QE | Quercetin equivalent |
| RT | Reverse transcriptase |
| SD | Standard deviation |
| TE | Trolox equivalent |
| TEAA | Trolox equivalent antioxidant activity |
| TFC | Total flavonoid content |
| TPC | Total phenolic content |
| TPTZ | 2,4,6-Tri(2-pyridyl)-1,3,5-triazine |
| VIP | Variable importance in projection |
Author Contributions
Conceptualization, W.-N.T.; methodology, K.N. and J.A.; software, W.-N.T., V.L. and K.-Y.K.; formal analysis, K.N. and N.J.-Y.C.; resources, W.-N.T., W.-Y.T. and C.-R.L.; writing—original draft preparation, W.-N.T., K.N. and J.A.; writing—review and editing, W.-N.T., W.-Y.T. and C.-R.L.; funding acquisition, W.-N.T. All authors have read and agreed to the published version of the manuscript.
Institutional Review Board Statement
Not applicable.
Informed Consent Statement
Not applicable.
Data Availability Statement
Not applicable.
Conflicts of Interest
The authors declare no conflict of interest.
Funding Statement
This study was funded by the Ministry of Higher Education Malaysia for Fundamental Research Grant Scheme with Project Code: FRGS/1/2018/STG01/USM/02/3.
Footnotes
Publisher’s Note: MDPI stays neutral with regard to jurisdictional claims in published maps and institutional affiliations.
References
- 1.Gouda S., Das G., Sen S.K., Shin H.-S., Patra J.K. Endophytes: A Treasure House of Bioactive Compounds of Medicinal Importance. Front. Microbiol. 2016;7:1538. doi: 10.3389/fmicb.2016.01538. [DOI] [PMC free article] [PubMed] [Google Scholar]
- 2.Alam B., Li J., Ge Q., Khan M.A., Gong J., Mehmood S., Yuan Y., Gong W. Endophytic fungi: From symbiosis to secondary metabolite communications or vice versa? Front. Plant Sci. 2021;12:791033. doi: 10.3389/fpls.2021.791033. [DOI] [PMC free article] [PubMed] [Google Scholar]
- 3.Cruz J.S., da Silva C.A., Hamerski L. Natural products from endophytic fungi associated with Rubiaceae species. J. Fungi. 2020;6:128. doi: 10.3390/jof6030128. [DOI] [PMC free article] [PubMed] [Google Scholar]
- 4.Strobel G., Daisy B. Bioprospecting for Microbial Endophytes and Their Natural Products. Microbiol. Mol. Biol. Rev. 2003;67:491–502. doi: 10.1128/MMBR.67.4.491-502.2003. [DOI] [PMC free article] [PubMed] [Google Scholar]
- 5.Nagarajan K., Ibrahim B., Bawadikji A.A., Lim J.-W., Tong W.-Y., Leong C.-R., Khaw K.Y., Tan W.-N. Recent Developments in Metabolomics Studies of Endophytic Fungi. J. Fungi. 2022;8:28. doi: 10.3390/jof8010028. [DOI] [PMC free article] [PubMed] [Google Scholar]
- 6.Fadiji A.E., Babalola O.O. Elucidating Mechanisms of Endophytes Used in Plant Protection and Other Bioactivities with Multifunctional Prospects. Front. Bioeng. Biotechnol. 2020;8:467. doi: 10.3389/fbioe.2020.00467. [DOI] [PMC free article] [PubMed] [Google Scholar]
- 7.Kusari S., Hertweck C., Spiteller M. Chemical Ecology of Endophytic Fungi: Origins of Secondary Metabolites. Chem. Biol. 2012;19:792–798. doi: 10.1016/j.chembiol.2012.06.004. [DOI] [PubMed] [Google Scholar]
- 8.Rai N., Kumari Keshri P., Verma A., Kamble S.C., Mishra P., Barik S., Kumar Singh S., Gautam V. Plant associated fungal endophytes as a source of natural bioactive compounds. Mycology. 2021;12:139–159. doi: 10.1080/21501203.2020.1870579. [DOI] [PMC free article] [PubMed] [Google Scholar]
- 9.Stierle A., Strobel G., Stierle D., Grothaus P., Bignami G. The Search for a Taxol-Producing Microorganism Among the Endophytic Fungi of the Pacific Yew, Taxus brevifolia. J. Nat. Prod. 1995;58:1315–1324. doi: 10.1021/np50123a002. [DOI] [PubMed] [Google Scholar]
- 10.Ashraf K., Sultan S., Adam A. Orthosiphon stamineus Benth. is an Outstanding Food Medicine: Review of Phytochemical and Pharmacological Activities. J. Pharm. Bioallied Sci. 2018;10:109–118. doi: 10.4103/JPBS.JPBS_253_17. [DOI] [PMC free article] [PubMed] [Google Scholar]
- 11.Cai X., Xiao C., Xue H., Xiong H., Hang Y., Xu J., Lu Y. A comparative study of the antioxidant and intestinal protective effects of extracts from different parts of Java tea (Orthosiphon stamineus) Food Sci. Nutr. 2018;6:579–584. doi: 10.1002/fsn3.584. [DOI] [PMC free article] [PubMed] [Google Scholar]
- 12.Cai X., Zhang L., Chen X., Zhang H., Xue H., Lu Y., Tang J., Lu Y. Orthosiphon stamineus and rosmarinic acid reduce heat stress in laying hens. Livest. Sci. 2020;240:104124. doi: 10.1016/j.livsci.2020.104124. [DOI] [Google Scholar]
- 13.Yenn T.W., Ring L.C., Nee T.W., Khairuddean M., Zakaria L., Ibrahim D. Endophytic Diaporthe sp. ED2 produces a novel anti-candidal ketone derivative. J. Microbiol. Biotechnol. 2017;27:1065–1070. doi: 10.4014/jmb.1612.12009. [DOI] [PubMed] [Google Scholar]
- 14.Tejesvi M.V., Pirttilä A.M. Potential of tree endophytes as sources for new drug compounds. In: Pirttila A.M., Frank A.C., editors. Endophytes of Forest Trees: Biology and Applications, Forestry Sciences. Springer Science + Business Media; Berlin, Germany: 2011. pp. 295–311. [Google Scholar]
- 15.Yang Q., Zhang A.-H., Miao J.-H., Sun H., Han Y., Yan G.-L., Wu F.-F., Wang X.-J. Metabolomics biotechnology, applications, and future trends: A systematic review. RSC Adv. 2019;9:37245–37257. doi: 10.1039/C9RA06697G. [DOI] [PMC free article] [PubMed] [Google Scholar]
- 16.Taylor M., Gill E.L.D., Vedam-Mai V., Yost R.A. Mass spectrometry-based cellular metabolomics: Current approaches, applications, and future directions. Anal. Chem. 2021;93:546–566. doi: 10.1021/acs.analchem.0c04363. [DOI] [PubMed] [Google Scholar]
- 17.Stuart K.A., Welsh K., Walker M.C., Edrada-Ebel R. Metabolomic tools used in marine natural product drug discovery. Expert Opin. Drug Discov. 2020;15:499–522. doi: 10.1080/17460441.2020.1722636. [DOI] [PubMed] [Google Scholar]
- 18.Bobo G., Davidov-Pardo G., Arroqui C., Vírseda P., Marín-Arroyo M.R., Navarro M. Intra-laboratory validation of microplate methods for total phenolic content and antioxidant activity on polyphenolic extracts, and comparison with conventional spectrophotometric methods. J. Sci. Food Agric. 2015;95:204–209. doi: 10.1002/jsfa.6706. [DOI] [PubMed] [Google Scholar]
- 19.Horszwald A., Andlauer W. Characterisation of bioactive compounds in berry juices by traditional photometric and modern microplate methods. J. Berry Res. 2011;1:189–199. doi: 10.3233/JBR-2011-020. [DOI] [Google Scholar]
- 20.Santos J.S., Brizola V.R.A., Granato D. High-throughput assay comparison and standardization for metal chelating capacity screening: A proposal and application. Food Chem. 2017;214:515–522. doi: 10.1016/j.foodchem.2016.07.091. [DOI] [PubMed] [Google Scholar]
- 21.Van de Velde F., Tarola A.M., Güemes D., Pirovani M.E. Bioactive Compounds and Antioxidant Capacity of Camarosa and Selva Strawberries (Fragaria x ananassa Duch.) Foods. 2013;2:120–131. doi: 10.3390/foods2020120. [DOI] [PMC free article] [PubMed] [Google Scholar]
- 22.Seo C.-S., Kim O.S., Kim J.-H., Shin H.-K. Simultaneous quantification and antiatherosclerosis effect of the traditional Korean medicine, Hwangryunhaedok-tang. BMC Complement. Altern. Med. 2015;15:108. doi: 10.1186/s12906-015-0632-5. [DOI] [PMC free article] [PubMed] [Google Scholar]
- 23.Salek R.M., Steinbeck C., Viant M.R., Goodacre R., Dunn W.B. The role of reporting standards for metabolite annotation and identification in metabolomic studies. GigaScience. 2013;2:13. doi: 10.1186/2047-217X-2-13. [DOI] [PMC free article] [PubMed] [Google Scholar]
- 24.Pang Z., Chong J., Zhou G., de Lima Morais D.A., Chang L., Barrette M., Gauthier C., Jacques P.-É., Li S., Xia J. MetaboAnalyst 5.0: Narrowing the gap between raw spectra and functional insights. Nucleic Acids Res. 2021;49:W388–W396. doi: 10.1093/nar/gkab382. [DOI] [PMC free article] [PubMed] [Google Scholar]
- 25.El-Hawary S.S., Mohammed R., Bahr H.S., Attia E.Z., El-Katatny M.H., Abelyan N., Al-Sanea M.M., Moawad A.S., Abdelmohsen U.R. Soybean-associated endophytic fungi as potential source for anti-COVID-19 metabolites supported by docking analysis. J. Appl. Microbiol. 2021;131:1193–1211. doi: 10.1111/jam.15031. [DOI] [PMC free article] [PubMed] [Google Scholar]
- 26.Aryal S., Baniya M.K., Danekhu K., Kunwar P., Gurung R., Koirala N. Total Phenolic Content, Flavonoid Content and Antioxidant Potential of Wild Vegetables from Western Nepal. Plants. 2019;8:96. doi: 10.3390/plants8040096. [DOI] [PMC free article] [PubMed] [Google Scholar]
- 27.Verma A., Gupta P., Rai N., Tiwari R.K., Kumar A., Salvi P., Kamble S.C., Singh S.K., Gautam V. Assessment of Biological Activities of Fungal Endophytes Derived Bioactive Compounds Isolated from Amoora rohituka. J. Fungi. 2022;8:285. doi: 10.3390/jof8030285. [DOI] [PMC free article] [PubMed] [Google Scholar]
- 28.González-Palma I., Escalona-Buendía H.B., Ponce-Alquicira E., Téllez-Téllez M., Gupta V.K., Díaz-Godínez G., Soriano-Santos J. Evaluation of the Antioxidant Activity of Aqueous and Methanol Extracts of Pleurotus ostreatus in Different Growth Stages. Front. Microbiol. 2016;7:1099. doi: 10.3389/fmicb.2016.01099. [DOI] [PMC free article] [PubMed] [Google Scholar]
- 29.Arora P., Wani Z.A., Ahmad T., Sultan P., Gupta S., Riyaz-Ul-Hassan S. Community structure, spatial distribution, diversity and functional characterization of culturable endophytic fungi associated with Glycyrrhiza glabra L. Fungal Biol. 2019;123:373–383. doi: 10.1016/j.funbio.2019.02.003. [DOI] [PubMed] [Google Scholar]
- 30.Griffin S.P., Bhagooli R. Measuring antioxidant potential in corals using the FRAP assay. J. Exp. Mar. Biol. Ecol. 2004;302:201–211. doi: 10.1016/j.jembe.2003.10.008. [DOI] [Google Scholar]
- 31.Dudonné S., Vitrac X., Coutière P., Woillez M., Mérillon J.-M. Comparative study of antioxidant properties and total phenolic content of 30 plant extracts of industrial interest using DPPH, ABTS, FRAP, SOD, and ORAC assays. J. Agric. Food Chem. 2009;57:1768–1774. doi: 10.1021/jf803011r. [DOI] [PubMed] [Google Scholar]
- 32.Xiao F., Xu T., Lu B., Liu R. Guidelines for antioxidant assays for food components. Food Front. 2020;1:60–69. doi: 10.1002/fft2.10. [DOI] [Google Scholar]
- 33.Rivero-Cruz J.F., Granados-Pineda J., Pedraza-Chaverri J., Pérez-Rojas J.M., Kumar-Passari A., Diaz-Ruiz G., Rivero-Cruz B.E. Phytochemical Constituents, Antioxidant, Cytotoxic, and Antimicrobial Activities of the Ethanolic Extract of Mexican Brown Propolis. Antioxidants. 2020;9:70. doi: 10.3390/antiox9010070. [DOI] [PMC free article] [PubMed] [Google Scholar]
- 34.Rai N., Keshri P.K., Gupta P., Verma A., Kamble S.C., Singh S.K., Gautam V. Bioprospecting of fungal endophytes from Oroxylum indicum (L.) Kurz with antioxidant and cytotoxic activity. PLoS ONE. 2022;17:e0264673. doi: 10.1371/journal.pone.0264673. [DOI] [PMC free article] [PubMed] [Google Scholar]
- 35.Ilyasov I.R., Beloborodov V.L., Selivanova I.A., Terekhov R.P. ABTS/PP Decolorization Assay of Antioxidant Capacity Reaction Pathways. Int. J. Mol. Sci. 2020;21:1131. doi: 10.3390/ijms21031131. [DOI] [PMC free article] [PubMed] [Google Scholar]
- 36.Sadeer N.B., Montesano D., Albrizio S., Zengin G., Mahomoodally M.F. The versatility of antioxidant assays in food science and safety—Chemistry, applications, strengths, and limitations. Antioxidants. 2020;9:709. doi: 10.3390/antiox9080709. [DOI] [PMC free article] [PubMed] [Google Scholar]
- 37.Zhou J., Diao X., Wang T., Chen G., Lin Q., Yang X., Xu J. Phylogenetic diversity and antioxidant activities of culturable fungal endophytes associated with the mangrove species Rhizophora stylosa and R. mucronata in the South China Sea. PLoS ONE. 2018;13:e0197359. doi: 10.1371/journal.pone.0197359. [DOI] [PMC free article] [PubMed] [Google Scholar]
- 38.Tanabe K., Hayashi C., Katahira T., Sasaki K., Igami K. Multiblock metabolomics: An approach to elucidate whole-body metabolism with multiblock principal component analysis. Comput. Struct. Biotechnol. J. 2021;19:1956–1965. doi: 10.1016/j.csbj.2021.04.015. [DOI] [PMC free article] [PubMed] [Google Scholar]
- 39.Heinemann J. Cluster Analysis of untargeted metabolomic experiments. In: Baidoo E.E.K., editor. Microbial Metabolomics. Methods and Protocols. Humana Press; New York, NY, USA: 2019. pp. 275–285. [DOI] [PubMed] [Google Scholar]
- 40.Kellogg J.J., Kvalheim O.M., Cech N.B. Composite score analysis for unsupervised comparison and network visualization of metabolomics data. Anal. Chim. Acta. 2020;1095:38–47. doi: 10.1016/j.aca.2019.10.029. [DOI] [PMC free article] [PubMed] [Google Scholar]
- 41.Friedman J.H., Meulman J.J. Clustering objects on subsets of attributes. J. R. Statist. Soc. B. 2004;66:815–849. doi: 10.1111/j.1467-9868.2004.02059.x. [DOI] [Google Scholar]
- 42.Triastuti A., Haddad M., Barakat F., Mejia K., Rabouille G., Fabre N., Amasifuen C., Jargeat P., Vansteelandt M. Dynamics of Chemical Diversity during Co-Cultures: An Integrative Time-Scale Metabolomics Study of Fungal Endophytes Cophinforma mamane and Fusarium solani. Chem. Biodivers. 2021;18:e2000672. doi: 10.1002/cbdv.202000672. [DOI] [PubMed] [Google Scholar]
- 43.Tawfike A.F., Abbott G., Young L., Edrada-Ebel R. Metabolomic-Guided Isolation of Bioactive Natural Products from Curvularia sp., an Endophytic Fungus of Terminalia laxiflora. Planta Med. 2018;84:182–190. doi: 10.1055/s-0043-118807. [DOI] [PubMed] [Google Scholar]
- 44.Aminu M., Ahmad N.A. Complex Chemical Data Classification and Discrimination Using Locality Preserving Partial Least Squares Discriminant Analysis. ACS Omega. 2020;5:26601–26610. doi: 10.1021/acsomega.0c03362. [DOI] [PMC free article] [PubMed] [Google Scholar]
- 45.Tatum J., Berry R. Six new flavonoids from Citrus. Phytochemistry. 1972;11:2283–2288. doi: 10.1016/S0031-9422(00)88391-0. [DOI] [Google Scholar]
- 46.Matthijs S., Tehrani K.A., Laus G., Jackson R., Cooper R.M., Cornelis P. Thioquinolobactin, a Pseudomonas siderophore with antifungal and anti-Pythium activity. Environ. Microbiol. 2007;9:425–434. doi: 10.1111/j.1462-2920.2006.01154.x. [DOI] [PubMed] [Google Scholar]
- 47.Rivera C., Piñeyro E., Giral F. Dehydroacetic acid in anthers of Solandra nitida (Solanaceae) Experientia. 1976;32:1490. doi: 10.1007/BF01924409. [DOI] [Google Scholar]
- 48.Weid M., Ziegler J., Kutchan T.M. The roles of latex and the vascular bundle in morphine biosynthesis in the opium poppy, Papaver somniferum. Proc. Natl. Acad. Sci. USA. 2004;101:13957–13962. doi: 10.1073/pnas.0405704101. [DOI] [PMC free article] [PubMed] [Google Scholar]
- 49.Avent A.G., Hanson J.R., Truneh A. Two pyrones from Gliocladium vermoesenii. Phytochemistry. 1992;31:1065–1066. doi: 10.1016/0031-9422(92)80079-T. [DOI] [Google Scholar]
- 50.Geiseler O., Podlech J. Total synthesis of infectopyrone, aplysiopsenes A–C, ent-aplysiopsene D, phomapyrones A and D, 8,9-dehydroxylarone, and nectriapyrone. Tetrahedron. 2012;68:7280–7287. doi: 10.1016/j.tet.2012.06.104. [DOI] [Google Scholar]
- 51.Lee M., Nohta H., Ohtsubo K., Yoo B., Ohkura Y. Determination of L-3,4-dihydroxyphenylalanine in plasma and urine by high-performance liquid chromatography with fluorescence detection. Chem. Pharm. Bull. 1987;35:235–240. doi: 10.1248/cpb.35.235. [DOI] [PubMed] [Google Scholar]
- 52.Kenig M., Vandamme E., Abraham E.P. The Mode of Action of Bacilysin and Anticapsin and Biochemical Properties of Bacilysin-resistant Mutants. J. Gen. Microbiol. 1976;94:46–54. doi: 10.1099/00221287-94-1-46. [DOI] [PubMed] [Google Scholar]
- 53.Stintzing F., Schliemann W. Pigments of fly Agaric (Amanita muscaria) Z. Naturforsch. 2007;62:779–785. doi: 10.1515/znc-2007-11-1201. [DOI] [PubMed] [Google Scholar]
- 54.Loyola L.A., Pedreros S., Morales G. P-hydroxyacetophenone derivatives from senecio graveolens. Phytochemistry. 1985;24:1600–1602. doi: 10.1016/S0031-9422(00)81074-2. [DOI] [Google Scholar]
- 55.Heilmann J., Mayr S., Brun R., Rali T., Sticher O. Antiprotozoal Activity and Cytotoxicity of Novel 1,7-Dioxadispiro[5.1.5.2] pentadeca-9,12-dien-11-one Derivatives from Amomum aculeatum. Helv. Chim. Acta. 2000;83:2939–2945. doi: 10.1002/1522-2675(20001108)83:11<2939::AID-HLCA2939>3.0.CO;2-N. [DOI] [Google Scholar]
- 56.Loya S., Tal R., Hizi A., Issacs S., Kashman Y., Loya Y. Hexaprenoid Hydroquinones, Novel Inhibitors of the Reverse Transcriptase of Human Immunodeficiency Virus Type 1. J. Nat. Prod. 1993;56:2120–2125. doi: 10.1021/np50102a014. [DOI] [PubMed] [Google Scholar]
- 57.Muharini R., Díaz A., Ebrahim W., Mándi A., Kurtán T., Rehberg N., Kalscheuer R., Hartmann R., Orfali R.S., Lin W., et al. Antibacterial and Cytotoxic Phenolic Metabolites from the Fruits of Amorpha fruticosa. J. Nat. Prod. 2017;80:169–180. doi: 10.1021/acs.jnatprod.6b00809. [DOI] [PubMed] [Google Scholar]
- 58.Flores-Vallejo R.D.C., Folch-Mallol J.L., Sharma A., Cardoso-Taketa A., Alvarez-Berber L., Villarreal M.L. ITS2 ribotyping, in vitro anti-inflammatory screening, and metabolic profiling of fungal endophytes from the Mexican species Crescentia alata Kunth. South Afr. J. Bot. 2020;134:213–224. doi: 10.1016/j.sajb.2019.12.030. [DOI] [Google Scholar]
Associated Data
This section collects any data citations, data availability statements, or supplementary materials included in this article.
Data Availability Statement
Not applicable.


