

SUMMARY
Newcastle disease (ND) is one of the most important and widespread avian pests. In Africa, backyard poultry production systems are an important source of protein and cash for poor rural livelihoods. ND mortality in these production systems is important and seriously disrupts benefits derived from it. This study undertook an African continental approach of ND epidemiology in backyard poultry. After a systematic literature review of studies published from 1980 to 2009, a meta-analysis of spatio-temporal patterns of serological prevalence and outbreak occurrence was performed. Average ND serological prevalence was estimated at 0·67 [95% confidence interval (CI) 0·58–0·75] in regions characterized by humid ecosystems, high human and poultry densities and low altitudes; 0·36 (95% CI 0·30–0·41) in dry ecosystems at intermediate altitude where human and poultry densities are low and 0·27 (95% CI 0·19–0·38) in mountain ecosystems where human and poultry densities are intermediate. In terms of seasonality, ND outbreaks occur mostly during the dry seasons in Africa, when environmental conditions are likely to be harshest for backyard poultry. In addition, a phylogeographical analysis revealed the regionalization of ND virus strains, their potential to evolve towards a higher pathogenicity from the local viral pool and suggests a risk for vaccine strains to provide new wild strains. These results present for the first time a continent-wide approach to ND epidemiology in Africa. More emphasis is needed for ND management and control in rural African poultry production systems.
Key words: Phylogeography, serological prevalence, spatio-temporal pattern, systematic review
INTRODUCTION
Newcastle disease (ND), a viral disease caused by the avian paramyxovirus serotype 1 (APMV-1), is one of the most important poultry diseases worldwide [1]. The disease probably emerged more than 150 years ago in wild birds in Scotland [2, 3]. It was first identified in poultry around the 1920s in Indonesia and England and today is endemic in many countries [4]. Epidemics are observed mainly in Central and South America, Africa, and Asia [5]. The threat of ND is still present in Europe where sporadic outbreaks occur [6]. Known also as pseudo-fowl plague, ND is widespread, primarily affecting avian species [7]. The virus may affect more than 8000 bird species [8, 9], including most domestic species whether vaccinated or not [10–15]. Domestic species usually appear to be more susceptible to the virus, and suffer from a higher mortality from it than wild species. The role of the specific diversity and composition of avian communities in the epidemiology of the disease is still largely unexplored. In particular, the reservoirs of the various ND virus (NDV) are not well identified and the variation in pathogenicity in NDV strains and host species combinations has only been partially described [10–15]. Nonetheless, due to the high pathogenicity and strong dispersion capacity of some strains [16], the OIE recognized ND as a list A disease alongside avian influenza [17].
Since ND first emerged on the African continent in the 1930s and 1940s, the disease has become endemic in many countries [4, 5]. Despite stringent control efforts, ND continues to be detected with high serological prevalence rates in African production systems [18]. In African rural communities, livestock production is an important economic asset. Chickens, representing the species with the smallest economic value per unit, are widely used, notably by the poorest members of a community, as a source of protein and income [19]. Each year about 18% of the African poultry population die from diverse infections [20, 21]. In some countries, ND alone is responsible for nearly 80% of poultry mortality in village systems [22]. Such mortality rates have a huge impact on the economies of some developing countries and the food security of their inhabitants [23, 24]. Although the spread of the disease in rural production systems and backyard chicken flocks does not appear to be as rapid as in industrial systems, with the disease taking weeks to contaminate a flock and months to reach adjacent villages [4], the disease burden in rural poultry production systems can seriously damage livelihoods. The study and control of ND is therefore a substantial challenge for development over the coming years.
Much remains unknown regarding the ecology of NDV and the epidemiology of this avian pest in African ecosystems. The sparse available data are scattered throughout individual studies and are inconclusive. Mortality can reach 100% when a non-immunized chicken population is infected by a highly pathogenic virus strain [12], the incubation and excretion periods can vary from 2 to 21 days for domestic poultry [25] and finally the survival of the virus in the environment varies from 21 days to several years depending on the substrate. All these data are synthesized in Figure 1.
Fig. 1.

Newcastle disease and virus eco-epidemiological characteristics: survival of the virus for different substrates, temperatures and pHs; incubation periods and transmission modes. (a) [17], (b) [95], (c) [8], (d) [96], (e) [97], (f) [1], (g) [4].
Although some country-wide studies have been conducted [26], integrative analyses that might reveal ecological and phylogeographical patterns of ND at the continental level are to our knowledge still missing. The present study, a systematic review of the literature produced over the past 30 years involving ND in Africa, addresses two questions. (1) What are the phylogenetic relationships in NDV strains isolated in backyard chickens in Africa? For this first question, particular emphasis is placed on the relationships between virulent and avirulent NDV strains. (2) How is ND distributed geographically and seasonally in Africa? For this second question, meta-analyses of ND serological prevalence variation according to biogeographical factors and of the association between the occurrence of ND epidemics and seasonal climatic characteristics are undertaken.
MATERIAL AND METHODS
Phylogeographical analyses of NDV strains on the African continent from 1994 to 2007
The objective of the analysis was to describe gene and nucleotide diversity, to study lineage stability, and to depict the evolution of strains at the African continental level.
The maximum amount of information on NDV strains characterized from a molecular point of view in Africa up to 2009 was obtained from Genbank. Six European fusion protein F sequences and 133 African sequences isolated from a variety of hosts between 1994 and 2007 were downloaded (see Supplementary Table S1 for the origin and accession numbers of strains). The nucleotide sequences were aligned with ClustalW [27] as implemented in BioEdit software [28]. A segment around the protein F fusion site of 89 bp length was found to be common to all sequences. Genetic polymorphism measures were estimated using DNAsp 4·0 [29]. We drew a maximum-likelihood tree using Kimura two-parameter distance with 1000 bootstraps using MEGA (see Supplementary Fig. S1). A median-joining network was constructed using the program Network 4·5 [30]. The gene and nucleotide diversity (π) were computed by lineage following notation proposed by Aldous et al. [31]. Finally, to detect signatures of population expansion, Tajima's D test [32] and Fu's Fs test [33] were used. Calculations and tests were performed using Arlequin v. 3.1 [34].
Systematic review
To undertake a systematic review, we followed the four-step protocol described by Moher et al. [35]. This process is presented along with the search results covering documents published between 1980 and 2009 (see Supplementary Fig. S2 for the systematic review synthesis). We searched for information on ND in African rural backyard systems in scientific articles, conference proceedings, PhD theses, and expert reports. An initial set of 2686 documents obtained by consulting databases with Boolean search expressions, was reduced to 201 documents after reading the summaries of each document and selecting those that provided quantitative information on the epidemiology of ND in Africa. Finally 88 documents were selected for inclusion in the study. These documents were carefully examined to establish a list of ND risk factors supported by scientific evidence.
Meta-analysis
Patterns of occurrence of ND in backyard chickens in rural areas of Africa
The objective of the analysis was to depict the biogeographical and seasonal patterns of occurrence of ND in African rural backyard systems and to identify some of the factors underpinning this pattern.
Geographical study
For the meta-analysis of geographical patterns, the list of documents used was further reduced to those reporting antibody prevalence estimates (hereafter referred to as  i) obtained from random sampling protocols in African backyard chicken populations outside outbreak periods (i.e. prevalences estimated following the declaration of an outbreak were excluded). In all these studies, NDV antibodies had been titrated using the haemagglutination inhibition (HI) test or the enzyme-linked immunosorbent assay (ELISA) as recommended by the OIE [1]. The 14 documents that were retained reported prevalence estimates for 12 countries from 1984 to 2005 (Benin, Cameroon, Ethiopia, Madagascar, Morocco, Mauritania, Niger, Nigeria, Democratic Republic of Congo, Tanzania, Zambia, Zimbabwe; see Fig. 2 and Supplementary Table S2 for documents used for the prevalence meta-analysis in the geographical study). Three of the 14 documents reported the results of longitudinal studies (estimates from a same population at different dates). For each of these studies, the prevalence estimates provided were pooled into one single average prevalence estimate that was considered as a single statistical unit in the meta-analysis.
Fig. 2.

Locations of Newcastle serological prevalence studies selected for the meta-analyses on a biome map (adapted from [39]).
Eight other documents reported results from investigations of spatial variation in prevalence (estimates from distinct populations obtained over a short period). The prevalence estimates reported in these studies were treated as distinct statistical units in the meta-analysis. Sixty-five population prevalence estimates (hereafter referred to as primary estimates) were eventually considered for the meta-analysis and are depicted in Figure 2.
The location of each prevalence estimate was provided in the source publication [36]. The altitude, poultry [37] and human [38] densities, and biome [39] for the location of each prevalence estimate were considered as potential explanatory variables. The year was also considered as a potential explanatory variable. The biome classification presented in Olson et al. [39] is established according to the assemblage of natural plant and animal communities and species. The biome reflects biotic conditions, such as vegetation type, as well as physical conditions, such as rainfall and temperature, which could influence the survival and spread of NDV in natural and domestic host compartments. Biome was used here as an integrative index of these environmental conditions. Altitude was included in the set of potential explanatory variables for the same reason. Poultry and human densities were considered as proxies for the density and the connectivity of the poultry production network. These characteristics are obviously important for the ecology of NDV because they influence the number of potential hosts and their contact rates. Biome, altitude, human density and poultry density are likely to be inter-related. To account simultaneously for the effect of these explanatory variables, they were combined using a multiple correspondence analysis (hereafter referred to as MCA). For the MCA, continuous variables such as altitude, population density and poultry density were transformed into categorical variables (Table 1). MCA then permitted the identification of groups of localities where prevalence had been estimated and that were relatively similar with regard to the set of explanatory variables considered. MCA was performed using the dudi.acm procedure of the ADE4 package [40, 41] of R software [42].
Table 1.
Explanatory variables for the meta-analysis
| Biomes (no.) | Description | Abbreviation | No. of data |
|---|---|---|---|
| 1 | Tropical and subtropical moist broadleaf forests | BI 1 | 14 |
| 7 | Tropical and subtropical grassland, savannas and shrublands | BI 7 | 38 |
| 10 | Montane grasslands and shrublands | BI 10 | 7 |
| 12 | Mediterranean forests, woodlands and scrub | BI 12 | 6 |
| Altitude (metres) | |||
| 1 | 0–500 | AL 1 | 27 |
| 2 | 500–1000 | AL 2 | 14 |
| 3 | 1000–1500 | AL 3 | 15 |
| 4 | >1500 | AL 4 | 9 |
| Years (study years) | |||
| 1 | ⩽1990 | Y 1 | 18 |
| 2 | 1990 < x ⩽ 1995 | Y 2 | 13 |
| 3 | 1995 < x ⩽ 2000 | Y 3 | 21 |
| 4 | >2000 | Y 4 | 13 |
| Human density (no./km2) | |||
| 1 | x < 25 | HD 1 | 21 |
| 2 | 25 < x < 250 | HD 2 | 22 |
| 3 | 250 < x < 1000 | HD 3 | 9 |
| 4 | x > 1000 | HD 4 | 13 |
| Poultry density (no./km2) | |||
| 1 | x < 300 | PD 1 | 22 |
| 2 | 300 > x > 1000 | PD 2 | 18 |
| 3 | x > 1000 | PD 3 | 25 |
BI, Biome; AL, altitude; Y, year; HD; human density; PD, poultry density.
Meta-analysis allowed the testing of differences in prevalence in the study categories defined with MCA. The variable used as the effect size in the meta-analysis was the logit of the prevalence estimate: logit(i) = ln(i/1 – i) [43]. A standard error (s.e.) was associated with each prevalence estimate, which was computed as follows: s.e.(i) = √[(i/1 – i)/ni], where ni is the size of the sample from which prevalence was estimated. The standard error of logit(i) was computed using the delta method: s.e.[logit (i)] = 1/i(1 – i)s.e. (pi).
The meta-analysis allows each of the MCA categories to estimate the mean and the standard error of the logit of prevalence, while accounting for the fact that the sample consists of estimates, rather than direct measurements, of the focal variable, each of which bears a certain uncertainty (quantified by the standard errors, s.e.[logit(i)], of the primary estimates). In addition, a heterogeneity test [44] can be performed within each category. The null hypothesis tested is that the logit of prevalence is homogeneous across the studies in a category. If this hypothesis is rejected, it can be concluded that prevalence varies in studies within the category considered, in which case the use of a random-effects model is justified. The package META of R software, which is devoted to meta-analytical methods, was used to compute the means of the logit (prevalence) distributions. In a second step, estimates of logit-transformed prevalence means were compared between categories using Z tests [45]. For these tests, a Bonferroni correction was applied to the threshold P value in order to prevent any inflation of the risk of a type I error (i.e. the risk of erroneously concluding that two means differ) because of multiple tests [45].
Temporal study
Among the set of 201 documents gathered through the systematic review, 25 reported the seasonal timing of ND epidemics (often along with recommendations about the optimal timing of vaccination). From these 25 documents, we were able to establish the months when distinct types of epidemiological periods (three types were defined: no epidemic, epidemic and epidemic peak) occurred in 19 African countries. All information on seasonality gathered from the literature is synthesized in Table 2. For each of the countries for which data on epidemiological periods were available, the timing of the rainy, dry-cold and dry-hot seasons was determined based on the monthly averages of rainfall and temperature over the last 100 years at three locations with contrasting latitudes (North, Central, South) in the country. These climate data were obtained from the World Climate website (http://www.worldclimate.com/). The epidemiological period and the climatic season data were cross-tabulated. For each of the nine possible combinations of type of epidemiological season × type of climatic season category, the corresponding contingency table cell was filled with the number of country × months reported in the 25 documents (Table 3). An independent χ2 test was computed from this contingency table. This test evaluates the null hypothesis H0: the type of epidemiological season to which a given month in a given country belongs is independent from the type of climatic season to which it belongs.
Table 2.
Epidemic periods indicated by (+) and vaccination sessions recommended (hatched cells) per country in Africa according to seasons (rainy, dry-cold, dry-hot)
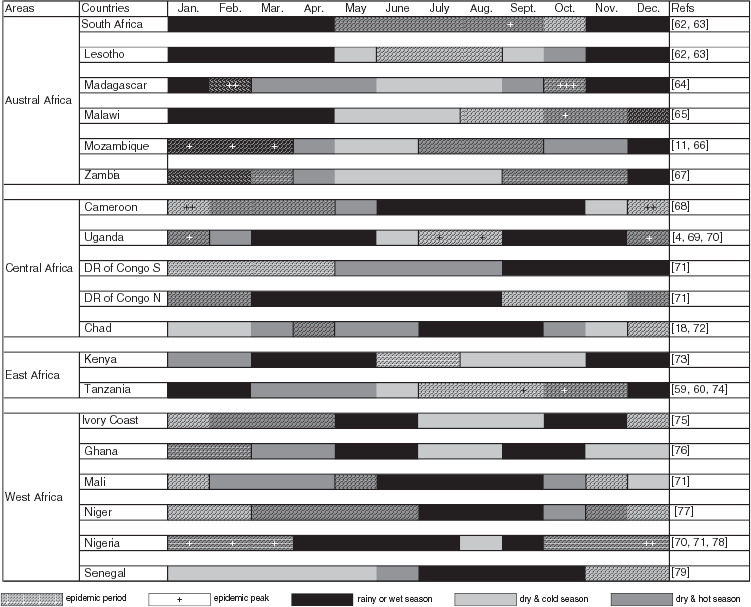
Table 3.
Contingency table crossing seasons and epidemic periods according to data found in the literature (see Table 2)
| Number of month × country | No epidemic | Epidemic | Peak epidemic |
|---|---|---|---|
| Rainy season | 78 | 2 | 4 |
| Dry and cold season | 39 | 27 | 5 |
| Dry and hot season | 31 | 32 | 10 |
Independence test χ4df2 = 50·7967, d.f. = 4, P < 0·0001.
RESULTS
Phylogeography
The phylogeographical analysis reveals the regionalization of NDV strains, their potential to evolve towards a higher pathogenicity from a local viral pool and suggests a risk for vaccine strains to provide new wild strains.
We obtained a segment of 89 bp length in which 55 variables sites, with 66 mutations that defined 53 haplotypes, were observed. Following the notation proposed by Aldous et al. [31] and previous studies [46–50], lineages 1–5, known to be found in Africa, were represented. The main haplotype is represented by II_1, followed by haplotypes V_2 and V_1 (corresponding to Aldous et al.'s classification [31, 51]) mainly found in southern Africa. Gene diversity (Hd) ranged from 0·335 in lineage 2 (L2) to 1 in L4. Low π n values were observed for both L1 (0·059) and L2 (0·022), whereas π n values were >0·1 for L3, L4 and L5. Only L2 showed a significant Tajima's D test (Table 4).
Table 4.
Polymorphic measures, Tajimas's D and Fu's Fs test of the major lineages in the African Newcastle strains
| Lineage | No. of samples | No. of haplotypes | Polymorphic sites | Genetic diversity | πn | Tajima's D | Fu's Fs |
|---|---|---|---|---|---|---|---|
| L1 | 11 | 7 | 11 | 0·873 | 0·059 | −0·595 | −1·462 |
| L2 | 30 | 7 | 19 | 0·335 | 0·022 | −2·523* | −1·91 |
| L3 | 16 | 11 | 26 | 0·933 | 0·146 | 0·091 | −1·208 |
| L4 | 3 | 3 | 9 | 1 | 0·109 | 0·108 | 0·588 |
| L5 | 73 | 24 | 41 | 0·897 | 0·121 | −0·676 | −3·197 |
P < 0·001.
Similar strain groupings were obtained using the maximum-likelihood approach (see Supplementary Fig. S1) and median-joining network (Fig. 3). The median-joining network showed that L1 is linked to L2 and that both lineages are clearly separated from the others (Figs 3, 4). L1 and L2 were found across the African continent. A regional distribution of the other lineages was observed. L4 was only found in two countries, Tanzania and Nigeria, from which haplotypes are genetically distant from each other. Within L3, the South African haplotypes are not directly linked to the L3 haplotypes from Tanzania. For L5, three branches are observed. One branch involves haplotypes found in southern countries, whereas the two remaining branches were from Western countries. The former were more genetically different than the others and appear to link haplotypes from lineages 3 and 4. The predominantly represented haplotype II_1 seems to be a central haplotype with a star-like topology while the two other haplotypes (V_2 and V_1) possess ‘pearl collar’ branches with inter-connected haplotypes.
Fig. 3.
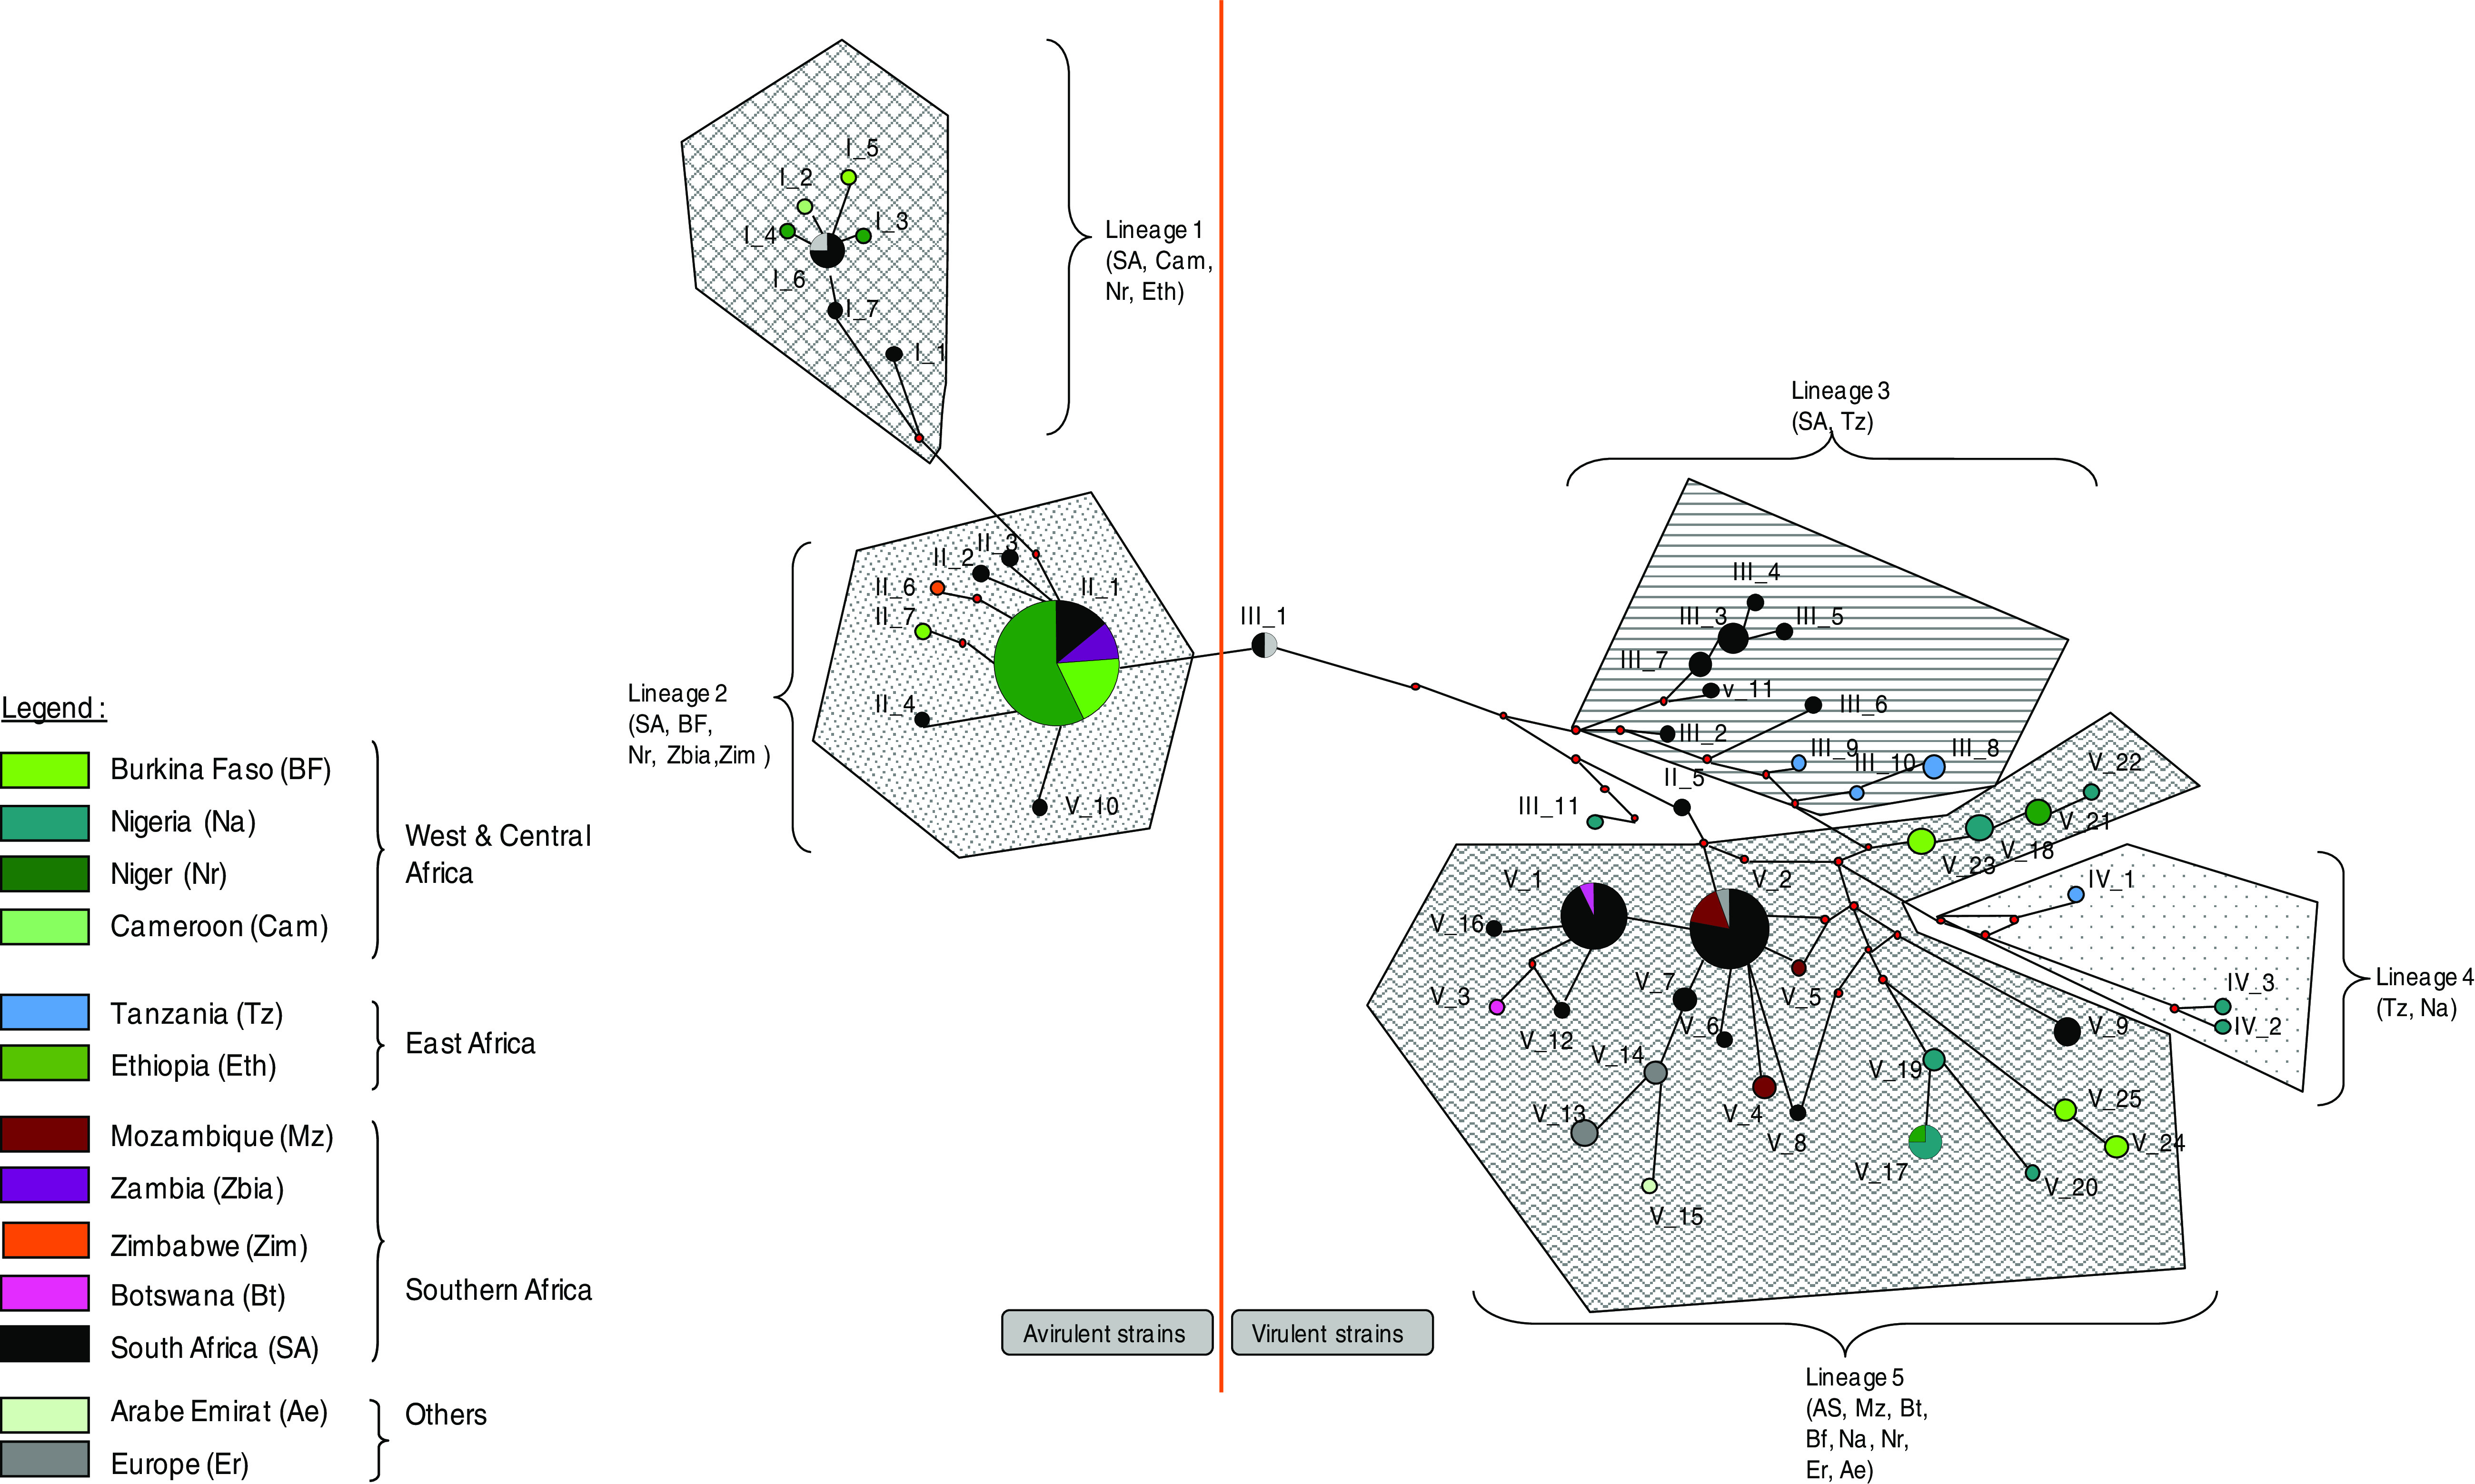
A median-joining network depicting the relationships between African Newcastle strains. Node size is proportional to haplotype frequencies in the dataset. Colours refer to countries. Red spots indicate a hypothetical missing haplotype and length of lines between nodes are proportional to the genetic distance between nodes.
Fig. 4.

Spatial distribution of the Newcastle strains in Africa.
Identification of risk factors for ND in Africa
A large number of risk factors were reported in the selected documents (Table 5). They included biological factors, such as poor physiological condition of the poultry or presence of different types of healthy carriers in the local domestic and wild avian community; environmental factors such as presence of surface water or of pollutants; and socioeconomic factors such as the occurrence of cultural or religious events that result in increased density of human and poultry contact networks. Because multi-disciplinary approaches are not common in epidemiology and risk factors are rarely quantified, it was difficult to rank these different risk factors.
Table 5.
Newcastle disease risk factors for backyard chicken identified in the literature
| Type of risk factor | Risk factors | Justification | Effect of the risk factor | Level of effect | Ref. |
|---|---|---|---|---|---|
| Biological | Physiological condition | Overall health status influences the susceptibility to disease | Better condition decreases ND susceptibility | Individual | [11, 59, 60] |
| Genetic variability | Host genetic processes regulate the host–pathogen interaction | Local breed more resistant than exotic breed to local ND strains | Breed | [80–82] | |
| Proportion of juveniles | Juveniles aged 6–20 weeks are the most vulnerable to ND infection | Higher proportion of juvenile increases ND susceptibility | Population | [4, 18, 65, 83] | |
| Population turn-over | Recruitment of immunologically naïve individuals influence ND susceptibility | High population turnover increases ND susceptibility | Population | [12, 84] | |
| Presence of vaccinal antibodies | Vaccination protects against natural infection | Vaccinated population less susceptible to ND infection.Risk of healthy carrier? | Population | [11] | |
| Co-infection | Pathogens interact directly or indirectly in the host | Variable: can be competition or synergy between pathogens | Population | [85] | |
| Domestic multi-species system | Different domestic species have different ND susceptibility | Variable: ducks more resistant than chicken and can maintain virus | Community | [12, 86, 87] | |
| Wild bird diversity | Up to 8000 bird species are susceptible to ND | Variable and largely unknown.. Healthy carrier or dilution effect of the risk? | Community | [5, 10, 11, 88] | |
| Environmental | Presence of surface water and faecal–oral transmission | ND viruses can be survive for days in water and faeces | When surface water is available, increased risk of ND transmission | Population, community | [4, 89, 90] |
| Shelter or no shelter | In shelter, chicken are kept together for an extended period of time | When sheltered, increased risk of ND transmission | Population | [60, 91] | |
| Pollution | Presence in the environment of toxin or contaminated food | Toxins and contaminated food can increase ND transmission risk | Population | [92] | |
| Socioeconomic | Movements, transport | Movements expose chicken to different environments with different ND strains | Increased chicken transport increases ND risk of infection | Population | [17, 59, 60, 67, 93] |
| Contacts, markets | Contacts between infected and naïve bird canlead to ND transmission | Increased contacts between individuals can increase the risk of transmission | Population | [4, 12, 64, 67, 70] | |
| Vaccination campaign | Vaccination team move from areas to areas, attenuated viruses can mutate to become pathogenic | Vaccination campaign can lead to an increase in ND risk | Population | [5, 81, 94] | |
| Cultural practices | Some human practices increase ND transmission | E.g. chicken faeces used to fertilize fields where naive chicken feed | Population | [4, 60, 67, 72] |
ND, Newcastle disease.
Pattern of occurence
Biogeographical patterns
The two first factorial components of the MCA accounted for 44% of the total variation. The projection of the variables on the factorial plane defined by these two components (see Supplementary Figs S3 and S4) revealed three distinct combinations of conditions: tropical or subtropical moist broadleaf forest regions were associated with studies covering the period 1995–2000 and low altitudes and high human and poultry densities (this combination of conditions hereafter will be referred to as category C1); tropical or subtropical grasslands and savannas and Mediterranean-type forests and shrublands were associated with studies covering the period prior to 1995, intermediate altitudes, and low human and poultry densities (hereafter referred to as C2); mountain grasslands and shrublands were associated with studies covering the period after 2000 and with high altitudes and moderate human and poultry densities (hereafter referred to as C3). Each statistical unit was associated with one of these combinations according to the position of its projection on the factorial plane defined by the two first factorial components.
The heterogeneity test was highly significant within each of the three categories of the classification generated with MCA (C1: Q = 241·52, d.f. = 20, P < 0·0001; C3: Q = 23·45, d.f. = 8, P = 0·0028; C2: Q = 561·55, d.f. = 34, P < 0·0001). The logit of prevalence thus varied strongly within study categories (Fig. 5). A random-effects model therefore was used to compute means of the logit of seroprevalence for each category that accounted for the sampling uncertainty associated with each primary estimate and for the heterogeneity in estimates. The estimates of the mean prevalence (obtained after an inverse logit transformation of the estimate obtained from the meta-analytical random-effects model) were equal to 0·67 [95% confidence interval (CI) 0·58–0·75]; 0·36 (95% CI 0·30–0·41) and 0·27 (95% CI 0·19–0·38) for categories C1, C2 and C3, respectively. The mean prevalence for category C1 was significantly higher than for the other two categories (ZC1vs.C2 = 5·76, P < 0·0001; ZC1vs.C3 = 5·35, P < 0·0001; Bonferroni-corrected threshold P = 0·015; Fig. 5), whereas the mean prevalence for category C2 did not differ significantly from that of C3 (ZC2vs.C3 = 1·38, P = 0·31; Fig. 5).
Fig. 5.

Individual study serological prevalences (open symbols) and estimates of mean serological prevalences (filled symbols) with associated 95% confidence interval for Newcastle disease in three biogeographical categories defined according to biome (BI), altitude (AL), poultry density (PD), human density (HD) and year (Y).
Seasonal patterns
The independence of type of climatic season and type of epidemic period was strongly rejected (χ4df2 = 50·7967, d.f. = 4, P < 0·0001). The epidemic period coincided with the dry season (either cold or hot) more often than expected under the independence hypothesis, and the non-epidemic period coincided with the rainy season more often than expected under the independence hypothesis.
DISCUSSION
The epidemiology of an infectious disease depends on the ecology and evolution of its causative pathogen and hosts as well as on the biotic and abiotic environment in which they occur. Meta-analytical approaches allow the role of such factors to be tested at a large regional scale, thereby benefitting from the sum of results of different studies, with different designs and locations. Meta-analyses need to be conducted carefully with regard to differences between approaches and the reliability of the estimates extracted from the literature. However, if cautiously conducted meta-analyses are able to reveal association patterns that are relevant for the management and control of an infectious disease that could not be identified by individual studies alone.
Although the results of our phylogeographical analysis should be interpreted with caution due to the small length of the sequence analysed, with 55 variable sites out of 89, these sequences were informative enough to detect interesting phylogeographical patterns which were compatible with the main lineages previously described by Aldous et al. [31]. Avirulent strains lineages (L1 and L 2) were found across the continent, while L3 and L4 were only found in three countries: South Africa–Tanzania and Nigeria–Tanzania, respectively. The number of branches observed in L5 raises questions regarding its homogeneity with at least one branch which appears to be more connected to L3 and L4 than to L5. Therefore if we consider that L5 is only represented by the branches including haplotypes V-2 and V-1 then this lineage is mainly present in southern Africa.
The virulent strain lineages L3, L4 and L5 appear to be ancient lineages that have reached a certain equilibrium as suggested by the ‘pearl collar’ patterns of their haplotypes and their high gene and nucleotide diversity values. By contrast, the star-like topology, low gene and nucleotide diversity values and significant Tajima's D test obtained for the avirulent strains of lineage L2 (Table 4, Fig. 4) highlight their recent expansion, an expansion that might have been facilitated by their genetic proximity to inoculate vaccines. Indeed, Snoeck et al. [48] proposed the hypothesis that lineages L1, L4, and L5 are ‘wild’ strains because vaccines of this type currently do not exist. In contrast, the central haplotype II_1 (L2) has the same genetic characteristics as the ‘La Sota’ vaccine frequently used in Africa to control ND [48]. A possible explanation is that the vaccine used during vaccination campaigns might have played a role in the maintenance, dispersion, and diffusion of avirulent viral strains on the continent. Vaccination could even have adverse consequences because through a few simple point mutations virulent strains could emerge from such avirulent strains [5]. Moreover, the genetic proximity of La Sota virus with the widely distributed avirulent haplotype II_1 (L2) implies that the La Sota vaccine is probably extremely well adapted to avirulent strains that circulate in the environment. Under this hypothesis, we should question the efficacy of vaccination campaigns using vaccines that are primarily efficient against avirulent strains frequently circulating in the environment and for which hosts are likely to have developed natural immunity. Although numerous vaccines exist to control the disease on the continent, each with different antigenic properties depending on the region in which they are used (see Supplementary Table S3 for vaccines used in different African countries), the genetic characteristics of vaccines such as La Sota raise the question of how well vaccines are adapted to the circulating viral strains.
The results of our geographical meta-analysis should be considered with caution because the temporal distribution of the samplings that produced the serological prevalence estimates found in the literature was not homogeneous over the three sets of geographical characteristics defined in our analysis. Consequently, the geographical prevalence pattern revealed by our analysis could be confounded by a temporal pattern. Moreover, since our explanatory variables were tightly interconnected, the interpretation of their respective effects is complicated. We can, however, discuss the potential role of each of them on the epidemiology of ND. Our results suggest that areas that are the most favourable for the persistence and spread of NDV in backyard poultry are characterized by low-altitude, tropical wet forest biomes and high poultry and human densities. This pattern is consistent with empirical evidence [52, 53] and theoretical results [54] that have demonstrated better spread of density-dependent infectious disease such as ND and avian influenza when host densities are high. It is also in agreement with the fact that humid conditions are conducive for ND outbreaks because they enhance virus survival in the environment and viral transmission through the faecal–oral route [5, 55]. Another factor that could explain high serological prevalence rates in wet forest biomes is the increasing disruption of these sylvatic ecosystems for logging and other purposes and the associated colonization by humans and their domestic species (i.e. backyard and livestock) of areas at the edge of wild ecosystems. Such colonization creates novel interactions among host species and between hosts and pathogens that could promote the transmission and maintenance of emerging NDV strains [56].
Our meta-analysis allowed establishing at the continental level that ND epizootics occurred most often during dry seasons. The association between dry seasons and the occurrence of infectious diseases in Africa has already been observed for ND in poultry [4] and avian influenza in wild birds [57, 58]. This seasonal pattern could at first appear to be contradictory to the geographical association between high ND serological prevalence and wet biomes. However, although wet conditions are likely to be optimal for the survival of the virus in the environment [5, 55], the dry season might be the time of year when coincidence of favourable conditions, in terms of virus presence in the environment, susceptibility of the poultry population, and transmissibility all occur. Indeed, during the dry seasons, non-permanent water points disappear, which results in the gathering of wild and domestic birds in high densities at the few remaining available perennial water points. It may then be possible that infected poultry, wild birds or other animals either transmit NDV by the respiratory route through close contact or contaminate a common water source (e.g. communal ponds in villages), which then becomes a source of infection through the faecal–oral route for other birds [4, 57, 58]. Moreover, the dry seasons in Africa are particularly harsh and put wild and domestic animals under severe stress. Temperatures can be >30 °C for long periods and food availability, an important factor for free-ranging backyard scavenging chickens, is decreasing as the dry season is progressing. These environmental conditions might weaken immunity and increase poultry susceptibility to ND [11, 59, 60].
Other potentially important risk factors for the epidemiology of ND in Africa could only be explored qualitatively in our study (Table 5). In particular, socioeconomic factors such as cultural practices, trading modalities, as well as poultry-rearing and disease-management practices (e.g. vaccination) can play an important role in the transmission and maintenance of ND in rural poultry production systems. Multi-disciplinary quantitative approaches are needed to rank these different risk factors.
Recently, avian influenza has received more attention worldwide than ND. Africa has not been spared by the highly pathogenic avian influenza pandemic even if ND still caused the death of more poultry on the continent during the same period [61]. Interestingly, ND and avian influenza share epidemiological traits: mortality and morbidity patterns, non-pathognomonic symptoms and transmission modes. Some of the risk factors identified in the present study also support this similarity (e.g. relationship with chicken and human density, seasonal profiles). It is therefore recommended that epidemiological investigation of both diseases should be combined. First, this could improve diagnosis, as excluding one pathogen almost confirms the other one. Second, as both pathogens share epidemiological traits, competition for hosts between them can be an important epidemiological factor.
Our study brings new knowledge on eco-epidemiological research with the use of appropriate statistical tools for integrating large-scale data and depicting global patterns. This type of study could be very useful in improving surveillance strategies, in particular for neglected diseases, in areas where data are lacking. We believe that animal disease management with more insight on ecological processes, leading to the mapping of risk areas, period and strain evolution may provide some innovative solutions to veterinary and public health sciences.
Supplementary Material
Supplementary information supplied by authors.
ACKNOWLEDGEMENTS
This study was supported by the GRIPAVI project, financed by the French Ministry of Foreign and European Affairs and managed by Cirad. We thank all of members of the AGIRs Research Unit at CIRAD, especially Camille Danes, Marie Gely, Flavie Goutard and Marisa Peyre. We also thank Grace Delobel for assistance with English language version of the paper.
SUPPLEMENTARY MATERIAL
For supplementary material accompanying this paper visit http://dx.doi.org/10.1017/S0950268812002610.
DECLARATION OF INTEREST
None.
REFERENCES
- 1.OIE. Newcastle disease: aetiology epidemiology diagnosis prevention and control references. OIE Technical Disease Cards 2009; last updated October 2009.
- 2.Macpherson LW. Some observations on the epizootiology of Newcastle disease. Canadian Journal of Comparative Medicine and Veterinary Science 1956; 20: 155–168. [PMC free article] [PubMed] [Google Scholar]
- 3.Kuiken T. Review of Newcastle disease in cormorants. Waterbirds 1999; 22: 333–347. [Google Scholar]
- 4.Awan MA, et al. The epidemiology of Newcastle disease in rural poultry – a review. Avian Pathology 1994; 23: 405–423. [DOI] [PubMed] [Google Scholar]
- 5.Alexander DJ. Newcastle disease and other avian paramyxoviruses. Revue Scientifique et Technique de l'Office International des Epizooties 2000; 19: 443–462. [DOI] [PubMed] [Google Scholar]
- 6.Alexander DJ. Newcastle disease in the European Union 2000 to 2009. Avian Pathology 2011; 40: 547–558. [DOI] [PubMed] [Google Scholar]
- 7.CNRS. Newcastle Disease [in French]. Centre national de Recherche Scientifique.
- 8.Roy P, et al. Velogenic Newcastle disease virus in captive wild birds. Tropical Animal Health and Production 30: 299–303. [DOI] [PubMed] [Google Scholar]
- 9.Zeng X, et al. Monitoring influenza A virus and Newcastle disease virus in migratory waterfowls in Sanjiang natural reserve of Heilongjiang Province. Wei Sheng Wu Xue Bao 2008; 48: 1403–1407. [PubMed] [Google Scholar]
- 10.Kuiken T, et al. Excretion of pathogenic Newcastle disease virus by double-crested cormorants (Phalacrocorax auritus) in absence of mortality or clinical signs of disease. Avian Pathology 1998; 27: 541–546. [DOI] [PubMed] [Google Scholar]
- 11.Mavale AP. Country report: Mozambique. SADC Planning workshop on Newcastle disease control in village chickens, Maputo, Mozambique, 6–9 March 2000. ACIAR Proceedings, 2001, No. 103, pp. 20–25. [Google Scholar]
- 12.Spradbrow PB. Epidemiology of Newcastle disease and the economics of its control. Poultry as a tool in poverty eradication and promotion of gender equality 1999; Proceedings of a workshop, 22–26 March 1999, Tune, Denmark, pp. 165–173. [Google Scholar]
- 13.Miller PJ, et al. Newcastle disease: Evolution of genotypes and the related diagnostic challenges. Infection Genetics and Evolution 2010; 10: 26–35. [DOI] [PubMed] [Google Scholar]
- 14.Piacenti AM, et al. Pathogenesis of Newcastle Disease in Commercial and specific pathogen-free turkeys experimentally infected with isolates of different virulence. Veterinary Pathology Online 2006; 43: 168–178. [DOI] [PubMed] [Google Scholar]
- 15.Zhu W, et al. Phylogenetic and pathogenic analysis of Newcastle disease virus isolated from house sparrow (Passer domesticus) living around poultry farm in southern China. Virus Genes 2010; 40: 231–235. [DOI] [PubMed] [Google Scholar]
- 16.OIE. Newcastle disease. World Organization for Animal Health – Terrestrial Manual 2012; chapter 2.3.14.
- 17.Leighton F, Heckert RA. Newcastle disease and related avian paramyxoviroses. In: Thomas N, Hunter NB, Atkinson CT, eds. Infectious Diseases of Wild Birds. Ames, Iowa, USA: Blackwell Publishing, 2007, pp. 3–16. [Google Scholar]
- 18.Bleich EG, et al. The FAO special programme for food security: livestock diversification – a case study in Chad. World's Poultry Science Journal 2005; 61: 23–29. [Google Scholar]
- 19.Mekonnen H, et al. Assessment of the nutritional status of indigenous scavenging chickens in Ada'a district, Ethiopia. Tropical Animal Health and Production 2010; 42: 123–130. [DOI] [PubMed] [Google Scholar]
- 20.FAO. GLiPHA, Global livestock production and health atlas (http://kids.fao.org/glipha/). [DOI] [PubMed]
- 21.Sayila A. Africa to benefit from poultry scheme. World Poultry 1999; 15: 10–1. [Google Scholar]
- 22.Spradbrow PB. Thermostable Newcastle disease in village chickens. Poultry Science Reviews 1994; 5: 57–96. [Google Scholar]
- 23.Khalafalla AI, Abdel Aziz SA, El Hassan SM. Increasing family poultry production in the Sudan through Newcastle disease control and improving housing. Improving farmyard poultry production in Africa: interventions and their economic assessment, 2004; Proceedings of a final research coordination meeting organized by the Joint FAO/IAEA Division of Nuclear Techniques in Food and Agriculture. Vienna, 24–28 May 2004. International Atomic Energy Agency, February 2006, pp. 220–227. [Google Scholar]
- 24.Alders RG, Pym RAE. Village poultry: still important to millions, eight thousand years after domestication. In: 23rd World Poultry Congress. Brisbane, Australia: Cambridge University Press, 2008, pp. 181–90. [Google Scholar]
- 25.Kaleta EF, Baldauf C. Newcastle disease in free-living and pet birds. In: Alexander DJ, ed. Newcastle Disease, 1st edn. Boston, MA: Kluwer Academic Publishers, 1988, pp. 197–246. [Google Scholar]
- 26.Njagi LW, et al. A retrospective study of factors associated with Newcastle Disease outbreaks in village indigenous chickens. Bulletin of Animal Health and Production in Africa 2010; 58: 22–33. [Google Scholar]
- 27.Thompson JD., et al. CLUSTAL W:improving the sensitivity of progressive multiple sequence alignment through sequence weighting, position-specific gap penalties and weight matrix choice. Nucleic Acids Research 1994; 22: 4673–4680. [DOI] [PMC free article] [PubMed] [Google Scholar]
- 28.Hall TA. BioEdit: a user-friendly biological sequence alignment editor and analysis program for Windows 95/98/NT. Nucleic Acids Symposium Series 1999; 41: 95–98. [Google Scholar]
- 29.Rozas J., et al. DnaSP, DNA polymorphism analyses by the coalescent and other methods. Bioinformatics 2003; 19: 2496–2497. [DOI] [PubMed] [Google Scholar]
- 30.Network. 4.5. (http://wwwfluxus-engineeringcom/sharenethtm).
- 31.Aldous EW, et al. A molecular epidemiological study of avian paramyxovirus type 1 (Newcastle disease virus) isolates by phylogenetic analysis of a partial nucleotide sequence of the fusion protein gene. Avian Pathology 2003; 32: 239–257. [DOI] [PubMed] [Google Scholar]
- 32.Tajima F. Statistical method for testing the neutral mutation hypothesis by DNA polymorphism. Genetics 1989; 123: 585–595. [DOI] [PMC free article] [PubMed] [Google Scholar]
- 33.Fu YX. Statistical tests of neutrality of mutations against population growth, hitchhiking and background selection. Genetics 1997; 147: 915–925. [DOI] [PMC free article] [PubMed] [Google Scholar]
- 34.Schneider S, Roessli D, Excoffier L. Arlequin: a software for population genetics data analysis, version 2.000. 2000. Genetics and Biometry Laboratory, Department of Anthropology, University of Geneva. [Google Scholar]
- 35.Moher D, et al. Epidemiology and reporting characteristics of systematic reviews. PLoS Medicine 2007; 4: 447–455. [DOI] [PMC free article] [PubMed] [Google Scholar]
- 36.National Geospatial Intelligence Agency. geographical location (http://earth-info.nga.mil/gns/html/namefiles.htm).
- 37.Poultry density Google earth. (http://mapsandearth.blogspot.com/2008/09/google-earth-poultry-density-worldwide.html). 2009; data SIO, NOAA US Navy, NGA GEBCO. © 2009 Google; ©2009 Tele Atlas, © Europa technologies.
- 38.Human density Google earth. (http://www.gearthblog.com/blog/archives/2007/12/population_maps_for_google_earth.html) 2009; data SIO, NOAA US Navy, NGA GEBCO. © 2009 Google; ©2009 Tele Atlas, © Europa technologies.
- 39.Olson DM, et al. Terrestrial ecoregions of the worlds: a new map of life on Earth. Bioscience 2001; 51: 933–938. [Google Scholar]
- 40.Chessel D, et al. The ade4 package – I: one-table methods. R News 2004; vol. 4/1, June. [Google Scholar]
- 41.Dray S, Dufour AB. The ade4 package: implementing the duality diagram for ecologists. Journal of Statistical Software 2007; 22. [Google Scholar]
- 42.R Development Core Team. R: a language and environment for statistical computing. R Foundation for Statistical Computing, Vienna, Austria, 2007. (http://www.R-project.org). [Google Scholar]
- 43.Chang BH, et al. Meta-analysis of binary data: which within study variance estimate to use? Statistics in Medicine 2001; 20: 1947–1956. [DOI] [PubMed] [Google Scholar]
- 44.Sutton AJ, Higgins JPI. Recent developments in meta-analysis. Statistics in Medicine 2008; 27: 625–650. [DOI] [PubMed] [Google Scholar]
- 45.Crawley M. (ed.). The R Book. Imperial College London at Silwood Park, UK, 2007. [Google Scholar]
- 46.Abolnik C, et al. A phylogenetic study of South African Newcastle disease virus strains isolated between 1990 and 2002 suggests epidemiological origins in the Far East. Archives of Virology 2004; 149: 603–619. [DOI] [PubMed] [Google Scholar]
- 47.de Almeida R, et al. Africa, a reservoir of new virulent strains of Newcastle disease virus? Vaccine 2009; 27: 3127–3129. [DOI] [PubMed] [Google Scholar]
- 48.Snoeck CJ, et al. Newcastle disease virus in West Africa: new virulent strains identified in non-commercial farms. Archives of Virology 2009; 154: 47–54. [DOI] [PubMed] [Google Scholar]
- 49.Otim MO, et al. Molecular characterization and phylogenetic study of Newcastle disease virus isolates from recent outbreaks in Eastern Uganda. Journal of Clinical Microbiology 2004; 42: 2802–2805. [DOI] [PMC free article] [PubMed] [Google Scholar]
- 50.Herczeg JWE, Bragg RR, Travassos Dias PM, Hadjiev G, Werner O, and Lomniczi B. Two novel genetic groups (VIIb and VIII) responsible for recent Newcastle disease outbreaks in Southern Africa, one (VIIb) of which reached Southern Europe. Archives of Virology 1999; 144: 2087–2099. [DOI] [PubMed] [Google Scholar]
- 51.Aldous EW, Alexander DJ. Detection and differentiation of Newcastle disease virus (avian paramyxovirus type 1). Avian Pathology 2001; 30: 117–128. [DOI] [PubMed] [Google Scholar]
- 52.Gilbert M, et al. Free-grazing ducks and highly pathogenic avian influenza, Thailand. Emerging Infectious Diseases 2006; 12: 227–334. [DOI] [PMC free article] [PubMed] [Google Scholar]
- 53.Tiensin T, et al. Ecologic risk factor investigation of clusters of avian influenza A (H5N1) virus infection in Thailand. Journal of Infectious Diseases 2009; 199: 1735–1743. [DOI] [PubMed] [Google Scholar]
- 54.McCallum H, et al. How should pathogen transmission be modelled? Trends in Ecology and Evolution 2001; 16: 295–300. [DOI] [PubMed] [Google Scholar]
- 55.Hugh-Jones M, et al. The evidence for the airborne spread of Newcastle disease. Journal of Hygiene (Cambridge) 1973; 71: 325–39. [DOI] [PMC free article] [PubMed] [Google Scholar]
- 56.Despommier D, Ellis BR, Wilcox B. The role of ecotones in emerging infectious diseases. EcoHealth 2007; 3: 281–289. [Google Scholar]
- 57.Cappelle J, et al. Circulation of avian influenza viruses in wild birds in Inner Niger Delta, Mali. Influenza and Other Respiratory Viruses 2012; 6: 240–244. [DOI] [PMC free article] [PubMed] [Google Scholar]
- 58.Caron A, et al. Persistence of low pathogenic avian influenza virus in waterfowl in a Southern African ecosystem. EcoHealth 2011; 8: 109–115. [DOI] [PubMed] [Google Scholar]
- 59.Msami HM, Wambura P, Minga UM. Evaluation of health and productivity of family poultry in eastern Tanzania and the impact of controlling Newcastle disease. Improving farmyard poultry production in Africa: interventions and their economic assessment, 2006. Proceedings of a final research coordination meeting organized by the Joint FAO/IAEA Division of Nuclear Techniques in Food and Agriculture, Vienna, 24–28 May 2004. International Atomic Energy Agency, February 2006, pp. 256–65. [Google Scholar]
- 60.Yongolo MGS, Maeda Machangu A, Minga UM. Newcastle disease and infectious Bursal disease among free range village chickens in Tanzania. In: Characteristics and Parameters of Family Poultry Production in Africa. IAEA, Vienna, Austria, 1996, pp. 107–116. [Google Scholar]
- 61.Alexander DJ, Brown IH. History of highly pathogenic avian influenza. Revue Scientifique et Technique de l'Office International des Epizooties 2009; 28: 19–38. [DOI] [PubMed] [Google Scholar]
- 62.Tsibane T. Country report: South Africa. SADC planning workshop on Newcastle disease control in village chickens, Maputo, Mozambique, 6–9 March 2000. ACIAR Proceedings, 2001, No. 103, pp. 32–35. [Google Scholar]
- 63.Thekisoe MMO, et al. Different approaches to the vaccination of free ranging village chickens against Newcastle disease in Qwa-Qwa, South Africa. Veterinary Microbiology 2004; 101: 23–30. [DOI] [PubMed] [Google Scholar]
- 64.Maminiaina OF, et al. Epidemioloy of Newcastle disease in village poultry farming in Madagascar. Revue Scientifique et Technique de l'Office International des Epizooties 2007; 26: 691–700. [PubMed] [Google Scholar]
- 65.Kampeni FL. Country report: Malawi. SADC planning workshop on Newcastle disease control in village chickens, Maputo, Mozambique, 6–9 March 2000. ACIAR Proceedings 2001, No. 103, pp. 15–16. [Google Scholar]
- 66.Dias PT, et al. Laboratory and field trials with thermostable live NCD vaccines in Mozambique. SADC planning workshop on Newcastle disease control in village chickens, Maputo, Mozambique, 6–9 March 2000. ACIAR Proceedings, 2001, No. 103, pp. 91–96. [Google Scholar]
- 67.Sogolo A, Katongo JC. Country report: Zambia. SADC planning workshop on Newcastle disease control in village chickens, Maputo, Mozambique, 6–9 March 2000. ACIAR Proceedings, 2001, No. 103, pp. 43–45. [Google Scholar]
- 68.Nzietchueng ST, et al. Introduction and dissemination of Newcastle disease virus in north Cameroon: models and qualitative risk analysis. Does control of animal infectious risks offer a new international perspective? In: Proceedings of the 12th International Conference of the Association of Institutions of Tropical Veterinary Medecine, Montpellier, CIRAD AITVM, 2007, pp. 69–72. [Google Scholar]
- 69.Mukiibi MG. Epidemiology of Newcastle disease and the need to vaccinate local chickens in Uganda. Proceedings no. 39: Newcastle disease in village chickens. In: Proceedings of an International Workshop. Kuala Lumpur, Malaysia, 6–10 October, 1991. [Google Scholar]
- 70.Kama KL, et al. Country report: Angola. SADC planning workshop on Newcastle disease control in village chickens, Maputo, Mozambique, 6–9 March, 2000. ACIAR Proceedings, 2001, No. 103, pp. 3–4. [Google Scholar]
- 71.Sylla M, et al. Rural Newcastle disease epidemiology in Mali [in French]. Revue d'Elevage et de Médecine Vétérinaire des PaysTropicaux 2003; 56: 7–12. [Google Scholar]
- 72.Maho A, et al. Newcastle disease in southern Chad: peak epidemic periods and the impact of vaccination. Revue Scientifique et Technique de l'Office International des Epizooties 2004; 23: 777–782. [PubMed] [Google Scholar]
- 73.Musiime JT. The Poultry industry in Kenya with particular reference to the Newcastle Disease problem. Proceedings no. 39: Newcastle disease in village chickens, In: Proceedings of an International Workshop. Kuala Lumpur, Malaysia, 6–10 October 1991. [Google Scholar]
- 74.Buza JJ, Mwamuhehe HA. Country report: Tanzania. SADC planning workshop on Newcastle disease control in village chickens, Maputo, Mozambique, 6–9 March, 2000. ACIAR Proceedings, 2001, No. 103, pp. 38–42. [Google Scholar]
- 75.Danho T, et al. Amelioration de la production en aviculture familiale cas de la côte d'ivoire. In: Improving farmyard poultry production in Africa – interventions and their economic assessment, 2004; FAO/IAEA, pp. 84–89. [Google Scholar]
- 76.Aboe PAT, et al. Free-range village chickens on the Accra plains, Ghana: their husbandry and productivity. Tropical Animal Health and Production 2006; 38: 235–48. [DOI] [PubMed] [Google Scholar]
- 77.Idi A, et al. Seroprevalence of Newcastle disease and infectious bursal disease in local chickens commercialised in Niamey, Niger. Research Report – INFPD – International Network for Family Poultry Development. Newsletter vol, 9, No. 1 (January– March), 1999.
- 78.Orajaka LJE, et al. Seroprevalence of Newcastle disease in local chikens from southeast derived savannah zone of Nigeria. Revue d'Elevage et de Médecine Vétérinaire des Pays Tropicaux 1999; 52: 185–188. [Google Scholar]
- 79.Arbelot B, et al. Survey of the main serological prevalence of avian diseases in Senegal [in French]. Revue d'Elevage et de Médecine Vétérinaire des Pays Tropicaux 1997; 50: 197–203. [Google Scholar]
- 80.Hassan MK, et al. Genetic resistance of Egyptian chickens to infectious bursal disease and Newcastle disease. Tropical Animal Health and Production 2004; 36: 1–9. [DOI] [PubMed] [Google Scholar]
- 81.Biswas PK, et al. A longitudinal study of the incidence of major endemic and epidemic diseases affecting semi-scavenging chickens reared under the participatory livestock development project areas in Bangladesh. Avian Pathology 2005; 34: 303–12. [DOI] [PubMed] [Google Scholar]
- 82.Carrasco ADT, et al. Experimental infection of Newcastle disease virus in pigeons (Columba livia): humoral antibody response, contact transmission and viral genome shedding. Veterinary Microbiology 2008; 129: 89–96. [DOI] [PubMed] [Google Scholar]
- 83.Tadesse S, Ashenafi H, Aschalew Z. Seroprevalence study of Newcastle disease in local chikens in central Ethiopia. International Journal of Applied Research in Veterinary Medecine 2005; 3(1). [Google Scholar]
- 84.Oakley RD. The limitations of a feed/water based heat-stable vaccine delivery system for Newcastle disease-control strategies for backyard poultry flocks in sub-Saharan Africa Preventive Veterinary Medicine 2001; 49: 271–279. [DOI] [PubMed] [Google Scholar]
- 85.Horning G, et al. Investigations on the influence of helminth parasites on vaccination of chickens against Newcastle disease virus under village conditions. Tropical Animal Health and Production 2003; 35: 415–424. [DOI] [PubMed] [Google Scholar]
- 86.IAEA/FAO. Improvement of health and management of family poultry production in Africa. In: Dwinger RH, Martin MJ, eds. Proceeding of IAEA/FAO Research Coordination Meeting no. 1, February 1999, Rabat, Morocco, 1999. [Google Scholar]
- 87.Kingstion DJ, Dharsana R. Newcastle disease infection in Indonesian ducks. Philippines Journal of Veterinary Medecine, 1979; 18: 125–30. [Google Scholar]
- 88.Takakuwa H, et al. Potentially virulent Newcastle disease viruses are maintained in migratory waterfowl populations. Japanese Journal of Veterinary Research 1998; 45: 207–215. [PubMed] [Google Scholar]
- 89.Otim MO, et al. A preliminary study of the role of ducks in the transmission of Newcastle disease virus to in-contact rural free-range chickens. Tropical Animal Health and Production 2006; 38: 285–289. [DOI] [PubMed] [Google Scholar]
- 90.Manchang TK, Abdu PA, Saidu L. Epidemiology and clinicpathologic manifestations of Newcastle disease in Nigerian local chickens. Revue d'Elevage et de Médecine Vétérinaire des Pays Tropicaux 2004; 57: 35–39. [Google Scholar]
- 91.Spradbrow PB. The epidemiology of Newcastle disease in village chickens. SADC Planning Workshop on Newcastle Disease Control in Village Chickens, Maputo, Mozambique, 6–9 March, 2000. ACIAR Proceedings, 2001, No. 103, pp. 53–55. [Google Scholar]
- 92.Azzam AH, et al. Correlation between Newcastle vaccines and pesticides pollution in village chickens. In: Improving farmyard poultry production in Africa – interventions and their economic assessment, 2004. FAO/IAEA, pp. 56–66. [Google Scholar]
- 93.Nwanta JA, Abdu PA, Ezema WS. Epidemiology,challenges and propects for control of Newcastle disease in village poultry in Nigeria. World's Poultry Science Journal 2008; 64: 119–127. [Google Scholar]
- 94.Oakeley R. The socio-economic environment of Newcastle disease control strategies backyard poultry systems. Poultry as a tool in poverty eradication and promotion of gender equality, 1999, Proceedings of a workshop. [Google Scholar]
- 95.Barre J, Delor V.Newcastle disease in wildlife (unpublished document), 2004.
- 96.Martin PAJ. The epidemiology of Newcastle disease in village chickens. In: Spradbrow PB, ed., ACIAR Proceedings No. 39, Newcastle disease in village chickens. Proceedings of an International Workshop, Kuala Lumpur, Malaysia, 6–10 October 1991. [Google Scholar]
- 97.Olesiuk OM. Influence of environmental factors on viability of Newcastle disease virus. American Journal of Veterinary Research 1951; 12: 152–155. [PubMed] [Google Scholar]
Associated Data
This section collects any data citations, data availability statements, or supplementary materials included in this article.
Supplementary Materials
Supplementary information supplied by authors.