

SUMMARY
The domestic poultry population in Vietnam has been vaccinated against highly pathogenic avian influenza (HPAI) H5N1 since 2005. Since then, outbreaks have continued to occur without a clear understanding of the mechanisms involved. The general objective of this study was to understand the epidemiology of the disease in the context of vaccination and to draw some conclusions about vaccination efficacy in the domestic poultry population of the Red River Delta area. Five cross-sectional surveys to measure the serological and virological prevalence in vaccinated and unvaccinated poultry were performed from the end of 2008 to June 2010. The global seroprevalence was 24% (95% confidence interval 19·9–28·2). Determinants of vaccine immunogenicity were identified separately in chickens and ducks as well as determinants of the seroconversion in unvaccinated birds. The results highlight the difficulties in maintaining good flock immunity in poultry populations using inactivated vaccine in the field with two vaccination rounds per year, and in preventing circulation of virus in co-existing unvaccinated poultry.
Key words: Avian flu, control, vaccination (immunization)
INTRODUCTION
Vietnam, with a poultry population of over 250 million [1], faced its first outbreaks of highly pathogenic avian influenza (HPAI) H5N1 at the end of 2003 [2]. By the end of 2009, five epidemic waves had occurred in domestic poultry [2]. The HPAI H5N1 viruses isolated in Vietnam from the initial outbreaks belonged to haemagglutinin (HA) clade 1 (genotype z) [3, 4] according to the nomenclature system of the HA lineage protein gene [5]. Those viruses derived their HA genes from the Gs/GD/1/96-like lineage [6]. From 2007 until 2010, clade 2.3.4 was predominant in Northern Vietnam [3, 4, 7], although from 2008, clade 7 and later clade 2.3.2, were sporadically detected [7].
To limit the number of outbreaks and the risk of transmission to humans, the Government of Vietnam decided to use vaccination from the end of 2005 until 2011 following the detection of 2.3.2 vaccine-resistant strains [8]. Vaccination was organized by the veterinary services following bi-annual vaccination campaigns with the vaccine provided free of charge to farmers who only paid for the service. During the study period (2008–2010), chickens and ducks were vaccinated with an inactivated H5N1 vaccine generated from a genetically modified reassortant H5N1 low pathogenic virus, A/Harbin/Re-1/2003 (designated Re-1; Weike Biological Company of the Harbin Veterinary Research Institute, Chinese Academy of Agricultural Sciences, China) that derives its HA and neuraminidase (NA) genes from the GS/GD/96 virus referred to as HA clade 0 [9]. Despite a period of about a year without an outbreak, Northern Vietnam faced a significant epidemic in 2007 [2] and since then, outbreaks have continued to occur sporadically without a clear understanding of the mechanisms involved. Possible reasons include low level of virus circulation in the vaccinated population, and regular re-introduction from neighbouring countries, or a combination of both.
The general objective of this study was to understand the epidemiology of the disease in Northern Vietnam in the context of vaccination and to draw some conclusions about vaccination efficacy in the domestic poultry population of the Red River Delta area.
The specific objectives were to: (1) assess, through serological monitoring, the effect of the vaccination strategy (protocol and vaccine used) on the immunity of the population; (2) identify the determinants of the vaccine immunogenicity under field conditions through an investigation of the variation in H5N1 HI titres in vaccinated birds [10]; and (3) measure the level of virus circulation in vaccinated and co-existing unvaccinated populations and its determinants, by means of virological follow-up of the whole population and serological monitoring of the unvaccinated population.
MATERIALS AND METHODS
Study design overview
During 2008–2010, repeated cross-sectional surveys were conducted in order to study the patterns of HPAI H5N1 serological and virological prevalences in the domestic poultry population of the Red River Delta region (Northern Vietnam). Five sampling campaigns were performed: mid-December 2008 (C1), end of January 2009 (C2), end of March 2009 (C3), early June 2009 (C4) and finally June 2010 (C5), in an outbreak recrudescence context [11].
Study sites
The study site consisted of nine communes located within four districts from two provinces (Fig. 1). These communes were selected because they were considered to be at risk for HPAI infection due to previous virus circulation at the early stage of epidemic waves.
Fig. 1.
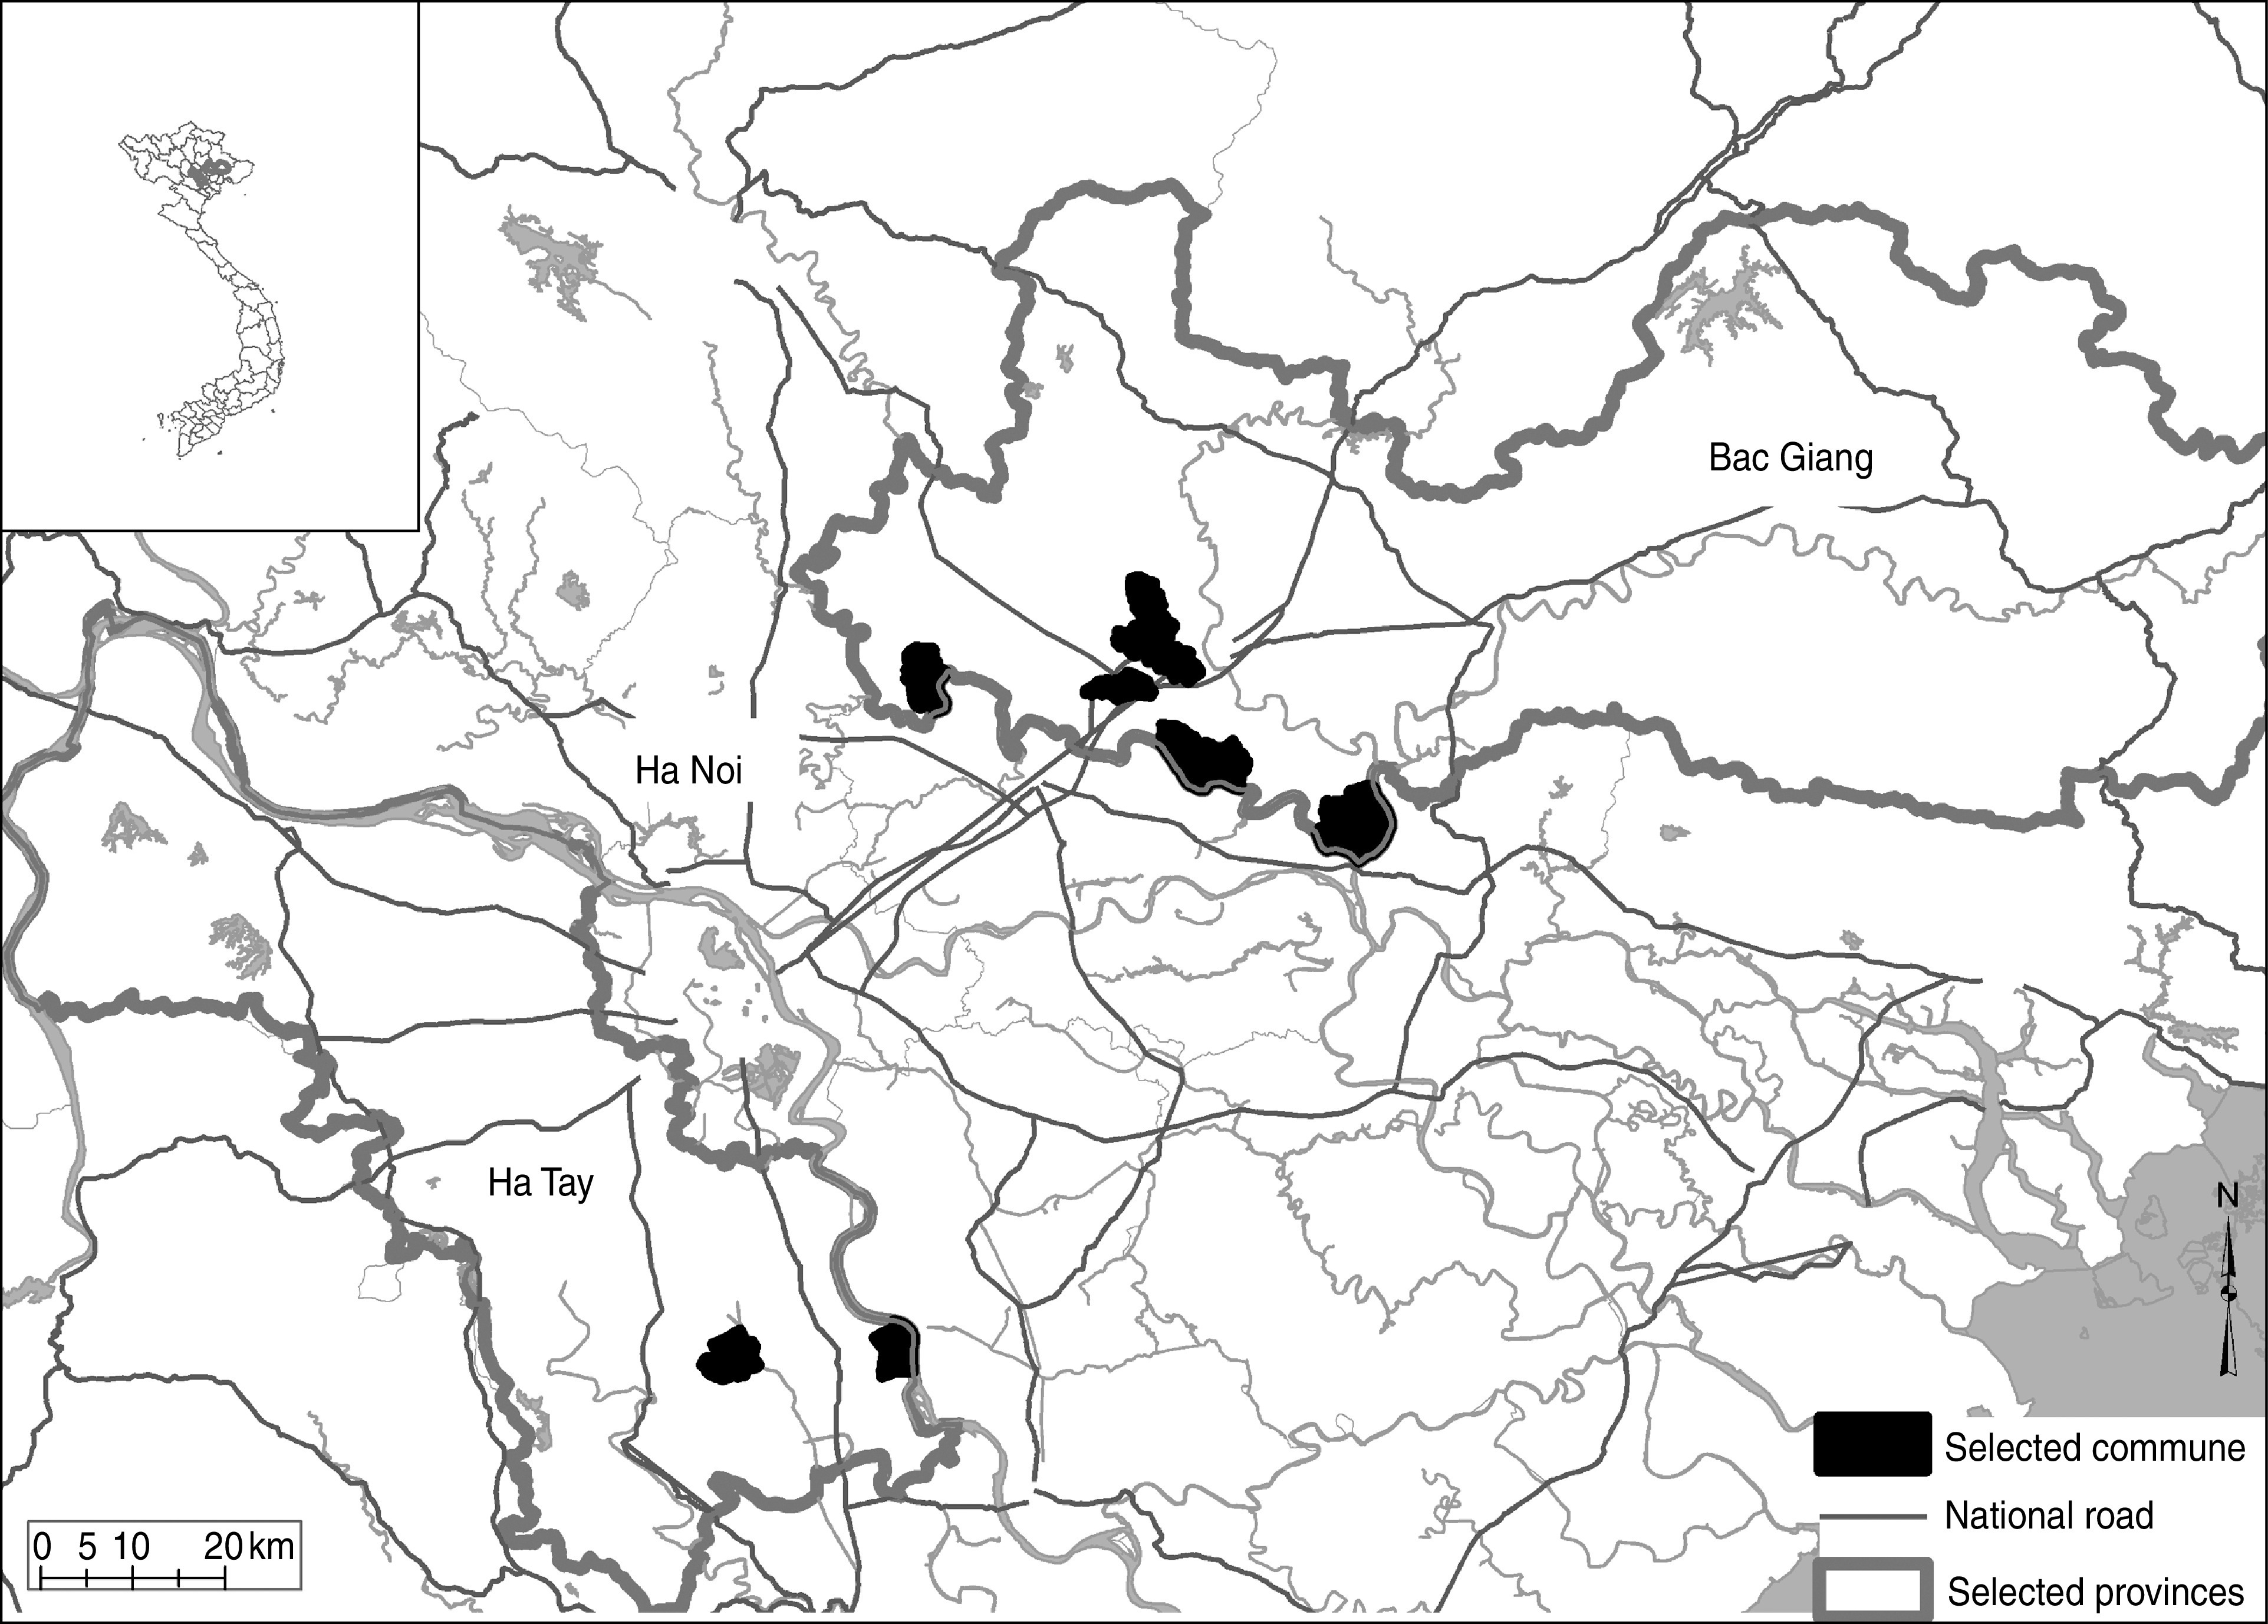
[colour online]. Study area showing selected provinces and communes.
Those communes also provided a good representation of the poultry production systems of the Red River Delta area, with Bac Giang province representative of the agricultural practices in the Delta region [12] and Ha Tay province being the main poultry production area in Northern Vietnam, especially for breeders [1]. One-day-old chickens and ducklings from this province are sent to most of the Northern provinces [1].
Sampling strategy
The population was stratified into three production systems [1]:
-
•
backyard poultry system;
-
•
semi-commercial long cycle (including breeding and laying flocks);
-
•
semi-commercial short cycle (meat bird flocks).
For each campaign we adopted a one-stage clustered stratified design with random selection of the clusters (the flocks for semi-commercial farms or the villages for backyard poultry) and random selection of the birds within each cluster. The number of flocks or villages randomly selected within the study site was proportional to their total number within each stratum. The sampling frame (including the list of all semi-commercial poultry flocks and villages in the study site) was updated by commune veterinarians before each sampling to take into account the known seasonal variation of the poultry population. During the study visits, selected farms that had no birds in their selected flocks were replaced by a flock of the same category in the same village, if possible, or with one from another village of the same commune.
Sample size calculation
We computed the sample size required to estimate a bird-level virological prevalence up to 15% with a precision of 3% at the 95% confidence level, and a bird-level seroprevalence up to 50% with a precision of 5% and a 95% confidence level. In the absence of data related to the variance of HPAI prevalence within and between clusters, we applied a multiplication factor of 2 to the estimated sample size corresponding to the design effect for a cluster sampling [13]. We obtained a minimum number of birds to be sampled at each campaign equal to 1090 birds. Fifteen birds were sampled in each selected cluster (flock or village) to detect the presence of virus with 90% confidence if the within-cluster prevalence was >15% (expected prevalence estimated based on available experimental trials [14]).
Data collection
Four different questionnaires were designed. Two were administered to the flock owners and to the heads of each village visited, respectively, including questions about vaccination status of birds sampled, the size and the characteristics of the flock (species, breed, age), housing system details, the number of households and poultry farms in the village, etc. One questionnaire was completed by the commune veterinarians between two sampling campaigns with data related to the date of H5N1 vaccination in the commune and about poultry mortality events during the period elapsed. In addition, in 2010 a questionnaire was administered to the commune veterinarians including questions on the detailed vaccination protocol for H5N1.
For each selected bird, a blood sample was collected from the wing vein, as well as cloacal and oropharyngeal swabs for C1–C4. Oropharyngeal and cloacal swabs were kept separately in 1 ml virus transport medium [15] for C1 and were then pooled together from three birds in 2 ml virus transport medium for C2–C4.
Laboratory tests
The haemagglutinin inhibition (HI) test was used to estimate H5N1 seroprevalence for all sera samples collected. The analyses were performed at the National Institute of Veterinary Research (NIVR). The test used a HA clade 1 antigen (A/Dk/Vietnam/6/03 H5N1) following the protocol described in the OIE manual [16]. All sera were first heat-inactivated at 56 °C for 30 min. Serum titres were expressed as log2 values of the highest reciprocal dilution that showed complete inhibition of haemagglutination.
The sensitivity (Se) and specificity (Sp) of the HI test performed at NIVR on the bird population were evaluated by comparison with a reference test, and the best cut-off values for the positive threshold were found to be 4 log2 for chickens and 3 log2 for ducks [17]. We used these positive cut-off values to define seropositivity as a result of previous infection or significant vaccination responses. Viral RNA extraction (using Qiagen® RNeasy mini kit, Qiagen, USA) and reverse transcription–polymerase chain reaction (RT–PCR) were performed at NIVR. Every positive result by RT–PCR for viral matrix protein (M) was subjected to RT–PCR for the HA gene of subtype H5.
Data analysis
Seroprevalence estimation and comparison
A sampling weight was applied to each bird in order to obtain an unbiased estimation of the prevalence at bird level despite the stratified sampling strategy [18]. The sampling weights were calculated as the inverse of the probability of selection. The probability of selection was calculated as follows: (number of epidemiological units selected in the strata/number of epidemiological units in the strata) × (number of birds selected in the epidemiological unit/number of birds in the epidemiological unit) [18].
Potential intra-cluster (flock or village) correlation was accounted for by using a robust calculation of the standard errors in the fixed-effects statistical models [19]. Comparison of the odds of being seropositive between categories of birds was performed using univariate logistic regression [18].
The theoretical vaccination coverage was assessed from farmers' reports on the vaccination status of the sampled birds. We defined a protected flock as having at least 70% of sampled birds with positive titres and having a geometric mean titre (GMT) ⩾20 [20, 21].
Determinants of vaccine immunogenicity
Immunogenicity refers to the ability of a vaccine to induce an immune response (antibody and/or cell-mediated immunity) in a vaccinated animal [22].
Only birds vaccinated for at least 21 days were considered in the analysis in order to allow the HI titre to reach a maximum level and be constant [23]. We analysed the determinants of the vaccine immunogenicity with a zero-inflated Poisson regression model separately for vaccinated chickens and ducks. Zero-inflated Poisson regression models allow addressing, in the same model, both the factors that distinguish seroconverted from non-seroconverted birds (logistic regression component) and the factors that explain the different levels of antibody titres in the seroconverted birds (Poisson regression component) [18]. In order to limit bias due to misclassification of birds (i.e. farmer stating the flock was vaccinated when it was not), only birds from flocks declared as vaccinated and presenting at least one seropositive sampled bird were included into this analysis. Birds showing discrepancy between their date of vaccination and their current age were removed from the analysis. We fitted the models for birds at 2 and 3 months post-vaccination. The determinants of immunogenicity were only studied for C5 for which detailed information on the number of injections per vaccination course was recorded in addition to the vaccination status and date of vaccination. Few predictors were initially considered. They were related to (1) the vaccination protocol of either of two doses after age 20 days (defined as protocol 1), one dose after age 20 days (protocol 2), two doses with the first injection before age 20 days (protocol 3) or one dose before age 20 days (protocol 4); (2) the number of poultry within the flock, used as an indicator of the specialization of the farmer; and (3) the housing system, used as an indicator of exposure to diverse microbiological pressure that may limit the immune system reaction. The breed could not be tested due to limited variability of breeds within the selected samples.
The first step was to build a model including all explanatory variables in both components of the model. If no further adjustment significantly improved the model [variation of >2 points of Akaike's Information Criteria (AIC) comparison when one variable was removed] then the full model was presented in order to obtain the adjusted coefficients [24]. Once the model was fitted, we performed Vuong's test to assess the validity of using a zero-inflated Poisson model instead of a standard Poisson model [18].
Determinants of the seroconversion in unvaccinated birds
A random-effects logistic model was built to study the determinants of the seroconversion of the unvaccinated birds [18]. Flocks or villages were included as a random effect in order to take into account intra-cluster correlation in the birds' seroconversion.
The variables tested were related to: (1) the birds' characteristics (species, production type, age); (2) the number of poultry within the flock; (3) the village characteristics (number of layer-breeder duck flocks in the village and presence/absence of meat-duck flocks in the village at sampling time); and (4) the estimated H5N1 immunity coverage of vaccinated poultry at the commune level at sampling time. The immunity coverage of vaccinated poultry in the commune was estimated by the seroprevalence at the bird level in the vaccinated birds in the study sample. The other variables were extracted from the questionnaires.
RESULTS
Study population
In total, 5880 domestic birds were sampled from 447 flocks or villages (C1 n = 69, C2 n = 75, C3 n = 74, C4 n = 76, C5 n = 153). All birds were tested for antibodies to H5N1 virus by HI test and only birds sampled from C1 to C4 (n = 4354) were tested by RT–PCR. The sample consisted of 2489 chickens, 2201 ducks, 1133 Muscovy ducks, 18 geese and 39 birds without clear species identification. The breakdown of the total number of flocks in the study area between December 2008 and June 2009 showed that the meat-duck flock population increased significantly during the first rice harvesting season in June (data not presented), as described previously [1].
Viral circulation over a 1-year period
The overall pool prevalence of type A influenza viruses for C2, C3 and C4 was 0·08 (C2, two positive pools/374 pools of three birds; C3, 1/365; C4, 6/396). No type A influenza positive or suspect samples were detected for the 1036 individual oropharyngeal samples collected during C1. The overall H5 influenza pool prevalence was 0·002 (2/1135). All the H5 positive and suspect samples were from ducks sampled in C4, including two flocks declared as vaccinated (Table 1).
Table 1.
Detailed information related to the positive and suspect H5 RT–PCR results
| H5 PCR pool (Ct value) | Farm | Species and production type (breed) | Vaccination status* (delay since last vaccination in days ) | Campaign |
|---|---|---|---|---|
| Positive (33·31) | 1 | Meat duck (Bau Canh Tran) | Unvaccinated | C4 |
| Positive (34·7) | 1 | Meat duck (Bau Canh Tran) | Unvaccinated | C4 |
| Suspect (38·09) | 1 | Meat duck (Bau Canh Tran) | Unvaccinated | C4 |
| Suspect (38·54) | 2 | Duck breeder (Super egg) | Vaccinated (31 says) | C4 |
| Suspect (37·27) | 3 | Duck layer-breeder (Super egg) | Vaccinated (114 days) | C4 |
RT–PCR, Reverse transcription–polymerase chain reaction.
Based on farmers' reports.
Detailed bird-level seroprevalence results
The seroprevalence over the five cross-sectional surveys of the overall population, without consideration of the reported vaccination status of the birds and estimated by methods accounting for the survey design (sampling weight and clustering) was 24% [95% confidence interval (CI) 19·9–28·2]. The seroprevalence per campaign was below 30% for all the sampling campaigns (Fig. 2).
Fig. 2.

[colour online]. Variation of the H5N1 bird-level seroprevalence over the study period in relation to theoretical vaccination coverage based on farmers' reports.
The seroprevalence estimates by species, production category and vaccination status are given in Table 2. We observed that the odds of being seropositive were significantly lower for meat birds compared to layer-breeders [odds ratio (OR) 0·37, P = 0·005] (Table 2). When viewing the seroprevalence kinetics during the study period separately for those two populations (Fig. 3), we observed differences in percentage of seropositive birds at the sampling dates between the main vaccination campaigns (C2 and C3) and not at the sampling dates just after the vaccination campaigns. These results emphasize the importance of rapid turnover of the meat-bird population in maintaining a sufficient poultry population immunity level using a bi-annual vaccination programme.
Table 2.
Detailed bird-level seroprevalence and univariate logistic regression results, corrected according to sampling design
| No. | Seroprevalence (95% CI) | OR* (95% CI) | P value | |
|---|---|---|---|---|
| Species | ||||
| Chickens | 2489 | 24·2% (17·7–30·7) | Ref. | |
| Ducks | 2201 | 29·9% (23·3–36·5) | 1·34 (0·83–2·14) | 0·226 |
| Muscovy ducks | 1133 | 7·1% (2–12·3) | 0·24 (0·10–0·56) | 0·001 |
| Production type | ||||
| Layers and breeders | 3561 | 29·7% (23·9–35·5) | Ref. | |
| Backyard poultry | 733 | 20·2% (12·2–28·2) | 0·60 (0·34–1·06) | 0·076 |
| Meat birds | 1576 | 13·5% (6·1–21) | 0·37 (0·18–0·74) | 0·005 |
| Province | ||||
| Province 1 | 2994 | 26·8% (20·6–30) | Ref. | |
| Province 2 | 2886 | 21% (15·6–26·5) | 0·72 (0·46–1·14) | 0·166 |
| Vaccination status | ||||
| Birds declared unvaccinated | 2561 | 10·3% (6–14·5) | Ref. | |
| Birds declared vaccinated | 2945 | 36·9% (30·4–43·5) | 5·1 (3–8·7) | <0·000 |
| Production type for the vaccinated population | ||||
| Layers and breeders | 2280 | 36·9 (29·8–44) | Ref. | |
| Meat birds | 603 | 31·6 (16·5–46·7) | 0·79 (0·37–1·69) | 0·543 |
| Production type for the unvaccinated population | ||||
| Layers and breeders | 913 | 11·9 (3·0–20·7) | Ref. | |
| Meat birds | 1251 | 4·2 (0·9–7·4) | 0·32 (0·09–1·04) | 0·059 |
| Species for the vaccinated population | ||||
| Chickens | 1296 | 39·8 (27·6–52·0) | Ref. | |
| Ducks | 1497 | 36·4 (28·6–44·2) | 0·87 (0·47–1·58) | 0·642 |
OR, Odds ratio; CI, confidence interval.
Odds ratio of being seropositive calculated using univariate logistic regression.
Fig. 3.

Variation of the H5N1 bird-level seroprevalence for layer-breeders and meat birds.
Evaluation of the vaccination implementation efficacy at bird and flock levels
The overall seroprevalence of the birds declared as vaccinated was only 36·9% (Table 3) with slight variations between sampling campaigns (Fig. 2). The odds of being seropositive were significantively higher for vaccinated compared to unvaccinated birds (OR 5·1, P < 0·000) (Table 2). The odds of being seropositive did not differ between vaccinated chickens and vaccinated ducks or between vaccinated meat and layer-breeder poultry (Table 2).
Table 3.
Final zero-inflated Poisson model* for the haemagglutinin inhibition (HI) titres in chickens vaccinated 2 and 3 months previously (between 31 and 120 days post-vaccination) (120 observations used)
| Variable | Category | Poisson regression† | Inflated§ | ||
|---|---|---|---|---|---|
| IRR‡ (95% CI) | P value | OR|| (95% CI) | P value | ||
| Vaccination protocol | Protocol 1: Two injections after age 20 days | Ref. | Ref. | ||
| Protocol 2: One injection after age 20 days | 1·22 (0·99–1·50) | 0·056 | 2·62 (0·96–7·16) | 0·061 | |
| Protocol 4: One injection before age 20 days | 1·35 (1·17–1·55) | 0·000 | 45·98 (20·44–103·45) | 0·000 | |
| Housing system | Birds in a closed building all day | Ref. | |||
| Birds with an outdoor closed pen | 0·95 (0·76–1·19) | 0·646 | |||
| Scavenging birds | 0·78 (0·65–0·93) | 0·007 | |||
IRR, Incidence rate ratio; CI, confidence interval; OR, odds ratio.
Vuong test of a zero-inflated Poisson vs. a standard Poisson model (z = 5·77, Pr>z = 0·0000).
Modelling the ratio of the HI titre mean.
IRR, comparing the HI titre mean of seroconverted birds between categories.
Modelling the probability of zero titre.
Comparing the odds of having a zero HI titre between categories.
Considering the flocks declared as being vaccinated at least 21 days previously, only 11·5% (21/182) were protected. The mean within-flock proportion of seropositive birds was 29·2% (95% CI 24·3–34·1) with a mean within-flock mean HI titre of only 1·7 log2 (95% CI 1·4–2·1 log2).
In order to limit bias due to incorrect vaccination status reports we also had those parameters computed for the flocks with at least one seropositive bird (107/182) and the percentage of protected flocks slightly increased to 19·6% (21/107). The mean within-flock proportion of seropositive birds increased to 49·7% (95% CI 44·0–55·3) and the mean within-flock mean HI titre increased to 2·8 log2 (95% CI 2·5–3·1 log2).
Determinants of vaccine immunogenicity in ducks and chickens
The only factor differentiating seronconverted from non-seroconverted chickens was the vaccination protocol (Table 3). Chickens vaccinated with protocol 4 (aged <20 days, one injection) seroconvert less than chickens vaccinated with protocol 1 (aged >20 days, two injections) (OR 45·98, P < 0·000). To a lesser extent, and at the limit of the significance level, birds vaccinated following protocol 2 (aged >20 days, one injection) also seroconvert less (OR 2·62, P = 0·061). Surprisingly, we found a higher mean HI titre in seroconverted birds vaccinated following protocol 4 than in those vaccinated following protocol 1 [incidence rate ratio (IRR) 1·35, P = 0·000]. The housing system also influenced the level of immune response of seroconverted birds, with scavenging birds having a lower HI mean titre than birds kept in a closed building all day (IRR 0·78, P = 0·007) (Table 3).
Only ducks of the Super Egg breed were represented in the population of ducks sampled at 2 or 3 months post-vaccination. For ducks, the size of the flock was found to be a determinant of seroconversion probability with a higher risk of not seroconverting for the smaller size flock category (Table 4). However, we demonstrated that birds from large flocks had a mean HI titre lower than birds from small flocks (IRR 0·73, P = 0·004). We also found an effect of the vaccination protocol on the HI titre of seroconverted ducks, with a lower mean HI titre for birds vaccinated following protocol 2 (aged >20 days, one injection) than for those vaccinated following protocol 1 (aged >20 days, two injections) (IRR 0·76, P = 0·015). We did not detect any significant difference in mean HI titre between ducks vaccinated following protocol 1 and protocol 3 (first injection at age <20 days, two injections) and none of the sampled birds had been vaccinated following protocol 4 (aged <20 days, one injection).
Table 4.
Final zero-inflated Poisson model* for the haemagglutinin inhibition (HI) titres in Super Egg ducks vaccinated for 2 and 3 months (139 observations)
| Variable | Category | Poisson regression† | Inflated§ | ||
|---|---|---|---|---|---|
| IRR‡ (95% CI) | P value | OR|| (95% CI) | P value | ||
| Vaccination protocol | Protocol 1: Two injections after 20 days | Ref. | Ref. | ||
| Protocol 2: One injection after 20 days | 0·76 (0·62–0·95) | 0·015 | 2·01 (0·77–5·23) | 0·154 | |
| Protocol 3: Two injections with first injection before 20 days | 0·96 (0·83–1·12) | 0·639 | 1·32 (0·33–5·24) | 0·694 | |
| Number of poultry in the flock | ⩽150 birds | Ref. | Ref. | ||
| 150–250 birds | 0·88 (0·69–1·11) | 0·273 | 0·03 (0·01–0·09) | 0·000 | |
| >250 birds | 0·73 (0·59–0·90) | 0·004 | 0·18 (0·08–0·40) | 0·000 | |
IRR, Incidence rate ratio; CI, confidence interval; OR, odds ratio.
Vuong test of zip vs. standard Poisson: z = 9·18, Pr>z = 0·0000.
Modelling the ratio of the HI titre mean.
IRR comparing the HI titre mean of seroconverted birds between categories.
Modelling the probability of zero titre.
Comparing the odds of having a zero HI titre between categories.
Serological evidence of exposure to H5N1 virus in unvaccinated poultry
The overall seroprevalence for unvaccinated poultry was 10·3% (Table 2). The species-specific seroprevalence was 10·6% for unvaccinated chickens (95% CI 6–15·2, n = 986), 13·4% for ducks (95% CI 0·4–26·7, n = 608) and 6·5% for Muscovy ducks (95% CI 0·7–12·3, n = 946).
The seroprevalence at flock level (one flock being positive if at least one bird was seropositive at the defined cut-off value) was 20·6% (95% CI 14·3–27, n = 160). The species-specific flock seroprevalence was 27·4% for chickens (95% CI 14·8–40·1, n = 51), 25·6% for ducks (95% CI 12·3–40·1, n = 42) and 12·1% for Muscovy ducks (95% CI 4·1–20·2, n = 66). Only one farm had declared experiencing mortality in the month before sampling.
Determinants of the seropositivity in unvaccinated birds
The probability of seroconversion of unvaccinated birds increased: (1) with age (OR 1·15 for a 30-day increase in age, P < 0·000); (2) for duck layers or breeders and backyard Muscovy ducks compared to chicken layers or breeders (OR 14·67, P = 0·026 and OR 28·12, P = 0·081, respectively); (3) when the number of layer or breeder duck flocks in the village at the time of sampling was medium compared to when this number was low (OR 5·59, P = 0·019); (4) when at least one meat-duck flock was present in the village at the time of sampling (OR 5·38, P = 0·010); (5) in June 2009 and June 2010 compared to December–January 2009 just before the Têt celebration (OR 7·39, P = 0·015 and OR 4·62, P = 0·042, respectively); (6) to a lesser extent, with higher numbers of birds in the flock from which birds were sampled (OR 1·005, P = 0·063) (Table 5). On the other hand, the probability of seroconversion of unvaccinated birds decreased when between 50% and 70% of the vaccinated poultry in the commune were above the defined positive H5 HI antibody titre (OR 0·01, P = 0·000).
Table 5.
Final random-effect logistic model for the seroconversion of unvaccinated birds (2124 observations)
| Variable | Category | OR (95% CI) | P value |
|---|---|---|---|
| Poultry age | Continuous variable | 1·005 (1·00–1·01) | 0·000 |
| Poultry category | Chicken layer-breeder | Ref. | |
| Chicken broiler | 2·20 (0·18–26·44) | 0·535 | |
| Chicken backyard | 9·90 (0·56–174·50) | 0·117 | |
| Duck layer-breeder | 14·67 (1·38–155·28) | 0·026 | |
| Meat duck | 0·40 (0·02–7·40) | 0·542 | |
| Duck backyard | 0·94 (0·04–21·68) | 0·968 | |
| Muscovy duck layer-breeder | 7·66 (0·62–95·14) | 0·113 | |
| Muscovy meat duck | 1·32 × 10−9 | 0·998 | |
| Muscovy backyard | 28·12 (0·66–1198·63) | 0·081 | |
| Number of poultry within flock | Continuous variable. | 1·005 (1–1·01) | 0·063 |
| Number of duck layer-breeder flocks in the village at the time of sampling | No duck layer-breeder flock | Ref. | |
| 1–5 | 5·29 (1·32–21·22) | 0·019 | |
| >5 | 0·31 (0·05–2·02) | 0·225 | |
| Presence of at least one meat-duck flock in the village 1 month before sampling | Yes | 5·38 (1·50–19·26) | 0·010 |
| H5N1 immunity level of the vaccinated birds at commune level at sampling time | <50% | Ref. | |
| 50–70% | 0·01 (0·001–0·090) | 0·000 | |
| >70% | 0·84 (0·07–9·99) | 0·893 | |
| Sampling period | Before 2009 Têt celebration (Dec. 2008–Jan. 2009) | Ref. | |
| After 2009 Têt celebration (Mar. 2009) | 1·03 (0·21–5·09) | 0·972 | |
| During 2009 high meat-duck production season (June 2009) | 7·39 (1·47–37·03) | 0·015 | |
| During 2009 high meat-duck production season (June 2010) | 4·62 (1·06–20·21) | 0·042 | |
| Intra-cluster (intra-flock) correlation | 0·51 (0·36–0·66) |
OR, Odds ratio; CI, confidence interval.
Likelihood ratio test of rho = 0 [16]: P = 0·000.
DISCUSSION
Our results highlight the difficulties in maintaining good flock immunity all year long in poultry populations from Northern Vietnam using an inactivated H5N1 vaccine. We were able to detect some determinants of immunogenicity of this vaccine for chickens and ducks. Finally, serological and virological results indicate that the vaccination levels being achieved did not prevent circulation of virus in co-existing unvaccinated poultry.
The limitations of the study in terms of methodology and the limitations and issues associated with the existing vaccination programme are discussed before conclusions are drawn.
Methodology
Cross-reactivity between the clade 1 antigen used in the HI test and the antibodies induced by a clade 0 vaccine antigen or by strains circulating in Northern Vietnam at that period is expected to be good. Indeed, clade 1 was found to be a good antigen for detection of HI antibody responses [25] and previous studies at the Agriculture, Fisheries and Conservation Department in Hong Kong confirmed this good cross-reactivity (T. Ellis, personal communication). Furthermore, clade 1 antigen was found to cross-react with antibodies from ferrets against clade 2.3.4 strains – the main strains circulating in Northern Vietnam from 2007 [3, 4, 7] – detected in 2005 as well as with strains detected in 2008 [26]. Clade 2.3.2 viruses have also been detected since 2009 in Northern Vietnam [7] and no information about the cross-reactivity with those strains is available. Nevertheless, this clade was not so well established at the time of the study period as indicated by a very low isolation rate compared to clade 2.3.4 in about 20 000 samples collected from 2007 to 2010 [7]. No or limited cross-reactivity is expected between clade 1 antigen and clade 7 antisera [26], but clade 7 viruses were only detected from birds seized at the border with China and have not yet become established in Vietnam [26, 27]. Thus, we can conclude that an HI test in those conditions may result in slightly lower measured HI antibody titres [28] but will still give indication of past exposure with the Re-1 vaccine or with circulating strains.
Difficulties in conferring high herd immunity level with a bi-annual vaccination strategy
The seroprevalence measured by the presence of HI H5 antibodies in the studied population was <30% for all the sampling campaigns. This immunity level is below the targeted vaccination coverage following a bi-annual mass vaccination campaign and the previous estimates made in Vietnam (i.e. >80%) [29]. Several factors may contribute and explain this low immunity level:
-
(1)
The high population turnover in poultry production systems does not allow the vaccination of all birds with a bi-annual vaccination campaign. Moreover, farmers' reports reveal lower vaccination coverage for samplings between the main vaccination campaigns (Fig. 2). This is mainly due to the low frequency of vaccination sessions on meat birds which are produced within a period of 2–3 months and are usually not vaccinated between vaccination campaigns (Fig. 3).
-
(2)
Different causes of preventable failures [30], such as problems with the cold chain that could have a direct consequence on the effect of the vaccine (vaccines are transported on motorbikes), or incorrect injection techniques or incorrect dosages that could lead to birds not receiving the appropriate amount of antigen. Existence of vaccination failures is supported by a within-flock immunity level below the expected target seroprevalence or herd immunity threshold (60–80%) needed in a vaccinated flock to prevent an outbreak [31, 32]. On the other hand, the greater technical capacity of farmers in vaccination implementation may lead to less frequent preventable vaccine failures. Indeed, in ducks, we found that larger flocks had a higher proportion of HI-positive responders than smaller flocks. But this observation may also be explained by problems of vaccine quality delivered for small flocks since one vaccine bottle containing about 500 doses is used to inoculate several small flocks over a few days.
-
(3)
Inappropriate vaccination protocols leading to low or no immunological response. The importance for vaccine immunogenicity of the number of doses and age of the bird at the time of vaccination was confirmed in our study for chickens and ducks (zero-inflated models), respectively, on the probability of seroconversion or on the mean HI titres for seroconverted ducks [33]. This confirms previous reports on the need to increase vaccine doses to induce protective immune response in ducks [25]. We also observed a fall in antibody levels at 1–2 months post-vaccination (see Supplementary online material) that might also be explained by inappropriate vaccination protocols used in the field (see Supplementary online material for presentation of the vaccination protocols as described by the commune veterinarians).
-
(4)
Farming management which may influence effective immunization by this vaccine. We found a lower mean HI titre in scavenging chickens than in seroconverted chickens kept in a closed building all day (Table 3). For those birds, possibly subjected to higher microbial pressure than birds in a closed building, the vaccine-specific immune responses may have suffered from competition [20, 34]. We also found that large flock size negatively influenced the mean HI titre of vaccinated ducks. More intensive management practices for the largest flocks may induce more stress for the birds and, as a consequence, a lower level of immunological response.
Limits of the vaccination strategy in preventing virus circulation in the domestic poultry population
Suspect positive results for H5 by PCR testing were found in only two unvaccinated duck flocks. Those results do not exclude the possibility of H5N1 virus circulation in vaccinated birds but indicate that this circulation is probably at a low level. According to the virus titres shed in H5N1-infected unvaccinated chickens and ducks from various experimental studies (at least 102 EID50/0·1 ml of virus) [35, 36] it is likely that a swab from one infected unvaccinated bird in a pool of swabs from 2 to 3 birds would still give a positive RT–PCR result. However, the virological results may have been biased by the short excretion window of the virus since viral excretion in birds vaccinated with Re-1 vaccine may be as short as 3 days post-challenge [35]. On the other hand, we have detected strong H5 PCR-positive pools from healthy unvaccinated ducks, confirming again the potential role of H5N1 virus reservoirs in waterfowl [37, 38] and providing evidence of failure in the indirect protection of the unvaccinated population with such a mass-vaccination strategy. Finally, this low virological prevalence measured on random samples at the farm level is in accord with another study conducted in the southern part of Vietnam a year before [39].
A serological prevalence of unvaccinated birds at around 10% is further evidence of virus circulation in that population. The presence of antibodies against H5N1 as a marker of past virus exposure is common in waterfowl but less frequent in chickens that are usually more susceptible to HPAI viruses. Nevertheless, it is possible that the local chicken breed present some resistance to HPAI H5N1 viruses as suggested previously [40] and observed in laboratory settings (M. Peiris, personal communication), or that chickens were resistant to infection if exposed to very low doses of virus [41]. Further, we cannot exclude that seroconversion of some of the unvaccinated birds was due to low pathogenic H5N1 and H5N2, but because of the predominance of the HPAI H5N1 virus in Vietnam, this bias is probably limited.
Nevertheless, despite failure in stopping virus circulation, we noted an indirect protection of unvaccinated birds when the vaccinated population of the same commune showed seroprevalence levels between 50% and 70% compared to situations where this seroprevalence level was <50%. However, in the final random-effects model, we did not detect a similar effect for a vaccinated population seroprevalence level >70%. One hypothesis might be that having more birds clinically protected without full prevention of virus shedding [35, 36] makes the detection and control of HPAI H5N1 virus circulation more difficult for farmers. This is also suggested by a modelling approach that demonstrated that the time taken to report outbreaks in Vietnam had increased in the period where vaccination was used compared to previous periods [42], lending support to the hypothesis of ‘silent spread’ of infection in vaccinated birds [43].
Hypothesis related to the mechanisms involved in virus persistence in the Red River Delta domestic poultry population
We also gathered evidence on the role played by the duck population in maintenance of the virus. We showed that the probability of seroconversion of unvaccinated birds was higher in June, when the meat-duck population reaches its maximum size. The last big epidemic wave in Northern Vietnam in 2007 occurred during that period [2]. Confirming the influence of the meat-duck population in supporting viral circulation, we found that the presence of at least one meat-duck flock in the village around the time of sampling significantly increased the risk for an unvaccinated bird being seropositive. Meat ducks probably contribute to virus dissemination because of their farming management, as they are allowed to scavenge all day in the rice fields. In addition, serological and virological results also support the role of the long-cycle duck population (vaccinated and unvaccinated) in virus circulation.
CONCLUSIONS
The study highlights the difficulties in maintaining good herd immunity throughout the year in poultry populations using an inactivated H5N1 vaccine in Northern Vietnam. Improvements might still be obtained by limiting the preventable vaccination failures and by optimizing and harmonizing the protocols being used separately for chickens and ducks. Our study provides insights into the epidemiology of the HPAI H5N1 virus within a vaccination context by providing indirect evidence that vaccinated populations with less than optimal levels of immunity can contribute to persistence of the virus within the poultry population. More precisely, we hypothesized that the virus is maintained in long-cycle ducks (and to lesser extent long-cycle unvaccinated Muscovy ducks) and that unvaccinated meat ducks probably contribute to virus dissemination because of their farming management. Appropriate vaccination protocols should be tested in this population in field conditions and vaccine should be available throughout the year.
Supplementary Material
Supplementary information supplied by authors.
ACKNOWLEDGMENTS
We thank the French Ministry of Foreign and European Affairs for funding the Gripavi project within the framework of which this work was done. We are grateful to the veterinary services of the nine communes under study for their support in data collection, to Thomas Beuscart for his contribution to the data collection in 2010, to Mrs Pham Thi Thu Huyen for data entry. We also thank Lucas Leger from CIRAD for useful exchanges on statistical analysis.
Supplementary material
For supplementary material accompanying this paper visit https://doi.org/10.1017/S0950268812001628.
click here to view supplementary material
DECLARATION OF INTEREST
None.
REFERENCES
- 1.Desvaux S, Dinh TV (eds). A General Review and a Description of the Poultry Production in Vietnam. Hanoi, Vietnam. Hanoi: Agricultural Publishing House, 2008. [Google Scholar]
- 2.Minh PQ, et al. Spatio-temporal epidemiology of highly pathogenic avian influenza outbreaks in the two deltas of Vietnam during 2003–2007. Preventive Veterinary Medicine 2009; 89: 16–24. [DOI] [PubMed] [Google Scholar]
- 3.Nguyen TD, et al. Multiple sublineages of influenza a virus (H5N1), Vietnam, 2005–2007. Emerging Infectious Diseases 2008; 14: 632–636. [DOI] [PMC free article] [PubMed] [Google Scholar]
- 4.Wan XF, et al. Evolution of highly pathogenic H5N1 avian influenza viruses in Vietnam between 2001 and 2007. PLoS One 2008; 3: e3462. [DOI] [PMC free article] [PubMed] [Google Scholar]
- 5.WHO/OIE/FAO H5N1 Evolution Working Group.Toward a unified nomenclature system for highly pathogenic avian influenza virus (H5N1). Emerging Infectious Diseases 2008; 14: e1. [DOI] [PMC free article] [PubMed] [Google Scholar]
- 6.Smith GJ, et al. Evolution and adaptation of H5N1 influenza virus in avian and human hosts in Indonesia and Vietnam. Virology 2006; 350: 258–268. [DOI] [PubMed] [Google Scholar]
- 7.Rivailler P, et al. Recent genomic evolution of highly pathogenic avian influenza (H5N1) viruses in Vietnam suggests continued emergence of H5N1 genotypes and possible reintroduction of novel virus strains. In: Influenza and Other Respiratory Viruses: Options for the Control of Influenza VII. Hong Kong SAR, China, 2010, pp. 530. [Google Scholar]
- 8.FAO, WHO, OIE. Technical update: current evolution of avian influenza H5N1 viruses (http://www.offlu.net/fileadmin/home/en/news/pdf/11_09_tripartite_notes_on_H5N1.pdf). Accessed 22 October 2011.
- 9.Qiao C, et al. Vaccines developed for H5 highly pathogenic avian influenza in China. Annals of the New York Academy of Sciences 2006; 1081: 182–192. [DOI] [PubMed] [Google Scholar]
- 10.Suarez DL, Schultz-Cherry S. Immunology of avian influenza virus: a review. Develomental and Comparative Immunology 2000; 24: 269–283. [DOI] [PubMed] [Google Scholar]
- 11.Ministry of Agriculture and Rural Development. Update on HPAI and FMS situation. (http://www.cucthuy.gov.vn/index.php?option=com_content&task=category§ionid=1&id=19&Itemid=64). Accessed 10 January 2008.
- 12.Desvaux S, et al. Risk factors of highly pathogenic avian influenza H5N1 occurrence at the village and farm levels in the Red River delta region in Vietnam. Transboundary Emerging Disease 2011; 58: 492–502. [DOI] [PubMed] [Google Scholar]
- 13.Killip S, Mahfoud Z, Pearce K. What is an intracluster correlation coefficient? Crucial concepts for primary care researchers. Annals of Family Medicine 2004; 2: 204–208. [DOI] [PMC free article] [PubMed] [Google Scholar]
- 14.Veits J, et al. Protective efficacy of several vaccines against highly pathogenic H5N1 avian influenza virus under experimental conditions. Vaccine 2008; 26: 1688–1696. [DOI] [PubMed] [Google Scholar]
- 15.WHO. Collecting, preserving and shipping specimens for the diagnosis of avian influenza A (H5N1) virus infection: guide for field operation. 2006. (http://www.who.int/csr/resources/publications/surveillance/CDS_EPR_ARO_2006_1.pdf). Accessed 30 May 2012.
- 16.OIE.Avian influenza. In: Manual of Diagnostic Tests and Vaccines for Terrestrial Animals, 6th edn. Paris: OIE, 2008, pp. 465–481. [Google Scholar]
- 17.Desvaux S, et al. Evaluation of serological tests for H5N1 avian influenza on field samples from domestic poultry populations in Vietnam: consequences for surveillance. Veterinary Microbiology 2012; 156: 277–284. [DOI] [PubMed] [Google Scholar]
- 18.Dohoo I, Martin W, Stryhn H (eds). Veterinary Epidemiologic Research. Charlottetown, Prince Edward Island, Canada: AVC Inc., 2003. [Google Scholar]
- 19.Rogers WH. Regression standard errors in clustered samples. Stata Technical Bulletin 1993, pp. 19–23. [Google Scholar]
- 20.Ellis TM, et al. Use of avian influenza vaccination in Hong Kong. Developmental Biology (Basel) 2006; 124: 133–143. [PubMed] [Google Scholar]
- 21.Peyre M, et al. Avian influenza vaccines: a practical review in relation to their application in the field with a focus on the Asian experience. Epidemiology and Infection 2009; 137: 1–21. [DOI] [PubMed] [Google Scholar]
- 22.Hannoun C, Megas F, Piercy J. Immunogenicity and protective efficacy of influenza vaccination. Virus Research 2004; 103: 133–138. [DOI] [PubMed] [Google Scholar]
- 23.Marche S, Lambrecht B, van den Berg T. Evaluation of different serologic markers for the early detection of avian influenza infection in chickens. Avian Disease 2010; 54: 690–698. [DOI] [PubMed] [Google Scholar]
- 24.Burnham KP, Anderson DR. Multimodel inference: understanding AIC and BIC in model selection. Sociological Methods and Research 2004; 33: 261–304. [Google Scholar]
- 25.Kim JK, et al. Pathogenicity and vaccine efficacy of different clades of Asian H5N1 avian influenza A viruses in domestic ducks. Journal of Virology 2008; 82: 11374–11382. [DOI] [PMC free article] [PubMed] [Google Scholar]
- 26.Davis CT, et al. Detection and characterization of clade 7 high pathogenicity avian influenza H5N1 viruses in chickens seized at ports of entry and live poultry markets in Vietnam. Avian Disease 2010; 54 (1 Suppl.): 307–312. [DOI] [PubMed] [Google Scholar]
- 27.Long NT, et al. Recent avian influenza virus A/H5N1 evolution in vaccinated and unvaccinated poultry from farms in Southern Vietnam, January–March 2010. Transboundary and Emerging Diseases 2011; 58: 537– 543. [DOI] [PMC free article] [PubMed] [Google Scholar]
- 28.Tian G, et al. Protective efficacy in chickens, geese and ducks of an H5N1-inactivated vaccine developed by reverse genetics. Virology 2005; 341: 153–162. [DOI] [PubMed] [Google Scholar]
- 29.Taylor N, Dung DH. An analysis of data generated by post-vaccination sero-monitoring and surveillance activities, following HPAI vaccination in Vietnam (2005–2006). Hanoi, Vietnam: Food and Agriculture Organization, Department of Animal Health, 2007. Report No.: Technical report (2) OSRO/RAS/604/USA. [Google Scholar]
- 30.Chen RT, Orenstein WA. Epidemiologic methods in immunization programs. Epidemiologic Reviews 1996; 18: 99–117. [DOI] [PubMed] [Google Scholar]
- 31.Rudolf M, et al. Longitudinal 2 years field study of conventional vaccination against highly pathogenic avian influenza H5N1 in layer hens. Vaccine 2010; 28: 6832–6840. [DOI] [PubMed] [Google Scholar]
- 32.Bouma A, et al. Estimation of transmission parameters of H5N1 avian influenza virus in chickens. PLoS Pathogens 2009; 5: e1000281. [DOI] [PMC free article] [PubMed] [Google Scholar]
- 33.Maas R, et al. Maternal immunity against avian influenza H5N1 in chickens: limited protection and interference with vaccine efficacy. Avian Pathology 2011; 40: 87–92. [DOI] [PubMed] [Google Scholar]
- 34.Hao YX, et al. Reduced serologic response to avian influenza vaccine in specific-pathogen-free chicks inoculated with Cryptosporidium baileyi. Avian Disease 2008; 52: 690–693. [DOI] [PubMed] [Google Scholar]
- 35.Pfeiffer J, et al. Efficacy of commercial vaccines in protecting chickens and ducks against H5N1 highly pathogenic avian influenza viruses from Vietnam. Avian Disease 2010; 54: 262–271. [DOI] [PubMed] [Google Scholar]
- 36.Tian G, et al. Protective efficacy of the H5 inactivated vaccine against different highly pathogenic H5N1 avian influenza viruses isolated in China and Vietnam. Avian Disease 2010; 54: 287–289. [DOI] [PubMed] [Google Scholar]
- 37.Perkins LE, Swayne DE. Pathogenicity of a Hong Kong-origin H5N1 highly pathogenic avian influenza virus for emus, geese, ducks, and pigeons. Avian Disease 2002; 46: 53–63. [DOI] [PubMed] [Google Scholar]
- 38.Pantin-Jackwood MJ, Swayne DE. Pathobiology of Asian highly pathogenic avian influenza H5N1 virus infections in ducks. Avian Disease 2007; 51: 250–259. [DOI] [PubMed] [Google Scholar]
- 39.Henning J, et al. Highly pathogenic avian influenza (H5N1) in ducks and in-contact chickens in backyard and smallholder commercial duck farms in Viet Nam. Preventive Veterinary Medicine 2011; 101: 229– 240. [DOI] [PubMed] [Google Scholar]
- 40.Phuong DQ, Dung NT, Christensen JP. H5 Avian influenza in rural poultry of Thai-Binh Province Vietnam. Developmental Biology (Basel) 2006; 124: 234. [Google Scholar]
- 41.Swayne DE, Pantin-Jackwood M. Pathogenicity of avian influenza viruses in poultry. Developmental Biology (Basel) 2006; 124: 61–67. [PubMed] [Google Scholar]
- 42.Walker PG, et al. A Bayesian approach to quantifying the effects of mass poultry vaccination upon the spatial and temporal dynamics of H5N1 in Northern Vietnam. PLoS Computational Biology 2010; 6: e1000683. [DOI] [PMC free article] [PubMed] [Google Scholar]
- 43.Savill NJ, et al. Silent spread of H5N1 in vaccinated poultry. Nature 2006; 442: 757. [DOI] [PubMed] [Google Scholar]
Associated Data
This section collects any data citations, data availability statements, or supplementary materials included in this article.
Supplementary Materials
Supplementary information supplied by authors.
For supplementary material accompanying this paper visit https://doi.org/10.1017/S0950268812001628.
click here to view supplementary material