Abstract
Epigenetic dysregulation is a defining feature of tumorigenesis that is implicated in immune escape1,2. To identify factors that modulate the immune sensitivity of cancer cells, we performed in vivo CRISPR-Cas9 screens targeting 936 chromatin regulators in mouse tumor models treated with immune checkpoint blockade (ICB). We identified the H3K9-methyltransferase SETDB1 and other members of the HUSH and KAP1 complexes as mediators of immune escape3–5. We also found that amplification of SETDB1 (1q21.3) in human tumors is associated with immune exclusion and ICB resistance. SETDB1 represses broad domains, primarily within the open genome compartment. These domains are enriched for transposable elements (TEs) and immune clusters associated with segmental duplication events, a central mechanism of genome evolution6. SETDB1 loss derepresses latent TE-derived regulatory elements, immunostimulatory genes, and TE-encoded retroviral antigens in these regions, and triggers TE-specific cytotoxic T-cell responses in vivo. Our study establishes SETDB1 as an epigenetic checkpoint that suppresses tumor-intrinsic immunogenicity, and thus represents a candidate target for immunotherapy.
Introduction
Tumors adopt diverse strategies to evade immune detection, including over-expression of inhibitory checkpoints, inactivation of antigen presentation, and editing of neo-antigens7,8. Therapies that disrupt immune evasion through the PD-1 or CTLA-4 pathways have shown remarkable efficacy9–11. However, ICB remains ineffective for most patients. Recent studies have identified chromatin regulators with cell-intrinsic effects on the immune sensitivity of cancer cells, raising the possibility that epigenetic therapies could enhance ICB1,2. We therefore carried out in vivo screens in mouse tumor models to systematically identify chromatin regulators that modulate ICB efficacy.
Results
In vivo chromatin regulator screens
We performed in vivo CRISPR-Cas9 screens to identify epigenetic regulators that modulate tumor-cell responses to ICB. We transduced an sgRNA library targeting 936 chromatin genes into two mouse tumor lines, B16 melanoma and Lewis lung carcinoma (LLC)(Fig. 1a, Supplementary Table 1). Cells were transplanted into mice and anti-tumor immunity elicited by tumor-cell vaccination and PD-1 blockade (B16), or combination PD-1/CTLA-4 blockade (LLC). Tumors were harvested after two weeks and sgRNA representations were evaluated (Extended Data Fig. 1a–b).
Figure 1. In vivo chromatin regulator screens.
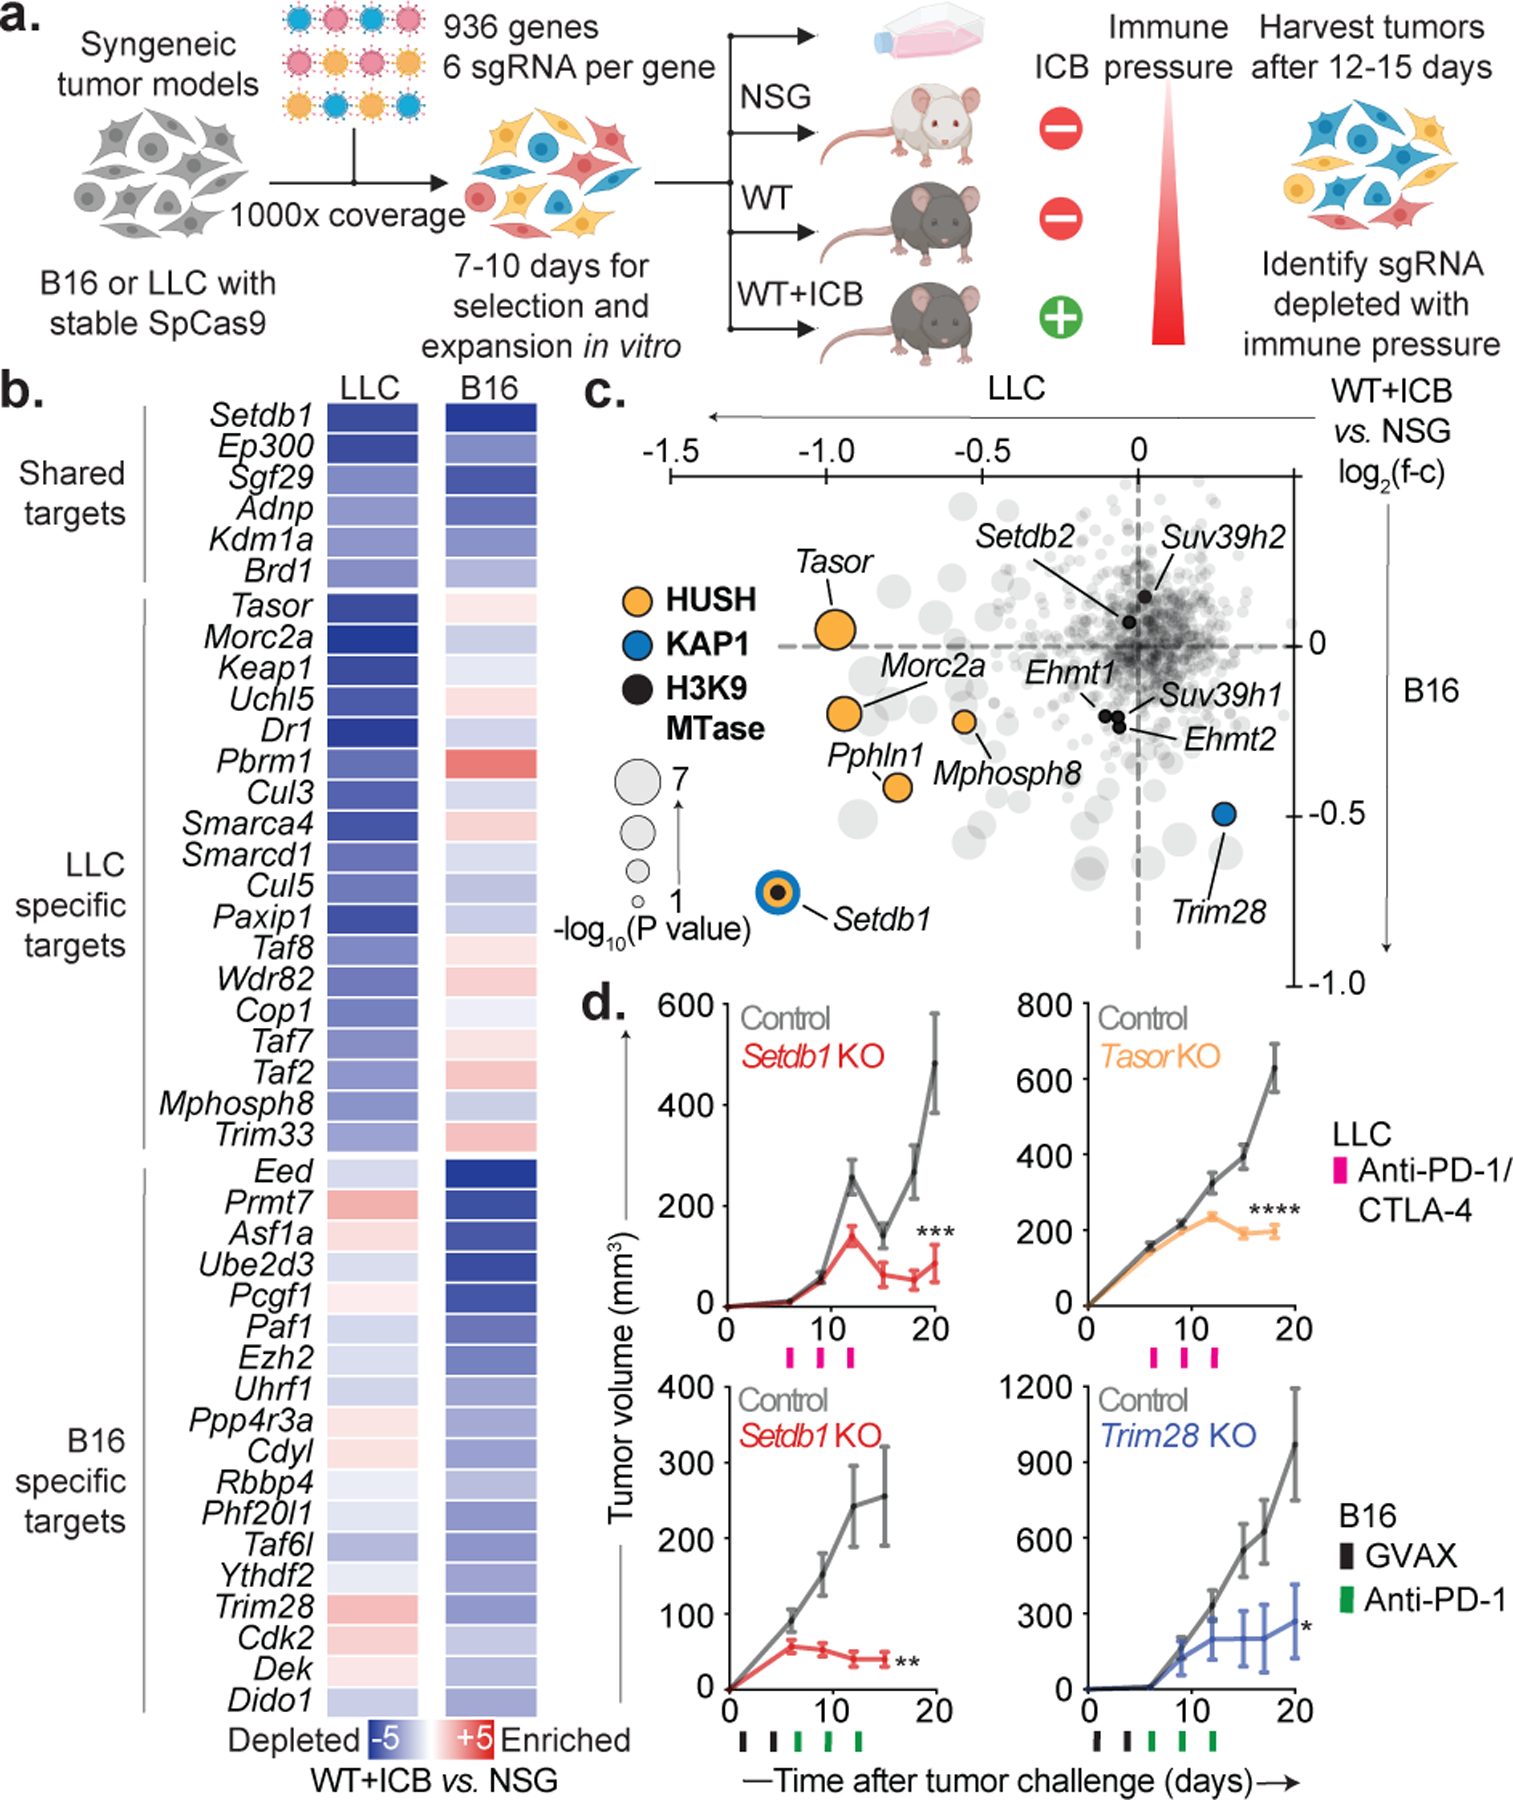
(a) Chromatin regulator screens in B16 and LLC. (b) Depletion (blue) or enrichment (red) of targeted genes in ICB-treated WT versus NSG mice grouped by top shared and cell-specific hits. (c) Depletion (negative ratios) or enrichment (positive ratios) of targeted genes (grey) in ICB-treated WT versus NSG mice with Setdb1, Trim28 (KAP1), HUSH complex, and other H3K9-methyltransferases highlighted. (d) Tumor growth (mean volume +/− s.e.m.) for ICB-treated WT mice inoculated with Setdb1 (n=20) or Tasor KO (n=20) LLC (top), and Setdb1 (n=20) or Trim28 KO (n=5) B16 (bottom). Data are representative of 3 (Setdb1), 1 (Tasor), and 2 (Trim28) independent experiments with 2 distinct sgRNA. Statistics by two-sided Student’s t-test at indicated time-points. *P < 0.05; **P < 0.01; ***P < 0.001; ****P < 0.0001.
To identify ICB sensitizers, we ranked sgRNAs that were depleted in ICB-treated versus immunodeficient (NOD-scid-IL2Rgnull) mice (Fig. 1a–b, Supplementary Table 2). We observed depletion of positive control genes (H2-T23, Ptpn2) and factors with recognized roles in tumor immunity (Ezh2, Kdm1a, Pbrm1, Asf1a)12–16. We also identified novel factors, many of which scored preferentially in either LLC or B16. LLC-specific hits included the PBAF/BAF (Pbrm1, Smarca4, Smarcd1), INO80 (Ino80, Uchl5), SIN3 (Sin3b, Phf12), and E3-ubiquitin ligase (Keap1, Cul3, Cul5, Cop1, Trim33) complexes. B16-specific hits included Polycomb (Ezh2, Eed, Rbbp4, Cdyl, Pcgf1, Bcor), HIRA (Asf1a, Hira), DNA methylation (Dnmt1, Uhrf1, Phf20l1), and m6A RNA (Virma, Ythdf2) complexes. These context-specific functions were not explained by basal expression of the targets and merit further study (Extended Data Fig. 1c–d).
SETDB1 loss sensitizes tumors to ICB
The H3K9-methyltransferase SETDB1 was the top-ranked sensitizer in B16 and LLC (Fig. 1b–c, Supplementary Table 2). SETDB1 is the catalytic subunit of the KAP1 and HUSH complexes, and is implicated in TE silencing3–5. KAP1 is recruited to TEs by Kruppel-associated box zinc fingers, which evolved in tandem with TEs to mediate their silencing17. HUSH is recruited via chromodomain interactions with H3K9me3 and also maintains TE silencing5. While SETDB1 scored as a top target in both models, Trim28 scored selectively in B16, and HUSH members (Tasor, Mphosph8, Pphln1, and Morc2a) scored preferentially in LLC (Fig. 1c). This suggests that SETDB1 acts via distinct complexes in alternate contexts.
In validation experiments, Setdb1, Tasor, or Mphosph8 KO sensitized to anti-PD-1/CTLA-4 in LLC, but had little effect without treatment (Fig. 1d, Extended Data Fig. 2a–d). In B16, Setdb1 or Trim28 KO sensitized to GVAX and PD-1 blockade, but had no significant effect in untreated mice. These results confirm the primary screen and validate SETDB1 and its complex members as immunotherapy targets.
SETDB1 amplification in human tumors
To study SETDB1 in human tumors, we examined cohorts from the cancer genome atlas (TCGA). While rarely inactivated, SETDB1 was recurrently amplified and over-expressed (median 38% of cases per cohort with low or high-level amplification), consistent with prior work identifying SETDB1 as a primary oncogene on 1q21.3 (Fig. 2a)18. SETDB1 expression anti-correlated with canonical immune signatures and cytolytic score, including in bootstrap analyses with control genes (Fig. 2b, Extended Data Fig. 3a–c). These findings suggest that tumors with SETDB1 (1q21.3) amplification are immune excluded.
Figure 2. SETDB1 (1q21.3) amplification in human tumors.
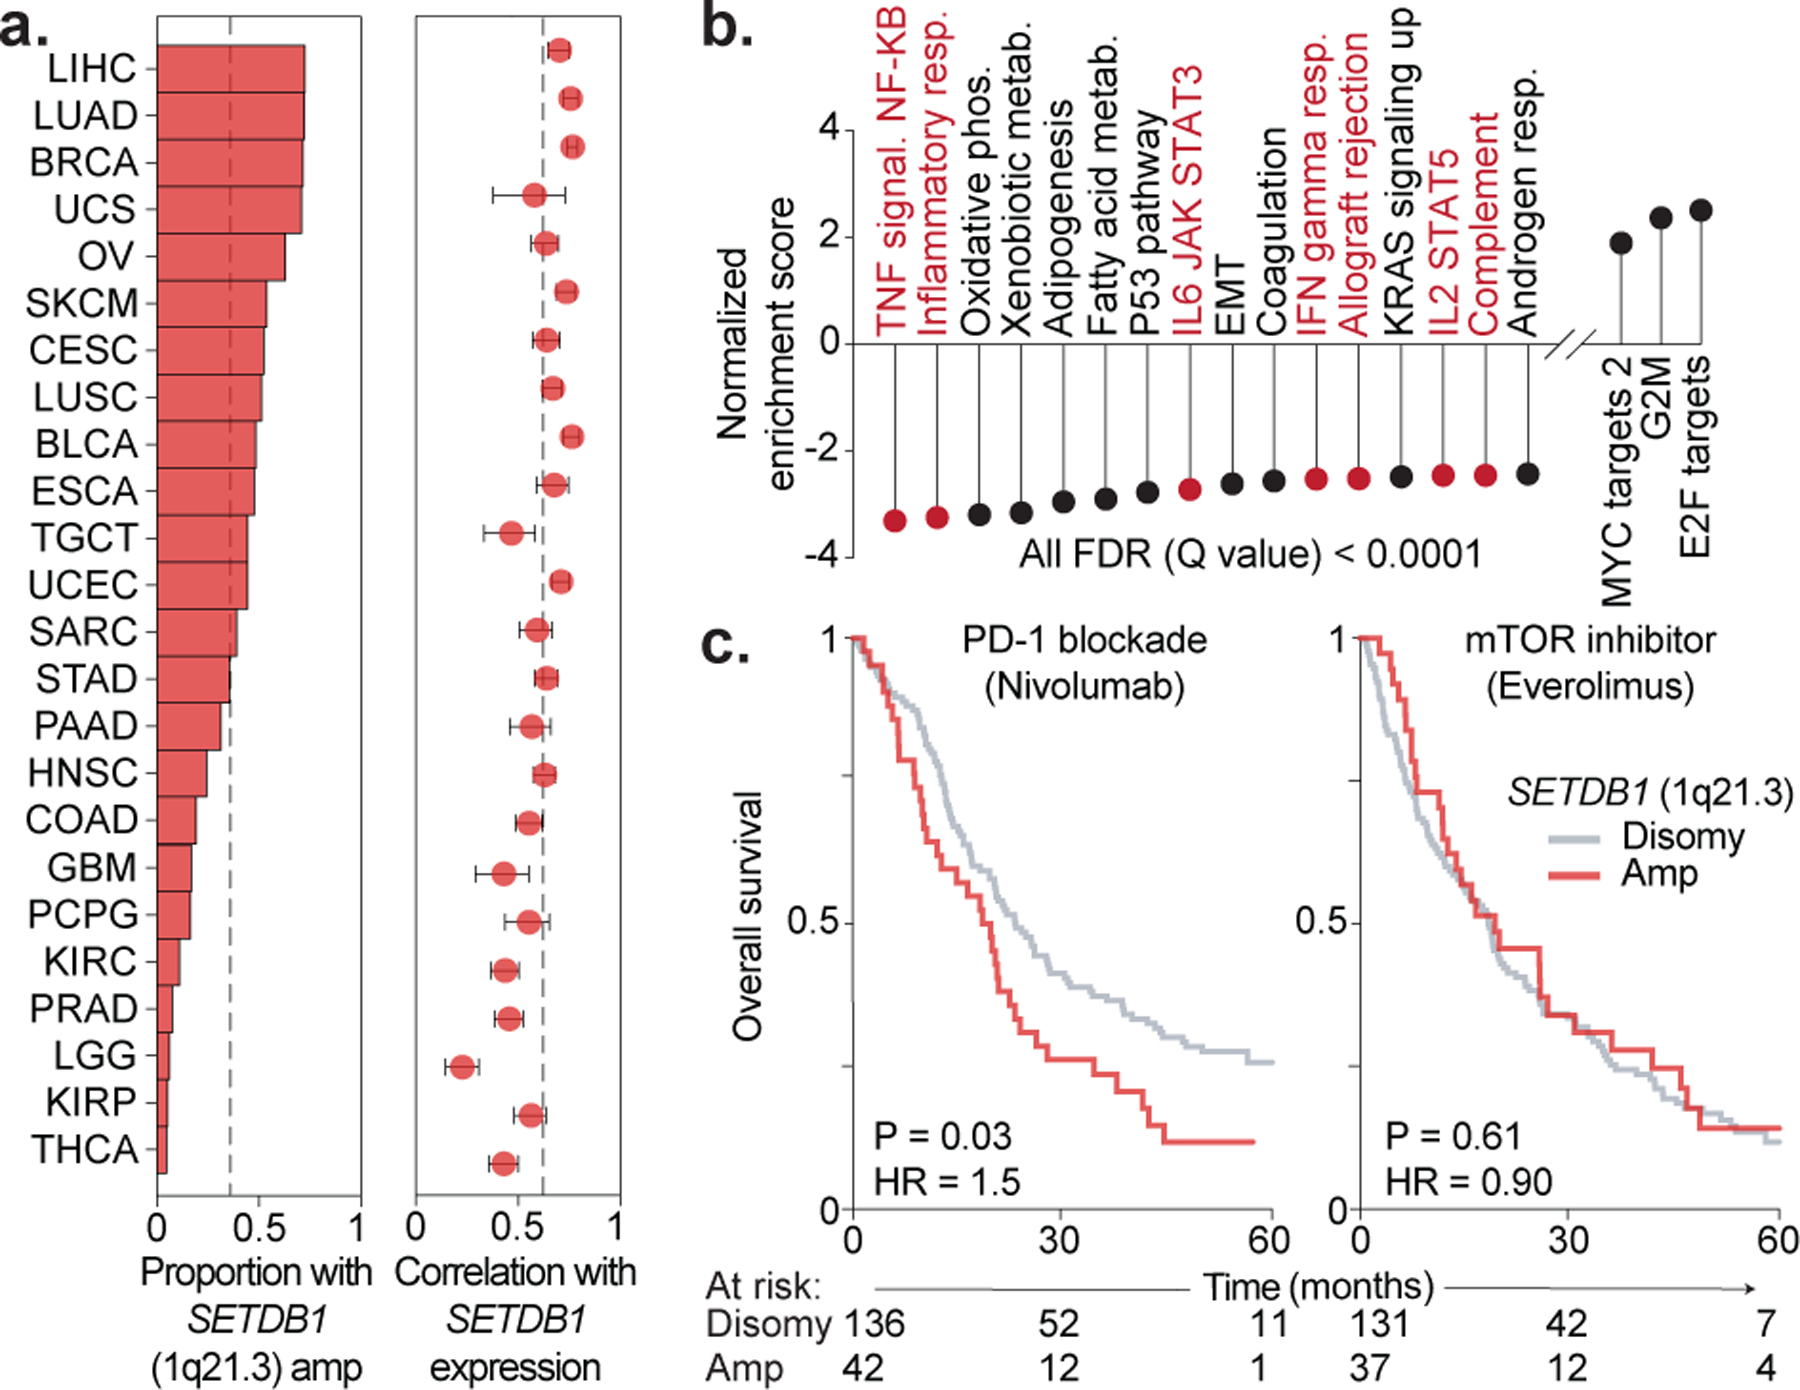
(a) Proportion of TCGA cases with SETDB1 high or low-level amplification (left), and Pearson’s correlation with 95% c.i. between SETDB1 copy-number and RNA (right). Dotted lines indicate median values. (b) Normalized enrichment scores of Hallmark gene sets correlated with SETDB1 expression. (c) Kaplan-Meier curves for renal cell carcinoma patients treated with PD-1 blockade or mTOR inhibitor and stratified by SETDB1 amplification. Hazard ratios associated with SETDB1 amplification are listed. Statistics by log-rank test.
SETDB1 amplification or over-expression also predicted poor outcome in response to PD-1 blockade but not mTOR inhibitor in patients with advanced renal cell carcinoma (Fig. 2c, Extended Data Fig. 3d–e)19. Further study is needed to assess whether this is generalizable to other human tumors, including those with high mutational burden.
SETDB1 targets evolving genomic loci
Our findings implicate SETDB1 as a mediator of immune escape and ICB resistance. To investigate underlying mechanisms, we used ChIP-seq to identify H3K9me3 peaks that were significantly reduced by Setdb1 KO in LLC or B16(Fig. 3a, Extended Data Fig. 4a–c). SETDB1-dependent H3K9me3 peaks were biased towards the open genome compartment ‘A’ and tended to cluster within large domains20. We annotated and merged these clusters to collate a set of 1,544 SETDB1 domains (median size: 184kb).
Figure 3. SETDB1 targets evolving genomic loci.
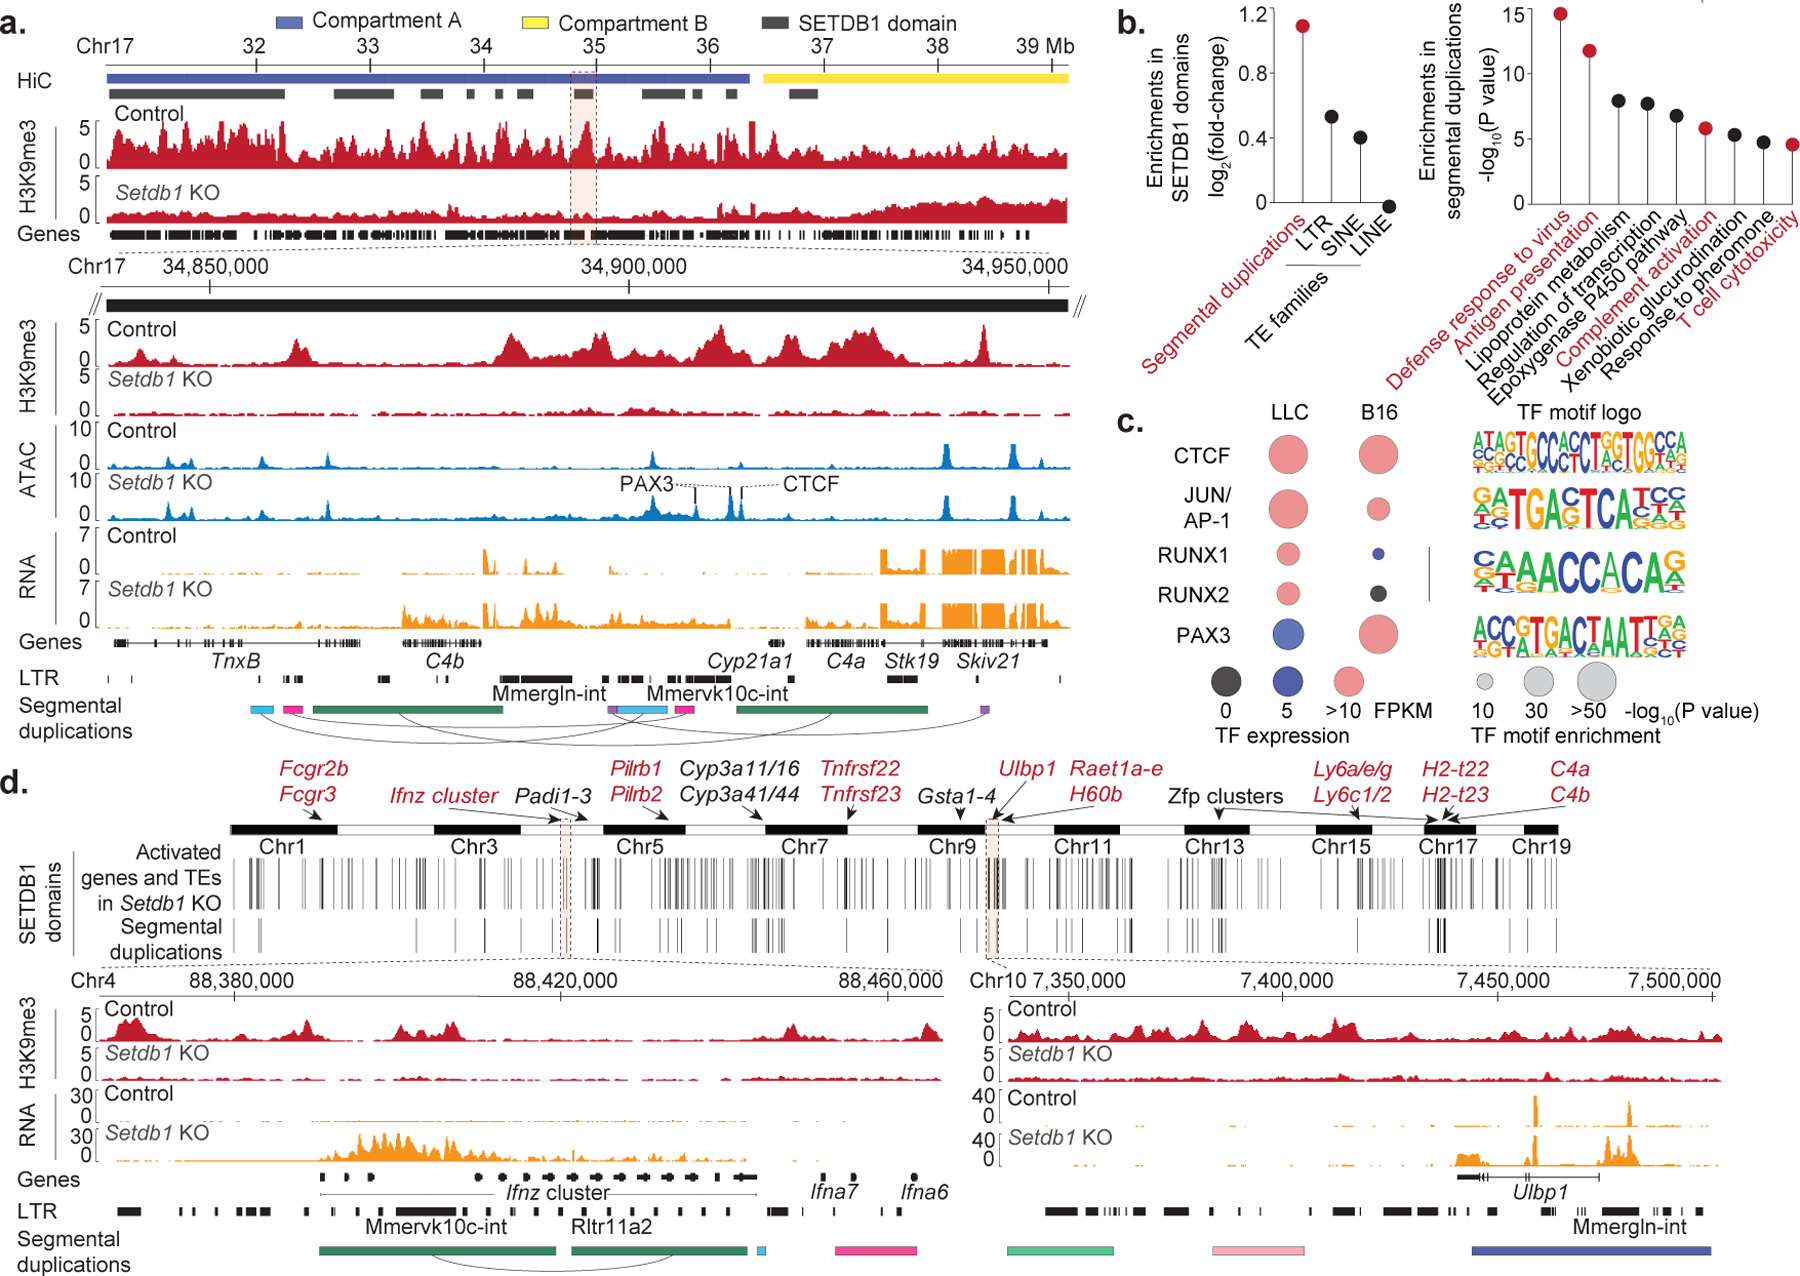
(a) Tracks show H3K9me3 ChIP-seq, genomic compartments, SETDB1 domains, and genes in control and Setdb1 KO B16 for a 9Mb interval of chr17. Expanded view (below) of the C4a/b locus shows ATAC-seq, RNA-seq, LTRs, and segmental duplications paired by arcs. (b) Enrichment analyses for segmental duplications and TEs within SETDB1 domains (left), and gene-ontology categories within SETDB1 domains overlapping segmental duplications (right). Statistics by permutation and hyper-geometric tests. (c) Basal expression, motif enrichment, and logos for TFs enriched within TE-associated ATAC-seq sites gained in Setdb1 KO cells. Enrichment statistics by binomial test. (d) Genome-wide view (top) shows SETDB1 domains and overlapping segmental duplications (>10kb) exhibiting coordinate activation of genes and TEs upon Setdb1 KO. Expanded views (bottom) show the Ifnz and Ulbp1 loci.
SETDB1 domains were enriched for TEs of the long terminal repeat (LTR) family and for segmental duplications, a class of ‘low-copy’ genomic repeat not previously linked to SETDB1 (Fig. 3b, Supplementary Table 3). Segmental duplications arise, in part, through TE-associated homologous recombination and play central roles in gene evolution and structural variation within and between species6.
We identified 530 segmental duplications (>10kb) within SETDB1 domains. These regions were strongly enriched for genes involved in immune-related processes, including viral defense, antigen presentation, and T-cell cytotoxicity (Fig. 3b). Enrichments were less prominent at segmental duplications that did not coincide with SETDB1 domains (Supplementary Table 4). These findings implicate SETDB1 in the epigenetic control of TEs, segmental duplications, and immune genes within evolving loci.
Latent TE-encoded regulatory elements
We next investigated the impact of SETDB1 on gene regulation. Upon SETDB1 loss, thousands of discrete chromatin accessible sites arose within SETDB1 domains. The majority of these sites were distal from gene promoters and coincided with TEs (67% in LLC; 73% in B16). Approximately half also acquired H3K27ac upon Setdb1 KO, and thus resembled active enhancers. Consistently, increased TE accessibility loss was associated with upregulation of nearby genes (Extended Data Fig. 5a–e).
Comparison of TE insertions that gained accessibility upon SETDB1 loss in the respective tumor models revealed an association with cell-specific TFs. TEs that gained accessibility in Setdb1 KO LLC were enriched for RUNX motifs, consistent with preferential expression of Runx1 and Runx2 in this model (Fig. 3c). TEs that gained accessibility in Setdb1 KO B16 cells were enriched for motifs recognized by PAX3, a melanocytic regulator expressed in B16. Motifs recognized by AP-1 and CTCF were enriched in both models, consistent with general roles in cancer-associated stress responses and genome topology, respectively. This suggests that SETDB1 domains contain thousands of TEs with latent regulatory potential.
Activation of TEs and immune clusters
We next characterized specific loci that are transcriptionally activated upon SETDB1 loss. We identified 543 SETDB1 domains that exhibit coordinate activation of TEs and nearby genes in Setdb1 KO LLC or B16 cells (Fig. 3d). These loci contain numerous segmental duplications and immune-related gene clusters, including an exemplary locus on 4qC4 with a species-specific cluster of IFN genes. Although silent in control cells, Setdb1 KO broadly derepressed this locus, including a MMERVK10c element and an array of CTCF-binding sites that have been linked to its rapid evolution in C57BL/6 mice21.
Another striking example is two duplicated loci containing clusters of NKG2D ligands: Ulbp1 (10qA1) and the closely related Raet1 family (10qA3). The Ulbp1 and Raet1-family genes encode ligands that activate the NKG2D receptor on NK and CD8+ T-cells, and their expression on cancer cells can trigger immune killing22. Setdb1 KO derepressed multiple TEs and genes in both loci (Fig. 3d, Extended Data Fig. 5f–g).
Other activated loci encode clusters of Fc-gamma receptor genes (1qH3), tumor necrosis factor receptor superfamily members (7qF5), lymphocyte antigen 6 (Ly6) family members (15qD3), non-canonical MHC class I (MHC-I) genes (17qB1), and complement genes (17qB1), among others (Fig. 3d). These findings implicate SETDB1 in the silencing of diverse categories of immune genes at loci associated with segmental duplications and TE-driven evolutionary processes.
SETDB1 targets TEs with coding potential
Hundreds of TE insertions were activated in Setdb1 KO cells, 44% of which were in SETDB1 domains (Fig. 4a). Induced TEs were predominantly LTR-type (79–84%), including MMERGLN, MMVL30, and MMERVK10C elements (Extended Data Fig. 6a). TEs targeted by SETDB1 showed low expression in normal tissues, with the exception of two groups of insertions that were basally expressed in normal testis or control LLC or B16 cells (Fig. 4a). Interestingly, bi-directional transcription at induced TEs was rare and did not provoke viral mimicry or IFN signatures (Extended Data Fig. 6b)23,24.
Figure 4. SETDB1 loss induces TE-encoded viral antigens.
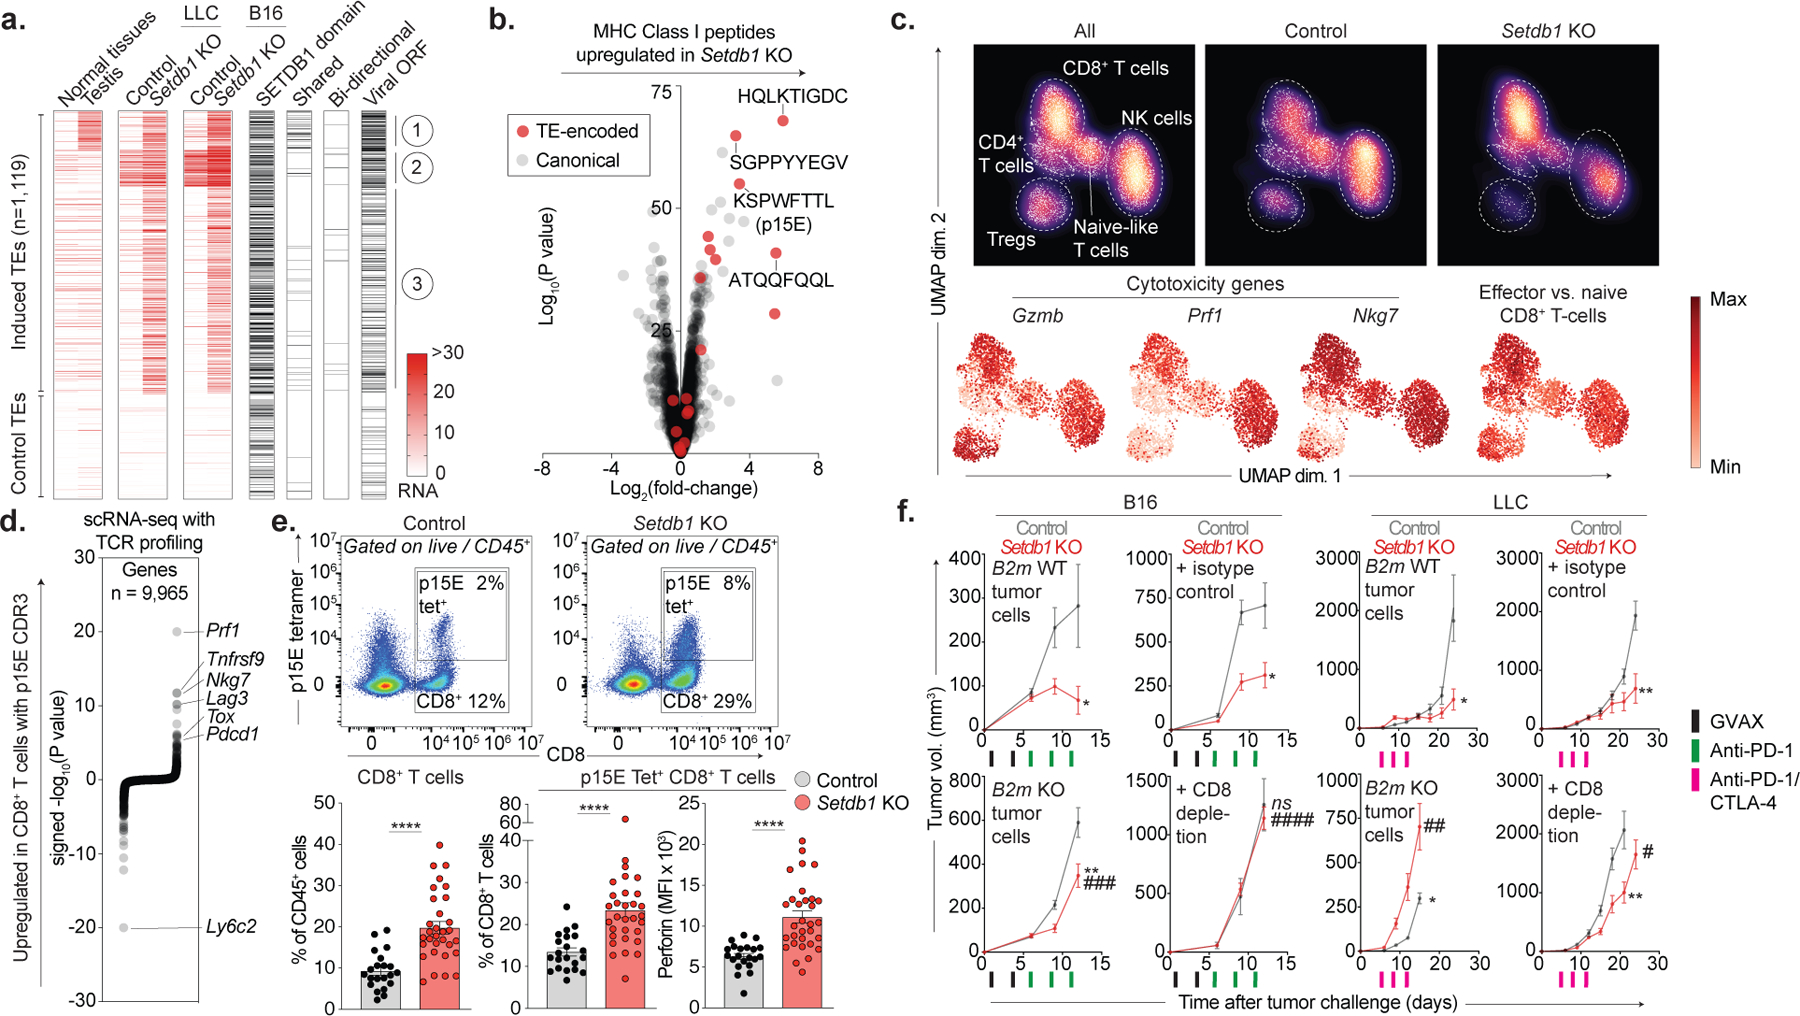
(a) Heatmap shows RNA expression for TE insertions (rows) activated upon Setdb1 KO (top) versus downsampled controls (bottom). Median expression across 17 normal tissues and testis is indicated. Additional columns identify TEs within SETDB1 domains, and those that are activated in Setdb1 KO LLC and B16 (shared), undergo bidirectional transcription, or retain intact viral ORFs. (b) MHC-I peptidomics of LLC depicts TE-encoded (red) and canonical (grey) peptides in Setdb1 KO versus control. (c) UMAP density plots (top) of scRNA-seq (3’) for 4,497 lymphoid cells identified within CD45+-enriched immune cells from control (n=7) or Setdb1 KO (n=7) LLC tumors. Red heat (bottom) depicts expression of cytotoxicity genes and an effector CD8+ T-cell signature. Data represent one experiment. (d) scRNA-seq (5’) with TCR profiling of 9,526 CD8+ T-cells identified within CD4+/CD8+-enriched cells from control (n=8) or Setdb1 KO (n=6) LLC tumors. Plot shows differential expression of genes in CD8+ T-cells with p15E-specific TCRs versus T-cells with TCRs of no known specificity. Data represent one experiment. (e) Flow cytometry of total and p15E-specific CD8+ T-cells isolated from control (n=20) and Setdb1 KO (n=30) LLC tumors. Data are mean +/− s.e.m and representative of two experiments. Statistics by two-sided Student’s t-test. (f) Tumor growth (mean volume +/−s.e.m) for ICB-treated mice inoculated with control or Setdb1 KO tumor cells with intact (B2m WT) or deficient (B2m KO) MHC-I. Analogous curves shown for mice receiving isotype-control or CD8-depleting antibodies. Data represent 1 experiment in each cell-line (n=10 in LLC and n=15 in B16 per genotype/treatment). Statistics by two-sided Student’s t-test at indicated time-points. Stars and pound-signs indicate significance within or across the indicated genotypes/treatments, respectively. */#P < 0.05; **/##P < 0.01; ***/###P < 0.001; ****/####P < 0.0001.
We therefore considered alternative mechanisms of immune sensitization. Adaptive immune responses against TE-encoded antigens have been described in human cancers and mouse models25–28. We found that TEs activated upon Setdb1 KO were enriched for LTR-family insertions containing intact open reading frames (ORFs) within remnant gag, pol, and env genes (Fig. 4a). Overall, TEs with intact ORFs comprised 28% (123/434) and 35% (240/685) of activated insertions in Setdb1 KO LLC and B16, respectively (Extended Data Fig. 6d).
Induced TE-encoded ORFs included a murine leukemia virus (MuLV) envelope (Env) protein, which was upregulated in Setdb1 KO cells by flow cytometry. Mass spectrometry of the TE-encoded proteome in B16 cells identified 20 tryptic peptides mapping to TE-encoded proteins (Gag, Pol, Env), including 6 that were significantly upregulated upon Setdb1 KO (Extended Data Fig. 6e–f).
Induced TEs encode MHC-I peptides
To identify antigens that could drive T-cell responses against Setdb1 KO tumors, we scanned TE-encoded ORFs identified by RNA-seq for 8–10-mer peptides predicted to bind MHC-I in LLC or B16. This nominated 416 TE-encoded epitopes upregulated in Setdb1 KO LLC or B16, including 45 basally expressed in both models, and three known MuLV-derived MHC-I peptides (H2-Kb, ATQQFQQL and KSPWFTTL; H2-Db, LGGVNPVAL) (Extended Data Fig. 6g). The KSPWFTTL/p15E peptide is known to drive H2-Kb-restricted T-cell responses against C57BL/6-derived tumors27,28.
To validate these predictions, we profiled the MHC-I peptidome using mass spectrometry of immunoprecipitated H2-Kb. Remarkably, 5 of the 10 most induced MHC-I peptides in Setdb1 KO LLC cells derived from TEs, including the KSPWFTTL/p15E and ATQQFQQL peptides (Fig. 4b, Supplementary Table 5). Thus, TE-encoded MHC-I peptides are candidate targets of T-cell immunity following Setdb1 loss.
To assess whether SETDB1 also silences TE-encoded MHC-I peptides in human cancer, we profiled RNA expression in A375 cells, a BRAF-mutant melanoma with SETDB1 (1q21.3) amplification. Consistent with our findings in mouse, SETDB1 KO induced hundreds of TEs (n=337) in A375, particularly of the LTR family (57%), but did not trigger viral mimicry. Upregulated TEs were enriched for insertions with intact ORFs (13.4%) and included 536 (unique) putative MHC-I peptides, suggesting that silencing of antigenic TEs by SETDB1 is conserved between human and mouse (Extended Data Fig. 7a–d).
T-cells recognize TE-encoded antigens
We reasoned that MHC-I presentation of TE-encoded antigens could drive T-cell responses against Setdb1 KO tumors. RNA-seq of Setdb1 KO LLC tumors revealed enrichments for pro-inflammatory gene sets and upregulation of cytotoxicity genes, indicating enhanced immune infiltration. T-cell receptor (TCR) repertoire analysis also revealed greater variation in clonotype abundance (skewing) in untreated Setdb1 KO tumors, suggesting expansion of T-cell clones against induced antigens (Extended Data Fig. 8a–c).
To characterize infiltrating lymphocyte populations, we performed single-cell RNA-seq (scRNA-seq). This confirmed an expansion of CD8+ T-cells expressing canonical cytotoxicity genes following Setdb1 loss, and a shift towards cytotoxic NK-cell phenotypes (Fig. 4c, Extended Data Fig. 8d–h). We then evaluated whether CD8+ T-cell populations recognized TE-encoded MHC-I peptides using targeted TCR profiling and scRNA-seq. First, we sorted p15E-tetramer+ T-cells and performed TCR sequencing. This revealed 377 high-confidence CDR3 sequences from p15E-specific T-cells (Fig. 4d, Extended Data Fig. 9a–d, Supplementary Table 6). Single-cell analysis of CD8+ T-cells harboring p15E-specific TCRs revealed upregulation of genes associated with T-cell cytotoxicity (Prf1, Nkg7) and activation/exhaustion (Tox, Pdcd1, Tnfrsf9, Lag3). We validated these findings by tetramer staining and flow cytometry of tumor-infiltrating T-cells. Setdb1 KO LLC tumors exhibited increased infiltration of CD8+ T-cells and p15E-specific CD8+ T-cells, and increased expression of cytotoxicity markers on p15E-specific subsets (Fig. 4e).
These results suggested that MHC-I presentation and CD8+ T-cell recognition of TE-encoded antigens drive immune responses against Setdb1 KO tumors. While Setdb1 KO had minimal effects on MHC-I expression, ablation of MHC-I (B2m KO) suppressed ICB sensitivity in LLC and B16 following SETDB1 loss (Fig. 4f, Extended Data Fig. 5g and 10a–b). Depletion of CD8+ T-cells (but not NK cells) also suppressed the sensitizing effect of Setdb1 KO in both models These findings confirm a requirement for antigen presentation to CD8+ T-cells in driving immune responses induced by Setdb1 KO.
Discussion
We present in vivo screens that identify SETDB1 as a suppressor of tumor-intrinsic immunity. SETDB1 establishes large domains of repressive chromatin concentrated at segmental duplications - evolving loci enriched for TEs and immune genes. We find that SETDB1 loss de-represses TEs with the potential to encode viral proteins, generate MHC-I peptides, and trigger T-cell responses3, which may be amplified by other immune-stimulatory genes in SETDB1 domains.
The SETDB1-containing KAP1 complex is known to restrain TEs during genome evolution17. Our work extends this model by suggesting that SETDB1 buffers the impact of transposition and segmental duplication events, thereby moderating the phenotypic consequences of these alterations. We hypothesize that SETDB1 buffers the evolution of immune genes within segmental duplications, and may also contribute to epigenetic memory in these regions by silencing TEs with gene-regulatory potential29,30.
Although SETDB1 appears to play analogous roles in human and mouse, its genomic targets will likely diverge between species. Examples include the mouse-specific IFN cluster, and the differential structure and regulation of loci encoding NKG2D ligands. Our data suggest that SETDB1-associated immune phenotypes may be pleiotropic and context-dependent; whereas a given locus may acquire latent potential upon SETDB1 loss, activation of its TEs, enhancers, and genes may depend on lineage-specific TFs.
Further study is needed to clarify how SETDB1 impacts the regulation of TEs, segmental duplications, and immune genes across tumor types and non-malignant cells. A deeper understanding of its context-specific functions could yield epigenetic therapies that selectively enhance anti-tumor immunity.
Methods
Cell Lines
B16F10 melanoma cells (B16) and B16-GM-CSF lines were received as a gift from G. Dranoff. Lewis Lung Carcinoma (LLC) and A375 cells were obtained from ATCC. All cell lines were tested for mycoplasma and cultured in RPMI (VWR) or DMEM media (Gibco) supplemented with 10% fetal bovine serum (FBS) and antibiotics.
Animal treatment
All animal studies and protocols were approved by the Broad IACUC committees, and all ethical standards were upheld. All mice were kept in pathogen-free facilities at the Broad Institute. Six to seven-week-old C57BL/6J female mice were obtained from Jackson Laboratories. A colony of immune incompetent NOD.Cg-Prkdcscid Il2rgtm1Wjl /SzJ (NSG) mice were bred at the Broad Institute. For all tumor challenges, 6–12 week-old, age-matched mice were used and pre-specified end-points for tumor size were adhered to as defined by the Broad IACUC, including 2.0cm in maximum dimension for validation studies and 2.5cm in maximum dimension for screens with daily monitoring.
In vivo chromatin regulator CRISPR screens in the B16 and LLC models
We designed a pooled sgRNA library targeting 936 genes with annotated functions in chromatin regulation (6 sgRNAs per gene) and delivered this pool to B16 or LLC cells engineered to stably express spCas9 (Supplementary Table 1)31. After transduction, B16 or LLC cells were selected and expanded in vitro for 7–10 days prior to transplantation into recipient mice. For tumor challenges, 2.0 × 10⁶ pool-infected B16 or LLC cells were resuspended in a 1:1 mixture of 1X Hanks balanced salt solution (HBSS, Gibco) and growth factor-reduced Matrigel (Corning) and inoculated subcutaneously in the bilateral flanks of recipient mice. A total of 25 mice were inoculated (n=50 total bilateral tumors) for each cell-line (B16 or LLC) and treatment condition (NSG, untreated WT, WT+ICB). For the B16 screen, treated mice received subcutaneous injections on the abdomen on days 1 and 4 with 2.0 × 10⁵ B16 GM-CSF secreting cells (GVAX) that had received 35 Gy of irradiation prior to administration. These mice then received intraperitoneal (i.p.) injections of 100 ug of rat monoclonal anti-PD1 antibodies (Bio X Cell, clone 29F.1A12) on days 6, 9, and 12. B16 tumors were harvested on day 12 (for untreated and NSG mice) and day 15 (for treated mice). For the LLC screen, treated mice received 200 μg of anti-PD1 antibodies and 200 ug of mouse anti-CTLA-4 antibodies (Bio X Cell, clone 9D9) i.p. on days 6, 9, and 12. LLC tumors were harvested on day 12 (for untreated and NSG mice) and day 15 (for treated mice). To evaluate effects on cellular fitness, pool infected B16 or LLC cells were also maintained in culture until the corresponding in vivo screen had concluded. After screen completion, collected tumor tissue was homogenized and placed into a 1:10 Proteinase K:ATL buffer mixture (Qiagen) for overnight digestion. Following digestion, gDNA was isolated using DNEasy Blood and Tissue genomic DNA isolation kits (Qiagen). PCR was then used to selectively amplify the sgRNA region and determination of sgRNA abundance was performed by Illumina sequencing (Extended Data Fig. Enrichment or depletion of sgRNAs from any set of conditions was determined using the STARS algorithm (Extended Data Fig. 1a/b, Supplementary Table 2)31.
Generation and validation of CRISPR knock-out cell lines
For validation studies, CRISPR knock-out (KO) was performed using two distinct sgRNA via transient transfection of spCas9 and guide RNA (in B16 cells), or lentiviral delivery of guide RNA into cells stably expressing spCas9 (in B16, LLC, and A375). All edited cell lines were validated for KO efficiency by western blot and/or amplicon sequencing of targeted loci. For western blot validations of KO cells, whole cell lysates from edited cells were collected in RIPA lysis buffer with 2x protease inhibitor cocktail (Roche) and 30–100 μg of protein was run on 4–12% Bolt Bis-Tris Plus gels (Life Technologies) with MES buffer (Life Technologies). Proteins were then transferred onto 0.45 μm nitrocellulose membranes (Bio-Rad) and incubated at 4°C overnight with rabbit polyclonal anti-SETDB1 primary antibodies diluted at 1:1000 (ProteinTech, 11231–1-AP) and α-tubulin mouse monoclonal loading control antibodies diluted at 1:10,000 (Abcam, ab7291). The following day, membranes were incubated for 1-hour with the corresponding IRDye Secondary antibodies (LI-COR Biosciences), blots were imaged and analyzed on Odyssey CLx Imaging System (LI-COR Biosciences) and Fiji/ImageJ (v2.0.0), respectively. For amplicon sequencing-based validation of KO efficiency, custom PCR primers were designed surrounding target sites for the respective Setdb1, Trim28, Tasor, Mphosph8, and B2m sgRNAs. Genomic DNA was isolated from edited cells using the DNeasy Blood and Tissue kit (Qiagen) and targeted loci were PCR-amplified and analyzed by Illumina sequencing.
CRISPR sgRNA sequences:
Gene name, sgRNA number, and sequence are as follows:
For B16 and LLC (mouse) experiments:
Setdb1 sgRNA 1 AGGACTAAGACATGGCACAA;
Setdb1 sgRNA 2 GTAATCTATAAGACACCCTG;
Trim28 sgRNA 1 CCAGCGGGTGAAATACACCA;
Trim28 sgRNA 2 AGGCGTTCAAGGCTCACACG;
Mphosph8 sgRNA 1 TGACCTTATAAGTATTGAAG;
Mphosph8 sgRNA 2 CTGAAATAATCGGTTTCGAT;
Fam208a (Tasor) sgRNA 1 ATAGGCTCTATATGCCAAGA;
Fam208a (Tasor) sgRNA 2 CGAAGGGGCCTCCGTCTCCG;
B2m sgRNA 1 AGTATACTCACGCCACCCAC;
Control sgRNA 1 GCGAGGTATTCGGCTCCGCG;
Control sgRNA 2 ACGTGTAAGGCGAACGCCTT;
Control sgRNA 3 ATTGTTCGACCGTCTACGGG.
For A375 (human) experiments:
SETDB1 sgRNA 1 GGTAATACAGAAAGAATCTG;
SETDB1 sgRNA 2 ATACCGGGACAGTAGCTCTG;
Control sgRNA 1 GCGGGCAGAACGACCCTGAC;
Control sgRNA 2 CGCGCACCACGGGCGCGCAC.
In vivo target validation experiments in the B16 and LLC models
For validation experiments, 1.0 × 10⁶ CRISPR KO tumor cells were resuspended in 1X HBSS (Gibco) and injected subcutaneously on the right flank of recipient mice. Group size for animal studies was determined based on experience with prior validation experiments and, where possible, used n=10–15 mice per group. For B16 experiments, treated mice were injected subcutaneously on D1 and D4 on the abdomen with 40,000 GVAX cells and treated with 100 μg of anti-PD1 antibodies on days 6, 9, and 12, with some experiments also receiving an additional dose on D15. Mice with LLC tumors assigned to treatment received 200 μg of rat monoclonal anti-PD1 antibodies and 200 ug of mouse anti-CTLA-4 antibodies on days 6, 9, and 12. For CD8+ T-cell and NK cell depletion studies, 200 μg of rat anti-CD8a antibodies (Bio X Cell, clone 53–6.7) and 200 μg of mouse anti-NK1.1 antibodies (Bio X Cell, PK136) were injected i.p. starting on day −3 prior to tumor challenge, and administered every 3 days through day 18 following tumor challenge; rat IgG2a (Bio X Cell, clone 2A3) and mouse IgG2a antibodies (Bio X Cell, clone C1.18.4) at 200 μg were used as controls. Beginning on day 6 after tumor challenge, tumors were manually measured every 3 days for length (the longest dimension) and width (the longest perpendicular dimension); tumor volume was calculated using (L × W2)/2 and is plotted as mean (mm3) +/− s.e.m. with statistics by two-sided Student’s t-test. Mice were followed until predefined endpoints were reached (tumor length >20 mm in greatest dimension, or tumor ulceration >25% of surface area) with overall survival statistics by log-rank test. Tumors were defined as “cured” if no palpable tumor was identified for 3 consecutive measurements. When indicated, mice were euthanized per IACUC regulations using CO2 inhalation. Mice were randomized for treatment after tumor inoculation and researchers were not blinded to group identity. Tumor growth and survival data were plotted in Graph-Pad Prism (v8.0).
Analysis of genomic data from TCGA and ICB-treated cohorts
Batch effect normalized mRNA data, GISTIC2 gene-level copy number, and GISTIC2 thresholded copy number calls were downloaded from Pancan cohort of Xena browser, and subsetted to a final set of 9,992 patients for which all data types were available32. Amplified patients were defined as those having gistic thresholded copy number calls of 1 (low amplification or copy-gain) or 2 (high amplification). For gene set enrichment analysis, we selected the 18 TCGA cohorts with at least 200 available patients and downsampled to achieve even sample sizes per cohort. Within this cohort of 4950 patients, we calculated a ranked gene list based on the Pearson’s correlation of each gene with SETDB1 expression, and used this list as the input to GSEA (version 4.0.3) pre-ranked against MsigDB’s Hallmark gene set H v7.1.133–35. Clinical outcomes and processed genomic data, including normalized RNA-seq and GISTIC2 copy-number calls, for the renal cell carcinoma (Checkmate 25 trial) ICB-treated cohort was accessed from relevant publications19,36. Survival statistics by log-rank test.
Chromatin immunoprecipitation followed by sequencing (ChIP-seq)
For ChIP-sequencing studies, ten million LLC or B16 cells per sample were cross-linked with 1% formaldehyde for 15 min, quenched with glycine, and subjected to two-step cell and nuclear lysis in the presence of protease inhibitors (Roche). Shearing of samples was optimized such that the final DNA length was approximately 400 base pairs using a Branson sonifier, and was followed by incubation with anti-H3K9me3 polyclonal antibody (Abcam, ab8898) overnight at 4°C. Immunoprecipitation was performed with 50:50 mixes of magnetic dynabeads Protein A and G (Invitrogen). Following elution and reverse cross-linking, end-repair, A-tailing, adapter ligation, and library amplification were performed with the Kapa HyperPrep kit (Roche). ChIP-seq studies for H3K27ac were performed using 250,000 B16 cells per sample, micrococcal nuclease (MNase)-based fragmentation, and immunoprecipitation with polyclonal anti-H3K27ac antibodies (Active Motif, 39133), as previously described37,38.
Assay for transposase-accessible chromatin using sequencing (ATAC-seq)
For ATAC-sequencing studies, nuclei from fifty-thousand LLC or B16 cells were isolated using Nuclei EZ buffer (Sigma). Isolated nuclei were then tagmented with Tn5 transposase and libraries were constructed as previously described39.
RNA sequencing (RNA-seq)
For RNA-seq studies, approximately one million cultured B16, LLC, or A375 cells were harvested and resuspended in RLT lysis buffer with ß-mercaptoethanol (1:100 dilution). For harvested LLC tumors grown in vivo tissue was first placed in RNAlater (Invitrogen) reagent, frozen, and then homogenized in RLT lysis buffer using a TissueLyser II (Qiagen) instrument. Total RNA was isolated using an RNeasy kit (Qiagen). Poly(A)-enriched sequencing libraries were then constructed with the NEBNext Ultra or Ultra II Directional RNA Library Prep Kits (New England Biolabs).
Single-cell RNA sequencing (scRNAseq) of tumor-infiltrating immune cells
CD45+ or CD4+/CD8+ enriched immune cells were isolated from control and Setdb1 KO LLC tumors after 15 days of expansion in vivo with or without treatment with PD-1/CTLA-4 blockade. For CD45+-enrichments, a total of 7 control (3 untreated, 4 ICB-treated) and 7 Setdb1 KO (3 untreated, 4 ICB-treated) unilateral tumors were harvested. For CD4+/8+-enrichments, a total of 8 control (4 untreated, 4 ICB-treated) and 6 Setdb1 KO (3 untreated, 3 ICB-treated) unilateral tumors were harvested. Harvested tumor tissue was dissociated into single cell suspension with a Tumor Dissociation Kit (Miltenyi) at 37 degrees. Isolation of immune cells was performed by density centrifugation with Lympholyte reagent (CedarLane labs) followed by positive selection for CD45+ or CD4+/CD8+ cells with MicroBeads and magnetic separator (Miltenyi). Droplet-based isolation of single cells and subsequent preparation of 3′ (for CD45+ enriched cells) or 5’ (for CD4+/CD8+ enriched cells) sequencing libraries was performed with the Chromium Controller using the 10x Genomics platform, according to the manufacturer’s specifications.
Library clean-up, quantification, and sequencing
Clean-up of all sequencing libraries was performed with Ampure XP (“SPRI”) beads (Beckman-Coulter). Characterization of all sequencing libraries was performed with BioAnalyzer (Agilent), TapeStation (Agilent) and Qubit (ThermoFisher) instruments. Pooled equimolar libraries were sequenced with Illumina instruments (MiSeq, HiSeq, NextSeq, or NovaSeq).
Identification of genome compartments from HiC data
To identify compartments A and B in the mouse genome, published HiC data was used for mouse ESC and NPC cells40,41. Valid pairs of HiC reads were downloaded and processed with juicer-tools Pre function to generate contact matrices in .hic format. The contact matrix was further processed with the juicer-tools Eigenvector function to identify PC1 from the Pearson matrix at 100kb resolution. Regions with PC1 >0 in both cell lines were identified as compartment A. The regions with PC1 <0 in either cell line were identified as compartment B.
Analysis of H3K9me3 and H3K27ac ChIP-seq data
ChIP-seq reads for H3K9me3 and H3K27ac were first trimmed by Trim Galore (v0.4.5) to remove adapter sequences. The trimmed reads were aligned to mm9 by Bowtie (v2.2.2) with the parameters –N 1 –L 25 -X 2000 --no-mixed --no-discordant. All unmapped reads and PCR duplicates were removed. Non-uniquely mapped reads were assigned to the position with the best matched score. For downstream analyses, read counts were normalized by computing the numbers of reads per kilobase of bin per million of reads (RPKM). H3K9me3 peaks were identified by calculating RPKM in the 100bp bin first. According to the signal distribution, each bin with RPKM more than 0.15 was selected as the signal bin. Signal bins within 500bp of each other were merged and called as signals/peaks. To identify the gain of H3K27ac signals at distal TE ATAC-seq peaks in B16, RPKM of H3K27ac on those peaks was calculated. These analyses required 1.5-fold more RPKM signal in Setdb1 KO versus control, with a minimum RPKM of >0.1 in KO cells and a maximum RPKM of <0.5 in control cells.
Identification of chromatin accessible sites from ATAC-seq data
ATAC-seq reads were first trimmed by Trim Galore (v0.4.5) to remove adapter sequences. The trimmed reads were aligned to mm9 by Bowtie (v2.2.2) with the parameters: -N 1 -L 25 -X 2000 –no-mixed –no-discordant. All unmapped reads and PCR duplicates were removed. Non-uniquely mapped reads were assigned to the position with the best matched score. All ATAC sites were called by the MACS2(v2.1.1) callpeak function with the parameters –nolambda –nomodel. ATAC sites that were at least 10 kb away from annotated promoters from the refFlat annotation were selected as “distal” ATAC sites. Distal ATAC sites overlapping (>1bp) TEs from RepeatMask annotations were identified as distal TE-associated ATAC sites. To identify gained ATAC sites in Setdb1 KO cells, RPKM were calculated on merged ATAC sites identified in control and Setdb1 KO cells. Gained ATAC sites were identified by requiring 2-fold more RPKM signal in Setdb1 KO versus control cells, with a minimum RPKM of more than 0.5. To find sequence motifs enriched in gained ATAC sites at distal TEs, findMotifsGenome.pl from the HOMER program was used with default parameters42. Motifs with known matches in the HOMER database were selected. ATAC sites were down-sampled to equivalent numbers to compare motif enrichments between samples and compute statistical significance.
Analysis of gene expression from RNA-seq data
RNA-seq reads were aligned to the mm9 or GRCh38 genomes by HISAT2 with default parameters. All unmapped reads were removed. Read counts were calculated by featureCounts using uniquely mapped reads, and differentially expressed genes were identified by DESeq2 with a cutoff of more than 1.5 fold-change and a p-value of less than 0.05. The gene expression level (FPKM) was calculated by StringTie based on the mm9 refFlat annotation database. Gene expression analysis was also performed in GRCm38 as described below in “Analysis of TE insertion expression from RNA-seq data”.
Identification of SETDB1-regulated H3K9me3 peaks and SETDB1 domains
RPKM values were calculated at a set of merged H3K9me3 peaks that were identified in control or Setdb1 KO cells. Requirements to identify peaks with H3K9me3 loss included (i) 2-fold more signal in control versus Setdb1 KO cells; (ii) a minimum RPKM of 0.05 in control cells; and (iii) a maximum RPKM of 0.05 in Setdb1 KO cells. To identify regions containing clustered SETDB1-dependent H3K9me3 peaks, the number of lost H3K9me3 peaks in Setdb1 KO cells within 100kb sliding windows (50kb increments) was calculated across the genome. In addition, the number of random regions (of identical lengths to the H3K9me3 peaks lost in Setdb1 KO cells) that were located within these same 100kb sliding windows was determined. Windows with 7 or more lost H3K9me3 peaks were then established as a threshold that reliably distinguished clustered SETDB1-dependent regions from controls in both B16 and LLC cells (Extended Data Fig. 4b–c). 100kb windows with 7 or more lost peaks in Setdb1 KO cells were then defined as regions showing clustered SETDB1-dependent H3K9me3. Overlapping 100kb windows containing clustered SETDB1-dependent H3K9me3 peaks were merged to define an initial set of SETDB1 domains (Extended Data Fig. 4c). The ends of each merged window were then trimmed until the first and last SETDB1-dependent peaks were detected. Domains that (i) were shorter than 50kb, and (ii) that had less than 8kb of minimum base coverage by SETDB1-dependent H3K9me3 peaks were then removed (Extended Data Fig. 4c). This resulted in a final set of 852 and 1,327 SETDB1 domains in LLC and B16 cells, respectively, which represented a total of 1,544 unique (union) and 635 shared (intersection) regions across these cell types (Extended Data Fig. 4c).
Enrichment analysis for TEs and segmental duplications in SETDB1 domains
Permutation testing was used to evaluate if SETDB1 domains were enriched for specific genomic features, including TEs and segmental duplications. Analyses were performed using SETDB1 domains present in either cell line (LLC or B16, union), or SETDB1 domains present in both cell lines (LLC and B16, intersection). Accordingly, 20 random sets of control regions with identical lengths and compartment representation to SETDB1 domains were generated. Compartment representation was controlled by ensuring that the distribution of compartment A vs B was similar between background (control regions) and foreground (SETDB1 domains). The number of SETDB1 domains overlapping different TE families (minimum 50% of TE overlap with domain), including LTR, SINE, and LINE elements, as well as large segmental duplications (>10kb), was calculated and compared to the average number of overlaps with control regions. The log2 ratio of ‘observed over expected’ values was then generated to determine enrichment. The P value was calculated as the number of times that the permutation yielded values more or less than the observation, divided by the number of permutations. Permutations were performed 20 times.
Gene ontology analysis at segmental duplications within SETDB1 domains
All genes overlapping (>1bp) large segmental duplications (>10kb) were identified within the union of SETDB1 domains (n=423 genes). In addition, genes from segmental duplications (>10kb) that do not overlap SETDB1 domains were identified (n=1,303 genes). Background sets for enrichment analyses were defined as all genes from the genome (n=24,083 genes). Searches for GO term enrichments were performed using the standard hyper-geometric statistics from the GOrilla web-tool43–46.
Gene activation nearby SETDB1-regulated ATAC sites within SETDB1 domains
The set of genes located within 50kb of distal, TE-encoded ATAC sites gained in Setdb1 KO cells were identified (n=1600 and 1053 in LLC and B16, respectively). An equal number of randomly selected genes was also identified as a control gene set. The log2 ratio of RNA expression in Setdb1 KO over control cells for each of these gene sets was identified to identify enrichments for gene activity nearby de-repressed TE-associated distal ATAC sites. The p-value was calculated as the number of times that the permutation yielded values more or less than the observation, divided by the number of permutations. Permutations were performed for 20 times.
Analysis of TE insertion expression from RNA-seq data
The expression of individual TE insertions was quantified in RNA-seq data from control and Setdb1 KO LLC and B16 cells, and a panel of 17 normal tissues from ENCODE (Supplementary Table 7)47,48. For LLC and B16, parallel analyses were performed in the mm9 and GRCm38 reference genomes to replicate findings across different genome assemblies. To quantify the expression of individual TE insertions and identify activated TEs in mm9, RPKM values were calculated based on the mm9 RepeatMasker annotations using uniquely mapped RNA-seq reads. Activated TEs in Setdb1 KO cells were identified with a cutoff of more than 2-fold change and a minimum RPKM of 1. Both mm9 refFlat and RepeatMasker annotation databases were from the University of California Santa Cruz (UCSC) genome browser. To define TEs activated in Setdb1 KO LLC and B16 in GRCm38, stranded RNA-seq reads were pseudoaligned to an index consisting of the GRCm38 reference transcriptome (release 93), and approximately 4.7 million unique chromosomal TE sequences from ISB repeatmasker (version 4.0.5) using Salmon (version 0.14.1) with flags --gcBias --seqBias --validateMappings. Transcript-level estimates were summed using Tximport (version 1.14.2). Between sample normalization was performed using Deseq2’s median of ratios method, calculating size factors on gene expression only. Differential expression was also performed using DeSeq2 (version 1.26.0). The resulting list was filtered to define the set of TE insertions that were upregulated in Setdb1 KO cells with an adjusted P value < 0.05. To define TEs activated in SETDB1 KO A375 cells, pseudoalignment and differential expression were performed as above, using an index consisting of the GRCh38 reference transcriptome (release 93), and 5.2 million unique human chromosomal TE sequences from ISB repeatmasker (version 4.0.5).
Analysis of bi-direction transcription of TEs
To quantify the strand-specific expression of individual TE insertions activated upon Setdb1 KO, RNA-seq reads mapped to GRCm38 were assigned to forward and reverse strands separately and read counts were calculated by featureCounts. TE insertions were classified as undergoing bi-directional transcription if there were >50 total stranded reads and if >10% came from opposite strands.
Annotation and enrichment analysis for viral ORFs in SETDB1-regulated TEs
The set of activated TE insertions in Setdb1 KO LLC, B16, and A375 cells were further annotated with gEVE, a curated database of TEs with intact proviral ORFs of at least 80 amino acids in length49. Proviral ORFs were also annotated in a matched control set of TE insertions that were selected to represent a similar composition of TE types (e.g., LTRs) and similar expression levels in control cells. Fisher’s exact test was then used to determine the statistical significance of proviral ORF enrichment in SETDB1-regulated TEs versus controls.
Flow cytometry for MuLV envelope, NKG2D ligands, and MHC Class I
B16 or LLC cells grown in vitro were harvested and washed in MACS Buffer (PBS + 2% FBS) prior to antibody staining. Cells were stained with hybridoma supernatant against MuLV envelope proteins (ATCC, HB-10392) followed by secondary staining with fluorescent antibodies, or with directly conjugated fluorescent antibodies against ULBP1 (FAB2588P, R&D systems), pan-RAET1 (FAB17582P, R&D systems), or MHC Class I (28–8-6, BioLegend) at 1:100 dilution50. Cells were then analyzed using a CytoFLEX S Flow Cytometer (Beckman Coulter) and FlowJo software (FlowJo).
Flow cytometry for total and p15E-recognizing CD8+ T-cells
Mice were inoculated with 2.0 × 10⁶ LLC cells on the back and then treated with anti-PD1/CTLA4. On post challenge day 18, tumors were excised, weighed, and chopped before chemical and mechanical digestion with the Tumor Dissociation Kit (Miltenyi) and the gentleMACS Dissociator (Miltenyi) using the m-TDK-2 program. The resulting cell suspension was then passed through a 70 micron filter. Lymphocytes were then enriched using Lympholyte M cell separation media (Cedarlane), per the manufacturer’s instructions. Enrichment for CD45+ cells was performed using magnetic beads (Miltenyi) and the MultiMACS Cell24 Separator Plus (Miltenyi). Cells were then stained in PBS using Live/Dead Fixable Near-IR Dead Cell Stain Kit (1:100, ThermoFischer), H-2Kb MuLV p15E Tetramer (1:10, MBL International), and TrueStain FcX Plus (anti-mouse CD16/32) Antibody (1:1000, BioLegend). Samples were then stained for CD45 (1:100, Invitrogen) and CD8 (1:10, MBL International) in MACS Buffer. After washing, cells were fixed and permeabilized using the Fix and Perm Cell Permeabilization Kit (ThermoFischer) before staining for Perforin (1:25, S16009A, Biolegend). Samples were analyzed using a Cytoflex LX instrument (Beckman Coulter) using single-colour compensation controls and fluorescence-minus-one controls for setting gates.
Identification of TE-encoded proteins from whole-cell mass spectrometry
Deep proteomic analysis of control and Setdb1 KO B16 cell line samples with or without treatment with IFNγ (48hrs, 100ng/ul) was performed as previously described51. Briefly, samples were lysed in a lysis buffer containing 8M Urea, reduced, alkylated and digested with LysC (Wako Chemicals) and Trypsin (Promega). Digested peptides were then labeled with tandem mass tags (TMT-11, Thermo Fisher), combined, subjected to offline basic reversed-phase chromatography and pooled into 24 fractions. 1 μg per fraction was loaded onto an analytical column ((20–30 cm, 1.9 μm C18 Reprosil beads (Dr. Maisch HPLC GmbH), packed in-house PicoFrit 75 μm inner diameter, 10μm emitter (New Objective)). Peptides were eluted with a linear gradient (EasyNanoLC 1000, Thermo Scientific) ranging from 6–30 % Buffer B (either 0.1%FA in 90% ACN) over 84 min, 30–90% B over 9 min and held 90% Buffer B for 5 min at 200nl/min. Peptides were analyzed on a QExactive plus using data dependent acquisition. The top 12 most abundant precursors per MS1 cycle were fragmented using HCD at 35,000 resolution, with an isolation width of 0.7 m/z, collision energy NCE29, 5e4 AGC target and 120 ms maximum injection time. Dynamic exclusion was enabled for 13s. Spectra were searched using Spectrum Mill (Broad Institute) against a mouse reference proteome (Uniprot, downloaded 12/28/2017) including 264 common contaminants. 570 intact viral ORF sequences differentially expressed in the knockout were clustered in 234 representative protein sequences with CD-HIT. These 234 protein sequences were appended to the sequence database. Peptide spectrum matches were first filtered to 1.2% FDR before being rolled up into protein groups by further filtering the PSMs using a target protein-level FDR threshold of zero, the protein grouping method ‘expand subgroups, top uses shared’ with an absolute minimum protein score of 13. Protein groups were exported with the protein grouping method ‘expand subgroups ignore shared’ and TMT11 reporter ion intensities were corrected for isotopic impurities using the afRICA correction method with correction factors obtained from the reagent manufacturer’s certificate of analysis for lot number TMT11_TE270749-TD264064.
Analysis of MHC Class I binding affinities for putative TE-encoded peptides
To identify expressed proviral ORFs in B16 and LLC, pseudoaligment was performed using Salmon (version 0.14.1 with flags --gcBias --seqBias --validateMapping) on the GRCm38 reference transcriptome and approximately 54,000 unique, computationally predicted proviral ORFs from the gEVE murine database described above. Putative TE-encoded ORFs were selected that were highly expressed and significantly differential in control or Setdb1 KO LLC and B16 cells (adjusted P value < 0.05 by DeSeq2 analysis and average of greater than 50 Deseq2 normalized counts in the differential condition). Amino acid sequences from this set of differential TE-encoded ORFs were inputted into NetMHCpan (version 4.0) with flag --BA, and predicted MHC Class I binding affinities for 8 to 10-mer peptides for the relevant HLA types52. Using these predictions, two subsets of TE-encoded peptides predicted to strongly bind MHC Class I (Rank < 0.5) were identified. First, the subset of predicted MHC Class I peptides from TE-encoded ORFs that were highly expressed (> 50 Deseq2 normalized counts) in control LLC or B16 cells, and that were further upregulated upon Setdb1 KO. Second, the subset of predicted MHC Class I peptides from TE-encoded ORFs that had no detectable expression in control cells, but were significantly upregulated upon Setdb1 KO. A375 analysis was performed as above on Grch38 reference transcriptome and approximately 30,000 human orfs from gEVE. Strongly binding, differential subsets were defined with an expression cutoff of > 25 Deseq2 normalized counts.
Identification of TE-encoded MHC Class I peptides with immunopeptidomics
Immunoprecipitation of MHC-I:peptide complexes on control and Setdb1 KO LLC cells was performed as previously described using the Anti-H-2K clone Y-3 antibody (MilliporeSigma)53. To upregulate MHC Class I protein expression, cells were stimulated with IFNγ (16hrs, 10ng/ul) prior to immunoprecipitation. MHC-peptides were then eluted with 10% acetic acid and desalted on 50mg tC18 SepPak cartridges (Waters)54. Samples were then labeled with TMT11 (Thermo Fisher Scientific, lot #TE270748-TD264064). LLC samples were combined into one sixplexe (LLC-SETDB1 KO: 128N, 129N, 130N), desalted on a C18 Stage-tip and eluted into four fractions using basic reversed phase fractionation with increasing concentrations of ACN (3%, 10%, 15%, and 50%) in 5 mM ammonium formate (pH 10). Peptides were reconstituted in 3%ACN/5% FA prior to loading onto an analytical column (25–30cm, 1.9μm C18 (Dr. Maisch HPLC GmbH), packed in-house PicoFrit 75μm inner diameter, 10μm emitter (New Objective)). Peptides were eluted with a linear gradient (EasyNanoLC 1200, Thermo Fisher Scientific) as described above. MS/MS were acquired on a Thermo Orbitrap Exploris 480 equipped with FAIMS (Thermo Fisher Scientific) in data dependent acquisition. MS2 fill time was set to 100ms with an AGC target of 5e4, collision energy was 32CE. FAIMS CVs were set to −50 and −70 with a cycle time of 1.5s per FAIMS experiment. Spectra were searched with Spectrum Mill using HLA specific workflows against a uniprot mouse database (downloaded 12/28/2017) including 553 small ORFs, 264 common contaminants, and putative TE-encoded ORFs predicted by RNA-seq54. TMT intensities were median normalized and used for relative quantitation.
CD45+ or CD4+/CD8+ enriched scRNA-seq
Sample demultiplexing, read alignment, filtering, and UMI counting were performed using the CellRanger pipeline (version 3.0, 10x genomics). Downstream analyses were performed in Python using Scanpy55,56. For each cell, two quality control metrics were calculated: (1) the total number of genes detected, and (2) the proportion of UMIs contributed by mitochondrially encoded transcripts. Cells in which fewer than 200 genes or greater than 2,500 genes were detected and in which mitochondrially encoded transcripts constituted greater than 10% of the total library were excluded from downstream analysis. Tumor replicates were concatenated, and no significant batch effect was observed in the CD45+-enriched dataset. ComBat was applied to the CD4+/CD8+-enriched dataset to help control for batch effect. The final expression matrix consisted of 17,036 cells by 31,053 genes for the CD45+-enriched, and 44,519 cells by 31,053 for the CD4+/CD8+-enriched dataset. Each gene expression measurement was normalized by total expression in the corresponding cell multiplied by a scaling factor of 10,000, and log transformed with a pseudocount of one. Mean and dispersion values were calculated for each gene across all cells, and 21,268, and 10,00 high variance genes were used for PCA dimensionality reduction in the CD45+-enriched and the CD4+/CD8+-enriched datasets, respectively. The first 50 principle components were used for UMAP projection into two dimensional space. The Leiden algorithm was used to perform unsupervised clustering. Scanpy’s rank_genes_groups function was used to identify differentially expressed genes for each cluster and determine cluster identity. Cells identified as belonging to the lymphoid lineage were subsetted and reclustered, as described above, yielding 4,497 cells in the CD45+-enriched conditions and 24,860 cells in the CD4+/CD8+-enriched condition. Differential expression was performed using logistic regression on scran normalized data57,58. For CD4+/CD8+, P15E differential expression was performed between 771 P15E specific CD8+ T cells, and 8755 CD8+ T cells with paired TCR info but no known specificity.
T-cell receptor (TCR) profiling from bulk tumor tissue and flow-sorted P15E tetramer-positive T-cells
Mice were inoculated with 2.0 × 10⁶ control LLC cells on the back (bilateral) and then treated with anti-PD1/CTLA4. On post challenge day 14–18, tumors were excised, weighed, and chopped before enzymatic and mechanical digestion, and immune cells were then isolated using density centrifugation and CD45+ magnetic bead enrichment, as described above. Cells were then stained in PBS using Live/Dead Fixable Near-IR Dead Cell Stain Kit (1:100, ThermoFischer), H-2Kb MuLV p15E Tetramer (1:10, MBL International), and TrueStain FcX Plus (anti-mouse CD16/32) Antibody (1:1000, BioLegend), followed by CD45 (1:100, Biolegend) and CD8 (1:10, MBL International). Samples were then pooled and analyzed using a MA900 FACS instrument (Sony), using single-colour compensation controls and fluorescence-minus-one controls for setting gates. Live/CD45+/CD8+/p15E+ cells were sorted into RMPI with 50% FBS. Live/CD45+/CD8+/p15E− cells were also sorted. Cells were spun down and resuspended in RLT Buffer. RNA was subsequently isolated using RNeasy Micro (Qiagen). TCR’s were then isolated from the resulting RNA using the SMARTer Mouse TCR a/b Profiling Kit (Takara), per the manufacturer’s instructions. TCR’s were sequenced using a 600-cycle MiSeq Reagent Kit V3 for 2×300 base-pair reads (Illumina).
Analysis of TCR repertoire in bulk tumors, p15E tetramer+-enriched T-cells, and CD4+/CD8+-enriched T-cells profiled by 5’ scRNA-seq
For bulk and p15E-sorted T-cells, we aligned and assembled clonotypes using mixcr analyze amplicon (version 3.0.13), excluding out of frame and stop codon containing CDR3 sequences and the small number of sequences assigned to gamma delta T-cells. We defined a set of p15E recognizing clonotypes which were significantly enriched in the tetramer positive sample, using a fisher exact test of clone frequency with a stringent P value threshold of 1e-20. This set included 377 putative p15E recognizing TCRs, out of 71,000 total identified clonotypes. To access T-cell clonal dynamics in bulk tumors, the output of mixcr was downsampled to that each sample has equal total cloneCounts, and gini and shannon diversity indices were calculated using the alpha_diversity function of skbio (version 0.5.2). TCR data from 5’ scRNA-seq was determined using the cellranger vdj pipeline (version 3.1.0), keeping only high confidence, full length, cell derived TCRs, and filtering cells that expressed more than one TCR beta chain or more than two alpha chains.
Extended Data
Extended Data Fig. 1. Analysis of screening performance.
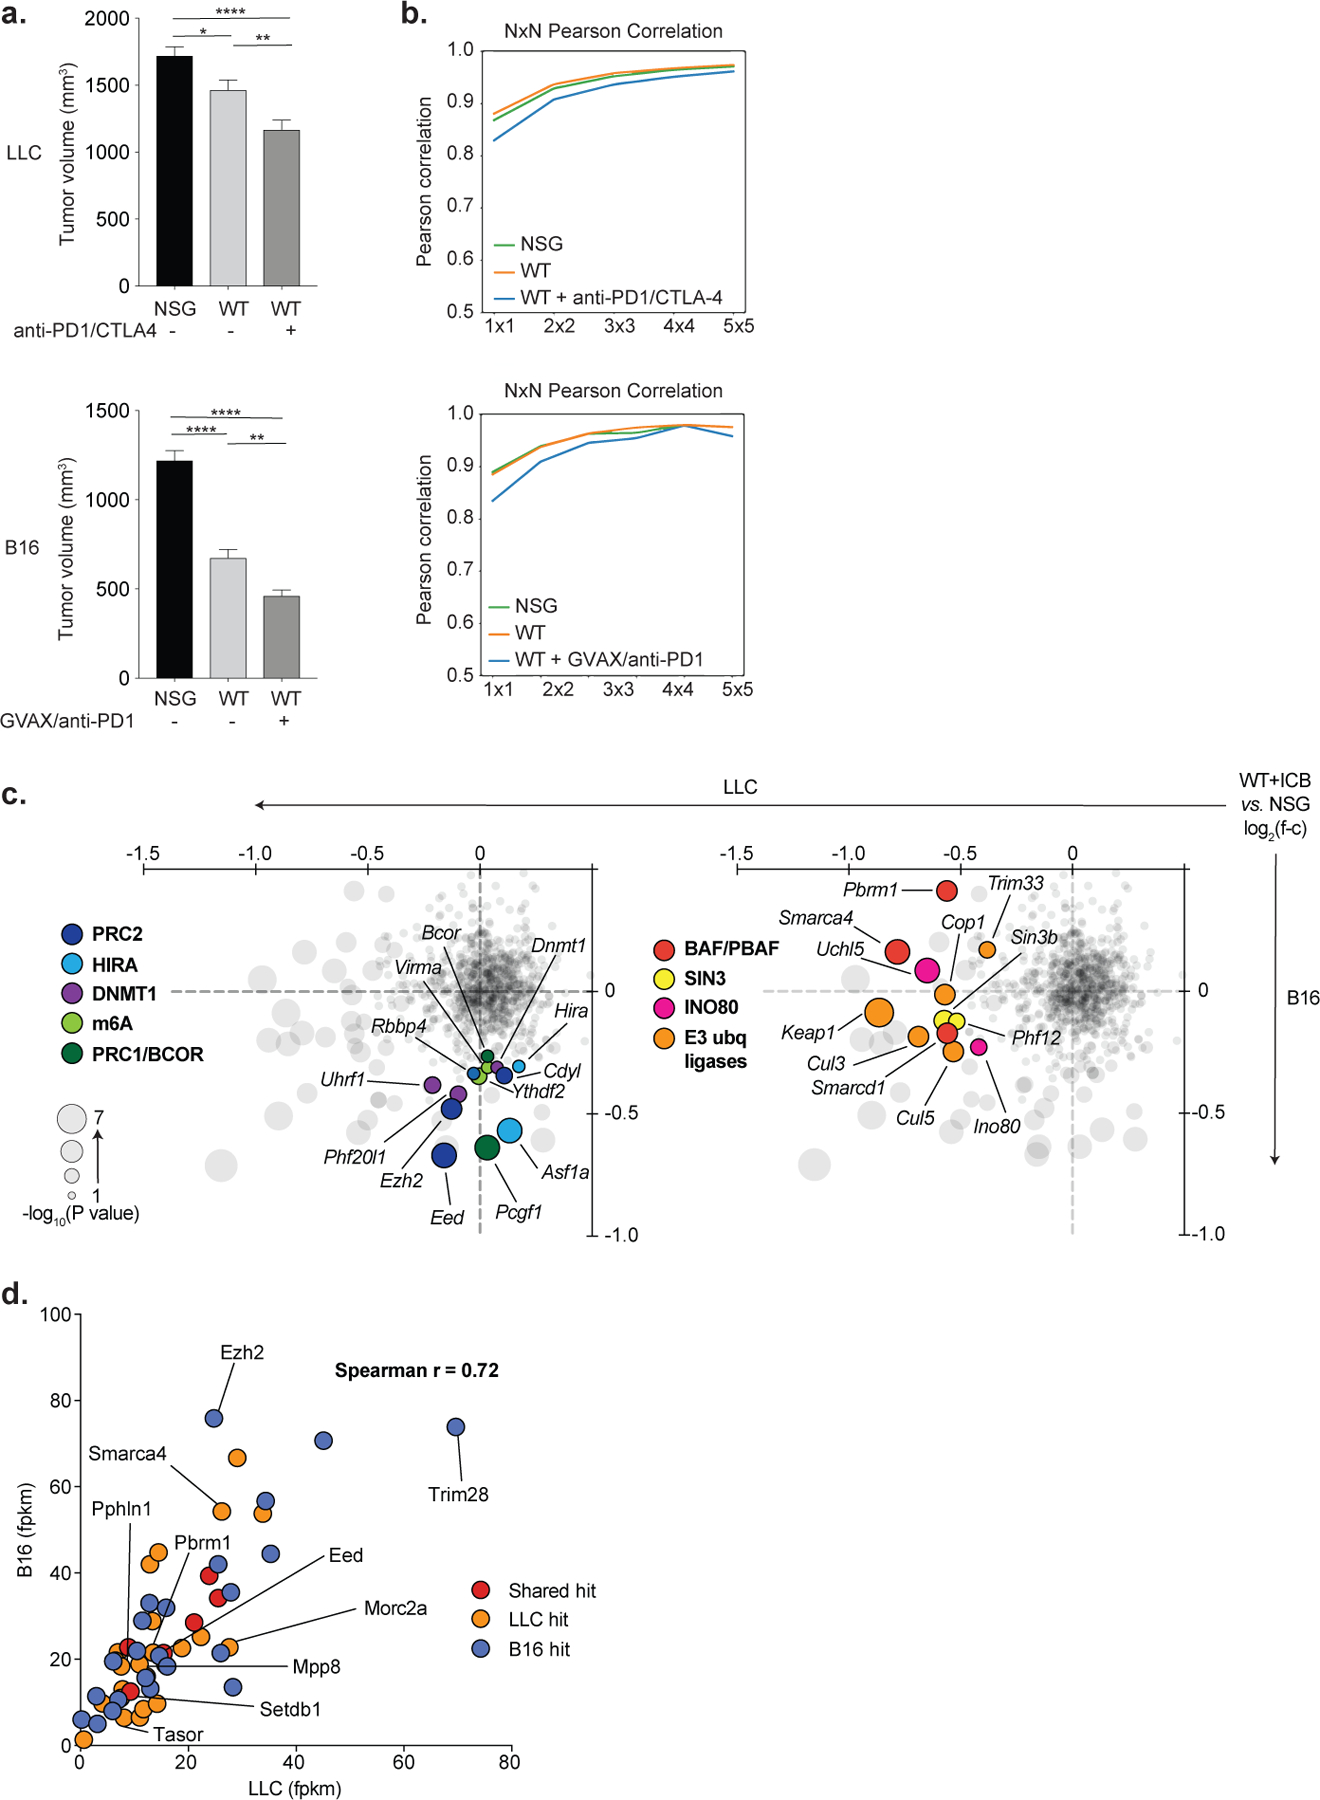
(a) Tumor volumes (mean +/− s.e.m.) of bilateral tumors (n=25 mice, n=50 individual tumors) in the LLC (top) and B16 (bottom) screens for the indicated treatment conditions on day 12 (LLC) and day 9 (B16) after tumor inoculation. Statistics by ANOVA with Tukey’s test for multiple comparisons. (b) Saturation analysis of animal replicates from the three in vivo screening conditions for LLC (top) and B16 (bottom). Pearson’s correlations are calculated for the log2 guide abundance in one animal versus any other animal, then for two averaged animals versus any other two, and so on. Saturation approaches r=0.95 for both screens. (c) RNA expression (FPKM) in LLC (x-axis) and B16 (y-axis) for the top 30 screening hits by STARS score in each cell line. Colors indicate whether the gene was depleted in LLC only (orange), B16 only (blue), or in both cell lines (red). One outlier value (x=11.7, y=248.7) for the B16-only hit, Cdk2, is excluded for ease of visualization but is included in the calculation of the correlation coefficient. (d) Depletion (negative ratios) or enrichment (positive ratios) of targeted chromatin regulator genes in ICB-treated WT versus NSG mice in the LLC (x-axis) and B16 (y-axis) screens. Circle sizes reflect the significance (−log10(P value)) of depletion in the higher scoring model. Selected genes that scored uniquely in B16 (left) or LLC (right) are highlighted and colored according to their associated chromatin regulator complexes. *P < 0.05; **P < 0.01; ***P < 0.001; ****P < 0.0001.
Extended Data Fig. 2. Tumor growth and survival data for Setdb1, Trim28, and HUSH complex KO.
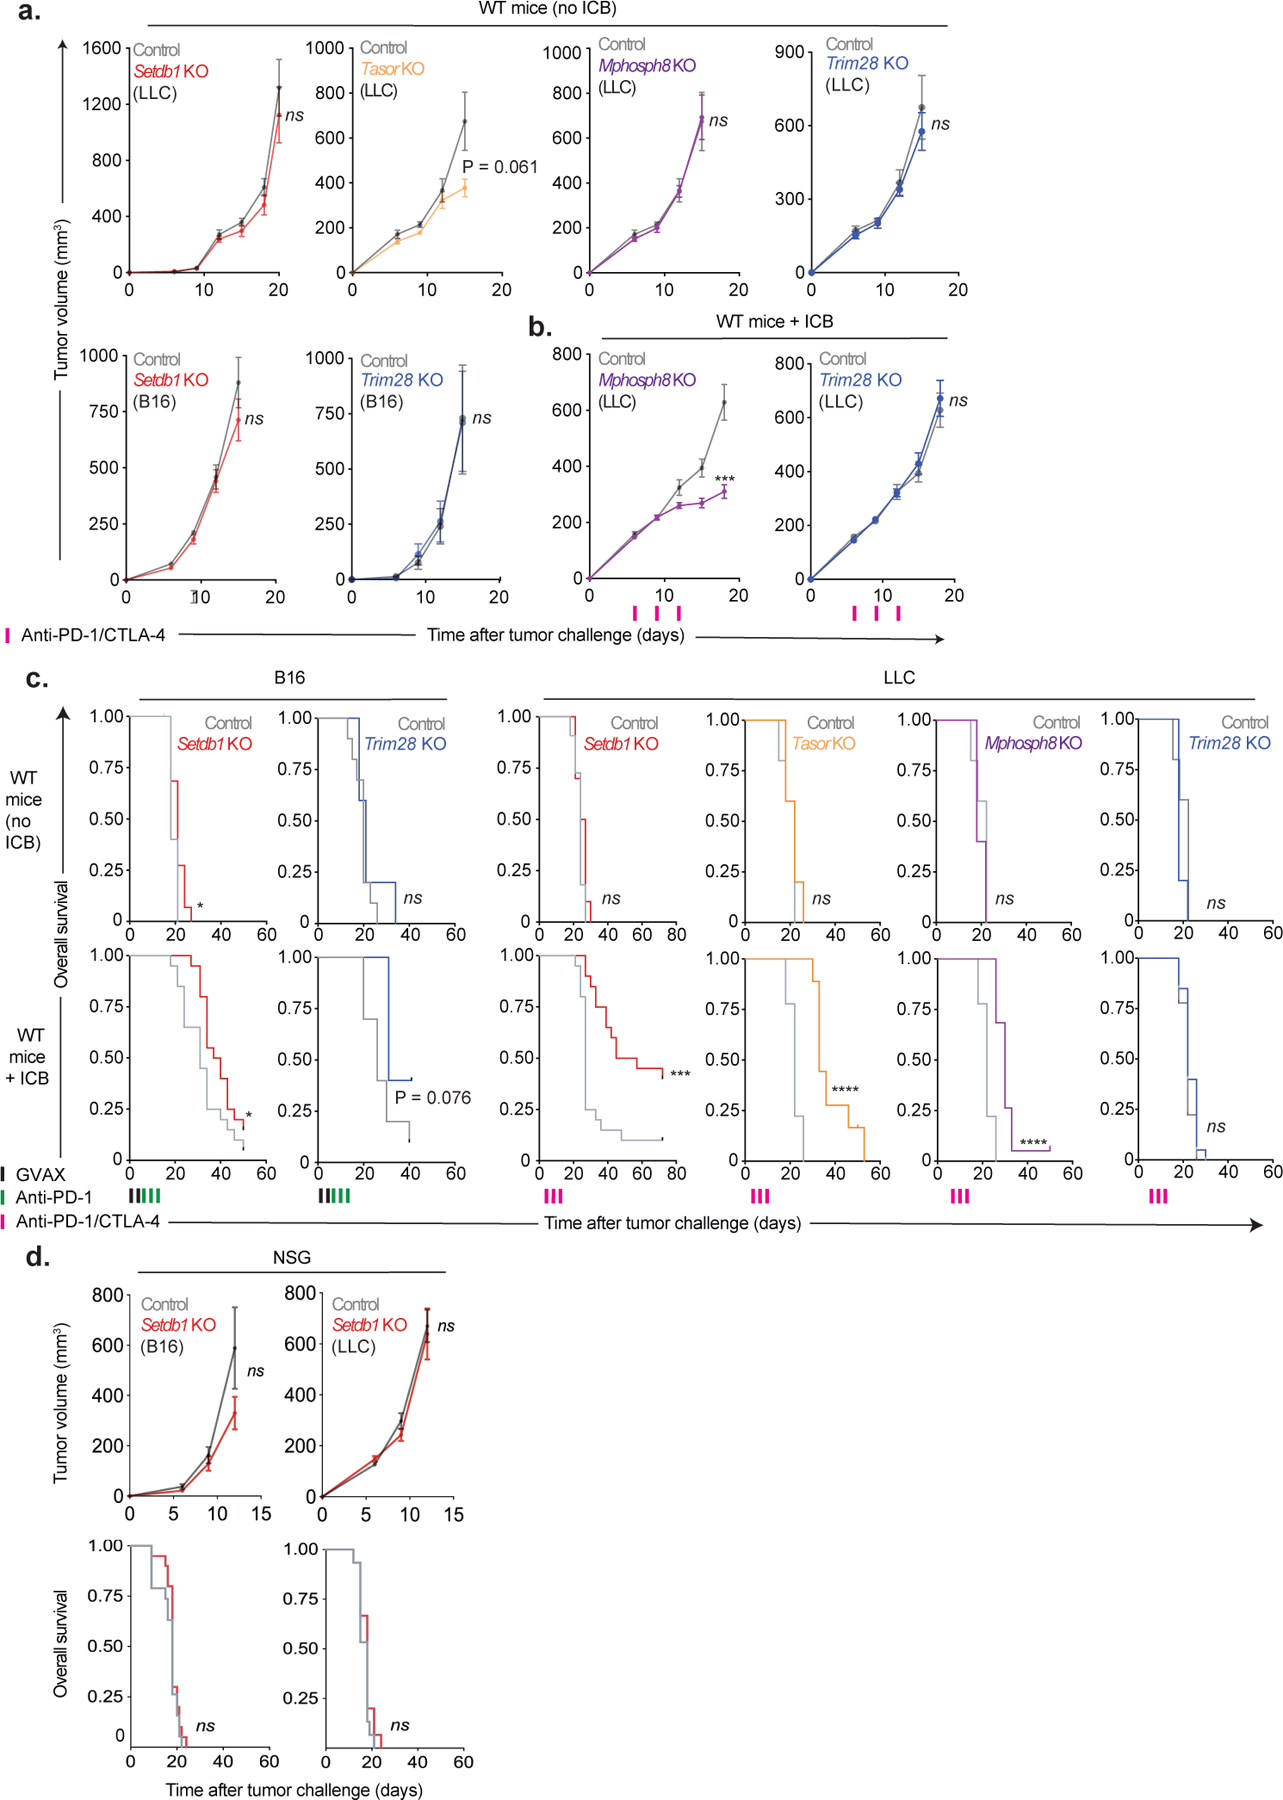
(a) Tumor growth (mean +/− s.e.m.) in untreated WT mice (no ICB) inoculated with Setdb1 (n=10) Tasor (n=5), Mphosph8 (n=5), or Trim28 (n=5) KO LLC cells, or Setdb1 or Trim28 KO B16 cells. Data are representative of 3 (Setdb1), 1 (Tasor), 1 (Mphosph8), 1 (Trim28 in LLC), and 2 (Trim28 in B16) experiments. Statistics by two-sided Student’s t-test at the indicated time-points. (b) Tumor growth (mean +/− s.e.m.) in WT mice treated with ICB inoculated with Mphosph8 (n=20) or Trim28 (n=20) KO LLC cells. Data represent 1 independent experiment. Statistics by two-sided Student’s t-test at the indicated time-points. (c) Overall survival for untreated (top) and ICB-treated (bottom) WT mice inoculated with B16 (left) or LLC (right) tumors and corresponding to Fig. 1d and Extended Data Fig. 2a–b. Statistics by log-rank test. (d) Tumor growth (top, mean +/− s.e.m.) and overall survival (bottom) for untreated NSG mice (no ICB) inoculated with Setdb1 KO B16 (left, n=20) or LLC (right, n=15). Data represent 1 experiment. Statistics for tumor growth by two-sided Student’s t-test at the indicated time-points. Statistics for overall survival by log-rank test. *P < 0.05; ***P < 0.001; ****P < 0.0001.
Extended Data Fig. 3. SETDB1 (1q21.3) amplification in human TCGA and ICB-treated cohorts.
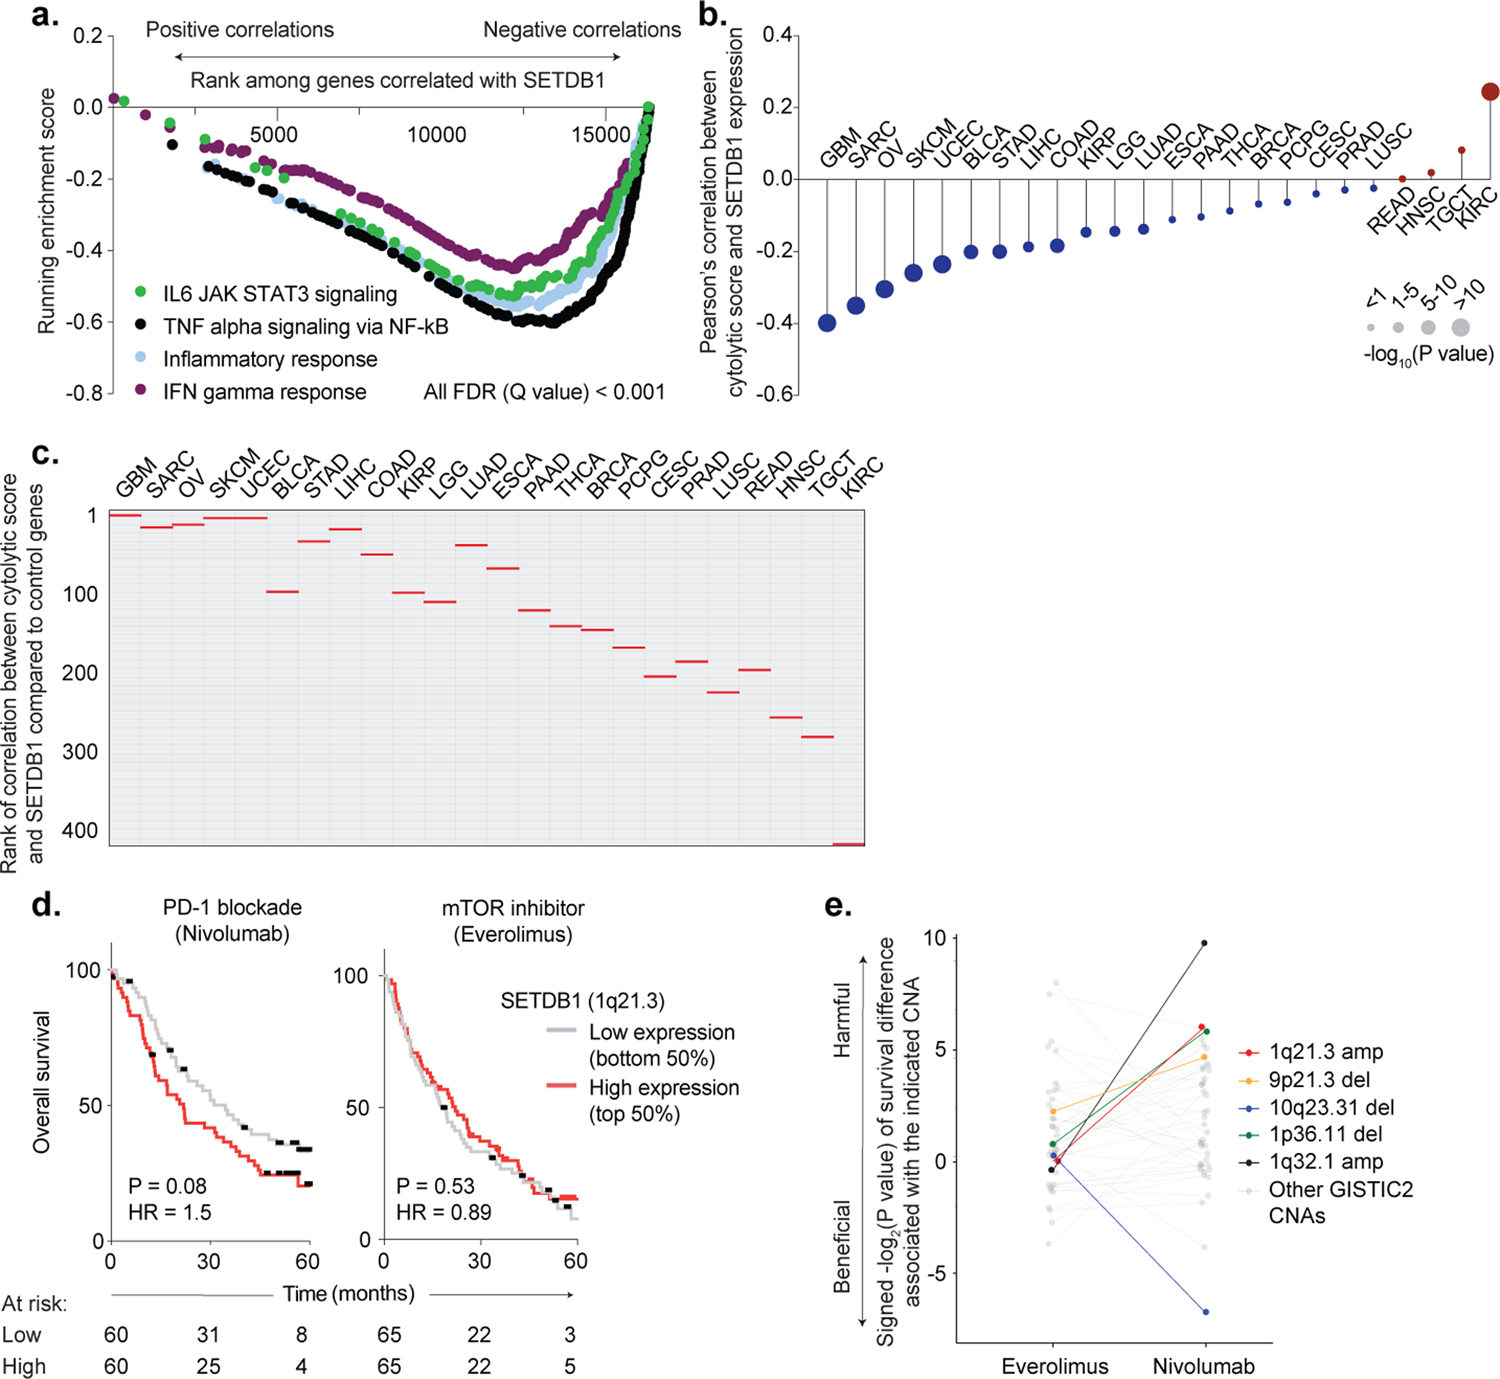
(a) Running enrichment scores by GSEA for immune gene sets significantly (FDR <0.001) anti-correlated with SETDB1 expression by Pearson’s correlation across TCGA cohorts. (b) Pearson’s correlation between SETDB1 expression and cytolytic score (geometric mean of PRF1 and GZMA expression) in TCGA cohorts. Circle size indicates statistical significance (−log10(P value)) of the Pearson’s correlation. (c) Bootstrap analysis plotting the rank of the correlation between cytolytic score and SETDB1 expression (red lines) in each TCGA cohort, compared to 408 randomly selected control genes (grey lines). (d) Kaplan-Meier curves for patients with renal cell carcinoma treated with PD-1 blockade (left, nivolumab) or mTOR inhibitor (right, everolimus). Overall survival curves are stratified according to SETDB1 expression (top 50% = high expression, bottom 50% = low expression). Hazard ratios associated with SETDB1 high expression are listed. The number of patients-at-risk are indicated for each timepoint. Statistics by log-rank test. (e) Bootstrap analysis showing the impact of GISTIC2-defined copy-number alterations (CNA) on overall survival in patients treated with mTOR inhibitor (left, everolimus) or PD-1 blockade (right, nivolumab). Positive values indicate a CNA that has a harmful impact on survival with ICB or mTOR inhibitor, and negative values indicate a CNA that has a beneficial effect. 1q21.3 amplification (red) is highlighted alongside chromosomal regions previously reported as predictors of ICB response in RCC, including 10q23.31 deletion (associated with improved response) and 9p21.3 deletion (associated with poor response).
Extended Data Fig. 4. Identification of SETDB1 domains.
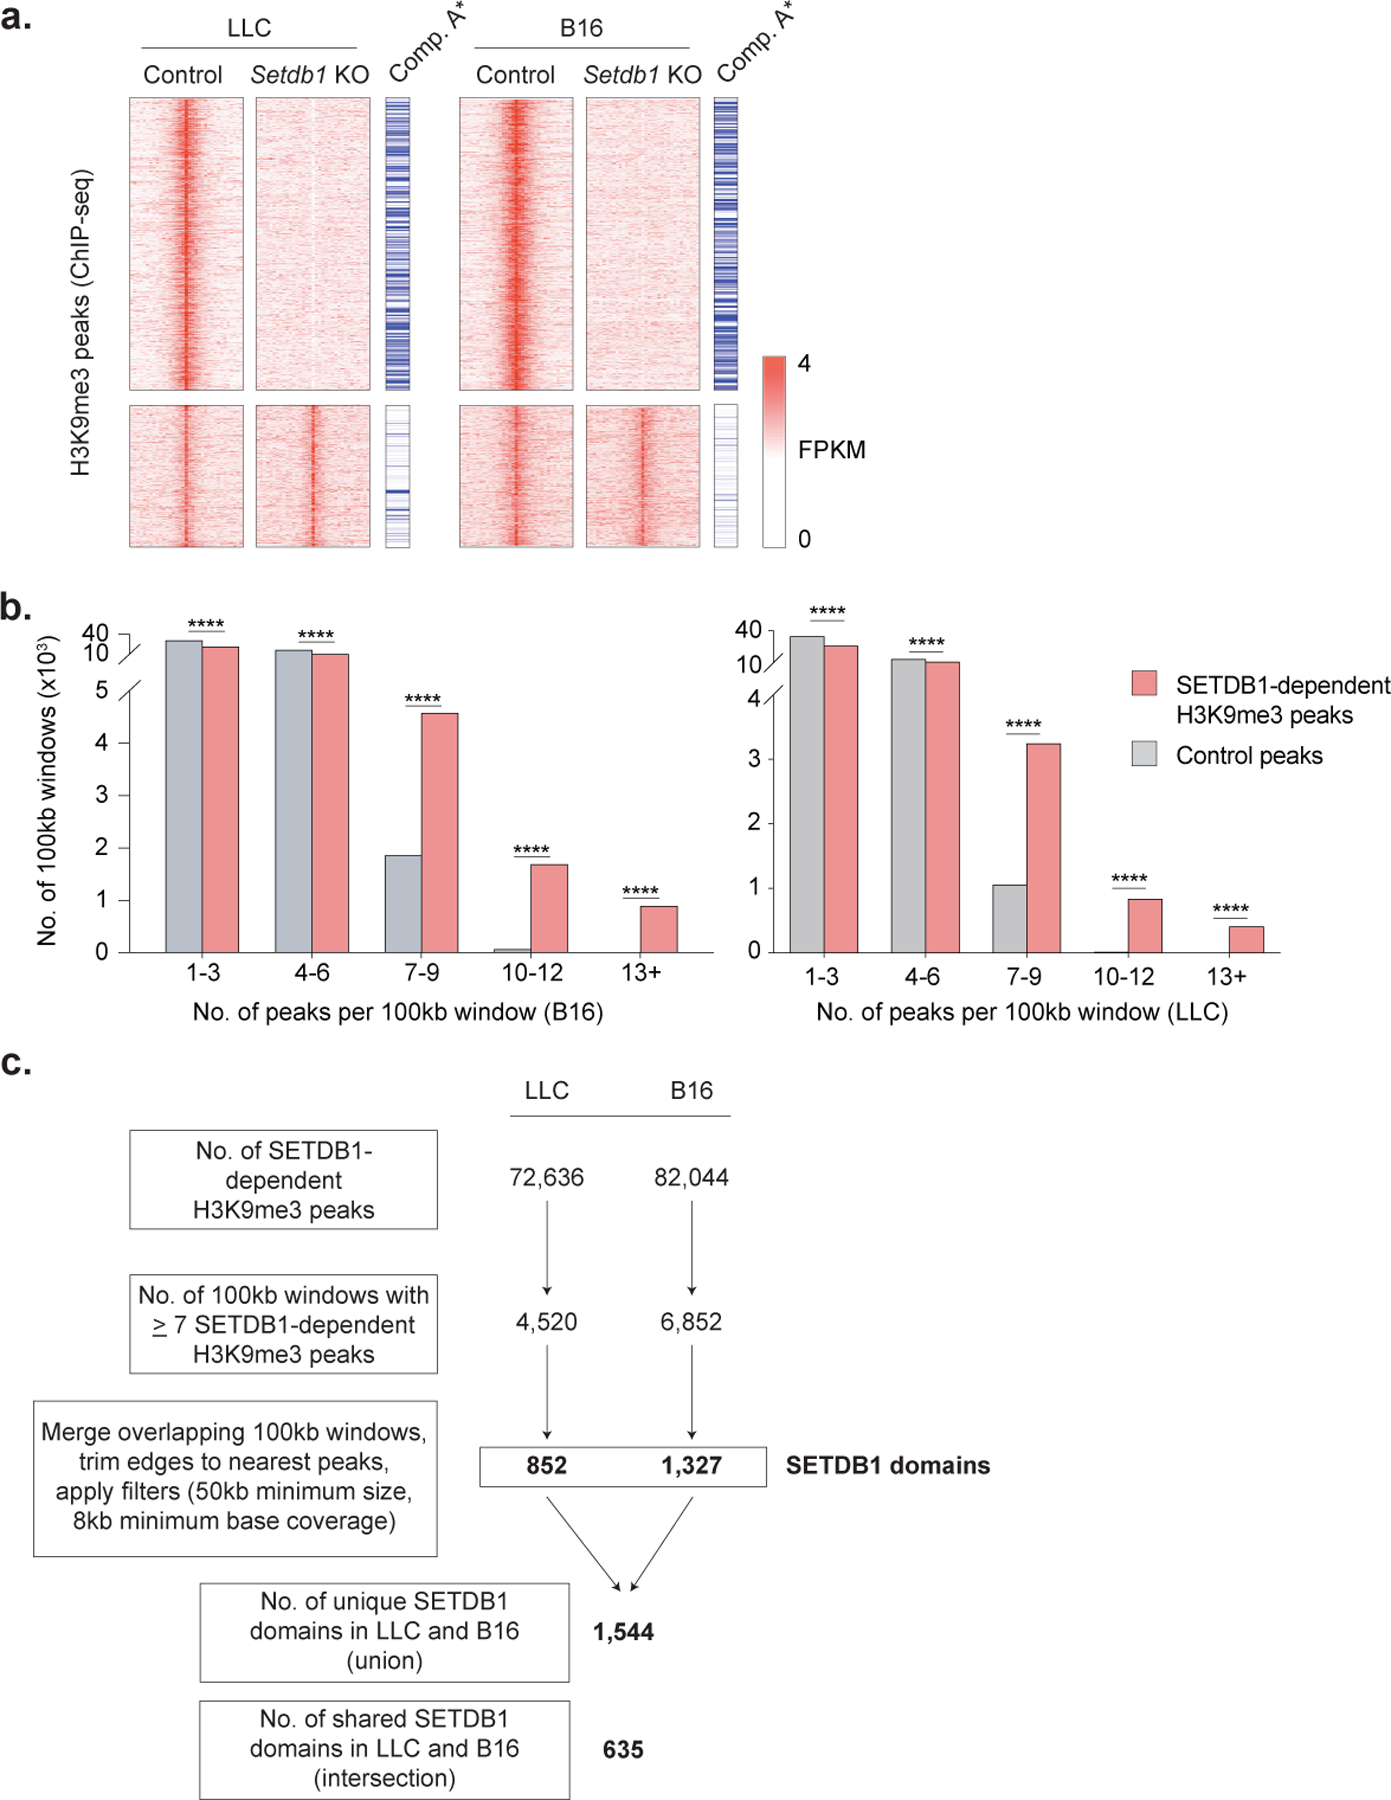
(a) Heatmap of H3K9me3 peaks (rows, FPKM) in control and Setdb1 KO LLC (left) and B16 (right) cells. Peaks are separated based on whether they were lost (top) or retained (bottom) in Setdb1 KO cells, and annotated by whether they are located in the open compartment A of the genome. Statistics for compartment A enrichment by permutation testing. (b) The number of 100kb windows containing the indicated numbers of SETDB1-dependent H3K9me3 peaks in B16 (left) or LLC (right) cells, compared to random control peaks. Statistics by Chi-square test. (c) Workflow for annotation of SETDB1-domains from H3K9me3 ChIP-seq data in LLC and B16 cells. *P < 0.05; ****P < 0.0001.
Extended Data Fig. 5. TE-encoded regulatory elements in Setdb1 KO LLC and B16 cells.
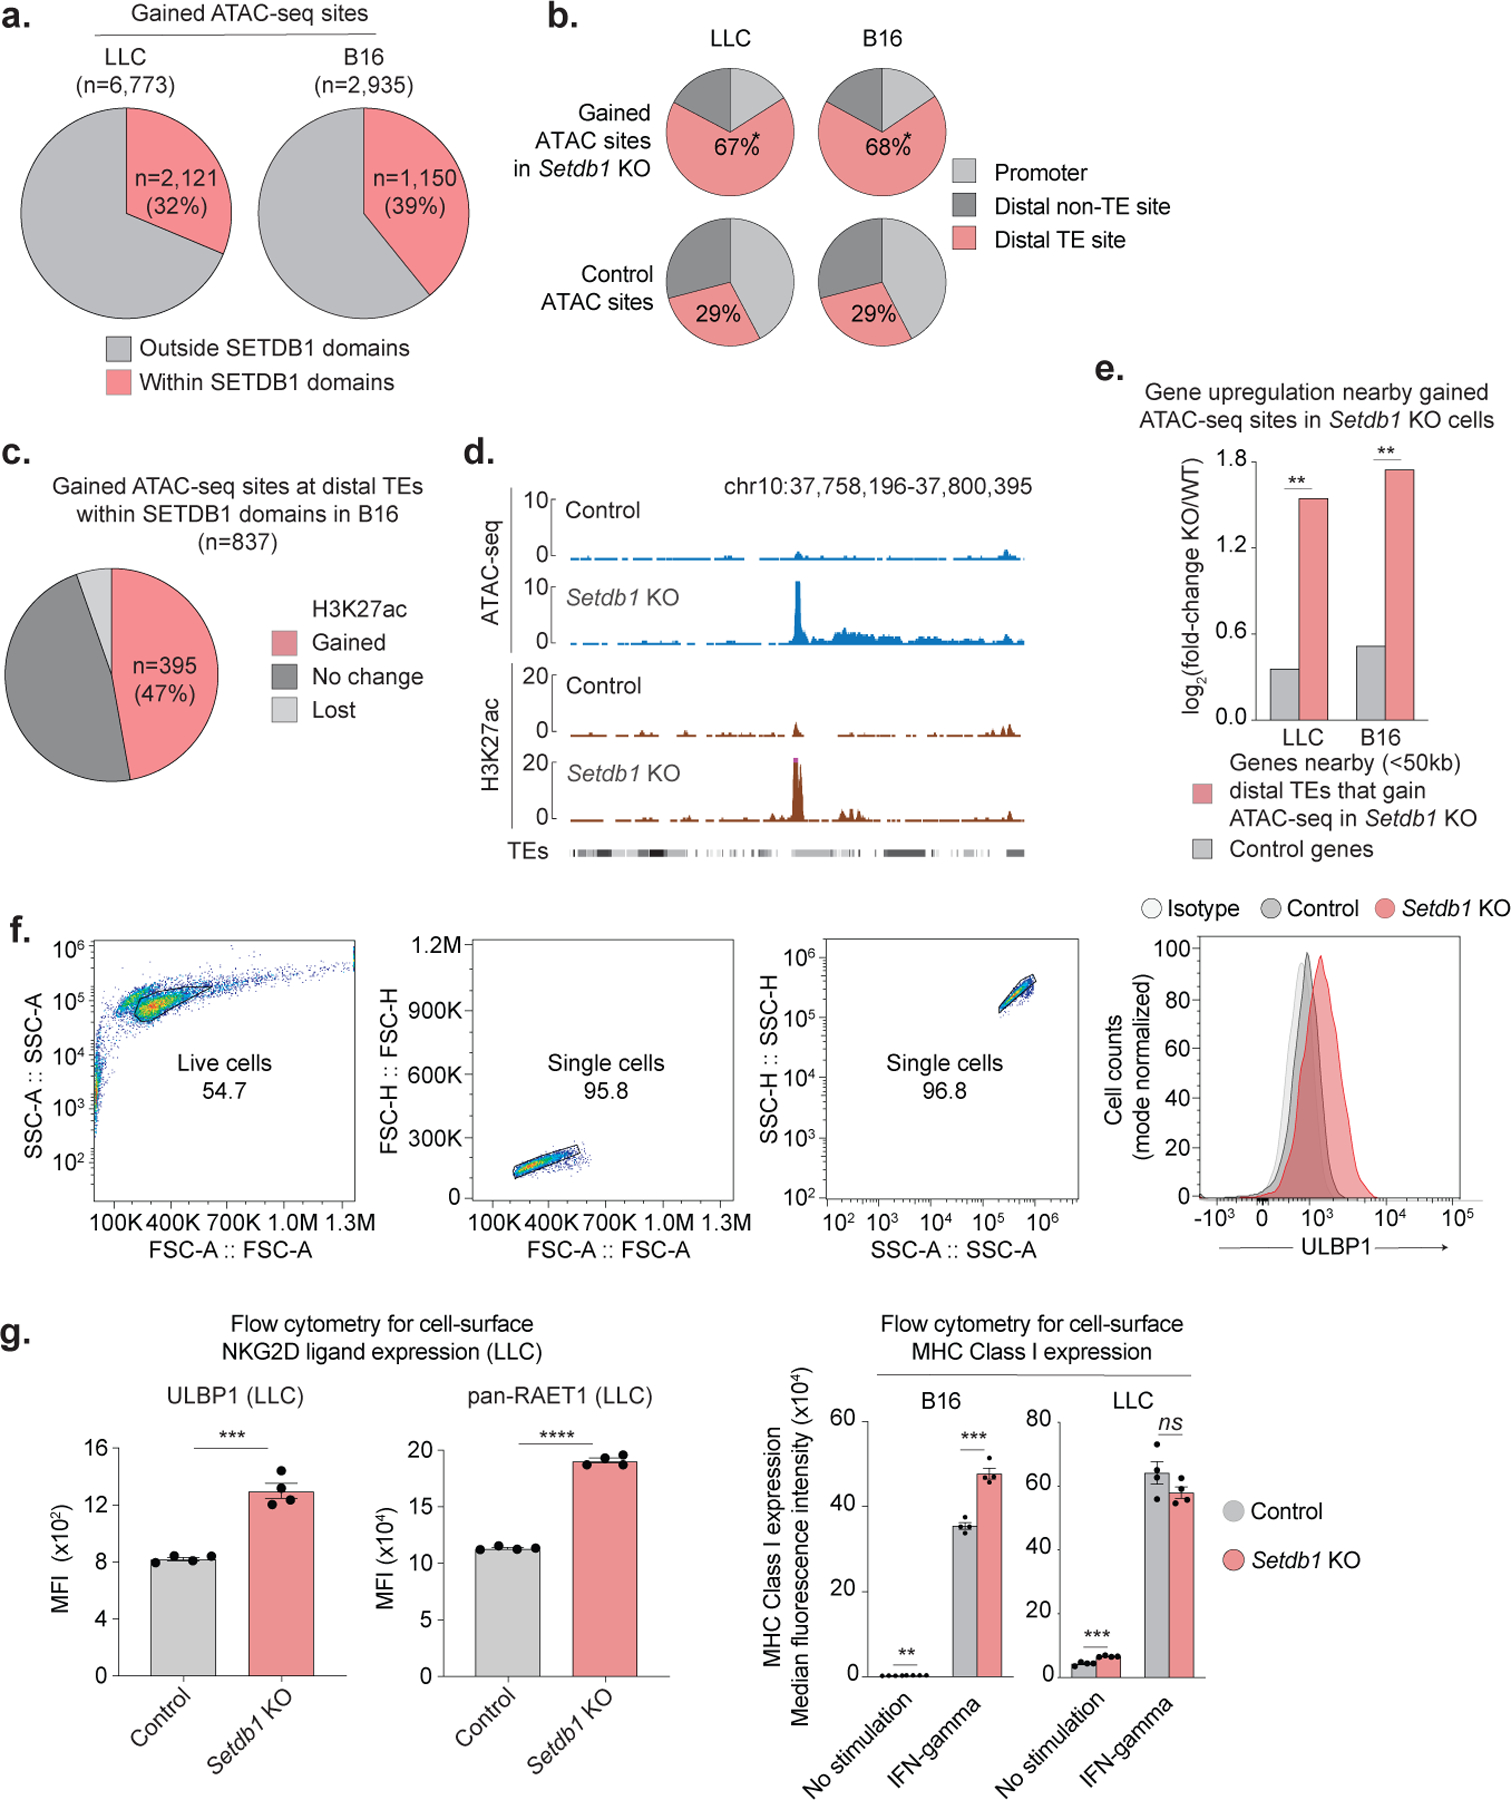
(a) Proportion of chromatin accessible sites (ATAC-seq) gained in Setdb1 KO LLC or B16 cells that are located within (red) or outside (grey) SETDB1 domains. (b) Proportion of ATAC-seq sites gained in Setdb1 KO LLC or B16 cells that coincide with promoters (light grey), distal TEs (red), or other promoter-distal sites (dark grey). Statistics by permutation testing. (c) Proportion of gained ATAC-seq sites at distal TEs in Setdb1 KO B16 cells that also gain H3K27 acetylation and resemble active enhancers. (d) Coordinate gain of chromatin accessibility and H3K27 acetylation at an example TE-site in Setdb1 KO B16 cells. (e) Activation of genes near (<50kb) gained ATAC-seq sites at distal TEs in Setdb1 KO LLC or B16 cells compared to control genes. Statistics by permutation testing. (f-h) Flow cytometry in control and Setdb1 KO cells showing (f) gating strategy, (g) cell-surface expression (y-axis, median fluorescence intensity (MFI)) for ULBP1 and RAET1 ligands in LLC (left), and MHC-I expression in LLC and B16 (right) +/− induction with IFNγ (10ng/mL, 24hr). Data are mean +/− s.e.m. and reflect 2 independent experiments with 4 biological replicates. Statistics by two-sided Student’s t-test. *P < 0.05; **P < 0.01.
Extended Data Fig. 6. Gene and TE expression in Setdb1 KO LLC and B16 cells.
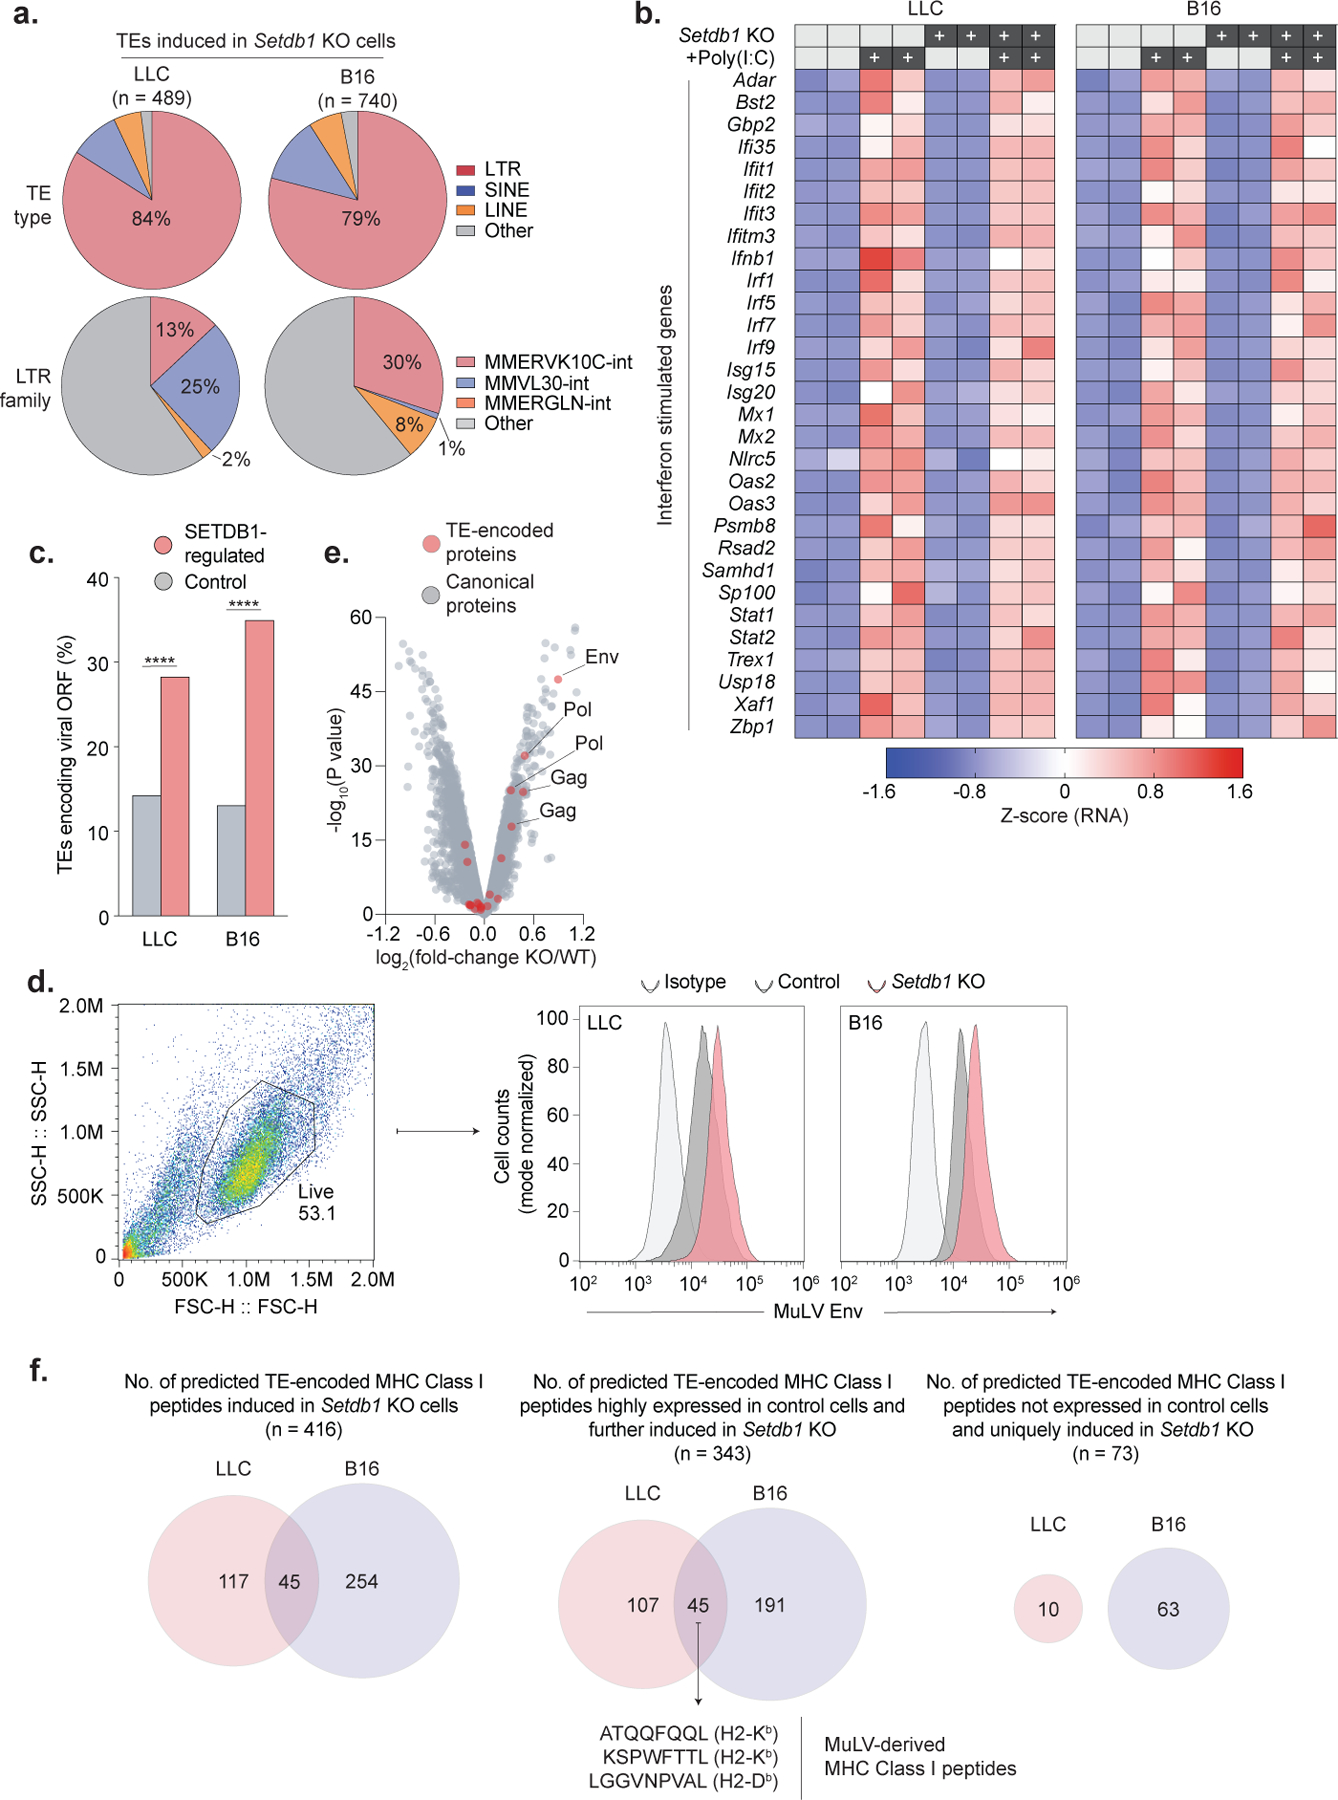
(a) Distribution of TE types (top) and LTR subfamilies (bottom) induced in Setdb1 KO LLC or B16 cells by RNA-seq. (b) Heatmap showing RNA expression (row normalized) of canonical interferon-stimulated genes in untreated and poly(I:C) stimulated (500ng/ml, 48hrs) control and Setdb1 KO LLC and B16 cells. (c) Percentage of TEs induced in Setdb1 KO LLC or B16 cells that retain intact viral ORFs, compared to control TEs. Statistics by Fisher’s exact test. (d) Flow cytometry for cell-surface expression of the MuLV envelope protein in Setdb1 KO LLC and B16 cells. Gating strategy (left) and histograms (right) with mode-normalized cell counts are shown. Data are representative of n=3 and n=2 experiments in LLC and B16, respectively. (e) Differential protein expression in B16 cells by whole-cell mass spectrometry. Tryptic protein sequences derived from TEs (red) or canonical proteins (grey) are highlighted. Fold-change (x-axis) and statistical significance (y-axis) for proteins in Setdb1 KO versus control are shown. (f) Venn-diagrams showing the number of predicted, unique TE-encoded H2-Kb/H2-Db binding peptides in LLC and B16 cells by GRCm38 RNA-seq analysis. Diagrams show the total number of predicted, TE-encoded MHC Class I peptides in LLC and B16 cells (left), and subsets showing (i) high expression in control cells and further induction upon Setdb1 KO (middle), and (ii) no detectable expression in control cells and strong induction only upon Setdb1 KO (right). Several MuLV-encoded peptides known to be presented by H2-Kb or H2-Db are highlighted. ***P < 0.001. ****P < 0.0001.
Extended Data Fig. 7. TE expression in SETDB1 KO A375 cells.
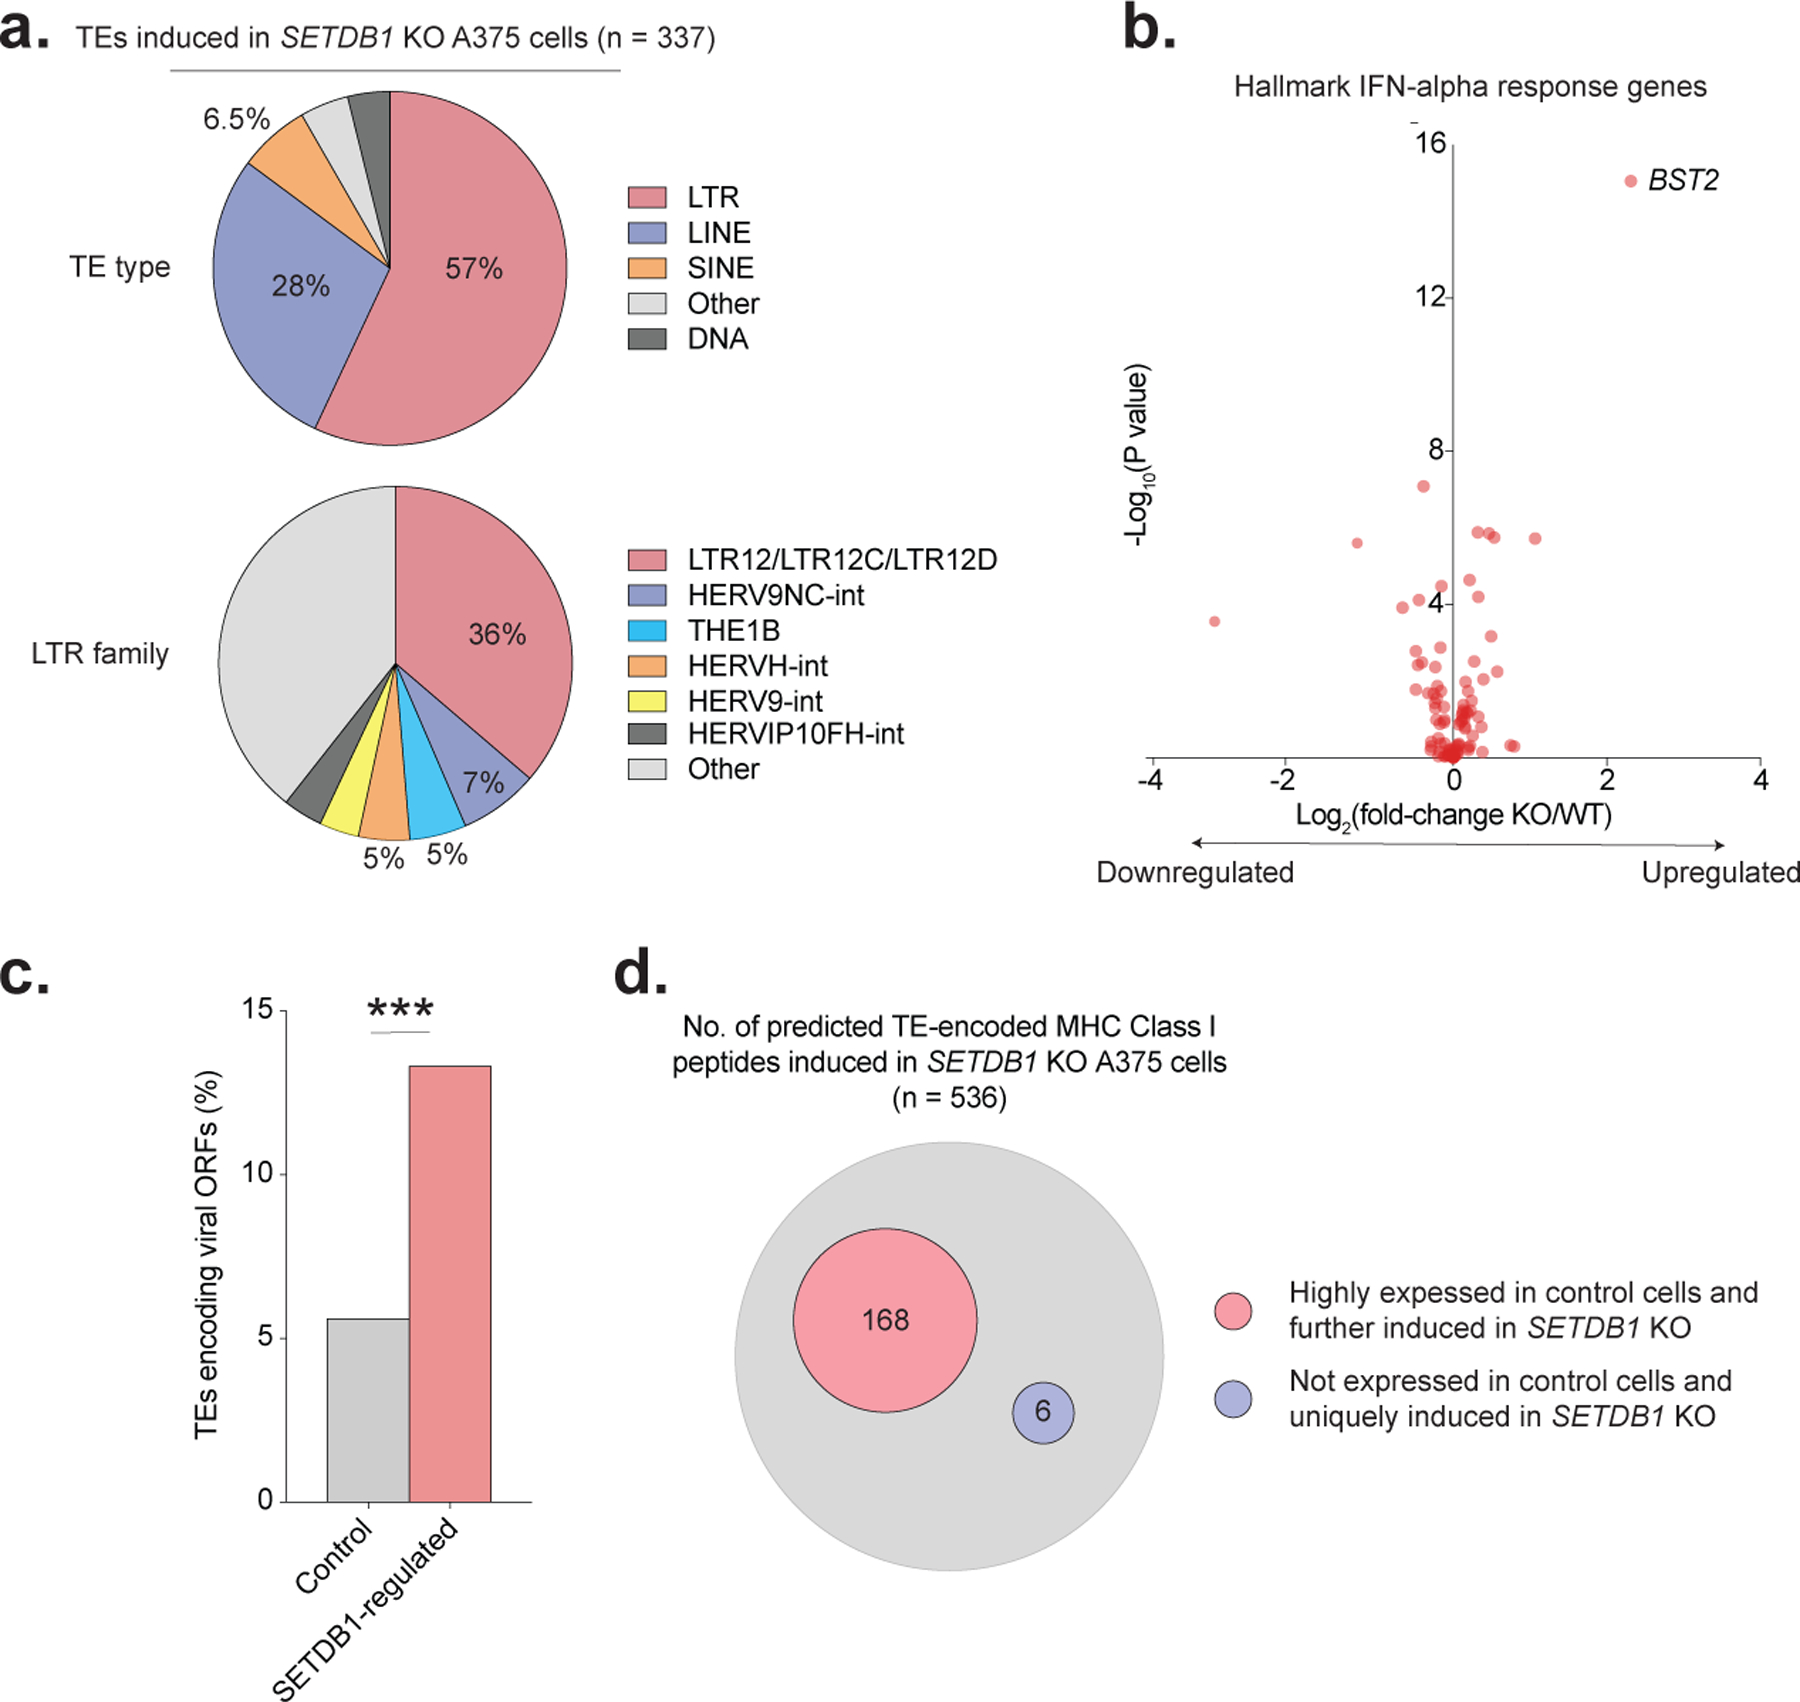
(a) Distribution of TE types (top) and LTR subfamilies (bottom) induced in SETDB1 KO A375 cells by RNA-seq. (b) Volcano plot of Hallmark IFN-alpha response genes in A375 cells by RNA-seq. Fold-change (x-axis) and statistical significance (y-axis) in SETDB1 KO versus control are shown. (c) Percentage of TEs induced in Setdb1 KO A375 cells that retain intact viral ORFs compared to control TEs. Statistics by Fisher’s exact test. (d) Diagram showing the total number of predicted, unique TE-encoded MHC-I peptides induced in SETDB1 KO A375 cells by RNA-seq. Binding predictions are based on A375-specific HLA types (see Methods). Subsets of predicted TE-encoded MHC-I peptides with (i) high expression in control cells and further induction upon SETDB1 KO, or (ii) no detectable expression in control cells and strong induction only upon SETDB1 KO, are highlighted. ***P < 0.001. ****P < 0.0001.
Extended Data Fig. 8. Gene expression and scRNA-seq analysis of immune infiltration in LLC tumors.
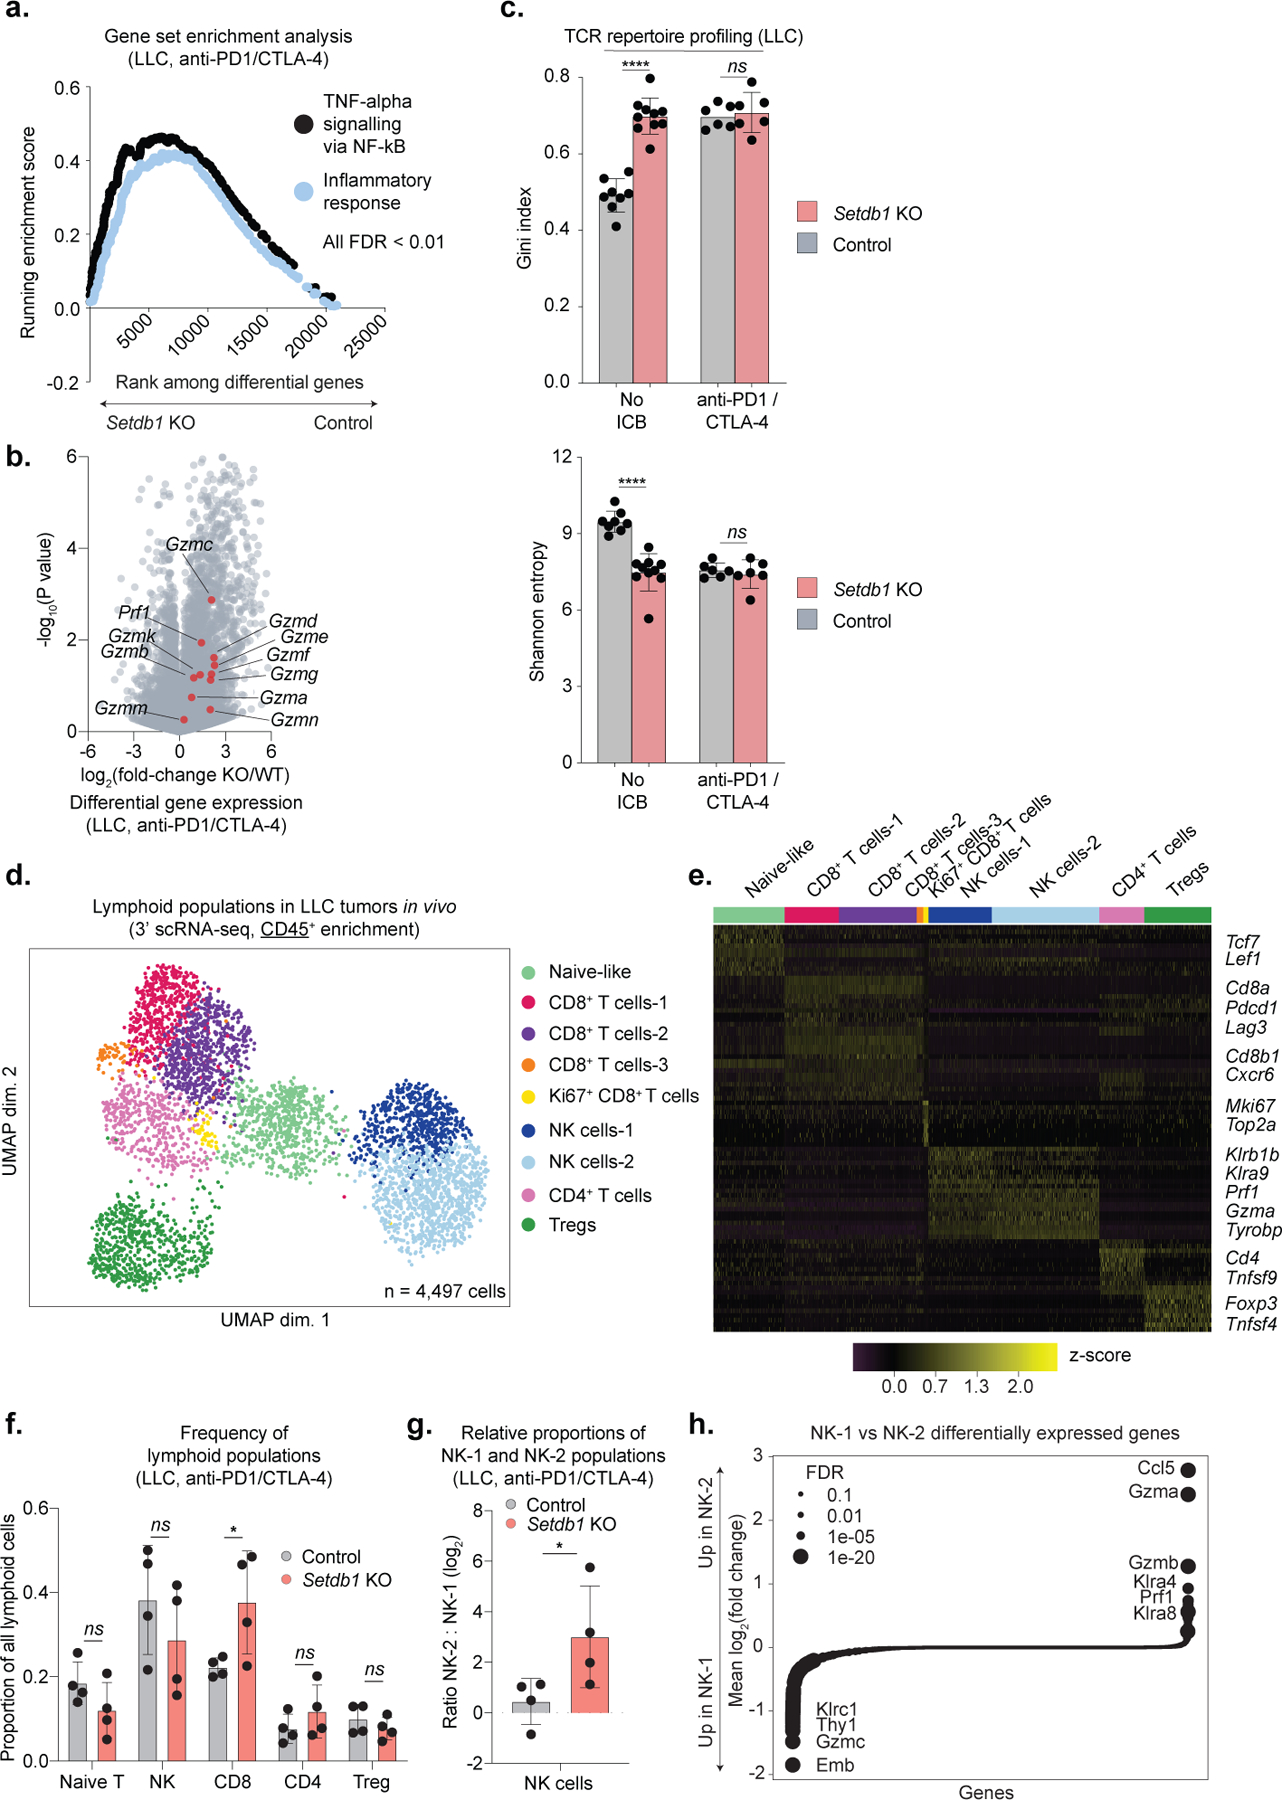
(a-c) Transcriptional profiling with RNA-seq performed on bulk tumor tissue from control (n=8 untreated and n=6 ICB-treated) and Setdb1 KO (n=10 untreated and n=6 ICB-treated) LLC tumors. Data represent 1 experiment. (a) Running enrichment scores by GSEA for immune gene sets significantly (FDR <0.01) upregulated in Setdb1 KO LLC tumors treated with ICB relative to controls. (b) Volcano plot depicts expression fold-change (x-axis) and statistical significance (y-axis) of cytotoxicity genes (red) and all other genes (grey) in Setdb1 KO LLC tumors treated with ICB relative to controls. (c) TCR repertoire profiling with targeted sequencing of alpha and beta-chain variable regions from Setdb1 KO LLC tumors (untreated and ICB-treated) relative to controls. Variation in clonotype abundance (skewing) is represented by the Gini index (left, higher number indicates greater skewness) and Shannon entropy (right, lower number indicates greater skewness). Data are mean +/− s.e.m. Statistics by two-sided Student’s t-test. (d-h) scRNA-seq (3’) analysis of immune cells (CD45+-enrichment) from control (n=3 untreated, n=4 ICB-treated) or Setdb1 KO (n=3 untreated, n=4 ICB-treated) LLC tumors. Data are from 1 experiment. (d) UMAP plots highlight 4,497 cells and associated clusters identified in the lymphoid compartment. (e) Representative marker genes used to identify and annotate cell clusters in (d). (f) Changes in lymphoid populations in ICB-treated tumors (n=4 control, n=4 Setdb1 KO) as a proportion of the total lymphoid population. Data are mean +/− s.e.m. Statistics by two-sided Student’s t-test. (g) Ratio of NK-2 to NK-1 cells in ICB-treated samples. Data are mean +/− s.e.m. Statistics by Mann-Whitney U. (h) Differentially expressed genes (log2(fold-change)) in NK-2 vs NK-1 cells. Circle sizes indicate statistical significance (FDR). *P < 0.05. ****P < 0.0001.
Extended Data Fig. 9. TCR profiling and scRNA-seq of p15E-specific T cells isolated from control and Setdb1 KO LLC tumors.
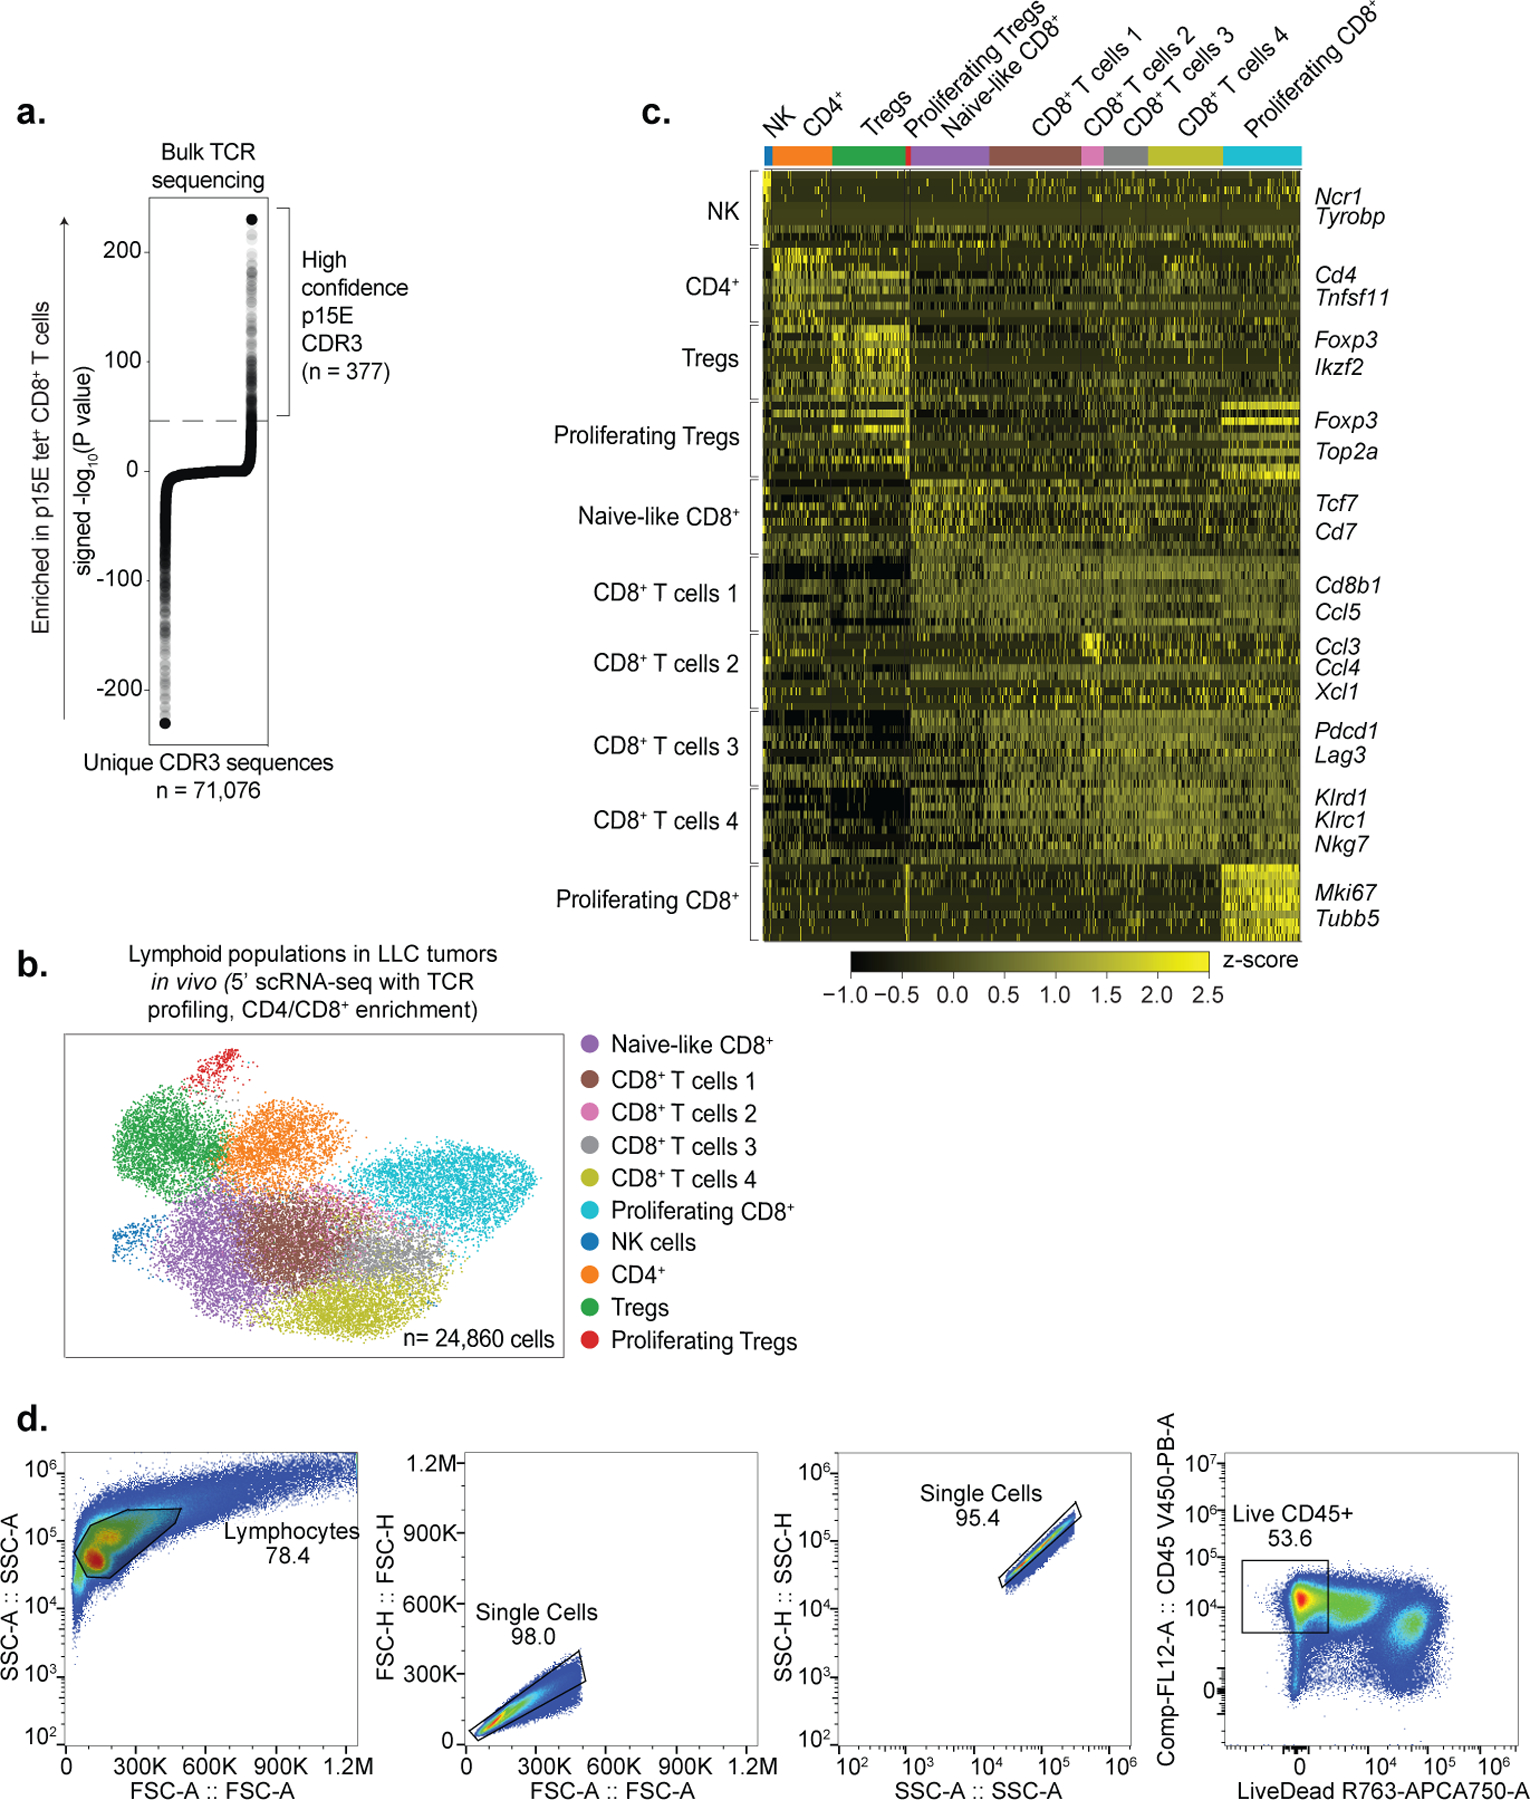
(a) Unique CDR3 sequences (x-axis) identified from TCR sequencing of flow-sorted p15E-tetramer-positive CD8+ T-cells isolated from control LLC tumors. High-confidence CDR3 sequences (n = 377) are highlighted by brackets and identified based on strong statistical enrichment (−log10(P value) > 46 cut-off indicated by dotted line, see Methods) within the p15E-tetramer-positive fraction. (b-c) scRNA-seq (5’) of 24,860 lymphoid cells (CD4+/CD8+-enrichment) isolated from control (n=4 untreated, n=4 ICB-treated) and Setdb1 KO (n=3 untreated, n=3 ICB-treated) LLC tumors. (b) UMAP plot highlights cell populations identified among CD4+/CD8+-enriched lymphoid cells. (c) Representative marker genes used to identify and annotate cell clusters in (b). (d) Representative flow cytometry gating strategy for p15E-tetramer studies. Corresponds to Fig. 4e. *P < 0.05.
Extended Data Fig. 10. Survival data and functional studies evaluating MHC-I ablation, CD8 depletion, and NK depletion in Setdb1 KO cells.
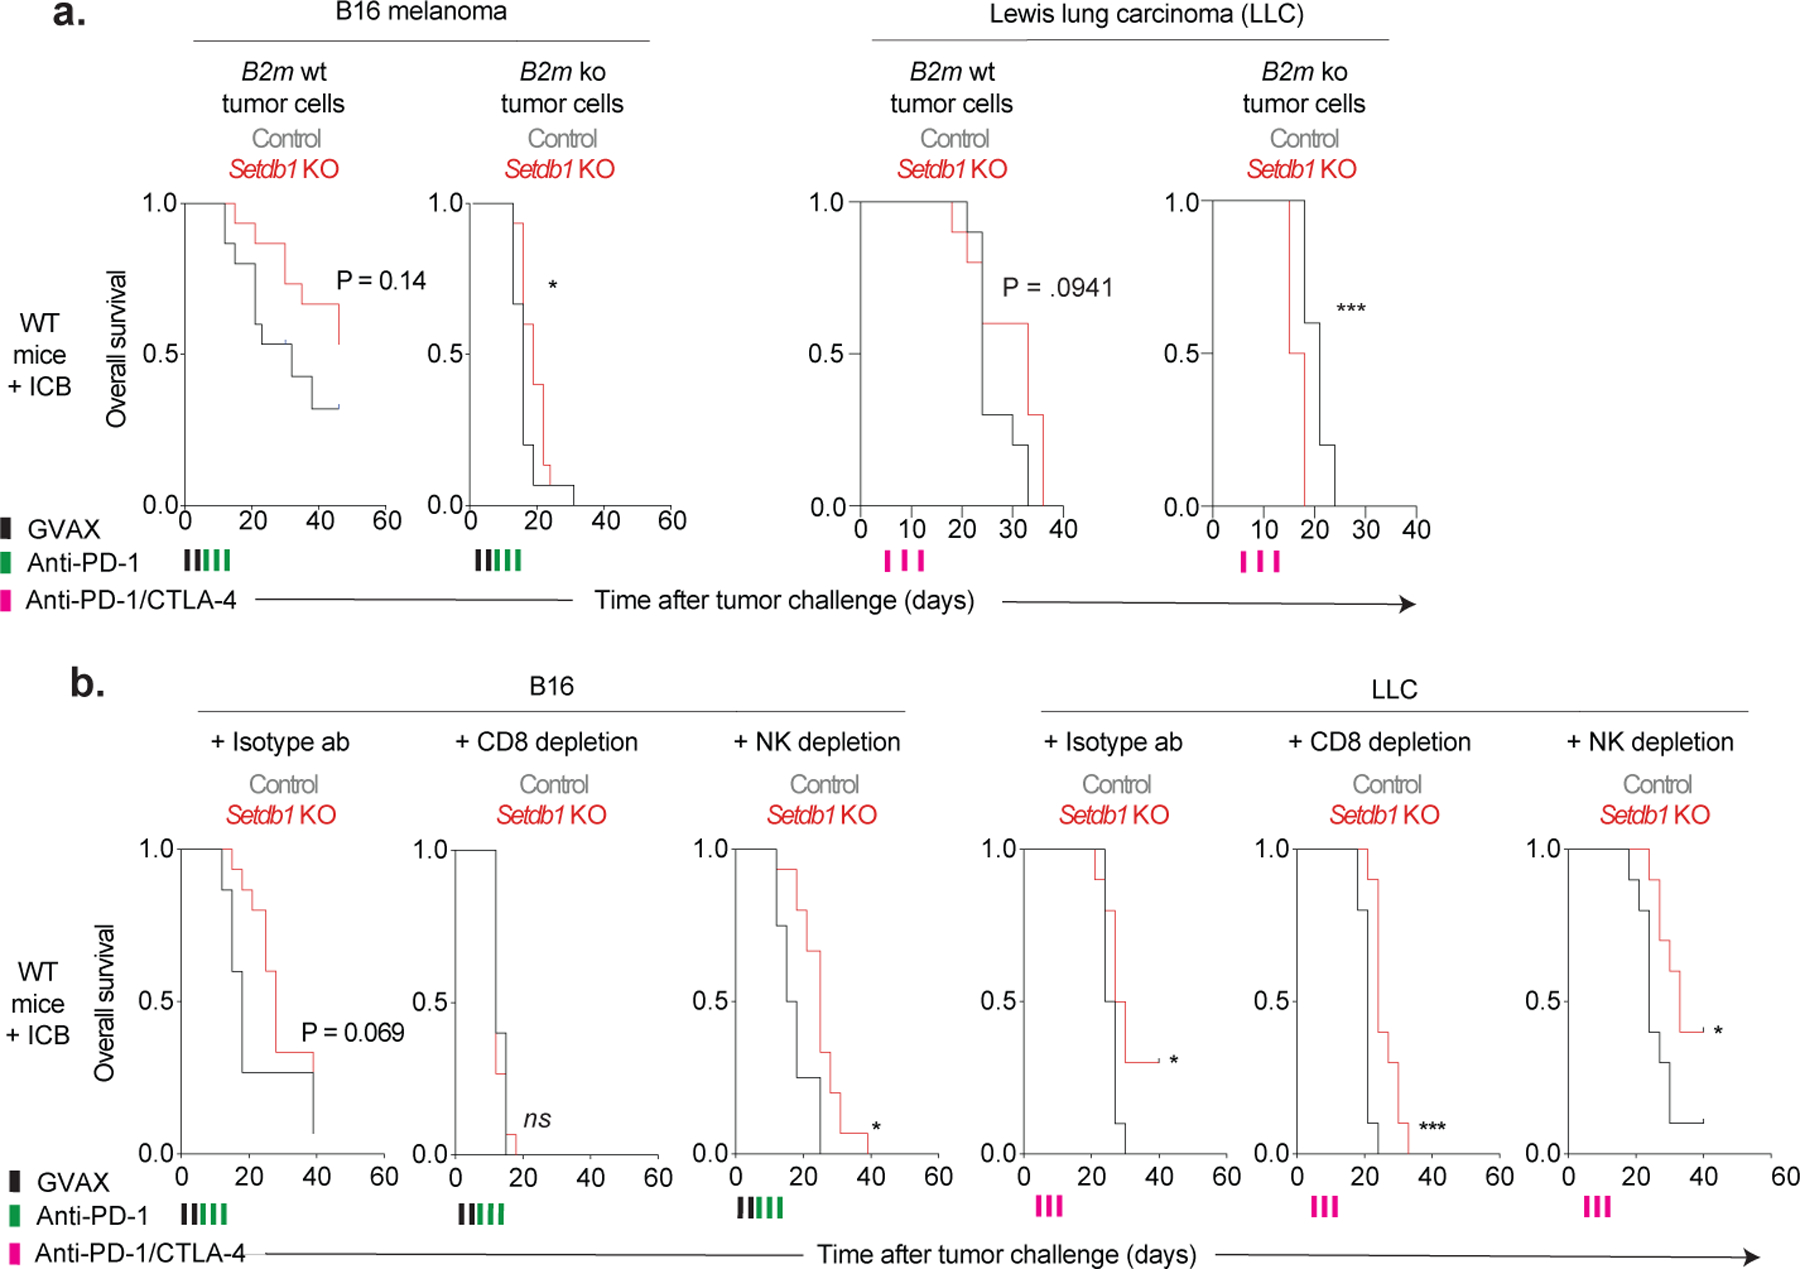
(a) Overall survival for ICB-treated WT mice inoculated with control and Setdb1 KO B16 (left) or LLC (right) cells with intact (B2m WT) or deficient (B2m KO) MHC-I, as detailed in Fig. 4f and Methods. Statistics by log-rank test. (b) Overall survival for ICB-treated WT mice inoculated with control or Setdb1 KO B16 (left) or LLC (right) cells that received intraperitoneal injections with isotype (left), CD8-depleting (middle), or NK-depleting (right) antibodies starting on day −3 prior to tumor challenge and continuing every 3 days until day 18, as detailed in Fig. 4f and Methods. Statistics by log-rank test. *P < 0.05; ***P < 0.001.
Supplementary Material
Acknowledgements
This work was supported by funds from Calico Life Sciences LLC, the Gene Regulation Observatory at the Broad Institute of MIT and Harvard, the Damon-Runyon Cancer Research Foundation (to G.K.G. and J.W.), the National Cancer Institute (NCI) Clinical Proteomic Tumor Analysis Consortium (NIH/NCI U24-CA210986 and NIH/NCI U01 CA214125 to S.A.C), the Wong Family Award (to B.C.M.), and the NCI/NIH Director’s Fund (DP1CA216873 to B.E.B.). B.E.B. is the Bernard and Mildred Kayden Endowed MGH Research Institute Chair and an American Cancer Society Research Professor.
In addition, the authors would like to thank all members of the Bernstein and Manguso labs at MGH and the Broad Institute, Dr. Eli Van Allen and Dr. Natalie Vokes of the Dana-Farber Cancer Institute, Dr. Arlene Sharpe of Harvard Medical School, Dr. Guillaume Poncet-Montagne, Dr. David McKinney, Dr. Tom Sundberg, and Dr. Joseph Growney of the Broad Institute, and Dr. David Stokoe and Dr. Ari Firestone of Calico Life Sciences LLC, for thoughtful discussions and feedback. Graphics in Figure 1a were created with Biorender.com.
Competing interests declaration
This work was supported in part by funding from Calico Life Sciences, LLC. G.K.G. consults for Moderna Therapeutics. J.J.I. consults for Tango Therapeutics and Phenomic AI. B.C.M. consults for Rheos Medicines, Inc. J.G.D. consults for Agios, Foghorn Therapeutics, Maze Therapeutics, Merck, and Pfizer; J.G.D. consults for and has equity in Tango Therapeutics. S.C.A. is a member of the scientific advisory boards of Kymera, PTM BioLabs and Seer and an ad hoc scientific advisor to Pfizer and Biogen. R.T.M. consults for Bristol Myers Squibb and Tango Therapeutics. B.E.B. declares outside interests in Fulcrum Therapeutics, Arsenal Biosciences, HiFiBio, Cell Signaling Technologies and Chroma Medicine.
Footnotes
Supplementary information line
Supplementary Information is available for this paper.
Data availability
All genomic sequencing data that support the findings of this study have been deposited in the GEO database with the accession code GSE155972. The original mass spectra for all experiments, and the protein sequence database used for searches have been deposited in the public proteomics repository MassIVE (https://massive.ucsd.edu) and are accessible at ftp://massive.ucsd.edu/MSV000086580/.
References
- 1.Jones PA, Ohtani H, Chakravarthy A & De Carvalho DD Epigenetic therapy in immune-oncology. Nat. Rev. Cancer 19, 151–161 (2019). [DOI] [PubMed] [Google Scholar]
- 2.Topper MJ, Vaz M, Marrone KA, Brahmer JR & Baylin SB The emerging role of epigenetic therapeutics in immuno-oncology. Nat. Rev. Clin. Oncol 17, 75–90 (2020). [DOI] [PMC free article] [PubMed] [Google Scholar]
- 3.Matsui T et al. Proviral silencing in embryonic stem cells requires the histone methyltransferase ESET. Nature 464, 927–931 (2010). [DOI] [PubMed] [Google Scholar]
- 4.Rowe HM et al. KAP1 controls endogenous retroviruses in embryonic stem cells. Nature 463, 237–240 (2010). [DOI] [PubMed] [Google Scholar]
- 5.Tchasovnikarova IA et al. GENE SILENCING. Epigenetic silencing by the HUSH complex mediates position-effect variegation in human cells. Science 348, 1481–1485 (2015). [DOI] [PMC free article] [PubMed] [Google Scholar]
- 6.Dennis MY & Eichler EE Human adaptation and evolution by segmental duplication. Curr. Opin. Genet. Dev 41, 44–52 (2016). [DOI] [PMC free article] [PubMed] [Google Scholar]
- 7.Sharma P, Hu-Lieskovan S, Wargo JA & Ribas A Primary, Adaptive, and Acquired Resistance to Cancer Immunotherapy. Cell 168, 707–723 (2017). [DOI] [PMC free article] [PubMed] [Google Scholar]
- 8.Spranger S & Gajewski TF Mechanisms of Tumor Cell–Intrinsic Immune Evasion. Annu. Rev. Cancer Biol 2, 213–228 (2018). [Google Scholar]
- 9.Galluzzi L, Chan TA, Kroemer G, Wolchok JD & López-Soto A The hallmarks of successful anticancer immunotherapy. Sci. Transl. Med 10, (2018). [DOI] [PubMed] [Google Scholar]
- 10.Wei SC, Duffy CR & Allison JP Fundamental Mechanisms of Immune Checkpoint Blockade Therapy. Cancer Discov. 8, 1069–1086 (2018). [DOI] [PubMed] [Google Scholar]
- 11.Baumeister SH, Freeman GJ, Dranoff G & Sharpe AH Coinhibitory Pathways in Immunotherapy for Cancer. Annu. Rev. Immunol 34, 539–573 (2016). [DOI] [PubMed] [Google Scholar]
- 12.Sheng W et al. LSD1 Ablation Stimulates Anti-tumor Immunity and Enables Checkpoint Blockade. Cell 174, 549–563.e19 (2018). [DOI] [PMC free article] [PubMed] [Google Scholar]
- 13.Miao D et al. Genomic correlates of response to immune checkpoint therapies in clear cell renal cell carcinoma. Science 359, 801–806 (2018). [DOI] [PMC free article] [PubMed] [Google Scholar]
- 14.Burr ML et al. An Evolutionarily Conserved Function of Polycomb Silences the MHC Class I Antigen Presentation Pathway and Enables Immune Evasion in Cancer. Cancer Cell 36, 385–401.e8 (2019). [DOI] [PMC free article] [PubMed] [Google Scholar]
- 15.Li F et al. In Vivo Epigenetic CRISPR Screen Identifies Asf1a as an Immunotherapeutic Target in Kras-Mutant Lung Adenocarcinoma. Cancer Discov. 10, 270–287 (2020). [DOI] [PMC free article] [PubMed] [Google Scholar]
- 16.Manguso RT et al. In vivo CRISPR screening identifies Ptpn2 as a cancer immunotherapy target. Nature 547, 413–418 (2017). [DOI] [PMC free article] [PubMed] [Google Scholar]
- 17.Jacobs FMJ et al. An evolutionary arms race between KRAB zinc-finger genes ZNF91/93 and SVA/L1 retrotransposons. Nature 516, 242–245 (2014). [DOI] [PMC free article] [PubMed] [Google Scholar]
- 18.Ceol CJ et al. The histone methyltransferase SETDB1 is recurrently amplified in melanoma and accelerates its onset. Nature 471, 513–517 (2011). [DOI] [PMC free article] [PubMed] [Google Scholar]
- 19.Braun DA et al. Interplay of somatic alterations and immune infiltration modulates response to PD-1 blockade in advanced clear cell renal cell carcinoma. Nat. Med 26, 909–918 (2020). [DOI] [PMC free article] [PubMed] [Google Scholar]
- 20.Lieberman-Aiden E et al. Comprehensive mapping of long-range interactions reveals folding principles of the human genome. Science 326, 289–293 (2009). [DOI] [PMC free article] [PubMed] [Google Scholar]
- 21.Azazi D, Mudge JM, Odom DT & Flicek P Functional signatures of evolutionarily young CTCF binding sites. BMC Biol. 18, 132 (2020). [DOI] [PMC free article] [PubMed] [Google Scholar]
- 22.Cosman D et al. ULBPs, novel MHC class I-related molecules, bind to CMV glycoprotein UL16 and stimulate NK cytotoxicity through the NKG2D receptor. Immunity 14, 123–133 (2001). [DOI] [PubMed] [Google Scholar]
- 23.Cuellar TL et al. Silencing of retrotransposons by SETDB1 inhibits the interferon response in acute myeloid leukemia. J. Cell Biol 216, 3535–3549 (2017). [DOI] [PMC free article] [PubMed] [Google Scholar]
- 24.Mehdipour P et al. Epigenetic therapy induces transcription of inverted SINEs and ADAR1 dependency. Nature 588, 169–173 (2020). [DOI] [PubMed] [Google Scholar]
- 25.Takahashi Y et al. Regression of human kidney cancer following allogeneic stem cell transplantation is associated with recognition of an HERV-E antigen by T cells. J. Clin. Invest 118, 1099–1109 (2008). [DOI] [PMC free article] [PubMed] [Google Scholar]
- 26.Laumont CM et al. Noncoding regions are the main source of targetable tumor-specific antigens. Sci. Transl. Med 10, (2018). [DOI] [PubMed] [Google Scholar]
- 27.Kershaw MH et al. Immunization against endogenous retroviral tumor-associated antigens. Cancer Res. 61, 7920–7924 (2001). [PMC free article] [PubMed] [Google Scholar]
- 28.White HD, Roeder DA & Green WR An immunodominant Kb-restricted peptide from the p15E transmembrane protein of endogenous ecotropic murine leukemia virus (MuLV) AKR623 that restores susceptibility of a tumor line to anti-AKR/Gross MuLV cytotoxic T lymphocytes. J. Virol 68, 897–904 (1994). [DOI] [PMC free article] [PubMed] [Google Scholar]
- 29.Jiang Y et al. The methyltransferase SETDB1 regulates a large neuron-specific topological chromatin domain. Nat. Genet 49, 1239–1250 (2017). [DOI] [PMC free article] [PubMed] [Google Scholar]
- 30.Adoue V et al. The Histone Methyltransferase SETDB1 Controls T Helper Cell Lineage Integrity by Repressing Endogenous Retroviruses. Immunity 50, 629–644.e8 (2019). [DOI] [PubMed] [Google Scholar]
- 31.Doench JG et al. Rational design of highly active sgRNAs for CRISPR-Cas9-mediated gene inactivation. Nat. Biotechnol 32, 1262–1267 (2014). [DOI] [PMC free article] [PubMed] [Google Scholar]
- 32.Goldman MJ et al. Visualizing and interpreting cancer genomics data via the Xena platform. Nat. Biotechnol 38, 675–678 (2020). [DOI] [PMC free article] [PubMed] [Google Scholar]
- 33.Subramanian A et al. Gene set enrichment analysis: a knowledge-based approach for interpreting genome-wide expression profiles. Proc. Natl. Acad. Sci. U. S. A 102, 15545–15550 (2005). [DOI] [PMC free article] [PubMed] [Google Scholar]
- 34.Liberzon A et al. The Molecular Signatures Database (MSigDB) hallmark gene set collection. Cell Syst 1, 417–425 (2015). [DOI] [PMC free article] [PubMed] [Google Scholar]
- 35.Liberzon A et al. Molecular signatures database (MSigDB) 3.0. Bioinformatics 27, 1739–1740 (2011). [DOI] [PMC free article] [PubMed] [Google Scholar]
- 36.Motzer RJ et al. Nivolumab versus Everolimus in Advanced Renal-Cell Carcinoma. N. Engl. J. Med 373, 1803–1813 (2015). [DOI] [PMC free article] [PubMed] [Google Scholar]
- 37.van Galen P et al. A Multiplexed System for Quantitative Comparisons of Chromatin Landscapes. Mol. Cell 61, 170–180 (2016). [DOI] [PMC free article] [PubMed] [Google Scholar]
- 38.D L, Lauren D, Van P, Bradley E & Charles B Mint-ChIP3: A low-input ChIP-seq protocol using multiplexed chromatin and T7 amplification v1 (protocols.io.wbefaje). protocols.io doi: 10.17504/protocols.io.wbefaje. [DOI] [Google Scholar]
- 39.Buenrostro JD, Giresi PG, Zaba LC, Chang HY & Greenleaf WJ Transposition of native chromatin for fast and sensitive epigenomic profiling of open chromatin, DNA-binding proteins and nucleosome position. Nat. Methods 10, 1213–1218 (2013). [DOI] [PMC free article] [PubMed] [Google Scholar]
- 40.Dixon JR et al. Chromatin architecture reorganization during stem cell differentiation. Nature 518, 331–336 (2015). [DOI] [PMC free article] [PubMed] [Google Scholar]
- 41.Bonev B et al. Multiscale 3D Genome Rewiring during Mouse Neural Development. Cell 171, 557–572.e24 (2017). [DOI] [PMC free article] [PubMed] [Google Scholar]
- 42.Heinz S et al. Simple combinations of lineage-determining transcription factors prime cis-regulatory elements required for macrophage and B cell identities. Mol. Cell 38, 576–589 (2010). [DOI] [PMC free article] [PubMed] [Google Scholar]
- 43.Mi H, Muruganujan A, Ebert D, Huang X & Thomas PD PANTHER version 14: more genomes, a new PANTHER GO-slim and improvements in enrichment analysis tools. Nucleic Acids Res. 47, D419–D426 (2019). [DOI] [PMC free article] [PubMed] [Google Scholar]
- 44.Ashburner M et al. Gene ontology: tool for the unification of biology. The Gene Ontology Consortium. Nat. Genet 25, 25–29 (2000). [DOI] [PMC free article] [PubMed] [Google Scholar]
- 45.The Gene Ontology Consortium. The Gene Ontology Resource: 20 years and still GOing strong. Nucleic Acids Res. 47, D330–D338 (2019). [DOI] [PMC free article] [PubMed] [Google Scholar]
- 46.Eden E, Navon R, Steinfeld I, Lipson D & Yakhini Z GOrilla: a tool for discovery and visualization of enriched GO terms in ranked gene lists. BMC Bioinformatics 10, 48 (2009). [DOI] [PMC free article] [PubMed] [Google Scholar]
- 47.ENCODE Project Consortium. An integrated encyclopedia of DNA elements in the human genome. Nature 489, 57–74 (2012). [DOI] [PMC free article] [PubMed] [Google Scholar]
- 48.Davis CA et al. The Encyclopedia of DNA elements (ENCODE): data portal update. Nucleic Acids Res. 46, D794–D801 (2018). [DOI] [PMC free article] [PubMed] [Google Scholar]
- 49.Nakagawa S & Takahashi MU gEVE: a genome-based endogenous viral element database provides comprehensive viral protein-coding sequences in mammalian genomes. Database 2016, (2016). [DOI] [PMC free article] [PubMed] [Google Scholar]
- 50.Evans LH, Morrison RP, Malik FG, Portis J & Britt WJ A neutralizable epitope common to the envelope glycoproteins of ecotropic, polytropic, xenotropic, and amphotropic murine leukemia viruses. J. Virol 64, 6176–6183 (1990). [DOI] [PMC free article] [PubMed] [Google Scholar]
- 51.Mertins P et al. Reproducible workflow for multiplexed deep-scale proteome and phosphoproteome analysis of tumor tissues by liquid chromatography-mass spectrometry. Nat. Protoc 13, 1632–1661 (2018). [DOI] [PMC free article] [PubMed] [Google Scholar]
- 52.Reynisson B, Alvarez B, Paul S, Peters B & Nielsen M NetMHCpan-4.1 and NetMHCIIpan-4.0: improved predictions of MHC antigen presentation by concurrent motif deconvolution and integration of MS MHC eluted ligand data. Nucleic Acids Res. 48, W449–W454 (2020). [DOI] [PMC free article] [PubMed] [Google Scholar]
- 53.Abelin JG et al. Mass Spectrometry Profiling of HLA-Associated Peptidomes in Mono-allelic Cells Enables More Accurate Epitope Prediction. Immunity 46, 315–326 (2017). [DOI] [PMC free article] [PubMed] [Google Scholar]
- 54.Sarkizova S et al. A large peptidome dataset improves HLA class I epitope prediction across most of the human population. Nat. Biotechnol 38, 199–209 (2020). [DOI] [PMC free article] [PubMed] [Google Scholar]
- 55.Wolf FA, Angerer P & Theis FJ SCANPY: large-scale single-cell gene expression data analysis. Genome Biol. 19, 15 (2018). [DOI] [PMC free article] [PubMed] [Google Scholar]
- 56.Butler A, Hoffman P, Smibert P, Papalexi E & Satija R Integrating single-cell transcriptomic data across different conditions, technologies, and species. Nat. Biotechnol 36, 411–420 (2018). [DOI] [PMC free article] [PubMed] [Google Scholar]
- 57.Ntranos V, Yi L, Melsted P & Pachter L A discriminative learning approach to differential expression analysis for single-cell RNA-seq. Nat. Methods 16, 163–166 (2019). [DOI] [PubMed] [Google Scholar]
- 58.Lun ATL, Bach K & Marioni JC Pooling across cells to normalize single-cell RNA sequencing data with many zero counts. Genome Biol. 17, 75 (2016). [DOI] [PMC free article] [PubMed] [Google Scholar]
Associated Data
This section collects any data citations, data availability statements, or supplementary materials included in this article.
Supplementary Materials
Data Availability Statement
All genomic sequencing data that support the findings of this study have been deposited in the GEO database with the accession code GSE155972. The original mass spectra for all experiments, and the protein sequence database used for searches have been deposited in the public proteomics repository MassIVE (https://massive.ucsd.edu) and are accessible at ftp://massive.ucsd.edu/MSV000086580/.


