Abstract
The adoptive transfer of T lymphocytes reprogrammed to target tumour cells has demonstrated potential for treatment of various cancers1–7. However, little is known about the long-term potential and clonal stability of the infused cells. Here we studied long-lasting CD19-redirected chimeric antigen receptor (CAR) T cells in two patients with chronic lymphocytic leukaemia1–4 who achieved a complete remission in 2010. CAR T cells remained detectable more than ten years after infusion, with sustained remission in both patients. Notably, a highly activated CD4+ population emerged in both patients, dominating the CAR T cell population at the later time points. This transition was reflected in the stabilization of the clonal make-up of CAR T cells with a repertoire dominated by a small number of clones. Single-cell profiling demonstrated that these long-persisting CD4+ CAR T cells exhibited cytotoxic characteristics along with ongoing functional activation and proliferation. In addition, longitudinal profiling revealed a population of gamma delta CAR T cells that prominently expanded in one patient concomitant with CD8+ CAR T cells during the initial response phase. Our identification and characterization of these unexpected CAR T cell populations provide novel insight into the CAR T cell characteristics associated with anti-cancer response and long-term remission in leukaemia.
Durable remissions have been demonstrated in relapsed, refractory B cell malignancies with CD19-specific CAR T (CTL019) cells1–4,5–7. Two patients with chronic lymphocytic leukaemia (CLL) were infused with CTL019 cells in 2010 as part of a phase I trial and responded with complete remissions and persistence of the infused CAR T cells1–4. Functional persistence of CAR T cells in acute lymphoid leukaemia (ALL) and CLL is a key characteristic of durable clinical responses2,8–10, yet the characteristics of long-term persisting CAR T cells have not been extensively studied. The persistence of CTL019 cells in these complete-responding patients enabled us to interrogate molecular and functional attributes of highly effective anti-CLL T cells. Here we report that these two patients have remained in remission at the last follow-up more than ten years after infusion, and we have mapped the fate of CTL019 cells using bulk and single-cell multi-omic approaches.
CLL remissions and CAR T cell persistence
Peak CTL019 expansion in patient 1 occurred on day 3, whereas this was delayed to day 31 in patient 2, a possible reflection of the almost 78-fold lower infusion dose in patient 2. Both individuals have remained in remission more than ten years after infusion. CAR T cells were detectable by flow cytometry across time points (Fig. 1a–c); at the time of the most recent research phlebotomy, 10 years post-infusion for patient 1 and 9 years post-infusion for patient 2, CTL019 cells remained detectable and represented 0.8% and 0.1% of all T cells, respectively (Fig. 1b, c). Quantitative PCR confirmed the presence of CTL019 in both patients at all time points. Flow cytometry showed that CD19+ Blymphocytes and CLL cells had remained undetectable or highly suppressed (less than 1% of cells) beyond 3 years post-infusion. The absence of leukaemia cells was confirmed by immunoglobulin heavy chain (IgH) repertoire analysis: the leukaemic clone has remained undetectable since 6 months after CTL019 administration. Productively rearranged IgH sequences have been at background levels since 12 and 6 months after CTL019 cell treatment in patients 1 and 2, respectively (Extended Data Table 1), confirming the findings by flow cytometry.
Fig. 1 |. Molecular tracking of effectors and targets in long-term responders to anti-CD19 CAR T cell therapy for CLL.
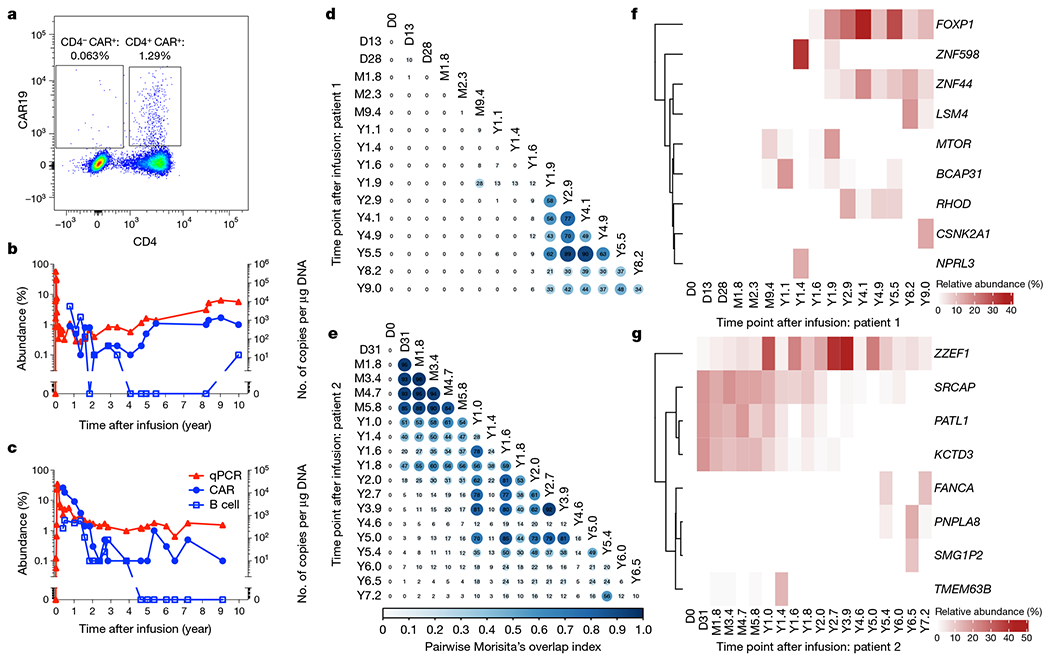
a, Representative flow cytometry data showing persistence of mostly CD4+ CTL019 cells in patient 1, eight years after infusion. b, c, Kinetics of CAR T cell expansion and persistence (red triangles, by quantitative PCR with vector-specific primers; blue circles, by flow cytometry using an anti-CAR antibody) and response of B cells (blue squares, by anti-CD19 flow cytometry) to anti-CD19 CAR T cell therapy in patient 1 (b) and patient 2 (c). d, e, Clonal evolution of CAR T cells based on lentiviral vector integration site analysis. Pairwise Morisita’s overlap index (shown as two decimal points in each circle) was computed between all timepoints (days (D), months (M) or years (Y) after infusion) for patient 1 (d) and patient 2 (e). f, g, Integration sites with abundance above 10% at at least one time point were tracked over time for patient 1 (f) and patient 2 (g). The integration sites were labelled using the nearest genes of integration.
Clonal stabilization of CAR T cells
To understand the clonal nature of these CAR T cell expansions, we examined the T cell receptor (TCR) β-chain repertoire of sorted CAR T cells by deep sequencing (TCR-seq) and lentiviral vector integration site (LVIS) analysis11. TCR-seq revealed a clonal shift in patient 1 that occurred between the month 2.3 and year 1.4 time points. The clonal composition of patient 2 was overall more stable with a gradual shift over the first two years (Extended Data Fig. 1a–d). TCR-seq was limited to the early time points owing to input cell requirements, so we turned to LVIS analysis11,12 to assess both clonal dynamics and CAR integration sites across time points up to 9.0 and 7.2 years post-infusion in patients 1 and 2, respectively. We identified 7,930 and 3,406 total unique sites for patients 1 and 2, respectively; 3,378 and 1,216 total unique sites were identified in the infusion products of patient 1 and 2, respectively. Most insertions were present within the gene body, and intronic insertions were favoured over other gene elements (Extended Data Fig. 2a–c). Our LVIS data revealed little CAR T cell clonal stability in the first 1.6 years in patient 1, in contrast to the TCR-seq at corresponding time points. From year 1.9 onward, the LVIS repertoire in this patient stabilized until the last follow-up (Fig. 1d). Patient 2 had episodes of repertoire stability from day 31 to approximately year 1, as well as from year 1 to 5, consistent with the clonal shift observed in the TCR-seq data (Fig. 1e).
Patient 1 showed emergence of clones with CAR insertion sites into MTOR, BCAP31, ZNF598 and NPRL3 from the month 9.4 to year 1.9 time points, mostly at single time points. CAR insertions into or near FOXP1, ZNF44 and RHOD emerged in the year 1.6–1.9 time points and were stable over many years; and CAR insertion sites in LSM4 and CSNK2A emerged in the year 8.2 and 9.0 time points (Fig. 1f). Patient 2 exhibited multiple CAR T cell clones at more than 10% abundance early after infusion, such as SRCAP, PATL1 and KCTD3, which were most prominent in the first two years, and ZZEF1 which was sustained for more than 7 years after infusion. Other insertions acquired prominence later after infusion, including FANCA, PNPLA8, SMG1P2 and TMEM63B (Fig. 1g). The nearest genes of the integration sites with more than 10% abundance in at least one time point did not overlap between patients. These data show stabilization of the CAR T cell repertoire in patient 1 at late time points, periods of stabilization in patient 2 with unclear stability at late time points, and non-overlap of integration sites between patients.
CyTOF reveals CD8+, γδ and CD4+ CAR T cells
We developed a 40-antibody panel to interrogate the phenotype of CAR T cells at multiple time points using cytometry by time-of-flight (CyTOF). We stringently gated CD3+ CAR+ T cells (Extended Data Fig. 3a), recovering over 45,000 CAR+ T cells across all time points, represented by at least 100 cells from each of five time points per patient (Fig. 2a, b, Extended Data Fig. 3b). In patient 1, CD8+ cells constituted 29.3% of CAR T cells at month 1.8 and diminished in proportion at subsequent time points, with CD4+ cells constituting 97.5% of CAR T cells at year 1.4 and over 99.6% of CAR T cells from year 3.4 to the latest time point at 9.3 years post-infusion (Fig. 2a–c). Patient 2, who had more delayed CAR T cell expansion characteristics, exhibited an overall similar trend, with prominent CD8+ cells in the initial time points, subsequently diminishing to such an extent that CD4+ cells constituted 97.6% of CAR T cells by 7.2 years post-infusion. We additionally observed a population of CD4 and CD8 double-negative CAR T cells that was prominent in patient 2, constituting 33.4% and 46.5% of CAR T cells at month 2.5 and year 1.6, respectively and diminishing to 12.9% 8.2%, and 0.5% at years 2.8, 4.7 and 7.2, respectively (Fig. 2b, c). This CD4−CD8− population had a distinct cellular phenotype, expressing cytotoxic markers GZMB, 2B4, CD57, CD85j, T-bet and PD-1, as well as Helios, which notably differentiated this population from otherwise similar cytotoxic CD8+ T cells (Fig. 2b, Extended Data Fig. 3b). Given this distinct marker profile, we labelled this subset as CD4−CD8− Helioshi CAR T cells. This population was detected at low levels (3.2% of cells) at the month 1.8 time point in patient 1 and was absent or rare (less than 1% of cells) and beyond the year 1.4 time point (Fig. 2c).
Fig. 2 |. Analysis of CD3+ CAR+ T cells using CyTOF across multiple time points.
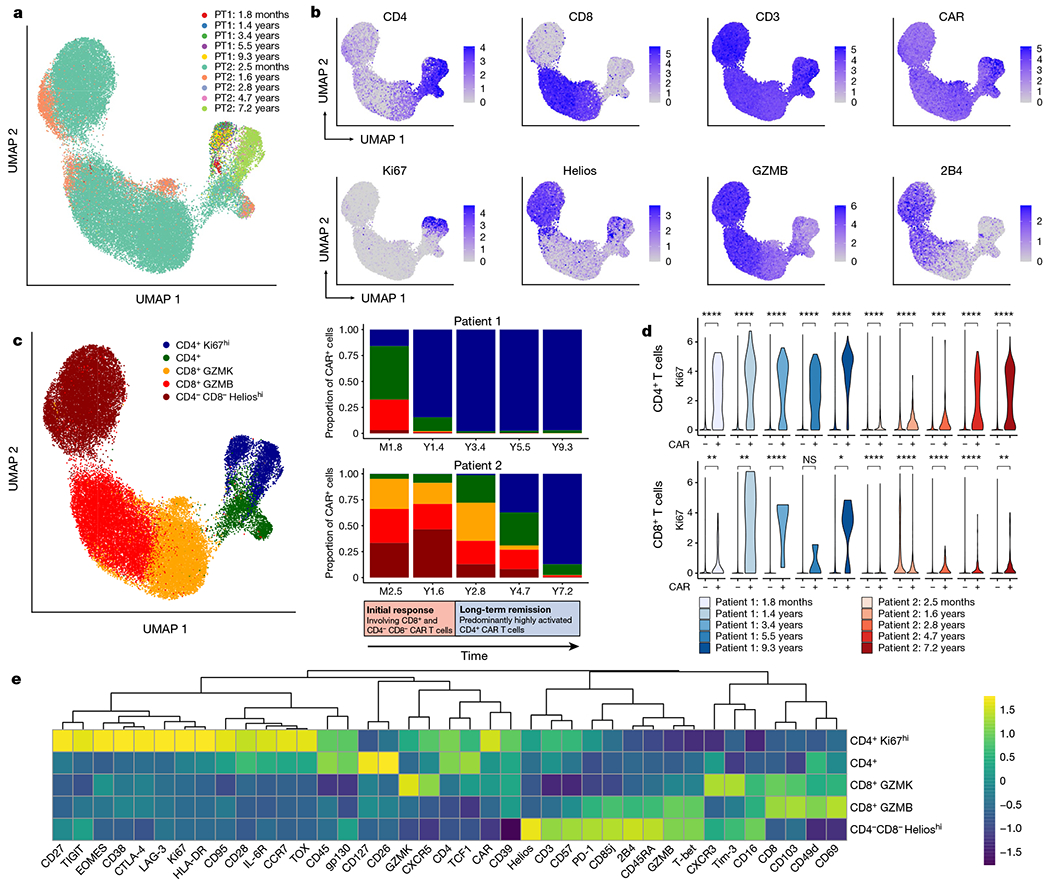
a, Uniform manifold approximation and projection (UMAP) of CD3+CAR+ gated cells from CyTOF data generated from samples at five time points for each of patient 1 (PT1) and patient 2 (PT2). Each colour represents cells from one patient time point after infusion. b, Protein expression of selected CyTOF markers, revealing a prominent Ki67hi population of CD4+ CAR T cells, as well as a CD4−CD8− population expressing Helios, GZMB and 2B4. c, UMAP grouped by five major clusters of CAR T cells: a CD4+Ki67hi population, a CD4+ population without this Ki67hi phenotype, a CD8+ population highly expressing GZMK, a CD8+ population highly expressing GZMB, and a CD4−CD8− population expressing Helios. The adjacent stacked bar plots indicate the proportion of each CAR T cell population at different time points, revealing an initial response phase involving CD8+ and CD4−CD8− CAR T cells, followed by a long-term remission stage dominated by this CD4+Ki67hi population. This transition to CD4+Ki67hi CAR T cells was more delayed in patient 2 compared with patient 1. d, Ki67 expression in CD4+CAR+ and CD4+CAR− cells; and CD8+CAR+ and CAR− cells across time points. Statistical testing was performed using the Wilcoxon rank-sum test. ****P < 0.0001; ***P < 0.001; **P < 0.01; *P < 0.05; NS, not significant (P > 0.05). e, Heat map indicating z-score normalized expression of CyTOF markers across five major CAR T cell clusters.
To characterize these CD4−CD8− CAR T cells, we performed 5′ cellular indexing of transcriptomes and epitopes by sequencing (CITE-seq) with TCR-seq on additional aliquots of CD3+CAR+ sorted cells from patient 2 at month 3 and year 3. We generated a UMAP embedding based on single-cell RNA sequencing (RNA-seq) and identified a population of double-negative cells that were verified as CAR T cells on the basis of the presence of reads mapped to the 5’ CAR construct (Extended Data Fig. 4a, b). These cells were found to be gamma delta (γδ) CAR T cells, as demonstrated by protein expression of TCRγδ, lack of protein expression of the TCRαβ, specific RNA expression of TRDV1 and TRGV4, and non-detection of the TCRαβ clonotype. We re-examined flow cytometry data from a functional experiment performed on CAR T cells from patient 23, which revealed that the CD4−CD8− CAR T cell population, as well as the CD8+ and CD4+ populations, exhibited evidence of CAR-specific function through upregulation of MIP-1β and CD107a on CD19-specific stimulation (Extended Data Fig. 5a, b).
The CD4+ CAR T cells highly expressed Ki67, suggestive of a proliferative phenotype (Fig. 2b). Ki67hiCD4+ CAR T cells steadily emerged as the dominant population in both patients, constituting 15.9% of CAR T cells at month 1.8 in patient 1, increasing to 97.0% by year 9.3; and constituting 0.2% of CAR T cells in patient 2 at month 2.4, increasing to 87.2% by year 7.2 (Fig. 2b, c). In comparing CAR+ CD4 T cells with CAR− CD4 T cells, we found Ki67 expression to be strongly CAR+ T cell-specific (Fig. 2d). CD8+ CAR T cells also exhibited an overall proliferative trend, but Ki67 expression was generally lower and less robustly observed compared with the CD4+ CAR T cells (Fig. 2d). These Ki67hi CD4+ T cells expressed a distinct marker profile, including activation markers CD38, HLA-DR and CD95, transcription factors EOMES and TOX, checkpoint markers CTLA-4, LAG-3 and TIGIT, and memory markers CD27 and CCR7 (Fig. 2e). Together, these data suggest that there are two major phases of CAR T cell therapy responses in these patients: an initial response phase represented by CD8+ T cells and CD4−CD8− Helioshi CAR T cells, and a long-term remission phase dominated by uniquely proliferative and cytolytic CD4+ CAR T cell phenotypes.
CITE-seq on persisting CD4+ CAR T cells
Given the intriguing evidence of a distinct long-persisting Ki67hi CD4+ CAR T cell phenotype, we sought to characterize the CAR T cell clonality, protein expression, and transcriptome of this population at a single-cell level. We analysed patient 1 at year 9.3, the longest follow-up time point with sufficient cells available for this analysis. We generated joint single-cell TCR-seq and CITE-seq libraries from CD3+CAR+DAPI− sorted cells, obtaining single-cell profiles from 1,437 T cells that passed our strict quality thresholds (Fig. 3a). By identifying single-cell RNA-seq reads mapped to the 5’ CAR sequence, we identified 1,149 CAR T cells, 288 of which were non-CAR expressing (‘normal’) T cells that passed through our fluorescence-activated cell sorting (FACS) gating (Fig. 3b).
Fig. 3 |. Multi-omic single-cell analysis reveals clonal expansion, proliferation and activation in CAR T cells from patient 1 at year 9.3.
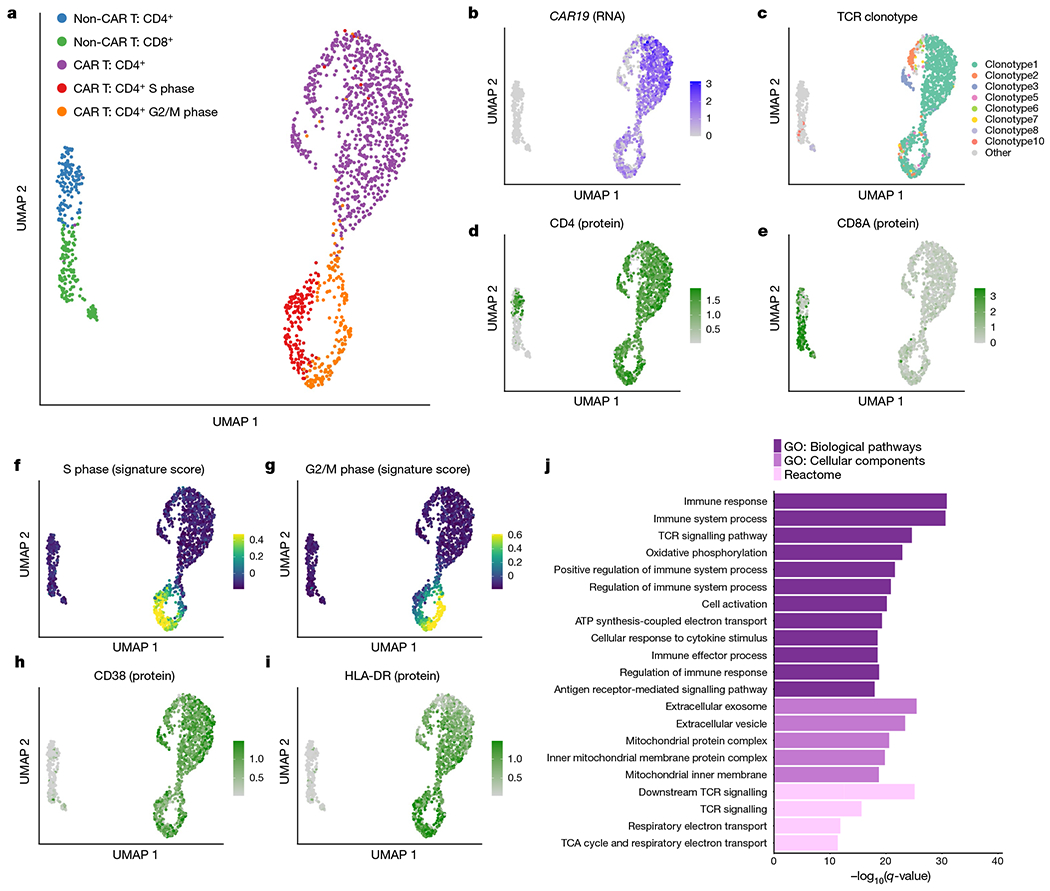
a, UMAP of 1,437 T cells sorted from peripheral blood from patient 1 at year 9.3. UMAP coordinates were computed using the single-cell RNA-seq component of the 5’ TCR-seq and CITE-seq protocol. b, Normalized expression of the CAR construct detected from 5’ single-cell RNA-seq reads. c, UMAP coloured by the eight detected TCR clonotypes with at least ten cells each. Minor clusters with fewer than ten detected cells were coloured light grey. d, e, Normalized CITE-seq antibody expression for the CD4 (d) and CD8a (e) proteins. f, g, Cell cycle scores for cells in the S phase (f) or G2/M (g) phases. h, i, Normalized CITE-seq antibody expression for the activation markers CD38 (h) and HLA-DR (i). j, Gene set enrichment analysis for genes significantly upregulated in CD4+CAR+ T cells compared with CD4+CAR− T cells. Gene Ontology (GO) biological pathways and cellular components and Reactome pathways were considered. TCA, tricarboxylic acid.
We reasoned that the non-CAR T cells provide a valuable comparison to the CAR T cell populations identified. While the normal T cells were clonally diverse (Shannon entropy = 6.88) with 170 unique clonotypes detected, the CAR T cells demonstrated strong evidence of clonal dominance (Shannon entropy = 1.43), with only 27 unique clonotypes detected and the top 3 clonotypes constituting more than 90% of CAR T cells (Fig. 3c). Out of the 27 CAR T cell clonotypes detected, 13 were detected at a previous time point from our TCR-seq analysis from the first 2 years (Extended Data Fig. 6a), including the most frequent clonotype seen at year 1.9 (clonotype 3 in Fig. 3c). The normal T cells consisted of a relatively balanced mix of CD4+ and CD8+ T cell populations, whereas CD4+ CAR T cells were sufficiently dominant at this time point that a CD8+ CAR T cell cluster was not clearly identified (Fig. 3d, e).
CAR T cells displayed strong evidence of ongoing proliferation at the transcriptomic level, supported by expression of PCNA, MCM6, TOP2A, CDK1, CCNB2 and MKI67 (Extended Data Fig. 6b) as well as from cell cycle scoring13 using gene sets to identify cells in S phase or G2/M phase (Fig. 3f, g). Approximately 30% of CAR T cells were observed to be in S, G2 or M phase, compared with fewer than 7% of non-CAR T cells (Extended Data Fig. 6c, d, χ2 P-value 8.97 × 10⁻¹⁵). This cell cycle effect in CAR T cells was not clonotype-specific, with no significant difference in cell cycle phase between the top three clonotypes, and weak evidence of differences in the remaining clonotypes (Extended Data Fig. 6e).
Cytotoxic attributes of CD4+ CAR T cells
The CAR T cells at year 9.3 exhibited a distinct profile compared with their CAR− counterparts. Activation markers CD38 and HLA-DR were strongly upregulated among CAR T cells, as shown by antibody-based detection via CITE-seq (Fig. 3h, i), as well as inhibitory receptors PD-1, TIM-3, LAG-3 and TIGIT, which have been associated with both activated and exhausted T cell states14,15 (Extended Data Fig. 7a, b). We identified 645 differentially expressed genes in the comparison between CAR T cells in G1 phase and normal CD4+ T cells in G1 phase (Extended Data Fig. 6f, Supplementary Table 1, Bonferroni-adjusted P-value < 0.001), with upregulated genes enriched for an effector CD4+ T cell signature (false discovery rate = 0.024; Extended Data Fig. 6g); by contrast, only 33 genes were differentially expressed between the top three clonotypes (Extended Data Fig. 6h). We observed significant enrichment in T cell activation, TCR signalling, oxidative phosphorylation, vesicle component and mitochondrial protein complex pathways in the CAR T cells (Fig. 3j). Of note, we observed a distinct profile of cytotoxic enzymes in the CD4+ CAR T cells. GZMK and GZMA were among the top four upregulated genes among the CD4+ CAR T cells (Fig. 4a, Extended Data Fig. 6f). PRF1 was upregulated, along with enrichment of vesicle cellular components that may be involved in cytotoxic granules (Figs. 3j, 4a). By contrast, GZMB and GZMM were not highly expressed. To directly assess the functional response of these long-persisting CD4+ CAR T cells, we subjected T cells from patient 1 at year 9.3 to CAR-specific stimulation by co-culture with a K562 cell line expressing CD19. We observed upregulation of the degranulation marker CD107a, which was co-expressed with MIP-1β, perforin and granzyme A (GZMA), supportive of direct cytotoxic function in response to CAR stimulation (Fig. 4c, Extended Data Fig. 8a, b).
Fig. 4 |. Evidence of functional activation, metabolic reprogramming and antigen-driven signalling in CAR T cells from patient 1 at year 9.3.
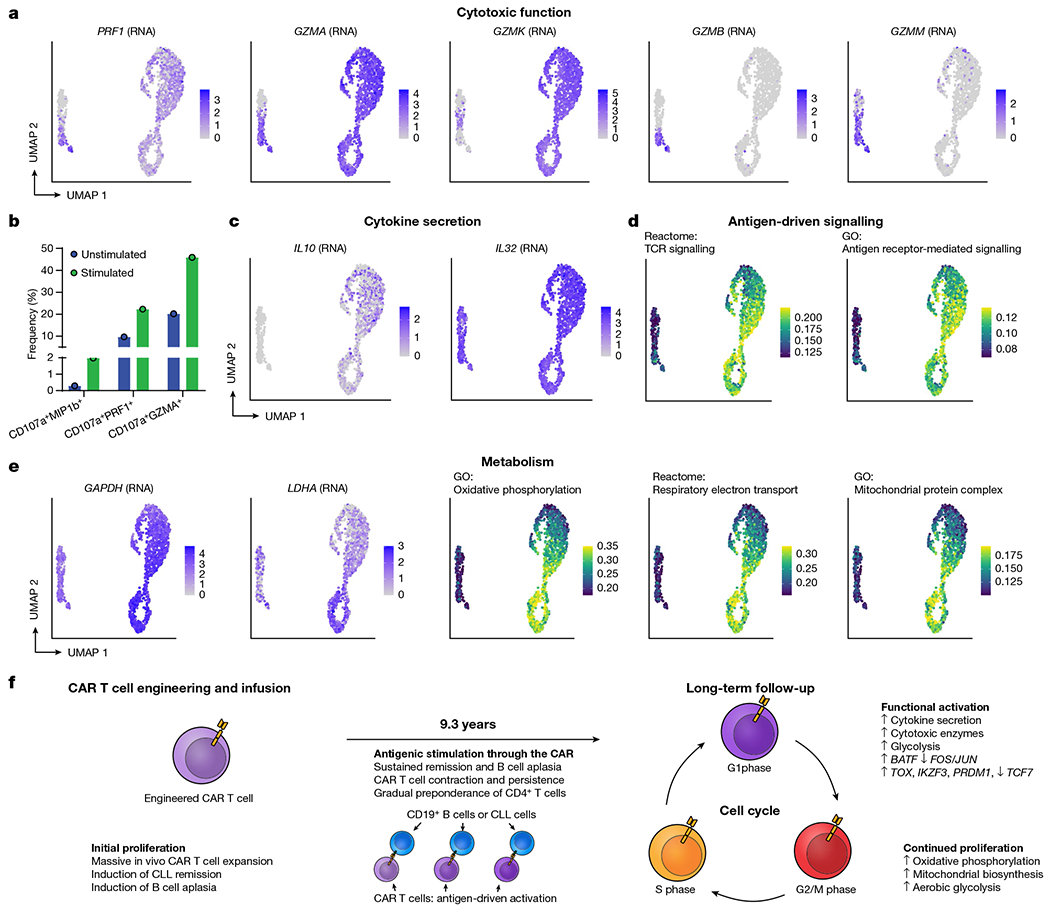
a, UMAP indicating upregulated RNA expression of cytotoxic genes PRF1, GZMA and GZMK in CD4+ CAR T cells, with GZMB and GZMM being expressed only in the normal CD8+ T cells. b, Evidence of cytotoxic function in CD4+ CAR T cells from patient 1 at year 9.3 in response to CAR-specific stimulation. T cells from patient 1 at year 9.3 were subjected to CAR-specific stimulation by co-culture with CD19-expressing K562 cells. Shown are gated CD3+CAR+CD4+ T cells, and the bars represent the frequency of cells double-positive for CD107a and MIP-1β, perforin and GZMA. c, UMAP indicating upregulated RNA expression of cytokine genes IL10 and IL32 among CAR T cells compared to normal T cells. d, AUCell scores for Reactome TCR signalling and Gene Ontology antigen receptor-mediated signalling pathways. e, RNA expression of key glycolytic gene GAPDH and fermentative glycolysis gene LDHA; AUCell scores for oxidative phosphorylation, respiratory electron transport and mitochondrial protein complex upregulated among CAR T cells, particularly in the active cell cycling phases. f, Proposed model of mechanistic basis of sustained remission with B cell aplasia mediated by few, metabolically active but immune checkpoint inhibitor-restrained CAR T cell clones.
Consistent with a functionally activated rather than exhausted phenotype, we observed upregulation of genes encoding for cytokines interleukin 10 (IL-10) and IL-32 among CAR T cells (Fig. 4c); this functional activity appeared to be associated with antigen-driven signalling through the CAR, as TCR signalling and antigen-mediated signalling were the top-enriched signalling pathways (Figs. 3j, 4d). GAPDH was upregulated in all cell cycle phases of the CAR T cells, and LDHA and oxidative phosphorylation pathways were upregulated among the actively cycling cells (Fig. 4e, f), suggestive of Warburg-like aerobic glycolysis in the CAR T cells with mitochondria-dependent oxidative phosphorylation providing metabolic support for CAR T cell proliferation. Further, 18 transcription factors were significantly differentially in the CAR T cells compared with the CAR− cells (Extended Data Fig. 9a, Bonferroni adjusted P-value < 0.001), and single-cell regulon scores generated using GENIE316 and AUCell showed strong correlation between transcription factor regulons (Extended Data Fig. 9b). Expression of TCF7, FOS, JUNB and JUN was downregulated, whereas TOX, IKZF3, EOMES, PRDM1 and BATF were upregulated in the CAR T cells (Extended Data Fig. 9c, d).
Finally, we tested whether this long-persisting CD4+ CAR T cell population with GZMA/GZMK expression was present in patient 2 and at earlier time points in patient 1. CITE-seq revealed 153 high-quality CAR T cells from patient 2 at year 6.5, from which we indeed identified a cluster of CD4+ CAR T cells that closely resembled the phenotype observed in patient 1 at year 9.3 with distinct expression of GZMA and GZMK (Extended Data Fig. 10a). This distinct GZMA–GZMK phenotype was also observed in patient 1 at the earlier time points of month 12 and month 15 post-infusion (Extended Data Fig. 10b, c), when nearly all of the 113 and 93 detected CAR T cells exhibited specific expression of GZMA and GZMK. Many of the CAR T cells at these earlier time points were CD4-positive, and a population of transcriptomically similar cells appeared to be CD8-positive, as shown by RNA expression of CD8B, suggesting a possible convergence of cytotoxic profiles among CD4+ and CD8+ CAR T cells at these time points.
Discussion
Here we detail the functional and molecular characterization of long-persisting anti-CD19 CAR T cells. We observed two distinct phases of the anti-leukaemia response: an initial phase characterized by CD8+ or CD4−CD8− Helioshi γδ CAR T cells, followed by the predominance of a proliferative CD4+ CAR T cell population in the ensuing years. The CAR T cells detected in patient 1 at year 9.3 were exclusively CD4+, a surprising finding that led us to rethink the possibility that CD4+ T cells may be primarily responsible for cytotoxicity against CD19-expressing cells at these time points. Strongly upregulated antigen-mediated signalling pathways and upregulation of GZMK, GZMA and PRF1, as well as functional characterization of these cells in response to CD19 stimulation, supported this notion. This population had notable similarity to a recently reported cytotoxic CD4GZMK T cell population in a study of bladder cancer17. Ongoing proliferation, cytokine expression, metabolic activity and in vitro response to CAR stimulation suggested that of these long-persisting CAR T cells remained functionally active rather than exhausted. This phenotype was observed across clonotypes and not in CAR− T cells, suggesting that proliferation was likely driven by ongoing antigenic signalling through the CAR rather than clonotype-specific features or systemically circulating cytokines. Indeed, antigenic signalling pathways were the top upregulated pathways associated with CAR+ T cells compared with normal T cells, possibly reflecting engagement of CD19+ B cells progressing beyond the early pre-pro-B stage. The apparent clonal selection in these two patients was an intriguing observation, with possible contributors including disruption of nearby genes, integration into genomic regions associated with more robust expression of the CAR construct, and genetic drift. These findings offer intriguing new insights into the nature of long-term CAR T cell signalling and persistence in these unique patients.
Methods
Study design
Both patients were enrolled on the trial designed to determine safety and feasibility of anti-CD19 CAR T cell manufacturing and infusionin patients with relapsed or refractory B cell malignancies18. The trial (ClinicalTrials.gov number, NCT01029366) was approved by the institutional review board at the University of Pennsylvania and conducted in accordance with the protocol3. Autologous T cells were collected by apheresis, enriched and activated using anti-CD3 and anti-CD28-coated polystyrene beads (Dynal) and transduced with the mouse FMC63-based chimeric antigen receptor carrying 4-1BB and CD3-ζ signalling domains as previously reported18. Patients 1 and 2 were infused with a total dose of 1.1 × 10⁹ (1.6 × 10⁷ kg−1) and 1.4 × 10⁷ (1.46 × 10⁵ kg−1) CAR T cells, respectively, on three consecutive days and monitored for CAR T cell engraftment, tumour dynamics and systemic inflammatory responses using previously reported qualified flow cytometry, quantitative PCR and Luminex assays3,8. All ethical guidelines were followed. No commercial sponsor was involved in the study.
Correlative studies
Patient samples were acquired before manufacturing, from the infusion product itself, and after infusion for the studies described here. Our routine pipeline of correlative assays includes (1) a flow cytometry-based assay using a non-commercially available, in-house generated anti-CAR19 idiotype monoclonal antibody conjugated to either Alexa Fluor 647 (a gift from L. Cooper) or phycoerythrin (PE) (Novartis Institute for Biomedical Research); (2) a quantitative PCR assay with primers spanning the 4-1BB and CD3ζ chimeric molecule; and (3) a flow-cytometry-based assay to quantify B cells and leukaemic cells. All assays have been qualified prior to implementation in the clinical monitoring and extensively used8,19. All routine correlative assays were qualified before implementation, and carried out at time points defined by the clinical protocol in parallel with disease response evaluations. In addition, leukaemia response to CTL019 in these patients was assessed via deep sequencing of immunoglobulin heavy chain rearrangements as previously described3,12.
CyTOF
Antibodies for mass cytometry were obtained as pre-conjugated metal-tagged antibodies from Fluidigm or generated in-house by conjugating unlabelled purified antibodies to isotope-loaded polymers using MAXPAR kits (Fluidigm). Antibodies generated in-house were diluted in antibody stabilization buffer (Candor Bioscience). In total, 35 monoclonal antibodies were used to identify T cell-expressed surface and intracellular proteins in conjunction with five monoclonal antibodies and dead cell exclusion dye to remove non-T cells and artefacts from analysis.
Cryopreserved peripheral blood mononuclear cells (PBMCs) were thawed with thawing medium containing 10% of FBS in RPMI supplemented with benzonase (0.5 U ml−1). Thawed cells were washed with PBS once and transferred to a 96-well U-bottom tissue culture plate. Single cell suspensions were pelleted, and incubated with the cisplatin solution (final concentration: 25 μM) for 1 min at room temperature for live–dead discrimination. The reactions were quenched with PBS/1% FBS (flow buffer) and centrifuged for 4 min at 500g Cell pellets were resuspended in surface antibody cocktail (adjusted to 50 μl final volume flow buffer, incubated for 20 min at 4 °C, and washed twice in flow buffer. The cells were fixed and permeabilized in 50 μl of FOXP3 Fixation/Permeabilization working solution (FOXP3 staining buffer set, eBioscience), and stained intracellularly for 30 min at 4 °C. The cells were further washed twice with 1× permeabilization buffer (eBioscience) before fixation in 1.6% PFA solution (Electron Microscopy Sciences) containing 125 nM iridium (Fluidigm) overnight at 4 °C. Prior to data acquisition on the Helios mass cytometer (Fluidigm), cells were washed twice in PBS (without Ca2+ and Mg2+) and once in deionized H2O. Immediately prior to sample acquisition, cells were resuspended with deionized H2O containing the bead standard at a concentration 1–2 × 10⁴ beads per ml. Samples were acquired using a bead-based normalization of CyTOF data by using Nolan lab normalizer (available at https://github.com/nolanlab/bead-normalization/releases).
T cell receptor Vβ deep sequencing
CART19 cells were purified from early (first 24 months) post-infusion specimens for T cell receptor Vβ deep sequencing (TCR-seq) using a Becton Dickinson Aria II flow cytometer. Genomic DNA was isolated using the DNeasy Blood and Tissue Kit (Qiagen) and TCR-seq was carried out by (Adaptive Biotechnologies). Only productive TCR rearrangements were used in the assessment of TCR clonotype frequencies.
Lentiviral vector integration site analysis
Vector integration sites were detected from genomic DNA as described previously11,12. Genomic sequences were aligned to the human genome by BLAT (hg38, version 35, >95% identity) and statistical methods for analysing integration site distributions were carried out as previously described20. The sonic abundance method was used to infer the abundance of cell clones from integration site data21, and annotatr22 was used to annotate the genomic location of the integration sites. All samples were analysed independently in quadruplicate to suppress founder effects in the PCR and stochastics of sampling.
CyTOF data processing
Cytobank23 was used to computationally gate live CAR+ CD3+ T cells. Gating was performed as previously described24 to isolate live singlets, which were further processed by removing CD14- and CD19-positive cells, selecting CD45+CD3+ cells, and gating CAR+ and CAR− using PBMCs from healthy donors to set the CAR+ gate. Pre-processed data were imported into Seurat. Expression values were arcsinh transformed with a cofactor of 5, and matrices were concatenated. UMAP projections were computed using the top 10 PCs and 20 nearest neighbours. Initial clustering was performed with the Louvain algorithm implemented in Seurat with a resolution parameter of 0.8, and 14 clusters were merged to five meta-clusters based on similar marker expression in Extended Data Fig. 3b. To avoid the impact of outliers on colour scales, colour scales for UMAPs were defined from a range of zero to the 99th percentile of expression. Antibody clones are provided in Supplementary Table 2.
Single-cell immune, proteome, and transcriptome profiling by 5’ CITE-seq and T cell receptor Vα V(D)J sequencing
Thawed patient PBMCs were washed with 1× PBS (Life Technologies) and resuspended with antibody staining buffer containing human TruStain FcX (Biolegend). Cells were incubated with TotalSeq-C, anti-CD3 (BioLegend) and CAR (custom generated, Novartis) antibodies for 30 min at 4°C. Stained cells were washed with antibody staining buffer three times and filtered through Flowmi. Before sorting, DAPI (Thermal Fisher) was added to sort single CD3+ CAR+ nuclei. Antibody clones are provided in Supplementary Table 2.
Sorted single nuclei were loaded on a Chromium Chip G (10x Genomics) according to the manufacturer’s instructions for processing with the Chromium Next GEM Single Cell 5’ Library & Gel Bead Kit v1.1. TCR single-cell library and cell surface protein libraries were subsequently prepared from the same cells with the Chromium Single Cell V(D)J Enrichment Kit, Human T Cell and 5’ Feature Barcode Library Kit, separately. TCR single-cell library, 5’gene Expression library and cell surface protein library were pooled with a molar ratio 1:10:1 for sequencing on Illumina NextSeq 550 with 26×91 bp, aiming for 50,000 read pairs per cell for 5’gene expression library and 5,000 read pairs per cell for both TCR single-cell library and cell surface protein library.
Analysis of CITE-seq and single-cell V(D)J sequencing data
Demultiplexing and alignment of CITE-seq RNA and antibody-derived tag sequences were performed with cellranger v3.1.0 using the Gencode v32 reference modified to contain the 5’ CAR sequence. TCR sequences were identified with cellranger vdj, and clonotypes were defined based on T cell receptor Vβ CDR sequences. Low-quality cells were computationally filtered by retaining only those cells with between 200 and 5,000 genes in the scRNA-seq data, less than 5% mitochondrial RNA, and containing a detectable TCR sequence. Centred log-ratio normalization was performed on CITE-seq antibody-derived tag counts. Single-cell RNA-seq count matrices were log-normalized, and the top 2,000 variable genes were identified with the variance-stabilizing transformation with Seurat v3.2.025. Dimensionality reduction was performed using UMAP on the top 15 principal components using 30 neighbours and 2 components.
Differential expression analysis on single-cell data was performed using the Wilcoxon rank-sum test with Bonferroni multiple testing correction. Pathway enrichment analysis on differentially expressed genes was performed using gprofiler226, and single-cell pathway enrichment scores were defined using AUCell v1.6.127. For visualization of CITE-seq protein markers and AUCell enrichment scores, maximum values of color gradients were defined using the 5th and 95th percentile values to reduce the impact of outlier values. GENIE316 was used to define a transcriptional regulatory network, and regulons of transcription factors were defined by identifying target genes with an edge score greater than 0.005 and a positive expression correlation.
Intracellular cytokine detection assay
Cryopreserved patient PBMCs were thawed into OpT5 T cell medium (Thermo Fisher) containing 5% human AB serum, 1% GlutaMax, and supplemented with 2.5% T cell supplement as provided with the base OpTmizer medium. Cells were spun down and incubated for 20 min at 37 °C in OpT5 medium plus 100 U ml−1 DNAse I (Roche). Cells were spun down again and CD3+ cells were isolated by negative selection using the EasySep Human T cell Isolation Kit (StemCell Technologies). Cells were resuspended at 1 × 10⁷ cells per ml in OpT5 medium with 4 μl GolgiStop per 6 ml medium and 1 μl GolgiPlug per 1ml medium (BD Biosciences). Anti-CD107a–FITC antibody was added to the medium at a 1:20 dilution. Artificial antigen presenting cells (aAPC) expressing CD19 were added to two-thirds of the lymphocytes at a ratio of 1 aAPC:10 T cells while one-third of the cells was kept as an un-activated control. Samples were placed at 37 °C for 6 h. After 6 h, samples were transferred to 4 °C overnight. The following morning, samples were washed twice in PBS (Life Technologies) and stained for 20 min at room temperature with Live Dead Blue detection reagent (Thermo) diluted 1:800 in PBS. Cells were washed two times in FACS staining buffer and then stained for surface molecules for 20 min at room temperature. Cells were fixed using the Cytofix/CytoPerm Kit (BD Biosciences) for 20 min at room temperature protected from light. Cells were washed twice with 1× Perm/Wash buffer and then stained for CAR19 (ACRO Bio) and intracellular cytokines with antibodies in Perm/Wash buffer. Staining was done for 20 min at room temperature in the dark. Cells were washed twice more with Perm/Wash buffer and resuspended in FACS staining buffer. Samples were run on the Cytek Aurora and analysis was performed using FlowJo.
Reporting summary
Further information on research design is available in the Nature Research Reporting Summary linked to this paper.
Extended Data
Extended Data Fig. 1 |. Clonal evolution for patient 1 and 2 based on TCR sequencing data.
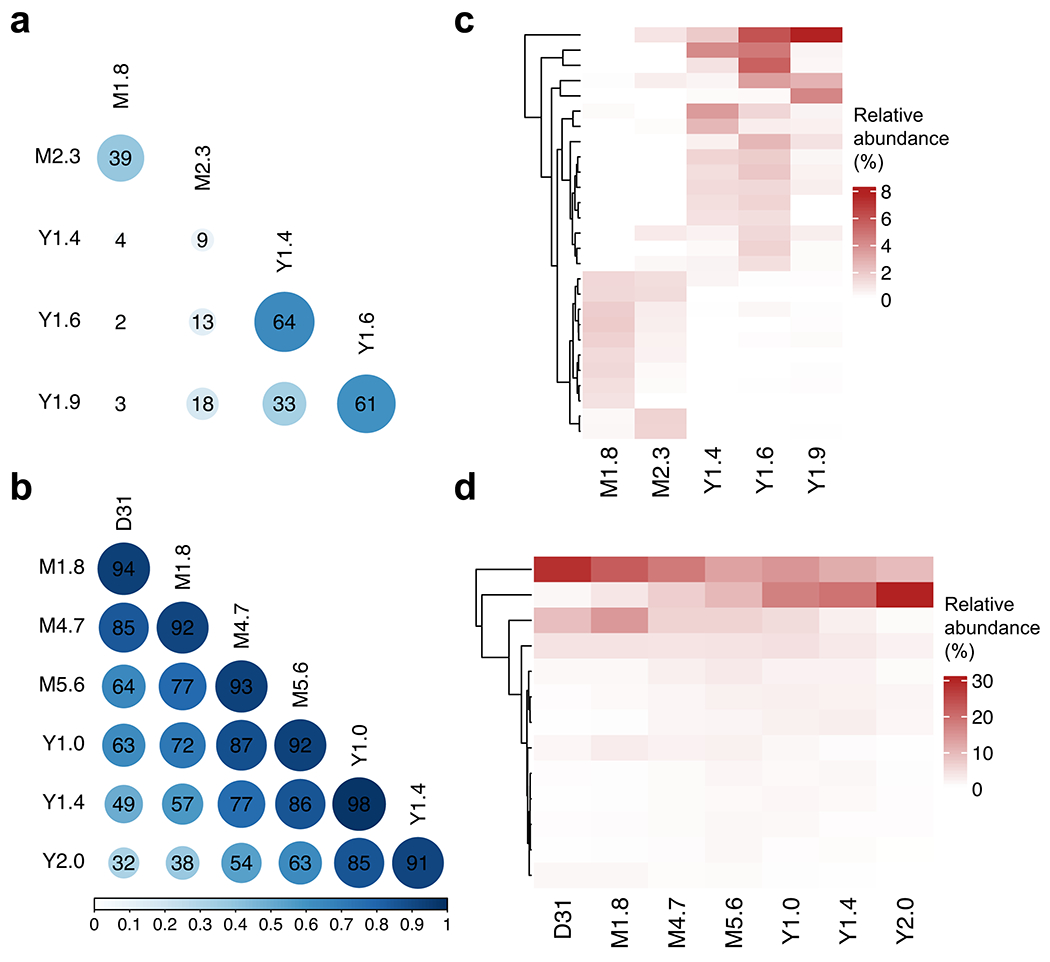
Pairwise Morisita’s overlap Index was computed between all timepoints (row and column labels) for patient 1 (a) and 2 (b). TCR clones (rows) with maximum abundance > 1% across time points were retained and tracked over time for patient 1 (c) and 2 (d).
Extended Data Fig. 2 |. Genomic annotation of integration sites for infusion product, post infusion timepoints < 60d and > 60d.
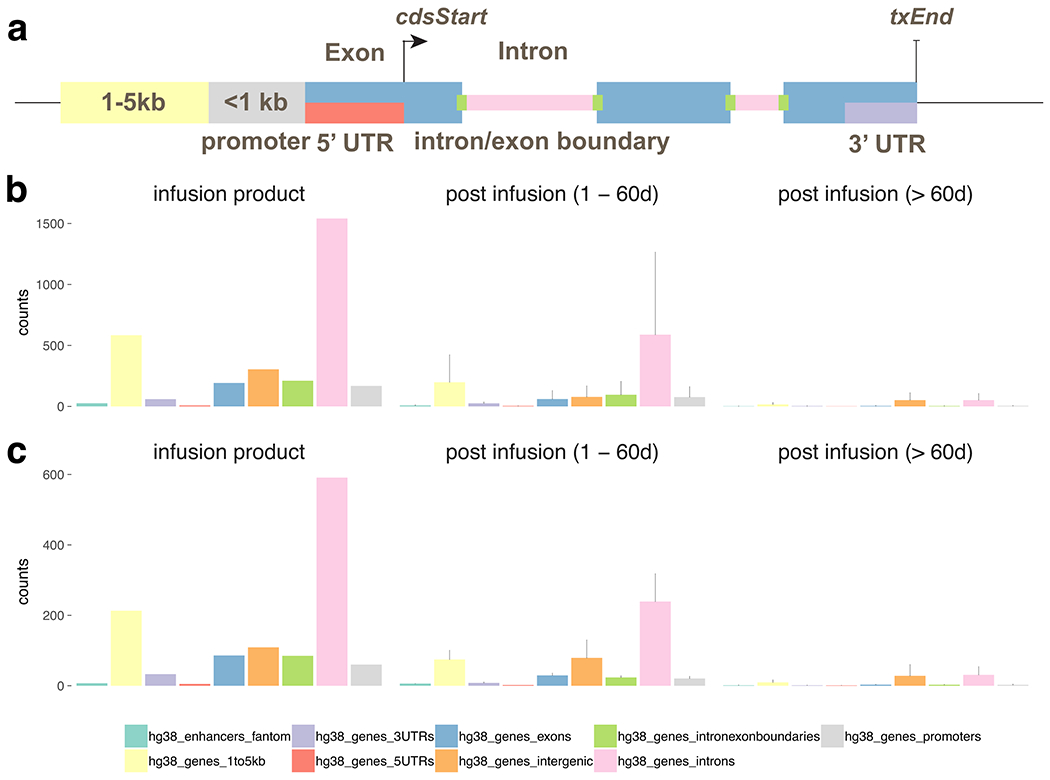
a, graphic of the annotation scheme. The integration sites from patient 1 (b) and 2 (c) were annotated based on its position relative to known genes (UCSC hg38) and permissive enhancers (FANTOM 5). The counts of integration sites that fall into each annotation category in infusion product were summarized (left). The mean and standard deviation of the number of sites for each category were also computed for 1–60 days post infusion (middle) and > 60 days post infusion (right).
Extended Data Fig. 3 |. Gating strategy and CyTOF marker expression profiles.
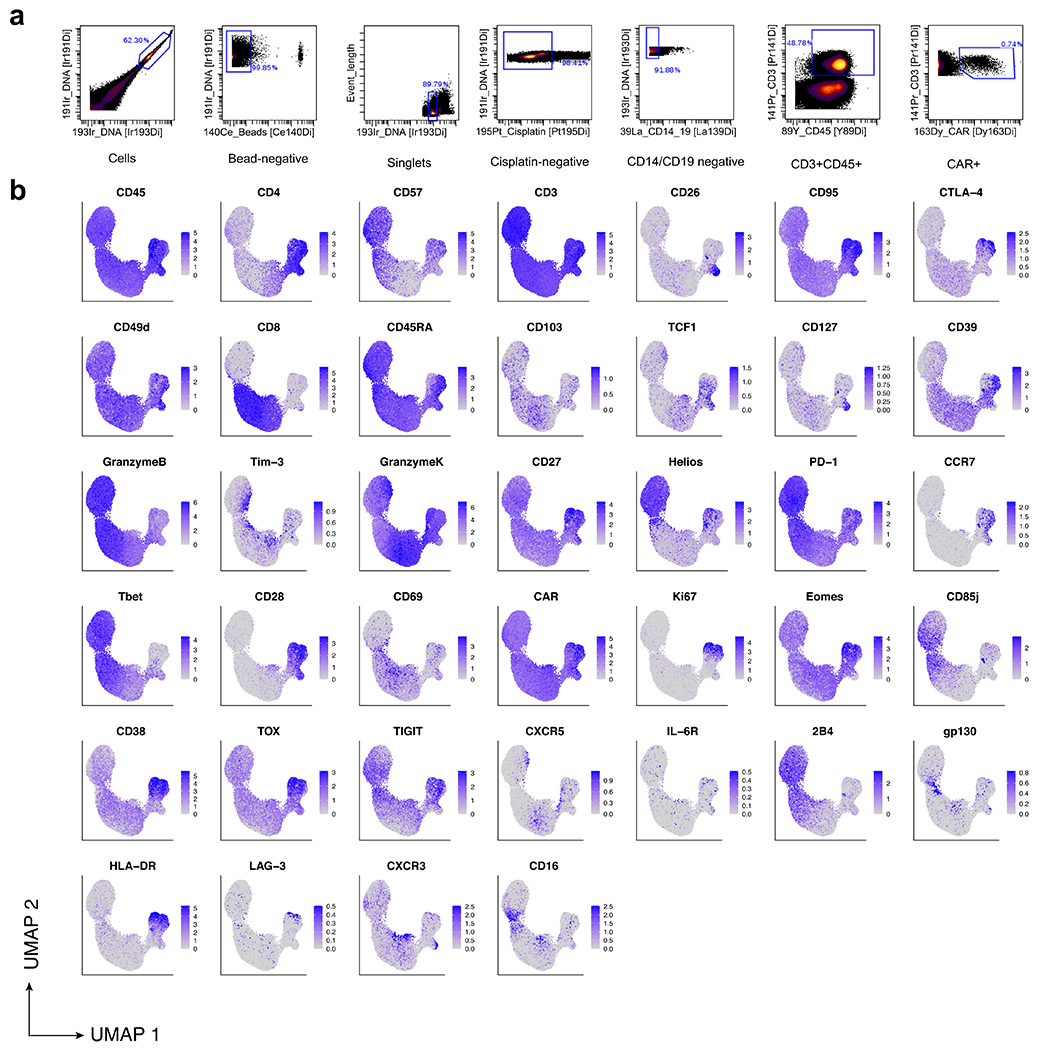
a, Gating strategy performed computationally on CyTOF data to filter to CD3+CAR+ T cells for downstream analysis. b, Protein expression of our CyTOF panel depicted on a single-cell basis on our UMAP.
Extended Data Fig. 4 |. CITE-Seq with 5’ TCR profiling reveals the presence of double-negative gamma-delta CAR T-cells in patient 2 at month 3 and year 3.
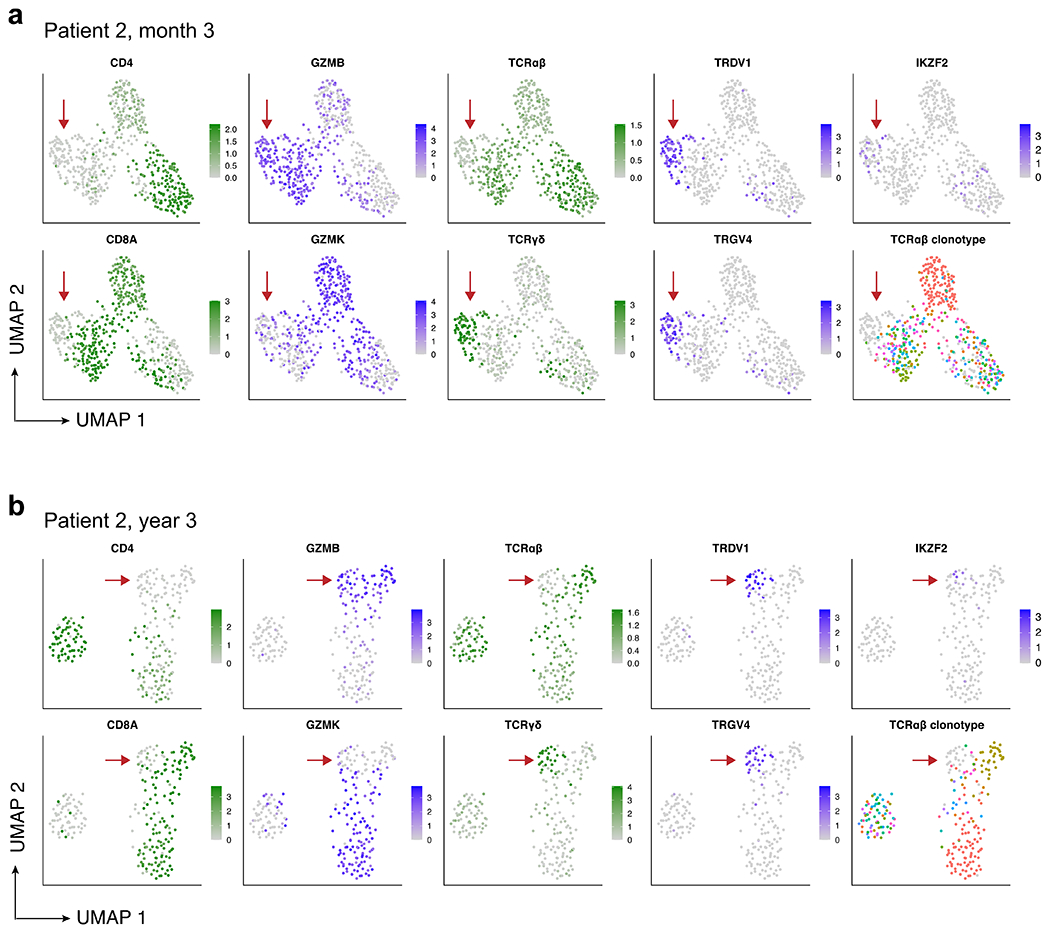
a, UMAP showing expression of key marker genes and TCRαβ clonotype for patient 2 at month 3, and (b) patient 2 at year 3. Aliquots of peripheral blood were sorted for CD3+CD14−CAR+ cells, and 5’ CITE-Seq with TCRαβ clonotyping was performed. High-quality cells were computationally identified by retaining cells with 200–5000 genes detected and less than 5% mitochondrial RNA, and shown are the 552 (month 3) and 242 (year 3) cells that were verified as CAR T-cells with at least one read aligned to the 5’ CAR construct. UMAP plots showing normalized RNA expression are colored in shades of blue; plots showing protein expression via CITE-Seq antibody-derived tags are colored in shades of green; TCRαβ clonotype plots (bottom-right of panels a and b) are colored using a spectral color scheme, with cells with no detected TCRαβ clonotype colored light grey. Red arrows indicate the double-negative CAR T-cell population in both time points, with gamma-delta identity demonstrated by protein expression of the γδ TCR, lack of protein expression of the αβ TCR, specific RNA expression of TRDV1 and TRGV4, and non-detection of the TCRαβ clonotype.
Extended Data Fig. 5 |. Re-analysis of previous published flow cytometry data performed on patient 2 demonstrates the functional capacity of CD4+, CD8+, and double-negative CAR T-cells.
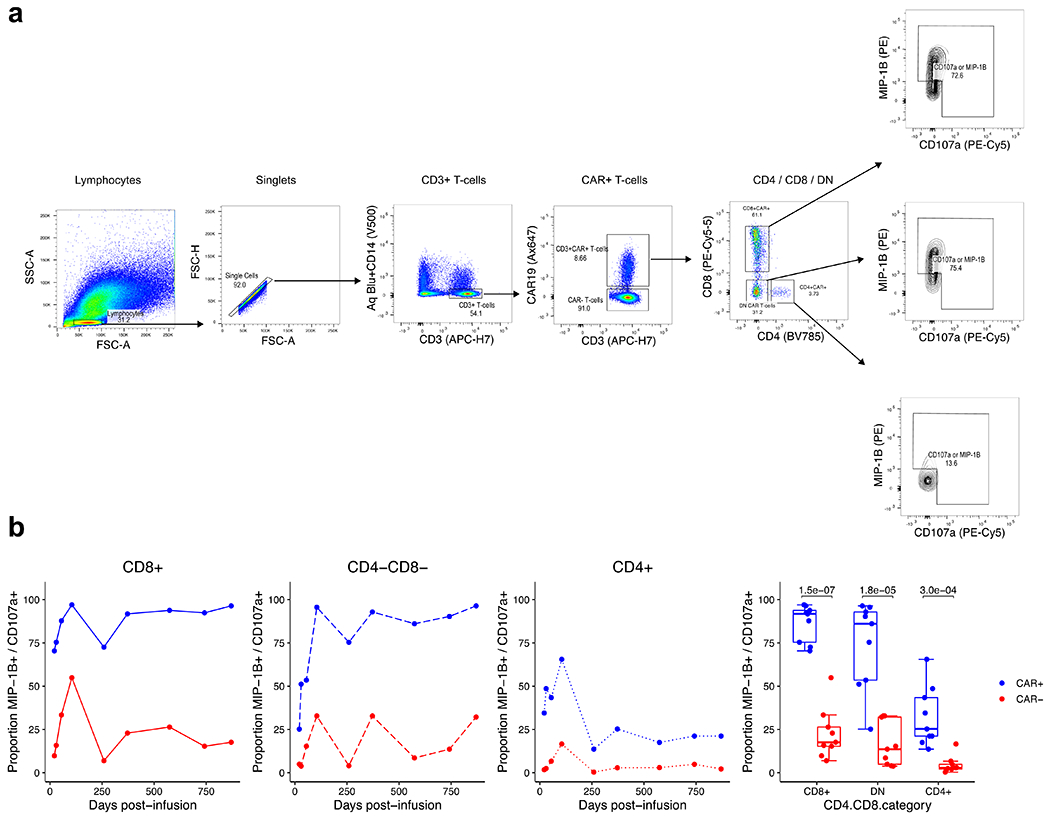
a, Gating strategy for the identification of CD4+, CD8+, and double-negative CAR T-cells. Flow cytometry data are from the functional experiment described by Porter et al. Sci Transl Med (2015), in which the authors stimulated cells from patient 2 with CD19 expressing K562 cells. Re-examination of the flow cytometry data identified prominent CD4+, CD8+, and double-negative CAR T-cell populations. Shown is representative gating at day 259, in which 31.2% of CAR T-cells were double-negative CAR T-cells. b, Line plots and box plots showing CAR-specific activation of CD4+, CD8+, and double-negative CAR T-cells supported by greater proportions of CAR+ T-cells expression MIP-1B and CD107a compared to CAR− cells in response to CAR specific stimulation. Pairwise statistical testing was performed using the two-sided Welch’s t-test.
Extended Data Fig. 6 |. Analysis of CAR T-cell clonotype, cell cycle, and differential gene expression from patient 1 at year 9.3.
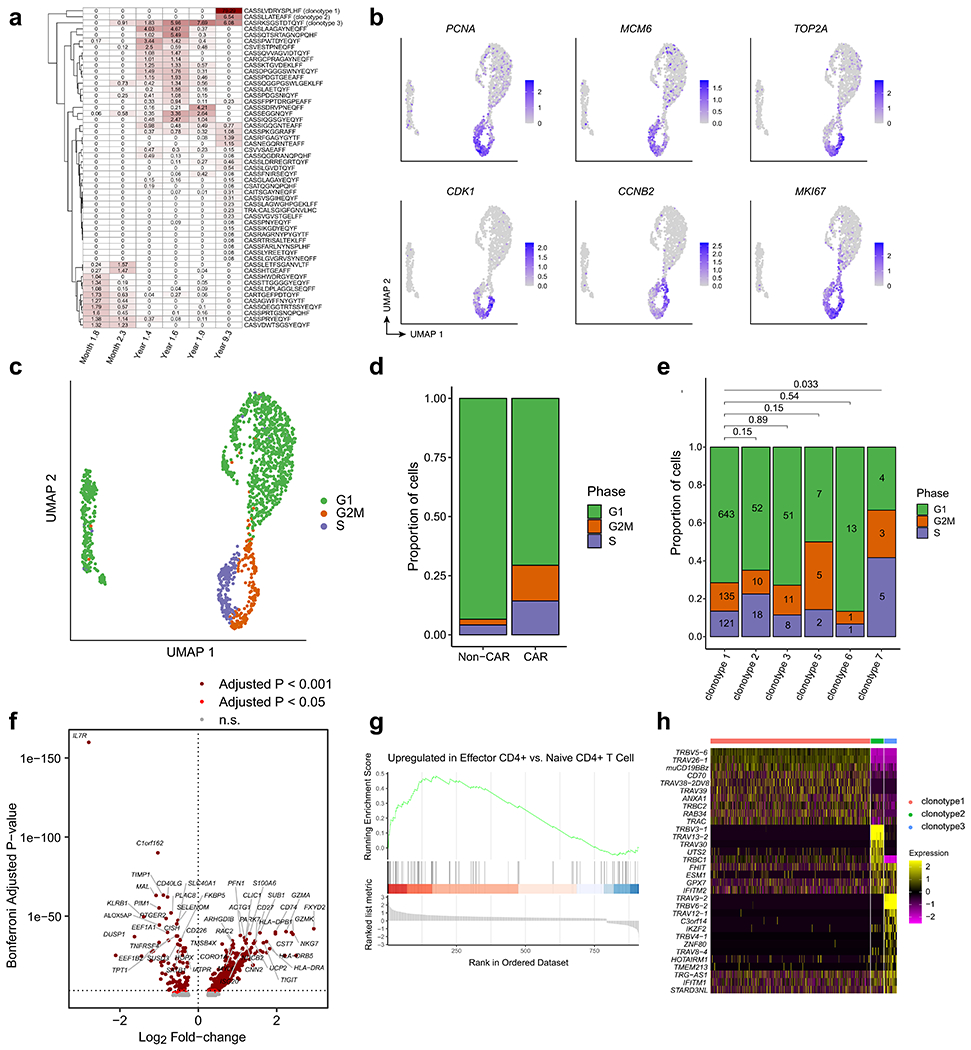
a, Heatmap showing the relative frequencies of TCR clonotypes at the 2-month, 3-month, 15-month, 18-month, 21-month, and 9-year time points. Note that the first five columns were estimated from bulk TCR sequencing, whereas the rightmost column was estimated from the single-cell TCR/CITE-Seq data from year 9. b, UMAPs indicating strong up-regulation of RNA expression of cell cycle genes. c, UMAP colored by cell cycle phase using Seurat. d, Proportions of cells in each cell cycle phase, compared between CAR− T and CAR+ T cells. Chi-squared p-value = 8.97e-15. e, Proportions of cells in each cell cycle phase, compared between the top six CAR T-cell clonotypes. Pairwise statistical significance was assessed with the Chi-Squared test, and multiple-testing correction was performed using the Benjamini-Hochberg method. Numbers within the bars indicate the number of cells observed. f, Volcano plot indicating genes up-regulated in CAR T-cells compared to normal CD4+ T cells (rightward direction) and genes down-regulated in CAR T-cells compared to normal CD4+ T cells (leftward direction). Differentially expressed genes were determined using the Wilcoxon rank-sum test with a Bonferroni-adjusted p-value cutoff of 0.001 (dark red) and 0.05 (red). g, Gene Set Enrichment Analysis plot for the effector CD4+ gene signature. h, Heatmap indicating normalized gene expression values for the 32 differentially expressed genes with a Bonferroni-adjusted p-value cutoff of 0.001.
Extended Data Fig. 7 |. CITE-Seq protein expression and correlation for patient 1 at year 9.3.
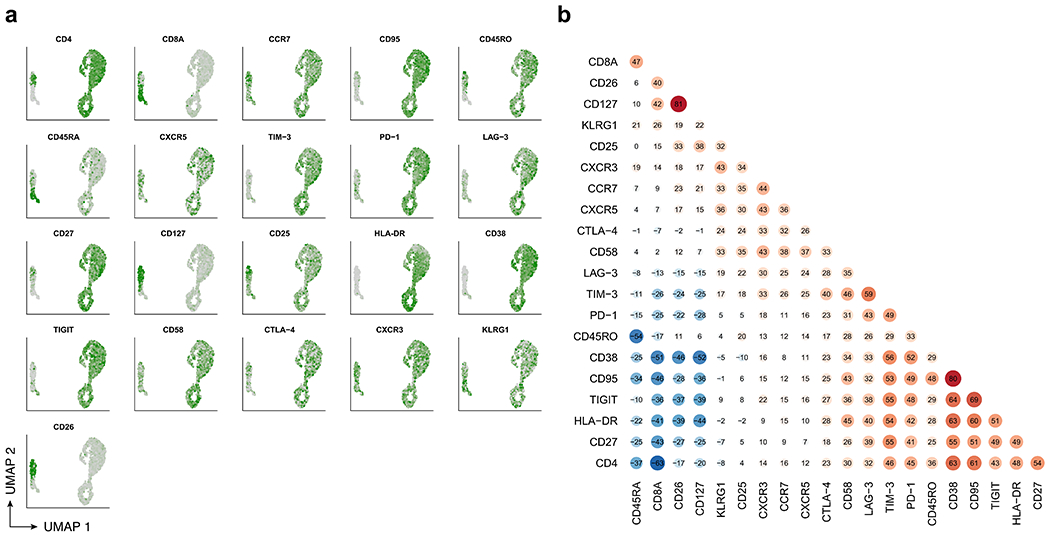
a, UMAP colored by normalized expression of CITE-Seq protein expression determined by antibody-derived tags. b, Pairwise Spearman correlations between CITE-Seq protein expression values across cells.
Extended Data Fig. 8 |. Flow cytometry analysis of functional experiment on CAR T-cells from patient 1 year 9.3.
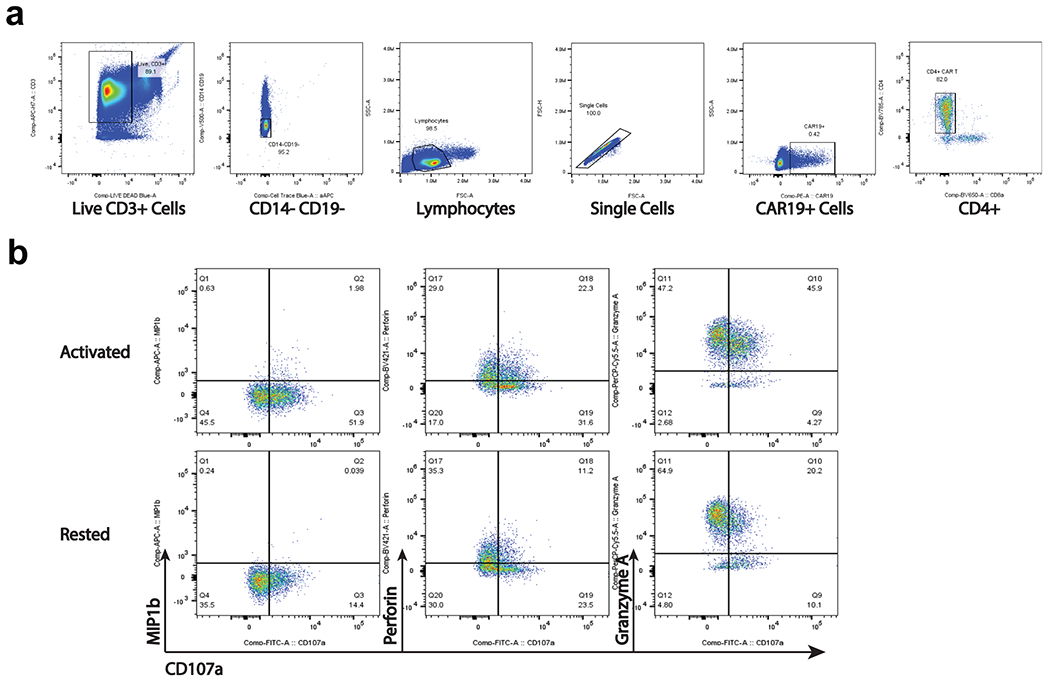
a. Representative gating strategy to identify CD4+CAR T-cells from the functional assay. b. Identification of populations expressing functional markers CD107a, MIP-1β, Perforin, and Granzyme A. Gates were defined based on FMO controls.
Extended Data Fig. 9 |. Transcriptional regulation of CAR T-cells in patient 1 at year 9.
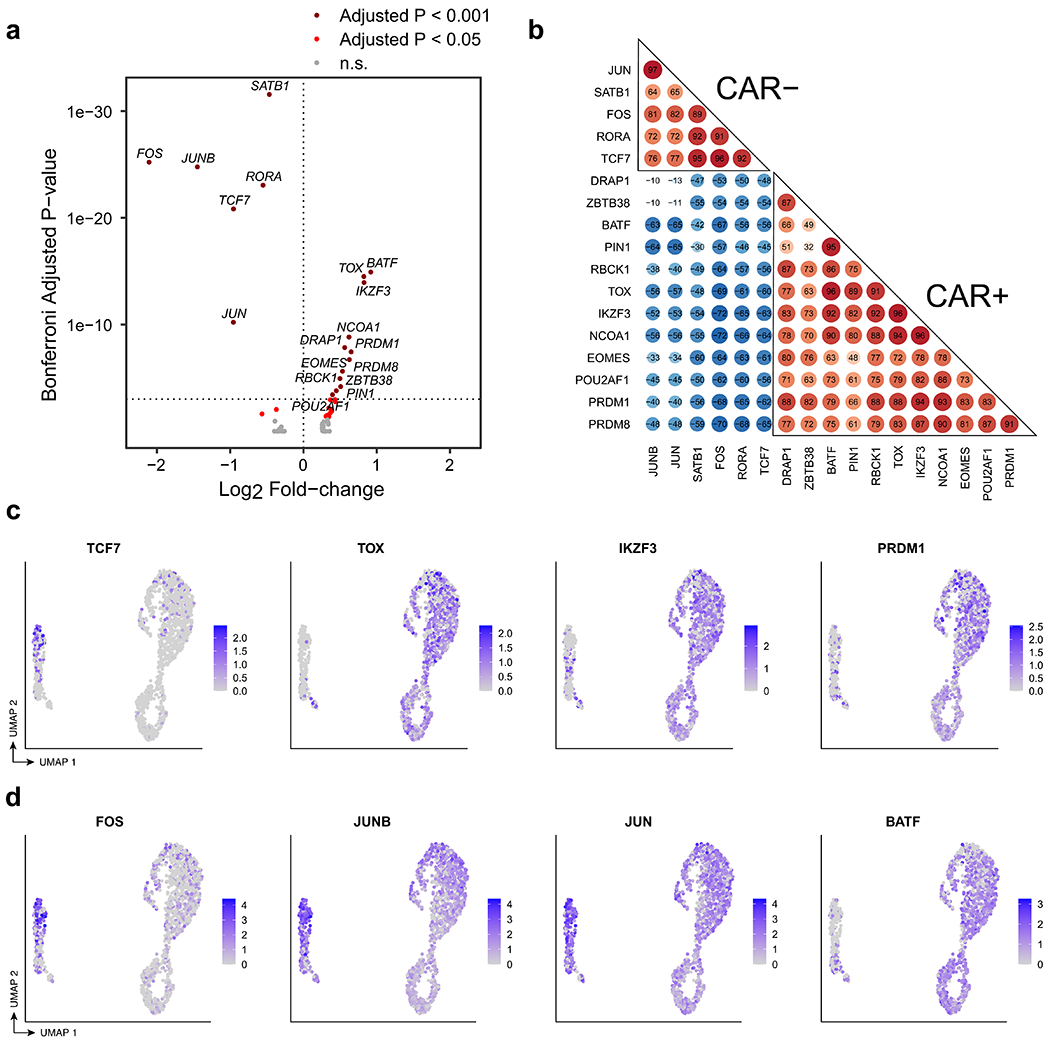
a, Volcano plot indicating transcription factors (TFs) up-regulated in CAR T-cells compared to normal CD4+ T cells (rightward direction) and TFs down-regulated in CAR T-cells compared to normal CD4+ T cells (leftward direction). Differentially expressed TFs were determined using the Wilcoxon rank-sum test with a Bonferroni-adjusted p-value cutoff of 0.001 (dark red) and 0.05 (red). b, Pairwise correlation of TF regulon scores determined by GENIE3 and AUCell in the comparison between CAR T-cells and CD4+ CAR− T cells. c, UMAP indicating RNA expression of selected differentially expressed TFs TCF7, TOX, IKZF3, and PRDM1. d, UMAP indicating RNA expression of differentially expressed AP-1 TFs, FOS, JUNB,JUN, and BATF.
Extended Data Fig. 10 |. CITE-Seq with 5’ TCR profiling reveals the presence of CD4+ CAR T-cells with characteristic expression of GZMA and GZMK in patients 1 and 2.
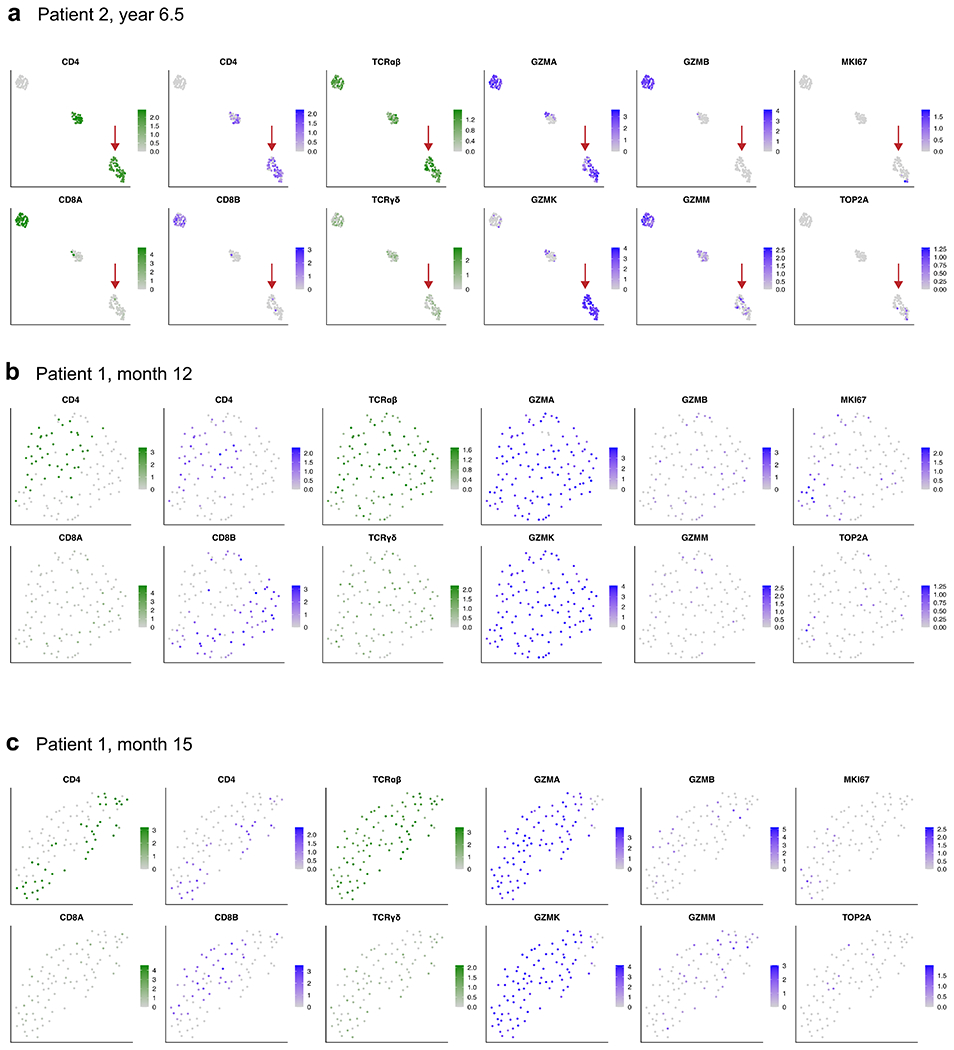
a, UMAP embeddings showing expression of key marker genes for patient 2 at year 6.5 post-infusion, as well as (b) patient 1 at month 12 and (c) patient 1 at month 15. Sample processing and data analysis was the same as in Extended Data Fig. 4. Shown are high-quality cells that were verified as CAR T-cells with at least one read aligned to the 5’ CAR construct. UMAP plots showing normalized RNA expression are colored in shades of blue; plots showing protein expression via CITE-Seq antibody-derived tags are colored in shades of green. Red arrows in panel a indicate a CD4+ CAR T-cell population with high expression of GZMA and GZMK, similar to the the long-persisting CAR T-cell population in patient 1 at year 9.3 described in Figs. 3–4 and Extended Data Figs. 6, 7, and 9. The CAR T-cells from patient 1 at months 12 and 15 characteristically expressed GZMA and GZMK at high levels, with the observation of cells expressing CD4 at a protein and RNA level, and cells that expressed CD8B at the RNA level.
Extended Data Table 1 |.
Immunoglobulin heavy chain rearrangement deep sequencing shows persistent deep molecular remission for both patients
| Patient number | Sample Information | IgH Repertoire Assessment | Tumor Clone | |||||
|---|---|---|---|---|---|---|---|---|
| Sample type | Infusion1 | Cell Equivalent2 | Productive Total3 | Productive Uniques4 | CLL clonotype sequence | Counts (reads) | Frequency5 | |
| 01 | PB | Baseline | 158,730 | 408,579 | 48 | CARDCSSSNCYEKG | 407,592 | 99.76% |
| Mo 6 | 79,365 | 285,305 | 7,362 | ND | 0 | 0.00% | ||
| Yr 1 | N/A | 41 | 12 | ND | 0 | 0.00% | ||
| Yr 3 | 298,667 | 91 | 6 | ND | 0 | 0.00% | ||
| Yr 3.5 | 350,171 | 123 | 8 | ND | 0 | 0.00% | ||
| Yr 4 | 277,943 | 157 | 10 | ND | 0 | 0.00% | ||
| Yr 4.5 | 238,933 | 107 | 12 | ND | 0 | 0.00% | ||
| Yr 5 | 270,629 | 94 | 8 | ND | 0 | 0.00% | ||
| Yr 5.5 | 291,810 | 75 | 12 | ND | 0 | 0.00% | ||
| Yr 8 | 395,249 | 339 | 12 | ND | 0 | 0.00% | ||
| BM | Mo 1 | 408,838 | 29 | 3 | ND | 0 | 0.00% | |
| Mo 6 | 158,730 | 202,535 | 4,451 | ND | 0 | 0.00% | ||
| Yr 1 | NA | 18,506 | 231 | ND | 0 | 0.00% | ||
| Yr 2 | 279,924 | 88 | 2 | ND | 0 | 0.00% | ||
| 02 | Baseline | 61,270 | 1,385,340 | 4,544 | CTTQTRTTIVFLDYYYYYMDVWGKG | 1,231,018 | 88.86% | |
| Mo 6 | N/A | 25,041 | 38 | ND | 0 | 0.00% | ||
| Mo 32 | 317,714 | 88 | 8 | ND | 0 | 0.00% | ||
| Yr 3 | 346,057 | 160 | 8 | ND | 0 | 0.00% | ||
| Yr 4 | 308,419 | 212 | 10 | ND | 0 | 0.00% | ||
| Yr 4.5 | 257,067 | 52 | 8 | ND | 0 | 0.00% | ||
| Yr 4.7 | 258,895 | - | - | ND | 0 | N/A | ||
| Yr 5 | 233,143 | 74 | 6 | ND | 0 | 0.00% | ||
| Yr 6 | 246,705 | - | - | ND | 0 | N/A | ||
| BM | Yr 1 | N/A | 5 | 2 | ND | 0 | 0.00% | |
| Yr 2 | 222,019 | 601 | 25 | ND | 0 | 0.00% | ||
Day/month/year relative to infusion date;
Cell equivalent sequenced, assuming that each diploid human cell contains 6.3 pg genomic DNA;
IgH rearrangements potentially encoding a functional IgH protein;
Number of unique productively rearranged IgH alleles;
The frequency of the leukemic clone as a proportion of all productively rearranged IgH alleleles;
N/A, Not available; ND, not detectable
Supplementary Material
Acknowledgements
We acknowledge the contributions of the following research cores at the University of Pennsylvania and Children’s Hospital of Philadelphia: the Translational and Correlative Studies Laboratory for providing standardized flow cytometric, quantitative PCR and cytokine multiplexing analyses, and biobanking of patient specimens on CAR T cell trials; the Clinical Cell and Vaccine Production Facility for cell processing and biobanking; the Human Immunology Core for providing healthy donor cells and analytical support; the Flow Cytometry Core for flow cytometry equipment maintenance and access to electronic sorters; the Stem Cell and Xenograft Core for providing de-identified patient specimens; and the High-Performance Computing Facility. This work was supported by Novartis Institute for Biomedical Research (to J.J.M. and C.H.J.), NIH grant R01-CA-241762-01 (to J.J.M. and F.D.B.); NIH grant CA233285 (to K.T.); CIHR Doctoral Foreign Study Award no. 433117 (to G.M.C.); and NIH Medical Scientist Training Program T32 GM07170 (to S.B.).
Footnotes
Online content
Any methods, additional references, Nature Research reporting summaries, source data, extended data, supplementary information, acknowledgements, peer review information; details of author contributions and competing interests; and statements of data and code availability are available at https://doi.org/10.1038/s41586-021-04390-6.
Code Availability
Analysis code are available on request.
Competing interests J.J.M., D.L.P., J.A.F., S.F.L. and C.H.J. hold patents related to CAR T cell manufacturing and biomarker discovery. I.P.-M. and J.B. are employees of Novartis. The remaining authors declare no competing interests.
Supplementary information The online version contains supplementary material available at https://doi.org/10.1038/s41586-021-04390-6.
Data availability
Raw sequencing data for this study are in preparation for submission to dbGaP (accession number pending).
References
- 1.Kalos M et al. T cells with chimeric antigen receptors have potent antitumor effects and can establish memory in patients with advanced leukemia. Sci. Transl. Med 3, 95ra73 (2011). [DOI] [PMC free article] [PubMed] [Google Scholar]
- 2.Fraietta JA et al. Determinants of response and resistance to CD19 chimeric antigen receptor (CAR) T cell therapy of chronic lymphocytic leukemia. Nat. Med 24, 563–571 (2018). [DOI] [PMC free article] [PubMed] [Google Scholar]
- 3.Porter DL et al. Chimeric antigen receptor T cells persist and induce sustained remissions in relapsed refractory chronic lymphocytic leukemia. Sci. Transl. Med 7, 303ra139 (2015). [DOI] [PMC free article] [PubMed] [Google Scholar]
- 4.Frey NV et al. Long-term outcomes from a randomized dose optimization study of chimeric antigen receptor modified T cells in relapsed chronic lymphocytic leukemia. J. Clin. Oncol Jco1903237 (2020). [DOI] [PMC free article] [PubMed] [Google Scholar]
- 5.Brentjens RJ et al. Safety and persistence of adoptively transferred autologous CD19-targeted T cells in patients with relapsed or chemotherapy refractory B-cell leukemias. Blood 118, 4817–4828 (2011). [DOI] [PMC free article] [PubMed] [Google Scholar]
- 6.Geyer MB et al. Safety and tolerability of conditioning chemotherapy followed by CD19-targeted CAR T cells for relapsed/refractory CLL. JCI Insight 4 (2019). [DOI] [PMC free article] [PubMed] [Google Scholar]
- 7.Turtle CJ et al. Durable molecular remissions in chronic lymphocytic leukemia treated with CD19-specific chimeric antigen receptor-modified T cells after failure of ibrutinib. J. Clin. Oncol 35, 3010–3020 (2017). [DOI] [PMC free article] [PubMed] [Google Scholar]
- 8.Maude S et al. Chimeric antigen receptor T cells for sustained remissions in leukemia. N. Engl. J. Med 371, 1507–1517 (2014). [DOI] [PMC free article] [PubMed] [Google Scholar]
- 9.Turtle CJ et al. CD19 CAR-T cells of defined CD4+:CD8+ composition in adult B cell ALL patients. J. Clin. Invest 126, 2123–2138 (2016). [DOI] [PMC free article] [PubMed] [Google Scholar]
- 10.Fry TJ et al. CD22-targeted CAR T cells induce remission in B-ALL that is naive or resistant to CD19-targeted CAR immunotherapy. Nat. Med 24, 20 (2018). [DOI] [PMC free article] [PubMed] [Google Scholar]
- 11.Nobles CL et al. CD19-targeting CAR T cell immunotherapy outcomes correlate with genomic modification by vector integration. J. Clin. Invest 130, 673–685 (2019). [DOI] [PMC free article] [PubMed] [Google Scholar]
- 12.Fraietta JA et al. Disruption of TET2 promotes the therapeutic efficacy of CD19-targeted T cells. Nature 558, 307–312 (2018). [DOI] [PMC free article] [PubMed] [Google Scholar]
- 13.Tirosh I et al. Dissecting the multicellular ecosystem of metastatic melanoma by single-cell RNA-seq. Science 352, 189–196 (2016). [DOI] [PMC free article] [PubMed] [Google Scholar]
- 14.Fuertes Marraco SA, Neubert NJ, Verdeil G & Speiser DE Inhibitory receptors beyond T cell exhaustion. Front. Immunol 6, 310 (2015). [DOI] [PMC free article] [PubMed] [Google Scholar]
- 15.ElTanbouly MA & Noelle RJ Rethinking peripheral T cell tolerance: checkpoints across a T cell’s journey. Nat. Rev. Immunol 21, 257–267 (2021). [DOI] [PubMed] [Google Scholar]
- 16.Irrthum A, Wehenkel L & Geurts P Inferring regulatory networks from expression data using tree-based methods. PLoS ONE 5, e12776 (2010). [DOI] [PMC free article] [PubMed] [Google Scholar]
- 17.Oh DY et al. Intratumoral CD4+ T cells mediate anti-tumor cytotoxicity in human bladder cancer. Cell 181, 1612–1625.e1613 (2020). [DOI] [PMC free article] [PubMed] [Google Scholar]
- 18.Porter DL, Levine BL, Kalos M, Bagg A & June CH Chimeric antigen receptor-modified T cells in chronic lymphoid leukemia. N. Engl. J. Med 365, 725–733 (2011). [DOI] [PMC free article] [PubMed] [Google Scholar]
- 19.Birsoy K et al. An essential role of the mitochondrial electron transport chain in cell proliferation is to enable aspartate synthesis. Cell 162, 540–551 (2015). [DOI] [PMC free article] [PubMed] [Google Scholar]
- 20.Scholler J et al. Decade-long safety and function of retroviral-modified chimeric antigen receptor T cells. Sci. Transl. Med 4, 132ra153 (2012). [DOI] [PMC free article] [PubMed] [Google Scholar]
- 21.Berry CC et al. Estimating abundances of retroviral insertion sites from DNA fragment length data. Bioinformatics 28, 755–762 (2012). [DOI] [PMC free article] [PubMed] [Google Scholar]
- 22.Cavalcante RG & Sartor MA annotatr: genomic regions in context. Bioinformatics 33, 2381–2383 (2017). [DOI] [PMC free article] [PubMed] [Google Scholar]
- 23.Kotecha N, Krutzik PO & Irish JM Web-based analysis and publication of flow cytometry experiments. Curr. Protoc. Cytometry 53, 10.17. 11–10.17. 24 (2010). [DOI] [PMC free article] [PubMed] [Google Scholar]
- 24.Bandyopadhyay S, Fisher DAC, Malkova O & Oh ST Analysis of signaling networks at the single-cell level using mass cytometry. Methods Mol. Biol 1636, 371–392 (2017). [DOI] [PubMed] [Google Scholar]
- 25.Butler A, Hoffman P, Smibert P, Papalexi E & Satija R Integrating single-cell transcriptomic data across different conditions, technologies, and species. Nat. Biotechnol 36, 411–420 (2018). [DOI] [PMC free article] [PubMed] [Google Scholar]
- 26.Raudvere U et al. g: Profiler: a web server for functional enrichment analysis and conversions of gene lists (2019 update). Nucleic Acids Res. 47, W191–W198 (2019). [DOI] [PMC free article] [PubMed] [Google Scholar]
- 27.Aibar S et al. SCENIC: single-cell regulatory network inference and clustering. Nat. Methods 14, 1083–1086 (2017). [DOI] [PMC free article] [PubMed] [Google Scholar]
Associated Data
This section collects any data citations, data availability statements, or supplementary materials included in this article.
Supplementary Materials
Data Availability Statement
Raw sequencing data for this study are in preparation for submission to dbGaP (accession number pending).


