Abstract
Objective
Diabetes is a chronic fatal disease that has affected millions of people all over the globe. Type 2 Diabetes Mellitus (T2DM) accounts for 90% of the affected population among all types of diabetes. Millions of T2DM patients remain undiagnosed due to lack of awareness and under resourced healthcare system. So, there is a dire need for a diagnostic and prognostic tool that shall help the healthcare providers, clinicians and practitioners with early prediction and hence can recommend the lifestyle changes required to stop the progression of diabetes. The main objective of this research is to develop a framework based on machine learning techniques using only lifestyle indicators for prediction of T2DM disease. Moreover, prediction model can be used without visiting clinical labs and hospital readmissions.
Method
A proposed framework is presented and implemented based on machine learning paradigms using lifestyle indicators for better prediction of T2DM disease. The current research has involved different experts like Diabetologists, Endocrinologists, Dieticians, Nutritionists, etc. for selecting the contributing 1552 instances and 11 attributes lifestyle biological features to promote health and manage complications towards T2DM disease. The dataset has been collected through survey and google forms from different geographical regions.
Results
Seven machine learning classifiers were employed namely K-Nearest Neighbour (KNN), Linear Regression (LR), Support Vector Machine (SVM), Naive Bayes (NB), Decision Tree (DT), Random Forest (RF) and Gradient Boosting (GB). Gradient Boosting classifier outperformed best with an accuracy rate of 97.24% for training and 96.90% for testing separately followed by RF, DT, NB, SVM, LR, and KNN as 95.36%, 92.52%, 90.72%, 90.20%, 90.20% and 77.06% respectively. However, in terms of precision, RF achieved high performance (0.980%) and KNN performed the lowest (0.793%). As far as recall is being concerned, GB achieved the highest rate of 0.975% and KNN showed the worst rate of 0.774%. Also, GB is top performed in terms of f1-score. According to the ROCs, GB and NB had a better area under the curve compared to the others.
Conclusion
The research developed a realistic health management system for T2DM disease based on machine learning techniques using only lifestyle data for prediction of T2DM. To extend the current study, these models shall be used for different, large and real-time datasets which share the commonality of data with T2DM disease to establish the efficacy of the proposed system.
Keywords: Diabetes prediction, Type 2 diabetes mellitus, machine learning algorithms, ensemble learning model, jupyter notebook
Introduction
Diabetes can be considered as one of the main healthcare challenges that are affecting the globe at a rapid and alarming rate [1]. “Diabetes mellitus is deadliest and is caused by a set of metabolic disorders that occurs when the body cannot produce any or enough insulin or cannot effectively use the insulin it produces” [2]. Diabetes is a kind of metabolic disease that is formed by the disorderliness of insulin in the body of an individual [3]. Because of diabetes, a patient is being strapped into the pathological destruction of pancreatic beta cells [4]. Some of the common symptoms that are commonly found in diabetes are excessive thirst, blurred vision, bedwetting, lack of energy, frequent urination, sudden weight loss, etc. [5]. There are different types of diabetes but the main categories are type 1 diabetes, type 2 diabetes and gestational diabetes [6]. The patients living with type 1 (insulin-dependent) diabetes are mostly children but can also be found in any age group mostly up to the age group 0-30 years [7]. Type 2 diabetes (insulin resistant) is a kind of diabetes where the body does not produce or use insulin properly [6]. It can be effectively managed through an active and healthy lifestyle with medication. Gestational diabetes is commonly found in pregnant women, it increases the blood sugar level and can affect the baby’s health even [8]. Diabetes mellitus disease has affected almost every sphere of the globe especially China , India, etc. and is among the leading health issues that adversely affect socio-economic boundaries with severe complications [9].
Motivation towards the study
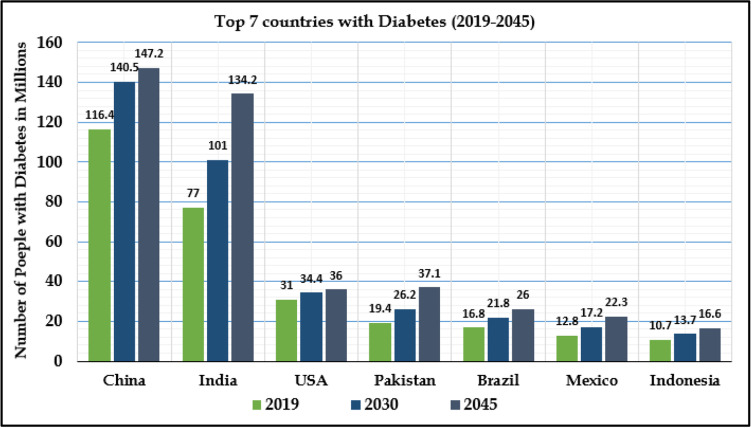
The main motivation of this research study is to identify and classify the severity of type 2 diabetes mellitus disease using lifestyle parameters only based on demographic regions. The lifestyle data has been considered so that this research can predict T2DM only on the basis of lifestyle indicators of the candidate diabetic. Moreover, prediction model can be used without visiting clinical labs. Some of the major statistical reports from various health organizations about diabetes mellitus signify the risk of developing life-threatening, severe and serious complications [10]. According to a report generated by the International Diabetes Federation (IDF) Atlas 2019, 463 million adults having an age range between 20-79 years (9.3% of the world’s population) are currently living with diabetes over the globe. There are also projections that it will affect 578 million by 2030 and 700 million by 2045. Fig. 1 depicts the top seven countries or regions with several million people living with diabetes [10].
Fig. 1.
Top 7 countries living with diabetes mellitus
Organization of paper
The main intent of this research work is to develop an advanced ensemble learning model using various machine learning algorithms for the better prediction of type 2 diabetes mellitus. The research work in this manuscript is divided into the following sections: Section I discusses diabetes and statistical reports that give an insight into its effects on human health and economy. In section II, existing related work has been analysed for achievements and shortcomings of previous work, so that the quality of the current study can be improved. In Section III, we have discussed the methodology adopted in this study i.e. the data collection, data description, data pre-processing and data modeling. In section IV, we have discussed the experimental results achieved through implementing the model of this study and provide a brief comparison of machine learning models through various statistical measures. Finally, section V presents conclusion of our research work and try to identify the shortcoming of the current study and provide future directions for a better prognosis and diagnosis of T2DM.
Related work
The machine learning tools and techniques are being explored in different fields in healthcare like medical treatment, disease diagnosis and detection, image processing, computational biology [11–15]. In recent years, copious work has been proposed and published for prediction of type 2 diabetes mellitus using various machine learning techniques [16, 17]. Mohebbi et.al (2017) [18] a novel framework using deep learning for type 2 diabetes mellitus was developed based on simulated Continuous Glucose Monitoring (CGM) signals of 9 patients. By using CGM, different machine learning classifiers like LR, MLP and CNN were compared, best accuracy rate of 77.5% through Convolutional Neural Networks was achieved. The study can be extended by using a large amount of real CGM signals in order to validate the existing deep learning models. Barhate and Kulkarni (2018) [19] proposed an analytical framework for different classification algorithms by using the PIMA diabetes dataset to promote early diagnosis of type II diabetes. An experimental study was performed using Scikit-learn library in Python. Random Forest (RF) obtained the highest accuracy 79.7% among all the classifiers used to build a machine learning model. During pre-processing, missing values were fixed using Multiple Imputation by Chained Equation (MICE) method. Feature engineering was performed in order to find the contribution of parameters towards disease. Ensemble learning models can be used for better results in terms of various statistical measures. Kowsher et.al (2019) [20] developed a predictive model for medication and treatment of type-II diabetes by using 9483 diabetes patient records along with 14 selected parameters. By comparing the eight machine learning algorithms, experimental results determine the Artificial Neural Network (ANN) model achieved a higher accuracy rate of 95.14%. The whole experiment task has been implemented using python 3.6 programming language. The intelligent interface can be designed and developed for early treatment to lessen the complications of patients. Islam et.al (2019) [21] proposed a robust framework using three machine learning classifiers viz Bagging, Logistic Regression and Random Forest. The authors have collected (340 instances and 26 features) data from Khulna Diabetes Hospital of diabetic patients based on symptoms categorized by two Typical and Non-Typical. The experimental work has been performed in WEKA 3.8 (Waikato Environment for Knowledge Analysis). Among all the classification techniques, Random Forest performs better with an accuracy rate of 90.29%. The results achieved through RF are best compared with the algorithms used in the previous systems. The current study can be extended with advanced ensemble learning algorithms to predict the disease more effectively and efficiently. Kopitar et.al (2020) [22] proposed an intelligent system for T2DM by comparing various ML prediction models like (i.e. Glmnet, RF, XGBoost, LightGBM) over standard regression techniques for early prediction of impaired fasting glucose (IFG) and fasting plasma glucose level (FPGL) values. Initially, the dataset comprised of 111 variables and 27050 instances, after filtration mechanism and pre-processing stage the dataset was reduced to 59 variables and 3723 records for developing the system. The simple regression model performed with the lowest average RMSE of 0.838, followed by RF (0.842), LightGBM (0.846), Glmnet (0.859) and XGBoost (0.881). When more data were added, Glmnet improved with the highest rate (+ 3.4%).In this research stacking and blending of different prediction models could be taken into consideration for future analysis. However, such systems bring along even more challenges in terms of interpreting the results that should support decisions of the healthcare experts. Tiggaa and Garg (2020) [23] developed the framework for T2DM using lifestyle data. The dataset used for the study comprised of 952 instances and 18 questions/parameters related to health. The research have also conducted the experiment with PIMA diabetes dataset. The performance evaluation achieved through both the datasets have been compared for better prediction of diabetes. R studio an Integrated Development Environment has been used for implementation of models and R programming language was used for coding purpose. Out of all the classifiers, Random Forest algorithms perform well for both datasets with an accuracy rate of 94.10%.
Proposed system
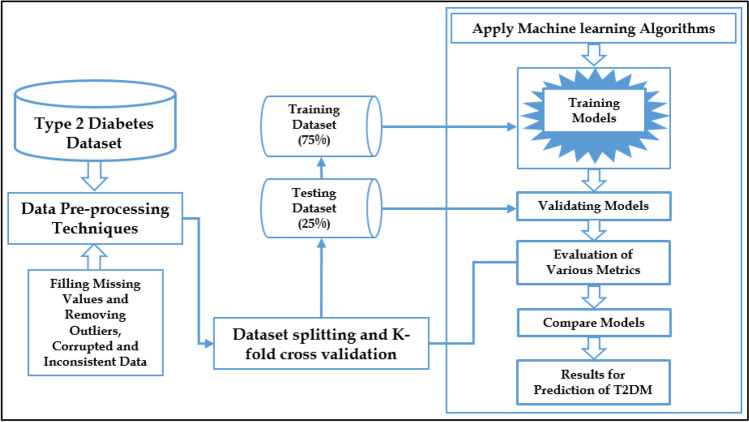
The proposed framework is depicted in Fig. 2. It presents overall working mechanism of our research process from the data acquisition up to the desired experimental results. The framework used is based on machine learning tools and techniques for better prediction of T2DM.
Fig. 2.
The overall proposed framework for the prediction of T2DM.
Initially type 2 diabetes mellitus dataset is being imported from the database into the jupyter notebook by executing the required library packages through python programming language. Pre-processing techniques have been applied to DataFrame, where missing values were replaced with some statistical measures viz mean, mode and median for different features like Urination, Fatigue, family history, weight, etc. The outliers, corrupted and inconsistent values have been removed to improve the quality assessment of dataset towards better results. The dataset is being splitted into training and testing datasets, where 75% of dataset is used for training various machine learning models and 25% of dataset for testing these machine learning models. Also, some prominent machine learning models have been developed and their results have been evaluated using various matrices. In order to validate the results of all the classifiers, 10-fold cross-validation has been applied. The proposed system is divided into various components which are discussed below:
Data collection
The dataset consists of information on 1552 patients (772 non-diabetic instances and 780 diabetic instances) has been collected from population of Kishtwar and Rajouri geographical regions of Jammu and Kashmir. As shown in Table 1, there are 11 biological features along with their Description, Class and Data Type. The features are categorical and numeric in nature. The data used in this study is personal health data as well as results from medical reports of the population under study. The main motive of dataset used in this study is to predict whether a patient is diabetic or non-diabetic through lifestyle indicators using machine learning techniques. Based on the selected features provided in the dataset the work can be extended to predict the probable patients and their inclination towards the disease. The dataset used is also a good combination of the patients like people from different areas, male-female ratio, patients from various classes (urban and rural areas) and adults from different age groups. The dataset was collected through survey forms and questioners then prepared into comma-separated values (CSV) file format before building and deploying the models for prediction of T2DM.
Table 1.
Biological feature description used for the study.
| S.No | Feature Name | Description of features | Class | Type |
|---|---|---|---|---|
| 1 | Age | Age of the individual | 10-90 yrs. | int64 |
| 2 | Sex | Gender of the individual (M/F) | 0 or 1 | int64 |
| 3 | Family History | Any individual in a family is diabetic or not | 0 or 1 | int64 |
| 4 | Smoking | Whether the individual is a smoker or not | 0 or 1 | int64 |
| 5 | Drinking | Whether the individual is liquor or non-liquor | 0 or 1 | int64 |
| 6 | Thirst | How many times individual drinks water in a day | Times | int64 |
| 7 | Urination | How many times an individual urinates in a day | Times | int64 |
| 5 | Height | Height of the individual | 60-190 cm | int64 |
| 9 | Weight | Weight of the individual | 20-96 kg | int64 |
| 10 | Fatigue | If the individual feels fatigue or not | 0 or 1 | int64 |
| 11 | Diabetic | If an individual is diabetic or not | 0 or 1 | int64 |
Machine learning toolkit
The experimental study has been carried out using Jupyter Notebook as an IDE (Integrated Development Environment) along with programming language python (3.9.1) for various statistical and machine learning performance evaluation measurements [24]. Prerequisites machine learning and third-party libraries have been imported for exploratory data analysis and model building process for prediction of T2DM disease. There is an intelligent and rich library of packages available in this open-source software, where Artificial Intelligence, Machine Learning, Deep Learning models can be developed for various healthcare problems like prediction of T2DM [25].
Data pre-processing
In this step, the collected data is loaded into the Jupyter notebook and various crucial libraries are being imported like NumPy, Matplotlib, Pandas, Seaborn, Scikit-learn, etc. for description and visualization of data [26]. Pre-processing plays a vital role to modify the raw data in order to achieve desired results and the classification capability of various machine learning techniques [27]. It was considered that collected survey forms have no missing values, outliers, corrupted and inconsistent data. But later we found that in place of these missing values there were zeroes at various instances like weight, Urination, Height which is not possible. These missing values have been filled by imputation method viz mean, mode and median to improve data quality assessment. Data cleaning operations have been performed to remove corrupted and inconsistent data from the dataset. Data transformation has been performed to improve the efficiency of data before building the machine learning models. For scaling the features of dataset, StandardScaler () using Scikit-learn package has been employed to reshape the attributes within range -1 and 1. The mathematical expression used to perform the data scaling and data standardization are given as:
| 1 |
| 2 |
Where, ‘z’ is the standardization of normal distribution
‘N’ is the total sample size
‘x’ is the lifestyle indicator/parameter
is the mean of lifestyle indicator/parameter
σ(x) is the sample variance lifestyle indicator/parameter
x min represents minimum sample value
x max represents maximum sample value
Class balance
Class balance is used to remove the biasness, if any, in the dataset. In this study K-fold cross-validation (K=10) for has been used in order to validate the desired results. The dataset is divided into 10 bins, wherein each bin is singularly used for testing while the remaining 09 bins are used for training iteratively to validate the results. The main advantage of K-fold cross-validation method is to reduce the bias in the dataset associated in the random sampling of instances for training and testing datasets. Although, the dataset used is a good mixture of both classes, 772 non-diabetic instances and 780 diabetic instances as shown in Fig. 3.
Fig. 3.
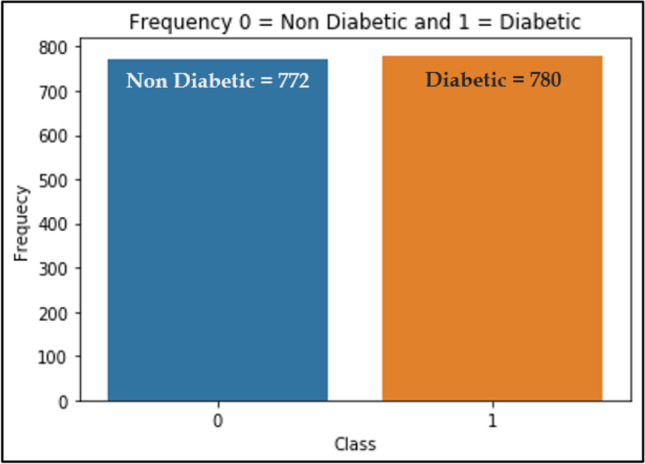
Instances of Class attribute
Machine learning methods
Machine learning paradigm plays a vital role in almost all spheres of world especially in healthcare [28]. The era of machine learning has made a lot of progress in healthcare system and is being used for better prediction, diagnosis, prognosis and detection of various diseases at early stages in order to save human lives. Machine Learning techniques are built on the basic principles and concepts of statistical analysis that are being used to solve data mysteries. Following are the algorithms used for analysis of type-2 diabetes prediction.
K-Nearest Neighbour
KNN is an algorithm of supervised machine learning techniques. It is used to calculate the distance between the data points based on their similarity measurements. KNN computes the distance between various data samples by using different mathematical calculated methods like Euclidean Distance, Manhattan Distance and Minkowski Distance. Its numerical ability has the potential of grouping the similitude between the new instance/information and accessible cases, and places all the based on the similarity measurements of classes It can handle both classification as well as regression problems to find the nearest neighbour of samples by using the value of K [27].
Logistic Regression
It is a supervised ML model used for predictive analytics that produces the dichotomous output in terms of binary format which is used to probabilistically predict the outcome of the categorical dependent variable by using a sigmoid function [29]. It can be classified into different types like Linear, logistic, poly regression. “Suppose there are ‘N’ input independent variables with their values represented by X1, X2, X3, ………………………….Xn. Let us assume that Y is the probability of Yes (1) and 1-Y is the probability of No (0). Then the final logistic regression equation is given as” [30]:
| 3 |
-
3.5.1.
Naive Bayes: is a simple but surprisingly powerful algorithm for predictive analytics commonly used in machine learning. Naive Bayes is a classification technique based on the Bayesian theorem with an assumption of independence among predictors [31]. It is easy to build and particularly useful for large datasets. The classification function used for NB classifier is given as:
| 4 |
“Given a hypothesis H and evidence E, Bayes theorem states that the relationship between the probability of the hypothesis before getting the evidence P(H) and the probability of the hypothesis after getting the evidence P(H|E) is” [32]:
| 5 |
In simple English, we write the equation as:
P(H|E) = Posterior Likelihood
P(E|H) = Probability
P(H) = Session Prior Likelihood
P(E) = Forecaster Prior Likelihood
Support vector machine
It is discriminative ML classifier that is designed by a separative hyper-plane [33]. Support Vector Machine algorithm can be used for both classification and regression analysis for different real-world problems. The basic function of this supervised classifier is to segregate or classify the given data points in the best possible and appropriate way in a multidimensional space. To work in high and complex dimensions, the SVM classifier uses different versions of the kernels like linear, polynomial, and radial basis function kernels. The equations for various kernels are [34]:
Linear Kernel Equation
| 6 |
Polynomial Kernel Equation
| 7 |
Where b = degree of kernel & a = constant term
Radial Basis Function Kernel Equation
| 8 |
Where || X1, X2 || = Euclidean distance between (X1 & X2)
Decision Tree
DT is a classification technique with the graphical representation of all possible solutions to a decision based on certain conditions [29]. The working principle behind the DT algorithm is decision-making for a specific classification problem. The computation procedure of the algorithm is very expensive as far as training and testing data is being concerned. In this acyclic connected graph at each node, one feature is selected to make separating decisions that lead to the prediction. The process of splitting the nodes continues unless and until the leaf node has optimally fewer data points. In the DT classifier, discriminative and entropies powers are identified with the formula:
| 9 |
| 10 |
Random forest
It is well known supervised ML classifier that is used for regression and classification problems. RF algorithm is made by using many DT models where it compiles all the results of the decision trees that lead to the final outcome [35]. The RF classifier handles the problem of overfitting that may make the results worse by creating the n number of decision trees depending upon the size and complexity of the dataset.
Gradient boosting
Ensemble approach is the process of combining multiple models or classifiers to solve the computational intelligence problem. The method improves the learning capabilities of algorithms and helps to solve real-world problems. It uses the aggregation results of various classifiers {c1, c2, c3, c4, c5,………., ck} to improve the forecasting capability of model C*. It is a process of converting weak learners into strong learners [28]. In this study, GB algorithm was used sequentially to develop an ensemble model.
Model building
An intelligent model is one where the difference between the predicted results and actual results is small or even negligible [28]. This phase is very important. In this phase machine learning classifiers have been implemented for prediction of type 2 diabetes mellitus. The algorithms used for experimental study include K-Nearest Neighbour (KNN), Linear Regression (LR), Support Vector Classifier (SVM), Naive Bayes (NB), Decision Tree (DT), Random Forest (RF) and Gradient Boosting (GB). The working mechanism of the algorithms are defined below:
Algorithm 1: Workflow of proposed framework for prediction of T2DM disease.
| Input: Results of survey form and google form | |
| Output: T2DM lifestyle disease prediction models | |
| BEGIN | |
| STEP 1: Prepare the dataset from survey form and Google form | |
| STEP 2: Preprocess the dataset: | |
| STEP 2.1: Data integration | |
| STEP 2.2: Data transformation | |
| STEP 2.3: Data cleaning | |
| STEP 3: Xtrain , Ytrain--75% of dataset | |
| STEP 4: Xtest , Ytest--25% of dataset | |
| STEP 5: Machine learning algorithms that are used in the models | |
| mn=[ KNN( ), LR( ), SVM( ), NB( ), DT( ), RF( ), GB( )] | |
| for(i=0; i<7; i++) do | |
| Model= mn[i]; | |
| Model.fit(); | |
| model.predict(); | |
| print(Accuracy(i), confusion_matrix, classification_report, roc_curve); | |
| End | |
| STEP 6: Deployment of framework | |
| STOP |
Results and discussions
Machine learning and deep learning [36], [37] whenever implemented, have provided better results for worldwide problems including healthcare analytics, social network analytics, business analytics so on and so forth. In this work, knowledge-based models using machine learning techniques have been developed for the better prediction of T2DM. The predictive models viz KNN, LR, SVM, NB, DT, RF and GB were developed. Different statistical and machine learning analytics procedures have been carried out in order to validate the models.
Dataset description
The performance evaluation of these machine learning models has been compared and hyperparameter tuning of machine learning models has been done to produce better results for prediction of T2DM. DataFrame describe() method [38] is used for describing the parameters of the dataset. The computation of these statistical measures like count, mean, std, min, percentile, max and other numerical values regarding DataFrame are shown in Table 2.
Table 2.
Description of Dataset.
| Parameters | count | mean | std | min | 25% | 50% | 75% | max |
|---|---|---|---|---|---|---|---|---|
| Age | 1552 | 41.770 | 15.835 | 5.000 | 31.000 | 39.000 | 50.000 | 83.000 |
| Sex | 1552 | 0.469 | 0.499 | 0.000 | 0.000 | 0.000 | 1.000 | 1.000 |
| Family History | 1552 | 0.273 | 0.445 | 0.000 | 0.000 | 0.000 | 1.000 | 1.000 |
| Smoking | 1552 | 0.146 | 0.354 | 0.000 | 0.000 | 0.000 | 1.000 | 1.000 |
| Drinking | 1552 | 0.175 | 0.380 | 0.000 | 0.000 | 0.000 | 0.000 | 1.000 |
| Thirst | 1552 | 6.180 | 2.434 | 1.000 | 5.000 | 6.000 | 7.000 | 15.000 |
| Urination | 1552 | 6.339 | 3.461 | 2.000 | 3.000 | 5.000 | 10.000 | 15.000 |
| Height | 1552 | 160.064 | 14.404 | 61.000 | 154.000 | 162.000 | 167.000 | 185.000 |
| Weight | 1552 | 61.569 | 11.481 | 15.000 | 55.000 | 62.000 | 69.000 | 96.000 |
| Fatigue | 1552 | 0.693 | 0.461 | 0.000 | 0.000 | 1.000 | 1.000 | 1.000 |
| Class | 1552 | 0.502 | 0.500 | 0.000 | 0.000 | 1.000 | 1.000 | 1.000 |
Density Plot
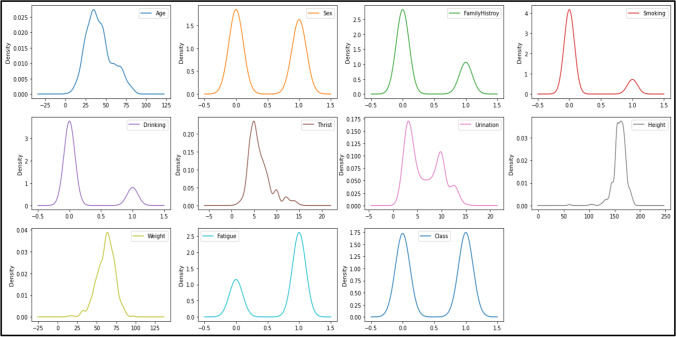
The density plots that have been used to detect the possible outliers in the dataset are shown in Fig. 4. In this work, Interquartile Range IQR-score and Z-score methods have been used for detecting, removing and correcting the outliers present in dataset. Kernel Density Estimation (KDE) method [39] is used to draw all the data points of parameters and then add them together and make a smooth density estimation curve for representation of parameters in the dataset. The x-axis denotes the value of parameters and the y-axis is probability density function for each attribute.
Fig. 4.
Density for each attribute in the dataset.
Correlation matrix
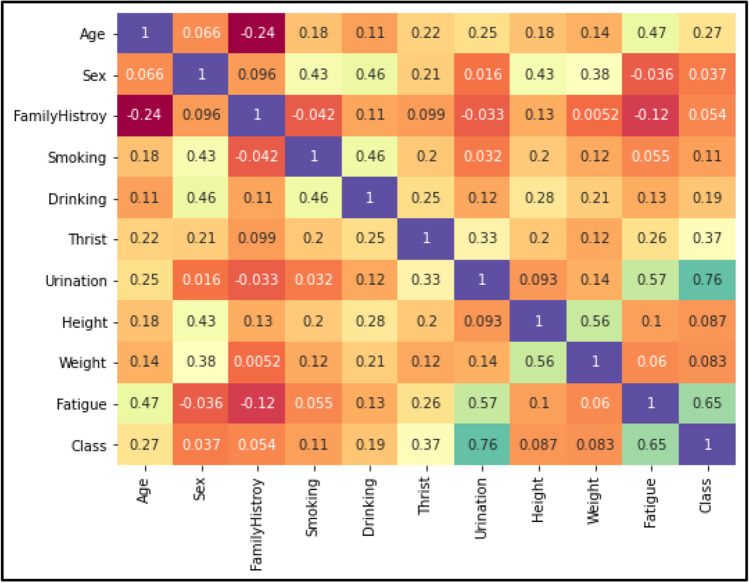
The graphical representation shown in Fig. 5 is the Correlation Matrix Plot that indicates the strong multivariate relationship (High and Low Correlation) between the parameters of dataset. The main idea behind the correlation coefficient analysis is to draw the relationship between the features. A feature set is considered good for developing machine learning models if it is strongly correlated between a dependent and independent set of attributes.
Fig. 5.
Correlation matrix plot for the various biological parameters.
Accuracy results
The results of the classifiers shown in Table 3 are average calculations after applying K-fold cross-validation where K = 10 for different measurements like accuracy, miss classification rate and run time. Gradient Boosting outperformed best with an accuracy rate of 97.24% for training and 96.90% for testing separately. The GB model provides the lowest miss classification rate of 0.030% and is proven to be the best model for prediction of type 2 diabetes mellitus. Other machine learning models like K Nearest Neighbor, Logistic Regression, Support Vector Machine, Naive Bayes, Decision Tree and Random Forest have 77.06%, 90.20%, 90.20%, 90.72%, 92.52% and 95.36% accuracy respectively. Also, the misclassification rate for GB is the lowest i.e., 0.030% as compared to other algorithms. Also, travel time (execution time) of each classifier is calculated. DT takes the minimum run time of 0.0056 sec and KNN takes maximum run time of 3.4950 sec during execution.
Table 3.
Hyper-parameter tuning of each classifier.
| Classifier | Optimum values of hyper-parameter tuning |
|---|---|
| KNN | n_neighbors = 50, weights = 'uniform', metric = 'manhattan'. |
| LR | random_state = 42, solver = 'liblinear', penalty = 'l2'. |
| SVM | C = 5, gamma = 10, kernel='linear’. |
| NB | priors = None, var_smoothing = 0.1032. |
| DT | class_weight = None, criterion='gini', max_depth = 4, max features = “auto”, min_samples_leaf=14, min_samples_split=2, splitter = “best”. |
| RF | n_estimators = 50, criterion = ‘entropy’, max_depth = 5, max_features = ‘auto’, ‘sqrt’, log2’, min_samples_leaf = 10. |
| GB | max_depth = 10, n_estimators = 1000, verbose = 3, subsample = 1.0, min_child_weight = 5, colsample_bytree = 0.10, learning_rate = 0.01. |
Hyper-parameter Tuning
It is a process to aggregate the right combination of all parameters that allows the model to maximize the performance evaluation in learning procedure. Automated hyper-parameter tuning has been utilized to get optimum results from the above ML algorithms. Grid Search CV technique is applied to get optimum values of hyper-parameter tuning as depicted in Table 4.
Table 4.
Comparison of Measures for ML techniques
| Algorithm | Training Accuracy |
Testing Accuracy |
Miss Classification Rate | Run Time (Seconds) |
|---|---|---|---|---|
| K-Nearest Neighbour | 81.86 % | 77.06 % | 0.229 % | 1.7730 |
| Logistic Regression | 90.88 % | 90.20 % | 0.097 % | 3.4950 |
| Support Vector Machine | 90.88 % | 90.20 % | 0.097 % | 0.1274 |
| Naive Bayes | 89.68 % | 90.72 % | 0.092 % | 0.1034 |
| Decision Tree | 94.23 % | 92.52 % | 0.074 % | 0.0056 |
| Random Forest | 95.35 % | 95.36 % | 0.046 % | 1.2365 |
| Gradient Boosting | 97.24 % | 96.90 % | 0.030 % | 2.1504 |
Hardware specification
HP Z60 Workstation has been used for the experimental process. The technical specification of hardware is processor Intel XEON with speed 2.4 GHz (12 CPU’s) along with GPU NVIDIA Quadro K2200. The system RAM and display RAM is of 4GB each. The storage capacity of system is 1TB and operating system installed is window 10 pro 64-bit.
Confusion matrices
The confusion matrices of these classifiers are shown below in Figs. 6, 7, 8, 9, 10, 11 and 12. To measure the performance of various machine learning algorithms, the confusion matrices have been used to predict the outcome of the models corresponding to the actual values. The confusion matrices display the percentage of the dataset instances correctly predicted by models while solving the classification problems. The process for prediction contains four different results called True Negative (TN), False Negative (FN), False Positive (FP) and True Positive (TP). Other significant measures or indicators like Precision, recall, F-1 score, etc. are also calculated by using the confusion matrices.
Fig. 6.
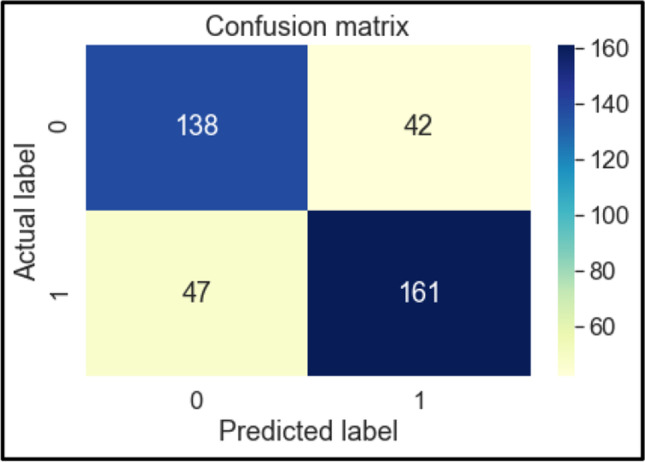
Confusion Matrix of KNN
Fig. 7.
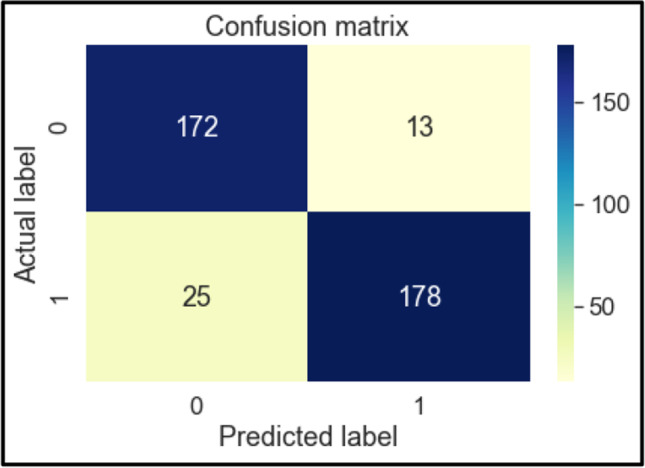
Confusion Matrix of LR
Fig. 8.
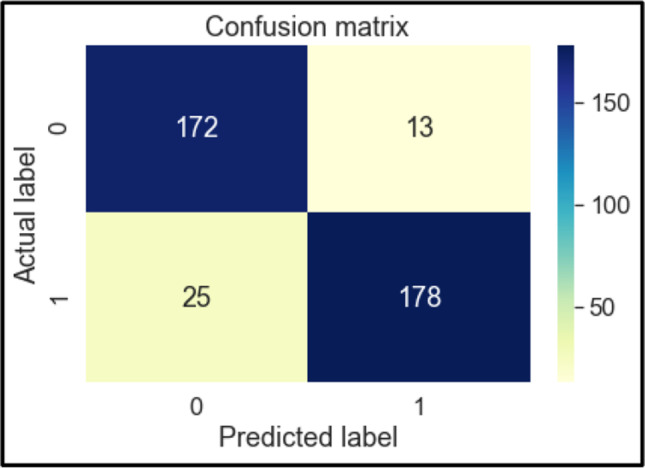
Confusion Matrix of SVM
Fig. 9.
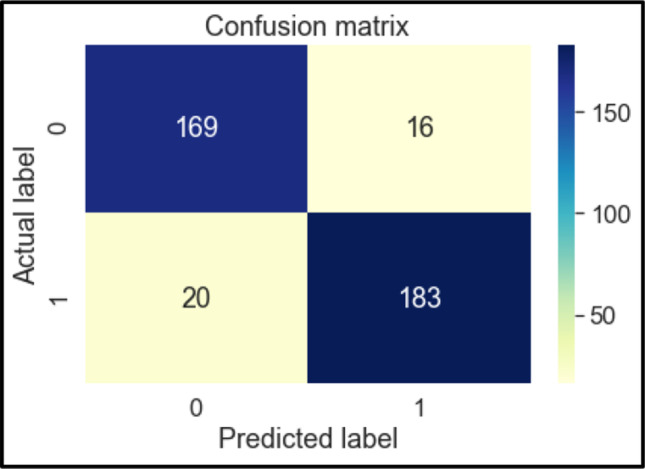
Confusion Matrix of NB
Fig. 10.
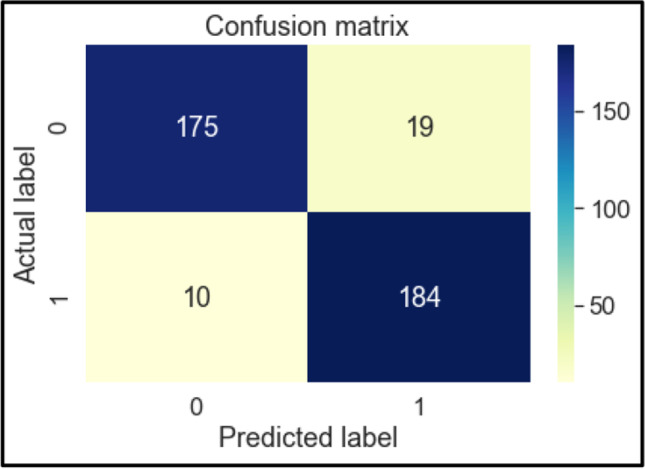
Confusion Matrix of DT
Fig. 11.
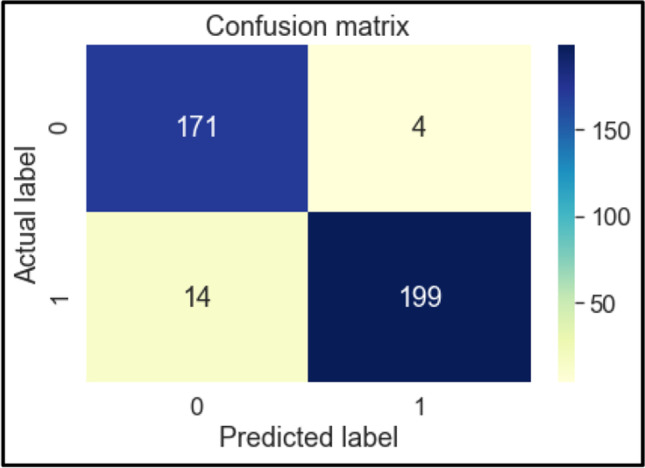
Confusion Matrix of RF
Fig. 12.
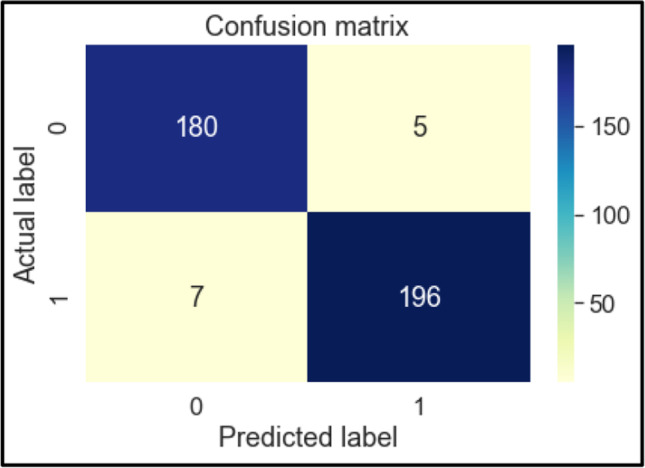
Confusion Matrix of GB
Other statistical measurements
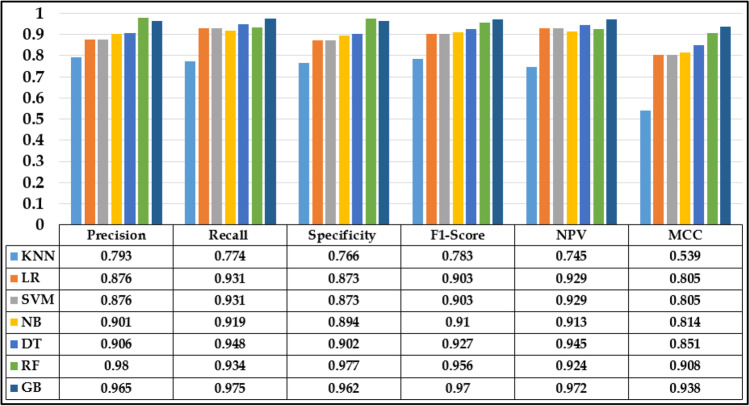
Additionally, some other measures are also used in this study to check the performance of these classifiers as shown in Fig. 13. These measures are Precision, Recall, Specificity, F1-score, Negative Predicted Value and Matthews Correlation Coefficient. The calculation formulas for these measures are by the equations [1–7].
Fig. 13.
Performance evaluation of various ML techniques.
(11)
(12)
(13)
(14)
(15)
(16)
(17)
Comparative analysis with existing work
The research work yielded good results in terms of various statistical matrices for prediction of T2DM using machine learning techniques. The existing systems have used only clinical/pathological datasets for the study, however, it has been found that using lifestyle parameters can yield much better results. The comparative analysis of other studies with different lifestyle datasets can be made in terms of the statistical matrices like accuracy, confusion matrix, AUC, ROC curve, etc. as these are common for both classes. The existing systems have also followed the same methodology based on a machine learning paradigm for prediction of the type 2 diabetes mellitus disease. Comparative analysis of related works towards type 2 diabetes mellitus prediction using machine learning techniques is shown in Table 5.
Table 5.
The Comparison with existing systems
| Authors | Technique used | Dataset | Analysis |
|---|---|---|---|
| [8] | CART (Classification and Regression Trees) | Collected dataset through questionnaire | 75% for CART |
| [40] | SVM, RF and LR | Demographic web based questionnaire | 80.17% for SVM |
| [41] | LR, GBC, LDA, ABC, ETC, NB, Bagging, RF, DT,SVC, Perceptron and KNN | Collected dataset from hospital | 96 % for LR |
| [23] | LR, KNN, SVM, NB, DT, RF | Offline and online questionnaire | 94.10% for RF |
| [20] | LR, LDA, KNN, DT, NB, SVM, RFC and ANN | Noakhali Medical College Bangladesh | 94.07% for ANN |
| [42] | LR, SVM, KNN, RF, NB, GB | Murtala Mohammed Specialist Hospital, Kano | 88.76% for RF |
| Our Proposed Study | KNN, LR, SVM, NB, DT, RF and GB | Lifestyle dataset from geographical regions | 96.90% for GB |
Receiver operating characteristic curve
The ROC curve shown in Fig. 14 is the graphical representation that is used to diagnose the ability of True Positive Rate (TPR) vs False Positive Rate (FPR) of the different machine learning algorithms. The receiver Operating Curve is a probability curve and the Area Under Curve (AUC) is used to measure the degree of separability between the classes. The ROC curve shows the results for different classification models in distinguishing whether a patient is having diabetes or not. The classifiers like GB, NB, SVM and DT show better than other classifiers results in terms of ROC and AUC for prediction of T2DM disease. The x-axis represents the false positive rate and y-axis denotes true positive rate.
Fig. 14.
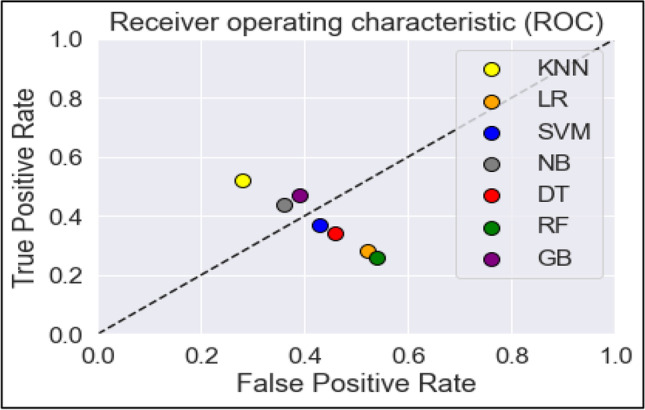
ROC of classification techniques for T2DM
Conclusion and future scope
As far as current medical diagnosis and prognosis is concerned, it has been found that there is a radical increase in the rate of people suffering from all types of diabetes. There is a lack of medical facilities to cope up with unnecessary testing, treatment and readmission in hospitals globally. So for the better prediction of T2DM, an intelligent expert system that exploits machine learning techniques for providing better results through statistical measures has been proposed. In the proposed model, outliers and corrupted/noisy data have been removed and the missing values are being filled by standardization at the pre-processing stage. Then data wrangling has been done along with data standardization and K-fold cross-validation. Different classifiers like K-Nearest Neighbour (KNN), Linear Regression (LR), Support Vector Classifier (SVM), Naive Bayes (NB), Decision Tree (DT), Random Forest (RF) and Gradient Boosting (GB) were employed for model building. The experimental study shows that the accuracy of Gradient Boosting is 97.24% for training results and 96.90% for testing results which is the highest among all other classifiers. The GB model outperformed other classifiers in terms of other statistical measures like precision, recall, specificity, f1-score, etc. To extend the current study, these algorithms shall be used for different, large and real-time datasets to establish the efficacy of the proposed system. A complete package in the form of product can be developed for real-time predictions which uses knowledge generated by the system proposed at runtime. In consultation with the specialists of the domain biological contributing parameters can be incorporated if required for better results.
Declaration
Conflict of Interest Statement
On behalf of all authors, the corresponding author states that there is no conflict of interest.
Footnotes
Publisher’s note
Springer Nature remains neutral with regard to jurisdictional claims in published maps and institutional affiliations.
Contributor Information
Shahid Mohammad Ganie, Email: Shahidmohammad@bgsbu.ac.in.
Majid Bashir Malik, Email: majidbashirmalik@bgsbu.ac.in.
Tasleem Arif, Email: t.arif@bgsbu.ac.in.
References
- 1.Chan DM. Director-General, and WHO Global report on Diabetes World Health organization. 2018;88.
- 2.Sneha N, Gangil T. Analysis of diabetes mellitus for early prediction using optimal features selection. J Big Data. 2019;6:1. 10.1186/s40537-019-0175-6
- 3.Alsulami S, et al. Effect of dietary fat intake and genetic risk on glucose and insulin-related traits in Brazilian young adults. J Diabetes Metab Disord. 2021;1337–47. 10.1007/s40200-021-00863-7. [DOI] [PMC free article] [PubMed]
- 4.Mohammadi H, Eshtiaghi R, Gorgani S, Khoramizade M. Assessment of Insulin, GLUT2 and inflammatory cytokines genes expression in pancreatic β-Cells in zebrafish (Danio rario) with overfeeding diabetes induction w/o glucose. J. Diabetes Metab. Disord. 2021;20(2):1567–1572. doi: 10.1007/s40200-021-00903-2. [DOI] [PMC free article] [PubMed] [Google Scholar]
- 5.International Diabetes Federation. Eighth edition. 2017;2017.
- 6.Kaur P, Sharma M. Analysis of Data Mining and Soft Computing Techniques in Prospecting Diabetes Disorder in Human Beings: a Review. Int. J. Pharm. Sci. Res. 2018;9(7):2700–2719. doi: 10.13040/IJPSR.0975-8232.9(7).2700-19. [DOI] [Google Scholar]
- 7.R. Sengamuthu, R. Abirami, and D. Karthik, “Various Data Mining Techniques Analysis To Predict,” 2018.
- 8.A. Anand and D. Shakti, “Prediction of diabetes based on personal lifestyle indicators,” Proc. 2015 1st Int. Conf. Next Gener. Comput. Technol. NGCT 2015, no. September, pp. 673–676, 2016, doi: 10.1109/NGCT.2015.7375206.
- 9.Jha RP, Shri N, Patel P, Dhamnetiya D, Bhattacharyya K, Singh M. Correction to: Trends in the diabetes incidence and mortality in India from 1990 to 2019: a joinpoint and age-period-cohort analysis. J. Diabetes Metab. Disord. 2021;20(2):1741. doi: 10.1007/s40200-021-00865-5. [DOI] [PMC free article] [PubMed] [Google Scholar]
- 10.Diabetes Federation International and IDF, IDF Diabetes Atlas 2019, 9th Editio. 2019.
- 11.Naz H, Ahuja S. Deep learning approach for diabetes prediction using PIMA Indian dataset. J. Diabetes Metab. Disord. 2020;19(1):391–403. doi: 10.1007/s40200-020-00520-5. [DOI] [PMC free article] [PubMed] [Google Scholar]
- 12.Nissa N, Jamwal S, Mohammad S. Early Detection of Cardiovascular Disease using Machine learning Techniques an Experimental Study. Int. J. Recent Technol. Eng. 2020;9(3):635–641. doi: 10.35940/ijrte.c46570.99320. [DOI] [Google Scholar]
- 13.S. M. Ganie, M. B. Malik, and T. Arif, “Machine Learning Techniques for Diagnosis of Type 2 Diabetes Using Lifestyle Data,” in International Conference on Innovative Computing and Communications, 2022, pp. 487–497.
- 14.Ramesh D, Katheria YS. Ensemble method based predictive model for analyzing disease datasets: a predictive analysis approach. Health Technol. (Berl). 2019;9(4):533–545. doi: 10.1007/s12553-019-00299-3. [DOI] [Google Scholar]
- 15.Ganie SM, Malik MB, Arif T. Various Platforms and Machine Learning Techniques for Big Data Analytics. A Technological Survey. 2018;3(6):679–687. [Google Scholar]
- 16.Choubey DK, Paul S. Classification techniques for diagnosis of diabetes: A review. Int. J. Biomed. Eng. Technol. 2016;21(1):15–39. doi: 10.1504/IJBET.2016.076730. [DOI] [Google Scholar]
- 17.Georga EI, Protopappas VC, Bellos CV, Fotiadis DI. Wearable systems and mobile applications for diabetes disease management. Health Technol. (Berl). 2014;4(2):101–112. doi: 10.1007/s12553-014-0082-y. [DOI] [Google Scholar]
- 18.Mohebbi A, Aradottir TB, Johansen AR, Bengtsson H, Fraccaro M, Morup M. A deep learning approach to adherence detection for type 2 diabetics. Proc. Annu. Int. Conf. IEEE Eng. Med. Biol. Soc. 2017;EMBS:2896–2899. doi: 10.1109/EMBC.2017.8037462. [DOI] [PubMed] [Google Scholar]
- 19.R. Barhate and P. Kulkarni, “Analysis of Classifiers for Prediction of Type II Diabetes Mellitus,” Proc. - 2018 4th Int. Conf. Comput. Commun. Control Autom. ICCUBEA 2018, pp. 1–6, 2018, doi: 10.1109/ICCUBEA.2018.8697856.
- 20.M. Kowsher, M. Y. Turaba, T. Sajed, and M. M. Mahabubur Rahman, “Prognosis and treatment prediction of type-2 diabetes using deep neural network and machine learning classifiers,” 2019 22nd Int. Conf. Comput. Inf. Technol. ICCIT 2019, no. December, pp. 18–20, 2019, doi: 10.1109/ICCIT48885.2019.9038574.
- 21.Tanvir Islam M, Raihan M, Farzana F, Ghosh P, Ahmed Shaj S. An empirical study on diabetes mellitus prediction using apriori algorithm. Adv. Intell. Syst. Comput. 2021;1166:539–550. doi: 10.1007/978-981-15-5148-2_48. [DOI] [Google Scholar]
- 22.Kopitar L, Kocbek P, Cilar L, Sheikh A, Stiglic G. Early detection of type 2 diabetes mellitus using machine learning-based prediction models. Sci. Rep. 2020;10(1):1–13. doi: 10.1038/s41598-020-68771-z. [DOI] [PMC free article] [PubMed] [Google Scholar]
- 23.Tigga NP, Garg S. Prediction of Type 2 Diabetes using Machine Learning Classification Methods. Procedia Comput. Sci. 2020;167(2019):706–716. doi: 10.1016/j.procs.2020.03.336. [DOI] [Google Scholar]
- 24.S. Raschka, J. Patterson, and C. Nolet, “Machine learning in python: Main developments and technology trends in data science, machine learning, and artificial intelligence,” Inf., vol. 11, no. 4, 2020, doi: 10.3390/info11040193.
- 25.Ganie SM, Malik MB. Comparative analysis of various supervised machine learning algorithms for the early prediction of type-II diabetes mellitus. Int. J. Med. Eng. Inform. 2021;1(1):1. doi: 10.1504/ijmei.2021.10036078. [DOI] [Google Scholar]
- 26.Nguyen G, et al. Machine Learning and Deep Learning frameworks and libraries for large-scale data mining: a survey. Artif. Intell. Rev. 2019;52(1):77–124. doi: 10.1007/s10462-018-09679-z. [DOI] [Google Scholar]
- 27.Jazayeri A, Liang OS, Yang CC. Imputation of Missing Data in Electronic Health Records Based on Patients’ Similarities. J. Healthc. Informatics Res. 2020;4(3):295–307. doi: 10.1007/s41666-020-00073-5. [DOI] [PMC free article] [PubMed] [Google Scholar]
- 28.Doupe P, Faghmous J, Basu S. Machine Learning for Health Services Researchers. Value Heal. 2019;22(7):808–815. doi: 10.1016/j.jval.2019.02.012. [DOI] [PubMed] [Google Scholar]
- 29.Patil R, Tamane S. A comparative analysis on the evaluation of classification algorithms in the prediction of diabetes. Int. J. Electr. Comput. Eng. 2018;8(5):3966–3975. doi: 10.11591/ijece.v8i5.pp3966-3975. [DOI] [Google Scholar]
- 30.Celine S, Dominic MM, Devi MS. Logistic Regression for Employability Prediction. Int. J. Innov. Technol. Explor. Eng. 2020;9(3):2471–2478. doi: 10.35940/ijitee.c8170.019320. [DOI] [Google Scholar]
- 31.Kaviani P, Dhotre S. International Journal of Advance Engineering and Research Short Survey on Naive Bayes Algorithm. Int. J. Adv. Eng. Res. Dev. 2017;4(11):607–611. [Google Scholar]
- 32.C. Elkan, “Naive Bayesian Learning,” pp. 1–4, 2007.
- 33.Jegan C, Kumari VA, Chitra R. Classification Of Diabetes Disease Using Support Vector Machine. 2018;3(2):1797–801.
- 34.Abdillah AA, Suwarno Diagnosis of diabetes using support vector machines with radial basis function kernels. Int. J. Technol. 2016;7(5):849–858. doi: 10.14716/ijtech.v7i5.1370. [DOI] [Google Scholar]
- 35.Chari KK, Chinna Babu M, Kodati S. Classification of diabetes using random forest with feature selection algorithm. Int. J. Innov. Technol. Explor. Eng. 2019;9(1):1295–1300. doi: 10.35940/ijitee.L3595.119119. [DOI] [Google Scholar]
- 36.Dehkordi SK, Sajedi H. Prediction of disease based on prescription using data mining methods. Health Technol. (Berl). 2019;9(1):37–44. doi: 10.1007/s12553-018-0246-2. [DOI] [Google Scholar]
- 37.B. Intelligence, S. Engineering, C. Sciences, and I. Technology, “Early prediction of diabetes mellitus using various artificial intelligence techniques : a technological review Shahid Mohammad Ganie and Majid Bashir Malik * Tasleem Arif,” vol. X, no. xxxx, pp. 1–22.
- 38.Anaconda Inc., “Anaconda Distribution,” Anaconda, 2019.
- 39.M. J. H. Rawa, D. W. P. Thomas, and M. Sumner, “Simulation of non-linear loads for harmonic studies,” Proceeding Int. Conf. Electr. Power Qual. Util. EPQU, vol. 00037, pp. 102–107, 2011, doi: 10.1109/EPQU.2011.6128915.
- 40.Patil R, Shah K. Assessment of Risk of Type 2 Diabetes Mellitus with Stress as a Risk Factor using Classification Algorithms. Int. J. Recent Technol. Eng. 2019;8(4):11273–11277. doi: 10.35940/ijrte.d9509.118419. [DOI] [Google Scholar]
- 41.Mujumdar A, Vaidehi V. Diabetes Prediction using Machine Learning Algorithms. Procedia Comput. Sci. 2019;165:292–299. doi: 10.1016/j.procs.2020.01.047. [DOI] [Google Scholar]
- 42.Muhammad LJ, Algehyne EA, Usman SS. Predictive Supervised Machine Learning Models for Diabetes Mellitus. SN Comput. Sci. 2020;1(5):1–10. doi: 10.1007/s42979-020-00250-8. [DOI] [PMC free article] [PubMed] [Google Scholar]


