Abstract
Maintaining a healthy proteome is fundamental for the survival of all organisms1. Integral to this are Hsp90 and Hsp70, molecular chaperones that together facilitate the folding, remodelling and maturation of the many’client proteins’ of Hsp902. The glucocorticoid receptor (GR) is a model client protein that is strictly dependent on Hsp90 and Hsp70 for activity3–7. Chaperoning GR involves a cycle of inactivation by Hsp70; formation of an inactive GR–Hsp90–Hsp70–Hop ‘loading’ complex; conversion to an active GR–Hsp90–p23 ‘maturation’ complex; and subsequent GR release8. However, to our knowledge, a molecular understanding of this intricate chaperone cycle is lacking for any client protein. Here we report the cryo-electron microscopy structure of the GR-loading complex, in which Hsp70 loads GR onto Hsp90, uncovering the molecular basis of direct coordination by Hsp90 and Hsp70. The structure reveals two Hsp70 proteins, one of which delivers GR and the other scaffolds the Hop cochaperone. Hop interacts with all components of the complex, including GR, and poises Hsp90 for subsequent ATP hydrolysis. GR is partially unfolded and recognized through an extended binding pocket composed of Hsp90, Hsp70 and Hop, revealing the mechanism of GR loading and inactivation. Together with the GR-maturation complex structure9, we present a complete molecular mechanism of chaperone-dependent client remodelling, and establish general principles of client recognition, inhibition, transfer and activation.
The highly abundant and conserved Hsp90 and Hsp70 molecular chaperones are essential for proteome maintenance. Hsp70 recognizes virtually all unfolded or misfolded proteins, and generally functions early in protein folding10. By contrast, Hsp90 typically functions later, and targets a select set of’client’ proteins11. Despite the differences, Hsp90 and Hsp70 share clients that are highly enriched for signalling and regulatory proteins2, making both chaperones important pharmaceutical targets for cancer12 and neurodegenerative diseases13. Both chaperones are dynamic molecular machines with complex ATP-dependent conformational cycles that drive the binding and release of clients. Hsp70 uses its N-terminal nucleotide-binding domain (Hsp70NBD) to allosterically regulate its C-terminal substrate-binding domain (Hsp70SBD), which comprises a β-sandwich core (Hsp70SBD-β) and an α-helical lid (Hsp70SBD-α)14 (Extended Data Fig. 1a). In the weak client-binding ATP-bound ‘open’ state (Hsp70ATP), both the Hsp70SBD-α and the Hsp70SBD-β dock onto the Hsp70NBD. After ATP hydrolysis (Hsp70ADP), the Hsp70NBD and Hsp70SBD subdomains separate, resulting in a high-affinity client-binding state. Hsp90 constitutively dimerizes through its C-terminal domain (Hsp90CTD) (Extended Data Fig. 1a) and cycles through open and closed conformations acting as a molecular clamp15,16. In the nucleotide-free state (Hsp90Apo), Hsp90 populates a variety of open conformations, whereas ATP binding (Hsp90ATP) drives clamp closure through secondary dimerization of the N-terminal domains (Hsp90NTD). Clamp closure activates Hsp90 for ATP hydrolysis and is rate-limiting, requiring Hsp90NTD rotation, N-terminal helix rotation and closure of the lid of the ATP-binding pocket. Unlike Hsp70, Hsp90 can engage clients independently of nucleotide state through the middle domain (Hsp90MD) and the amphipathic helix-hairpins (Hsp90amphi-α on the Hsp90CTD16
The glucocorticoid receptor (GR) is a steroid-hormone-activated transcription factor that constitutively depends on Hsp90 to function4 5. Building on the work of others6 7 we previously reconstituted the Hsp90 dependence of GR using an in vitro system8, and established a four-step cycle (Fig. 1a) that starts with the active GR ligand-binding domain (hereafter, GR for simplicity). Next, Hsp70 inactivates GR ligand binding, and then the cochaperone Hop (Hsp90–Hsp70 organizing protein) helps to load Hsp70–GR onto Hsp90, forming the inactive ‘client-loading’ complex (GR–Hsp90–Hsp70–Hop). After Hsp90 ATP hydrolysis and closure, Hsp70 and Hop are released, followed by the incorporation of p23, forming the GR–Hsp90–p23 ‘client-maturation’ complex. In the maturation complex, GR is reactivated, indicating that GR is conformationally remodelled during the transition. A similar pattern of Hsp70 and Hsp90 functional antagonism has subsequently been shown for other clients17–19, supporting a general mechanism.
Fig. 1 |. GR-loading complex and the molecular basis of Hsp90–Hsp70 interactions.
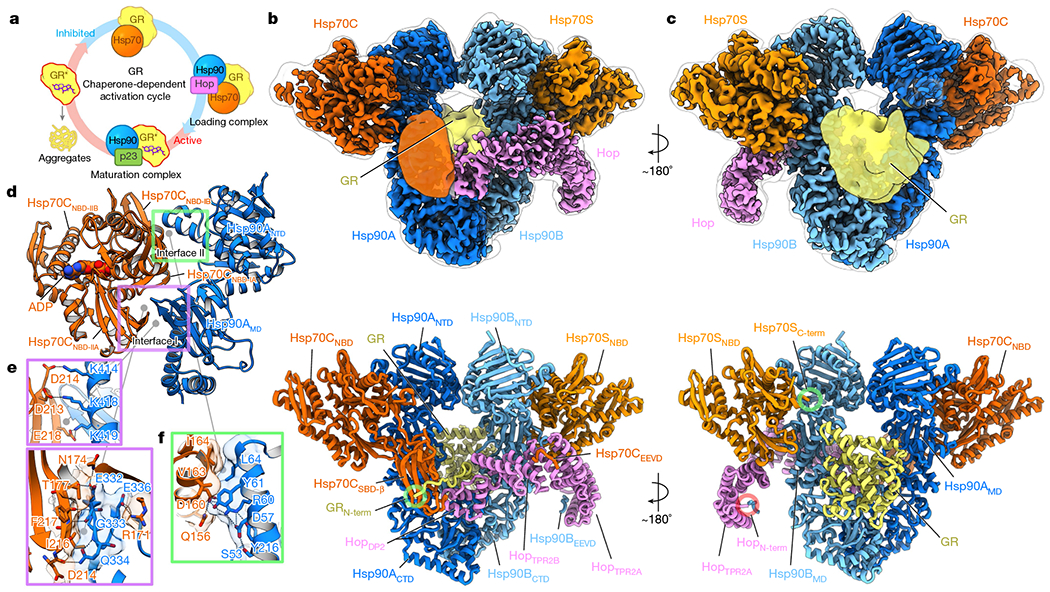
a, GR ligand binding is regulated by molecular chaperones in a constant cycle of inactivation and activation. The activated states of GR are indicated by asterisks. b, c, Front (b) and back (c) views of a composite cryo-EM map and the atomic model of the GR-loading complex. Densities of Hsp70CSBD and the globular C-terminal GR are taken from the 10 Å low-pass-filtered map of the high-resolution reconstruction of the full complex. Subunit colouring is maintained throughout. d–f, Hsp90–Hsp70 interactions (d) are mediated via two main interfaces (interface I, purple rectangle (e) and interface II, green rectangle (f)). Residues involved in these interactions are shown in sticks and transparent surfaces(e, f). Dominant polar interactions are depicted by dashed lines.
The molecular basis for almost all of this complex chaperone interplay remains unknown, with high-resolution structural studies hampered by the instability of client proteins and the highly dynamic nature of client-chaperone associations. Here we report a high-resolution cryo-electron microscopy (cryo-EM) structure of the client-loading complex, which provides molecular insights into how Hsp90 and Hsp70 coordinate their ATP cycles, how they are organized by Hop, and the molecular mechanisms that underlie the functional regulation of GR by Hsp90 and Hsp70.
Architecture of the GR-loading complex
The client-loading complex was prepared by reconstitution using excess ADP to enhance client binding by Hsp70 and an ATP-binding deficient Hsp90 (Hsp90(D93N)) to stall the cycle at this intermediate step, followed by glutaraldehyde stabilization (Extended Data Fig. 1b, c). A cryo-EM reconstruction at around 3.6 Å resolution was obtained from about 4 million particles (Extended Data Figs. 1d–f, 2, Methods). The resulting structure reveals an architecture markedly different to that expected, with the Hsp90 dimer (Hsp90A/B) surrounded by Hop, GR and two Hsp70s (Hsp70’C’ for client-loading and Hsp70’S’ for scaffolding) (Fig. 1b, c). Hsp90 adopts a ‘semi-closed’ conformation, in which the Hsp90NTDs have rotated into an Hsp90ATP-like orientation, but have not yet reached the fully closed ATP state (Extended Data Fig. 3b, c). The observed Hsp90NTD orientations are stabilized by the Hsp70NBDs that bind symmetrically to the Hsp90NTD–Hsp90MD interface of each Hsp90 protomer. Hop intimately interacts with each Hsp90 protomer, the two Hsp70s and, notably, a portion of GR. Although the two Hsp70SBDs are not visible in the high-resolution map, the Hsp70CSBD-β subdomain becomes visible in low-pass-filtered maps (Fig. 1b). Also seen in the filtered maps, GR is positioned on one side of the Hsp90 dimer (Fig. 1c). In addition, another map (around 7 Å) reveals a loading complex that has lost Hsp70C but that retains Hsp70S, Hop and GR (Extended Data Fig. 3d, e). The observation of the two-Hsp70 and one-Hsp70 loading complexes populated in our sample is consistent with a previous study20.
The ATP-regulated Hsp90–Hsp70 interplay
Two major interfaces (Fig. 1d) are formed in both of the nearly identical Hsp70NBD–Hsp90 protomer interactions (root mean square deviation (RMSD) of 0.96 Å) (Supplementary Fig. 1a–c). In interface I, the outer edge of the Hsp90MD β-sheet inserts into the cleft formed by the Hsp70NBD-IA and Hsp70NBD-IIA subdomains (Fig. 1d, Extended Data Fig. 4a). Of note, in Hsp70ATP this cleft binds the Hsp70 interdomain linker and also contributes to binding to the Hsp40 J-domain14 (Extended Data Fig. 4b). Hence, the cleft is only available for Hsp90 in Hsp70ADP. Interface I is tightly packed (approximately 479 Å2 of buried surface area; BSA), and is stabilized by numerous polar interactions (Fig. 1d, e). This explains why mutations at interface I on either Hsp90 (G333, K414, K418, K419)21–23 or Hsp70 (R171, N174, D213)24 led to defective Hsp90-Hsp70 interaction, growth defects and impaired client maturation of GR, v-Src and luciferase (Fig. 1d, e, Extended Data Fig. 4c–h; see Supplementary Table 3 for equivalent yeast residue numbering).
The two ATPase domains of Hsp90 and Hsp70 directly interact with each other at interface II (Fig. 1d, f, approximately 280 Å2 BSA), using a combination of hydrophobic (Hsp90(Y61, L64)–Hsp70(V163, I164)) and polar contacts (Hsp90(R60, Y61)–Hsp70(D160)). Notably, interface II defines the Hsp90ATP-like position and orientation of the Hsp90NTD with respect to the Hsp90MD, explaining the observation that Hsp70 accelerates Hsp90 ATPase activity25. Consistent with the significance of interface II, mutation of the three Hsp90 interface residues (Hsp90 R60, Y61 and L64) resulted in marked yeast growth defects at 37 °C (ref. 26). Similar to the interface I mutations G333S and K418E in Hsp90 (G309S and K394E in yeast Hsc82), an Hsp90 mutation at R60 (yHsc82(R46G)) led to reduced Hsp70 interaction, inviability at 37 °C and reduced v-Src activity (Extended Data Fig. 4e–h). Finally, sequence alignments of Hsp90 and Hsp70 homologues and paralogues showed that interface I and II residues are generally conserved, suggesting a universal Hsp90–Hsp70 binding strategy across species23,24,27 and organelles28,29 (Supplementary Fig. 2a, b).
As expected from Hsp90(D93N), both Hsp90NTD ATP-binding pockets are empty with their lids open. The Hsp90ANTD and Hsp90BNTD closely resemble the structure of an apo-Hsp90NTD fragment (RMSD of 0.43 and 0.35 Å to Protein Data Bank (PDB) ID 3T0H, respectively) (Extended Data Fig. 5a). The ATP pocket lid and the first α-helix form a dimerization interface (approximately 512 Å2 BSA) (Extended Data Fig. 3a). The two Hsp70NBDs clearly have ADP bound and are similar to the ADP-bound Hsp70NBD crystal structure (Cα-RMSD of 0.50 Å (Hsp70C) and 0.53 Å (Hsp70S) to PDB ID 3AY9) (Fig. 1d, Supplementary Fig. 3a, b).
Coordination between the Hsp90 and Hsp70 ATPase cycles is required for forming the loading complex. The Hsp90ATP conformation is incompatible as closure of the Hsp90ATP ATP pocket lid and the central helix of Hsp90NTD would clash with the Hsp70NBD (Extended Data Fig. 5b, c). Thus, Hsp90 ATP binding and lid closure would be expected to accelerate loss of the bound Hsp70s. Furthermore, the Hsp70ATP conformation is incompatible with the loading complex, as the entire Hsp70SBD would clash with Hsp90NTD–Hsp90MD (Extended Data Fig. 5d, e). For Hsp70 to re-enter its ATP cycle, it must first leave Hsp90, thus nucleotide exchange on Hsp70 is likely to time its dissociation. Of note, in the loading complex, Hsp70NBD-IIAs deviate from the crystal structure (Supplementary Fig. 3a, b) and Hsp90MD interacts with Hsp70 (R171, N174, T177) in the ATP catalytic motif (Fig. 1e, Supplementary Fig. 3c), suggesting how Hsp90 enhances the nucleotide exchange on Hsp70 during the GR-chaperoning cycle30. The canonical nucleotide exchange factor (NEF)-binding sites10,14 on Hsp70NBD-IIB remain available, explaining how the NEF Bag-1 can accelerate GR maturation30 (Supplementary Fig. 4a, b) and also how the NEF Hsp110 can be involved in GR maturation31 (Supplementary Fig. 4c, d).
Hop binds to all complex components
The cochaperone Hop is well-conserved in eukaryotes and facilitates GR maturation in vivo32 and in vitro8. Hop is thought to bring Hsp90 and Hsp70 together using its three tetratricopeptide repeat (TPR) domains that bind the EEVD C termini on both Hsp90 and Hsp7033 (Extended Data Fig. 1a). Despite using the full-length Hop construct, only the three C-terminal domains (HopTPR2A, HopTPR2B and HopDP2) are observed (Fig. 1b, c). Notably, these three domains are necessary and sufficient for full GR activation33. Hop wraps around much of the loading complex, with extensive interactions made by HopTPR2A and HopDP2, demonstrating a far more integral role than was anticipated (Fig. 2a, c).
Fig. 2 |. Hop interacts closely with all components in the loading complex.
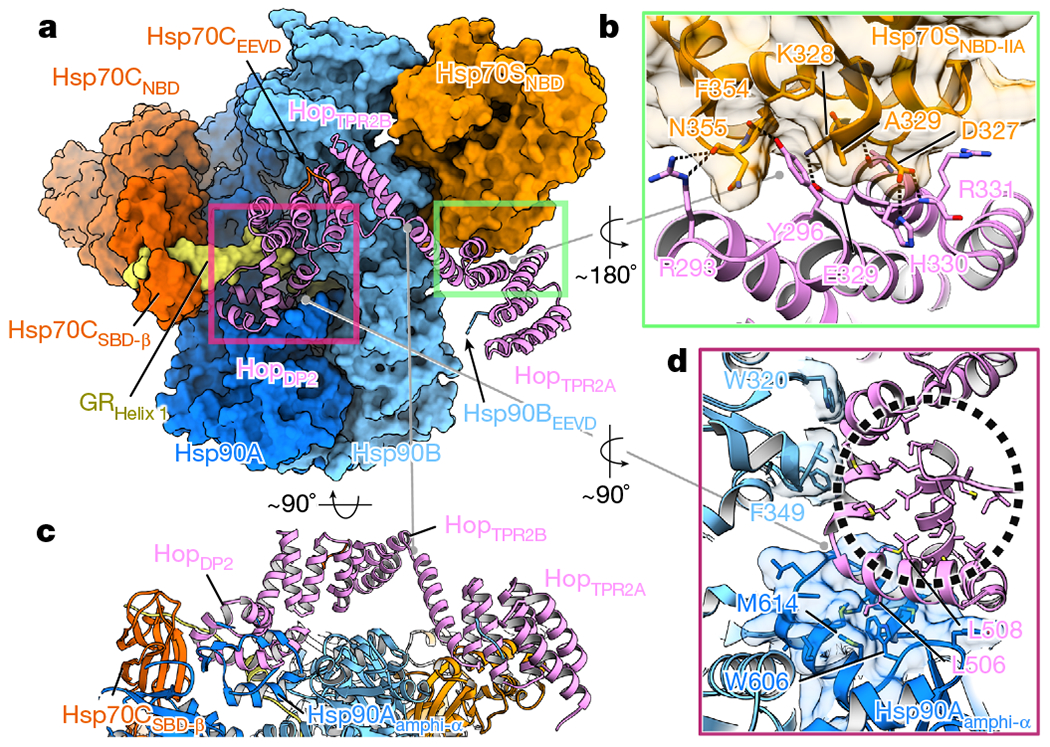
a, Hop (pink ribbon) uses HopTPR2A to interact with Hsp70S (green rectangle). HopDP2 interacts with both Hsp90 protomers, Hsp70CSBD and a portion of GR (pink rectangle). The Hop TPRs also bind EEVD fragments from both Hsp90 and Hsp70. b, In the Hop–Hsp70 interface (green rectangle, a), the Hop residue Y296 inserts into a cavity on Hsp70SNBD-IIA (transparent surface). Dashed lines depict polar interactions. c, HopTPR2B is suspended above Hsp90, supported by Hsp70–HopTPR2A and Hsp90–HopDP2. d, HopDP2 uses surface-exposed hydrophobic residues to interact with Hsp90Aamphi-α (shown with transparent surface and with hydrophobic residues in sticks) and Hsp90B(W320, F349). HopDP2 is loosely packed with many hydrophobic residues exposed in the ‘palm’ (black circle) of the ‘hand’. Note that the binding of GR to HopDP2 is omitted.
The structure of HopTPR2A-TRP2B closely matches the yeast crystal structure33 (Cα-RMSD of 1.47 Å to PDB ID 3UQ3, Supplementary Fig. 5a, c, d), including the conserved electrostatic network (Hop(Y354, R389, E385, K388)) that defines the unique interdomain angle (Supplementary Fig. 5h–j). Focused maps revealed that HopTPR2A and HopTPR2B are bound to the EEVD termini of Hsp90 and Hsp70, respectively (Extended Data Fig. 6d–f, Supplementary Fig. 6b–f, k, l). Although the density for the remaining Hsp70 and Hsp90 tails is missing, our structural modelling suggested the connectivity (Supplementary Fig. 7a, b). HopTPR2A and Hsp70SNBD-IIA form an extensive interface (approximately 578 Å2 BSA) composed largely of polar interactions (Fig. 2a, b, Extended Data Fig. 6a–d, g). Hsp70SNBD-IIA interacts with Hop and Hsp90 simultaneously, thereby rigidly positioning Hop with respect to Hsp90. Y296A–A328H mutations of Hop (Y332–T364 in yeast, Sti1) at the Hsp70SNBD-IIA–HopTPR2A interface (Extended Data Fig. 6a–c, g) resulted in yeast growth defects (Extended Data Fig. 6i) and did not promote v-Src maturation (Extended Data Fig. 6j). These data indicate that Hsp70S has a crucial scaffolding role in the loading complex. Although HopTPR2B was in close proximity (around 6 Å) to Hsp90MD, no major contacts were observed (Fig. 2c). However, the 15-Å-resolution Hsp90–Hop cryo-EM structure34 (Supplementary Fig. 7c) and previous studies33,35 show that HopTPR2B can make direct contacts with Hsp90MD. This suggests that Hop may first prepare Hsp90 for Hsp70 and client interaction, and subsequently rearrange after Hsp70SNBD binding (Supplementary Fig. 7d, e).
HopDP2 makes extensive interactions with both Hsp90 protomers at Hsp90ACTD and Hsp90BMD, thereby defining and maintaining the semi-closed Hsp90 conformation within the loading complex (Fig. 3a). This poises Hsp90 for the subsequent fully closed ATP conformation. Notably, conserved client-binding residues on Hsp90 are repurposed for HopDP2 binding (Fig. 2d, Extended Data Fig. 8a). Supporting our observations, Hsp90 mutations (yHsp82 W585T and M593T, corresponding to hHsp90α W606 and M614) that would destabilize the HopDP2–Hsp90A interface (Fig. 2d) cause yeast growth defects36. Our HopDP2 structure agrees well with the yeast nuclear magnetic resonance (NMR) structure33 (Cα-RMSD of 1.13 Å to PDB 1D 2LLW) (Supplementary Fig. 5b), adopting a hand-like α-helical structure, with many of its core hydrophobic sidechains exposed in the ‘palm’ of the ‘hand’ (Fig. 3d, Extended Data Fig. 8a). This hydrophobic palm is continuous with the client-binding surface provided by the lumen between the Hsp90 protomers, augmenting the Hsp90Aamphi-α with a stronger, more-extensive hydrophobic binding capability (Fig. 3a).
Fig. 3 |. GR is unfolded and threaded through the Hsp90 lumen, binding HopDP2 and Hsp70CSBD-β.
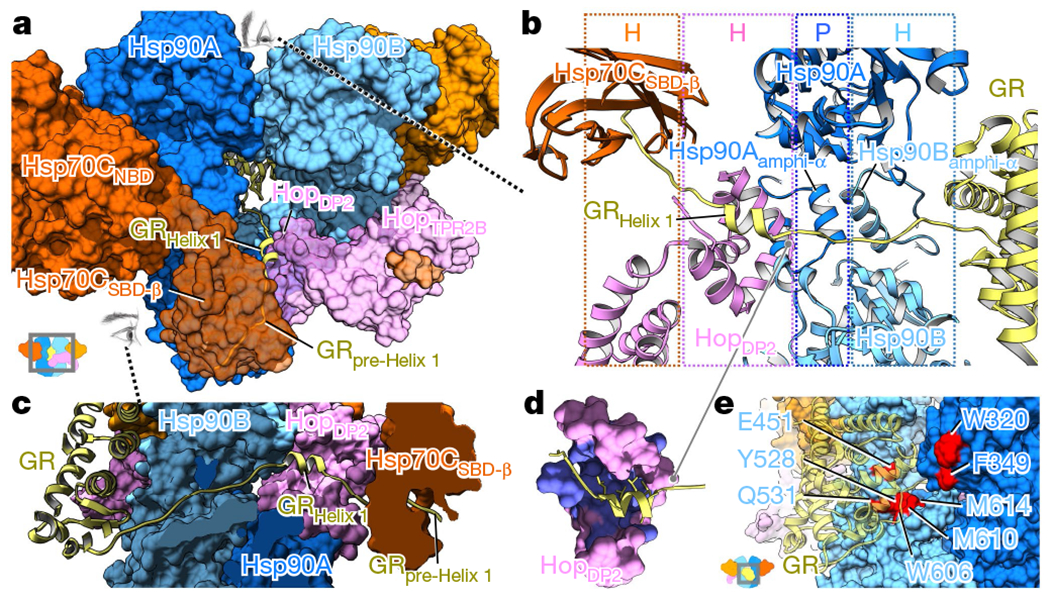
a, GR (ribbon model) is partially unfolded, with the N-terminal residues simultaneously gripped by Hsp70CSBD-β and HopDP2, and is threaded through the semi-closed lumen of Hsp90. The remaining GR is at the other side of the loading complex, which was modelled by docking this portion (556–777) from the GR crystal structure into the 10 Å low-pass-filtered GR density (Methods). b, Top-down view of GR recognition via an extended client-binding pocket collectively formed by Hsp70CSBD-β, HopDP2 and Hsp90A/Bamphi-αs. The N-terminal residues of GR (residues 520–551), which form a strand-helix-strand motif (yellow), are captured in the loading complex. The molecular property of each binding pocket is colour-coded and labelled on the top panel (H and P denote hydrophobic and polar interactions, respectively). c, Side view (see-through) of the GR N-terminal motif captured by the loading complex. d, The exposed hydrophobic pocket in HopDP2 (purple) binds the LXXLL motif of GRHelix1. e, Residues on Hsp90 (blue and cyan surface) previously reported to be important for GR (transparent yellow ribbon) activation are highlighted in red.
Unfolded GR is bound by Hsp90–Hop–Hsp70
In the high-resolution map, a strand of density can be seen passing through the Hsp90 lumen (Extended Data Fig. 7a–c). In the 10 Å low-pass-filtered map, this density connects to the globular part of GR on one side of Hsp90 (Fig. 1c, Extended Data Fig. 7e, f). On the other side, a GR helix is cradled in the HopDP2 hydrophobic palm and the rest of GR becomes a strand embedded in the Hsp70CSBD-β substrate-binding pocket (Fig. 3a–d, Extended Data Figs. 8b, 9d, Supplementary Figs. 8a, b, 9d–f). Thus, GR is partially unfolded and threaded through the Hsp90 lumen. This client-unfolding on Hsp90 is reminiscent of how the unfolded CDK4 kinase was captured by Hsp9037, although via the fully closed Hsp90ATP. To test this client–cochaperone interaction, we substituted the Hop residue Q512 in HopDP2 (which is close to, but not directly interacting with, the GR helix) with the photoreactive unnatural amino acid p-benzoyl-phenylalanine (Extended Data Fig. 8b–d). In support of our structure, GR and Hop become photo-cross-linked (Extended Data Fig. 8c, d). In addition, a residue in the HopDP2 hydrophobic palm (Hop L508; L553 in yeast, Sti1) that directly interacts with GR (Figs. 2d, 3d, Extended Data Fig. 8e) is functionally important. Mutations of this residue decrease yeast viability (Hop(L508D)) (Extended Data Fig. 8g), and completely abrogate the function of GR (Hop(L508A); ref. 33) and v-Src (Hop(L508D)) (Extended Data Fig. 8h) in vivo. These data indicate that client binding to HopDP2 is crucial for both general cellular function and protein maturation across different Hsp90 client systems.
We next sought to determine which GR segment is captured in the loading complex lumen. The GR maturation complex structure unambiguously demonstrates that GR’s pre-helix 1 strand (GR523–531, GRpre-Helix1) is gripped in the closed Hsp90 lumen9. Re-examination of previous Hsp70-GR hydrogen deuterium exchange mass spectrometry (HDX-MS) data8 reveals that only GRpre-Helix1 becomes protected upon Hsp70 binding (Extended Data Fig. 9a,b) and GRpre-Helix1 also contains high-scoring predicted Hsp70-binding sites (GR519–526) (Extended Data Fig. 9a). This strongly supports a model in which Hsp70 first inhibits GR by capturing GRpre-Helix1. Then, Hsp70 loads GR onto Hsp90–Hop with GRpre-Helix1 bound, forming the client-loading complex (Extended Data Fig. 9b–d). This model was tested by incorporating the photoreactive cross-linker at two positions in the GRpre-Helix1 residues either before (GR517) or after (GR527) the predicted Hsp70-binding site (Extended Data Fig. 10a). As expected, at both positions, cross-links between GR and Hsp70 were formed in the loading complex (Extended Data Fig. 10b, c). In addition, both positions were able to cross-link with Hop (Extended Data Fig. 10b, c), indicating that it is Hsp70C that the GRpre-Helix1 cross-linked with, rather than Hsp70S. Consistent with our model, a previous optical-tweezer study38 showed that GRHelix1 is readily detached, correlating with ligand binding loss. Together, this indicates that perturbations to GRHelix1 by Hsp70 or the loading complex leads to loss of GR ligand binding, explaining the inactivation of GR during the chaperone cycle.
Despite extensive 3D classifications, the main body of GR remained at low resolution. Nonetheless, the Hsp90MDs from each protomer and the Hsp90Bamphi-α clearly contact GR (Extended Data Fig. 7b–d, f, g). Hsp90 residues previously found21,22,39–41 to affect GR maturation are highlighted in Fig. 3e. The exposed Hsp90A(W320, F349) directly contact GR in both the loading complex (Fig. 3e, Extended Data Fig. 7g), and the maturation complex9. Notably, Hsp90 W320 (W300 in yHsp82) is an important binding residue that is exploited by both clients and cochaperones. Not only does it interact with GR and HopDP2 (Fig. 2d), but it also interacts with another cochaperone, Aha142. Supporting its broad functional importance, numerous studies have reported deleterious effects of Hsp90 W320 mutations on GR activation40,43 and yeast growth26.
Discussion
Our client-loading complex structure provides a view of how Hsp70, Hsp90 and Hop work together to chaperone a client. Several features were unexpected. (1) Two Hsp70s bind the Hsp90 dimer–one delivers client and the second scaffolds Hop. (2) Hop interacts extensively with all components, including GR, going well beyond the anticipated TPR-EEVD interactions. (3) Together, Hop–Hsp90 and Hsp70–Hsp90 interactions define the Hsp90 conformation, poising it both for client binding and ultimately for ATP hydrolysis and client activation. (4) Hsp90 repurposes one side of its client-binding sites to bind HopDP2, which in turn augments the Hsp90 lumenal client-binding site, facilitating client-loading from Hsp70 (Figs. 3b, 4a).
Fig. 4 |. Model of how Hsp70 loads GR onto Hsp90.
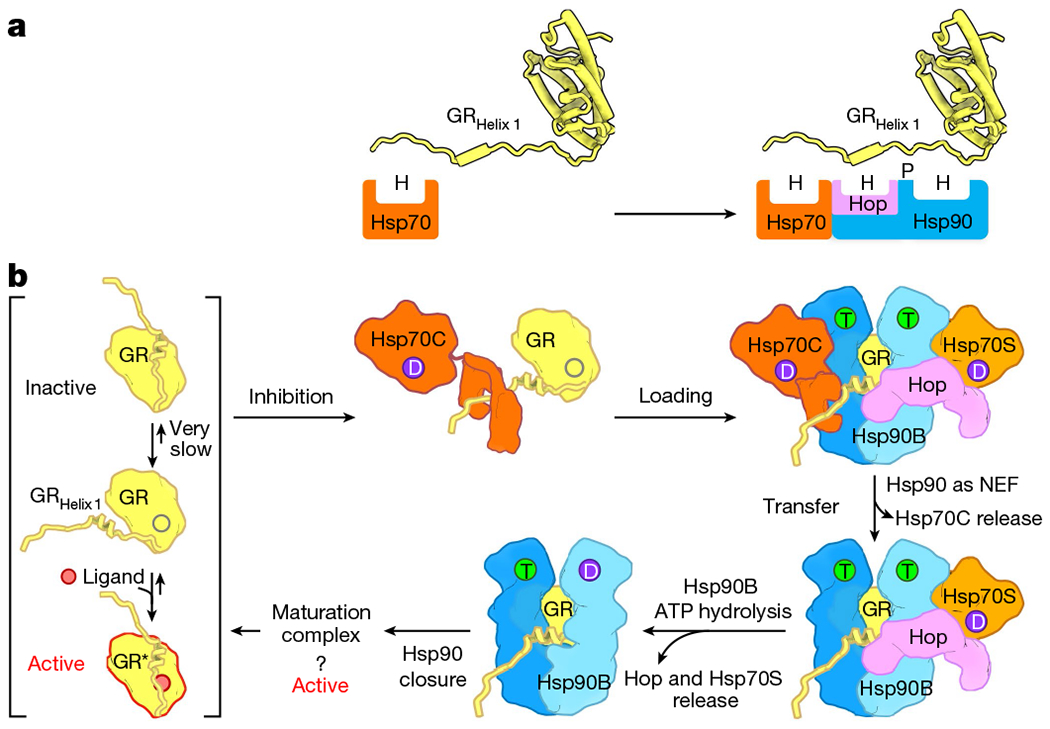
a, The molecular principle of GR recognition at the client-loading step. H and P denote hydrophobic and polar interactions, respectively. b, Catalysis of GR ligand binding by the actions of Hsp70 and Hsp90. GR under physiological conditions is in a sparingly populated equilibrium between apo-closed (inactive) and open apo states to which ligand can bind. GRHelix 1 acts as a lid to gate and support ligand binding. Hsp70C (dark orange) in its ADP state (D) binds the GRpre-Helix 1 strand, enabling GRHelix 1 to detach and inhibit ligand binding (top middle). Facilitated by HopDP2 recognizing the GRHelix 1 LXXLL motif, Hsp70C loads GR onto Hsp90 (blue), forming the client-loading complex (top right). Although the observed structure was for an Hsp90Apo state, under physiological conditions ATP is highly abundant and would probably occupy Hsp90’s ATP-binding pockets (T). The ATP binding and NEF activity of Hsp90 facilitate the release of Hsp70C (bottom right). The energy from the ATP hydrolysis (D) on Hsp90B (light blue) is used to release Hsp70S (light orange) and Hop (bottom middle), which is followed by full closure of Hsp90 towards the GR-maturation complex9.
The loading complex provides an extremely extended client-binding pocket, with a large and very adaptable surface for client recognition (Figs. 3b, 4a, Extended Data Fig. 7b–d): (1) Hsp70 binds a hydrophobic strand; (2) HopDP2 binds a hydrophobic or amphipathic helix; (3) the remaining part of the Hsp90Aamphi-α provides polar interactions; (4) the Hsp90Bamphi-α provides a hydrophobic surface; and (5) the Hsp90A/B lumen provides a combination of hydrophobic and polar interactions. Not only is the loading complex lumen spacious enough to bind a strand (as shown here) or intact helix (Extended Data Fig. 3f), but the flexible positioning of the Hsp70CSBD and the dynamic, adaptable conformation of the Hsp90amphi-α allow even broader flexibility for client recognition.
Our structural insights reveal the molecular mechanism of GR inactivation in the chaperone cycle (Fig. 1a), allowing us to propose the following pathway for loading complex formation (Fig. 4b): Hsp70C captures the flexible GRpre-Helix 1, causing the next dynamic helix-strand motif to detach, thereby destabilizing the GR ligand-binding pocket (Extended Data Fig. 9b, c). Hsp70C then delivers the partially unfolded GR to Hop–Hsp70S–Hsp90. In the resultant loading complex, GR is further unfolded through engagement of the LXXLL motif of GRHelix1 with HopDP2 and the GRpost-Helix1 strand with the Hsp90 lumen (Fig. 3b–d, Extended Data Fig. 8e), suppressing any possible ligand binding. The rest of GR remains globular and is only loosely associated with the distal surface of Hsp90.
Our structural data also enable us to propose how the loading complex progresses to the maturation complex–a process requiring Hsp90 ATP hydrolysis and release of Hop and both Hsp70s. The one-Hsp70 loading complex (Extended Data Fig. 3d, e) suggests that the process is asymmetric and sequential, with the loss of Hsp70C occurring first. Schematically shown in Fig. 4b, we propose that a combination of Hsp90’s ATP binding and NEF activities promotes Hsp70C to hand off GR and exit the complex. This leaves GR engaged with HopDP2 and the Hsp90 lumen, minimizing reformation of an Hsp70–GR complex or premature release. Then, asymmetric Hsp90 ATP hydrolysis drives the release of the more tightly engaged Hsp70S–Hop. Finally, as discussed in detail in a partner study9, the conversion of the semi-closed Hsp90 in the loading complex to the fully closed Hsp90ATP in the maturation complex may serve as a driving force for client remodelling and hence activation (Extended Data Fig. 3b, c).
GR uses a generalized chaperone (Hsp70) and cochaperone (Hop) for loading onto Hsp90, making the principles learned here broadly applicable to other clients. Indeed, in this report, we show that the two most studied model clients–GR and v-Src–seemingly share a similar client-loading mechanism for their maturation (Extended Data Figs. 6j, 8h). Although Hop is absent in bacteria and organellar compartments, Hsp70s are ubiquitously present and the client binding provided by HopDP2 is probably substituted by the Hsp90amphi-α. Although most, if not all, proteins engage with Hsp70 at least during initial folding, only a subset are Hsp90 clients. Ultimately, client properties must dictate this selectivity. Rather than an overall client property such as stability, our loading complex structure suggests a more nuanced balance of three effects: (1) the probability of partial unfolding fluctuations in the client; (2) the ability of Hsp70 to capture a transiently exposed site; and (3) the likelihood that further unfolding events would uncover adjacent client regions that can be captured by HopDP2–Hsp90. Experiments to test these general principles can now be designed to predict and identify potential clients that undergo regulation by Hsp90 and Hsp70.
Methods
Protein purification
All recombinant chaperone proteins of Hsp90α, Hop and Hsp70 (from human), and ydj1 (yeast Hsp40) were in general expressed and purified as described previously8 but with minor modifications as described below. Proteins were expressed in the Escherichia coli BL21 star (DE3) strain. Cells were grown in terrific broth (TB) at 37 °C until the optical density at 600 nm (OD600) reached 0.8. Protein expression was induced with 0.5 mM IPTG for 16 h at 16 °C. Cells were collected by centrifugation at 4,000g for 15 min and resuspended in lysis buffer (50 mM Tris pH 7.5, 500 mM KCl, 10 mM imidazole and 5 mM βME). A protease inhibitor cocktail (Roche) was then added. Cells were lysed by an Emulsiflex system (Avestin). Lysates were cleared by centrifugation at 20,000 rpm for 1 h at 4°C and the soluble fraction was affinity-purified by gravity column with Ni-NTA affinity resin (Qiagen). The protein was eluted by 50 mM Tris pH 8, 50 mM KCl and 5 mM βME. The 6×-His-tag was removed with TEV protease and protein was dialysed into low-salt buffer overnight (50 mM Tris pH 8, 50 mM KCl and 5 mM βME). The cleaved protein was purified with MonoQ 10/100 GL (GE Healthcare), an ion-exchange column with 30 mM Tris pH 8, 50 mM KCl and 5 mM βME and eluted with a linear gradient of 50–500 mM KCl. Fractions with the target protein were then pooled and concentrated for final purification of size exclusion in 30 mM HEPES pH 7.5, 50 mM KCl, 2 mM DTT and 10% glycerol using a Superdex S200 16/60 (GE Healthcare) or Superdex S75 16/60 (GE Healthcare). The peak fractions were pooled, concentrated to around 100–150 μM or greater, snap-frozen in liquid nitrogen and stored in aliquots at −80 °C. MBP–GRLBD(520–777) (F602S) was expressed and purified as described previously8. Note that for complex preparation, Hsp70 from an Sf9 cell source was used with purification as described previously8. The Hop and GR constructs for the cross-linking experiment were obtained using FastCloning44 to the Amber codon. The constructs were expressed in E. coli BL21 DE3 cells containing the pEVOL-pBpF plasmid45 distributed by the laboratory of P. Schultz through Addgene (31190). Cells were grown in TB to an OD600 of 0.6. For induction, arabinose (0.02%), IPTG (1 mM) and p-benzoyl-phenylalanine (pBpa; 0.7 mM) were added, and expression was carried out overnight at 16 °C. Cell collection, lysis and Ni-NTA purification was performed as described above.
Preparation of the GR-loading complex
Using reaction buffer containing 50 mM HEPES pH 7.5, 50 mM KCl and 2 mM DTT, 10 μM Hsp90 dimer of ATP-binding-deficient mutant (Hsp90(D93N))46, 10 μM Hop, 15 μM Hsp70, 4 μM Hsp40 and 20 μM MBP-GRLBD were incubated with 5 mM ATP/MgCl2 for 1 h at room temperature. The complex was purified and analysed by size-exclusion chromatography with multi-angle light scattering (SEC-MALS) with a Wyatt 050S5 column on an Ettan LC (GE Healthcare) in a running buffer containing 50 mM HEPES, 50 mM KCl, 5 mM MgCl2, 2 mM DTT, 200 μM ADP and 0.01% octyl β-d-glucopyranoside (β-OG). Molecular weights were determined by multi-angle laser light scattering using an in-line DAWN HELEOS and Optilab rEX differential refractive index detector (Wyatt Technology Corporation). Once eluted, fractions containing the GR-loading complex were immediately cross-linked with 0.02% glutaraldehyde for 20 min at room temperature and quenched with 20 mM Tris pH 7.5. Fractions containing the GR-loading complex were separately snap-frozen in liquid nitrogen, and stored in aliquots at −80 °C.
Photoreactive cross-linking experiment
To ensure that pBpa-Hop (Extended Data Fig. 8a, b, d) and pBpa-GR (Extended Data Fig. 10) cross-link the bound segment in the context of the loading complex, cross-linking reactions were performed immediately after the complex was fractionated from SEC (see the previous section). Using a UV-transparent, 96-well microplate (Corning) as a fraction collector, the whole fractions of the eluted GR-loading complex were subjected to UV exposure using an agarose gel imaging system (Enduro GDS Imaging System). Samples were irradiated for 60 min in total. To prevent overheating, the 96-well plate was placed on a shallow, UV-transparent plate filled with constantly refreshed ice water during the time course of the exposure. SDS–PAGE gels were used to analyse cross-linked products, followed by western blot transfer to nitrocellulose and probed with anti-MBP (New England BioLabs), anti-Hsp70 (Enzo Life Sciences) or anti-STIP1 (Proteintech) antibodies.
Cryo-EM sample preparation, grid preparation and data acquisition
The flash-frozen fractions of the loading complex were thawed and concentrated to 0.7–0.8 μM. About 2.5 μl of the complex sample was applied onto a glow-discharged, holey carbon grid (Quantifoil R1.2/1.3, Cu,400 mesh), blotted by Vitrobot Mark IV (FEI) for 8–14 s at 10 °C and 100% humidity, and plunge-frozen in liquid ethane. Four data collections were made using Titan Krios (Thermo Fisher Scientific) equipped with a K2 camera (Gatan K2). SerialEM47 was used for all the data collections with parameters as described in Supplementary Table 1.
Image processing
Movies were motion-corrected using MotionCor248, in which the unweighted summed images were used for CTF estimation using CTFFIND449, and the dose-weighted images were used for image analysis with RELION50 throughout. The initial model of the loading complex was obtained from a small data collection (Extended Data Fig. 1d). Particles were picked from the small data collection using Gautomatch (https://www2.mrc-lmb.cam.ac.uk/research/locally-developed-software/zhang-software/) without template and subjected to reference-free 2D classification (Class2d) using RELION. 2D class averages with proteinaceous features were selected for 3D classification (Class3d) using RELION. For Class3d, the reference model was generated using the semi-open conformation Hsp90 from the Hsp90–Hop cryo-EM structure34 (Supplementary Fig. 7c). Among eight classes, one class (around 8 Å resolution) showed recognizable shapes of the protein components, although the class is markedly different from the initial model (Extended Data Fig. 1d). This low-resolution reconstruction of the loading complex was then used as an initial reference model for the following image analysis that achieved high resolution.
The procedure to obtain the high-resolution reconstruction is shown schematically in Extended Data Fig. 1e. Particles were picked from all dose-weighted micrographs using Gautomatch with the low-resolution reconstruction as a template. Without using Class2d, the extracted, binned 4 × 4 particles (4.236 Å pixel−1) were subjected to RELION Class3d (4 classes) to sort out ‘empty’ or non-proteinaceous particles. Particles from the selected class were re-centred and re-extracted to binned 2 × 2 (2.118 Å pixel−1) for another round of Class3d. Note that a low-resolution (around 7.5 Å) reconstruction of one-Hsp70 loading complex was obtained among the 4 classes (Extended Data Fig. 1e). The selected class that contains 636,056 particles of the two-Hsp70 loading complex was 3D auto-refined (Refine3d) into a single class (consensus class). The set of particles are then used for further global classification and focused classification (described below). For global classification, another round of masked Class3d (4 classes) was performed without alignment, followed by masked Refine3d using unbinned particles (1.059 Å pixel−1). Finally, 85,619 particles from the highest resolution, two-Hsp70 loading class were further subjected to multiple rounds of per-particle CTF and beam-tilt refinement51 until the gold-standard resolution determined by Refine3d no longer improved. The overall gold-standard resolution for the global reconstruction of the loading complex is 3.57 Å (Extended Data Fig. 2c). Local resolution was estimated using RELION (Extended Data Fig. 2a).
The loading complex presents conformational heterogeneity at all regions of the complex, in particular at the HopTPR2A-TPR2B (Supplementary Fig. 5f–h). Starting from the consensus class containing 636,056 binned 2 × 2 particles (2.118 Å pixel−1), masks at various GR-loading complex regions were used for focused classification with signal subtraction using RELION52 (Focused-class3d) (Extended Data Figs. 1f, 2g). A pipeline to obtain the best reconstruction for each masked region is outlined in Extended Data Fig. 1f. For each masked region, Class3d without alignment was performed, followed by Refine3d using unbinned particles (1.059 Å pixel−1). For each Class3d job, parameters of number of requested classes (K = 6, 8, 10, 12, 14) and Tau (T = 10, 20, 30, 40) were scanned. For each masked region, the reconstruction that results in the highest resolution determined by the gold-standard Fourier shell correlation (FSC) of the Refine3d job was selected for each masked region. Using the unbinned particles, another round of Focused-class3d was performed with the similar procedure described for the previous round. Parameters were scanned in a similar manner but with smaller requested classes (K = 2, 3, 4, 5). Finally, the selected Focused-class3d job was subjected to multiple rounds of per-particle CTF and beam-tilt refinement. The overall resolution of the reconstruction for each masked region is determined by the gold-standard FSC and as denoted in the FSC plots in Extended Data Fig. 2g, Supplementary Table 2. The focused maps showed much better atomic details than the global reconstruction at all regions, and hence were used for model building and refinement.
Model building and refinement
Model building and refinement was carried out using Rosetta53 throughout. All of the components of the loading complex had crystal structures or close homologous structures (from yeast) available. Details of how the starting, unrefined atomic model for each component was obtained are described below. For Hsp90, the starting model was assembled from the crystal structure of human apo-Hsp90NTD (PDB ID: 3T0H)54 and the cryo-EM structure of the Hsp90MD-CTD from the GR-maturation complex9. Many crystal structures of Hsp70NBD were available. As potassium and magnesium ions were used in the buffer for complex preparation and there is density accounted for them in our focused maps (Supplementary Fig. 3a, b), the ADP state Hsp70NBD crystal structure (PDB ID: 3AY9)55, which has potassium and magnesium ions to coordinate ADP, was used as an starting model. For the Hsp70SBD-β, the human Hsp70 crystal structure (PDB ID: 4PO2)56 was used as a starting model. The initial docking poses of Hsp70CSBD-β were obtained using a rotation search enabled by spherical-harmonic decomposition previously used57 for docking fragments in cryo-EM density. To facilitate the rotation search, the density of Hsp70CSBD-β was isolated from the 5A low-pass-filtered map of the global reconstruction using the Chimera “Zone” tool. The top solution was selected from the top-10 solutions based on (1) visual inspection of the fit-to-density, (2) the physical connectivity to the C-terminus of Hsp70CNBD, (3) the room to accommodate the Hsp70CSBD-α (shown as missing density in the global reconstruction), and (4) the cryo-EM density and physical connectivity of the bound GR segment in Hsp70CSBD-β to the GR segment in the lumen of the loading complex. The interdomain linker between Hsp70CNBD and Hsp70CSBD-β was built using RosettaCM guided by the 5 Å low-pass-filtered map of the global reconstruction with all of the complex components present. Then, the docking pose of Hsp70CSBD-β was further optimized with full-atom energy minimization guided by the cryo-EM density. The sequence of the Hsp70CSBD-β-bound GR segment was determined with the aid of Rosetta (Supplementary Fig. 9). Two 7-residue GR segments (SIVPATL and IVPATLP) of a continuous sequence (residues 519–526; note that residue 519 in the native GR sequence is T, not S) in the GRpre-Helix 1 strand are predicted to be Hsp70-binding sites by two state-of-the-art algorithms (BiPPred58 and ChaperISM59) (Extended Data Fig. 9a). Structural modelling of the two GR peptides in the templates60 (PDB IDs: 4EZZ, 4EZT and 4EZQ) with ‘reverse’ binding mode to Hsp70CSBD-β indicated that the segment, SIVPATL, is energetically more favoured (Supplementary Fig. 9a–c). For Hop, the crystal structures33 of the HopTPR2A-TPR2B (PDB ID: 3UQ3) and HopDP2 (PDB ID: 2LLW) from yeast were used as initial templates with the alignments obtained from the HHpred server61 (Supplementary Fig. 5a, b, e). The insertion in the threaded Hop model was completed using RosettaCM62 guided by the cryo-EM density. The resulting completed models of HopTPR2A and HopTPR2B showed a high resemblance to their structures determined by NMR63 individually (Supplementary Fig. 5c, d).
Using the high-resolution information acquired from focused classification/refinement, the starting models were refined separately into the individual focused maps (Extended Data Fig. 2g). Model overfitting was monitored and contained using the half-map approach as previously described64,65, in which one-half map from RELION Refine3d was used for density-guided refinement, whereas the other half map was used for validation. A Rosetta fragment-based iterative refinement protocol65 was used to refine the models throughout. On the basis of the high-resolution focused maps, the refinement tasks were split into (1) Hsp90A–Hsp70C (Extended Data Fig. 2g, Supplementary Fig. 1a), (2) Hsp90B–Hsp70S (Extended Data Fig. 2g, Supplementary Fig. 1b), (3) Hsp70S–HopTPR2A (Extended Data Figs. 2g, 6a, d) and (4) Hsp90ABCTD–Hsp70SSBD-β–HopDP2–GRHelix 1 (Extended Data Figs. 2g, 7a–c). To model the GR segment threaded through the lumen of Hsp90, the GRHelix 1 motif (residues 528–551) was first segmented from the crystal structure of GRLBD (PDB ID: 1M2Z)66 and rigid-body-fitted into the lumen density. The GRHelix1 segment was then rebuilt and refined using a Rosetta fragment-based iterative refinement method into the focused map of the Hsp90ABCTD–Hsp70SSBD-β–HopDP2–GRHelix 1 (Extended Data Figs. 2g, 7a–c) with the other component proteins present. The remaining, globular portion of GRLBD was rigid-body-fitted initially using Chimera. The placement was further refined, guided by (1) the connectivity to the GRHelix1 motif and (2) GR’s interaction with Hsp90MD in the maturation complex9. The docked GRLBD was then energy minimized in Rosetta guided by the 10 A low-pass-filtered cryo-EM map (Extended Data Fig. 7f, g). Finally, the connectivity of the N-terminal end of the globular portion of GRLBD and the C-terminal end of the GRHelix1, and the N-terminal end of the GRHelix1 motif and the C-terminal end of the Hsp70-bound GRpre-Helix 1 portion (Supplementary Fig. 9d–f), was built using RosettaCM. Note that the N-terminal MBP (maltose-binding protein) tag of the GRLBD construct was ruled out to be the density connected to the GRpre-Helix 1 (Supplementary Fig. 8c). The final model of the loading complex was assembled and refined into the high-resolution global construction, followed by atomic B-factor refinement (Extended Data Fig. 2d–f). Note that the dynamic range of the fitted atomic B-factors (Extended Data Fig. 2d, e) accurately represents the distribution of local-resolution estimates in the global reconstruction shown in Extended Data Fig. 2a.
Structural modelling was used to ensure and suggest the connectivity of the EEVD tails of Hsp90–Hsp70 to the bound TPR domains of Hop (Supplementary Fig. 7a, b). For each protomer of Hsp90, around 40 residues of the tail were modelled using RosettaCM to connect the bound Hsp90 EEVD fragment and the very C-terminal helix in the Hsp90CTD. Similarly, for Hsp70C, the remaining residues were built, including a Hsp70SBD-α lid closing on the Hsp70SBD-β (PDB ID: 4PO2)56 followed by approximately 30-residue tail residues to the Hsp70 EEVD fragment bound to HopTPR2B.
To investigate how the NEFs, Bag-130 and Hsp11031,67, may regulate the GR cycle using the canonical NEF-binding site on the Hsp70NBD-IIB in the loading complex, crystal structures of the Hsc70NBD–Bag-1 complex (PDB ID: 1HX1)68 and Hsp70NBD–yeast Hsp110 complex (PDB ID: 3D2E)69 were superimposed onto the Hsp70s in the loading complex using PyMOL.
In vivo yeast Hsp90–Hsp70 interaction assay
Hsc82 plasmids expressing untagged or His–Hsc82 were expressed in the yeast strain JJ816 (hsc82::LEU2 hsp82::LEU2/YEp24-HSP82). His–Hsc82 complexes were isolated as described70. Antibodies against the last 56 amino acids of Ssa1/2 were a gift from E. Craig. The Sti1 peptide antiserum was raised against amino acids 91–108. His–Hsc82 was detected using an anti-Xpress antibody, which recognizes sequences near the 6×-His tag at the amino terminus. The R46G and K394E mutations were isolated in a genetic screen as described23.
Expression of Sti1 mutants
Wild-type cells (JJ762), or Δsti1cells (JJ623) expressing empty vector (pRS315) or plasmid-borne wild-type or mutant Sti1 (pRS315-S771) were lysed and subjected to SDS–PAGE (7.5% acrylamide gel) followed by immunoblot analysis with polyclonal antisera raised against yeast Sti1 as previously described71.
Growth assay of STI1 function
Δhsc8282hsp82(hsc8hsp82/YEp24-HSP82) (JJ117) or Δsti1hsc82hsp82/YEp24-HSP82 (JJ1443) strains were first transformed with plasmids expressing wild-type HSC82 or hsc82-G309S (pRS313GPDHis-Hsc82). Those cells were transformed with an additional plasmid, either empty vector (pRS315), or wild-type or mutant Sti1 (pRS315-STI1). Transformants were grown for 3 days in the presence of 5-FOA, which counter-selects for the URA3-based YEp24-HSP82 plasmid. As previously shown23, Δsti1hsc82hsp82 cells expressing hsc82-G309S are viable in the presence of STI1 but inviable in Δsti1 cells. Viability of sti1hsc82hsp82 cells expressing hsc82-G309S is restored by the presence of a plasmid expressing wild-type STI1 but not mutant sti1.
v-Src assay
Wild-type cells (JJ762), or Δ sti1cells (JJ623) expressing empty vector (pRS315), or plasmid-borne wild-type or mutant Sti1 (pRS315-STI1) were transformed with a plasmid expressing v-Src (pBv-src) under the GAL1 promoter or a control plasmid (pB656)71.
Cells were grown overnight in raffinose medium lacking uracil. The next day, galactose was added to a final concentration of 2%. After six hours of incubation, the cells were serially diluted 10-fold, spotted on the indicated media and grown for 2 days (glucose) or 3 days (galactose). All strains exhibited similar growth in the presence of glucose. v-Src induction in the presence of galactose dramatically inhibited the growth of wild-type but not Δsti1cells. Adding plasmid borne STI1 resulted in growth inhibition, similar to wild-type cells. Cells expressing mutant forms of STI1 behaved like cells expressing empty vector.
Reporting summary
Further information on research design is available in the Nature Research Reporting Summary linked to this paper.
Extended Data
Extended Data Fig. 1 |. Purification of the GR-loading complex and the cryo-EM single-particle image processing pipeline.
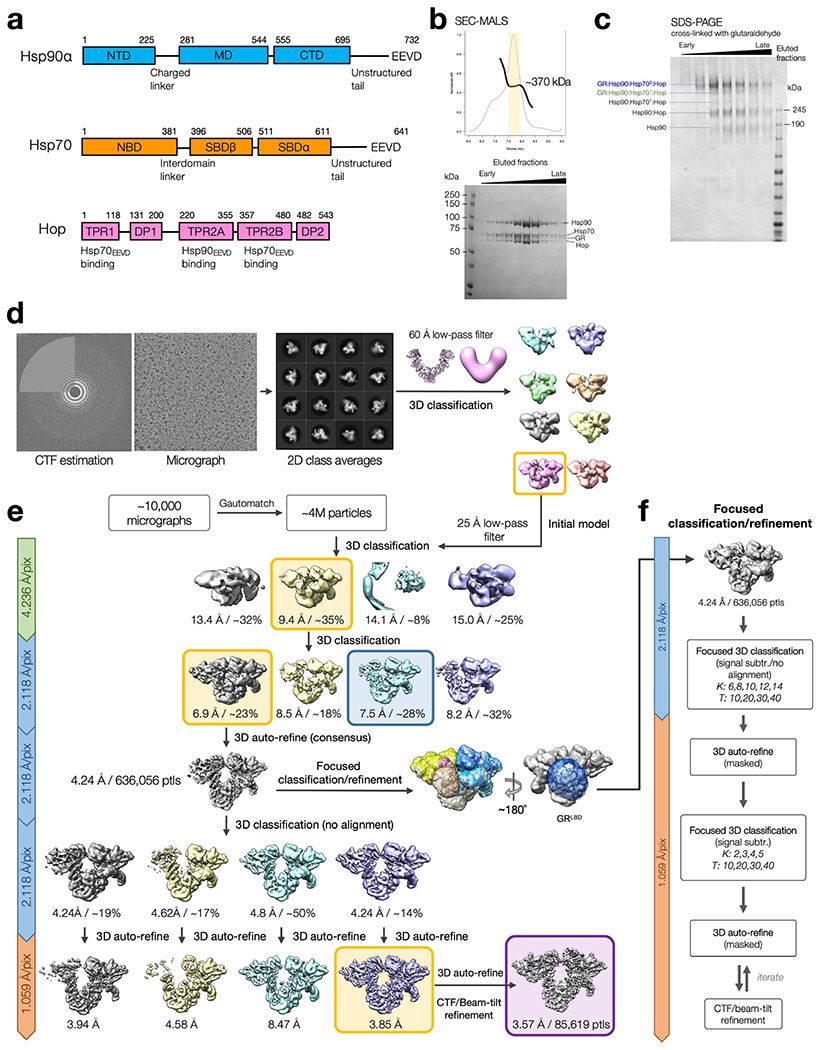
a, Domain organization of the chaperone proteins in the GR-loading complex. b, Top, elution profile of gel filtration using SEC-MALS to confirm the homogeneity of the GR-loading complex. The apparent molecular weight of the eluent estimated by SEC-MALS is ~370 kDa, although the two-Hsp70 client-loading complex is ~440 kDa. The discrepancy may be a result of multiple species co-eluted. Bottom, SDS–PAGE stained with Coomassie blue of the eluted fractions marked in (top). c, SDS–PAGE stained with Coomassie blue of the fractions treated with 0.02% (w/v) glutaraldehyde cross-linking for 20 min at room temperature, followed by quenching with 20 mM Tris buffer at pH 7.5. Data in (b-c) are representative data of at least two independent experiments. d, Initial model generation for the GR-loading complex. The 60 Å low-pass filtered initial model used to reconstruct the 3D model was adopted from the Hsp90 semi-open conformation structure from the Hsp90:Hop cryo-EM structure34. e, Schematic workflow of the global cryo-EM map reconstruction. Yellow boxes indicate the selected class to move forward. Blue box indicates one-Hsp70 loading complex. Purple box indicates the final high-resolution global reconstruction. f, Flow chart of focused classification/refinement using the signal subtraction approach from RELION. Final reconstructions for individual masked classifications/refinements were selected based on the resolution intercepted with the FSC 0.143 from 3D auto-refine. K=number of classes; T=regularization factor, Tau.
Extended Data Fig. 2 |. Resolution estimates for cryo-EM reconstructions, atomic B-factor refinement and model-map FSC.
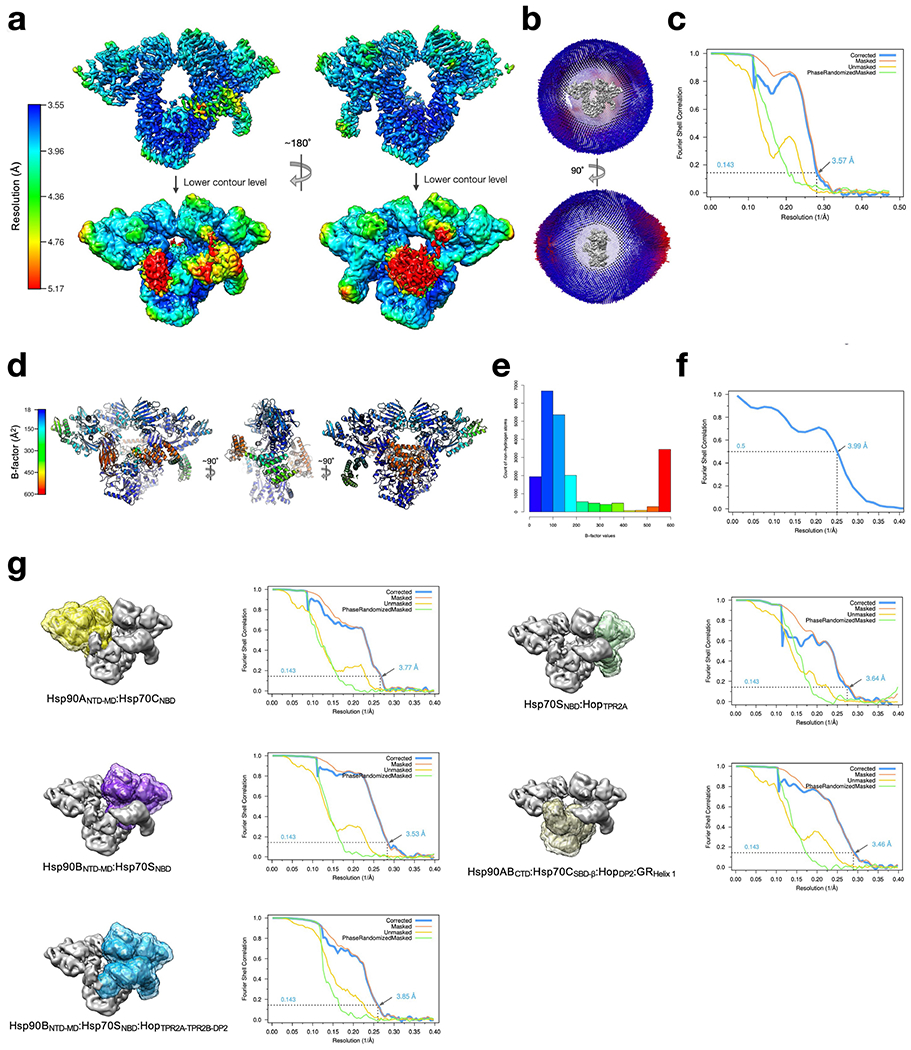
a, Local resolution estimates for the GR-loading complex global reconstruction were calculated using RELION with front view (left) and back view (right). b, Euler angle distribution in the final reconstruction. Orthogonal views of the reconstruction are shown with front view (top) and side view (bottom) c, Gold-standard FSC for the global cryo-EM reconstruction. d, Atomic model with B-factors refined with colour key shown on the left. e, Histogram of the B-factor values of all non-hydrogen atoms in the atomic model, coloured by the same colour key in d. f, Model-map FSC. g, Focused classification and refinement of the GR-loading complex. Masks were created at various regions of the GR-loading complex (left) and its corresponding gold-standard FSC (right) after 3D auto-refine. The nominal resolution for each reconstruction is labelled and indicated in the FSC plots.
Extended Data Fig. 3 |. The Hsp90 in both two-Hsp70 and one-Hsp70 GR-loading complexes adopts a semi-closed conformation.
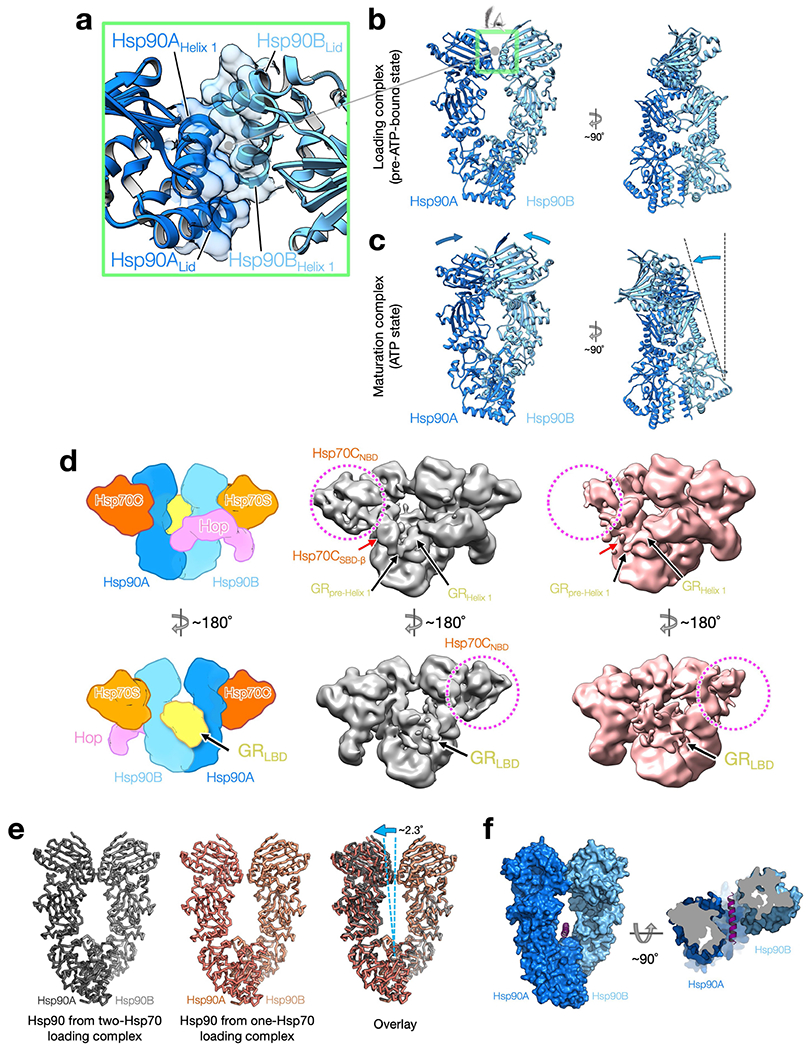
a, Close-up view of the novel dimerization interface of the symmetric Hsp90 dimer with residues at the interface in transparent surface representation. The interface is composed of two molecular switches of Hsp90, the first helix and the lid motif. b, c, The Hsp90 in the loading complex (b) is one step away from the fully closed ATP state (c). Front (left) and side (right) views of the Hsp90 in the two-Hsp90 GR-loading complex (b) and the Hsp90 in the GR-maturation complex9 (c). Arrows indicate displacements from the Hsp90 in the loading state, in which a large twisting motion is apparent from the side view. d, Comparison of cryo-EM reconstructions of the one-Hsp70 and two-Hsp70 GR-loading complexes. Schematic model of the two-Hsp70 loading complex (left). Front views of cryo-EM maps of the two-Hsp70 (middle; grey colour) and one-Hsp70 (right; salmon colour) GR-loading complexes. Right, the one-Hsp70 reconstruction has lost density for Hsp70CNBD (dashed circle) and Hsp70CSBD-α (red arrows); however, density for GRpre-Helix 1 and GRHelix 1 (black arrows) is in the same location as it is in the two-Hsp70 GR-loading complex. e, Rigid-body fitting of the two Hsp90 protomers individually in the one-or two-Hsp70 loading complexes cryo-EM reconstructions shows both of the Hsp90s share a similar semi-closed conformation. The Hsp90 in the one-Hsp70 loading complex (middle panel) has a slightly wider opening angle (right panel) than the Hsp90 in the two-Hsp70 loading complex (left panel). f, The lumen of the semi-closed Hsp90 presented in the loading complex can fit a helix72. A helix (magenta) can be accommodated in the semi-closed Hsp90. Front view (left) and top view (right).
Extended Data Fig. 4 |. Interfaces I and II are both crucial for Hsp90–Hsp70 interactions and client activation.
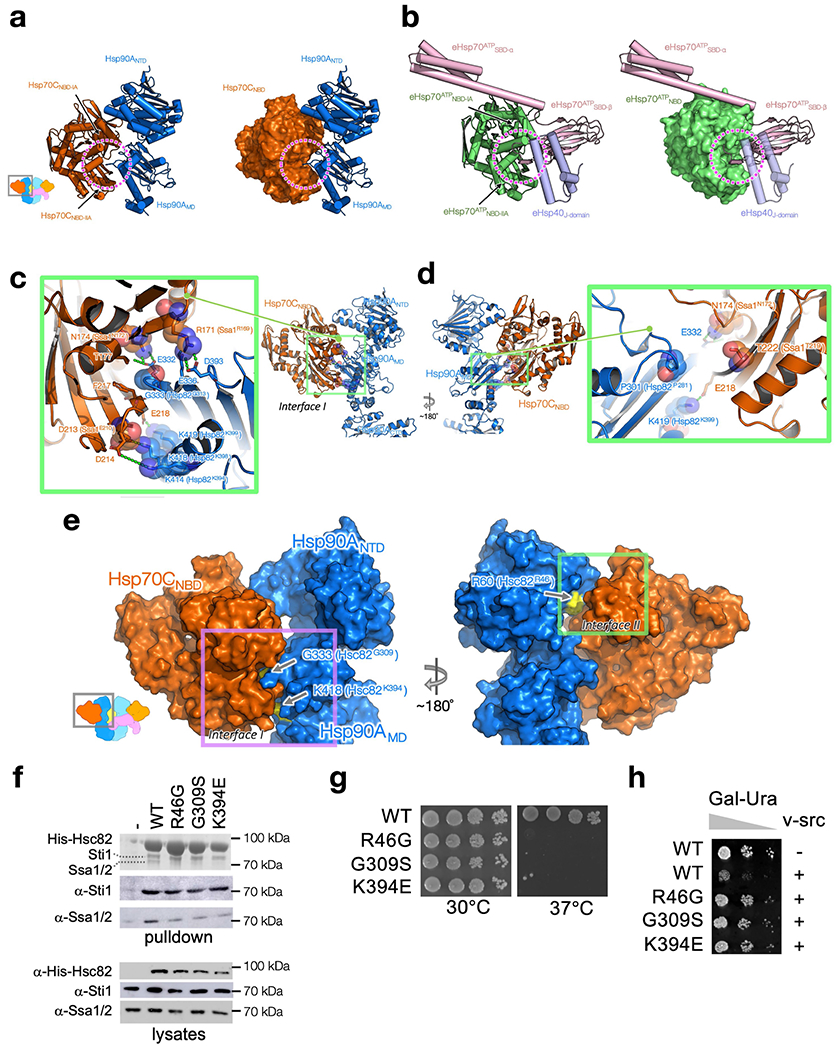
a, b, The Hsp70 cleft (dashed circles), formed by Hsp70NBD-IA and Hsp70NBD-IIA (a), which Hsp90MD interacts with, is used by the Hsp70 interdomain linker in the Hsp70 ATP state and Hsp40’s J-domain (b). Hsp90A:Hsp70C in the loading complex are shown as cartoon (a, left) and surface (a, right) representation. The E. coli Hsp70 (eHsp70):J-protein complex in the ATP state (PDB ID: 5NRO73) are shown as cartoon (b, left) and surface (b, right) representation. The two subdomains of eHsp70 are coloured in green for eHsp70ATPNBD and in pink for eHsp70ATPSBD. The E.coliHsp40J-domain (eHsp40J-domain) is coloured in purple. c, d, Mapping Hsp90/Hsp70 residues previously characterized by the Wickner group on the loading complex. Five yeast Hsp90 (Hsp82P281,G313,K394,K398,K399)23 and four yeast Hsp70 (ssa1R169,N172,E210,T219)24 mutations previously characterized by the Wickner group23,24 are all located at Interface I. These ‘Wickner residues’ are shown with stick and transparent sphere representation, whereas residues that interact with the Wickner residues are shown with only stick representation. Polar interactions are highlighted with green dashed lines. Residue numbers of the Wickner residues in yeast Hsp90/Hsp70 are shown as the labels within parentheses. Based on the proximity of the Wickner residue positions to Interface I residues, our structure can readily explain why Hsp82P281C (P301, Hsp90) and Ssa1T219C(T222, Hsp70) (d) showed no effect, whereas the other four Hsp90 mutants (Hsp82G313S(G333, Hsp90), Hsp82K394C(K414,Hsp90), Hsp82K398E(K418,Hsp90), Hsp82K399C(K419, Hsp90)) and the other three Hsp70 mutants (Ssa1N172D(N174, Hsp70), Ssa1R169H(R171, Hsp70), Ssa1E210R(D213, Hsp70)) (c) disrupted Hsp90:Hsp70 interaction significantly. e–h, In vivo validation of Interface I and II of the Hsp90:Hsp70 interactions in the GR-loading complex. Mapping the positions of the three mutations (arrows and yellow surface representation in e) used for in vivo validation on the atomic structure of Hsp90:Hsp70 (dark blue:dark orange; surface representation in e) in the GR-loading complex. The Interface I residues used, Hsp90G333 (Hsc82G309) and Hsp90K418 (Hsc82K394), are indicated by arrows (e, left panel). The Interface II residue, Hsp90R60 (Hsc82R46), is indicated by an arrow (e, right panel). Residue numbers of the residues in yeast Hsc82 are shown as the labels within parentheses in e. In f, His-Hsc82 complexes were isolated from yeast and analysed by SDS-PAGE and visualized by Coomassie staining and immunoblot analysis (see also Supplementary Fig. 10 for the uncropped gels/blots). Yeast proteins: Sti1=Hop; Ssa1/2=Hsp70; Hsc82=Hsp90β. In g, plasmids expressing wild-type or mutant Hsc82 were expressed as the sole Hsp90 in JJ816 (hsc82hsp82) cells. Growth was examined by spotting 10-fold serial dilutions of yeast cultures on rich media, followed by incubation for two days at 30 °C or 37°C. In h, strains expressing wild-type (WT) or mutant HSC82 were transformed with a multicopy plasmid expressing GAL1-v-src (pBv-src) or the control plasmid (pB656)74. Yeast cultures were grown overnight at 30 °C in raffinose-uracil drop-out medium until mid-log phase. Galactose (20%) was added to a final concentration of 2%. After six hours, cultures were serially diluted 10-fold onto uracil drop-out plates containing galactose. Plates were grown for 2-3 days at 30°C.
Extended Data Fig. 5 |. Both the Hsp90ATP and the Hsp70ATP conformations are incompatible with the GR-loading complex.
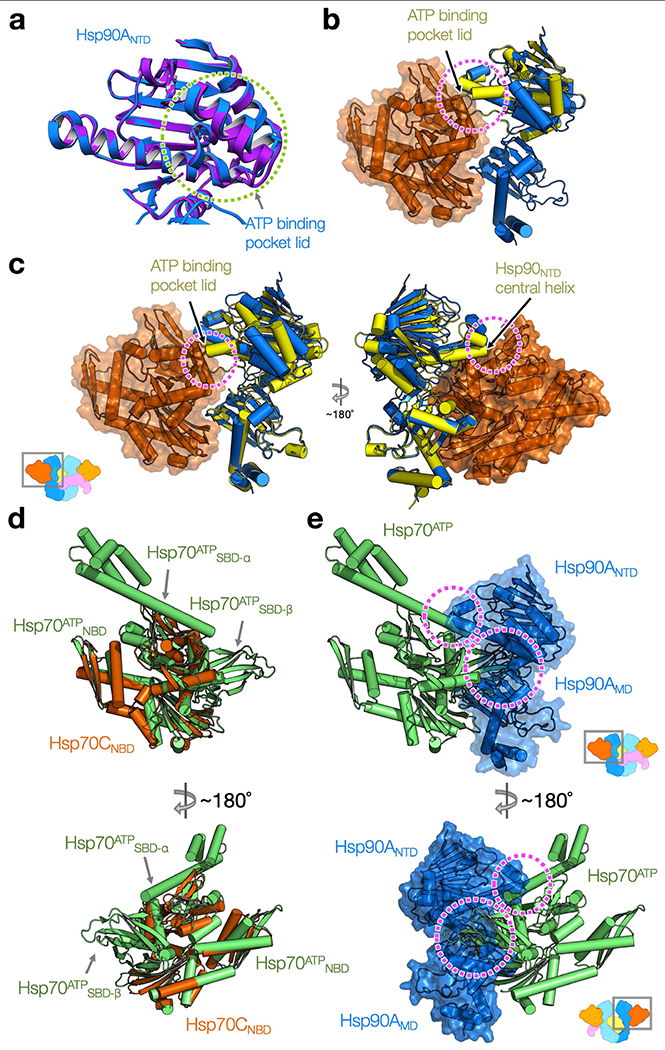
a, Overlay of the crystal structure of Apo Hsp90 fragment (purple; PDB ID: 3T0H54) to the Hsp90ANTD (dark blue). Green circle highlights the open ATP pocket lid. b, Closure of the ATP pocket lid in the ATP state of Hsp90NTD (the Hsp90α structure from the GR-maturation complex9 is in yellow, ribbon representation) clashes (magenta circle) with the Hsp70NBD (orange, surface and ribbon representation) in the loading complex. The NTD fragment of Hsp90ATP is aligned with the Hsp90NTD in the loading complex. c, Superimposition of the ATP state of Hsp90NTD-MD fragment (yellow) to the Hsp90A (dark blue) at the MD. Magenta circles indicate steric clashes of the ATP state of the Hsp90NTD to the Hsp70NBD (orange; surface/ribbon representation). d, Superposition of the Hsp70ATP conformation (green; PDB ID: 4B9Q75) to the Hsp70CNBD (dark orange). Arrows indicate the two subdomains of Hsp70ATPSBD, which cause serious steric clashes with the Hsp90 in the loading complex shown in e. e, The superimposed Hsp70ATP shown in e is fixed from d and the Hsp90 (dark blue; surface/ribbon representation) of the GR-loading complex is present. Magenta circles highlight steric clashes caused by the two subdomains of Hsp70ATPSBD (green) to the Hsp90ANTD-MD.
Extended Data Fig. 6 |. The Hsp70–Hop interface in the GR-loading complex is crucial for cellular functions and client maturation.
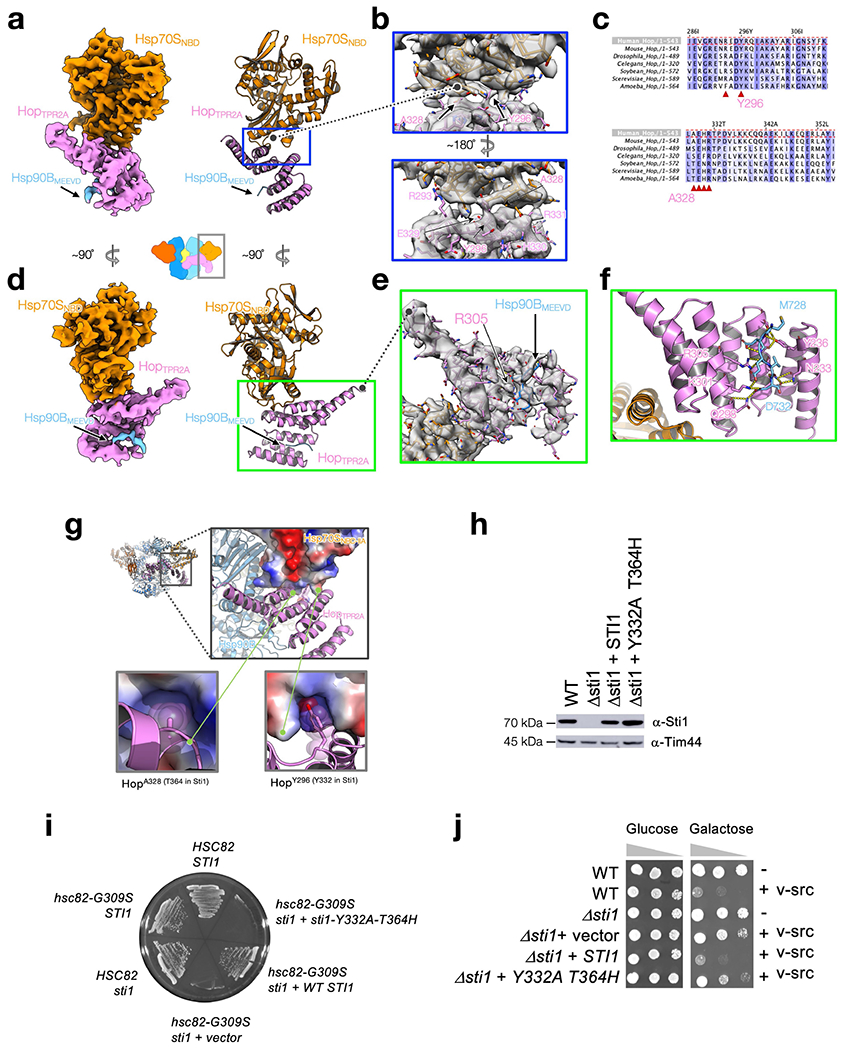
a–f, The atomic interactions of Hsp70SNBD:HopTRP2A:Hsp9GBMEEVD in the GR-loading complex. The cryo-EM map from focused classification and refinement is shown in (a and d, left). The atomic model with the corresponding view from (a and d, left) is shown in the right panels of (a, d). Close-up views of the Hsp70SNTD:HopTPR2A interface with the atomic model fit into the density (b). Two key residues (HopY296 and HopA328) are buried in the surface with their sidechain density indicated by the arrows (b, top and bottom). Density of the interface residues highlighted in Fig. 2b is shown in (b, bottom). Sequence alignments of Hop with key residues at the Hsp70NBD:HopTPR2A interface highlighted by the red triangles in (c), in which the colour scheme is BLOSUM62. Close-up view of the atomic model of HopTPR2A:Hsp90BMEEVD fit with the cryo-EM map is shown in (e). Close-up view of the atomic interactions of the MEEVD fragment from Hsp90B (light blue) and HopTPR2A (pink) from e is shown in f, in which polar interactions are depicted with dashed lines. g–j, In vivo validation of the Hsp70SNBD:HopTPR2A interface in the loading complex. The two buried residues in Hsp70SNBD-IIA:HopTPR2A interface, which were chosen for the mutational studies, are shown in g. Components of the GR-loading complex (g, top left) are coloured as in other figures and as labelled. Hsp70SNBD is shown in surface-charge representation (blue: positive; red: negative) calculated using PyMOL. Note that the corresponding residue numbering of the two positions in yeast Hop (Sti1) are shown in parentheses of the labels of the bottom panels in g. In h, Sti1Y332A-T364H accumulates at levels similar to WT Sti1 (see also Supplementary Fig. 10 for the uncropped gels/blots); data in h are representative of two independent experiments. Extracts from WT cells (JJ762), sti1 cells (JJ623), or sti1 cells transformed with a plasmid that expresses WT Sti1 or Sti1Y332A-T364H were analysed by SDS–PAGE and immunoblotted with a polyclonal antisera specific for Stil. Loading control is antibody against mitochondrial protein Tim44. In i, sti1-Y332A-T364H is inviable in hsc82hsp82 cells expressing hsc82-G309S. hsc82hsp82 (JJ117) or sti1hsc82hsp82 (JJ1443) strains harbouring YEp24-HSP82 were transformed with plasmids expressing WT HSC82 or hsc82-G309S. Strains that lacked STI1 were also transformed with an empty plasmid or a plasmid expressing WT STI1 or sti1-Y332A-T364H. Transformants were grown in the presence of 5-FOA for 3 days to counter-select for the YEp24-HSP82 plasmid. STI1 is essential under these conditions and the growth of cells expressing sti1-Y332A-T364H was indistinguishable from those expressing the empty plasmid. In j, WT cells, sti1 cells or sti1 cells transformed with a plasmid that expresses WT Sti1 or Sti1-Y332A-T364H were transformed with an empty plasmid or a plasmid that expresses GAL-v-src. v-src induction in the presence of galactose sharply reduces the growth of WT cells, but not cells lacking STI1. The growth of cells expressing sti1-Y332A-T364H was very similar to those expressing the empty plasmid, indicating that sti1-Y332A-T364H is unable to support v-src function. The growth of cells in the presence of glucose was indistinguishable. 10-fold serial dilutions of cultures were grown for 3 days in the presence of galactose or glucose.
Extended Data Fig. 7 |. The cryo-EM density and atomic model of GRHelix 1 motif interacting with Hsp90 and HopDP2.
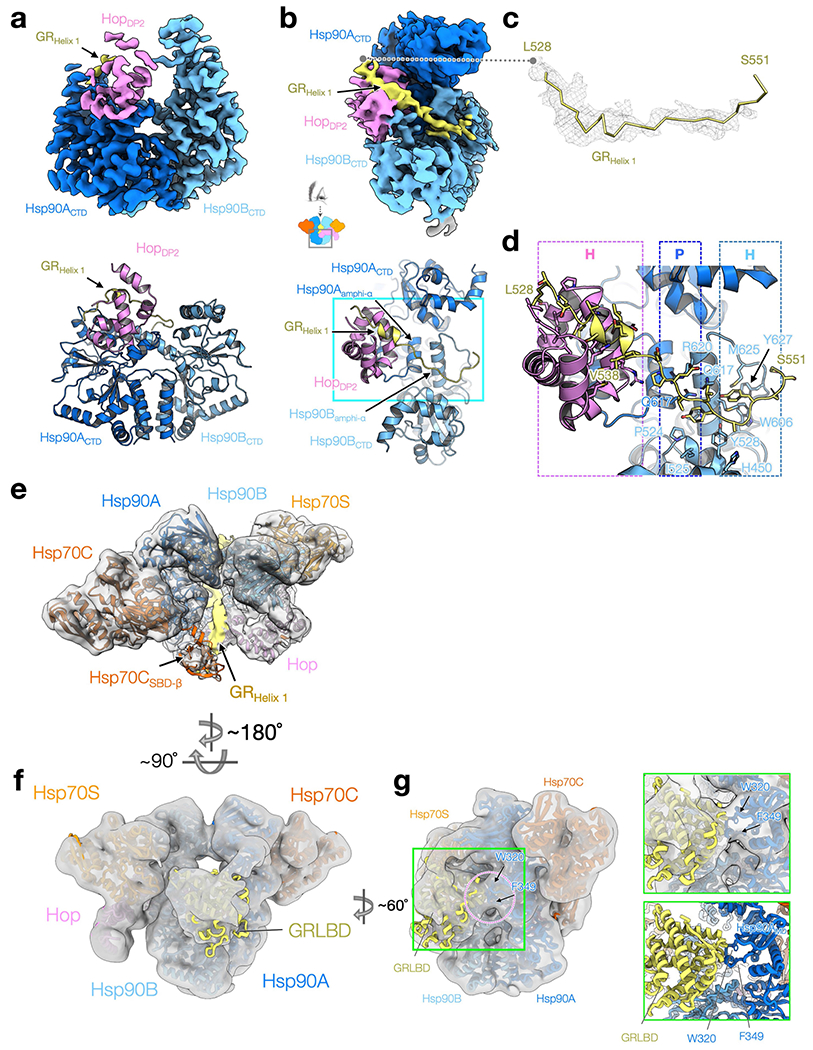
a, The focused map of the Hsp90ABCTD:Hsp70CSBD-β:HopDP2:GRHelix1 (top) and the atomic model shown in ribbon representation (bottom). b, The top view of the reconstruction and model shown in a. c, The density (mesh) for the GRHelix 1 motif (residues 528-551) gripped by Hsp90 and HopDP2. d, The atomic interactions of the GRHelix 1 motif with Hsp90 and HopDP2 corresponding to b, cyan box in bottom). Residues in contact with the GR motif are shown in stick representation. The types of molecular interaction Hsp90 and HopDP2 provide are indicated at the top; H and P denote hydrophobic and polar interactions, respectively. e, The 7Å low-pass filtered cryo-EM map shows that the lumen density (yellow shade) of GR connects to the globular part of GR on the other side of Hsp90. f, Docking of the GRLBD to the 10Å low-pass filtered map shows that the low-resolution GR density can fit the rest of the GRLBD. g, The low-pass filtered map shows that W320 and F349 (arrows) of Hsp90A in the loading complex are in contact with GRLBD.
Extended Data Fig. 8 |. Validations of HopDP2 binding to GR and of the in vivo importance of the client-binding pocket in HopDP2.
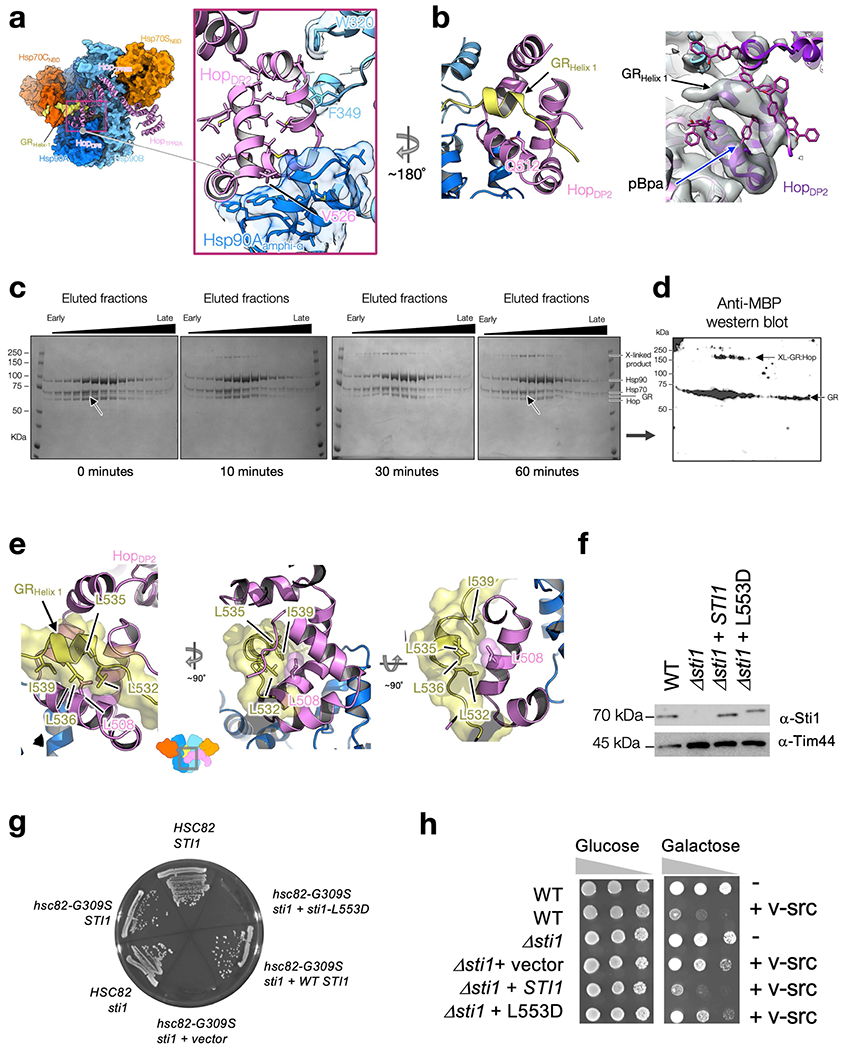
a–d, Using photoreactive, site-directed cross-linking to validate the HopDP2:GR interaction (a, the pink box) and (b, left). In a, HopDP2 is loosely packed and uses surface-exposed hydrophobic residues, shown in sticks, to interact with Hsp90Aamphi-α (shown in transparent surface and with hydrophobic residues in sticks) and Hsp90BW320,F349. Suggested by modelling of the photoreactive cross-linker p-benzoyl-l-phenylalanine (pBpa) on various positions of HopDP2 to search for the position which is at the closest proximity to the GRHelix1 density (b, right), the pBpa was placed at HopQ512 (b, left). The blue arrow on the right panel in b points at the selected position, Q512 (right panel, b). A time course of UV-exposed GR-loading complex analysed by SDS–PAGE and visualized by Coomassie staining (c). Whole fractions of GR-loading complex eluted from the size-exclusion column were exposed to UV using a gel imager (see also Methods). In c, arrows at 0 and 60 min indicate a reduced intensity of the GR band over the time course. Western blot of the SDS–PAGE gel after a 60 min UV exposure, using anti-MBP antibody to detect the MBP-tagged GR is shown in (d). Data in (c, d) are from one experiment. e–h, HopDP2’s client-binding/transfer function is crucial for cellular functions and client maturation. HopL508 (L553 in Sti1) is located on the hydrophobic palm (Fig. 2d) of HopDP2, interacting closely with the LXXLL motif of GRHelix 1 through hydrophobic interactions (e, left, middle and right). Mutations of HopL508 completely abrogated GR function in vivo (Sti1L553A in Schmid et al. 201233), lead to growth defects (g), and failed to promote v-src maturation (h). The mutant Sti1L553D accumulates at levels similar to WT Sti1 (f); data in f are from two independent experiments (see also Supplementary Fig. 10 for the uncropped gels/blots). Extracts from WT cells (JJ762), sti1 cells (JJ623) or sti1 cells transformed with a plasmid that expresses WT Sti1 or Sti1L553D were analysed by SDS–PAGE and immunoblotted with a polyclonal antisera specific for Sti1. Loading control is antibody against mitochondrial protein Tim44. In g, sti1-L553D is inviable in hsc82hsp82 cells expressing hsc82-G309S. hsc82hsp82 (JJ117) or sti1hsc82hsp82 (JJ1443) strains harbouring YEp24-HSP82 were transformed with plasmids expressing WT HSC82or hsc82-G309S. Strains that lacked STI1 were also transformed with an empty plasmid or a plasmid expressing WT STI1 or sti1-L553D. Transformants were grown in the presence of 5-FOA for 3 days to counter-select for the YEp24-HSP82 plasmid. STI1 is essential under these conditions and the growth of cells expressing sti1-L553D was indistinguishable from those expressing the empty plasmid. In h, WT cells, sti1 cells or sti1 cells transformed with a plasmid that expresses WT Sti1 or Sti1-L553D were transformed with an empty plasmid or a plasmid that expresses GAL-v-src. v-src induction in the presence of galactose sharply reduces the growth of WT cells, but not cells lacking STI1. The growth of cells expressing sti1-L553D was very similar to those expressing the empty plasmid, indicating that sti1-L553D is unable to support v-src function. The growth of cells in the presence of glucose was indistinguishable. 10-fold serial dilutions of cultures were grown for 3 days in the presence of galactose or glucose.
Extended Data Fig. 9 |. Hsp70 inhibits GR by binding the pre-Helix 1 region of GR.
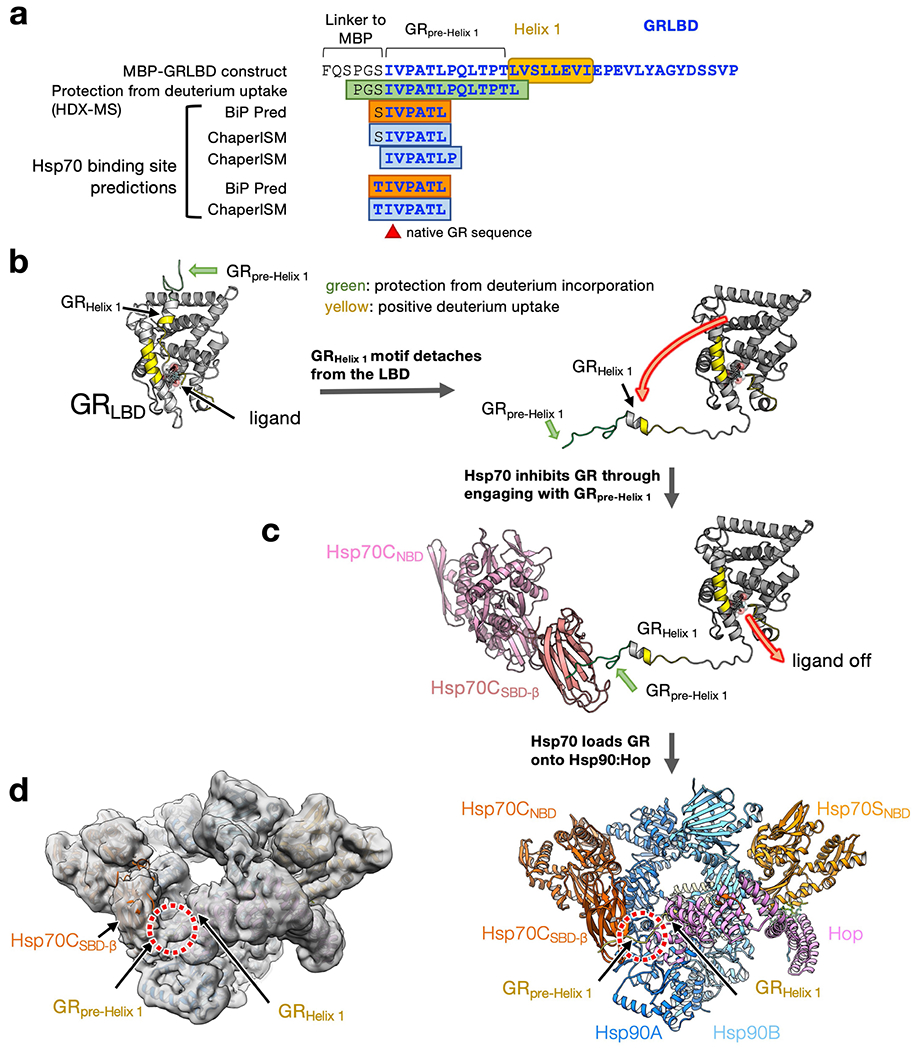
a, After engaging with Hsp70/Hsp40, the GRpre-Helix 1 region exhibits protection from deuterium incorporation in a HD-exchange mass spectrometry (HDX-MS) experiment8. In the GRpre-Helix 1 region, there are Hsp70-binding sites predicted by two state-of-the-art algorithms (BiP Pred58 and ChaperISM59). b, Left, GRLBD crystal structure (PDB ID: 1M2Z) coloured by the change of deuterium uptake (HDX-MS data was retrieved from a previous study)8; green: protection from deuterium incorporation; yellow: positive deuterium uptake. Right, the detachment of the entire GRHelix 1 motif explains the positive deuterium uptake around the ligand-binding pocket. c, The protection from deuterium incorporation of the GRpre-Helix 1 region can be explained by the binding of Hsp70. Together b and c provide a molecular mechanism describing how Hsp70 can inhibit GR ligand binding. d, GR’s pre-Helix 1 remains bound to Hsp70CSBD-β (red circles) in the loading complex. Left, the 6Å; low-pass filtered cryo-EM map of the loading complex. Right, atomic model with ribbon presentation.
Extended Data Fig. 10 |. The GRpre-Helix1 strand is engaged with the client-loading Hsp70 (Hsp70C) in the GR-loading complex.
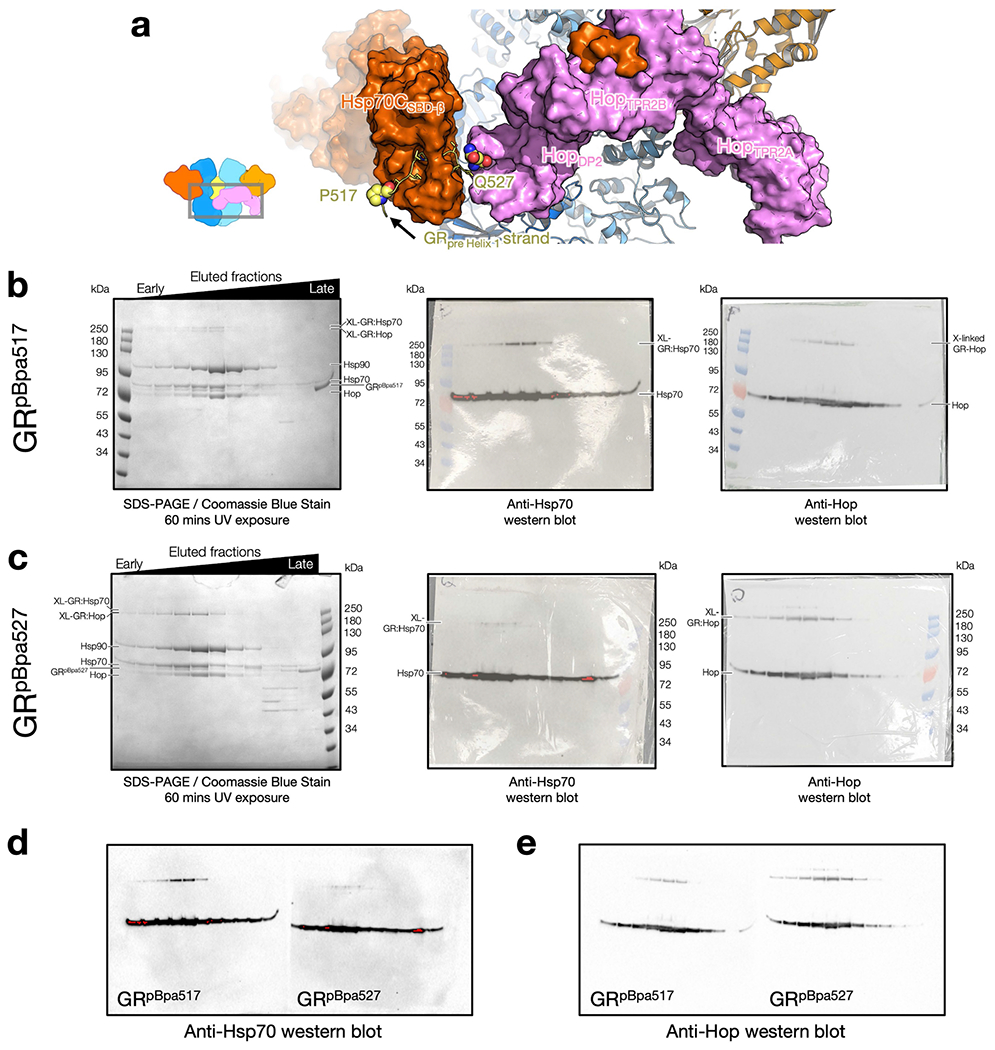
a, The photoreactive cross-linker (pBpa) was placed at two positions in the GRpre-Helix1 strand, residues before (GRP517, sphere presentation) and after (GRQ527, sphere representation) the predicted Hsp70-binding site (GR519–526, stick representation). b, c, Whole fractions of GR-loading complex eluted from the size-exclusion column were exposed to UV using a gel imager (see also Methods). As expected, at both positions, cross-links between GR and Hsp70 were formed in the GR-loading complex, indicated by high molecular weight species. Left, SDS–PAGE stained with Coomassie blue. Middle, anti-Hsp70 Western blot. Right, anti-Hop Western blot. Data from (b, c) are from one experiment. Hsp70 cross-linking efficiency was higher for the GRpBpa517position (b, middle) than for the GRpBpa527 position (c, middle). It is likely because 1) the C-terminal end of the Hsp70-bound substrate tends to be flexible in the reverse binding mode, as indicated by high atomic B-factors and missing density from previously determined Hsp70 crystal structures with a reverse peptide bound (PDB ID: 4EZZ, 4EZQ, 4EZT, and 4EZY)60, and 2) GR527 is closer to Hop543 than Hsp70. In addition, the two positions were able to cross-link with Hop (b, c, right), indicating it is the client-loading Hsp70 that the GRpre-Helix 1 strand cross-linked with, rather than the scaffolding Hsp70. Note that although the GR517position is not adjacent to Hop in the GR-loading complex model, we reasoned that the cross-link may be formed in the one-Hsp70 loading complex (b, right). These results demonstrate that it is the GRpre-Helix 1 strand bound to Hsp70C, supporting our structural model. d, e, Raw western blots from middle and right panels in b, c. Red pixels in the western blots shown indicate overexposure.
Supplementary Material
Acknowledgements
We thank members of the Agard laboratory for discussions; T. W. Owens for advising on the photoreactive cross-linking experiment; D. Bulkley, G. Gilbert, E. Tse and Z. Yu from the W.M. Keck Foundation Advanced Microscopy Laboratory at the University of California San Francisco (UCSF) for maintaining the electron microscopy facility and helping with data collection; and M. Harrington and J. Baker-LePain for computational support with the UCSF Wynton cluster. R.Y.-R.W. thanks D. Elnatan for various support in biochemistry at the initial stage of the project. R.Y.-R.W. was a Howard Hughes Medical Institute Fellow of the Life Sciences Research Foundation. C.M.N. is a National Cancer Institute Ruth L. Kirschstein Predoctoral Individual NRSA Fellow. The work was supported by funding from Howard Hughes Medical Institute (D.A.A.) and NIH grants R35GM118099 (D.A.A.), S10OD020054 (D.A.A.), S10OD021741 (D.A.A.), P20GM104420 (J.L.J.) and R01GM127675 (J.L.J.).
Footnotes
Online content
Any methods, additional references, Nature Research reporting summaries, source data, extended data, supplementary information, acknowledgements, peer review information; details of author contributions and competing interests; and statements of data and code availability are available at https://doi.org/10.1038/s41586-021-04252-1.
Competing interests The authors declare no competing interests.
Supplementary information The online version contains supplementary material available at https://doi.org/10.1038/s41586-021-04252-1.
Peer review information Nature thanks Oscar Llorca, Matthias Mayer and the other, anonymous, reviewer(s) for their contribution to the peer review of this work. Peer reviewer reports are available.
Data availability
The electron microscopy maps and atomic model have been deposited into the Electron Microscopy Data Bank (EMDB) and the PDB. The accession codes for the GR-loading complex are EMD-23050 and 7KW7. Focused maps used for model refinements were also deposited with accession codes denoted in Supplementary Table 2 (EMD-23051, EMD-23053, EMD-23054, EMD-23055 and EMD-23056).
References
- 1.Kim YE, Hipp MS, Bracher A, Hayer-Hartl M & Hartl FU Molecular chaperone functions in protein folding and proteostasis. Annu. Rev. Biochem 82, 323–355 (2013). [DOI] [PubMed] [Google Scholar]
- 2.Genest O, Wickner S & Doyle SM Hsp90 and Hsp70 chaperones: collaborators in protein remodeling. J. Biol. Chem 294, 2109–2120 (2019). [DOI] [PMC free article] [PubMed] [Google Scholar]
- 3.Lorenz OR et al. Modulation of the Hsp90 chaperone cycle by a stringent client protein. Mol. Cell 53, 941–953 (2014). [DOI] [PubMed] [Google Scholar]
- 4.Picard D et al. Reduced levels of hsp90 compromise steroid receptor action in vivo. Nature 348, 166–168 (1990). [DOI] [PubMed] [Google Scholar]
- 5.Nathan DF, Vos MH & Lindquist S In vivo functions of the Saccharomyces cerevisiae Hsp90 chaperone. Proc Natl Acad. Sci. USA 94, 12949–12956 (1997). [DOI] [PMC free article] [PubMed] [Google Scholar]
- 6.Smith DF & Toft DO Minireview: the intersection of steroid receptors with molecular chaperones: observations and questions. Mol. Endocrinol 22, 2229–2240 (2008). [DOI] [PMC free article] [PubMed] [Google Scholar]
- 7.Pratt WB, Morishima Y, Murphy M & Harrell M in Molecular Chaperones in Health and Disease (eds Starke K & Gaestel M) 111–138 (2006). [Google Scholar]
- 8.Kirschke E, Goswami D, Southworth D, Griffin PR & Agard DA Glucocorticoid receptor function regulated by coordinated action of the Hsp90 and Hsp70 chaperone cycles. Cell 157, 1685–1697 (2014). [DOI] [PMC free article] [PubMed] [Google Scholar]
- 9.Noddings C, Wang RY-R, Johnson JL & Agard DA Structure of Hsp90–p23–GR reveals the Hsp90 client-remodelling mechanism. Nature 10.1038/s41586-021-04236-1 (2021). [DOI] [PMC free article] [PubMed] [Google Scholar]
- 10.Rosenzweig R, Nillegoda NB, Mayer MP & Bukau B The Hsp70 chaperone network. Nat. Rev. Mol. Cell Biol 20, 665–680 (2019). [DOI] [PubMed] [Google Scholar]
- 11.Taipale M, Jarosz DF & Lindquist S HSP90 at the hub of protein homeostasis: emerging mechanistic insights. Nat. Rev. Mol. Cell Biol 11, 515–528 (2010). [DOI] [PubMed] [Google Scholar]
- 12.Whitesell L & Lindquist SL HSP90 and the chaperoning of cancer. Nat. Rev. Cancer 5, 761–772 (2005). [DOI] [PubMed] [Google Scholar]
- 13.Lackie RE et al. The Hsp70/Hsp90 chaperone machinery in neurodegenerative diseases. Front. Neurosci 11, 254 (2017). [DOI] [PMC free article] [PubMed] [Google Scholar]
- 14.Mayer MP & Gierasch LM Recent advances in the structural and mechanistic aspects of Hsp70 molecular chaperones. J. Biol. Chem 294, 2085–2097 (2019). [DOI] [PMC free article] [PubMed] [Google Scholar]
- 15.Krukenberg KA, Street TO, Lavery LA & Agard DA Conformational dynamics of the molecular chaperone Hsp90. Q. Rev. Biophys 44, 229–255 (2011). [DOI] [PMC free article] [PubMed] [Google Scholar]
- 16.Schopf FH, Biebl MM & Buchner J The HSP90 chaperone machinery. Nat. Rev. Mol. Cell Biol 18, 345–360 (2017). [DOI] [PubMed] [Google Scholar]
- 17.Boysen M, Kityk R & Mayer MP Hsp70- and Hsp90-mediated regulation of the conformation of p53 DNA binding domain and p53 cancer variants. Mol. Cell 74, 831–843 (2019). [DOI] [PubMed] [Google Scholar]
- 18.Dahiya V et al. Coordinated conformational processing of the tumor suppressor protein p53 by the Hsp70 and Hsp90 chaperone machineries. Mol. Cell 74, 816–830 (2019). [DOI] [PubMed] [Google Scholar]
- 19.Moran Luengo T, Kityk R, Mayer MP & Rudiger SGD Hsp90 breaks the deadlock of the Hsp70 chaperone system. Mol. Cell 70, 545–552 (2018). [DOI] [PubMed] [Google Scholar]
- 20.Morgner N et al. Hsp70 forms antiparallel dimers stabilized by post-translational modifications to position clients for transfer to Hsp90. Cell Rep. 11, 759–769 (2015). [DOI] [PMC free article] [PubMed] [Google Scholar]
- 21.Nathan DF & Lindquist S Mutational analysis of Hsp90 function: interactions with a steroid receptor and a protein kinase. Mol. Cell. Biol 15, 3917–3925 (1995). [DOI] [PMC free article] [PubMed] [Google Scholar]
- 22.Bohen SP & Yamamoto KR Isolation of Hsp90 mutants by screening for decreased steroid receptor function. Proc. Natl Acad. Sci. USA 90, 11424–11428 (1993). [DOI] [PMC free article] [PubMed] [Google Scholar]
- 23.Kravats AN et al. Functional and physical interaction between yeast Hsp90 and Hsp70. Proc. Natl Acad. Sci. USA 115, E2210–E2219 (2018). [DOI] [PMC free article] [PubMed] [Google Scholar]
- 24.Doyle SM et al. Intermolecular interactions between Hsp90 and Hsp70. J. Mol. Biol 431, 2729–2746 (2019). [DOI] [PMC free article] [PubMed] [Google Scholar]
- 25.Genest O, Hoskins JR, Kravats AN, Doyle SM & Wickner S Hsp70 and Hsp90 of E. coli directly interact for collaboration in protein remodeling. J. Mol. Biol 427, 3877–3889 (2015). [DOI] [PMC free article] [PubMed] [Google Scholar]
- 26.Flynn JM et al. Comprehensive fitness maps of Hsp90 show widespread environmental dependence. eLife 9, e58310 (2020). [DOI] [PMC free article] [PubMed] [Google Scholar]
- 27.Genest O, Hoskins JR, Camberg JL, Doyle SM & Wickner S Heat shock protein 90 from Escherichia coli collaborates with the DnaK chaperone system in client protein remodeling. Proc. Natl Acad. Sci. USA 108, 8206–8211 (2011). [DOI] [PMC free article] [PubMed] [Google Scholar]
- 28.Sung N et al. 2.4 A resolution crystal structure of human TRAP1NM, the Hsp90 paralog in the mitochondrial matrix. Acta Crystallogr. D 72, 904–911 (2016). [DOI] [PMC free article] [PubMed] [Google Scholar]
- 29.Sun M, Kotler JLM, Liu S & Street TO The endoplasmic reticulum (ER) chaperones BiP and Grp94 selectively associate when BiP is in the ADP conformation. J. Biol. Chem 294, 6387–6396 (2019). [DOI] [PMC free article] [PubMed] [Google Scholar]
- 30.Kirschke E, Roe-Zurz Z, Noddings C & Agard D The interplay between Bag-1, Hsp70, and Hsp90 reveals that inhibiting Hsp70 rebinding is essential for glucocorticoid receptor activity. Preprint at 10.1101/2020.05.03.075523 (2020). [DOI] [Google Scholar]
- 31.Mandal AK et al. Hsp110 chaperones control client fate determination in the hsp70-Hsp90 chaperone system. Mol. Biol. Cell 21, 1439–1448 (2010). [DOI] [PMC free article] [PubMed] [Google Scholar]
- 32.Sahasrabudhe P, Rohrberg J, Biebl MM, Rutz DA & Buchner J The plasticity of the Hsp90 co-chaperone System. Mol. Cell 67, 947–961 (2017). [DOI] [PubMed] [Google Scholar]
- 33.Schmid AB et al. The architecture of functional modules in the Hsp90 co-chaperone Sti1/Hop. EMBO J. 31, 1506–1517 (2012). [DOI] [PMC free article] [PubMed] [Google Scholar]
- 34.Southworth DR & Agard DA Client-loading conformation of the Hsp90 molecular chaperone revealed in the cryo-EM structure of the human Hsp90:Hop complex. Mol. Cell 42, 771–781 (2011). [DOI] [PMC free article] [PubMed] [Google Scholar]
- 35.Lee CT, Graf C, Mayer FJ, Richter SM & Mayer MP Dynamics of the regulation of Hsp90 by the co-chaperone Sti1. EMBO J. 31, 1518–1528 (2012). [DOI] [PMC free article] [PubMed] [Google Scholar]
- 36.Reidy M, Kumar S, Anderson DE & Masison DC Dual roles for yeast Sti1/Hop in regulating the Hsp90 chaperone cycle. Genetics 209, 1139–1154 (2018). [DOI] [PMC free article] [PubMed] [Google Scholar]
- 37.Verba KA et al. Atomic structure of Hsp90–Cdc37–Cdk4 reveals that Hsp90 traps and stabilizes an unfolded kinase. Science 352, 1542–1547 (2016). [DOI] [PMC free article] [PubMed] [Google Scholar]
- 38.Suren T et al. Single-molecule force spectroscopy reveals folding steps associated with hormone binding and activation of the glucocorticoid receptor. Proc. Natl Acad. Sci. USA 115, 11688–11693 (2018). [DOI] [PMC free article] [PubMed] [Google Scholar]
- 39.Bohen SP Hsp90 mutants disrupt glucocorticoid receptor ligand binding and destabilize aporeceptor complexes. J. Biol. Chem 270, 29433–29438 (1995). [DOI] [PubMed] [Google Scholar]
- 40.Hawle P et al. The middle domain of Hsp90 acts as a discriminator between different types of client proteins. Mol. Cell. Biol 26, 8385–8395 (2006). [DOI] [PMC free article] [PubMed] [Google Scholar]
- 41.Genest O et al. Uncovering a region of heat shock protein 90 important for client binding in E. coli and chaperone function in yeast. Mol. Cell 49, 464–473 (2013). [DOI] [PMC free article] [PubMed] [Google Scholar]
- 42.Liu Y et al. Cryo-EM structures reveal a multistep mechanism of Hsp90 activation by co-chaperone Aha1. Preprint at 10.1101/2020.06.30.180695 (2020). [DOI] [Google Scholar]
- 43.Rutz DA et al. A switch point in the molecular chaperone Hsp90 responding to client interaction. Nat. Commun 9, 1472 (2018). [DOI] [PMC free article] [PubMed] [Google Scholar]
- 44.Li C et al. FastCloning: a highly simplified, purification-free, sequence- and ligation-independent PCR cloning method. BMC Biotechnol. 11, 92 (2011). [DOI] [PMC free article] [PubMed] [Google Scholar]
- 45.Chin JW, Martin AB, King DS, Wang L & Schultz PG Addition of a photocrosslinking amino acid to the genetic code of Escherichia coli. Proc. Natl Acad. Sci. USA 99, 11020–11024 (2002). [DOI] [PMC free article] [PubMed] [Google Scholar]
- 46.Obermann WM, Sondermann H, Russo AA, Pavletich NP & Hartl FU In vivo function of Hsp90 is dependent on ATP binding and ATP hydrolysis. J. Cell Biol 143, 901–910 (1998). [DOI] [PMC free article] [PubMed] [Google Scholar]
- 47.Schorb M, Haberbosch I, Hagen WJH, Schwab Y & Mastronarde DN Software tools for automated transmission electron microscopy. Nat. Methods 16, 471–477 (2019). [DOI] [PMC free article] [PubMed] [Google Scholar]
- 48.Zheng SQ et al. MotionCor2: anisotropic correction of beam-induced motion for improved cryo-electron microscopy. Nat. Methods 14, 331–332 (2017). [DOI] [PMC free article] [PubMed] [Google Scholar]
- 49.Rohou A & Grigorieff N CTFFIND4: fast and accurate defocus estimation from electron micrographs. J. Struct. Biol 192, 216–221 (2015). [DOI] [PMC free article] [PubMed] [Google Scholar]
- 50.Scheres SH RELION: implementation of a Bayesian approach to cryo-EM structure determination. J. Struct. Biol 180, 519–530 (2012). [DOI] [PMC free article] [PubMed] [Google Scholar]
- 51.Zivanov J et al. New tools for automated high-resolution cryo-EM structure determination in RELION-3. Elife 7, e42166 (2018). [DOI] [PMC free article] [PubMed] [Google Scholar]
- 52.Bai XC, Rajendra E, Yang G, Shi Y & Scheres SH Sampling the conformational space of the catalytic subunit of human gamma-secretase. Elife 4, e11182 (2015). [DOI] [PMC free article] [PubMed] [Google Scholar]
- 53.Leman JK et al. Macromolecular modeling and design in Rosetta: recent methods and frameworks. Nat. Methods 17, 665–680 (2020). [DOI] [PMC free article] [PubMed] [Google Scholar]
- 54.Li J et al. Structure insights into mechanisms of ATP hydrolysis and the activation of human heat-shock protein 90. Acta Biochim Biophys Sin 44, 300–306 (2012). [DOI] [PubMed] [Google Scholar]
- 55.Arakawa A, Handa N, Shirouzu M & Yokoyama S Biochemical and structural studies on the high affinity of Hsp70 for ADP. Protein Sci. 20, 1367–1379 (2011). [DOI] [PMC free article] [PubMed] [Google Scholar]
- 56.Zhang P, Leu JI, Murphy ME, George DL & Marmorstein R Crystal structure of the stress-inducible human heat shock protein 70 substrate-binding domain in complex with peptide substrate. PLoS ONE 9, e103518 (2014). [DOI] [PMC free article] [PubMed] [Google Scholar]
- 57.Wang RY et al. De novo protein structure determination from near-atomic-resolution cryo-EM maps. Nat. Methods 12, 335–338 (2015). [DOI] [PMC free article] [PubMed] [Google Scholar]
- 58.Schneider M et al. BiPPred: combined sequence- and structure-based prediction of peptide binding to the Hsp70 chaperone BiP. Proteins 84, 1390–1407 (2016). [DOI] [PubMed] [Google Scholar]
- 59.Gutierres MBB, Bonorino CBC & Rigo MM ChaperISM: improved chaperone binding prediction using position-independent scoring matrices. Bioinformatics 36, 735–741 (2020). [DOI] [PubMed] [Google Scholar]
- 60.Zahn M et al. Structural studies on the forward and reverse binding modes of peptides to the chaperone DnaK. J. Mol. Biol 425, 2463–2479 (2013). [DOI] [PubMed] [Google Scholar]
- 61.Soding J, Biegert A & Lupas AN The HHpred interactive server for protein homology detection and structure prediction. Nucleic Acids Res. 33, W244–W248 (2005). [DOI] [PMC free article] [PubMed] [Google Scholar]
- 62.Song Y et al. High-resolution comparative modeling with RosettaCM. Structure 21, 1735–1742 (2013). [DOI] [PMC free article] [PubMed] [Google Scholar]
- 63.Darby JF et al. Solution structure of the Hop TPR2A domain and investigation of target druggability by NMR, biochemical and in silico approaches. Sci. Rep 10, 16000 (2020). [DOI] [PMC free article] [PubMed] [Google Scholar]
- 64.DiMaio F, Zhang J, Chiu W & Baker D Cryo-EM model validation using independent map reconstructions. Protein Sci. 22, 865–868 (2013). [DOI] [PMC free article] [PubMed] [Google Scholar]
- 65.Wang RY et al. Automated structure refinement of macromolecular assemblies from cryo-EM maps using Rosetta. Elife 5, e17219 (2016). [DOI] [PMC free article] [PubMed] [Google Scholar]
- 66.Bledsoe RK et al. Crystal structure of the glucocorticoid receptor ligand binding domain reveals a novel mode of receptor dimerization and coactivator recognition. Cell 110, 93–105 (2002). [DOI] [PubMed] [Google Scholar]
- 67.Liu XD, Morano KA & Thiele DJ The yeast Hsp110 family member, Sse1, is an Hsp90 cochaperone. J. Biol. Chem 274, 26654–26660 (1999). [DOI] [PubMed] [Google Scholar]
- 68.Sondermann H et al. Structure of a Bag/Hsc70 complex: convergent functional evolution of Hsp70 nucleotide exchange factors. Science 291, 1553–1557 (2001). [DOI] [PubMed] [Google Scholar]
- 69.Polier S, Dragovic Z, Hartl FU & Bracher A Structural basis for the cooperation of Hsp70 and Hsp110 chaperones in protein folding. Cell 133, 1068–1079 (2008). [DOI] [PubMed] [Google Scholar]
- 70.Johnson JL, Halas A & Flom G Nucleotide-dependent interaction of Saccharomyces cerevisiae Hsp90 with the cochaperone proteins Sti1, Cpr6, and Sba1. Mol. Cell. Biol 27, 768–776 (2007). [DOI] [PMC free article] [PubMed] [Google Scholar]
- 71.Flom G, Weekes J, Williams JJ & Johnson JL Effect of mutation of the tetratricopeptide repeat and asparatate-proline 2 domains of Sti1 on Hsp90 signaling and interaction in Saccharomyces cerevisiae. Genetics 172, 41–51 (2006). [DOI] [PMC free article] [PubMed] [Google Scholar]
- 72.Street TO et al. Elucidating the mechanism of substrate recognition by the bacterial Hsp90 molecular chaperone. J. Mol. Biol 426, 2393–2404 (2014). [DOI] [PMC free article] [PubMed] [Google Scholar]
- 73.Kityk R, Kopp J & Mayer MP Molecular mechanism of J-domain-triggered ATP hydrolysis by Hsp70 chaperones. Mol. Cell 69, 227–237 e224 (2018). [DOI] [PubMed] [Google Scholar]
- 74.Dey B, Lightbody JJ & Boschelli F CDC37 is required for p60v-src activity in yeast. Mol. Biol. Cell 7, 1405–1417 (1996). [DOI] [PMC free article] [PubMed] [Google Scholar]
- 75.Kityk R, Kopp J, Sinning I & Mayer MP Structure and dynamics of the ATP-bound open conformation of Hsp70 chaperones. Mol. Cell 48, 863–874 (2012). [DOI] [PubMed] [Google Scholar]
Associated Data
This section collects any data citations, data availability statements, or supplementary materials included in this article.
Supplementary Materials
Data Availability Statement
The electron microscopy maps and atomic model have been deposited into the Electron Microscopy Data Bank (EMDB) and the PDB. The accession codes for the GR-loading complex are EMD-23050 and 7KW7. Focused maps used for model refinements were also deposited with accession codes denoted in Supplementary Table 2 (EMD-23051, EMD-23053, EMD-23054, EMD-23055 and EMD-23056).


