

Abstract
Background:
Psoriasis is an inflammatory, IL-17-driven skin disease in which autoantigen-induced CD8+ T cells have been identified as pathogenic drivers.
Objective:
Our study focused on comprehensively characterizing the phenotypic variation of CD8+ T cells in psoriatic lesions.
Methods:
We used single-cell RNA-seq to compare CD8+ T cell transcriptomic heterogeneity between psoriatic and healthy skin.
Results:
We identified 11 transcriptionally diverse CD8+ T cell subsets in psoriatic and healthy skin. Among several inflammatory subsets enriched in psoriatic skin, we observed two Tc17 subsets that were metabolically divergent, developmentally related, and expressed CXCL13, which we found to be a biomarker of psoriasis severity and which achieved comparable or greater accuracy than IL17A in a support vector machine classifier of psoriasis and healthy transcriptomes. Despite high co-inhibitory receptor expression in the Tc17 clusters, a comparison of these cells with melanoma-infiltrating CD8+ T cells revealed upregulated cytokine, cytolytic, and metabolic transcriptional activity in the psoriatic cells that differed from an exhaustion program.
Conclusion:
Using high resolution single cell profiling in tissue, we have uncovered the diverse landscape of CD8+ T cells in psoriatic and healthy skin, including two non-exhausted Tc17 subsets associated with disease severity.
Keywords: Single-cell RNA sequencing, Smart-seq2, psoriasis, CD8 T cell, T cell dysfunction, melanoma
Capsule Summary
Our findings provide a high-resolution comparison of cutaneous CD8+ T cells in psoriasis and healthy skin and elucidate the phenotypic distinctions between the chronic pathologies of autoimmunity and cancer.
Introduction
Psoriasis is a chronic, immune-mediated disease characterized by erythematous skin lesions consisting of hyperproliferating keratinocytes and a persistent inflammatory immune cell infiltrate. IL-17 is a central mediator of this disease, based on elevated expression of this cytokine in psoriatic lesions1 and the efficacy of psoriasis biologics that inhibit IL-172,3, the IL-17 receptor4, or IL-23, an upstream regulator of pathogenic IL-17 producing cells5–7. As IL-17 has been found to originate from several adaptive, innate, and non-hematopoietic cell types in psoriasis lesions and to exert similarly numerous effects on a variety of cell types8, many aspects of its signaling role in psoriasis remain to be understood.
Recent psoriasis studies have elucidated the pathogenic contribution of CD8+ T cells, which are increased in abundance within the lesion9. CD8+ T cells have been found to produce IL-17 and other inflammatory cytokines at sites of active psoriasis10,11 as well as within clinically resolved skin9, supporting a role for this T cell subset in the formation, persistence, and recurrence of psoriatic lesions.
At the same time, CD8+ T cells are currently understood to be phenotypically heterogeneous, with distinct functional characteristics (e.g. cytotoxic and cytokine producing capacity12) and anatomical distributions13 that have only begun to be identified. Some of these subsets are prominent in certain skin diseases such as psoriasis and vitiligo12 and may even influence different clinical features of a skin disease (e.g. localized vs diffuse erythema in cutaneous T cell lymphoma14), raising the question of how the range of CD8+ T cell phenotypes in psoriasis differs from healthy skin.
Recent characterization of ‘dysfunctional’ or ‘exhausted’ CD8+ T cells in cancer, chronic infection, and autoimmune disease also raises additional questions about the development and chronic pathogenic behavior of CD8+ T cells in psoriasis. T cell dysfunction, identified as a distinct cellular state in which canonical cytokine, cytotoxic, and proliferative functions are progressively lost at sites of disease, is thought to be driven primarily by chronic antigen stimulation15. While cutaneous autoantigens capable of chronically inducing the expression of IL-17 and other inflammatory cytokines in CD8+ T cells have been discovered in psoriatic lesions16,17, the extent to which CD8+ T cell dysfunction occurs in this disease has not been investigated.
In this study, we survey the phenotypic heterogeneity of CD8+ T cells in healthy and psoriatic skin using single-cell transcriptomics. We identify subsets of CD8+ T cells common to both psoriatic and healthy skin, as well as subsets that are specific to each condition. We then describe the functional characteristics of these subsets, focusing on those that are specific to psoriasis, and evaluate the extent of CD8+ T cell dysfunction in psoriatic lesions compared to melanoma.
Methods
Patient recruitment
This study was approved by the institutional review board of the University of California, San Francisco. Study participants providing written informed consent underwent a skin exam and completed a questionnaire (see Methods in the Online Repository Materials for patient selection details). We also obtained four 5-mm skin biopsies from each subject, which were stored on gauze dampened with phosphate buffered saline (PBS) and kept at 4 °C until further processing. Healthy control tissue was obtained from the discarded skin of healthy subjects receiving abdominoplasty.
Cell sorting and library preparation
Skin punch biopsies were immediately stored at 4 °C in a container with sterile gauze and PBS until processed. Tissue was trimmed to remove hair and subcutaneous adipose, finely minced, and incubated overnight with 5% CO2 in RPMI 1640 containing Collagenase Type IV (Worthington LS04188), DNAse (Sigma-Aldrich DN25–1G), 10% FBS, 1% HEPES, and 1% Penicillin/Streptavidin. Harvested cell suspensions were filtered, centrifuged, counted, and sorted for CD8+ T cells. Staining methods are further described in the Methods in the Online Repository Materials.
Full length cDNA synthesis of each cell was performed using the SMART-Seq v4 Ultra Low Input Kit with the following specifications and modifications. All reactions were prepared with a MANTIS liquid handler (Formulatrix) to allow miniaturization of the reaction volume to half of the manufacturer’s recommended volume. Aliquots of 0.4 μL of 1:4,000,000 diluted External RNA Controls Consortium (ERCC) RNA Spike-In (Thermo Fisher Scientific, cat. 4456740) were added to each cell lysate prior to the First-Strand Synthesis step. LD PCR was performed for 19 cycles. Purification of cDNA was performed using Agencourt AMPure XP beads (Beckman Coulter, cat. A63881) and quantified using the QuantIT PicoGreen dsDNA Assay Kit (Invitrogen, cat. P7589). Sequencing libraries were prepared using the Nextera XT DNA Sample Preparation Kit (Illumina, cat. FC-131-1096), quality-checked using the Bioanalyzer High Sensitivity DNA Kit (Agilent, cat. 5067–4626), and quantified by NEBNext library quantification kit for Illumina (New England Biolab, cat. E7630L).
Read sequencing and processing
150-bp paired-end sequencing was performed on an Illumina HiSeq 4000. We used STAR 2.4.2a18 to map sequenced reads from each cell to the GRCh38 build of the human reference genome provided by the Genome Analysis Toolkit (https://console.cloud.google.com/storage/browser/genomics-public-data/resources/broad/hg38/v0/Homo_sapiens_assembly38.fasta) that was annotated by GENCODE 25 and appended with the 92 reference sequences of the ERCC spike-in standard. Read counts for each transcript were tallied using HTSeq 0.6.1p119 and imported into R 3.4.220. Raw single-cell RNA-seq data were deposited in GEO (GSE146264), with processed data (as unnormalized counts) attached as a supplementary file.
Gene expression analysis
Cell QC and normalization
Using the scater 1.2.0 R package21, we excluded low-quality cells (< 100,000 mapped reads, < 1,000 mapped genes, > 25% reads mapped to ERCC, or > 25% reads mapped to mitochondrial genes). We also excluded genes that were not detected with at least 5 transcripts in at least two cells. Read counts across libraries were then adjusted by RUVg (k = 50, drop = 1), as implemented in the RUVSeq 1.8.0 R package22, on ERCC spike-in counts to control for batch, depth, and other technical confounding effects. Adjusted counts were then normalized by sequencing depth for each cell, multiplied by 2,500,000, incremented by 1, and log-transformed in the Seurat 3.1.1 R package23.
Clustering
In Seurat, cells were clustered by first performing principal components analysis (PCA) on 1,311 highly variable genes (see Table E2 in the Online Repository Materials) to maximally represent the variation across these genes in fewer dimensions. We used the ‘JackStrawPlot’ and ‘PCElbowPlot’ functions to select informative principal components, here PC1–6. The ‘FindClusters’ function (with default settings and resolution set to 1.0) was then used to perform unsupervised clustering on the informative PCs using the Louvain method, as described in the Seurat documentation at https://satijalab.org/seurat. Inter-cell variation across the first 10 principal components was visually summarized on two dimensions by constructing a uniform manifold approximation and projection (UMAP) plot using the Seurat ‘RunUMAP’ function with parameters n.neighbors = 30 and n.epochs = 200. The resulting plots were overlaid with patient demographic data (race, sex, BMI, etc.; see Table E1 in the Online Repository Materials) and inspected for confounding effects. Density-preserving UMAP was performed using the ‘densMAP’ function of the densmap24 Python package using the same parameters.
Differential expression analysis
Marker genes of each cluster were calculated using the Seurat ‘FindMarkers’ function to perform two-tailed Wilcoxon tests for each gene on the normalized, log-transformed expression values of cells in the cluster and cells not in the cluster, finally applying a Bonferroni correction across the tested genes and filtering for genes with adjusted p-value ≤ 0.05. Pathway annotation and enrichment for lists of DE genes were calculated using Ingenuity Pathway Analysis (Qiagen).
Melanoma comparison
Normalized single-cell expression data from Tirosh et al.25 was downloaded from the NCBI GEO database (https://www.ncbi.nlm.nih.gov/geo/query/acc.cgi?acc=GSE72056) and converted from log2(TPM/10 + 1) expression values to pseudocounts for import and normalization (as above) in Seurat. From 2,068 non-malignant cells that were annotated as T cells, we focused on a subset of 841 CD8+ T cells with CD8A and CD8B expression > 1 and CD4 expression < 1. PCA was performed on 999 highly variable genes (see Table E5 in the Online Repository Materials), and the first 10 PCs were used to perform clustering and construct a UMAP using default Seurat settings.
TCR analysis
TCR sequences were reconstructed using TraCeR26 on all cells, including those excluded from gene expression analysis. The CDR3 region from reconstructed TCR sequences output by TraCeR was used as the basis for clonotype and TCR-sharing inference and consisted of the IMGT nomenclature IDs (http://www.imgt.org/IMGTrepertoire/LocusGenes/) for the V and J genes along with the intervening nucleotide sequence. Cells were classified as being of the same clonotype if they shared identical CDR3 repertoires (i.e. matching set of CDR3 regions). TCR sharing was statistically evaluated by identifying the TCRs of each cluster that were found in at least one cell of at least one other cluster in the same subject. The proportion of instances of each shared TCR in each other cluster was calculated, and a Kruskal-Wallis test was performed on the resulting proportion data for all shared TCRs within a cluster to determine whether the average proportion of shared TCR instances was significantly different between any of the other clusters, followed by Mann-Whitney U tests between the proportions of each TCR shared between specific pairs of clusters. These comparisons were performed using the ‘kruskal.test’ and the ‘wilcox.test’ functions of the stats package in R, and significance was evaluated based on an FDR-adjusted p-value threshold of 0.05.
Functional and cell cycle scoring
Phenotype scoring of CD8+ T cells was performed using the ‘AddModuleScore’ function in Seurat 3.1.1 with default settings (see Methods in the Online Repository Materials).
RNAscope
FFPE skin sections of psoriatic skin (n=6), healthy skin (n=6), and eczematous skin (n=4) were obtained from the UCSF Dermatopathology Laboratory. A 4-plex RNAscope® assay was performed using RNAscope® Multiplex Fluorescent v2 kit (ACD Biosystems Cat. 323100) according to the manufacturer’s protocol for FFPE skin tissue (see Methods in the Online Repository Materials).
Expression of lesional CXCL13 in guselkumab-treated psoriasis patients
Expression of CXCL13 was evaluated in skin biopsies before and after treatment in a subset of psoriasis patients (n=17) who received guselkumab (100 mg at Weeks 0, 4, and 12 and every eight weeks thereafter through Week 44) in the VOYAGE 1 study7. Additional sampling details are described in the Methods in the Online Repository Materials. All skin samples were collected in RNALater RNA stabilization reagent (Qiagen, Valencia, CA, USA), and stored at −70°C until RNA extraction. RNA was extracted using Qiasymphony RNA Kit (QIAGEN, Valencia, CA, USA) and hybridized to GeneChip HT HG-U133+ PM 96-Array Plate (Affymetrix, Santa Clara, CA, USA). Gene expression measures in individual skin biopsies were determined at the probe set level (n = 54,715) using the RMA (Robust Multi-array Average) methodology.
Baseline serum levels of CXCL13 in psoriasis patients
Patient serum protein concentration levels at baseline were evaluated in a subset of psoriasis patients (n=39) who participated in the VOYAGE 2 clinical trial27. Serum samples were sent to SomaLogic Inc. (Boulder, Colorado, US), and CXCL13 was profiled using SomaLogic’s standard SOMAscan panel28. Assay quality control and data QC were performed following SomaLogic’s standard procedures, and serum protein levels were measured as log2RFU (log2 Relative Fluorescence Unit) values for down-stream analysis. Associations between protein levels and Psoriasis Area and Severity Index (PASI) scores at baseline were evaluated.
Results
Psoriasis lesions and healthy skin are populated by common subsets of CD8+ T cells as well as subsets that are specific to each condition
To survey the subsets of CD8+ T cells in psoriasis lesions and healthy skin, we performed deep single-cell RNA-seq on CD45+CD3+CD8+ cells sorted by flow cytometry from lesional skin biopsies of 11 psoriasis patients or control abdominal skin from 5 healthy individuals (see Table E1 in the Online Repository Materials). Of 7,304 input cells, a total of 4,575 cells (2,919 cells from the psoriasis subjects and 1,656 cells from healthy subjects) passed quality control filtering. On average, we obtained 2,419,280 mappable reads (66% of input) and detected 2,767 genes from each cell.
Healthy and psoriasis skin contained common phenotypic subsets of CD8+ T cells. We observed eleven clusters (subsets) of phenotypically distinct CD8+ T cells based on 1,311 genes that were highly variable among all 4,575 cells (Figure 1A, also see Table E2 in the Online Repository Materials). Each cluster comprised cells from several different subjects (Figure 1C), indicating its generalizability across individuals. In addition, many of these subsets could be found in both healthy and psoriatic skin, as Clusters 0, 1, 2, 4, 5, 7, and 8 contained substantial numbers of CD8+ T cells from both healthy and psoriasis subjects (Figure 1D).
Figure 1.
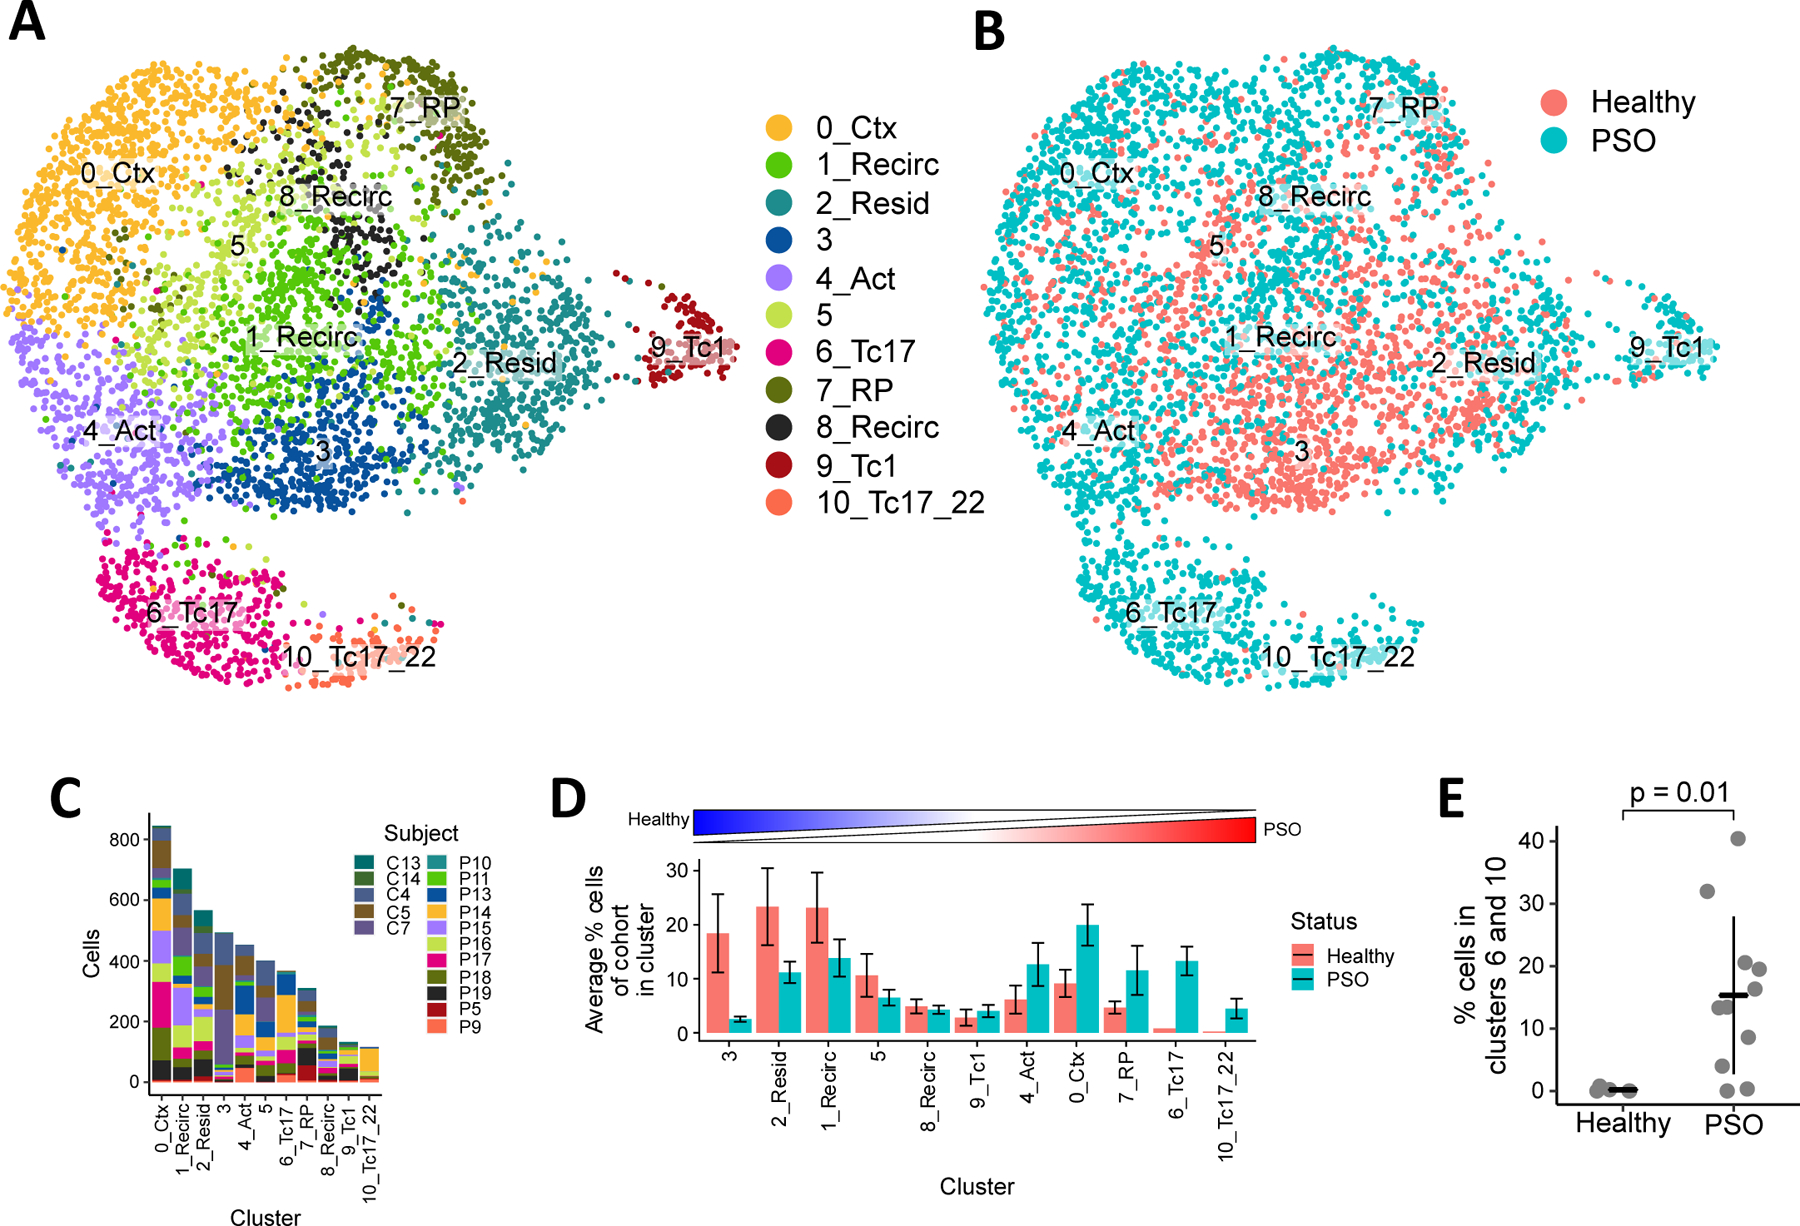
Heterogeneity of CD8+ T cells in healthy and psoriatic skin. Clustering of 4,575 CD8+ T cells shown in UMAPs colored by (A) cluster and (B) clinical status. (C) Composition of CD8+ T cells in each cluster by different subjects. (D) Average percentage of CD8+ T cells in each cluster out of all CD8+ T cells within each subject. Bar heights indicate the means across healthy or psoriasis subjects, error bars represent standard deviations. Clusters ordered from left to right by increasing ratio of healthy mean percentage to psoriasis mean percentage. (E) Proportion of cluster 6 and 10 cells in healthy and psoriatic subjects. Bars and whiskers represent means and standard deviations.
On the other hand, we also observed clusters that were highly specific to either healthy or psoriasis skin. Cluster 3 consisted mostly of cells from healthy subjects (88%) while clusters 6 and 10 consisted mostly of cells from psoriasis patients (>98%). These psoriasis-enriched clusters in particular were prevalent across the 11 psoriasis patients (10 patients with cluster 6 cells, 8 patients with cluster 10 cells) but represent a small population in our dataset, making up 20% of all CD8+ T cells sampled from psoriasis patients and, on average, 19% of the cells from each psoriasis patient (Figure 1D). Despite their low abundance, the proportion of cells in these clusters was significantly higher in psoriasis patients than healthy subjects (p = 0.010, Figure 1E), suggesting a pathogenic role for these CD8+ T cells within the lesion. A density-preserving projection24 of our dataset additionally suggested that the transcriptomic variability within these clusters may also be higher than common or health-associated clusters (see Figure E1 in the Online Repository Materials).
Distinct inflammatory CD8+ T cell subsets in psoriatic skin
We characterized the phenotypic differences between the eleven CD8+ T cell clusters by comparing their expression of known markers of T cell biology and by determining the marker genes significantly upregulated and downregulated in each cluster relative to all other cells (Figure 2A, also see Table E3 in the Online Repository Materials).
Figure 2.
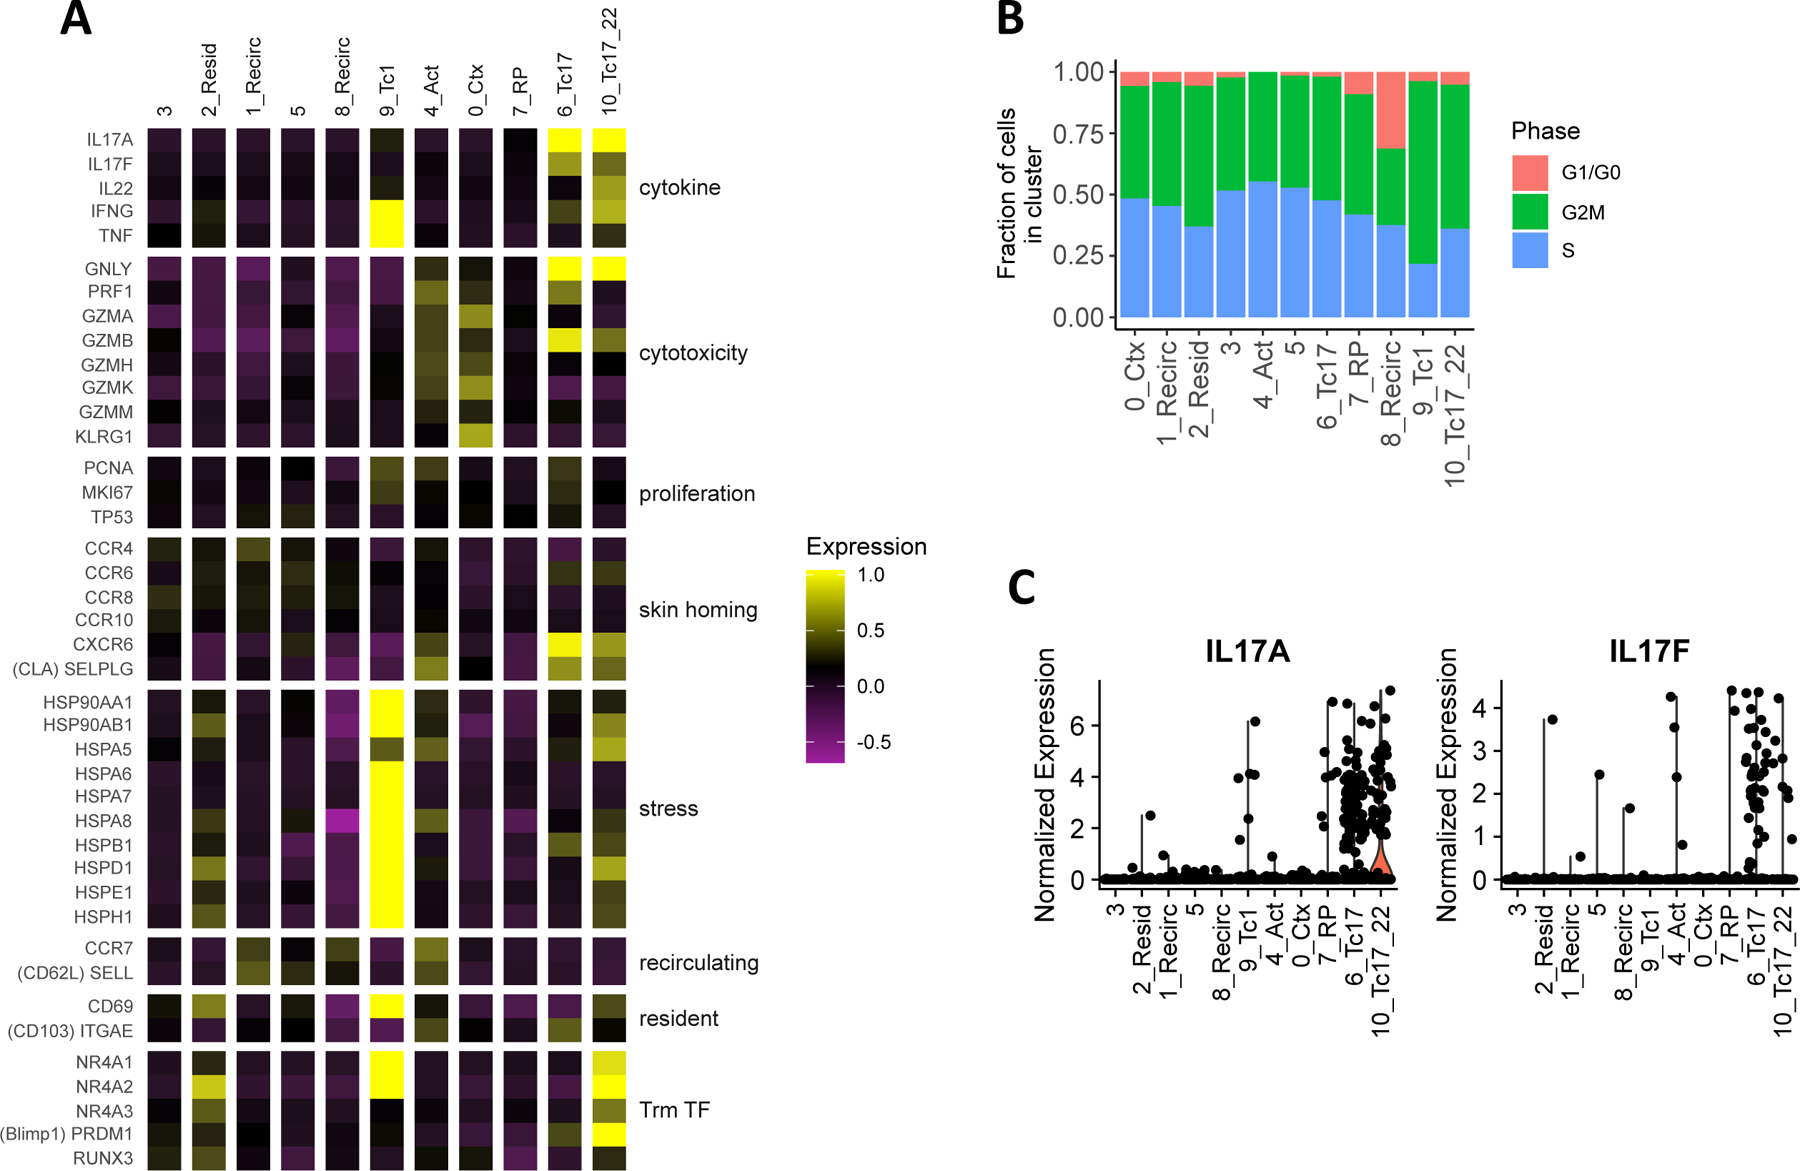
Specific inflammatory CD8+ T cell subtypes in psoriatic lesions. (A) Average expression in each cluster of marker genes for various T cell functions and characteristics. Each column represents the average mean-centered and scaled expression z-score of each gene (in rows) for the cells in a cluster. Color intensities outside of the z-score range [−1, 1] were set to the maximum and minimum of this range. (B) Cell cycle classification of cells in each cluster (C) Normalized log-transformed expression of IL17A and IL17F in each cluster.
CD8+ T cells isolated from healthy skin consisted of resident as well as recirculating subtypes. Within clusters relatively enriched (> 1.5-fold) in cells from healthy individuals (clusters 1, 2, 3, and 5, Figure 1D), we detected moderately higher expression of the skin homing chemokine receptors CCR4 and CCR829 compared to other cells (p < 10−21, Figure 2A). Among these clusters, high expression of CD69 (p < 10−23) and transcription factors involved in specifying tissue residence (RUNX3, NR4A2, and NR4A330,31, p < 10−5), coupled with lower expression of recirculating markers SELL (encoding CD62L) and CCR714 (though not significant), distinguished cluster 2 as a potentially resident subtype. The opposite pattern in clusters 1 and 8 suggested that these may be recirculating subtypes. Estimation of cell-cycle phase based on the average expression of phase-specific cell-cycle genes additionally revealed a higher proportion of G1/G0 phase cells in Cluster 8, suggesting that the cells of this subtype may be relatively quiescent (Figure 2B). Overall, limited inflammatory activity was detected among healthy skin CD8+ T cells, as, relative to all clusters in our dataset, the average expression of genes encoding inflammatory cytokines and cytolytic proteins was lowest in healthy-enriched clusters (Figure 2A).
In contrast, several of the CD8 clusters enriched in psoriatic lesions (clusters 0, 4, 6, 7, and 10) represented distinct inflammatory subtypes. These included the Tc1-like cluster 9, which highly expressed the Type I cytokine genes IFNG (p < 10−38) and TNF (p < 10−35, Figure 2A). Cells of cluster 0, on the other hand, represented a subtype with primarily cytotoxic effector function based on their limited expression of cytokines but high expression of genes encoding many cytolytic enzymes (GZMA, GZMK, p < 10−44) and the terminal effector marker KLRG1 (p < 10−52). Cluster 4 cells also expressed cytolytic genes, but the low expression of KLRG1 and the high expression of CCR7 (p < 10−6) and the inflammation homing marker CXCR332 (p < 10−10) in this cluster suggests that it may represent an early, activated precursor of one or more effector subtypes. Lastly, cluster 6 and 10, which consisted almost entirely of cells from psoriasis patients as noted above, were identified as two Tc17 subsets based on high expression of IL17A (p < 10−25) and IL17F (p < 10−22 for cluster 6, Figure 2C).
These Tc17 subsets displayed transcriptional activity for multiple effector functions in psoriatic lesions. The average expression of specific cytolytic genes (e.g. GNLY and GZMB (p < 0.03), as well as PRF1 in cluster 6 (p < 10−15), Figure 2A) was elevated in Tc17 clusters. Expression of at least one of the three cytotoxicity genes GZMB, GNLY, and PRF1 was detected in 91% of cluster 6 cells and 74% of cluster 10 cells, suggesting that these Tc17 subtypes may also have cytotoxic potential. Cluster 10 additionally expressed genes encoding other cytokines involved in psoriasis pathogenesis, such as IFNG and IL22, along with tissue residence transcription factors(Figure 2A). A more comprehensive calculation of differentially expressed genes between these Tc17 clusters and other cells (see Figure E2, Table E3 in the Online Repository Materials) revealed additional phenotypic and functional differences, as detailed below.
Tc17 subtypes express CXCL13, a biomarker of psoriasis severity
Besides co-expression of IL-17 pathway cytokines and cytolytic genes, another unique feature of psoriasis-associated clusters 6 and 10 is the expression of CXCL13 (Figure 3A, Table E3), a chemokine understood to mediate B cell recruitment to lymphoid tissues33. Like IL17A, high expression of CXCL13 was observed in a subset of the Tc17 clusters (see Figure E3 in the Online Repository Materials). This chemokine was significantly correlated with IL17A expression across all CD8+ T cells (Pearson’s r = 0.31, p < 10−15) and was co-expressed in roughly half of all IL17A-expressing CD8+ T cells (56%, Figure 3B), though IL17A and CXCL13 co-expressing cells represented a rare population in our dataset (1.6%) and within each psoriasis patient (average 2.8% of cells). In situ hybridization staining of psoriasis skin lesions confirmed the presence of CXCL13 mRNA in psoriatic but not in healthy CD8+ T cells (Figure 3C, D). While CXCL13 was also detected in CD8+ T cells from one of four patients with atopic dermatitis, CXCL13+IL17A+ CD8+ T cells appeared to be specific to psoriasis lesions.
Figure 3.
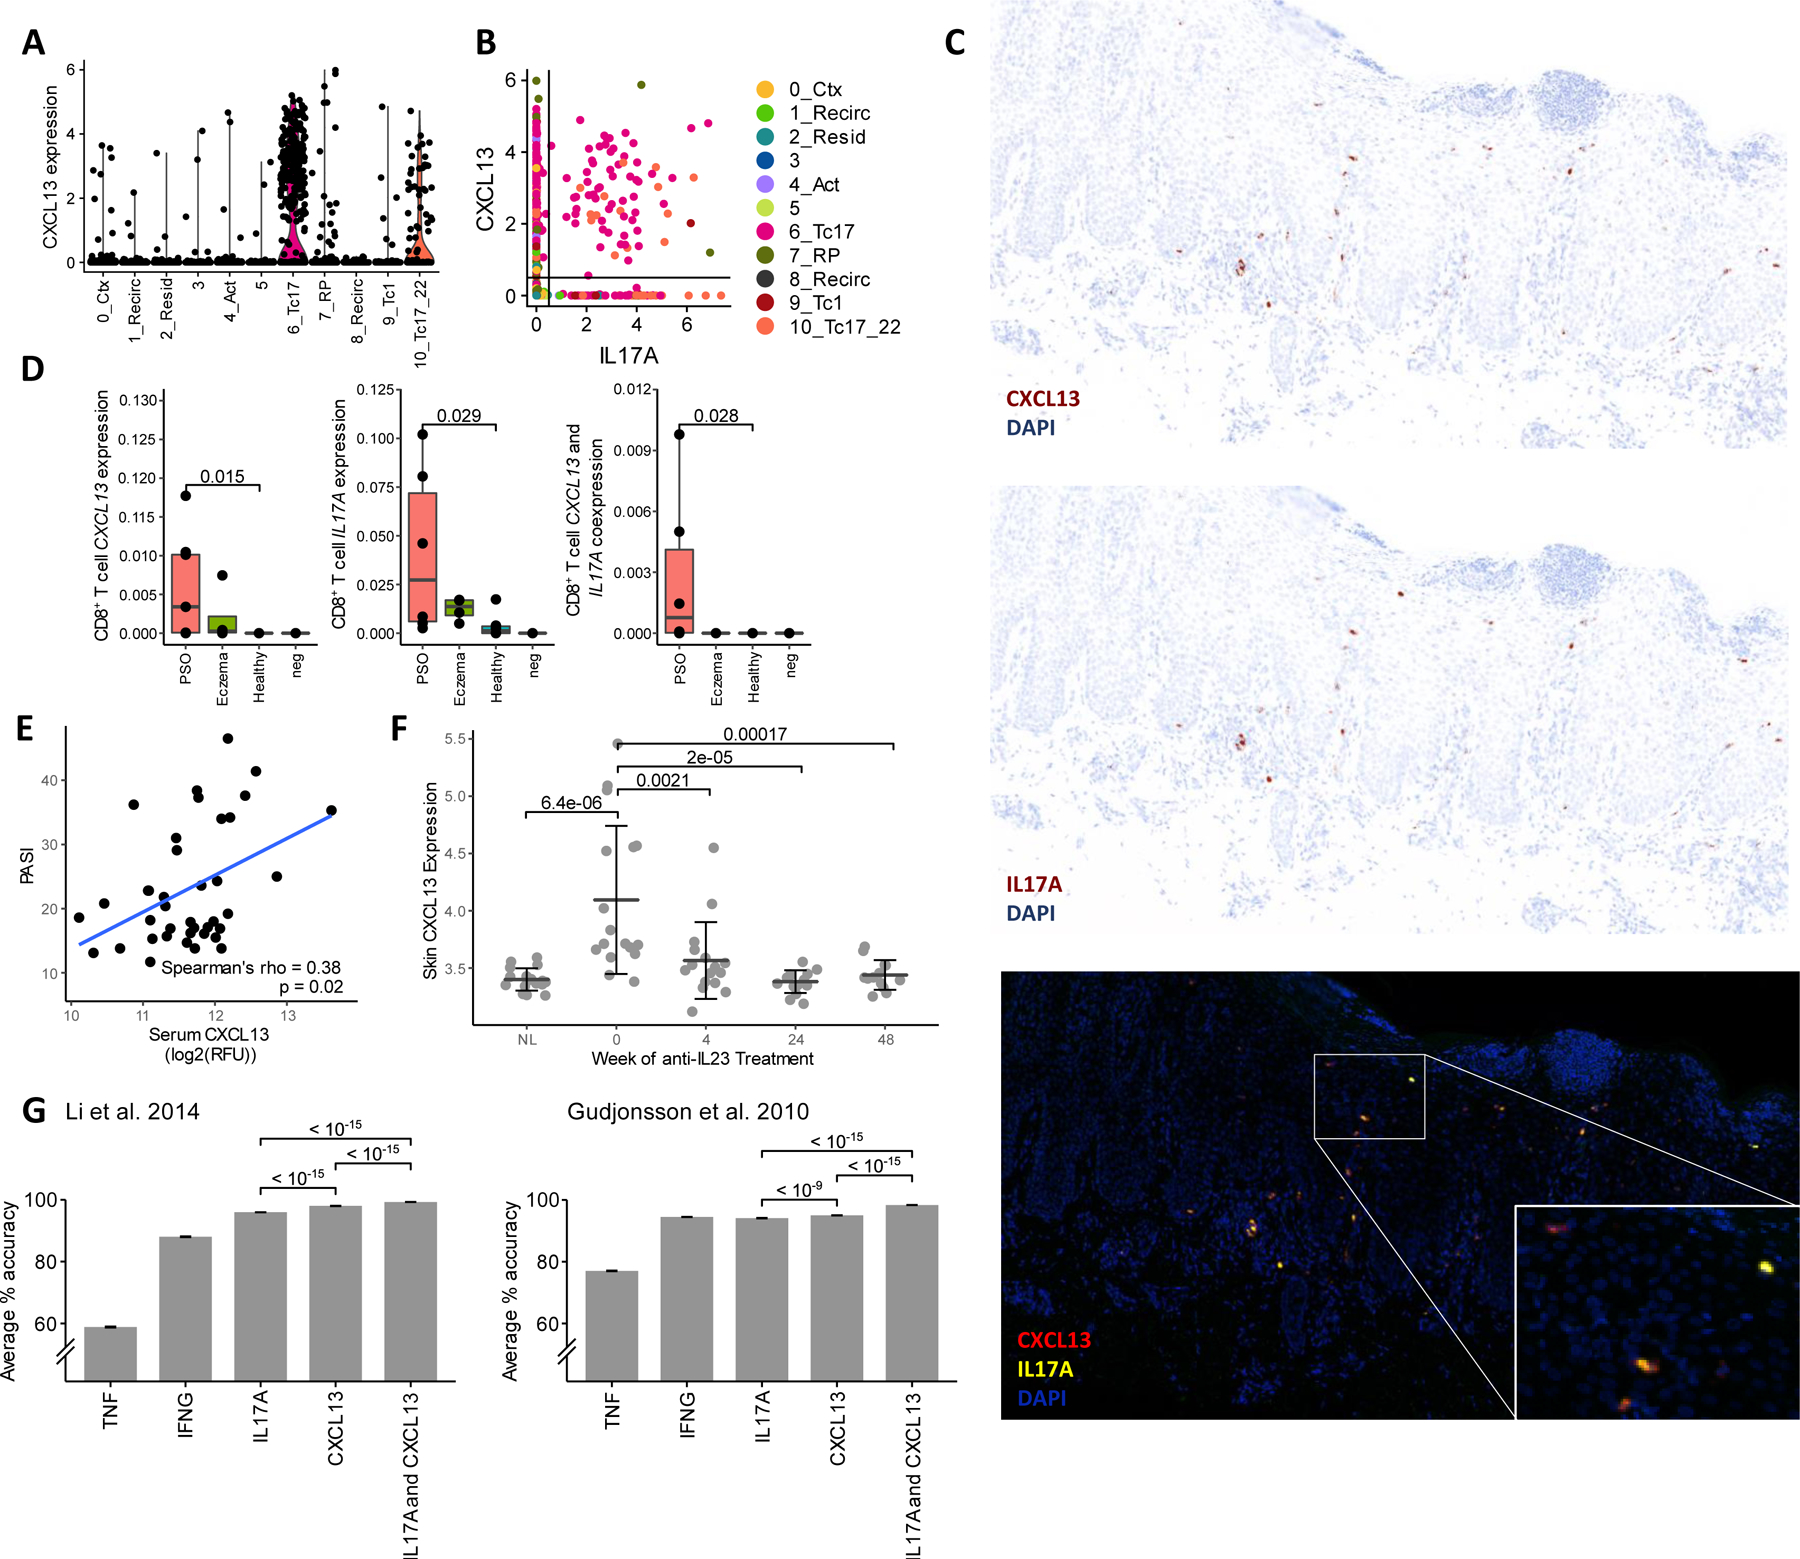
Tc17 subsets express CXCL13, a clinically relevant psoriasis biomarker. (A) CXCL13 expression and (B) co-expression with IL17A across all clusters. Points represent normalized, log-transformed count values for each cell. (C) RNAscope staining of CXCL13 and IL17A mRNA in psoriatic lesions. (D) CD8+ T cell-colocalized RNAscope fluorescence for (from left to right) CXCL13, IL17A, and both genes. Points represent proportion of pixels positive for CD8A, CD3E, and DAPI that are also positive for each gene(s) of interest in psoriatic skin (PSO, n=6), eczema skin (n = 4), healthy skin (n = 6), and control (n=2) slides. (E) Correlation of serum CXCL13 with PASI in VOYAGE 2 cohort. Trendline based on least squares regression. (F) Skin and lesional CXCL13 expression in VOYAGE 1 participants treated with guselkumab. Error bars = Mean ± SD. NL = non-lesional sites sampled at Week 0. (G) Average classification accuracy of 5-fold cross validated SVMs trained on Gudjonsson et al. 201035 (GSE13355) and Li et al. 201434 (GSE54456) datasets using different psoriasis-associated genes (n = 50 for each gene combination). P-values are shown for Wilcoxon tests between groups indicated by brackets.
Investigating the clinical significance of this chemokine, we found that serum concentrations of CXCL13 protein significantly correlated with PASI (Spearman’s rho = 0.38, p = 0.02, Figure 3E) in a cohort of 39 psoriasis patients from a previous phase III trial27. In a separate cohort of 17 patients from another trial7, CXCL13 gene expression in psoriatic lesions was significantly elevated at baseline, correlated with PASI (Pearson r = 0.535, p < 10−5), and reduced over time by the anti-IL-23 monoclonal antibody guselkumab (Figure 3F). An upregulation of CXCL13 in psoriatic lesions was similarly observed in a previous bulk RNA-seq study by Li et al.34, and using the 92 psoriatic and 82 healthy skin transcriptomes from this study, we additionally observed that support vector machine classification of healthy and psoriatic skin samples using CXCL13 expression achieved a high degree of accuracy either alone or in combination with IL17A (Figure 3G, also see Table E4 in the Online Repository Materials). Similar results were obtained from a microarray study by Gudjonsson et al.35 of 58 psoriatic and 64 healthy skin transcriptomes (Figure 3G, Table E4 in the Online Repository Materials). While expression of CXCR5, which encodes the best currently known receptor for CXCL13, was virtually absent among the CD8+ T cells in our single-cell data, this gene was significantly upregulated in one of these studies34, altogether indicating the potential clinical relevance of CXCL13 signaling.
Comparison of psoriasis and melanoma-infiltrating CD8+ T cells reveals a dysfunction-like phenotype in Tc17 clusters
CXCL13 expression has been reported in exhausted/dysfunctional tumor-infiltrating CD8+ T cells isolated from various cancers36–38, motivating a further examination of dysfunction characteristics within psoriasis-enriched clusters. Tirosh et al.25 previously developed a core dysfunction score based on a signature panel of 28 genes for melanoma-infiltrating CD8+ T cells. When we applied this score to the healthy and psoriatic CD8+ T cells in our study, the Tc17 clusters 6 and 10 scored highest (Figure 4A), while clusters 1, 3, and 8 scored the lowest, consistent with their naïve, recirculating phenotypes observed above. Analogous clustering of 841 tumor-infiltrating CD8+ T cells (TILs) from the Tirosh et al. study based on 999 highly variable genes (Table E5) likewise identified high- and low-dysfunction clusters (see Figure E4A, B in the Online Repository Materials), the latter of which, like clusters 1, 3, and 8 in our dataset, may represent naïve or recirculating cells based on high expression of SELL and CCR7 (Figure E4C).
Figure 4.
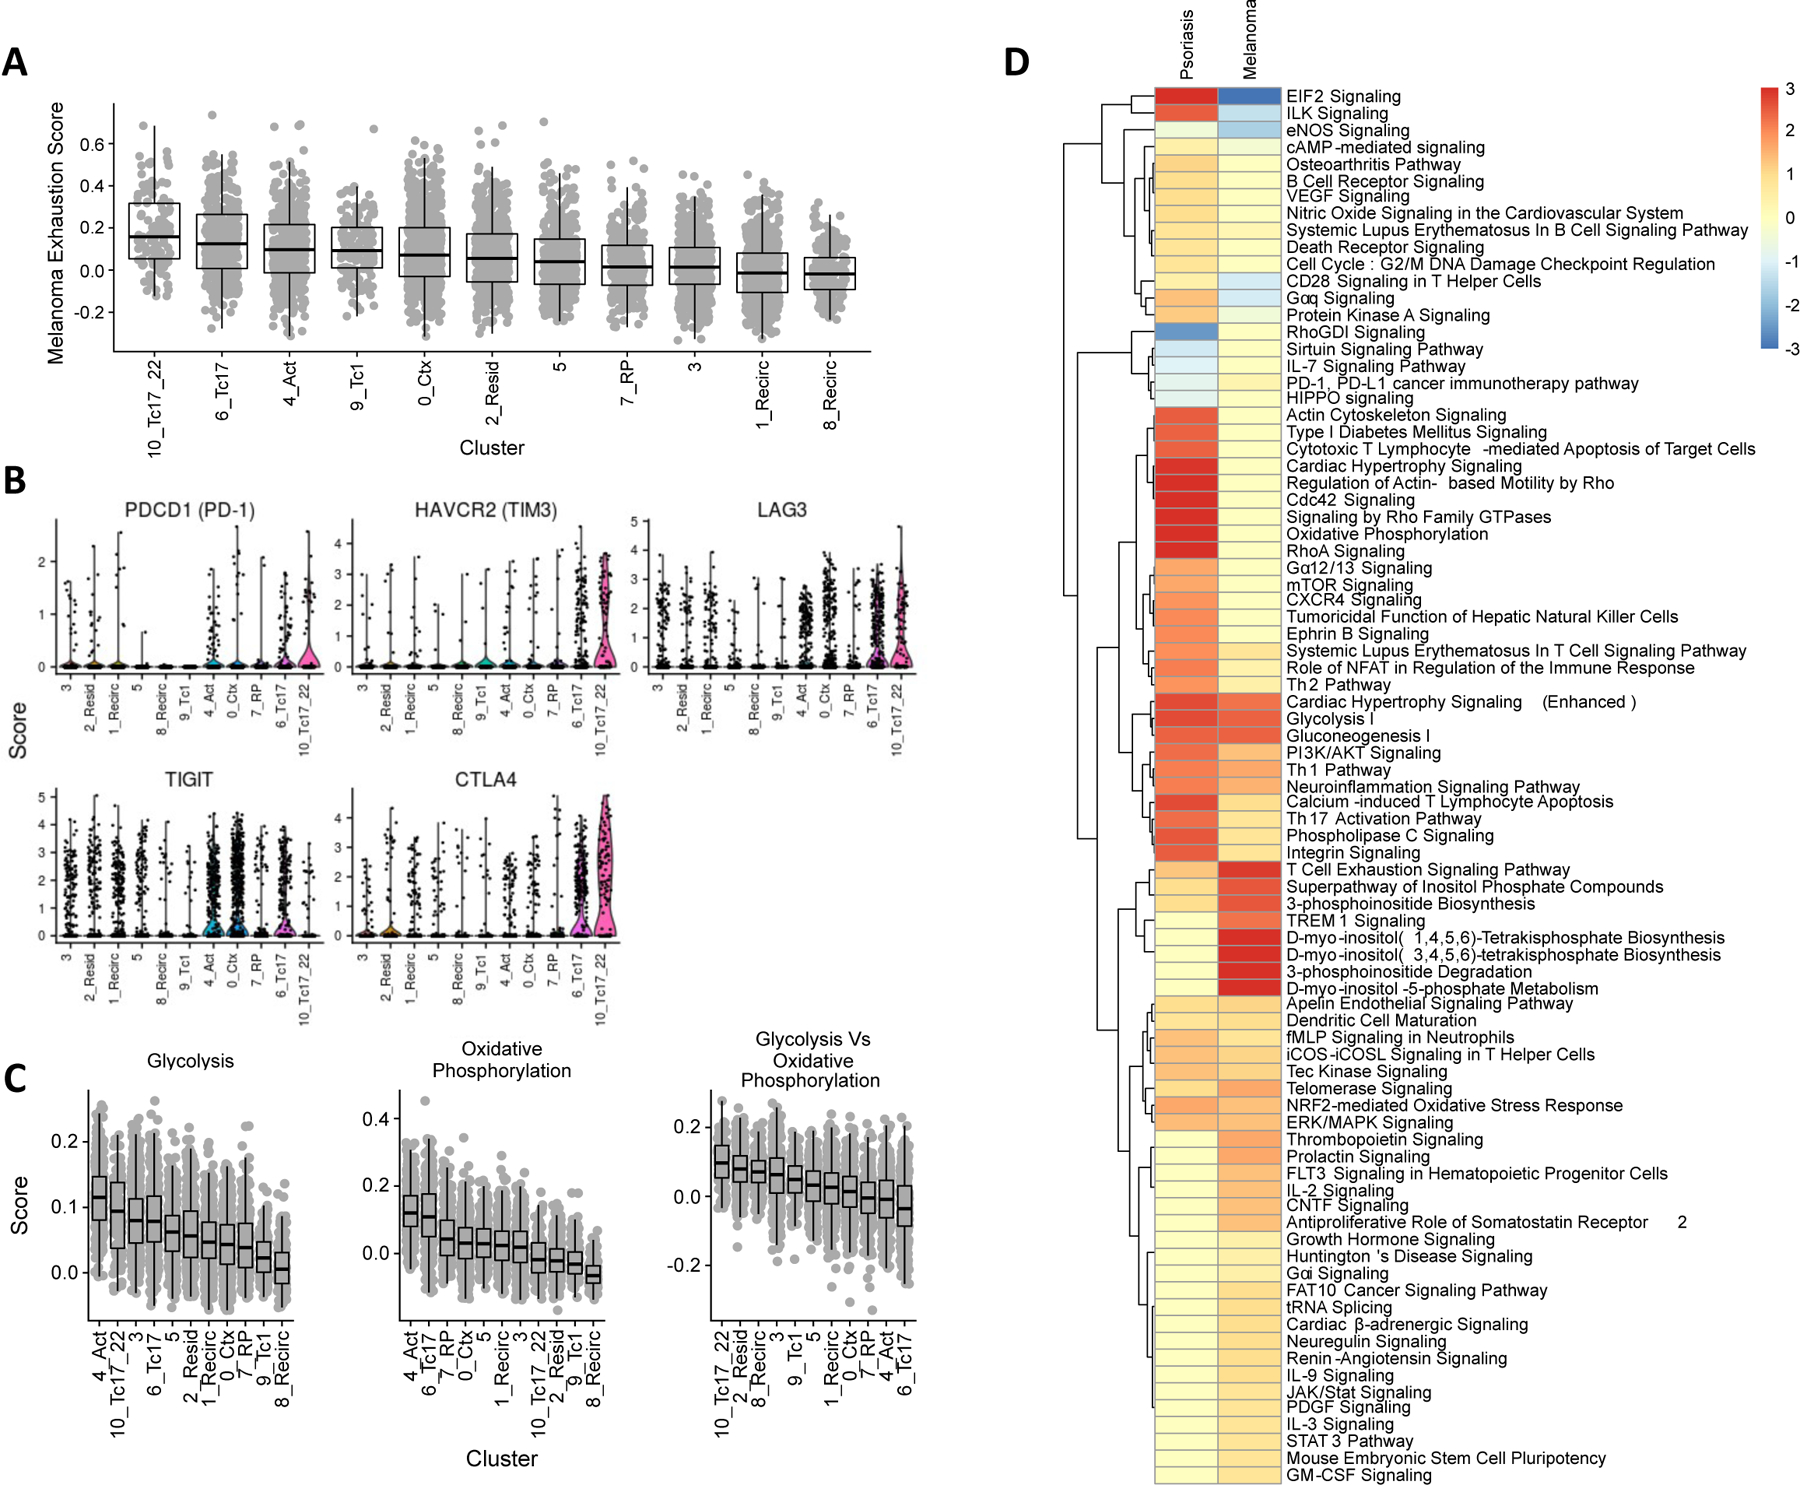
Dysfunction characteristics in psoriatic and melanoma-infiltrating CD8+ T cells. (A) Dysfunction scores of psoriasis and healthy skin CD8+ T cells in each cluster according to the core dysfunction signature from Tirosh et al. 2016. (B) Coinhibitory receptor expression across CD8+ T cell clusters. (C) Metabolic scoring of glycolysis and oxidative phosphorylation pathway gene expression, along with score difference, for each cell. (D) Common pathways represented by differentially-expressed genes between most exhausted vs least exhausted clusters in psoriasis (this study) and melanoma (Tirosh et al. 2016) CD8+ T cells.
We then compared CD8+ T cell dysfunction characteristics of psoriasis to melanoma by comparing 589 and 396 genes found to be differentially expressed between the high- and low-dysfunction clusters within each disease, respectively (see Table E6 in the Online Repository Materials). A set of 133 genes shared between the two lists contained multiple coinhibitory receptors, such as CTLA4, HAVCR2 (encoding TIM3), and LAG3 (Figure 4B). However, expression of PDCD1, which encodes a principal inhibitory marker of dysfunction, PD-1, was not prevalently detected nor significantly different between the Tc17 subtypes and other clusters despite being abundantly expressed in the TILs (Figure 4B, Figure E4). Moreover, psoriasis clusters 6 and 10 displayed upregulation of cytotoxic T cell pathways, consistent with our earlier findings, that were not increased in exhausted TILs (Figure 4D).
Several genes involved in glucose metabolism (ALDOA, ENO1, GAPDH, PGAM1, PGK1, and TPI1) were also commonly upregulated in high-dysfunction psoriasis and melanoma CD8+ T cells (Table E6). As dysfunctional CD8+ T cells have been reported to show defects in the metabolic shift from oxidative phosphorylation to glycolysis that accompanies typical T cell activation15, we also scored the average expression of glycolytic and oxidative phosphorylation pathway genes from MSigDB39,40 in each cluster. Of the clusters showing the highest glycolytic gene expression (clusters 3, 4, and the Tc17 clusters 6 and 10, Figure 4C), clusters 4 and 6 also ranked highest in overall oxidative phosphorylation expression, while Clusters 3 and 10 ranked in the lower half of oxidative phosphorylation scores. This suggests that while metabolic activity may be increased in both Tc17 subtypes, cluster 10 may represent a more glycolytic state. This divergence contrasts with the metabolic scores calculated for TILs, in which glycolytic and oxidative phosphorylation genes are expressed more similarly between exhausted and naïve clusters (Figure E4D). Thus, in contrast to TILs, psoriasis Tc17 cells existed in both oxidative phosphorylation and glycolytic states.
Evidence of a developmental relationship between Tc17 clusters
Lastly, we analyzed the TCR-spanning reads captured in our dataset to perform a limited comparison of clonotypic expansion and differentiation dynamics between CD8+ T cells in healthy skin and psoriatic lesions. Within our initial dataset of 7,304 single-cell transcriptomes, we reconstructed the TCR repertoires of 4,908 CD8+ T cells (average 62% input cells per subject) by assembling their TCR-spanning reads. Within each subject, these cells represented an average of 224 unique ‘clonotypes’ (see Table E7 in the Online Repository Materials), defined here as groups of cells with fully matching sets of TCR sequences based on comparison of inferred CDR3 regions.
The TCR sequences and clonotypes shared between clusters provide evidence of a differentiation process that gives rise to the two phenotypically distinct Tc17 subtypes. From each cluster of CD8+ T cells, we identified 43–263 TCRs ‘shared’ between clusters, that is, TCR sequences that can be found in cells of different clusters within the same subject. While the shared TCRs of a given cluster were generally detected in all other clusters (Figure 5A, B), their average proportions in each of these other clusters differed significantly (Kruskal-Wallis p < 10−4 for the shared TCR sets of all clusters). In particular, the shared TCRs of cluster 10 were detected most frequently, on average, in cluster 6 (Mann-Whitney p < 0.001) and, to a lesser extent, in the activated subtype represented by cluster 4 (Mann-Whitney p < 0.04). The shared TCRs of cluster 6, in turn, were most frequently found in cluster 4 (Mann-Whitney p < 0.04), suggesting that cells in these clusters may come from a common lineage progressing from cluster 4 to cluster 6 to cluster 10. Consistent with this developmental relationship, of the 13 clonotypes in cluster 10 that were also present in other clusters, 8 (62%) were also detected in cluster 6.
Figure 5.
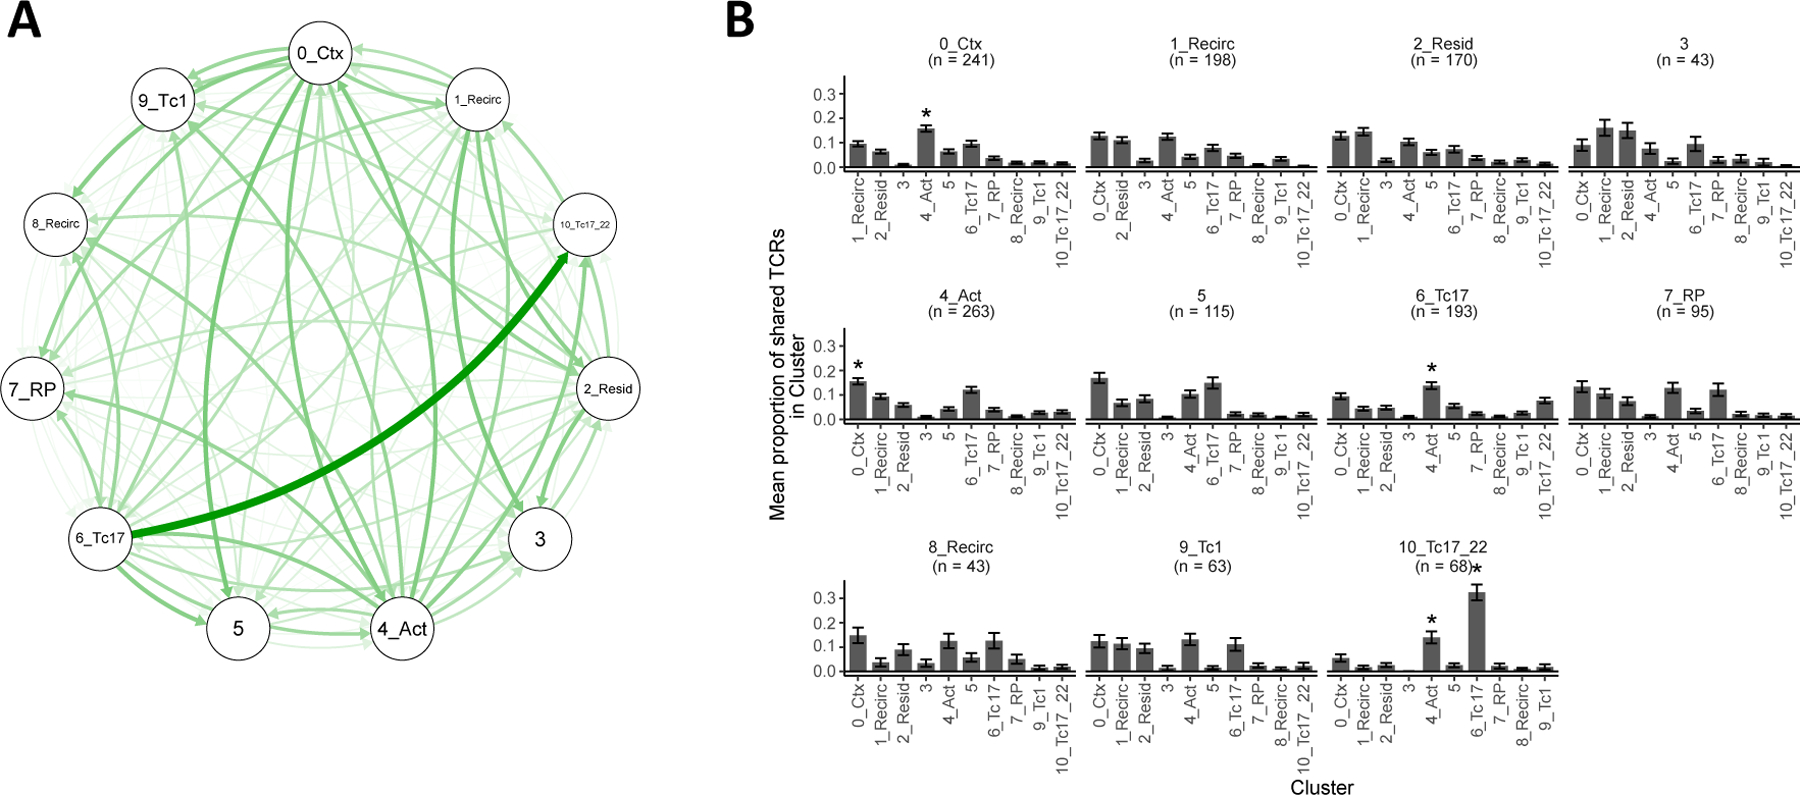
TCR sharing between Tc17 clusters. (A) TCR sharing network between clusters. Thickness and intensity of each curve represent the proportion of shared TCRs in one cluster (at arrow head) that can be found in another (at arrow tail). (B) Cluster distributions of shared TCRs. Each plot shows, for each cluster, the mean proportion of its ‘shared’ TCRs that occurs in each other cluster. Error bars represent mean ± standard error. Asterisks indicate a mean proportion that is significantly different from all others within the same cluster. n = number of shared TCRs detected for a cluster.
Comparable TCR and clonotype diversity within healthy and psoriatic skin
Our TCR data also revealed a similar diversity of clonotypes and unique TCRs among healthy and psoriasis subjects after accounting for the number of cells sampled from each individual (see Figure E5A, B in the Online Repository Materials) The average proportion of clonotypes consisting of two or more cells also did not differ significantly between psoriasis and healthy subjects (Figure E5C), suggesting comparable degrees of clonotypic expansion between healthy skin and psoriatic lesions. Twenty-four TCRs were found to be shared between two or more subjects, including eight that were specifically found only in psoriasis patients (see Table E8 in the Online Repository Materials). Eleven (46%) of these 24 shared TCRs were TCRα sequences with TRAV1–2 and TRAJ33 segments, indicative of mucosa associated invariant T (MAIT) cells, which a previous study found to make up a subset of the Tc17 population in psoriatic lesions41. However, in our study, MAIT CD8+ T cells were present in similar numbers between healthy and psoriasis subjects (see Figure E6A in the Online Repository Materials). Unexpectedly, while we could confirm that these putative MAIT cells expressed KLRB1, which encodes the MAIT marker CD16142 (Figure E6B), these cells were relatively scarce in the Tc17 clusters 6 and 10 and showed virtually no expression of IL17A, IL17F, or CXCL13 (Figure E6C). Of the three non-MAIT TCRs shared among psoriasis patients, one contains a TCRVβ6 segment, which was previously reported as a TCR preferentially enriched in psoriasis43.
Within each of the clusters, the proportion of expanded clonotypes was also mostly similar between psoriasis and healthy CD8+ T cells, except for the healthy-associated Cluster 3 and the psoriasis-associated clusters 6 and 10, in which we observed large differences in the average proportion of clonotypically expanded CD8+ T cells in psoriasis subjects compared with healthy CD8+ T cells (Figure E5D). However, these differences were not statistically significant and may be due to low cell numbers in the relatively depleted group.
Discussion
CD8+ T cell heterogeneity in psoriasis lesions
Our high-resolution single-cell study sheds light on several aspects of the CD8+ T cells in psoriatic lesions. We defined 11 CD8+ T cell subtypes and observed that several of these are distinct inflammatory subtypes in psoriatic lesions, including two IL17A-expressing subsets that expressed cytotoxicity-related genes as well as Th1 and Th22 cytokines10,11. These Tc17 subtypes represented a small fraction of lesional CD8+ T cells among relatively larger numbers of potentially “bystander” resident and recirculating subtypes (that also occur in healthy skin) and other cytokine-producing and cytotoxic inflammatory subtypes.
Other CD8+ subtypes besides Tc17 cells were enriched (cluster 7) or depleted (cluster 3) in psoriatic lesions, though we could not identify well-studied markers for these clusters. This may be due in part to our comparison of gene expression between clusters using a conservative, non-parametric statistical approach among the many that currently exist for single-cell transcriptomic data. While it has been found that these methods can differ greatly with regard to the genes they detect as differentially expressed44, continued use and refinement of these single cell analysis technologies may well lead to a better understanding of which statistical models are optimal for specific sampling, platform, or experimental settings. On the other hand, it is also possible that these clusters may represent transitional or less-defined transcriptional cell states within one or more general subsets that are beyond the resolution of our current sequencing. More extensive sampling of cells in these clusters, perhaps with deeper sequencing or multimodal profiling (e.g. of surface protein expression or chromatin accessibility) may help validate and characterize these putative subtypes.
Tc17 characteristics in psoriasis lesions
Our study identifies additional functional characteristics of psoriatic Tc17 cells. First, the increased expression of cytotoxicity genes in this subset is consistent with previous studies16,45 and suggest the capacity for a cytolytic role in the lesion. However, the extent to which T cell-mediated cell killing contributes to psoriasis is still unclear17,46. Second, while the persistent antigen exposure thought to underlie many chronic autoimmune diseases is also recognized as a key driver of T cell dysfunction in cancer and chronic infections15, our transcriptomic profiling reveals limited evidence of dysfunction in psoriatic CD8+ T cells with regard to the previously reported progressive loss of IFNG and TNF expression47 and impaired shift toward glycolytic metabolism48. These functions appeared intact among Tc17 cells at the transcriptional level, though additional experimental investigation is needed to determine whether this condition translates to the proteomic and metabolomic level. Along with the absence of CD8+ T cell dysfunction reported in juvenile idiopathic arthritis49, another immune-mediated disease, our findings are consistent with a proposed model in which the divergent outcomes of chronic antigen stimulation in cancer, chronic infection, and autoimmunity depend on context15, such as the presence of T cell help and contact-dependent and contact-independent costimulatory and coinhibitory signals, which intuitively vary between diseases and individuals. In particular, PD-150 and CTLA451 signaling have been found to play an active role in promoting T cell dysfunction. As CTLA4 but not PDCD1 expression is upregulated in the psoriatic Tc17 cells from our dataset, the signaling mechanism preventing dysfunction in this subtype remains unclear and warrants further investigation.
Lastly, we observed that Tc17 subsets highly express CXCL13, a chemokine that we subsequently found to be a biomarker of disease severity and anti-IL23 treatment response. In the context of autoimmunity, CXCL13 has been studied for its role in both the formation of ectopic lymphoid structures (ELSs) at sites of inflammation and the recruitment and maturation of B cells in these locations via the CXCR5 receptor. While CXCR5 expression was not appreciably detected in our data, CXCR5+CD8+ T cells have been observed in different disease contexts to have protective or pathogenic roles52, and B cells are indeed increased in the circulation and lesions of patients with certain types of psoriasis53,54. While ELSs have been found only in the synovium of psoriatic arthritis patients55, dendritic cell–T cell aggregates have been observed in the psoriatic dermis56. Further investigation is needed to clarify the effects and targets of CXCL13 in psoriasis.
Tc17 differentiation in psoriasis lesions
Lastly, our TCR and expression data shed light on the differentiation of inflammatory subtypes in psoriatic lesions. Intuitively, the shared TCR sequences and clonotypes between clusters 0, 4, 6, and 10 would be consistent with a model in which activated, skin-homing CD8+ T cells represented by cluster 4 differentiate into either cytotoxic effectors (represented by cluster 0) or Tc17 effectors (represented by clusters 6), the latter of which may further differentiate into Tc17/Tc22 effectors (represented by cluster 10) according to previous observations that IL-17-producing CD8+ T cells can give rise to an IL-22-producing subset in vitro57. Other studies have observed that Tc17 cells may also acquire a Tc1 phenotype58,59, which is characteristic of psoriasis-enriched cluster 9, though TCR evidence of such a conversion was lacking in our dataset.
Given this plasticity of Tc17 cells and the limited information about the direction of transitions between clusters provided by TCR sharing alone, there is a need to further dissect the developmental relationships and functional characteristics among these inflammatory subtypes. Equally important is the need for additional single-cell studies of the other immune8 and non-immune cell types60 known to play pathogenic roles in the lesion using both a targeted deep-sequencing approach, as we have done here, to characterize the functional phenotypes within each specific cell type, as well as a broader sequencing of all of these cell types simultaneously to capture their interactions in the lesion and identify therapeutic molecular targets.
Supplementary Material
Clinical Implications.
Psoriasis may be driven by multiple subsets of pathogenic T cells. Understanding the biology of these cells and their biomarkers may lead to novel treatment approaches.
Acknowledgements
This work was funded by a grant from Janssen Biotech, Inc. to the University of California San Francisco. W.L. is funded in part by grants from the National Institutes of Health (5U01AI119125) and Abbvie, Amgen, Janssen, Novartis, Regeneron, Sanofi, and TRex Bio.
Funding sources
This work was supported by a grant from Janssen Biotech, Inc. to the University of California San Francisco.
Abbreviations
- PASI
Psoriasis Area and Severity Index
- TILs
tumor-infiltrating lymphocytes
- ELS
ectopic lymphoid structure
- SVM
support vector machine
- PBS
phosphate buffered saline
Footnotes
Conflict of Interest
T.B. is currently an investigator for Celgene, Janssen, Merck, and Regeneron. She has served as an advisor for Abbvie, Lilly, and Pfizer. M.D.R is a founder and consultant for TRex Bio., a founder of Sitryx Bio., and receives funding from Abbvie, LEO Pharma and TRex Bio.
References
- 1.Lowes MA, Kikuchi T, Fuentes-Duculan J, Cardinale I, Zaba LC, Haider AS, et al. Psoriasis Vulgaris Lesions Contain Discrete Populations of Th1 and Th17 T Cells. J Invest Dermatol [Internet]. 2008;128:1207–11. Available from: https://linkinghub.elsevier.com/retrieve/pii/S0022202X15338537 [DOI] [PubMed] [Google Scholar]
- 2.Hueber W, Patel DD, Dryja T, Wright AM, Koroleva I, Bruin G, et al. Effects of AIN457, a fully human antibody to interleukin-17A, on psoriasis, rheumatoid arthritis, and uveitis. Sci Transl Med [Internet]. 2010;2:1–11. Available from: 10.1126/scitranslmed.3001107 [DOI] [PubMed] [Google Scholar]
- 3.Leonardi C, Matheson R, Zachariae C, Cameron G, Li L, Edson-Heredia E, et al. Anti–Interleukin-17 Monoclonal Antibody Ixekizumab in Chronic Plaque Psoriasis. N Engl J Med [Internet]. 2012;366:1190–9. Available from: 10.1056/NEJMoa1109997 [DOI] [PubMed] [Google Scholar]
- 4.Papp KA, Leonardi C, Menter A, Ortonne J-P, Krueger JG, Kricorian G, et al. Brodalumab, an Anti–Interleukin-17–Receptor Antibody for Psoriasis. N Engl J Med [Internet]. 2012;366:1181–9. Available from: 10.1056/NEJMoa1109017 [DOI] [PubMed] [Google Scholar]
- 5.Reich K, Papp KA, Blauvelt A, Tyring SK, Sinclair R, Thaçi D, et al. Tildrakizumab versus placebo or etanercept for chronic plaque psoriasis (reSURFACE 1 and reSURFACE 2): results from two randomised controlled, phase 3 trials. Lancet (London, England) [Internet]. 2017;390:276–88. Available from: http://www.ncbi.nlm.nih.gov/pubmed/28596043 [DOI] [PubMed] [Google Scholar]
- 6.Haugh IM, Preston AK, Kivelevitch DN, Menter AM. Risankizumab: an anti-IL-23 antibody for the treatment of psoriasis. Drug Des Devel Ther [Internet]. 2018;12:3879–83. Available from: http://www.ncbi.nlm.nih.gov/pubmed/30518998 [DOI] [PMC free article] [PubMed] [Google Scholar]
- 7.Blauvelt A, Papp KA, Griffiths CEM, Randazzo B, Wasfi Y, Shen Y-K, et al. Efficacy and safety of guselkumab, an anti-interleukin-23 monoclonal antibody, compared with adalimumab for the continuous treatment of patients with moderate to severe psoriasis: Results from the phase III, double-blinded, placebo- and active comparator-. J Am Acad Dermatol [Internet]. 2017;76:405–17. Available from: http://www.ncbi.nlm.nih.gov/pubmed/28057360 [DOI] [PubMed] [Google Scholar]
- 8.Brembilla NC, Senra L, Boehncke W-H. The IL-17 Family of Cytokines in Psoriasis: IL-17A and Beyond. Front Immunol [Internet]. 2018;9:1682. Available from: http://www.ncbi.nlm.nih.gov/pubmed/30127781 [DOI] [PMC free article] [PubMed] [Google Scholar]
- 9.Cheuk S, Wiken M, Blomqvist L, Nylen S, Talme T, Stahle M, et al. Epidermal Th22 and Tc17 Cells Form a Localized Disease Memory in Clinically Healed Psoriasis. J Immunol [Internet]. 2014;192:3111–20. Available from: 10.4049/jimmunol.1302313 [DOI] [PMC free article] [PubMed] [Google Scholar]
- 10.Ortega C, Fernandez-A S, Carrillo JM, Romero P, Molina IJ, Moreno JC, et al. IL-17-producing CD8+ T lymphocytes from psoriasis skin plaques are cytotoxic effector cells that secrete Th17-related cytokines. J Leukoc Biol [Internet]. 2009;86:435–43. Available from: http://www.ncbi.nlm.nih.gov/pubmed/19487306 [DOI] [PubMed] [Google Scholar]
- 11.Hijnen D, Knol EF, Gent YY, Giovannone B, Beijn SJP, Kupper TS, et al. CD8+ T cells in the lesional skin of atopic dermatitis and psoriasis patients are an important source of IFN-γ, IL-13, IL-17, and IL-22. J Invest Dermatol [Internet]. 2013;133:973–9. Available from: 10.1038/jid.2012.456 [DOI] [PMC free article] [PubMed] [Google Scholar]
- 12.Cheuk S, Schlums H, Gallais Sérézal I, Martini E, Chiang SC, Marquardt N, et al. CD49a Expression Defines Tissue-Resident CD8 + T Cells Poised for Cytotoxic Function in Human Skin. Immunity [Internet]. 2017;46:287–300. Available from: https://linkinghub.elsevier.com/retrieve/pii/S1074761317300316 [DOI] [PMC free article] [PubMed] [Google Scholar]
- 13.Sathaliyawala T, Kubota M, Yudanin N, Turner D, Camp P, Thome JJC, et al. Distribution and Compartmentalization of Human Circulating and Tissue-Resident Memory T Cell Subsets. Immunity [Internet]. 2013;38:187–97. Available from: 10.1016/j.immuni.2012.09.020 [DOI] [PMC free article] [PubMed] [Google Scholar]
- 14.Watanabe R, Gehad A, Yang C, Scott LL, Teague JE, Schlapbach C, et al. Human skin is protected by four functionally and phenotypically discrete populations of resident and recirculating memory T cells. Sci Transl Med [Internet]. 2015;7:279ra39–279ra39. Available from: 10.1126/scitranslmed.3010302 [DOI] [PMC free article] [PubMed] [Google Scholar]
- 15.McLane LM, Abdel-Hakeem MS, Wherry EJ. CD8 T Cell Exhaustion During Chronic Viral Infection and Cancer. Annu Rev Immunol 2019;37:457–95. [DOI] [PubMed] [Google Scholar]
- 16.Lande R, Botti E, Jandus C, Dojcinovic D, Fanelli G, Conrad C, et al. The antimicrobial peptide LL37 is a T-cell autoantigen in psoriasis. Nat Commun [Internet]. 2014;5:5621. Available from: http://www.ncbi.nlm.nih.gov/pubmed/25470744 [DOI] [PubMed] [Google Scholar]
- 17.Arakawa A, Siewert K, Stohr J, Besgen P, Kim SM, Ruhl G, et al. Melanocyte antigen triggers autoimmunity in human psoriasis. J Exp Med [Internet]. 2015;212:2203–12. Available from: http://www.ncbi.nlm.nih.gov/pubmed/26621454%5Cnhttp://jem.rupress.org/content/212/13/2203.full.pdf [DOI] [PMC free article] [PubMed] [Google Scholar]
- 18.Dobin A, Davis CA, Schlesinger F, Drenkow J, Zaleski C, Jha S, et al. STAR: ultrafast universal RNA-seq aligner. Bioinformatics [Internet]. 2013;29:15–21. Available from: http://www.ncbi.nlm.nih.gov/pubmed/23104886 [DOI] [PMC free article] [PubMed] [Google Scholar]
- 19.Anders S, Pyl PT, Huber W. HTSeq--a Python framework to work with high-throughput sequencing data. Bioinformatics [Internet]. 2015;31:166–9. Available from: 10.1093/bioinformatics/btu638 [DOI] [PMC free article] [PubMed] [Google Scholar]
- 20.R Development Core Team. R: A Language and Environment for Statistical Computing [Internet]. Vienna: The R Foundation for Statistical Computing; 2011. Available from: http://www.r-project.org/ [Google Scholar]
- 21.McCarthy DJ, Campbell KR, Lun ATL, Wills QF. Scater: pre-processing, quality control, normalization and visualization of single-cell RNA-seq data in R. Bioinformatics [Internet]. 2017;btw777. Available from: 10.1093/bioinformatics/btw777 [DOI] [PMC free article] [PubMed] [Google Scholar]
- 22.Risso D, Ngai J, Speed TP, Dudoit S. Normalization of RNA-seq data using factor analysis of control genes or samples. Nat Biotechnol [Internet]. 2014;32:896–902. Available from: 10.1038/nbt.2931 [DOI] [PMC free article] [PubMed] [Google Scholar]
- 23.Stuart T, Butler A, Hoffman P, Hafemeister C, Papalexi E, Mauck WM, et al. Comprehensive Integration of Single-Cell Data. Cell [Internet]. 2019;177:1888–1902.e21. Available from: https://linkinghub.elsevier.com/retrieve/pii/S0092867419305598 [DOI] [PMC free article] [PubMed] [Google Scholar]
- 24.Narayan A, Berger B, Cho H. Density-Preserving Data Visualization Unveils Dynamic Patterns of Single-Cell Transcriptomic Variability. bioRxiv [Internet]. 2020;2020.05.12.077776. Available from: http://biorxiv.org/content/early/2020/05/14/2020.05.12.077776.abstract [DOI] [PMC free article] [PubMed] [Google Scholar]
- 25.Tirosh I, Izar B, Prakadan SM, Wadsworth MH, Treacy D, Trombetta JJ, et al. Dissecting the multicellular ecosystem of metastatic melanoma by single-cell RNA-seq. Science [Internet]. 2016;352:189–96. Available from: https://science.sciencemag.org/content/352/6282/189.long [DOI] [PMC free article] [PubMed] [Google Scholar]
- 26.Stubbington MJT, Lönnberg T, Proserpio V, Clare S, Speak AO, Dougan G, et al. T cell fate and clonality inference from single-cell transcriptomes. Nat Methods [Internet]. 2016;13:329–32. Available from: http://biorxiv.org/content/early/2015/08/28/025676.abstract [DOI] [PMC free article] [PubMed] [Google Scholar]
- 27.Reich K, Armstrong AW, Foley P, Song M, Wasfi Y, Randazzo B, et al. Efficacy and safety of guselkumab, an anti-interleukin-23 monoclonal antibody, compared with adalimumab for the treatment of patients with moderate to severe psoriasis with randomized withdrawal and retreatment: Results from the phase III, double-blind, p. J Am Acad Dermatol [Internet]. 2017;76:418–31. Available from: https://linkinghub.elsevier.com/retrieve/pii/S0190962216311586 [DOI] [PubMed] [Google Scholar]
- 28.Gold L, Ayers D, Bertino J, Bock C, Bock A, Brody EN, et al. Aptamer-Based Multiplexed Proteomic Technology for Biomarker Discovery. Gelain F, editor. PLoS One [Internet]. 2010;5:e15004. Available from: 10.1371/journal.pone.0015004 [DOI] [PMC free article] [PubMed] [Google Scholar]
- 29.Clark RA, Chong B, Mirchandani N, Brinster NK, Yamanaka K -i. K, Dowgiert RK, et al. The Vast Majority of CLA+ T Cells Are Resident in Normal Skin. J Immunol [Internet]. 2006;176:4431–9. Available from: 10.4049/jimmunol.176.7.4431 [DOI] [PubMed] [Google Scholar]
- 30.Milner JJ, Toma C, Yu B, Zhang K, Omilusik K, Phan AT, et al. Runx3 programs CD8+ T cell residency in non-lymphoid tissues and tumours. Nature [Internet]. 2017;552:253–7. Available from: 10.1038/nature24993 [DOI] [PMC free article] [PubMed] [Google Scholar]
- 31.Boddupalli CS, Nair S, Gray SM, Nowyhed HN, Verma R, Gibson JA, et al. ABC transporters and NR4A1 identify a quiescent subset of tissue-resident memory T cells. J Clin Invest [Internet]. 2016;126:3905–16. Available from: http://www.ncbi.nlm.nih.gov/pubmed/27617863 [DOI] [PMC free article] [PubMed] [Google Scholar]
- 32.Kunkel EJ, Boisvert J, Murphy K, Vierra MA, Genovese MC, Wardlaw AJ, et al. Expression of the chemokine receptors CCR4, CCR5, and CXCR3 by human tissue-infiltrating lymphocytes. Am J Pathol [Internet]. 2002;160:347–55. Available from: http://www.ncbi.nlm.nih.gov/pubmed/11786428 [DOI] [PMC free article] [PubMed] [Google Scholar]
- 33.Klimatcheva E, Pandina T, Reilly C, Torno S, Bussler H, Scrivens M, et al. CXCL13 antibody for the treatment of autoimmune disorders. BMC Immunol [Internet]. 2015;16:6. Available from: http://www.biomedcentral.com/1471-2172/16/6 [DOI] [PMC free article] [PubMed] [Google Scholar]
- 34.Li B, Tsoi LC, Swindell WR, Gudjonsson JE, Tejasvi T, Johnston A, et al. Transcriptome analysis of psoriasis in a large case-control sample: RNA-seq provides insights into disease mechanisms. J Invest Dermatol [Internet]. 2014;134:1828–38. Available from: 10.1038/jid.2014.28 [DOI] [PMC free article] [PubMed] [Google Scholar]
- 35.Gudjonsson JE, Ding J, Johnston A, Tejasvi T, Guzman AM, Nair RP, et al. Assessment of the psoriatic transcriptome in a large sample: additional regulated genes and comparisons with in vitro models. J Invest Dermatol [Internet]. 2010;130:1829–40. Available from: http://linkinghub.elsevier.com/retrieve/pii/S0022202X15348983 [DOI] [PMC free article] [PubMed] [Google Scholar]
- 36.Li H, van der Leun AM, Yofe I, Lubling Y, Gelbard-Solodkin D, van Akkooi ACJ, et al. Dysfunctional CD8 T Cells Form a Proliferative, Dynamically Regulated Compartment within Human Melanoma. Cell [Internet]. 2019;176:775–789.e18. Available from: 10.1016/j.cell.2018.11.043 [DOI] [PMC free article] [PubMed] [Google Scholar]
- 37.Workel HH, Lubbers JM, Arnold R, Prins TM, van der Vlies P, de Lange K, et al. A Transcriptionally Distinct CXCL13 + CD103 + CD8 + T-cell Population Is Associated with B-cell Recruitment and Neoantigen Load in Human Cancer. Cancer Immunol Res [Internet]. 2019;7:784–96. Available from: 10.1158/2326-6066.CIR-18-0517 [DOI] [PubMed] [Google Scholar]
- 38.Thommen DS, Koelzer VH, Herzig P, Roller A, Trefny M, Dimeloe S, et al. A transcriptionally and functionally distinct PD-1+ CD8+ T cell pool with predictive potential in non-small-cell lung cancer treated with PD-1 blockade. Nat Med [Internet]. 2018;24:994–1004. Available from: 10.1038/s41591-018-0057-z [DOI] [PMC free article] [PubMed] [Google Scholar]
- 39.Subramanian A, Tamayo P, Mootha VK, Mukherjee S, Ebert BL, Gillette MA, et al. Gene set enrichment analysis: A knowledge-based approach for interpreting genome-wide expression profiles. Proc Natl Acad Sci [Internet]. 2005;102:15545–50. Available from: 10.1073/pnas.0506580102 [DOI] [PMC free article] [PubMed] [Google Scholar]
- 40.Liberzon A, Birger C, Thorvaldsdóttir H, Ghandi M, Mesirov JP, Tamayo P. The Molecular Signatures Database Hallmark Gene Set Collection. Cell Syst [Internet]. 2015;1:417–25. Available from: https://linkinghub.elsevier.com/retrieve/pii/S2405471215002185 [DOI] [PMC free article] [PubMed] [Google Scholar]
- 41.Teunissen MBM, Yeremenko NG, Baeten DLP, Chielie S, Spuls PI, De Rie MA, et al. The IL-17A-producing CD8 + T-cell population in psoriatic lesional skin comprises mucosa-associated invariant t cells and conventional t cells. J Invest Dermatol [Internet]. 2014;134:2898–907. Available from: 10.1038/jid.2014.261 [DOI] [PubMed] [Google Scholar]
- 42.Martin E, Treiner E, Duban L, Guerri L, Laude H, Toly C, et al. Stepwise Development of MAIT Cells in Mouse and Human. Cerundolo V, editor. PLoS Biol [Internet]. 2009;7:e1000054. Available from: 10.1371/journal.pbio.1000054 [DOI] [PMC free article] [PubMed] [Google Scholar]
- 43.Matos TR, O’Malley JT, Lowry EL, Hamm D, Kirsch IR, Robins HS, et al. Clinically resolved psoriatic lesions contain psoriasis-specific IL-17-producing αβ T cell clones. J Clin Invest [Internet]. 2017;127:4031–41. Available from: http://www.ncbi.nlm.nih.gov/pubmed/28945199 [DOI] [PMC free article] [PubMed] [Google Scholar]
- 44.Soneson C, Robinson MD. Bias, robustness and scalability in single-cell differential expression analysis. Nat Methods [Internet]. 2018;15:255–61. Available from: 10.1038/nmeth.4612 [DOI] [PubMed] [Google Scholar]
- 45.Yawalkar N, Schmid S, Braathen LR, Pichler WJ. Perforin and granzyme B may contribute to skin inflammation in atopic dermatitis and psoriasis. Br J Dermatol [Internet]. 2001;144:1133–9. Available from: 10.1046/j.1365-2133.2001.04222.x [DOI] [PubMed] [Google Scholar]
- 46.Wrone-Smith T, Mitra RS, Thompson CB, Jasty R, Castle VP, Nickoloff BJ. Keratinocytes derived from psoriatic plaques are resistant to apoptosis compared with normal skin. Am J Pathol [Internet]. 1997;151:1321–9. Available from: http://www.ncbi.nlm.nih.gov/pubmed/9358758 [PMC free article] [PubMed] [Google Scholar]
- 47.Fuller MJ, Zajac AJ. Ablation of CD8 and CD4 T Cell Responses by High Viral Loads. J Immunol [Internet]. 2003;170:477–86. Available from: 10.4049/jimmunol.170.1.477 [DOI] [PubMed] [Google Scholar]
- 48.Bengsch B, Johnson AL, Kurachi M, Odorizzi PM, Pauken KE, Attanasio J, et al. Bioenergetic Insufficiencies Due to Metabolic Alterations Regulated by the Inhibitory Receptor PD-1 Are an Early Driver of CD8(+) T Cell Exhaustion. Immunity [Internet]. 2016;45:358–73. Available from: http://www.ncbi.nlm.nih.gov/pubmed/27496729 [DOI] [PMC free article] [PubMed] [Google Scholar]
- 49.Petrelli A, Mijnheer G, van Konijnenburg DPH, van der Wal MM, Giovannone B, Mocholi E, et al. PD-1+CD8+ T cells are clonally expanding effectors in human chronic inflammation. J Clin Invest [Internet]. 2018;128:4669–81. Available from: https://www.jci.org/articles/view/96107 [DOI] [PMC free article] [PubMed] [Google Scholar]
- 50.Patsoukis N, Bardhan K, Chatterjee P, Sari D, Liu B, Bell LN, et al. PD-1 alters T-cell metabolic reprogramming by inhibiting glycolysis and promoting lipolysis and fatty acid oxidation. Nat Commun [Internet]. 2015;6:6692. Available from: http://www.ncbi.nlm.nih.gov/pubmed/25809635 [DOI] [PMC free article] [PubMed] [Google Scholar]
- 51.Chang C-H, Qiu J, O’Sullivan D, Buck MD, Noguchi T, Curtis JD, et al. Metabolic Competition in the Tumor Microenvironment Is a Driver of Cancer Progression. Cell [Internet]. 2015;162:1229–41. Available from: http://www.ncbi.nlm.nih.gov/pubmed/26321679 [DOI] [PMC free article] [PubMed] [Google Scholar]
- 52.Valentine KM, Hoyer KK. CXCR5+ CD8 T Cells: Protective or Pathogenic? Front Immunol [Internet]. 2019;10. Available from: 10.3389/fimmu.2019.01322/full [DOI] [PMC free article] [PubMed] [Google Scholar]
- 53.Lu J, Ding Y, Yi X, Zheng J. CD19+ B cell subsets in the peripheral blood and skin lesions of psoriasis patients and their correlations with disease severity. Brazilian J Med Biol Res = Rev Bras Pesqui medicas e Biol [Internet]. 2016;49:e5374. Available from: http://www.ncbi.nlm.nih.gov/pubmed/27532281 [DOI] [PMC free article] [PubMed] [Google Scholar]
- 54.de Boer OJ, van der Loos CM, Hamerlinck F, Bos JD, Das PK. Reappraisal of in situ immunophenotypic analysis of psoriasis skin: interaction of activated HLA-DR+ immunocompetent cells and endothelial cells is a major feature of psoriatic lesions. Arch Dermatol Res [Internet]. 1994;286:87–96. Available from: http://www.ncbi.nlm.nih.gov/pubmed/7512323 [DOI] [PubMed] [Google Scholar]
- 55.Cañete JD, Santiago B, Cantaert T, Sanmartí R, Palacin A, Celis R, et al. Ectopic lymphoid neogenesis in psoriatic arthritis. Ann Rheum Dis [Internet]. 2007;66:720–6. Available from: http://www.ncbi.nlm.nih.gov/pubmed/17223654 [DOI] [PMC free article] [PubMed] [Google Scholar]
- 56.Kim T-G, Jee H, Fuentes-Duculan J, Wu WH, Byamba D, Kim D-S, et al. Dermal Clusters of Mature Dendritic Cells and T Cells Are Associated with the CCL20/CCR6 Chemokine System in Chronic Psoriasis. J Invest Dermatol [Internet]. 2014;134:1462–5. Available from: https://linkinghub.elsevier.com/retrieve/pii/S0022202X15368007 [DOI] [PubMed] [Google Scholar]
- 57.Res PCM, Piskin G, de Boer OJ, van der Loos CM, Teeling P, Bos JD, et al. Overrepresentation of IL-17A and IL-22 producing CD8 T cells in lesional skin suggests their involvement in the pathogenesis of psoriasis. PLoS One [Internet]. 2010;5:e14108. Available from: http://www.ncbi.nlm.nih.gov/pubmed/21124836 [DOI] [PMC free article] [PubMed] [Google Scholar]
- 58.Yen H-R, Harris TJ, Wada S, Grosso JF, Getnet D, Goldberg MV., et al. Tc17 CD8 T Cells: Functional Plasticity and Subset Diversity. J Immunol [Internet]. 2009;183:7161–8. Available from: 10.4049/jimmunol.0900368 [DOI] [PMC free article] [PubMed] [Google Scholar]
- 59.Arra A, Lingel H, Kuropka B, Pick J, Schnoeder T, Fischer T, et al. The differentiation and plasticity of Tc17 cells are regulated by CTLA-4-mediated effects on STATs. Oncoimmunology [Internet]. 2017;6:e1273300. Available from: http://www.ncbi.nlm.nih.gov/pubmed/28344884 [DOI] [PMC free article] [PubMed] [Google Scholar]
- 60.Albanesi C, Madonna S, Gisondi P, Girolomoni G. The interplay between keratinocytes and immune cells in the pathogenesis of psoriasis. Front Immunol 2018;9:1–7. [DOI] [PMC free article] [PubMed] [Google Scholar]
Associated Data
This section collects any data citations, data availability statements, or supplementary materials included in this article.