

Summary
Loss of sensory hair cell (HCs) in the mammalian inner ear leads to permanent hearing and vestibular defects, whereas loss of HCs in zebrafish results in their regeneration. We used scRNA-Seq to characterize the transcriptional dynamics of HC regeneration in zebrafish at unprecedented spatio-temporal resolution. We uncovered three, sequentially activated modules. First, an injury/inflammatory response and downregulation of progenitor cell maintenance genes within minutes after HC loss. Second, the transient activation of regeneration-specific genes. And third, a robust reactivation of developmental gene programs, including HC specification, cell cycle activation, ribosome biogenesis, and a metabolic switch to oxidative phosphorylation. The results are not only relevant for our understanding of HC regeneration and how we might be able to trigger it in mammals but also for regenerative processes in general. The data is searchable and publicly accessible via a web-based interface.
Keywords: Hair cell regeneration, scRNASeq atlas, lateral line system, support cells, stem cells, pseudotime analysis
Graphical Abstract

eTOC Blurb:
It is not understood why mammals cannot regenerate their inner ear hair cells. Baek et al., performed scRNASeq analyses of six time points during sensory hair cell regeneration in zebrafish. Regeneration depends on three, subsequently activated gene modules which can serve as a blueprint to trigger regeneration in mammals.
Introduction
Humans in particular, and mammals in general, fail to regenerate mechanosensory hair cells (HCs) in their inner ears. Noise-, drug- or age-induced hearing loss due to HC death is therefore permanent (Furness, 2015; Wagner and Shin, 2019; Wong and Ryan, 2015). In contrast, fish, chicken and amphibians constantly replace dying HCs through proliferation and differentiation of support cells (SCs) (Corwin and Cotanche, 1988; Corwin and Warchol, 1991; Cruz et al., 2015; Pinto-Teixeira et al., 2015; Ryals and Rubel, 1988). Because neonatal mouse SCs are able to produce a modest number of HCs after injury and some vestibular HCs turn over spontaneously, there is hope that elucidating the gene regulatory networks (GRNs) underpinning HC regeneration may lead to the restoration of hearing loss (Bucks et al., 2017; Burns et al., 2012; Burns and Stone, 2017; Cox et al., 2014; Du et al., 2013; Forge et al., 1993; Korrapati et al., 2013; Warchol and Corwin, 1996; White et al., 2006). One strategy to identify candidate genes and pathways that might trigger HC regeneration in mammals has been to identify genes involved in HC development (Burns et al., 2015; Cai and Groves, 2015; Jen et al., 2019; Lee et al., 2020; Sayyid et al., 2019; Scheffer et al., 2015; Valdivia et al., 2011; Zhu et al., 2019). Another promising strategy is to identify the molecular underpinnings of HC regeneration in regenerating species, such as chicken and zebrafish and use this blueprint of regeneration to experimentally trigger regeneration in mammals (Behra et al., 2009; Jiang et al., 2014; Ku et al., 2014; Pei et al., 2018; Roccio et al., 2018; Scheibinger et al., 2018; Steiner et al., 2014). However, the number of regenerated HCs attained in mammals thus far has been modest. This is likely due to the limited number of known candidate genes and our general lack of understanding of cell type specific expression dynamics at a fine time scale.
The zebrafish sensory lateral line is a powerful model to study HC development and regeneration because of its accessibility and relative ease of experimental manipulation (Figure 1A; (Denans et al., 2019; Kniss et al., 2016; Lush and Piotrowski, 2014; Ma and Raible, 2009; Romero-Carvajal et al., 2015; Viader-Llargues et al., 2018)). Zebrafish and mammalian sensory HCs are very similar, and loss of lateral line HC genes does not only cause loss of HC function in fish, but also deafness and vestibular dysfunction in mammals (Nicolson, 2005; Whitfield, 2002).
Figure 1. Spatio-temporal scRNA-Seq analysis during lateral line HC regeneration.
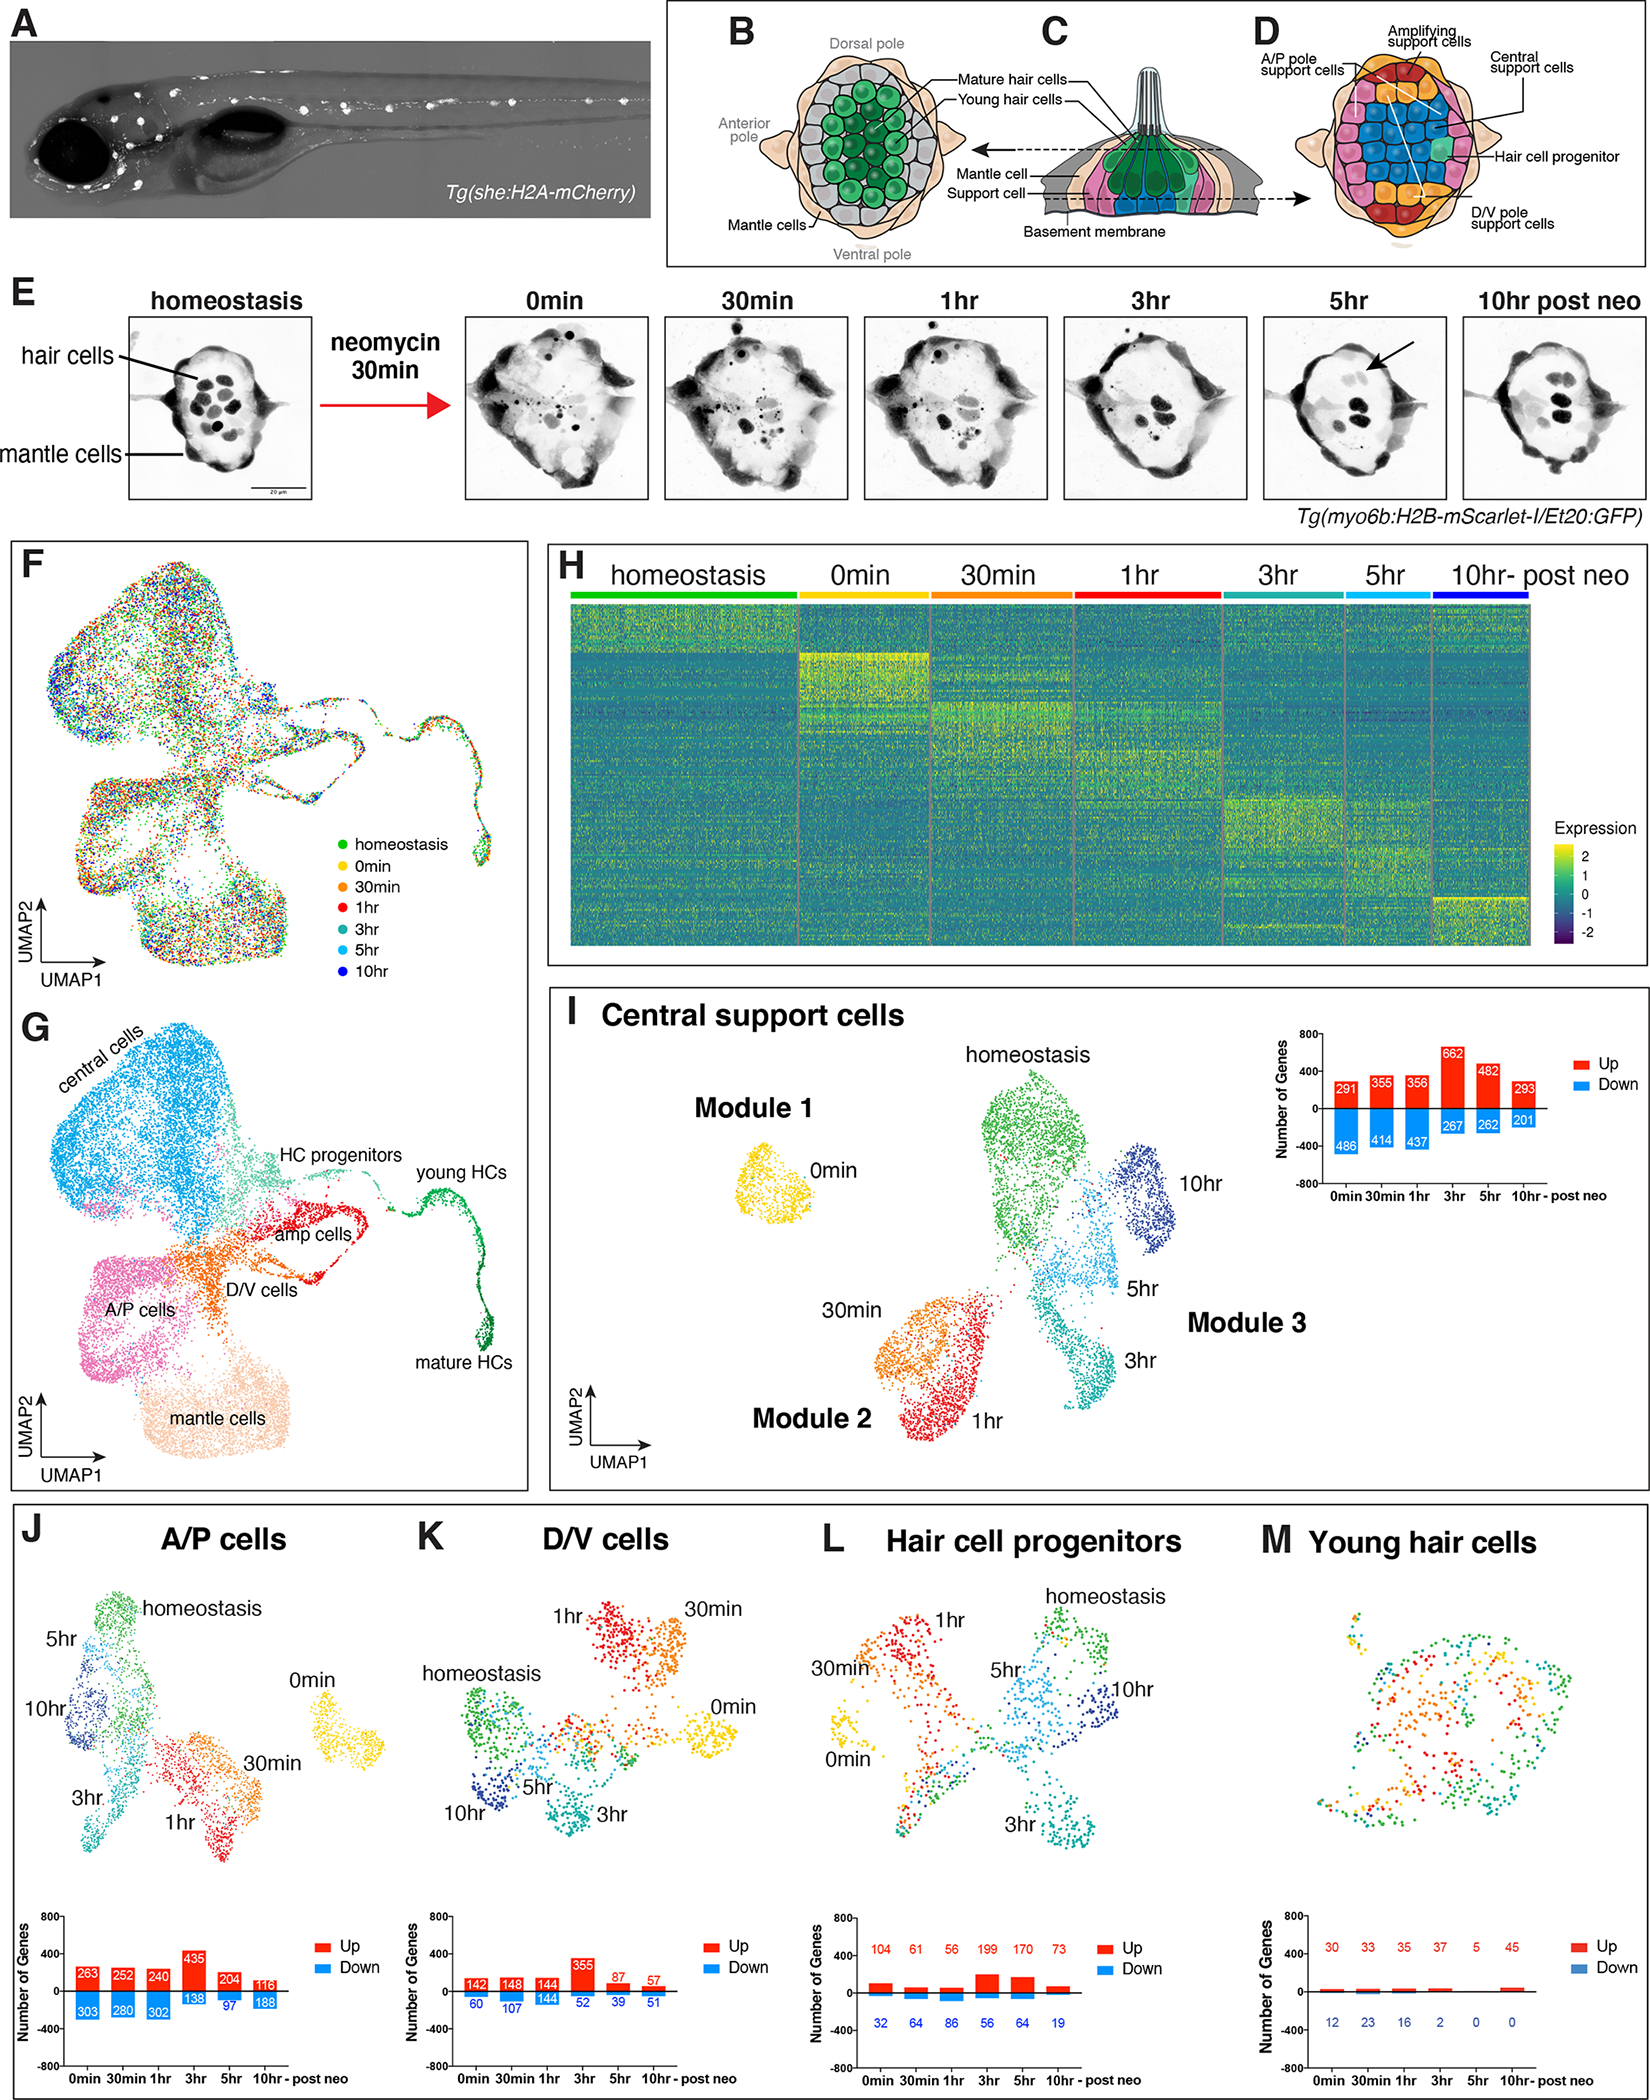
(A) 5dpf Tg(she:H2A-mCherry) larvae were used for FACS of lateral line cells.
(B - D) Illustration of homeostatic lateral line cell types. (B and D) dorsal view and (C) lateral view.
(E) Experimental timeline of scRNA-Seq sample collection. Maximum intensity projection of confocal images of Tg(myo6b:H2B-mScarlet-I/Et20:GFP) neuromasts during HC regeneration. This transgenic line shows the HCs more clearly than the Tg(she:H2A-mCherry) line that was used for sorting. Scale bar: 20μm, arrow indicates two new HCs.
(F) Integration of scRNA-Seq samples of seven different time points in UMAP latent space.
(G) UMAP of a cluster analysis identifies eight different neuromast cell types.
(H) Heatmap visualizing the top 25 genes in each timepoint during HC regeneration. (Differential gene expression analysis of each time point vs. all other time points)
(I - M) UMAPs of subsetted (I) central SCs, (J) A/P cells, (K) D/V cells, (L) HC progenitors and (M) young HCs with bar graphs showing the number of up and down-regulated genes during regeneration (differential gene expression analysis of each time point vs. homeostasis in individual cell type).
We have previously performed bulk RNA-Seq analyses of regenerating lateral line HCs that identified candidate genes and pathways but lacked spatio-temporal resolution (Jiang et al., 2014). To identify the cell populations involved in regeneration, we analyzed HC death using time lapse and BrdU analyses and characterized homeostatic lateral line sensory organs (neuromasts) using scRNA-Seq (Figures 1B–D; (Lush et al., 2019; Romero-Carvajal et al., 2015)). Lateral line sensory organs consist of sensory HCs surrounded by SCs and an outermost ring of mantle cells. SCs can be subdivided into anterior-posterior (A/P), dorso-ventral (D/V) and a central sub population (Romero-Carvajal et al., 2015; Thomas and Raible, 2019; Wibowo et al., 2011). During regeneration SCs divide before differentiating into HCs (López-Schier and Hudspeth, 2006; Ma et al., 2008; Mackenzie and Raible, 2012; Wibowo et al., 2011). Central SCs are the immediate precursors of HCs (Lush et al., 2019; Romero-Carvajal et al., 2015). D/V and A/P SCs also give rise to HCs, but it is not known if they first acquire a central SC fate or if they directly differentiate into HCs during regeneration. Mantle cells do not respond behaviorally to HC loss, but they generate SCs and HCs after severe injury to the sensory organ (Denans et al., 2019; Romero-Carvajal et al., 2015; Thomas and Raible, 2019; Viader-Llargues et al., 2018).
We previously showed that all regenerative cell divisions are symmetric. Central and A/P SCs divide and give rise to two HCs, whereas D/V cells that are in contact with mantle cells (amplifying cells) also divide symmetrically but instead give rise to two SCs (Romero-Carvajal et al., 2015). Manipulations of the Notch and Wnt signaling pathways demonstrated that the majority, or maybe even all SC populations can be induced to proliferate and either give rise to only HCs or to only SCs, indicating that most of SCs are competent to serve as HC progenitors.
Faithful regeneration of sensory cells requires the precise orchestration of stem/progenitor cell activation, proliferation, cell lineage determination and differentiation. Of all the vertebrate regeneration models studied, such as fin, heart and retina regeneration, HC regeneration is by far the fastest. Zebrafish lateral line cells die within 30min of killing HCs and the first newly regenerated HCs arise around 5 hours later. Here, using differential gene expression, enrichment term analysis, pseudotime analysis, and validation by in situ hybridization we defined the molecular changes taking place during HC regeneration at unprecedented resolution. We correlated the transcriptional dynamics with previously defined cellular behaviors to build the foundation for the establishment of a GRN. We discovered three sequentially activated modules. The first consists of a systemic injury/inflammatory response, which likely plays a crucial role in the initiation of regeneration (Beisaw et al., 2020; Wang et al., 2020). The second module is characterized by a transient activation of regeneration-specific genes. The longest, third phase of regeneration recapitulates developmental events. Thus, once initiated, regeneration recapitulates development, but the early injury/inflammatory response is regeneration-specific. The resulting gene expression dynamics are publicly available and readily searchable via web-based interfaces: https://piotrowskilab.shinyapps.io/neuromast_regeneration_scRNAseq_pub_2021/ and gEAR (http://umgear.org/ZfRegen) (Orvis et al., 2021).
Knowing when and in which cell types genes and pathways are modulated, and when lineage decisions occur informs not only our understanding of zebrafish lateral line HC regeneration but also efforts to induce HC regeneration in mammals. Therefore, the high spatio-temporal resolution data presented here provides a foundation for comparative regeneration studies across species and regenerating organs.
Results
To determine relevant stages for transcriptomic analyses, we analyzed time lapse recordings of regenerating HCs in a transgenic line that labels HCs and mantle cells (Figure 1E). The vast majority of HCs die within 30min of addition of neomycin (0min time point), and dead HC debris is cleared between 3–5 hours. HCs regenerate rapidly, with the first new pair detected within 3–5 hours after neomycin exposure (Figure 1E, arrow; (Romero-Carvajal et al., 2015)). To characterize the transcriptional changes that underly these fast behavioral responses, we performed single cell RNA-Seq (scRNA-Seq) using the 10X Chromium platform during homeostasis (homeo) and six time points after 30min neomycin exposure to kill HCs (Figure 1E, homeo, 0min, 30min, 1h, 3h, 5h and 10h- after neomycin treatment). We dissociated 5dpf Tg(she:H2A-mCherry) fish, in which the nuclei of all neuromast cells are labeled and FACsorted the cells (Data S1 page 1; Peloggia et al., 2021). After sequencing, we filtered and integrated cells from all time points using Seurat (v3.2.0) and plotted them in two-dimensional UMAP space (Figure 1F; homeo: 4335 cells, 0min: 2481 cells, 30min: 3704 cells, 1h: 2804 cells, 3h: 2301 cells, 5h: 1619 cells, 10h: 1829 cells).
Cluster analyses identified the same populations we previously described in homeostatic neuromasts (Figure 1G, Figures 1B–D, Data S1 page 2A, Table S1, (Lush and Piotrowski, 2014)). We did not observe any obvious loss or gain of a particular SC population during any of the regeneration time points (Data S1 page 2B).
We show the results of the transcriptome analyses of all 6 time points after HC death in all cell types in Figures 1- 5 and present the results of pseudotime analyses using only central SCs and HC lineage cells in Figures 6–8. All genes mentioned in each Figure are listed in Table S5. The results of our regeneration analysis can be queried using publicly available databases: the shiny app entitled ‘Neuromast Regeneration scRNA-Seq’ shows feature plots, violin plots, dot plots and heat maps of the entire data set, whereas the link within this shiny app called ‘Pseudotime Analysis’ shows feature plots, violin plots, dot plots and line graphs of central cells and HC lineage (Data S1 page 3A–B, https://piotrowskilab.shinyapps.io/neuromast_regeneration_scRNAseq_pub_2021/). The genes comprising both databases are listed in Table S2. In addition, the data has been deposited to gEAR, a database that allows comparison of our data with other published data from other species (Data S1 page 3C, http://umgear.org/ZfRegen) (Orvis et al., 2021).
Figure 5. Ribosome biogenesis, spliceosome, HC genes, Wnt, Notch and cell cycle genes are enriched 3–10h after HC death.
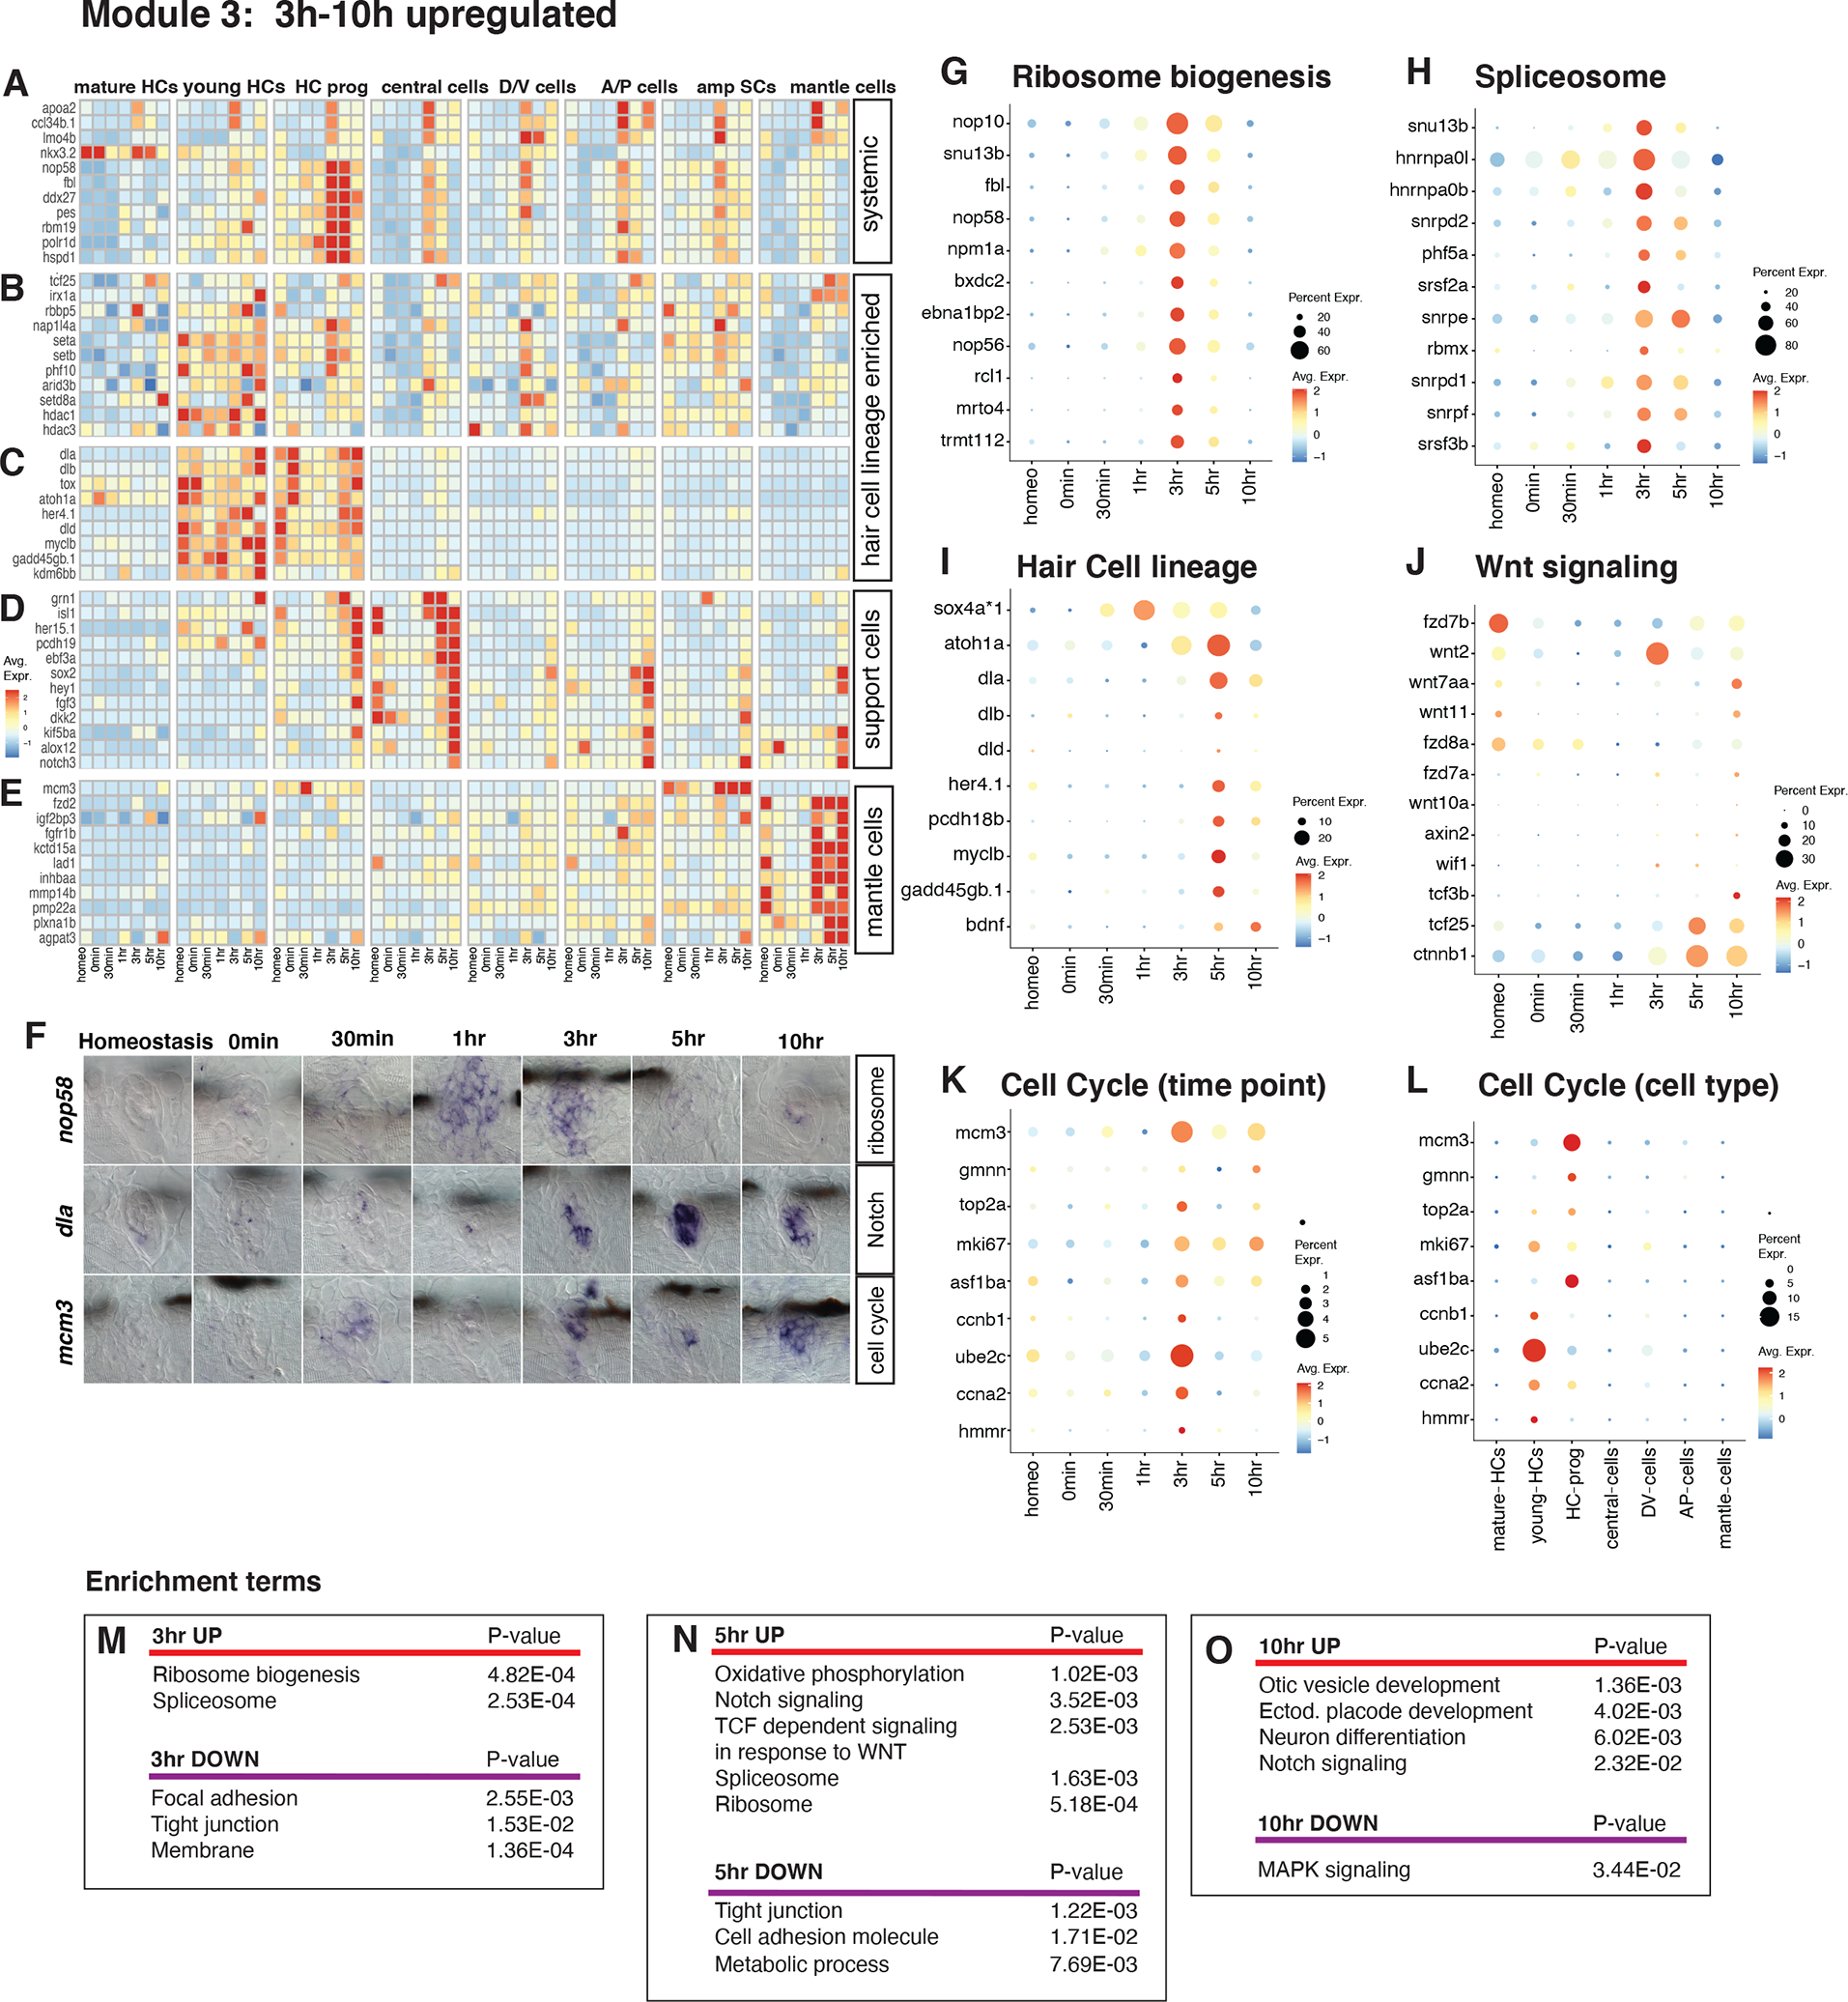
(A) Heatmap of the average expression of selected genes upregulated in several cell types at 3h-10h after HC death.
(B - E) Heatmaps of the average expression of selected cell type-specific genes upregulated 3h-10h after HC death.
(F) ISH images of nop58, dla, and mcm3 in neuromasts during HC regeneration.
(G - K) Dot plots displaying the average expression per time point of (G) ribosome biogenesis, (H) spliceosome, (I) HC lineage, (J) Wnt signaling and (K) cell cycle genes. The dot size shows the percentage of cells that express the gene.
(L) Cell cycle genes by cell type enrichment. Amplifying SCs omitted.
(M - O) Gene enrichment term analysis of up- and downregulated genes at (M) 3h, (N) 5h, and (O) 10h after HC death compared to all other time points.
Figure 6. Pseudotime analysis (injury response + progenitor activation).
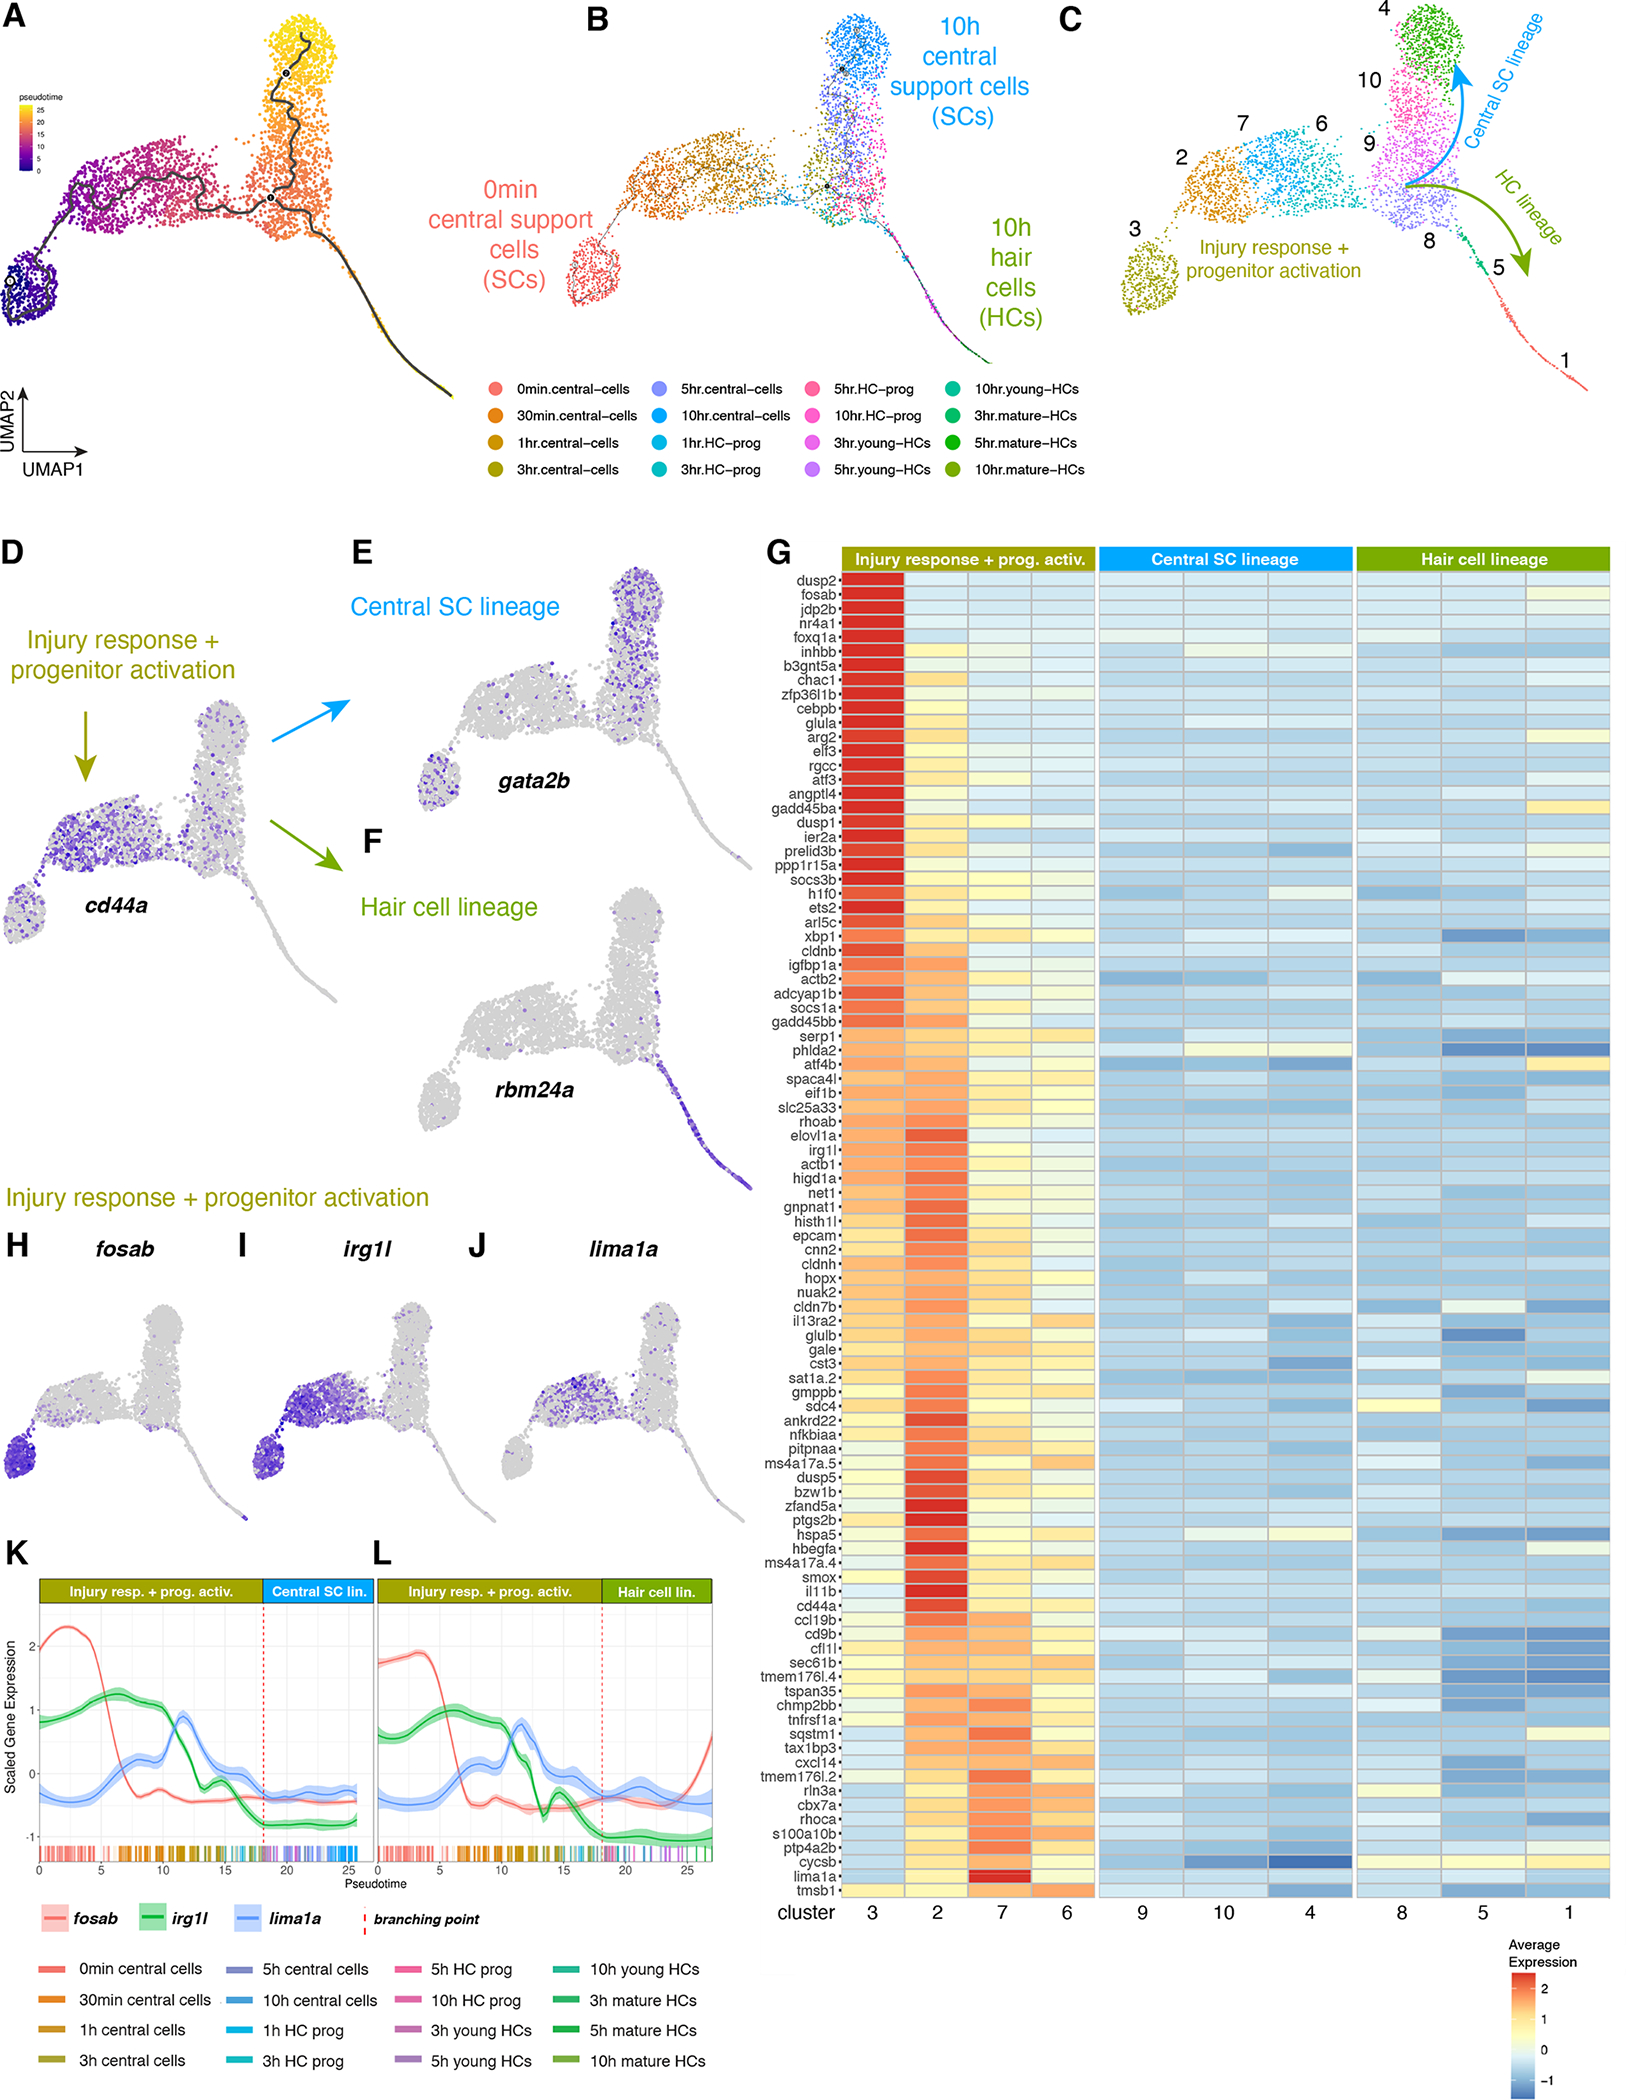
(A - C) UMAPs of pseudotime trajectories of subsetted central SC- and HC lineage cells. (A) Dark purple shows cells at the beginning of pseudotime and yellow cells at the end. (B) UMAP with the location of cells from different time points highlighted in different colors. (C) Cluster analysis groups cells with similar transcriptomes into ten different clusters. After the branch point, cells either follow the central SC lineage (blue arrow), or they follow the HC lineage (green arrow).
(D) Feature plot of cd44a that is enriched in cells before the branch point.
(E) gata2b is enriched in the central SC lineage.
(F) rbm24a labels the HC lineage.
(G) Heatmap of markers enriched in the injury response + progenitor activation population, partitioned into clusters.
(H - J) Feature plots of genes expressed in the injury response + progenitor activation central SC population.
(K and L) Line plots showing the scaled expression of fosab, irg1l, and lima1a along the pseudotime trajectory in the (K) central SC lineage and (L) HC lineage. Individual cells are represented by color-coded tics on the x-axis.
Figure 8. Pseudotime analysis (HC lineage after the branch point).
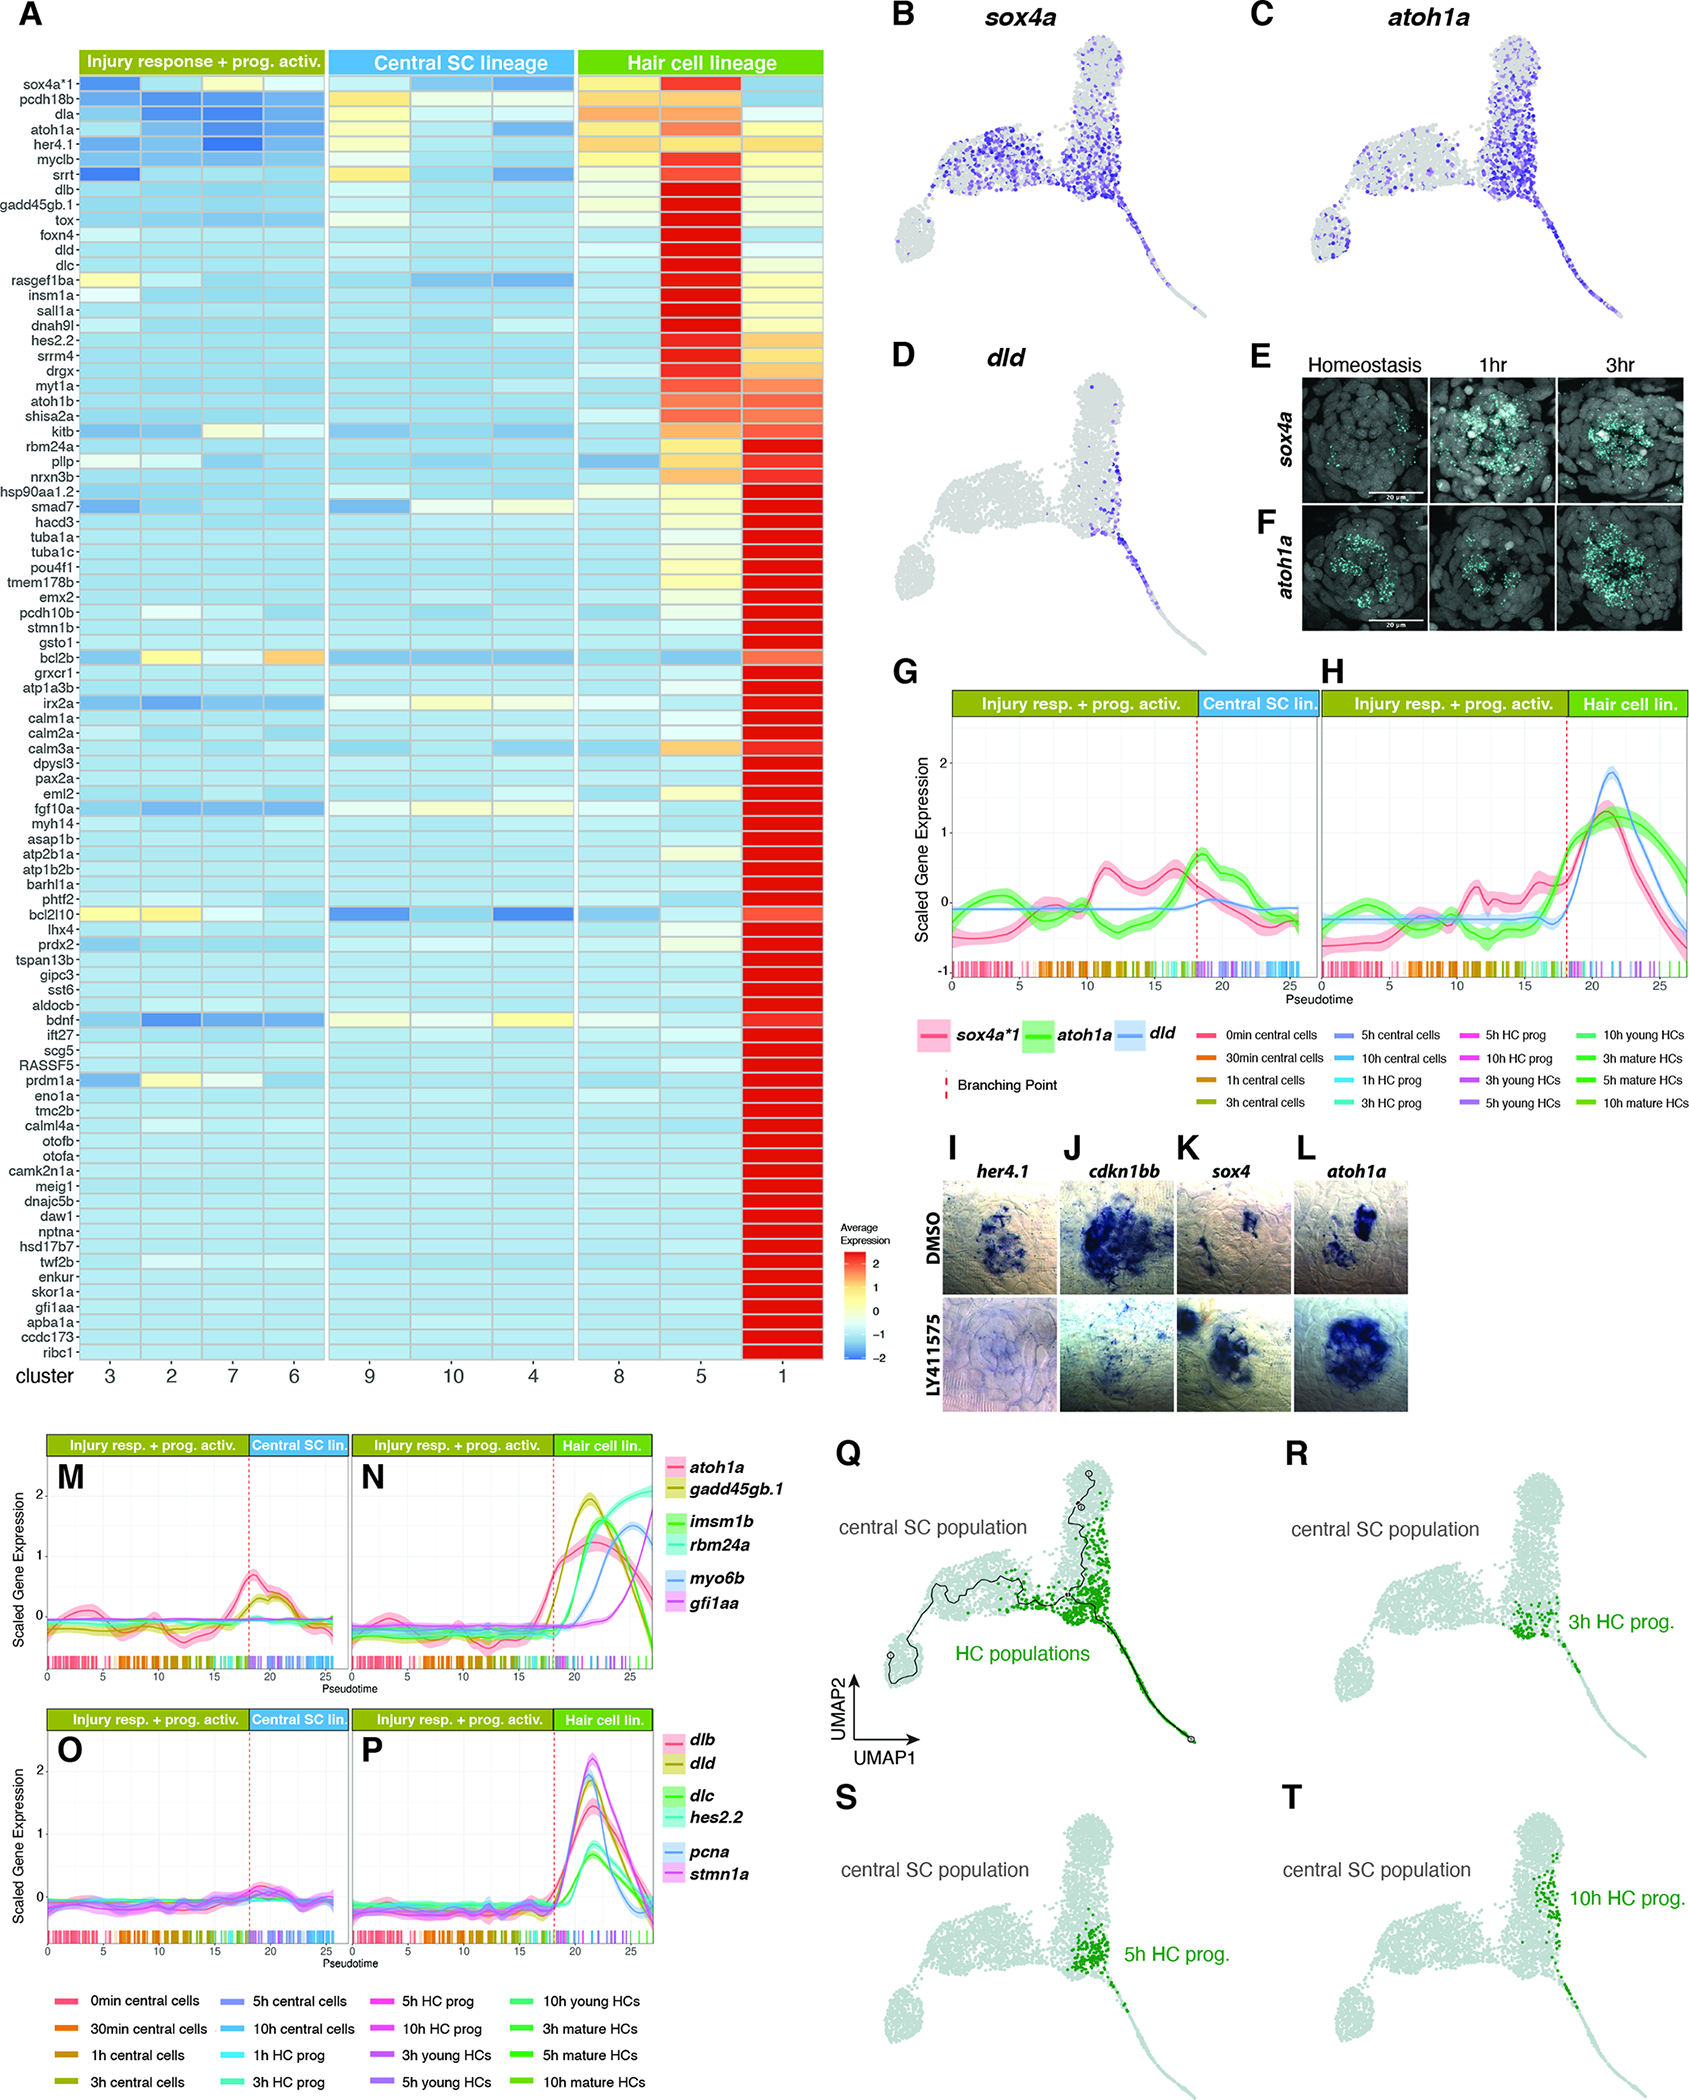
(A) Heatmap of the average expression of genes selectively enriched in HC lineage cells, partitioned by Louvain clusters.
(B-D) Feature plots of sox4a (B), atoh1a (C), dld (D).
(E and F) Fluorescent ISH (HCR) images of sox4a (E) and atoh1a (F) with DAPI in homeostasis, 1h and 3h after HC death. Scale bar: 20μm.
(G and H) Line plots of sox4a, atoh1a, and dld scaled expression along the pseudotime trajectory in the (G) central SC lineage and (H) HC lineage. Individual cells are represented by color-coded tics on the x-axis.
(I-L) ISH images of her4.1, cdkn1bb, sox4a, and atoh1a in 5dpf DMSO- or LY411575-treated (to inhibit Notch signaling) neuromasts. Larvae were treated for 6h before fixation.
(M and N) Line plots of the scaled expression of atoh1a, insm1b, myo6b, gadd45gb.1, rbm24a, and gfi1aa along the pseudotime trajectory in the (M) central SC lineage and (N) HC lineage. Individual cells are represented by color-coded tics on the x-axis.
(O and P) Line plots of dlb, dld, dlc, hes2.2, pcna, and stmn1a scaled expression along the pseudotime trajectory in the (O) central SC lineage and (P) HC lineage.
(Q) UMAP of the distribution of HC populations comprised of HC prog., young HCs and mature HCs.
(R - T) UMAP of the distribution of 3h, 5h, and 10h HC progenitor populations, respectively.
To identify differentially expressed genes between time points, we compared cells in a query time point against cells in all other time points (Table S3). Table S4 shows the differential gene list of cells grouped by time point and cell type. The transcriptional responses to HC death are rapid and cohorts of genes are rapidly down- and up-regulated throughout regeneration (Figure 1H, Table S3). Comparison with a previously generated list of neomycin-induced genes (Jiang et al., 2014) shows that only a handful of the differentially expressed genes in the current study are due to neomycin toxicity (Table S3, column Q). UMAPs of individual cell types, in which cells are grouped according to the degree of similarity in their transcriptomes, show three modules (example central SCs, Figure 1I, Table S4). Cells at the 0min time point have a drastically different transcriptome than homeostatic cells and the 30min time point (Figures 1I–M). Cells collected at the 30min and 1h time points are more similar to each other but distinct from the 3h-10h time points. 5 and 10h cells are transcriptionally most similar to homeostatic cells. These groupings are not caused by batch effects as cells collected at different time points possess similar number of UMI count distribution (Data S1 page 2C). 3h and 5h time points showed the highest mean number of genes per cell, supporting our theory that the most dynamic transcriptomic changes occur in these time points (Data S1 page 2D). The largest number of transcriptional changes occur in central, A/P, D/V and HC progenitor cells, whereas amplifying cells, HC progenitors, young and mature HCs show a much smaller response (Figures 1I–M, Data S1 page 2E–G, Table S4). Mantle cells also show robust transcriptional changes, even though they do not proliferate in response to neomycin-induced HC death (Data S1 page 2G; (Romero-Carvajal et al., 2015)). We observed the largest number of upregulated transcripts at 3h after HC death, whereas between 0min- 1h more genes are down- than upregulated.
In summary, our transcriptome analysis of closely spaced time points revealed that transcriptome changes occur rapidly in SC populations immediately after killing HCs. The different regeneration time points can be roughly grouped into three modules: 0min, 30min/1h and 3h/5h/10h. To determine what transcriptional changes occur between the three modules, we generated heatmaps with time point- and cell type-enriched genes (Tables S3 and S4) and selected genes that changed systemically in several cell types or specifically in a few cell populations. We show selected genes in heatmaps (Figures 2–5; extended gene lists in Data S1). The dot plots contain pathway genes that did not pass our stringent filtering criteria but are nevertheless differentially expressed. The enrichment term analyses were performed on genes enriched per time point (Table S3 genes, Figures 2–5). The list of cell-type specific genes is too short for a meaningful enrichment term analysis.
Figure 2. Downregulation of progenitor maintenance/placodal genes, Notch and Fgf- signaling 0min after HC death.
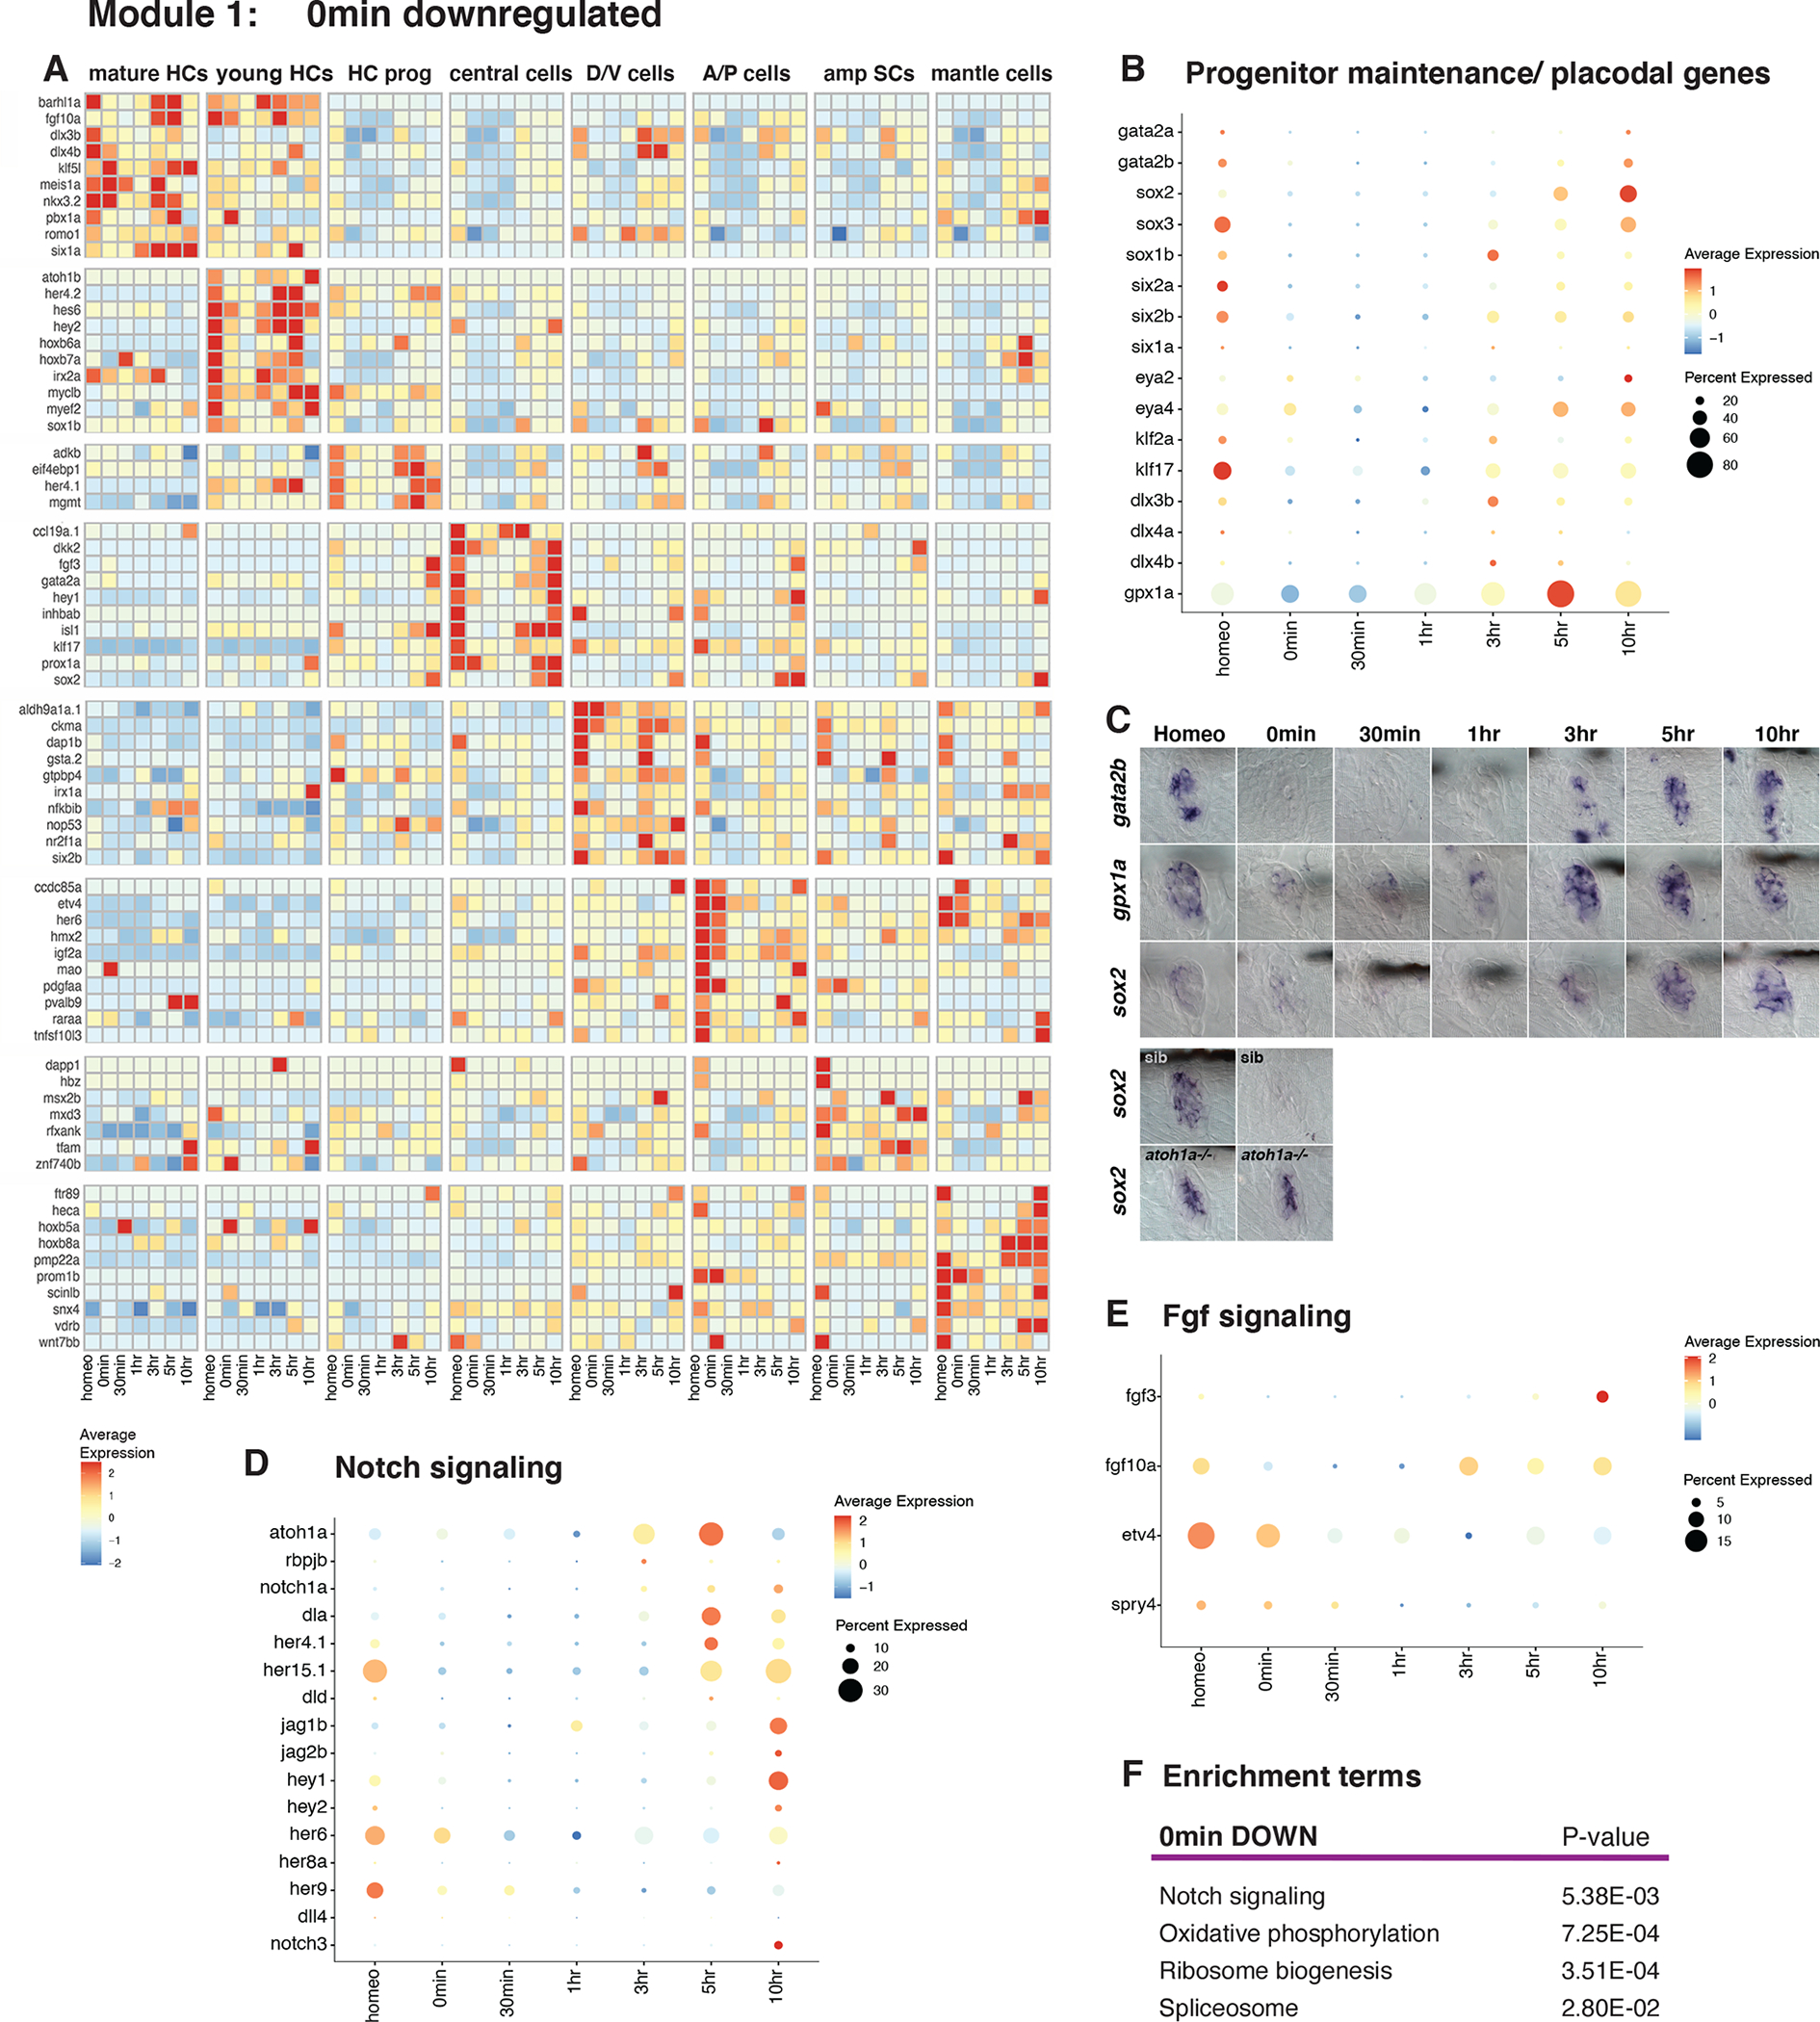
(A) Heatmap of selected cell type-specific downregulated genes 0min after neomycin treatment.
(B) Dot plot of the average expression of progenitor/stem cell maintenance/placodal genes during HC regeneration. The size of the dots represents the proportion of cells expressing the gene.
(C) ISH images of gata2b, gpx1a, and sox2 expression during HC regeneration. Bottom two rows: ISH of sox2 in siblings and atoh1a CRISPR mutants during homeostasis and 0min after neomycin treatment.
(D and E) Dot plots of the average expression of Notch (D) and Fgf (E) pathway members during HC regeneration.
(F) Enrichment term analysis of downregulated genes 0min after HC death compared to all other time points.
Module 1 (0min): Downregulation of progenitor maintenance/placodal genes and upregulation of injury/inflammatory response genes
Progenitor maintenance/placodal genes are rapidly turned off after neomycin treatment but are re-expressed between 3–5h (Figure 2, Table S3–S5). In contrast, injury/inflammatory genes are rapidly activated after HC death but are sharply turned off again after 30min- 1h (Figure 3, Table S3–S5).
Figure 3. Injury/inflammatory response genes are rapidly upregulated 0min after HC death.
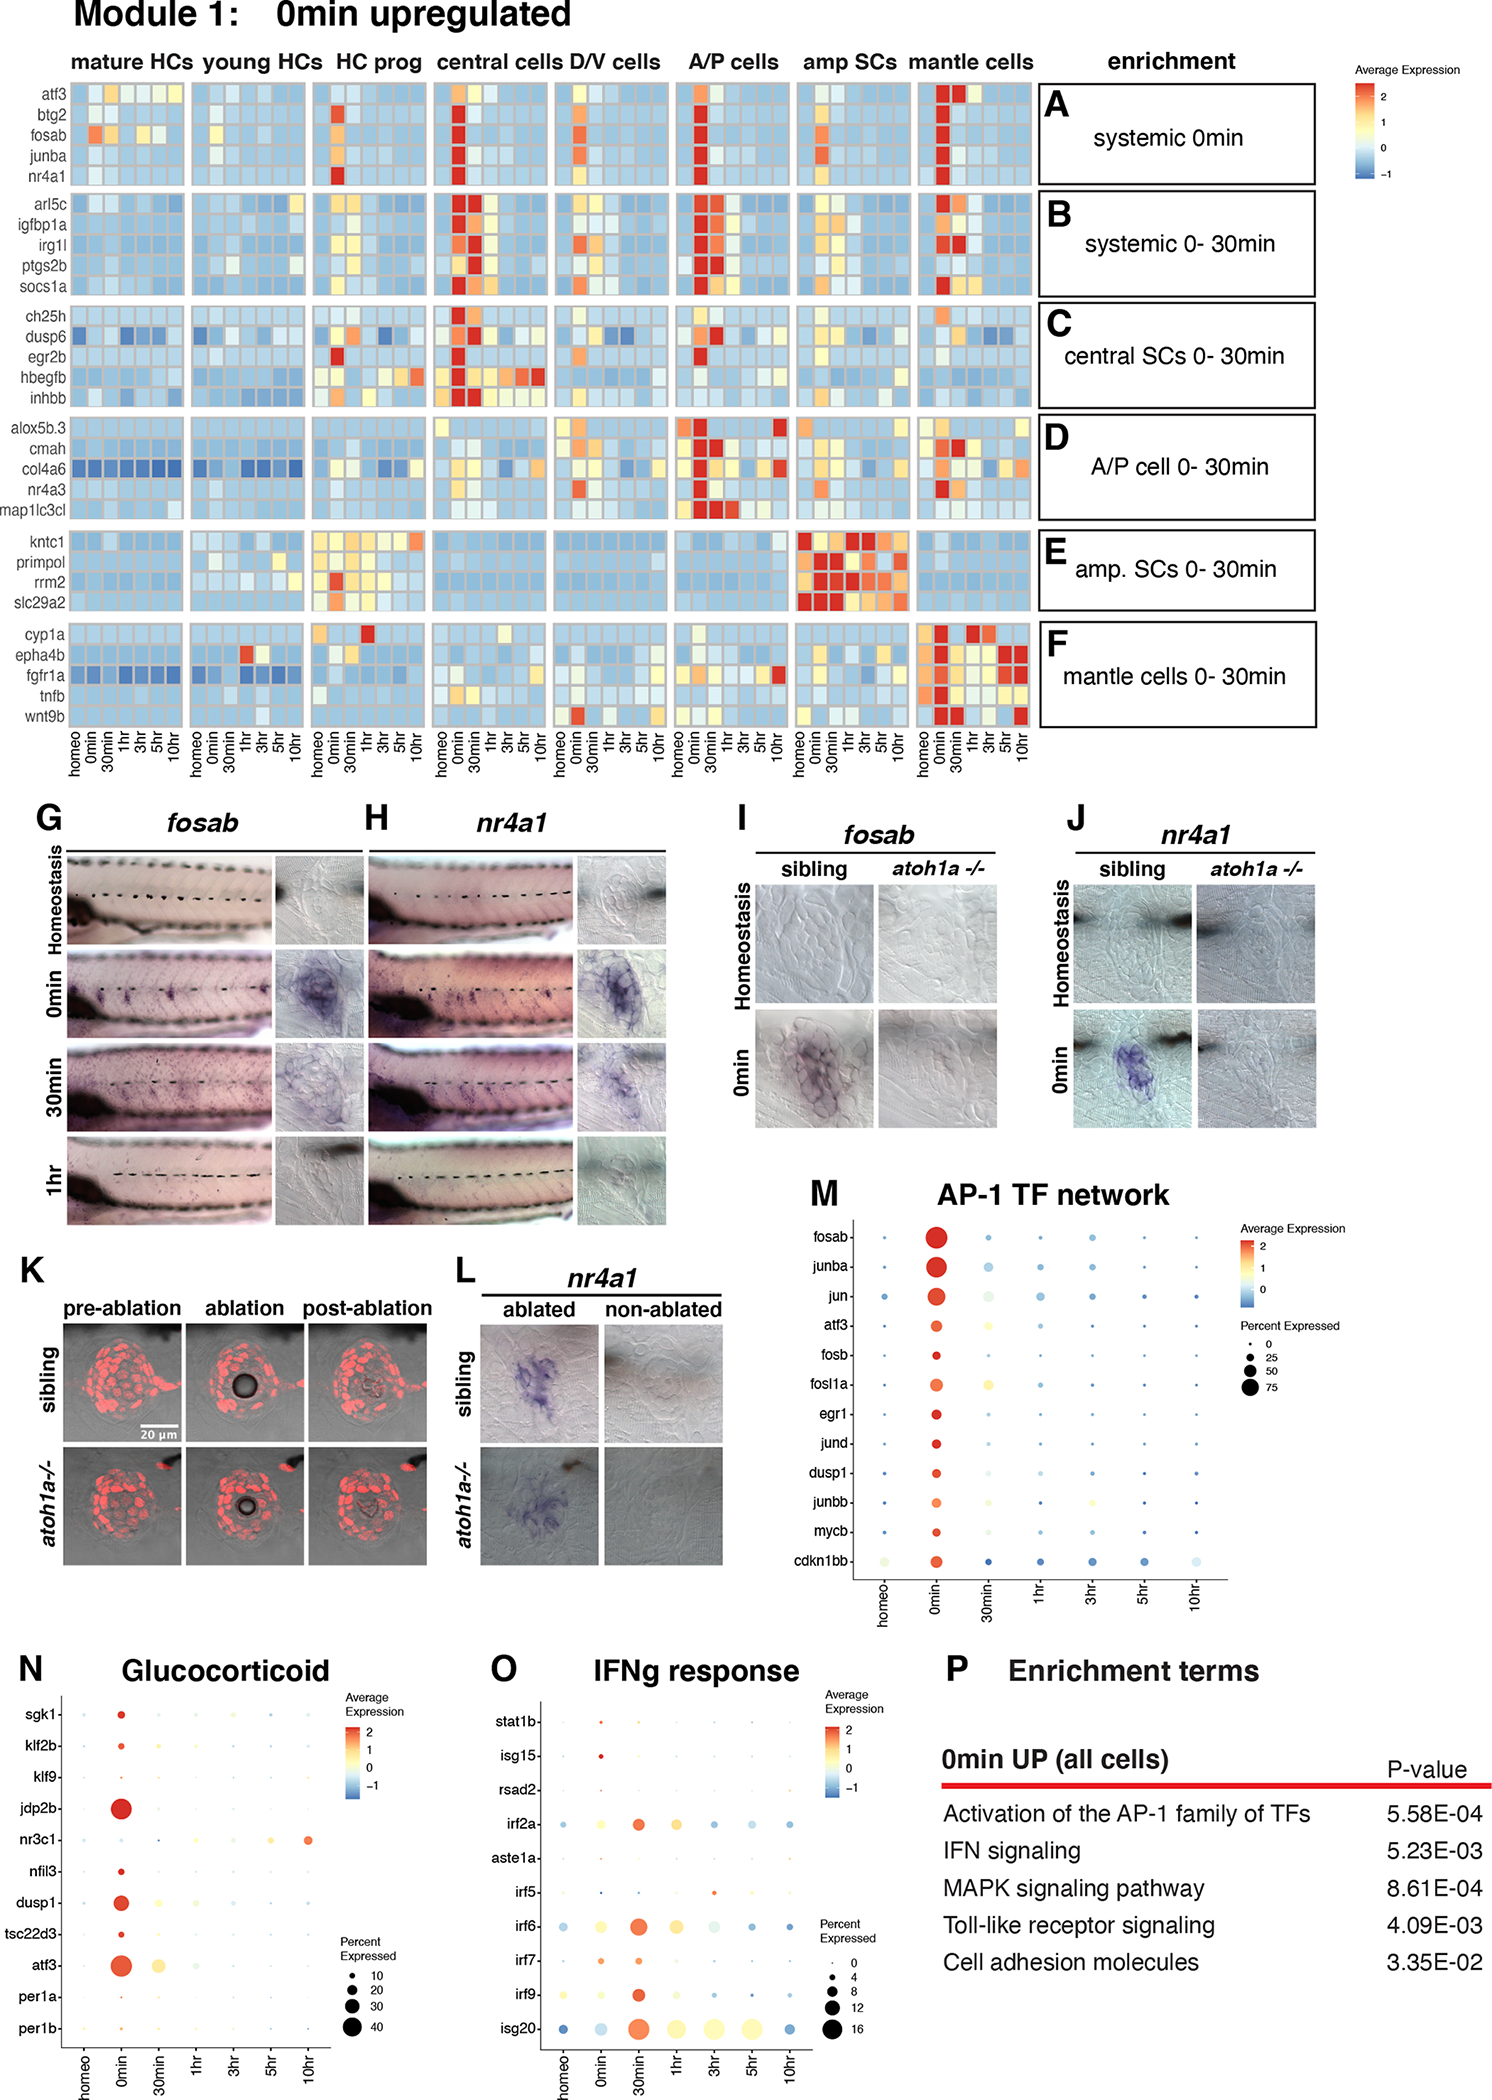
(A - B) Heatmap of the expression of selected genes upregulated in all SCs at (A) 0min and (B) 0–30min.
(C - F) Heatmaps of genes upregulated in different cell types at 0min and 30min after HC death.
(G and H) ISH images of (G) fosab and (H) nr4a1 in neuromasts at homeostasis, 0min, 30min, and 1h after HC death.
(I and J) ISH images of (I) fosab and (J) nr4a1 expression in neuromasts of sibling and atoh1a CRISPR mutants at homeostasis and 0min after HC death.
(K) Confocal images of Tg(she:H2A-mCherry) neuromast cells and transmitted light during laser ablation in 5dpf sibling and atoh1a CRISPR mutants.
(L) ISH images of nr4a1 expression in laser-ablated and non-ablated neuromasts of sibling and atoh1a CRISPR mutants.
(M - O) Dot plots of the relative expression of (M) AP-1 TF network members, (N) Glucocorticoid receptor and (O) IFN signaling in neuromasts during HC regeneration.
(P) Gene enrichment term analysis for genes upregulated 0min after HC death compared to all other time points.
Downregulation of progenitor maintenance/placodal genes, Notch- and Fgf signaling 0min after HC death
0min after neomycin treatment more genes are down- than upregulated (Figures 1I–M). A heatmap of the downregulated genes in different cell types and at different time points shows that the downregulation of genes at 0min is transient and that the majority of genes are re-expressed between 3–10h (Figure 2A, Data S1 page 4, Table S4). It is also apparent that many downregulated genes are cell type specific. Among the downregulated genes are several involved in ear/lateral line placode development, including stem cell markers, such as sox2/3, as well as the Notch-, and Fgf signaling pathways (Figures 2B–E, Table S4; (Graham et al., 2003; Hernandez et al., 2007; Jiang et al., 2014; Sarkar and Hochedlinger, 2013)). We validated the downregulation of these genes by in situ analysis (Figure 2C, also (Jiang et al., 2014)). To test whether the observed downregulation is not caused by the neomycin treatment, we treated atoh1a mutant larvae, which lack HCs with neomycin (Figure 2C). sox2 is only downregulated after HC death in the siblings at 0min demonstrating that the downregulation of genes is not caused by the neomycin treatment but by the loss of HCs. Prior studies showed that Notch and Fgf signaling are downregulated to allow for Wnt-dependent cell proliferation (Lush et al., 2019; Romero-Carvajal et al., 2015). Notch downregulation is also required to initiate HC differentiation (Ma et al., 2008; Romero-Carvajal et al., 2015; Wibowo et al., 2011). Data S1 page 5A shows in which cell type progenitor maintenance/placodal, Notch and Fgf genes are enriched. vegfab is also downregulated at 0min but re-expressed by 10h (Data S1 page 4, central cells). Interestingly, Vegf is required for HC regeneration in the avian ear (Wan et al., 2020), but its role in the lateral line has not been previously described.
Enrichment term analyses on time point specific genes (Table S3) show that the most drastically downregulated processes are oxidative phosphorylation (OXPHOS), ribosomal proteins, genes involved in splicing and the Notch pathway (Figure 2F, Data S1 page 5B, Data S1 page 6, Table S3). These terms suggest that translation is inhibited and that the lateral line progenitor/stem cells undergo metabolic reprogramming, a characteristic of other progenitor/stem cells that become activated (Mathieu and Ruohola-Baker, 2017; Shyh-Chang and Ng, 2017).
Upregulation of the injury/inflammatory response, AP-1 complex, Tnf-, IFNg, Tgfβ and glucocorticoid signaling at 0min
Injury either induces early response genes in all SC types (Figures 3A–B) or only central-, A/P-, amp-, or mantle cells (Figures 3C–F, Data S1 page 7A–F, Table S3–S5; (Bahrami and Drablos, 2016)). Some early response genes are known to be involved in an inflammatory response that, depending on the context and timing have either pro- or anti-regenerative effects (Eming et al., 2017; Kyritsis et al., 2012; Namdaran et al., 2012; White et al., 2017). We found that AP-1 complex members (eg., fosab, fosb, fosl1a, jund, junba), the nuclear hormone receptor nr4a1 and other early response genes, such as atf3, egr1, and btg2 are strikingly upregulated at 0min but are turned off again at 30min (Figures 3A, G, H, M, Data S1 page 7A; (Cho et al., 2004)). Because AP-1 family members and nr4a1 respond to injury/inflammation, we wondered whether the neomycin treatment, rather than HC death causes the upregulation of these genes. We treated sibling and atoh1a mutants that do not possess HCs with neomycin and performed in situ hybridization with fosab and nr4a1 (Figures 3I–J). atoh1a mutant neuromasts do not upregulate these genes in response to neomycin treatment, demonstrating that they are specifically upregulated in response to HC death. We then tested whether nr4a1 upregulation is induced by HC death specifically (Figures 3K–L). We laser-ablated SCs in siblings and atoh1a mutants and found nr4a1 expression induced in both, demonstrating that death of any cell type leads to the upregulation of injury response genes.
Glucocorticoid and Jak/Stat signaling, as well as immunoresponsive gene 1-like (irg1l) are also activated in most cell types at 0min, but Jak/Stat and irg1l stay on until 30min/1h (Figure 3N, Data S1 page 8A–B, D). irg1l is induced in keratinocytes by macrophages after infection and in turn leads to metabolic reprogramming in macrophages (Hall et al., 2014). Its role in lateral line regeneration needs to be determined. Interferon-, and Tgfβ signaling are activated slightly later than the early response genes and are expressed in distinct subset of cell types (Figure 3O, Data S1 page 8C, D). Other genes are specifically enriched in particular cell types at 0min-1h, such as egr2b, ch25h and hbegfb in central cells and the autophagy gene map1lc3cl in AP cells (Figure 3A, Data S1 page 8A). Why these genes are activated in some but not all cell types remains to be investigated. Other enrichment terms describing genes upregulated at 0min are MAPK signaling, Toll-like receptor signaling and cell adhesion molecules (Figure 3P, Data S1 pages 6 and 8D, Table S3).
Module 2 (30min −1h): Regeneration specific genes, translation, RA-, MAPK signaling and cell adhesion are upregulated
Module 2 genes are either upregulated in all SCs and HC progenitors at 30min (bzw1b, cbx7a, txn, Figures 4A, F, H, I, K, Data S1 page 9, Table S4–S5) or they are specifically upregulated in young and mature HCs (lin28a, irx2a and pak1; Figures 4B, I, Data S1 page 9); some central SCs and the HC lineage (gadd45ga, kitlga; Figure 4B); the central SCs (e.g. cd44a, crabp2a, il11b, noxa1, rln3a, tgfb1a, arid3a; Figures 4C, G); A/P cells (Figure 4D) and mantle cells (Figure 4E). Retinoic acid (RA) signaling is also induced between 30min and 1h with pathway members being expressed in different cell types (Figures 4J–K). As a control, we performed in situ hybridization experiments with 30min-1h genes in atoh1a mutants that show that module 2 genes are not induced by neomycin toxicity but respond to HC death (Data S1 page 10). Enrichment terms that characterize upregulated genes at 30min are the MAPK cascade, NOD-like receptor signaling and Cell adhesion/tight junction, whereas ectodermal placode/otic vesicle development, Notch signaling, TCF-dependent Wnt signaling and oxidative phosphorylation are downregulated (Figure 4L, Data S1 pages 5 and 11, Table S3). At 1h, ribosomal and other translation-associated genes are induced, whereas signaling by Wnt, Notch, cell differentiation and metabolism is still downregulated (Figure 4L, Data S1 pages 5 and 11, Table S3).
Figure 4. Upregulated genes 30min–1h after HC death.

(A) Heatmap of the average expression of selected upregulated genes in several SC types and HC progenitors at 30min-1h.
(B - E) Heatmaps of the average expression of genes enriched in different cell types at 30min-1h after HC death.
(F and G) ISH images of genes upregulated at 30min-1hr in all SCs (F) and central SCs (G).
(H and I) Dot plots visualizing the average expression of (H) ‘regeneration enriched’ genes across regeneration time points and (I) neuromast cell types.
(J and K) Dot plots of the average expression of RA pathway genes across (J) regeneration time points and (K) cell types.
(L) Gene enrichment term analysis of up- and downregulated genes at 30min and 1h after HC death compared to all other time points.
Module 3 (3h- 10h): HC lineage becomes specified and ribosome biogenesis and splicing genes are activated (recapitulation of HC development)
As for the earlier time points, we combined a differential gene expression analysis (Figures 5A–E, Data S1 page 12A–E, Table S4) with a candidate pathway (Figures 5G–K) and an enrichment analysis (Figures 5M–O, Data S1 page 14) to characterize the genes/pathways that are upregulated between 3h-10h (Table S5). At 3h, ribosome biogenesis genes, such as nop58 (Figure 5F, Data S1 page 13A) and spliceosome genes are induced in most cell types (Data S1 page 13B), whereas epigenetic regulators (e.g., seta, arid3b, hdac3) and HC lineage genes, such as atoh1a are most highly expressed in young HCs (Figures 5B–C, Data S1 page 13C, Table S4–S5, (Bermingham et al., 1999; Chen et al., 2002; Gubbels et al., 2008; Woods et al., 2004; Zheng and Gao, 2000)). Downstream HC lineage targets, such as delta ligands, myclb, gadd45gb.1 and kdm6bb are upregulated by 5h (Figures 5C, I, Table S4). Likewise, Notch pathway genes, such as hey1, her15.1 and notch3 are re-expressed by 5h in central SCs to ensure that not all cells differentiate into HCs (Figure 5D, Figure 2D, Data S1 page 13E). Central SC genes, such as sox2, fgf3 and hey1 are also upregulated in 5–10h central SCs and HC progenitors (Figure 5D). Mantle cells specifically upregulate genes, such as fgfr1b and inhbaa (Figure 5E).
To examine the behavior of genes belonging to particular pathways, we generated dot plots with candidate genes for ribosome biogenesis, spliceosome, the HC lineage, Wnt- and Notch signaling, as well as cell cycle genes (Figures 5G–L, Figure 2D, Data S1 page 13A–E). Indeed, these genes/pathways are also highly enriched at 3–5h. Thus, even genes that were not identified, or were filtered out in our differential gene expression analysis can be queried using the shiny app or gEAR (Data S1 page 3)(Orvis et al., 2021). Wnt signaling regulates proliferation in the lateral line and pathway members are enriched in SC populations and downregulated in mature HCs (Jacques et al., 2014; Romero-Carvajal et al., 2015).
Concomitantly with Wnt signaling, cell cycle genes are induced at 3h (Figure 5K, most cell cycle genes were omitted from Figures 5A–E). Cell cycle genes are most highly expressed in amplifying cells but also in HC progenitors and young HCs (Figures 5E, L, Table S4). Amplifying cells that restore the SCs but do not differentiate are not shown in Figure 5L to highlight the expression in the HC lineage. Early cell cycle genes involved in DNA replication, such as mcm genes, are, in addition to amplifying cells, enriched in HC progenitors and A/P cells, whereas young HCs and D/V cells express genes characteristic of later stages of the cell cycle, such as mki67 (Figure 5L). Thus, the HC lineage is tightly associated with proliferation.
Enrichment analysis revealed that by 5h, oxidative phosphorylation is upregulated (Figure 5N, Data S1 page 6, S14) (Liberzon et al., 2015). Focal adhesion, tight junction and cell adhesion genes are downregulated during these time points, a hallmark of proliferating epithelial cells. By 10h many of the genes associated with otic vesicle/ectodermal placode development, such as sox2 and sox3 are re-expressed, while MAPK signaling- and translation genes are markedly downregulated (Figure 5O). The re-expression of Notch- and progenitor maintenance/placodal genes shows that HC and SC ratios are dynamically regulated during regeneration. The discrete waves of gene up- and downregulation closely recapitulate key aspects of HC development.
Pseudotime analysis indicates that central SCs either differentiate into HCs or they re-express SC genes
To gain a better understanding of the lineage trajectories that central SCs undergo during regeneration and to identify associated genes, we ordered central support-, progenitor- and HCs along pseudotime using Monocle 3 (Cui et al., 2020; Qiu et al., 2017; Trapnell et al., 2014b). We chose to limit the analysis to these cell types, as in vivo lineage tracing showed that central SCs are the direct precursors to HCs (Lush et al., 2019). Although D/V and A/P cells can also give rise to HCs (Romero-Carvajal et al., 2015; Thomas and Raible, 2019; Wibowo et al., 2011), it still needs to be determined whether A/P and D/V cells first acquire a central SC fate.
To generate the UMAP in Figure 6A we specified 0min central cells (in purple) as the start of the trajectory. Cells with later pseudotime values are colored in yellow. The black line is the fitted trajectory along pseudotime and indicates lineage decisions that cells can take. Pseudotime is related to but not necessarily identical to developmental time. Nevertheless, our pseudotime lineage trajectory model is temporally largely consistent with the regeneration time points that the cells were collected at, with 10h HCs and 10h central SCs being at the end of each of the two lower and upper branch trajectories, respectively (Figure 6B). In contrast to the differential gene expression performed on all cells from all time points (Figure 2- Figure 5), pseudotime analysis reveals a branch point at which cells either follow a path to HC differentiation (Figure 6B, lower branch) or they revert to a central SC state (Figure 6B, upper branch).
The branch point at which cells are predicted to undergo a lineage decision occurs in cells at the 3–5h time points (Figure 6A, B). To identify the genes that are expressed in cells before the branch point, we aggregated cells into clusters and performed a differential gene expression analysis between clusters of these different cell groupings/lineages (Figure 6C, Table S6). This analysis showed that sets of genes are progressively activated or de-activated in the injury response and progenitor activation cluster (Figure 6C clusters 3, 2, 7 and 6), the central SC lineage (Figure 6C clusters 9, 10, and 4), and the HC lineage (Figure 6C clusters 8, 5, and 1). The injury response and progenitor activation clusters are characterized by expression of cd44a (Figure 6D), while the central SC lineage is marked by the upregulation of gata2b (Figure 6E). The HC lineage cluster is represented by the expression of rbm24a, an RNA-binding protein that regulates alternative splicing (Figure 6F).
Genes modulated in central SCs before the branch point
The heatmap (Figure 6G) and feature plots show genes that are immediately upregulated in cluster 3 central SCs (Figure 6C) in response to HC death but that are off in cluster 2, such as fosab (Figures 6 G, H, Data S1 page 15A, Table S6); genes that are upregulated in clusters 3, 2, 7, 6, (Figure 6C) such as irg1l (consisting mostly of 30min and 1h central cells, Figures 6G, I, Data S1 page 15A, Table S6); and genes that are most highly expressed in clusters 6 and 7 (Figure 6C) before the branch point, such as lima1a (Figures 6G, J, Data S1 page 15A, Table S6). Line graphs of scaled gene expression of fosab, irg1l and lima1a in cells aligned along pseudotime clearly show these distinct gene expression dynamics (Figures 6K, L).
Genes modulated in the central SC lineage after the branch point
To identify genes expressed in the central SC lineage versus the HC lineage after the branch point, we specified the end and start points of each lineage and the algorithm assigned cells at and beyond the branch point to either lineage (Data S1 page 15B). Cells before the branch point are shared between both lineages. The central SC lineage chiefly consists of clusters 9, 10 and 4 (Figure 6C, Table S6) and the expression dynamics of genes enriched in these clusters is shown in Figure 7A. Among those enriched in the central SC lineage after the branch point are placodal/stem cell-associated genes, such as sox2, sox3, gata2a, gata2b, klf2a, klf17 and prox1a (Figure 7B; Data S1 page 16, Table S6). sox3 is already upregulated before the branch point but then rapidly turned off in the HC lineage (Figure 7B). Plotting these genes in a heatmap that contains all cell types and homeostatic cells shows that many of the central SC lineage genes are also present during homeostasis. A number of these genes are also expressed in 10h A/P cells and mantle cells, suggesting that these cell types return to their homeostatic transcriptional state (Data S1 page 16).
Figure 7. Pseudotime analysis (central SC lineage after the branch point).

(A) Heatmap of the average expression of genes selectively enriched in the central SC lineage, partitioned by Louvain clusters.
(B) Feature plot of sox3 and list of other expressed genes.
(C) Feature plot of hey1 and list of Notch pathway members that are also expressed.
(D) Line plots of the scaled expression of sox3, prox1a, and hey1 along the pseudotime trajectory in cells of the central SC lineage and HC lineage cells. Individual cells are represented by color-coded tics on the x-axis.
Notably, the Notch pathway is also upregulated along pseudotime and highest in cluster 4 cells (Figure 7C, 6B–C, 10h central cells). Line plots of scaled gene expression along pseudotime show that sox3, prox1a and the Notch target hey1 are upregulated in the central SC lineage (Figure 7D).
We conclude from these analyses that the central SCs are on a trajectory back to becoming homeostatic central SCs. Indeed, the majority of the central SC lineage genes are expressed at homeostasis but are subsequently downregulated at 0min and are later re-expressed between 3–10h (Data S1 page 16).
Genes modulated in the HC lineage
Atoh1 is required for HC specification but is not sufficient to regenerate a fully functional sensory epithelium when overexpressed in mammals in culture (Burns and Stone, 2017; Jen et al., 2019). To identify additional genes that show similar expression dynamics as atoh1a, we compared gene expression between central SCs and HC lineage clusters 8, 5 and 1 (Figure 6C, Table S6). Cluster 8 cells are HC progenitors and 5 and 1 consist of young and mature HCs, respectively. Differential gene expression analysis between combinations of clusters shows the progression of gene expression along pseudotime (Figure 8A, cell cycle genes were excluded). We were particularly interested in identifying genes that might be involved in specifying HCs upstream of atoh1a. sox4a (called sox4a*1 in our data sets) is an attractive candidate, as it is involved in HC development (Gnedeva and Hudspeth, 2015) and is expressed in a few central cells, as well as the HC lineage (Figure 8B; (Lush et al., 2019)). Indeed, our scRNA-Seq analysis shows that sox4a is upregulated before atoh1a at 30min, whereas atoh1a is activated at 3h (Figure 5I, Figures 8B, C, Data S1 page 17A–D). Both genes are expressed in central cells and the HC lineage (Data S1 page 17C, D). We validated this difference in the onset of gene expression after HC death using HCR in situ hybridization (Figures 8E, F). Line plots of sox4a, atoh1a and dld show that sox4a is expressed before atoh1a and that dld is expressed after atoh1a is upregulated (Figures 8G, H).
Notch signaling needs to be inhibited for HC specification genes to be expressed and we therefore wondered if sox4a is regulated by Notch signaling. Indeed, the downregulation of Notch signaling by the γ-secretase inhibitor LY411575, as evidenced by the loss of her4.1 and cdkn1bb expression (Figures 8I, J) leads to the upregulation of sox4a and atoh1a (Figures 8K–L).
Line plots show temporal gene expression changes of well-known HC lineage genes with higher granularity than the heatmap in Figure 8A. Line plots reveal that the HC specifying genes atoh1a and the cell cycle regulator gadd45gb.1 are upregulated in central SCs before the branch point (Figures 8M, N, stippled line), continue to increase in the HC lineage after the branch point (Figure 8N) but are downregulated in the central SC lineage (Figure 8M). Within the HC lineage atoh1a and gadd45gb.1 are followed by insm1b, rbm24a, myo6b and trailed by gfi1aa (Figure 8N). Line plots, the heatmap and feature plots also show that cell proliferation (pcna, stmn1a) occurs in the HC lineage (Figure 8P, dlb, dld, dlc, hes2.2) after the branch point and that cells in the central SC lineage do not proliferate (Figure 8O, Data S1 page 17E–F). The high-resolution characterization of gene expression dynamics in the HC lineage serves as a reference for developing protocols to induce HCs in culture and to improve HCs induction during mammalian regeneration.
HC progenitors likely revert to a central cell fate
When we plotted the distribution of cells in the HC lineage along pseudotime, we observed HC progenitors clustering with the central SC lineage (Figure 8Q, T, green cells). A more detailed analysis of HC progenitors from different time points showed that, whereas most of the 3 and 5h HC progenitors are located immediately after the branch point close to the HC lineage (Figures 8R, S), 10h HC progenitors group mostly with the central SCs (Figure 8T) suggesting that these cells had turned on HC genes but then failed to fully differentiate and instead turned on central cell genes. To substantiate our hypothesis that a group of 10h HC progenitors abort the HC lineage program and instead revert to a SC fate, we estimated RNA velocity by measuring unspliced and spliced mRNA (La Manno et al., 2018). RNA velocity predicts the future state of single cells. The vectors in the UMAP in Data S1 page 17G show the general movement of 10h HC progenitors (pink cells, fat arrow) toward the 10h SC fate (blue cells). We hypothesize that initially more cells are competent to become HCs but that the re-expression of Notch lateral inhibition signaling between 3–5h ensures that not all cells turn into HCs but also into SCs (Data S1 page 13E, Figure 7C; Romero-Carvajal., 2015). This interpretation is supported by the finding that only few of the atoh1a expressing central SCs later turn on dld (Figures 8C–D).
Overview of cellular and molecular processes during the regeneration time course
To identify genes with similar trajectory-dependent expression dynamics and which may be co-regulated, we clustered these genes into units using Monocle 3 (Data S1 page 18, Table S7). We identified eight gene units. To gain an understanding of the processes that characterize different stages of regeneration, we performed Enrichment term analysis on unit genes (Data S1 page 18). Unit 3 is comprised of injury response genes. Units 8, 1, and 6 describe genes that are upregulated in cells before the lineage decision branch point and that are then enriched in the HC lineage, such as genes involved in ribosome biogenesis/translation, splicing and oxidative phosphorylation. Unit 2 contains genes of the central SC lineage involved in sensory organ development and stem cell maintenance, and units 4, 7 and 5 contain HC lineage genes with the enrichment terms cell cycle, stereocilium organization, glycolysis and glutathione metabolism. Figure 9 synthesizes the dynamic changes of cellular and molecular processes that occur during the three modules of the HC regeneration process.
Figure 9.
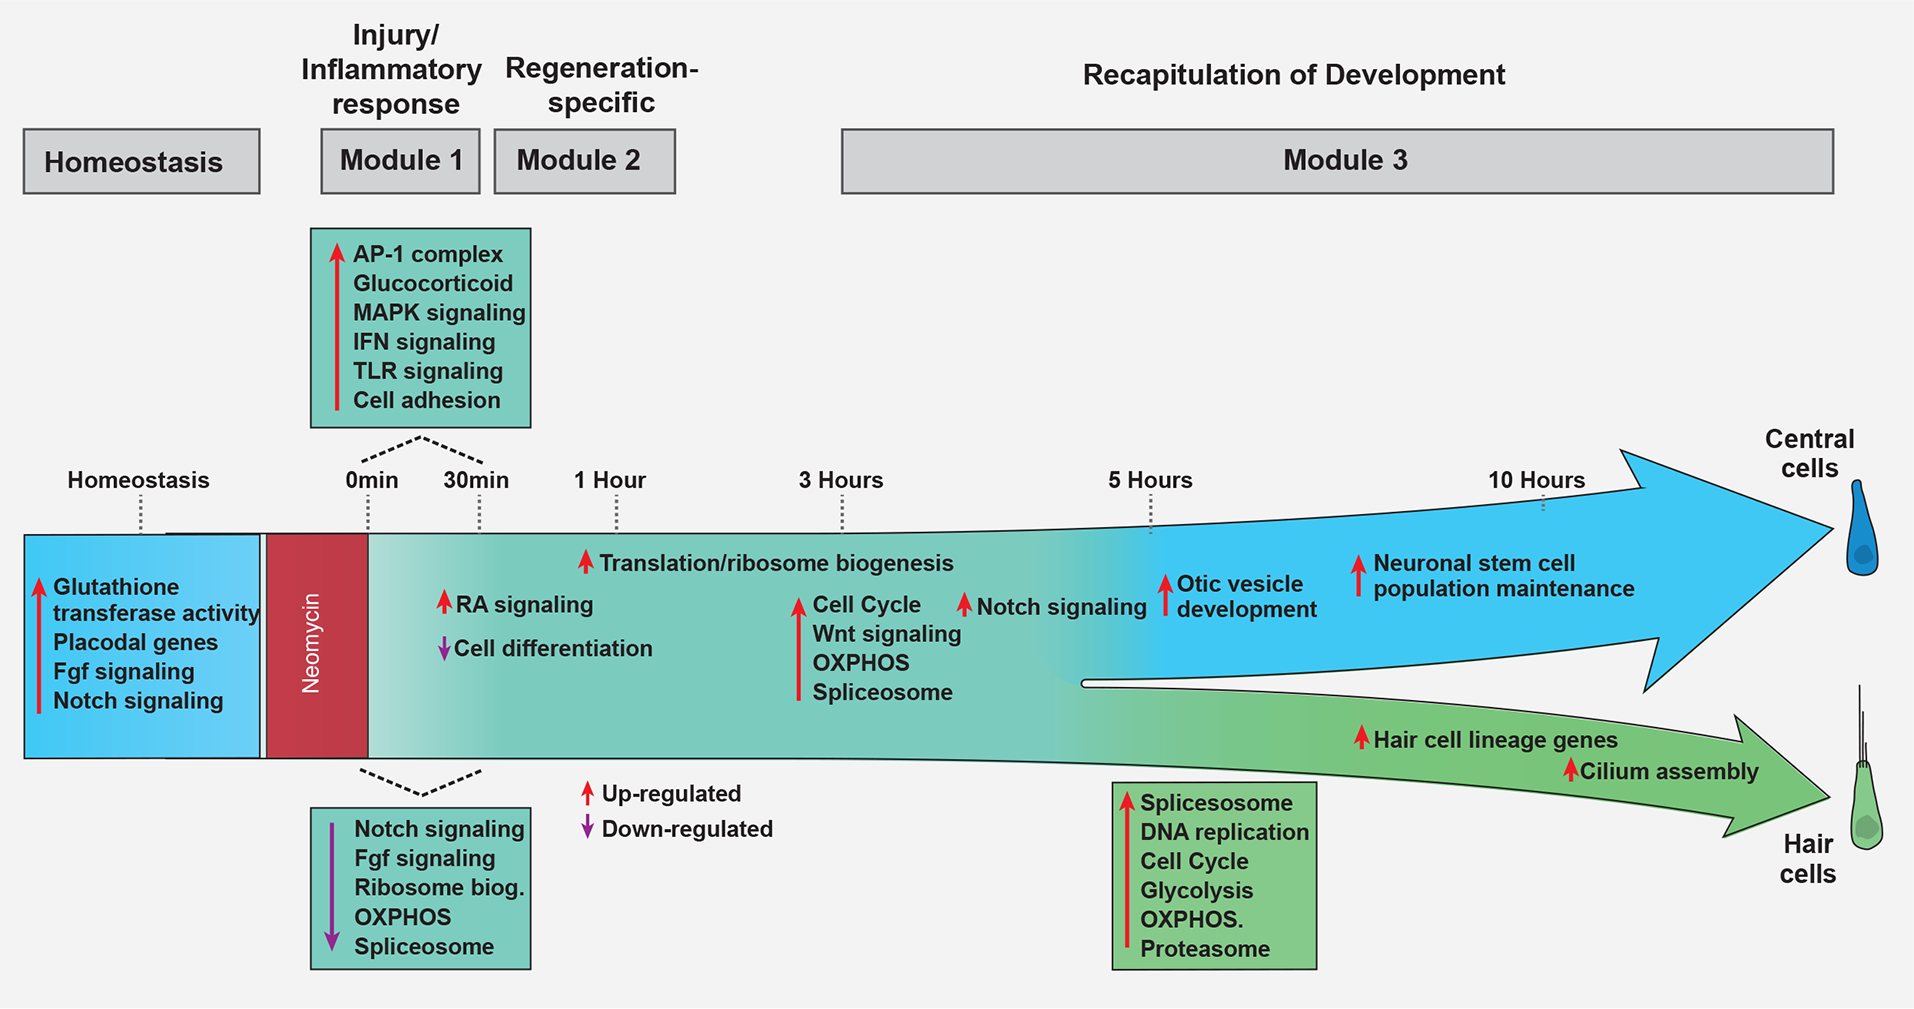
Overview of the molecular processes occurring during HC regeneration.
Discussion
Inner ear HC and lateral line sensory organ development share key regulatory signaling pathways. Yet, unlike fish, mammalian HCs do not regenerate once damaged. The remarkable speed (3–5h) at which zebrafish regenerate lateral line HCs after injury allowed us to characterize the gene expression dynamics of a regenerating vertebrate sensory organ at unprecedented resolution. Our results provide a blueprint of a gene regulatory network that enables SCs to re-enter the cell cycle and replace lost HCs. The fact that a number of genes/pathways involved in the regeneration of other sensory organs such as the retina in different species are also employed during lateral line regeneration indicates that knowledge gained in a particular research organism or organ can inform studies in other species or organ systems (Denans et al., 2019; Hoang et al., 2020; Wan and Goldman, 2016).
Gene expression changes occur within minutes after cell death
Our closely timed tissue collections demonstrated that drastic transcriptional changes occur within minutes after HC death. Recent studies showed that early response genes are required for triggering regeneration (discussed below). Yet, even though regeneration studies in different species increasingly include scRNA-Seq analysis, the majority of these studies collect only few time points and also collect the first sample many hours, or even days after injury. Our data indicate that to gain a complete understanding of the transcriptional dynamics underlying regenerative processes and to allow for comparative analyses between species, it is essential to characterize many closely spaced time points, starting within the first hour after injury.
The injury/inflammatory response likely triggers regeneration
Genes expressed within minutes after HC death are injury or early response genes that are often involved in inflammation (Figure 3 and Figure 6G; (Bahrami and Drablos, 2016; Cho et al., 2004; Landen et al., 2016; Wang et al., 2020)). Inflammation has pro-regenerative effects in several contexts (Eming et al., 2017; Kyritsis et al., 2012; Namdaran et al., 2012; White et al., 2017), yet the timing of inflammation and its resolution by anti-inflammatory processes is crucial. Pharmacological suppression of the immune response before retina and CNS injury in zebrafish leads to a diminished regenerative response; however, blocking inflammation after injury speeds up the regeneration process (Kyritsis et al., 2012; White et al., 2017). These findings suggest that the inflammatory response facilitates the onset of the regeneration process but needs to be shut off for regeneration to proceed.
We did not observe a strong pro-inflammatory response, such as robust tnfa, il1b or il6 induction after HC death. However, nr4a1, a target of il1b, tnfa and nfkb is still strongly induced, as are AP-1 transcription factors (Figures 3A, M; (Pei et al., 2005)). Simultaneously, anti-inflammatory glucocorticoid signaling and nfkb inhibitors are rapidly activated at 0min (Figure 3). Interestingly, synthetic glucocorticoid agonists modestly enhance lateral line HC regeneration by increasing mitotic activity (Namdaran et al., 2012). Thus, it is possible that the short, pro-inflammatory signal observed in our study may facilitate HC regeneration by minimizing the detrimental effects of a long-term pro-inflammatory response (Denans et al., 2019; Landen et al., 2016; Monje et al., 2003). Jak/Stat3 is also induced at 0min. Loss of stat3 function causes defects in HC regeneration/development in zebrafish and mice (Chen et al., 2017; Liang et al., 2012). The IFNG-pathway responds to HC loss at 30min (Figure 3O). It acts upstream of Jak/Stat1 and is involved in skeletal muscle regeneration. Yet, the role of the IFNG-pathway in HC regeneration remains to be investigated (Cheng et al., 2008; Zaidi, 2019). How early response pathways repress or activate each other still needs to be characterized (Cho et al., 2004; Xavier et al., 2016).
The AP-1 complex is of particular interest because it is not only required for wound healing but also for regeneration in several contexts (Beauchemin et al., 2015; Ishida et al., 2010; Raivich et al., 2004; Wenemoser et al., 2012), possibly by promoting chromatin accessibility (Beisaw et al., 2020). Additionally, AP-1-motif enriched regeneration responsive enhancers are likely a reason why non-mammalian vertebrates are better at regenerating (Wang et al., 2020). Even though mouse AP-1 enhancer elements drive gene expression in response to injury, they are unable to trigger a regenerative response, likely because of enhancer repurposing during evolution. It would therefore be important to test if AP-1 factors are required for HC regeneration in fish and if they are, compare the ability of the fish and mouse AP-1 motif containing enhancers to not only induce an injury but also a regeneration response. Interestingly, noise induced HC damage in the rat cochlea leads to upregulation of the early response genes Egr1, Nr4a1(Nur77) and Btg2, but regeneration is not triggered supporting the notion of enhancer repurposing in mammals (Cho et al., 2004).
Regeneration specific genes are active between 30min and 1h
Genes and pathways such as the retinoic acid pathway, which are enriched between 30min and 1h, are relatively regeneration specific, as they are not, or only lowly expressed during homeostasis. They show surprisingly short-lived activation and are again downregulated between 3–5h. Many of these genes have been implicated in regeneration, such as il11 that stimulates progenitor cells in axolotl tail regeneration and Jak/Stat3 and the Nr4a1 target relaxin3a (rln3a) that are required for zebrafish heart regeneration (Figure 4G, (Fang et al., 2013; Tsujioka et al., 2017; You et al., 2018)). Likewise, the RNA binding protein Lin28 supports mouse axon regeneration, coordinates HC progenitor proliferation and differentiation and zebrafish HC regeneration (Doetzlhofer and Avraham, 2017; Wang et al., 2018; Ye et al., 2020). Lin28a also leads to enhanced tissue repair by metabolic reprogramming and increased glycolysis and oxidative phosphorylation in mice (Shyh-Chang et al., 2013). It is possible that these genes possess enhancers with AP-1 binding motifs and may represent the switch from a wound healing to a regenerative response, a hypothesis that can be readily tested in future work.
Progenitor/stem cell maintenance/placodal genes are immediately downregulated
During the first 1h of HC regeneration more genes are downregulated than upregulated, which could represent a reprogramming step. A number of these genes, such as Notch/Fgf pathway members, sox, six/eya, gata, dlx and the antioxidant enzyme glutathione peroxidase 1a (gpx1a) are also expressed in the lateral line placode during development, and their homologs are involved in the development of HCs in the mammalian inner ear (Figure 2B, (Basch et al., 2016; Kolla et al., 2020; Roccio et al., 2018)). Sox2/3, Six/Eya, Klf, Gata and Dlx transcription factors play multiple roles, such as stem cell maintenance, induction of pluripotency and lineage determination. gpx1a has been implicated in ES cell self-renewal (Wang et al., 2014). Likewise, we and others have previously shown that Notch and Fgf pathway downregulation is essential for SC proliferation and that their re-expression at the end of the regeneration process is required for SC maintenance (Lush et al., 2019; Ma et al., 2008; Romero-Carvajal et al., 2015). We propose that the downregulated genes are candidates that when temporarily inhibited might improve mammalian SC reprogramming and HC regeneration (Iyer and Groves, 2021).
HC specification is triggered in the majority of 3–5h central SCs but only a subset differentiates into HCs
Between 3–5h the majority of central SCs upregulate the HC specifier atoh1a (Figures 5I, 8C, 8F) but then only a subset also activate dld and enter the HC lineage (Figures 5I, 8D). The other cells maintain atoh1a expression for a few hours but simultaneously upregulate central SC genes and enter the SC lineage (Figures 8C, D). This finding is in line with observations in Drosophila photoreceptor and zebrafish otic development where Atoh is first broadly expressed and acts as a proneural gene, but subsequently only a subset of the cells acquire a sensory fate (Cai and Groves, 2015). Unexpectedly, even a few dld expressing cells appear to revert back to the central SC lineage (Figure 8D, Data S1 page 17G). Figure 8S–T show 5 and 10h HC lineage cells that align with central cells along pseudotime. These findings are consistent with recent reports that progenitors of different neural crest cell lineages initially express markers of both lineages and that lineage decisions arise over time (Soldatov et al., 2019). During HC development, the re-activation of Notch signaling at 3h correlates with the lineage bifurcation discovered in our pseudotime analysis (Figure 7C). We propose that the re-activation of Notch signaling in the central SC lineage between 3–5h may be responsible for ensuring that not all cells enter the HC lineage but that the majority of cells returns to a central SC fate. This interpretation is supported by our and our colleagues’ experimental data that prolonged Notch inhibition causes all cells to adopt a HC fate (Ma et al., 2008; Romero-Carvajal et al., 2015).
Reactivation of Notch and Fgf signaling inhibits the cell cycle in the central SC lineage
Interestingly, cell proliferation only occurs in the HC lineage and not in the central SC lineage (Figures 8O, P, Data S1 page 17E- F), which correlates with the re-activation of Notch and Fgf signaling in central SCs (Figure 7A). We previously showed that Notch signaling, and to a smaller degree Fgf signaling, inhibit proliferation via the inhibition of Wnt signaling during homeostasis (Lush et al., 2019; Romero-Carvajal et al., 2015). Thus, Notch does not only regulate lineage decisions but also inhibits proliferation and maintains cells in a progenitor state. The antiproliferative effect of Notch signaling is conserved in neural stem cells and the retina (Llorens-Bobadilla et al., 2015; Shin et al., 2015; Wan and Goldman, 2016). Likewise, Fgf signaling inhibits proliferation in the zebrafish retina (Wan and Goldman, 2017). Therefore, important unanswered questions are: what factors lead to the re-activation of Notch and Fgf signaling between 3–5h in the central SC lineage? And what signals positively drive proliferation in HC progenitors upstream of Wnt signaling? (Jacques et al., 2014; Jacques et al., 2012; Romero-Carvajal et al., 2015; Shi et al., 2012; Wang et al., 2015).
Ribosome biogenesis and translation significantly increase between 3–5h
Concomitant with HC specification, the largest number of transcriptional changes occur at the 3h time point. Ribosome biogenesis and translation (e.g., npm1a, nop56, nop58, RPL and RPS genes) and splicing are activated particularly in the HC progenitors (Figures 5A, F, N, Data S1 page 13A, B; (Lush et al., 2019)). An increase in ribosome biogenesis has also been observed in immature cardiomyocytes during heart regeneration in newborn mice (Cui et al., 2020). Similarly, ribosome heterogeneity is characteristic for stem cells and the role of regulated ribosome biogenesis during regeneration needs to be interrogated (Gabut et al., 2020; Li and Wang, 2020).
Regeneration recapitulates later stages of HC development, but the trigger is regeneration specific
Many of the genes and pathways that we identified downstream of atoh1a in the HC lineage are involved in HC development in the mouse, chick and zebrafish implying that the HC specification and differentiation process is conserved between development and regeneration. The difference between regeneration and development is that regeneration is likely triggered by an injury/inflammatory response which fails to occur in mammals (Wang et al., 2020). Future studies need to focus on this response and its downstream targets, to determine why they fail to be activated in mammals. Along this line, a gene expression atlas of mammalian inner ear sensory epithelia after damage is needed to identify the block in gene regulation that prevents mammals from regenerating.
Similarities with zebrafish cardiac regeneration
Even though we have not yet performed a systematic comparison, we observed that many of the differentially expressed genes that we identified in the regenerating zebrafish lateral line have also been described in other regenerating organs, such as the retina, heart and fin (also (Denans et al., 2019)). During zebrafish cardiac regeneration, the Jak1/Stat3 pathway members jak1, jak3, Il6st and socs3b are highly induced, as is rln3a (Fang et al., 2013). During zebrafish retina regeneration, several of the same growth factors/cytokines are induced, such as hbegf, insulin and il11 (Wan and Goldman, 2016). As in the lateral line, Notch downregulation leads to proliferation in the retina, which is enhanced by lin28a (Elsaeidi et al., 2018; Romero-Carvajal et al., 2015). Other genes involved in progenitor quiescence are insm1a and the Tgfβ inhibitor tgif1a (Chablais and Jazwinska, 2012; Lenkowski et al., 2013; Ramachandran et al., 2012). Likewise, some lateral line regeneration genes have also been described in fin and heart regeneration, such as inhba/b (Dogra et al., 2017; Sehring et al., 2016; Wang et al., 2020). This gene list is not comprehensive but stresses the value of comparing the regeneration programs between different organs and species to identify candidate regeneration genes (Hoang et al., 2020). High spatio-temporal resolution transcriptome studies from other regenerating species and organs are essential to test whether the sequence of the three gene expression modules described here is conserved and only the length of each module differs.
Conclusion
We have generated a high-resolution regeneration scRNA-Seq data set that will serve as a foundation for devising strategies to help induce HC regeneration in mammals. The detailed transcriptome analyses, combined with the characterization of three modules uncovered in our study will also serve as a reference to interrogate similarities in the regeneration response across different species/organs and in response to different injury paradigms. Thus, this data is not only relevant for our understanding of HC regeneration but also for regenerative processes in general.
Limitations of the study
scRNASeq using the 10X Chromium platform allows sequencing of large numbers of cells, which is important for reliably detecting clusters. However, it only detects a fraction of the genes expressed in any given cell. It is thus likely that some genes involved in regeneration were not detected. Now, that all clusters have been characterized, they can be sorted separately and scRNASeq can be performed on a smaller number of cells using techniques that detect more genes/cell but cost more. We also only performed pseudotime analysis on central support cells and cells belonging to the hair cell lineage, as in vivo lineage tracing showed that central support cells differentiate into hair cells. Even though A-P, D-V and mantle cells can also give rise to hair cells, it is unclear if they first transition to a central support cell fate or if they differentiate into hair cells directly. Experimental lineage tracing, coupled with gene expression analyses will resolve this question.
STAR Methods
RESOURCE AVAILABILITY
Lead contact
Further information and requests for resources and reagents should be directed to and will be fulfilled by the Lead Contact, Tatjana Piotrowski (pio@stowers.org).
Data and code availability
Raw files such as BAM files and count matrices outputted by the CellRanger pipeline have been deposited in the Gene Expression Omnibus database, www.ncbi.nlm.nih.gov/geo (accession no. GSE196211). Source code used to build our shiny applications are uploaded to the following repository, https://github.com/Piotrowski-Lab/shiny-apps. Supplementary scripts and wrapper functions used to process our Seurat and pseudotime objects are available in the following github repositories: (https://github.com/Piotrowski-Lab/SeuratExtensions, https://github.com/Piotrowski-Lab/CellTrajectoryExtensions). All original source data are deposited in the Stowers Institute Original Data Repository and available online at https://www.stowers.org/research/publications/libpb-1636
EXPERIMENTAL MODEL AND SUBJECT DETAILS
Zebrafish
Animal work followed the guidelines of the animal ethics committee (IACUC review board) at the Stowers Institute for Medical Research. The following zebrafish transgenic and mutant lines were used: Tg(she:H2A-mCherry)psi57Tg, Tg(Myo6:H2B-mScarlet-I)psi66Tg (Peloggia et al., 2021), Et(Krt4:EGFP)sqet4ET, Et(Krt4:EGFP)sqet20ET (Parinov et al., 2004), atoh1apsi69 (Navajas Acedo et al., 2019a).
METHOD DETAILS
Sensory HC ablation
To ablate HCs, 5dpf embryos were treated with 150~300μM neomycin (Sigma-Aldrich, St Louis, MO, USA) for 30min at 28 °C. Following, embryos were washed with 0.5x E2 medium (7.5 mM NaCl, 0.25 mM KCl, 0.5 mM MgSO4, 75 mM KH2PO4, 25 mM Na2HPO4, 0.5 mM CaCl2, 0.5 mg/L NaHCO3, pH = 7.4) and incubated at 28 °C until further experimental needed.
scRNA-Seq
Embryo dissociation and FACS
5dpf larvae were anesthetized with tricaine for ~1 min until they stopped moving (1:20 dilution of 4g/L tricaine in 0.5x E2 medium). We used ~1000 mCherry-positive and 50 mCherry-negative (for gating control) larvae. To dissociate the larvae, we placed the larvae into four wells (250 larvae each) containing strainers (BD Falcon Cell Strainer (BD Biosciences, San Jose, USA), quickly rinsed the larvae in ice-cold DPBS and added 4.5 ml cold 0.25% trypsin-EDTA (Thermo Fisher Scientific, Waltham, USA). The larvae (250 each) were then transferred to one 15ml polypropylene conical tube (placed on ice) with a disposable transfer pipet. Then, the embryos were dissociated by trituration with a 1 ml pipette tip for 3min ~ 3min 30 sec on ice. Since the neuromasts are superficial organs, we separated dissociated neuromast cells from the larval bodies by filtering the suspension through a Filcons 70 μm cell strainer (BD Biosciences, San Jose, CA, USA) into a 5ml polypropylene round-bottom tube. Subsequently, we centrifuged the cells at 2000 rpm (720 × g) for 7 min at 4°C. To wash off the trypsin-EDTA, we removed it, added ice-cold DPBS and centrifuged the cells at 2000 rpm (720 × g) for 7 min at 4°C. Resuspended cells in fresh ice-cold DPBS were filtered through a 35μm strainer (we only use strainer-cap part from 5ml blue cap strainer tubes (Falcon-Corning, Glendale, AZ, USA) into a falcon round bottom 5ml tube (snap cap tube, Falcon-Corning, Glendale, AZ, USA).
FACS
To collect viable cells, we stained the resuspended cells with Draq5 and DAPI (Final concentration 25 μM DRAQ5 and 2 μg/ml DAPI). Following incubation for 5 min on ice, stained cells were sorted with BD influx cell sorter (BD Biosciences, San Jose, CA, USA) using a 100 μm nozzle at 20 psi and 1X DPBS (Sigma-Aldrich, St Louis, USA). Laser lines used are 355 nm, 488 nm, and 647 nm. DAPI, GFP, and DRAQ5 are collected using 460/50 nm, 528/28 nm, and 720/40 nm filters, respectively. FSC/SSC size selection gate was constructed by back-gating from high GFP expression. Targeted cells were collected into 90% MeOH (in DPBS) directly. We fixed cells as we observed that sorted live cells started to upregulate injury response genes during the time it took to sort all remaining cells in the sample.
10X Chromium scRNA-seq library construction
Methanol fixed cells were handled using the 10x Genomics suggested process and rehydrated with rehydration buffer (1% BSA and 0.5 U/μl RNase-inhibitor in ice-cold DPBS). The maximum recommended volume of single cell suspension (34 μl) was loaded on a Chromium Single Cell Controller (10x Genomics, Pleasanton, CA). Libraries were made using the Chromium Single Cell 3’ Library & Gel Bead Kit v2 (10x Genomics) according to manufacturer’s instructions. Following the library preparation, short fragment libraries were tested for quality and quantity using an Agilent 2100 Bioanalyzer and Invitrogen Qubit Fluorometer. The libraries were sequenced to produce a depth of ~160–330M reads each on the Illumina HiSeq 2500 instrument (Illumina, San Diego, CA, USA) using Rapid SBS v2 chemistry with the following paired-end read lengths: 26 bp on the Read1, 8 bp on the I7 Index and 98 bp on the Read2.
scRNA-Seq read alignment and quantification
Raw reads were demultiplexed and aligned to version 10 of the zebrafish reference transcriptome (danRer10, Ensembl release 91) following 10X Genomics’s CellRanger (v2.1.1) pipeline. Prior to the downstream QC filtering we obtained the following cell numbers: 5,099 (homeostasis), 6,817 (0min), 6,727 (30min), 13,257 (1h), 3,314 (3h), 4,004 (5h) and 3,450 (10h) using CellRanger’s cell-association algorithm. Post-filtering, the number of cells per sample were 4335 (homeostasis), 2481 (0min), 2704 (30min), 2804 (1h), 2301 (3h), 1619 (5h), and 1829 (10h). The mean number of genes per time point were 726 (homeostasis), 653 (0min), 639 (30min), 650 (1h), 906 (3h) 826 (5h) and 797 (10h). All raw data for temporal samples including sorted BAM files and count matrices produced by CellRanger has been deposited in Gene Expression Omnibus (GEO) database, www.ncbi.nlm.nih.gov/geo (accession no. GSE196211).
Pre-processing, quality filtering and batch integration
To distinguish zebrafish repeated gene symbols with unique Ensembl IDs, we modified the count matrices outputted from the CellRanger pipeline using a custom R script (https://github.com/Piotrowski-Lab/SeuratExtensions). Each repeated gene symbol is annotated with an asterisk followed by an incrementing number. A comprehensive gene list with unique repeated symbol annotations can be downloaded from our interactive web application (https://piotrowskilab.shinyapps.io/neuromast_regeneration_scRNAseq_pub_2021/). Low quality cells or cells containing doublets with reads greater than 6000 and less than 300 genes per cell after combining all samples were filtered from the subsequent analysis. Genes present in less than 10 cells were also removed from the dataset as were cells with a percentage of mitochondrial contamination greater than 5%.
All seven temporal samples were integrated together following the standard integration pipeline outlined by the R package Seurat (v3.2.0, (Butler et al., 2018a)). Here, individual temporal samples were normalized independently using default parameters via Seurat::NormalizeData. The log-normalized expression values are then z-scored on the integrated object via Seurat::ScaleData using default parameters after finding anchoring cells between samples.
Dimensional reduction, and cell classification
Choosing an optimal number of principal components (PCs) for dimensional reduction was determined by scree plot using Seurat::ElbowPlot. We selected PCs showing the greatest variance explained until each subsequent PC showed little to no change. We specified 50 total number of PCs to compute and selected the first 10 PCs based on the scree plot to build and shared nearest neighbor (SNN) graph using Seurat::RunPCA and Seurat::FindNeighbors, respectively. Seurat::FindClusters was used with a resolution of 0.4, resulting in 13 clusters. To visualize cells in two-dimensional latent space, we used UMAP dimensional reduction technique via Seurat::RunUMAP using the first 10 PCs aforementioned. Classification of cell clusters of the integrated dataset were annotated by calculating differential marker expression via Seurat::FindAllMarkers using default parameters. Annotating universal neuromast cell types preserved throughout regeneration was achieved via a comprehensive marker list previously generated by (Lush et al., 2019). Skin contaminant populations were removed from the subsequent analysis.
DE analysis or primary analysis
To distinguish differentially expressed marker genes between time points, we used Seurat::FindMarkers to compare cells in one query time point against all other cells (Figure 2–5, Table S3). The time point specific differential gene list was subsequently used in our gene set enrichment analysis. For all differentially expressed gene tables, we defined our statistical test using Wilcoxon Rank-test with default filtering parameters. Only genes with a p-value less than 0.05 were retained. To distinguish the proportion of neomycin-induced genes were differentially influencing the gene list, we queried neomycin-induced genes from Jiang et al. (2014) to our differential gene list (Table S3). The top 25 differential genes in each timepoint illustrate the expression dynamics between time points (Figure 1H).
Gene set enrichment analysis
Enriched terms at each time point were identified via the R package ClusterProfiler (v3.14.3, (Yu et al., 2012)) and ReactomePA (v1.30.0, (Yu and He, 2015)). Visualizing enriched terms was achieved via R package enrichplot (v1.6.1, https://github.com/YuLab-SMU/enrichplot). To explore terms from multiple pathway databases, we ran ClusterProfiler::gseGO, ClusterProfiler::gseKEGG, ReactomePA::gsePathway to access terms in the GO, KEGG, and Reactome databases respectively. To accommodate pathway databases that only read in Entrez IDs such as KEGG and Reactome, we converted Ensembl IDs from our differential gene tables to its complementary Entrez IDs using ClusterProfiler::bitr. Enriched terms from Figures 2–5 were generated by ordering genes from highest to lowest average log-fold changes from the differentially expressed gene list where one time point is compared against all other time points. To qualify as an enriched term, a minimum of 2 and a maximum 300 number of genes needed to be present in each gene set to pass the hypergeometric test. These thresholds assisted us in filtering out vague and repetitive terms.
The final terms list went through another layer of filtering, in which we built a custom terms database after choosing more meaningful terms from the original terms list and reran the hypergeometric test using the final terms list shown in the final excel tab of Table S3 and Data S1 page 6. We filtered and integrated meaningful terms, shown in Data S1 page 6, from the three pathway databases into a custom terms database via clusterProfiler::GSEA and returned a gseResult object. Here, we specified the minimal size of each gene set as 2, the maximum size of genes annotated for testing as 800 and 10,000 permutations. From the terms summary of each time point analysis, we labelled activated or suppressed terms by filtering positive and negative normalized enrichment scores (NES) respectively (Table S3). All terms from the final enrichment analysis have a p-value < 0.05.
Pseudotime Analysis
The pseudotime analysis was processed using R package monocle3 v0.2.1(Cui et al., 2020; Qiu et al., 2017; Trapnell et al., 2014b) and velocyto.R v0.6 (La Manno et al., 2018).
For both pipelines, we subsetted the following HC populations: central cells at 0min through 10hr, HC progenitors at 1hr through 10hr, young HCs at 3hr through 10hr and mature HCs at 3hr through 10hr, totaling 3828 cells. Dimensional reduction was performed in UMAP latent space using Seurat’s standard preprocessing pipeline and the embeddings were projected onto the cds and seurat objects for monocle3 and velocyto analysis respectively. We extracted the subsetted counts matrix and corresponding metadata for each pipeline.
A hallmark feature in the development of monocle3 is its scalability to partition cells to learn multiple, disjoint trajectories via partitioned approximate graph abstraction (PAGA). Since our subsetted cell populations have a common transcriptional ancestor, we set all possible partitions to a single partition to allow the trajectory path to travel through the entire UMAP embeddings. Thereafter, we fit a principal graph through the entire UMAP space via monocle3::learn_graph. Here, we controlled for the amount of branching paths by pruning trajectories that have a path diameter length less than 15. Next, cells were ordered along pseudotime via monocle3::order_cells, in which we specified the root of origin at the 0min central cell population. We relabeled cells belonging to the two major branching events as the Central Cell and HC Lineage via monocle3::choose_graph_segments, where we selected the start and end node pertaining to each lineage path. Cells that are shared between the two lineages prior to the branching point were relabeled as the Injury Response + Progenitor Activation Lineage. To retrieve the exact pseudotime value and UMAP embeddings of the branching point, we built a custom wrapper function, CellTrajectoryExtension::get_branching_point, found in our github repository (https://github.com/Piotrowski-Lab/CellTrajectoryExtensions). In brief, we built a dataframe that includes every node label with its corresponding UMAP embeddings and subsetted for branching nodes using monocle3::branch_nodes. We then identify the approximate cell barcode and corresponding pseudotime value pertaining to the branching node’s embeddings.
To identify correlated gene expression along the trajectory, we utilized a spatial autocorrelation test statistic implemented in monocle3::graph_test, which returns a Moran’s I value for each gene. To retain all positive, statistically significant autocorrelation values from monocle3::graph_test, we subsetted gene entries with Moran’s I greater than or equal to 0.10 and q-value less than 0.05. We then passed in our filtered genes from the graph_test output into monocle3::find_gene_modules to cluster genes into meaningful modules (called units in the text) using Louvain clustering. Here, we parameterized our resolution at 0.0005 and used the first 3 PCs to cluster our genes, resulting in 8 units as shown in Data S1 page 18. To illustrate dynamic expression of genes in each unit, we calculated the z-scored expression of each gene in its corresponding module and averaged the expression of the cells along pseudotime. We then fit a smoothing line connecting the relationship between average expression of genes in each unit and pseudotime using a locally weighted smoothing method (LOESS). We set our degree of smoothing to 20% using the span argument. RNAvelocyto: Following the velocyto pipeline, the spliced, unspliced, and ambiguous reads were calculated for each time point via the velocyto command line interface (CLI). The outputted loom objects were then converted to Seurat objects via Seurat::as.Seurat. After following the standard Seurat integration pipeline, we subsetted and reclustered the HC populations. The RNA velocity was estimated via seurat-wrapper::RunVelocity using 2% top/bottom quantiles for the gamma fit. To project the velocity on the UMAP embeddings, we used velocyto.R::show.velocity.on.embedding.cor. (La Manno et al., 2018).
Interactive web application and data repository
To encourage fast and dynamic visualization of our scRNA-Seq data, we built an interactive web-based graphical user interface (GUI) via R base Shiny (https://piotrowskilab.shinyapps.io/neuromast_regeneration_scRNAseq_pub_2021/). The datasets imported in the shiny app includes the integrated neuromast regeneration and the pseudotime analysis. Features include visualizing user inputted gene expression via featureplots, dotplots, heatmaps, pseudotime line plots and comparative differential analysis. Instructions are provided on the homepage of the web app. In addition, our integrated regeneration data is uploaded to the Gene Expression Analysis Resource (gEAR) website (http://umgear.org/ZfRegen)(Orvis et al., 2021).
Confocal Imaging and laser ablation
For confocal imaging, zebrafish embryos were embedded in 1% low-melt agarose (Promega, Madison, USA), which contains 1x tricaine in 0.5x E2 medium in glass bottom 35 mm dishes (MatTek, Ashland, USA). Imaging was performed using a Zeiss LSM 780 confocal microscope with 10x or 40x objectives. All images were processed using Fiji (Schindelin et al., 2012) software. To ablate specific neuromast cells, 5dpf of atoh1a sibling or mutant embryos Tg(she:H2A-mCherry)psi57Tg were mounted in 1% low-melt agarose with 1x tricaine in 0.5x E2 medium in glass bottom 35 mm dishes. Neuromasts were identified and ablated using an LSM-780 (Zeiss) confocal microscope. Tissue fluorescence was excited at 561nm through a 40x LD C-Apochromat objective (Zeiss, NA = 1.1) and collected back through the same objective, then through a 562–633nm bandpass filter. Photons were detected with a GaAsP detector running in photon counting mode. Once the tissue of interest was identified, ablation occurred with a Ti Sapphire 2 photon laser (Coherent) running at 800nm in mode-locked mode. The laser power at the back aperture of the objective was 6mW. Ablation occurred over a user selected ROI by point scanning the 2 photon beam through the ROI a user specified number of times. These settings were adjusted as needed to achieve ablation. Successful ablation was verified by imaging the tissue in transmitted light.
Notch inhibition
5dpf wild type larvae were treated with 50μM LY411575 (Selleckchem, Houston, TX, USA) or 1% DMSO (Sigma-Aldrich, St Louis, MO, USA) as a negative control for 6 hours, then fixed overnight in 4% paraformaldehyde at 4°C.
In Situ Hybridization
For conventional ISH, anti-sense RNA probes were generated by PCR with cDNA from mixed stages of zebrafish embryos using T3 promoter-tagged reverse primer (Key resource table), except gata2b (Butko et al., 2015), sox2 (Kudoh et al., 2001), txn, cdk1nn, her4.1 (Jiang et al., 2014), dla (Appel and Eisen, 1998), atoh1a (Itoh and Chitnis, 2001). Go-Taq (Promega, Madison, USA) was used for PCR reaction and PCR product was purified by NEB gel extraction kit (New England Biolabs, MA, USA). Following that, In vitro transcription was performed with T3 RNA polymerase (Promega, Madison, WI, USA) and DIG-labelled kit (Roche, USA) in a PCR machine at 37°C for 4 hrs. After DNase I treatment at 37°C for 30mins, In vitro transcribed RNA was purified using RNA clean and concentrator kit (Zymo Research, Irvine, CA, USA) in accordance with the manufacturer’s manual. DIG-labelled RNA probe was diluted as 10 ng/μl in hybridization buffer and stored at −20°C. Colorimetric in situ hybridization was performed as described previously (Navajas Acedo et al., 2019a). Hybridization chain reaction (HCR) for sox4a-B2 and atoh1a-B2 (Choi et al., 2018) was carried out following the manufacturer’s manual, except that we incubated in the probe and amplifier for 48h each. (Molecular Instruments). The amplifier used was B2–546 (Molecular Instruments). Stained and fixed larvae were stained with DAPI (5μg/ml) for 30 min at room temperature and washed three times with 5x SSCT and imaged with a confocal microscope.
KEY RESOURCES TABLE.
| REAGENT or RESOURCE | SOURCE | IDENTIFIER |
|---|---|---|
| Antibodies | ||
| Anti-Digoxigenin, Fab fragments | Roche | Cat# 11214667001; RRID: AB_514494 |
| Chemicals, peptides, and recombinant proteins | ||
| Neomycin sulfate | Sigma-Aldrich | N6386; CAS: 1405-10-3 |
| DPBS | Sigma-Aldrich | D8537-500ML |
| Trypsin-EDTA (0.25%), phenol red | Thermo Fisher Scientific | 25200056 |
| DAPI (4’,6-Diamidino-2-Phenylindole, Dilactate) | Thermo Fisher Scientific | D3571 |
| Draq5 | Biostatus | DR50200 |
| MeOH | Sigma-Aldrich | 34860-1L-R; CAS: 67-56-1 |
| Protector RNase inhibitor | Roche | 03335399001 |
| GoTaq Hot Start Master Mix | Promega | M5132 |
| T3 RNA polymerase | Promega | P2083 |
| Transcription optimized 5x buffer | Promega | P1181 |
| DTT (100mM) | Promega | P1171 |
| DIG RNA labelling mix | Roche | 11277073910 |
| DNase I | New England Biolabs | M0303S |
| Proteinase K | Roche | 03115828001 |
| BCIP/NBT Color Development Substrate (5-bromo-4-chloro-3-indolyl-phosphate/nitro blue tetrazolium) |
Promega | S3771 |
| LY411575 | Selleckchem | S2714; CAS: 209984-57-6 |
| Critical commercial assays | ||
| Chromium Single Cell 3’ Library & Gel Bead Kit v2 | 10X Genomics | 120237 |
| Monarch DNA Gel extraction kit | New England Biolabs | T1020S |
| RNA clean and concentrator Kit | Zymo Research | R1018 |
| Hybridization Chain Reaction (HCR) v3.0 | Molecular Instruments | N/A |
| Deposited data | ||
| Sequencing Data | This paper | GSE196211 |
| Experimental models: Organisms/strains | ||
| Zebrafish AB-wildtype | N/A | |
| Tg(she:H2A-mCherry) psi57Tg | (Peloggia et al., 2021) | N/A |
| Tg(Myo6:H2B-mScarlet-I) psi66Tg | (Peloggia et al., 2021) | N/A |
| Et(Krt4:EGFP) sqet4ET | (Parinov et al., 2004) | Sqet4ET; RRID: ZFIN_ZDB-ALT-070628-4 |
| Et(Krt4:EGFP) sqet20ET | (Parinov et al., 2004) | sqet20ET; RRID: ZFIN_ZDB-ALT070628-20 |
| atoh1a psi69 | (Navajas Acedo et al., 2019) | N/A |
| Oligonucleotides | ||
| gpx1a_ISH_F: 5’-ACAACAGTCAGGGATTACACC-3’ | IDT | N/A |
| gpx1a_ISH_T3R: 5’-AATTAACCCTCACTAAAGGGGAATGATAAAACCTGAGCCGTG-3’ | IDT | N/A |
| nr4a1_ISH_F: 5’-TCTTGCCACACTGGTCATAA-3’ | IDT | N/A |
| nr4a1_ISH_T3R: 5’-AATTAACCCTCACTAAAGGGAATGCTTCGGCACTTGAATG-3’ | IDT | N/A |
| fosab_ISH_F: 5’-AGTCCCAGAGATCGTCACTA-3’ | IDT | N/A |
| fosab_ISH_T3R: 5’-AATTAACCCTCACTAAAGGGCACGTTCAGAAATCAACCGT-3’ | IDT | N/A |
| junba_ISH_F: 5’-ACACCTGTCGAATTGGTACAG-3’ | IDT | N/A |
| junba_ISH_T3R: 5’-AATTAACCCTCACTAAAGGGGACGCCACCGAACAACTC-3’ | IDT | N/A |
| btg2_ISH_F: 5’-GAAAGGTTCAGGATACCGCT-3’ | IDT | N/A |
| btg2_ISH_T3R: 5’-AATTAACCCTCACTAAAGGGCGGCCTGAAACTGTTCTGTA-3’ | IDT | N/A |
| irg1l_ISH_F: 5’-AATCTGCACTAGATGTGGCA-3’ | IDT | N/A |
| irg1l_ISH_T3R: 5’-AATTAACCCTCACTAAAGGGGAGGACTTGCTTCTAACCCA-3’ | IDT | N/A |
| egr2b_ISH_F: 5’-TCCAAGGAAATACCCCAACA-3’ | IDT | N/A |
| egr2b_ISH_T3R: 5’-AATTAACCCTCACTAAAGGGACAATTTCATCCACGCCTCT-3’ | IDT | N/A |
| ch25h_ISH_F: 5’-TGTGGCATCTTCTACATCACA-3’ | IDT | N/A |
| ch25h_ISH_T3R: 5’-AATTAACCCTCACTAAAGGGTGAATTCCTTCATGGTCCACG-3’ | IDT | N/A |
| map1lc3cl_ISH_F: 5’-ATGCCTCCCTACGAGAAATC-3’ | IDT | N/A |
| map1lc3cl_ISH_T3R: 5’-AATTAACCCTCACTAAAGGGACACACCTCTAATATCGCCG-3’ | IDT | N/A |
| bzw1b_ISH_F: 5’-TAAGGTCAGCATGGACAACC-3’ | IDT | N/A |
| bzw1b_ISH_T3R: 5’-AATTAACCCTCACTAAAGGGGATGACAATTCTTTAAAAAGGCCAG-3’ | IDT | N/A |
| cbx7a_ISH_F: 5’-GACTGTGTATGGGTATCGCA-3’ | IDT | N/A |
| cbx7a_ISH_T3R: 5’-AATTAACCCTCACTAAAGGGGTGCTCTTTCCTTTTCCCAC-3’ | IDT | N/A |
| clic2_ISH_F: 5’-GAGTCCTTTGATGTTGGTGC-3’ | IDT | N/A |
| clic2_ISH_T3R: 5’-AATTAACCCTCACTAAAGGGTGACTCCTTCACAATACCCC-3’ | IDT | N/A |
| crabp2a_ISH_F: 5’-AAATTCCCGATTTTGCTGGT-3’ | IDT | N/A |
| crabp2a_ISH_T3R: 5’-AATTAACCCTCACTAAAGGGATGTGACTGTACCTTTAGCACT-3’ | IDT | N/A |
| il11b_ISH_F: 5’-CATCCCAACAAATGAACGCA-3’ | IDT | N/A |
| il11b_ISH_T3R: 5’-AATTAACCCTCACTAAAGGGATCTGTTTCATAGCGACACCT-3’ | IDT | N/A |
| lima1a_ISH_F: 5’-AAATGAGAAACCAGACTCCGA-3’ | IDT | N/A |
| lima1a_ISH_T3R: 5’-AATTAACCCTCACTAAAGGGGTCAATCGAACAAAACATGGG-3’ | IDT | N/A |
| tgfb1a_ISH_F: 5’-TGATGGTGAAGCCGTACATT-3’ | IDT | N/A |
| tgfb1a_ISH_T3R: 5’-AATTAACCCTCACTAAAGGGGCTTGTTTGGGTGAAATGCT-3’ | IDT | N/A |
| nop58_ISH_F: 5’-CAACACAAGAGTGATGTAAAGGTA-3’ | IDT | N/A |
| nop58_ISH_T3R: 5’-AATTAACCCTCACTAAAGGGTAAACCTGAGACAAAATGACCC-3’ | IDT | N/A |
| sox4a_ISH_F: 5’-ACACCAGAGGTGAGCGAGTT-3’ | IDT | N/A |
| sox4a_ISH_R: 5’-GAGCAATGTTTGGCCGTTAT-3’ | IDT | N/A |
| Software and algorithms | ||
| Fiji | (Schindelin et al., 2012) | https://fiji.sc/# |
| GraphPad Prism 7.0e | GraphPad | https://www.graphpad.com/scientific-software/prism/ |
| R Studio | RStudio | https://rstudio.com |
| R version v3.6.1 | R core team | https://www.r-project.org |
| CellRanger v2.1.1 | 10X Genomics | https://support.10xgenomics.com/single-cell-gene-expression/software/pipelines/latest/what-is-cell-ranger |
| Seurat v3.2.0 | (Butler et al., 2018) | https://satijalab.org/seurat/ |
| Monocle3 v0.2.1 | (Cao et al., 2019; Qiu et al., 2017; Trapnell et al., 2014) | https://cole-trapnell-lab.github.io/monocle3/ |
| ClusterProfiler v3.14.3 | (Yu et al., 2012) | https://guangchuangyu.github.io/software/clusterProfiler/ |
| ReactomePA v1.30.0 | (Yu and He, 2015) | https://github.com/YuLab-SMU/ReactomePA |
| enrichplot v1.6.1 | (Wu et al., 2021) | https://github.com/YuLab-SMU/enrichplot |
| RNA Velocity v0.6 | (La Manno et al., 2018) | http://velocyto.org/ |
| Custom Seurat wrappers | This paper | https://github.com/Piotrowski-Lab/SeuratExtensions |
| Custom Cell Trajectory wrappers | This paper | https://github.com/Piotrowski-Lab/CellTrajectoryExtensions |
Supplementary Material
This spreadsheet contains the differentially expressed gene list (cluster markers) of neuromast cell types from the integrated regeneration dataset via Seurat::FindAllMarkers with default parameters. Genes with p-values greater than 0.05 were omitted from the gene list.
This spreadsheet contains a list of all genes within the integrated neuromast regeneration scRNA-Seq dataset. Genes present in the expression matrix were extracted and placed within the gene table column named “Gene.name.uniq” along with their corresponding Ensembl ID, ZFIN ID, description, etc.
This spreadsheet corresponds to the differential pseudobulk time point expression analysis. For each differential expression analysis, we compared cells labelling a query timepoint against cells in all other time points using the R call function Seurat::FindMarkers followed by a gene set enrichment analysis using the R package ClusterProfiler.
This spreadsheet corresponds to the differential expression analysis of cells labelling each time point and cell type compared to all other cells via Seurat::FindMarkers.
This spreadsheet contains the list of genes used to plot heatmaps and dotplots corresponding to Figures 1–8, S1–S18, and partitioned into individual tabs. Each tab’s gene table contains genes symbols, corresponding Ensembl IDs, descriptions, as well as columns of the average scaled (normalized and z-scored) expression value grouped by the cell identities displayed on the x-axis.
This spreadsheet contains lists of differentially expressed genes partitioned by clusters ordered along the pseudotime trajectory. We grouped clusters based on where they fall before and after the major branching event. We labelled clusters 3,2,7,6, which aggregate before the branching point as “Injury response + progenitor activation”. Clusters 4,9,10 with the end terminus leading to 10hr central cells, we labelled as “Central SC lineage”. Clusters 1,5,8 with the end terminus leading to 10hr HCs, we labelled as “HC lineage”.
This spreadsheet contains outputs of genes clustered into modules (units) along the pseudotime trajectory. Gene tables were generated via monocle3::find_gene_modules after subsetting for genes from the spatial autocorrelation analysis (monocle3::graph_test) with a moran_I greater than or equal to 0.10 and q-value less than 0.05.
Highlights:
A scRNASeq atlas of Hair Cell regeneration at unprecedented spatio-temporal resolution.
Regeneration occurs via three sequentially activated gene modules
Trajectory analysis show that progenitors can acquire one of two fates
The data can be queried using publicly available databases
Acknowledgments
We thank the Piotrowski lab members for insightful discussions and Drs. Alejandro Sánchez Alvarado, Nicolas Denans, Jeremy Sandler and Daniela Muench for critical reading of the manuscript. We thank Jillian Blanck, Jungeun Park, Allison Scott, Jeffrey Lange, Julia Peloggia for technical assistance and Mark Miller for graphic design. We are also grateful to the Stowers Institute Core Facilities (Aquatics team, Cytometry Core, Imaging Core, Molecular Biology Core) for their technical expertise. We would also like to thank Dr. Ronna Hertzano, Joshua Orvis and Yang Song for developing and uploading our data to gEAR. This work was funded by an NIH (NIDCD) award 1R01DC015488-01A1 and by institutional support from the Stowers Institute for Medical Research to T.P.
Footnotes
Declaration of interests
The authors declare no competing interests.
Publisher's Disclaimer: This is a PDF file of an unedited manuscript that has been accepted for publication. As a service to our customers we are providing this early version of the manuscript. The manuscript will undergo copyediting, typesetting, and review of the resulting proof before it is published in its final form. Please note that during the production process errors may be discovered which could affect the content, and all legal disclaimers that apply to the journal pertain.
Reference
- Appel B, and Eisen JS (1998). Regulation of neuronal specification in the zebrafish spinal cord by Delta function. Development 125, 371–380. [DOI] [PubMed] [Google Scholar]
- Bahrami S, and Drablos F (2016). Gene regulation in the immediate-early response process. Adv Biol Regul 62, 37–49. [DOI] [PubMed] [Google Scholar]
- Basch ML, Brown RM 2nd, Jen HI, and Groves AK (2016). Where hearing starts: the development of the mammalian cochlea. J Anat 228, 233–254. [DOI] [PMC free article] [PubMed] [Google Scholar]
- Beauchemin M, Smith A, and Yin VP (2015). Dynamic microRNA-101a and Fosab expression controls zebrafish heart regeneration. Development 142, 4026–4037. [DOI] [PMC free article] [PubMed] [Google Scholar] [Research Misconduct Found]
- Behra M, Bradsher J, Sougrat R, Gallardo V, Allende ML, and Burgess SM (2009). Phoenix is required for mechanosensory hair cell regeneration in the zebrafish lateral line. PLoS Genet 5, e1000455. [DOI] [PMC free article] [PubMed] [Google Scholar]
- Beisaw A, Kuenne C, Guenther S, Dallmann J, Wu CC, Bentsen M, Looso M, and Stainier DYR (2020). AP-1 Contributes to Chromatin Accessibility to Promote Sarcomere Disassembly and Cardiomyocyte Protrusion During Zebrafish Heart Regeneration. Circ Res 126, 1760–1778. [DOI] [PMC free article] [PubMed] [Google Scholar]
- Bermingham NA, Hassan BA, Price SD, Vollrath MA, Ben-Arie N, Eatock RA, Bellen HJ, Lysakowski A, and Zoghbi HY (1999). Math1: an essential gene for the generation of inner ear hair cells. Science 284, 1837–1841. [DOI] [PubMed] [Google Scholar]
- Bucks SA, Cox BC, Vlosich BA, Manning JP, Nguyen TB, and Stone JS (2017). Supporting cells remove and replace sensory receptor hair cells in a balance organ of adult mice. Elife 6. [DOI] [PMC free article] [PubMed] [Google Scholar]
- Burns JC, Cox BC, Thiede BR, Zuo J, and Corwin JT (2012). In vivo proliferative regeneration of balance hair cells in newborn mice. J Neurosci 32, 6570–6577. [DOI] [PMC free article] [PubMed] [Google Scholar]
- Burns JC, Kelly MC, Hoa M, Morell RJ, and Kelley MW (2015). Single-cell RNA-Seq resolves cellular complexity in sensory organs from the neonatal inner ear. Nat Commun 6, 8557. [DOI] [PMC free article] [PubMed] [Google Scholar]
- Burns JC, and Stone JS (2017). Development and regeneration of vestibular hair cells in mammals. Semin Cell Dev Biol 65, 96–105. [DOI] [PMC free article] [PubMed] [Google Scholar]
- Butko E, Distel M, Pouget C, Weijts B, Kobayashi I, Ng K, Mosimann C, Poulain FE, McPherson A, Ni C-W, et al. (2015). Gata2b is a restricted early regulator of hemogenic endothelium in the zebrafish embryo. Development 142, 1050–1061. [DOI] [PMC free article] [PubMed] [Google Scholar]
- Butler A, Hoffman P, Smibert P, Papalexi E, and Satija R (2018a). Integrating single-cell transcriptomic data across different conditions, technologies, and species. Nature Biotechnology 36, 411–420. [DOI] [PMC free article] [PubMed] [Google Scholar]
- Butler A, Hoffman P, Smibert P, Papalexi E, and Satija R (2018b). Integrating single-cell transcriptomic data across different conditions, technologies, and species. Nat Biotechnol 36, 411–420. [DOI] [PMC free article] [PubMed] [Google Scholar]
- Cai T, and Groves AK (2015). The Role of Atonal Factors in Mechanosensory Cell Specification and Function. Mol Neurobiol 52, 1315–1329. [DOI] [PMC free article] [PubMed] [Google Scholar]
- Cao J, Spielmann M, Qiu X, Huang X, Ibrahim DM, Hill AJ, Zhang F, Mundlos S, Christiansen L, Steemers FJ, et al. (2019). The single-cell transcriptional landscape of mammalian organogenesis. Nature 566, 496–502. [DOI] [PMC free article] [PubMed] [Google Scholar]
- Chablais F, and Jazwinska A (2012). The regenerative capacity of the zebrafish heart is dependent on TGFbeta signaling. Development 139, 1921–1930. [DOI] [PubMed] [Google Scholar]
- Chen P, Johnson JE, Zoghbi HY, and Segil N (2002). The role of Math1 in inner ear development: Uncoupling the establishment of the sensory primordium from hair cell fate determination. Development 129, 2495–2505. [DOI] [PubMed] [Google Scholar]
- Chen Q, Quan Y, Wang N, Xie C, Ji Z, He H, Chai R, Li H, Yin S, Chin YE, et al. (2017). Inactivation of STAT3 Signaling Impairs Hair Cell Differentiation in the Developing Mouse Cochlea. Stem Cell Reports 9, 231–246. [DOI] [PMC free article] [PubMed] [Google Scholar]
- Cheng M, Nguyen MH, Fantuzzi G, and Koh TJ (2008). Endogenous interferon-gamma is required for efficient skeletal muscle regeneration. Am J Physiol Cell Physiol 294, C1183–1191. [DOI] [PubMed] [Google Scholar]
- Cho Y, Gong TW, Kanicki A, Altschuler RA, and Lomax MI (2004). Noise overstimulation induces immediate early genes in the rat cochlea. Brain Res Mol Brain Res 130, 134–148. [DOI] [PubMed] [Google Scholar]
- Corwin JT, and Cotanche DA (1988). Regeneration of sensory hair cells after acoustic trauma. Science 240, 1772–1774. [DOI] [PubMed] [Google Scholar]
- Corwin JT, and Warchol ME (1991). Auditory hair cells: structure, function, development, and regeneration. Annu Rev Neurosci 14, 301–333. [DOI] [PubMed] [Google Scholar]
- Cox BC, Chai R, Lenoir A, Liu Z, Zhang L, Nguyen D-H, Chalasani K, Steigelman KA, Fang J, Rubel EW, et al. (2014). Spontaneous hair cell regeneration in the neonatal mouse cochlea in vivo. Development (Cambridge, England) 141, 816–829. [DOI] [PMC free article] [PubMed] [Google Scholar]
- Cruz IA, Kappedal R, Mackenzie SM, Hailey DW, Hoffman TL, Schilling TF, and Raible DW (2015). Robust regeneration of adult zebrafish lateral line hair cells reflects continued precursor pool maintenance. Dev Biol 402, 229–238. [DOI] [PMC free article] [PubMed] [Google Scholar]
- Cui M, Wang Z, Chen K, Shah AM, Tan W, Duan L, Sanchez-Ortiz E, Li H, Xu L, Liu N, et al. (2020). Dynamic Transcriptional Responses to Injury of Regenerative and Non-regenerative Cardiomyocytes Revealed by Single-Nucleus RNA Sequencing. Dev Cell 53, 102–116 e108. [DOI] [PMC free article] [PubMed] [Google Scholar]
- Denans N, Baek S, and Piotrowski T (2019). Comparing Sensory Organs to Define the Path for Hair Cell Regeneration. Annu Rev Cell Dev Biol 35, 567–589. [DOI] [PubMed] [Google Scholar]
- Doetzlhofer A, and Avraham KB (2017). Insights into inner ear-specific gene regulation: Epigenetics and non-coding RNAs in inner ear development and regeneration. Semin Cell Dev Biol 65, 69–79. [DOI] [PMC free article] [PubMed] [Google Scholar]
- Dogra D, Ahuja S, Kim HT, Rasouli SJ, Stainier DYR, and Reischauer S (2017). Opposite effects of Activin type 2 receptor ligands on cardiomyocyte proliferation during development and repair. Nat Commun 8, 1902. [DOI] [PMC free article] [PubMed] [Google Scholar]
- Du X, Li W, Gao X, West MB, Saltzman WM, Cheng CJ, Stewart C, Zheng J, Cheng W, and Kopke RD (2013). Regeneration of mammalian cochlear and vestibular hair cells through Hes1/Hes5 modulation with siRNA. In Hear Res, pp. 91–110. [DOI] [PMC free article] [PubMed] [Google Scholar]
- Elsaeidi F, Macpherson P, Mills EA, Jui J, Flannery JG, and Goldman D (2018). Notch Suppression Collaborates with Ascl1 and Lin28 to Unleash a Regenerative Response in Fish Retina, But Not in Mice. J Neurosci 38, 2246–2261. [DOI] [PMC free article] [PubMed] [Google Scholar]
- Eming SA, Wynn TA, and Martin P (2017). Inflammation and metabolism in tissue repair and regeneration. Science 356, 1026–1030. [DOI] [PubMed] [Google Scholar]
- Fang Y, Gupta V, Karra R, Holdway JE, Kikuchi K, and Poss KD (2013). Translational profiling of cardiomyocytes identifies an early Jak1/Stat3 injury response required for zebrafish heart regeneration. Proc Natl Acad Sci U S A 110, 13416–13421. [DOI] [PMC free article] [PubMed] [Google Scholar]
- Forge A, Li L, Corwin JT, and Nevill G (1993). Ultrastructural evidence for hair cell regeneration in the mammalian inner ear. Science 259, 1616–1619. [DOI] [PubMed] [Google Scholar]
- Furness DN (2015). Molecular basis of hair cell loss. Cell Tissue Res 361, 387–399. [DOI] [PubMed] [Google Scholar]
- Gabut M, Bourdelais F, and Durand S (2020). Ribosome and Translational Control in Stem Cells. Cells 9. [DOI] [PMC free article] [PubMed] [Google Scholar]
- Gnedeva K, and Hudspeth AJ (2015). SoxC transcription factors are essential for the development of the inner ear. Proc Natl Acad Sci U S A 112, 14066–14071. [DOI] [PMC free article] [PubMed] [Google Scholar]
- Graham V, Khudyakov J, Ellis P, and Pevny L (2003). SOX2 functions to maintain neural progenitor identity. Neuron 39, 749–765. [DOI] [PubMed] [Google Scholar]
- Gubbels SP, Woessner DW, Mitchell JC, Ricci AJ, and Brigande JV (2008). Functional auditory hair cells produced in the mammalian cochlea by in utero gene transfer. Nature 455, 537–541. [DOI] [PMC free article] [PubMed] [Google Scholar]
- Hall CJ, Boyle RH, Sun X, Wicker SM, Misa JP, Krissansen GW, Print CG, Crosier KE, and Crosier PS (2014). Epidermal cells help coordinate leukocyte migration during inflammation through fatty acid-fuelled matrix metalloproteinase production. Nat Commun 5, 3880. [DOI] [PubMed] [Google Scholar]
- Hernandez PP, Olivari FA, Sarrazin AF, Sandoval PC, and Allende ML (2007). Regeneration in zebrafish lateral line neuromasts: expression of the neural progenitor cell marker sox2 and proliferation-dependent and-independent mechanisms of hair cell renewal. Dev Neurobiol 67, 637–654. [DOI] [PubMed] [Google Scholar]
- Hoang T, Wang J, Boyd P, Wang F, Santiago C, Jiang L, Yoo S, Lahne M, Todd LJ, Jia M, et al. (2020). Gene regulatory networks controlling vertebrate retinal regeneration. Science 370. [DOI] [PMC free article] [PubMed] [Google Scholar]
- Ishida T, Nakajima T, Kudo A, and Kawakami A (2010). Phosphorylation of Junb family proteins by the Jun N-terminal kinase supports tissue regeneration in zebrafish. Dev Biol 340, 468–479. [DOI] [PubMed] [Google Scholar]
- Itoh M, and Chitnis AB (2001). Expression of proneural and neurogenic genes in the zebrafish lateral line primordium correlates with selection of hair cell fate in neuromasts. Mech Dev 102, 263–266. [DOI] [PubMed] [Google Scholar]
- Iyer AA, and Groves AK (2021). Transcription Factor Reprogramming in the Inner Ear: Turning on Cell Fate Switches to Regenerate Sensory Hair Cells. Front Cell Neurosci 15, 660748. [DOI] [PMC free article] [PubMed] [Google Scholar]
- Jacques BE, Montgomery W.H.t., Uribe PM, Yatteau A, Asuncion JD, Resendiz G, Matsui JI, and Dabdoub A (2014). The role of Wnt/beta-catenin signaling in proliferation and regeneration of the developing basilar papilla and lateral line. Dev Neurobiol 74, 438–456. [DOI] [PubMed] [Google Scholar]
- Jacques BE, Puligilla C, Weichert RM, Ferrer-Vaquer A, Hadjantonakis A-K, Kelley MW, and Dabdoub A (2012). A dual function for canonical Wnt/β-catenin signaling in the developing mammalian cochlea. Development (Cambridge, England) 139, 4395–4404. [DOI] [PMC free article] [PubMed] [Google Scholar]
- Jen HI, Hill MC, Tao L, Sheng K, Cao W, Zhang H, Yu HV, Llamas J, Zong C, Martin JF, et al. (2019). Transcriptomic and epigenetic regulation of hair cell regeneration in the mouse utricle and its potentiation by Atoh1. Elife 8. [DOI] [PMC free article] [PubMed] [Google Scholar]
- Jiang L, Romero-Carvajal A, Haug JS, Seidel CW, and Piotrowski T (2014). Gene-expression analysis of hair cell regeneration in the zebrafish lateral line. Proc Natl Acad Sci U S A 111, E1383–1392. [DOI] [PMC free article] [PubMed] [Google Scholar]
- Kniss JS, Jiang L, and Piotrowski T (2016). Insights into sensory hair cell regeneration from the zebrafish lateral line. Curr Opin Genet Dev 40, 32–40. [DOI] [PubMed] [Google Scholar]
- Kolla L, Kelly MC, Mann ZF, Anaya-Rocha A, Ellis K, Lemons A, Palermo AT, So KS, Mays JC, Orvis J, et al. (2020). Characterization of the development of the mouse cochlear epithelium at the single cell level. Nat Commun 11, 2389. [DOI] [PMC free article] [PubMed] [Google Scholar]
- Korrapati S, Roux I, Glowatzki E, and Doetzlhofer A (2013). Notch signaling limits supporting cell plasticity in the hair cell-damaged early postnatal murine cochlea. PLoS One 8, e73276. [DOI] [PMC free article] [PubMed] [Google Scholar]
- Ku YC, Renaud NA, Veile RA, Helms C, Voelker CC, Warchol ME, and Lovett M (2014). The transcriptome of utricle hair cell regeneration in the avian inner ear. J Neurosci 34, 3523–3535. [DOI] [PMC free article] [PubMed] [Google Scholar]
- Kudoh T, Tsang M, Hukriede NA, Chen X, Dedekian M, Clarke CJ, Kiang A, Schultz S, Epstein JA, Toyama R, et al. (2001). A gene expression screen in zebrafish embryogenesis. Genome Res 11, 1979–1987. [DOI] [PubMed] [Google Scholar]
- Kyritsis N, Kizil C, Zocher S, Kroehne V, Kaslin J, Freudenreich D, Iltzsche A, and Brand M (2012). Acute inflammation initiates the regenerative response in the adult zebrafish brain. Science 338, 1353–1356. [DOI] [PubMed] [Google Scholar]
- La Manno G, Soldatov R, Zeisel A, Braun E, Hochgerner H, Petukhov V, Lidschreiber K, Kastriti ME, Lonnerberg P, Furlan A, et al. (2018). RNA velocity of single cells. Nature 560, 494–498. [DOI] [PMC free article] [PubMed] [Google Scholar]
- Landen NX, Li D, and Stahle M (2016). Transition from inflammation to proliferation: a critical step during wound healing. Cell Mol Life Sci 73, 3861–3885. [DOI] [PMC free article] [PubMed] [Google Scholar]
- Lee S, Song JJ, Beyer LA, Swiderski DL, Prieskorn DM, Acar M, Jen HI, Groves AK, and Raphael Y (2020). Combinatorial Atoh1 and Gfi1 induction enhances hair cell regeneration in the adult cochlea. Sci Rep 10, 21397. [DOI] [PMC free article] [PubMed] [Google Scholar]
- Lenkowski JR, Qin Z, Sifuentes CJ, Thummel R, Soto CM, Moens CB, and Raymond PA (2013). Retinal regeneration in adult zebrafish requires regulation of TGFbeta signaling. Glia 61, 1687–1697. [DOI] [PMC free article] [PubMed] [Google Scholar]
- Li D, and Wang J (2020). Ribosome heterogeneity in stem cells and development. J Cell Biol 219. [DOI] [PMC free article] [PubMed] [Google Scholar]
- Liang J, Wang D, Renaud G, Wolfsberg TG, Wilson AF, and Burgess SM (2012). The stat3/socs3a pathway is a key regulator of hair cell regeneration in zebrafish. [corrected]. J Neurosci 32, 10662–10673. [DOI] [PMC free article] [PubMed] [Google Scholar]
- Liberzon A, Birger C, Thorvaldsdóttir H, Ghandi M, Mesirov Jill P., and Tamayo P (2015). The Molecular Signatures Database Hallmark Gene Set Collection. Cell Syst 1, 417–425. [DOI] [PMC free article] [PubMed] [Google Scholar]
- Llorens-Bobadilla E, Zhao S, Baser A, Saiz-Castro G, Zwadlo K, and Martin-Villalba A (2015). Single-Cell Transcriptomics Reveals a Population of Dormant Neural Stem Cells that Become Activated upon Brain Injury. Cell Stem Cell 17, 329–340. [DOI] [PubMed] [Google Scholar]
- López-Schier H, and Hudspeth AJ (2006). A two-step mechanism underlies the planar polarization of regenerating sensory hair cells. Proceedings of the National Academy of Sciences of the United States of America 103, 18615–18620. [DOI] [PMC free article] [PubMed] [Google Scholar]
- Lush ME, Diaz DC, Koenecke N, Baek S, Boldt H, St Peter MK, Gaitan-Escudero T, Romero-Carvajal A, Busch-Nentwich EM, Perera AG, et al. (2019). scRNA-Seq reveals distinct stem cell populations that drive hair cell regeneration after loss of Fgf and Notch signaling. Elife 8. [DOI] [PMC free article] [PubMed] [Google Scholar]
- Lush ME, and Piotrowski T (2014). Sensory hair cell regeneration in the zebrafish lateral line. Dev Dyn 243, 1187–1202. [DOI] [PMC free article] [PubMed] [Google Scholar]
- Ma EY, and Raible DW (2009). Signaling pathways regulating zebrafish lateral line development. Curr Biol 19, R381–386. [DOI] [PubMed] [Google Scholar]
- Ma EY, Rubel EW, and Raible DW (2008). Notch signaling regulates the extent of hair cell regeneration in the zebrafish lateral line. J Neurosci 28, 2261–2273. [DOI] [PMC free article] [PubMed] [Google Scholar]
- Mackenzie SM, and Raible DW (2012). Proliferative regeneration of zebrafish lateral line hair cells after different ototoxic insults. PloS one 7, e47257. [DOI] [PMC free article] [PubMed] [Google Scholar]
- Mathieu J, and Ruohola-Baker H (2017). Metabolic remodeling during the loss and acquisition of pluripotency. Development 144, 541–551. [DOI] [PMC free article] [PubMed] [Google Scholar]
- Monje ML, Toda H, and Palmer TD (2003). Inflammatory blockade restores adult hippocampal neurogenesis. Science 302, 1760–1765. [DOI] [PubMed] [Google Scholar]
- Namdaran P, Reinhart KE, Owens KN, Raible DW, and Rubel EW (2012). Identification of modulators of hair cell regeneration in the zebrafish lateral line. J Neurosci 32, 3516–3528. [DOI] [PMC free article] [PubMed] [Google Scholar]
- Navajas Acedo J, Voas MG, Alexander R, Woolley T, Unruh JR, Li H, Moens C, and Piotrowski T (2019a). PCP and Wnt pathway components act in parallel during zebrafish mechanosensory hair cell orientation. Nat Commun 10, 3993. [DOI] [PMC free article] [PubMed] [Google Scholar]
- Navajas Acedo J, Voas MG, Alexander R, Woolley T, Unruh JR, Li H, Moens C, and Piotrowski T (2019b). PCP and Wnt pathway components act in parallel during zebrafish mechanosensory hair cell orientation. Nat Commun 10, 3993. [DOI] [PMC free article] [PubMed] [Google Scholar]
- Nicolson T (2005). The genetics of hearing and balance in zebrafish. Annu Rev Genet 39, 9–22. [DOI] [PubMed] [Google Scholar]
- Orvis J, Gottfried B, Kancherla J, Adkins RS, Song Y, Dror AA, Olley D, Rose K, Chrysostomou E, Kelly MC, et al. (2021). gEAR: Gene Expression Analysis Resource portal for community-driven, multi-omic data exploration. Nat Methods 18, 843–844. [DOI] [PMC free article] [PubMed] [Google Scholar]
- Parinov S, Kondrichin I, Korzh V, and Emelyanov A (2004). Tol2 transposon-mediated enhancer trap to identify developmentally regulated zebrafish genes in vivo. Dev Dyn 231, 449–459. [DOI] [PubMed] [Google Scholar]
- Pei L, Castrillo A, Chen M, Hoffmann A, and Tontonoz P (2005). Induction of NR4A orphan nuclear receptor expression in macrophages in response to inflammatory stimuli. J Biol Chem 280, 29256–29262. [DOI] [PubMed] [Google Scholar]
- Pei W, Xu L, Huang SC, Pettie K, Idol J, Rissone A, Jimenez E, Sinclair JW, Slevin C, Varshney GK, et al. (2018). Guided genetic screen to identify genes essential in the regeneration of hair cells and other tissues. NPJ Regen Med 3, 11. [DOI] [PMC free article] [PubMed] [Google Scholar]
- Peloggia J, Munch D, Meneses-Giles P, Romero-Carvajal A, Lush ME, Lawson ND, McClain M, Pan YA, and Piotrowski T (2021). Adaptive cell invasion maintains lateral line organ homeostasis in response to environmental changes. Dev Cell 56, 1296–1312 e1297. [DOI] [PMC free article] [PubMed] [Google Scholar]
- Pinto-Teixeira F, Viader-Llargues O, Torres-Mejia E, Turan M, Gonzalez-Gualda E, Pola-Morell L, and Lopez-Schier H (2015). Inexhaustible hair-cell regeneration in young and aged zebrafish. Biol Open 4, 903–909. [DOI] [PMC free article] [PubMed] [Google Scholar]
- Qiu X, Mao Q, Tang Y, Wang L, Chawla R, Pliner HA, and Trapnell C (2017). Reversed graph embedding resolves complex single-cell trajectories. Nat Methods 14, 979–982. [DOI] [PMC free article] [PubMed] [Google Scholar]
- Raivich G, Bohatschek M, Da Costa C, Iwata O, Galiano M, Hristova M, Nateri AS, Makwana M, Riera-Sans L, Wolfer DP, et al. (2004). The AP-1 transcription factor c-Jun is required for efficient axonal regeneration. Neuron 43, 57–67. [DOI] [PubMed] [Google Scholar]
- Ramachandran R, Zhao XF, and Goldman D (2012). Insm1a-mediated gene repression is essential for the formation and differentiation of Muller glia-derived progenitors in the injured retina. Nat Cell Biol 14, 1013–1023. [DOI] [PMC free article] [PubMed] [Google Scholar]
- Roccio M, Perny M, Ealy M, Widmer HR, Heller S, and Senn P (2018). Molecular characterization and prospective isolation of human fetal cochlear hair cell progenitors. Nat Commun 9, 4027. [DOI] [PMC free article] [PubMed] [Google Scholar]
- Romero-Carvajal A, Navajas Acedo J, Jiang L, Kozlovskaja-Gumbriene A, Alexander R, Li H, and Piotrowski T (2015). Regeneration of Sensory Hair Cells Requires Localized Interactions between the Notch and Wnt Pathways. Dev Cell 34, 267–282. [DOI] [PMC free article] [PubMed] [Google Scholar]
- Ryals BM, and Rubel EW (1988). Hair cell regeneration after acoustic trauma in adult Coturnix quail. Science 240, 1774–1776. [DOI] [PubMed] [Google Scholar]
- Sarkar A, and Hochedlinger K (2013). The sox family of transcription factors: versatile regulators of stem and progenitor cell fate. Cell Stem Cell 12, 15–30. [DOI] [PMC free article] [PubMed] [Google Scholar]
- Sayyid ZN, Wang T, Chen L, Jones SM, and Cheng AG (2019). Atoh1 Directs Regeneration and Functional Recovery of the Mature Mouse Vestibular System. Cell Rep 28, 312–324 e314. [DOI] [PMC free article] [PubMed] [Google Scholar]
- Scheffer DI, Shen J, Corey DP, and Chen ZY (2015). Gene Expression by Mouse Inner Ear Hair Cells during Development. J Neurosci 35, 6366–6380. [DOI] [PMC free article] [PubMed] [Google Scholar]
- Scheibinger M, Ellwanger DC, Corrales CE, Stone JS, and Heller S (2018). Aminoglycoside Damage and Hair Cell Regeneration in the Chicken Utricle. J Assoc Res Otolaryngol 19, 17–29. [DOI] [PMC free article] [PubMed] [Google Scholar]
- Schindelin J, Arganda-Carreras I, Frise E, Kaynig V, Longair M, Pietzsch T, Preibisch S, Rueden C, Saalfeld S, Schmid B, et al. (2012). Fiji: an open-source platform for biological-image analysis. Nat Methods 9, 676–682. [DOI] [PMC free article] [PubMed] [Google Scholar]
- Sehring IM, Jahn C, and Weidinger G (2016). Zebrafish fin and heart: what’s special about regeneration? Curr Opin Genet Dev 40, 48–56. [DOI] [PubMed] [Google Scholar]
- Shi F, Kempfle JS, and Edge AS (2012). Wnt-responsive Lgr5-expressing stem cells are hair cell progenitors in the cochlea. J Neurosci 32, 9639–9648. [DOI] [PMC free article] [PubMed] [Google Scholar]
- Shin J, Berg DA, Zhu Y, Shin JY, Song J, Bonaguidi MA, Enikolopov G, Nauen DW, Christian KM, Ming GL, et al. (2015). Single-Cell RNA-Seq with Waterfall Reveals Molecular Cascades underlying Adult Neurogenesis. Cell Stem Cell 17, 360–372. [DOI] [PMC free article] [PubMed] [Google Scholar]
- Shyh-Chang N, and Ng HH (2017). The metabolic programming of stem cells. Genes Dev 31, 336–346. [DOI] [PMC free article] [PubMed] [Google Scholar]
- Shyh-Chang N, Zhu H, Yvanka de Soysa T, Shinoda G, Seligson MT, Tsanov KM, Nguyen L, Asara JM, Cantley LC, and Daley GQ (2013). Lin28 enhances tissue repair by reprogramming cellular metabolism. Cell 155, 778–792. [DOI] [PMC free article] [PubMed] [Google Scholar]
- Soldatov R, Kaucka M, Kastriti ME, Petersen J, Chontorotzea T, Englmaier L, Akkuratova N, Yang Y, Haring M, Dyachuk V, et al. (2019). Spatiotemporal structure of cell fate decisions in murine neural crest. Science 364. [DOI] [PubMed] [Google Scholar]
- Steiner AB, Kim T, Cabot V, and Hudspeth AJ (2014). Dynamic gene expression by putative hair-cell progenitors during regeneration in the zebrafish lateral line. Proc Natl Acad Sci U S A 111, E1393–1401. [DOI] [PMC free article] [PubMed] [Google Scholar]
- Thomas ED, and Raible DW (2019). Distinct progenitor populations mediate regeneration in the zebrafish lateral line. Elife 8. [DOI] [PMC free article] [PubMed] [Google Scholar]
- Trapnell C, Cacchiarelli D, Grimsby J, Pokharel P, Li S, Morse M, Lennon NJ, Livak KJ, Mikkelsen TS, and Rinn JL (2014a). The dynamics and regulators of cell fate decisions are revealed by pseudotemporal ordering of single cells. Nat Biotechnol 32, 381–386. [DOI] [PMC free article] [PubMed] [Google Scholar]
- Trapnell C, Cacchiarelli D, Grimsby J, Pokharel P, Li S, Morse M, Lennon NJ, Livak KJ, Mikkelsen TS, and Rinn JL (2014b). The dynamics and regulators of cell fate decisions are revealed by pseudotemporal ordering of single cells. Nature Biotechnology 32, 381–386. [DOI] [PMC free article] [PubMed] [Google Scholar]
- Tsujioka H, Kunieda T, Katou Y, Shirahige K, Fukazawa T, and Kubo T (2017). interleukin-11 induces and maintains progenitors of different cell lineages during Xenopus tadpole tail regeneration. Nat Commun 8, 495. [DOI] [PMC free article] [PubMed] [Google Scholar]
- Valdivia LE, Young RM, Hawkins TA, Stickney HL, Cavodeassi F, Schwarz Q, Pullin LM, Villegas R, Moro E, Argenton F, et al. (2011). Lef1-dependent Wnt/beta-catenin signalling drives the proliferative engine that maintains tissue homeostasis during lateral line development. Development 138, 3931–3941. [DOI] [PMC free article] [PubMed] [Google Scholar]
- Viader-Llargues O, Lupperger V, Pola-Morell L, Marr C, and Lopez-Schier H (2018). Live cell-lineage tracing and machine learning reveal patterns of organ regeneration. Elife 7. [DOI] [PMC free article] [PubMed] [Google Scholar]
- Wagner EL, and Shin JB (2019). Mechanisms of Hair Cell Damage and Repair. Trends Neurosci 42, 414–424. [DOI] [PMC free article] [PubMed] [Google Scholar]
- Wan J, and Goldman D (2016). Retina regeneration in zebrafish. Curr Opin Genet Dev 40, 41–47. [DOI] [PMC free article] [PubMed] [Google Scholar]
- Wan J, and Goldman D (2017). Opposing Actions of Fgf8a on Notch Signaling Distinguish Two Muller Glial Cell Populations that Contribute to Retina Growth and Regeneration. Cell Rep 19, 849–862. [DOI] [PMC free article] [PubMed] [Google Scholar]
- Wan L, Lovett M, Warchol ME, and Stone JS (2020). Vascular endothelial growth factor is required for regeneration of auditory hair cells in the avian inner ear. Hear Res 385, 107839. [DOI] [PubMed] [Google Scholar]
- Wang QY, Liu ZS, Wang J, Wang HX, Li A, Yang Y, Wang XZ, Zhao YQ, Han QY, Cai H, et al. (2014). Glutathione peroxidase-1 is required for self-renewal of murine embryonic stem cells. Biochem Biophys Res Commun 448, 454–460. [DOI] [PubMed] [Google Scholar]
- Wang T, Chai R, Kim GS, Pham N, Jansson L, Nguyen DH, Kuo B, May LA, Zuo J, Cunningham LL, et al. (2015). Lgr5+ cells regenerate hair cells via proliferation and direct transdifferentiation in damaged neonatal mouse utricle. Nat Commun 6, 6613. [DOI] [PMC free article] [PubMed] [Google Scholar]
- Wang W, Hu CK, Zeng A, Alegre D, Hu D, Gotting K, Ortega Granillo A, Wang Y, Robb S, Schnittker R, et al. (2020). Changes in regeneration-responsive enhancers shape regenerative capacities in vertebrates. Science 369. [DOI] [PMC free article] [PubMed] [Google Scholar]
- Wang XW, Li Q, Liu CM, Hall PA, Jiang JJ, Katchis CD, Kang S, Dong BC, Li S, and Zhou FQ (2018). Lin28 Signaling Supports Mammalian PNS and CNS Axon Regeneration. Cell Rep 24, 2540–2552 e2546. [DOI] [PMC free article] [PubMed] [Google Scholar]
- Warchol ME, and Corwin JT (1996). Regenerative proliferation in organ cultures of the avian cochlea: identification of the initial progenitors and determination of the latency of the proliferative response. J Neurosci 16, 5466–5477. [DOI] [PMC free article] [PubMed] [Google Scholar]
- Wenemoser D, Lapan SW, Wilkinson AW, Bell GW, and Reddien PW (2012). A molecular wound response program associated with regeneration initiation in planarians. Genes Dev 26, 988–1002. [DOI] [PMC free article] [PubMed] [Google Scholar]
- White DT, Sengupta S, Saxena MT, Xu Q, Hanes J, Ding D, Ji H, and Mumm JS (2017). Immunomodulation-accelerated neuronal regeneration following selective rod photoreceptor cell ablation in the zebrafish retina. Proc Natl Acad Sci U S A 114, E3719–E3728. [DOI] [PMC free article] [PubMed] [Google Scholar]
- White PM, Doetzlhofer A, Lee YS, Groves AK, and Segil N (2006). Mammalian cochlear supporting cells can divide and trans-differentiate into hair cells. Nature 441, 984–987. [DOI] [PubMed] [Google Scholar]
- Whitfield TT (2002). Zebrafish as a model for hearing and deafness. J Neurobiol 53, 157–171. [DOI] [PubMed] [Google Scholar]
- Wibowo I, Pinto-Teixeira F, Satou C, Higashijima S. i., and López-Schier H (2011). Compartmentalized Notch signaling sustains epithelial mirror symmetry. Development (Cambridge, England) 138, 1143–1152. [DOI] [PubMed] [Google Scholar]
- Wong AC, and Ryan AF (2015). Mechanisms of sensorineural cell damage, death and survival in the cochlea. Front Aging Neurosci 7, 58. [DOI] [PMC free article] [PubMed] [Google Scholar]
- Woods C, Montcouquiol M, and Kelley MW (2004). Math1 regulates development of the sensory epithelium in the mammalian cochlea. Nat Neurosci 7, 1310–1318. [DOI] [PubMed] [Google Scholar]
- Wu T, Hu E, Xu S, Chen M, Guo P, Dai Z, Feng T, Zhou L, Tang W, Zhan L, et al. (2021). clusterProfiler 4.0: A universal enrichment tool for interpreting omics data. Innovation (N Y) 2, 100141. [DOI] [PMC free article] [PubMed] [Google Scholar]
- Xavier AM, Anunciato AK, Rosenstock TR, and Glezer I (2016). Gene Expression Control by Glucocorticoid Receptors during Innate Immune Responses. Front Endocrinol (Lausanne) 7, 31. [DOI] [PMC free article] [PubMed] [Google Scholar]
- Ye Z, Su Z, Xie S, Liu Y, Wang Y, Xu X, Zheng Y, Zhao M, and Jiang L (2020). Yap-lin28a axis targets let7-Wnt pathway to restore progenitors for initiating regeneration. Elife 9. [DOI] [PMC free article] [PubMed] [Google Scholar]
- You X, Guo ZF, Cheng F, Yi B, Yang F, Liu X, Zhu N, Zhao X, Yan G, Ma XL, et al. (2018). Transcriptional up-regulation of relaxin-3 by Nur77 attenuates beta-adrenergic agonist-induced apoptosis in cardiomyocytes. J Biol Chem 293, 14001–14011. [DOI] [PMC free article] [PubMed] [Google Scholar]
- Yu G, and He Q-Y (2015). ReactomePA: an R/Bioconductor package for reactome pathway analysis and visualization. Mol Biosyst 12, 477–479. [DOI] [PubMed] [Google Scholar]
- Yu G, Wang L-G, Han Y, and He Q-Y (2012). clusterProfiler: an R Package for Comparing Biological Themes Among Gene Clusters. Omics J Integr Biology 16, 284–287. [DOI] [PMC free article] [PubMed] [Google Scholar]
- Zaidi MR (2019). The Interferon-Gamma Paradox in Cancer. J Interferon Cytokine Res 39, 30–38. [DOI] [PMC free article] [PubMed] [Google Scholar]
- Zheng JL, and Gao WQ (2000). Overexpression of Math1 induces robust production of extra hair cells in postnatal rat inner ears. Nat Neurosci 3, 580–586. [DOI] [PubMed] [Google Scholar]
- Zhu Y, Scheibinger M, Ellwanger DC, Krey JF, Choi D, Kelly RT, Heller S, and Barr-Gillespie PG (2019). Single-cell proteomics reveals changes in expression during hair-cell development. Elife 8. [DOI] [PMC free article] [PubMed] [Google Scholar]
Associated Data
This section collects any data citations, data availability statements, or supplementary materials included in this article.
Supplementary Materials
This spreadsheet contains the differentially expressed gene list (cluster markers) of neuromast cell types from the integrated regeneration dataset via Seurat::FindAllMarkers with default parameters. Genes with p-values greater than 0.05 were omitted from the gene list.
This spreadsheet contains a list of all genes within the integrated neuromast regeneration scRNA-Seq dataset. Genes present in the expression matrix were extracted and placed within the gene table column named “Gene.name.uniq” along with their corresponding Ensembl ID, ZFIN ID, description, etc.
This spreadsheet corresponds to the differential pseudobulk time point expression analysis. For each differential expression analysis, we compared cells labelling a query timepoint against cells in all other time points using the R call function Seurat::FindMarkers followed by a gene set enrichment analysis using the R package ClusterProfiler.
This spreadsheet corresponds to the differential expression analysis of cells labelling each time point and cell type compared to all other cells via Seurat::FindMarkers.
This spreadsheet contains the list of genes used to plot heatmaps and dotplots corresponding to Figures 1–8, S1–S18, and partitioned into individual tabs. Each tab’s gene table contains genes symbols, corresponding Ensembl IDs, descriptions, as well as columns of the average scaled (normalized and z-scored) expression value grouped by the cell identities displayed on the x-axis.
This spreadsheet contains lists of differentially expressed genes partitioned by clusters ordered along the pseudotime trajectory. We grouped clusters based on where they fall before and after the major branching event. We labelled clusters 3,2,7,6, which aggregate before the branching point as “Injury response + progenitor activation”. Clusters 4,9,10 with the end terminus leading to 10hr central cells, we labelled as “Central SC lineage”. Clusters 1,5,8 with the end terminus leading to 10hr HCs, we labelled as “HC lineage”.
This spreadsheet contains outputs of genes clustered into modules (units) along the pseudotime trajectory. Gene tables were generated via monocle3::find_gene_modules after subsetting for genes from the spatial autocorrelation analysis (monocle3::graph_test) with a moran_I greater than or equal to 0.10 and q-value less than 0.05.
Data Availability Statement
Raw files such as BAM files and count matrices outputted by the CellRanger pipeline have been deposited in the Gene Expression Omnibus database, www.ncbi.nlm.nih.gov/geo (accession no. GSE196211). Source code used to build our shiny applications are uploaded to the following repository, https://github.com/Piotrowski-Lab/shiny-apps. Supplementary scripts and wrapper functions used to process our Seurat and pseudotime objects are available in the following github repositories: (https://github.com/Piotrowski-Lab/SeuratExtensions, https://github.com/Piotrowski-Lab/CellTrajectoryExtensions). All original source data are deposited in the Stowers Institute Original Data Repository and available online at https://www.stowers.org/research/publications/libpb-1636