

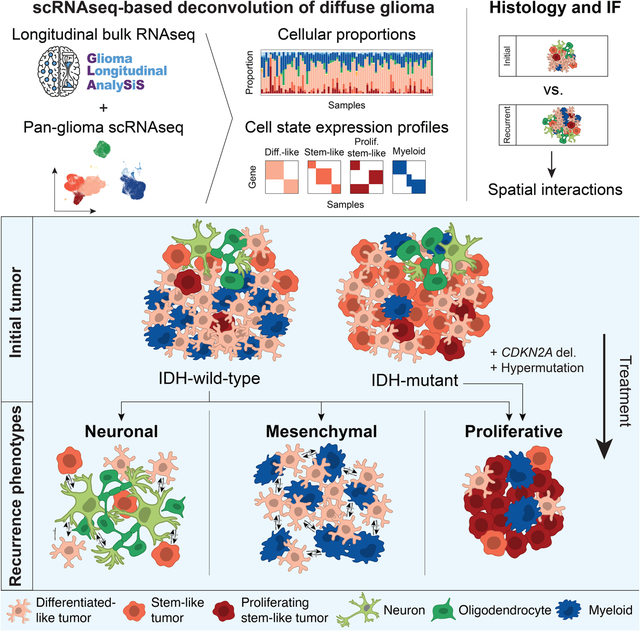
Summary
The factors driving therapy resistance in diffuse glioma remain poorly understood. To identify treatment-associated cellular and genetic changes, we analyzed RNA and/or DNA sequencing data from the temporally separated tumor pairs of 304 adult patients with IDH-wild-type and IDH-mutant glioma. Tumors recurred in distinct manners that were dependent on IDH mutation status and attributable to changes in histological feature composition, somatic alterations, and microenvironment interactions. Hypermutation and acquired CDKN2A deletions associated with an increase in proliferating neoplastic cells at recurrence in both glioma subtypes, reflecting active tumor growth. IDH-wild-type tumors were more invasive at recurrence, and their neoplastic cells exhibited increased expression of neuronal signaling programs that reflected a possible role for neuronal interactions in promoting glioma progression. Mesenchymal transition was associated with the presence of a specific myeloid cell state defined by specific ligand-receptor interactions with neoplastic cells. Collectively, these recurrence-associated phenotypes represent potential targets to alter disease progression.
Keywords: Glioma, glioblastoma, genomics, treatment resistance, microenvironment, hypermutation, neurons, macrophages, single-cell, spatial imaging
Graphical Abstract
In Brief
Integrating longitudinal transcriptomic and genomic data from paired diffuse glioma samples with complementary single-cell RNAseq and multiplex immunofluorescence datasets reveals recurrence-associated genetic and microenvironmental changes that are dependent on IDH mutation status.
Introduction
Diffuse gliomas in adults are primary tumors of the central nervous system that are characterized by a poor prognosis and the development of resistance to a surgery and chemoradiation treatment regimen (Wen et al., 2020). Genomic profiling has identified drivers of glioma progression and led to the definition of clinically relevant subtypes based on the presence of somatic mutations in the isocitrate dehydrogenase (IDH) genes and co-deletion of chromosome arms 1p and 19q (Cancer Genome Atlas Research et al., 2015; Ceccarelli et al., 2016; Louis et al., 2016). Bulk and single-cell transcriptional profiling has revealed that the gene expression programs in neoplastic glioma cells are influenced by underlying somatic alterations and interactions with the tumor microenvironment. These cells additionally exhibit high plasticity that enables them to respond dynamically to diverse challenges (Johnson et al., 2021; Neftel et al., 2019; Venteicher et al., 2017; Wang et al., 2017). Bulk genomics approaches have revealed therapy-related mesenchymal transitions and both branching and linear evolutionary patterns (Barthel et al., 2019; Kim et al., 2015a; Kim et al., 2015b; Korber et al., 2019; Wang et al., 2016; Wang et al., 2017). However, the extent to which individual neoplastic and microenvironmental host cells interact and evolve over time to facilitate therapy resistance remains poorly understood.
To identify the drivers of treatment resistance in glioma, we established the Glioma Longitudinal Analysis Consortium (GLASS) (Consortium, 2018). We previously assembled longitudinal whole-exome and whole-genome sequencing data from 222 patients to define the clonal dynamics of glioma under therapy (Barthel et al., 2019). Here, we expand upon these analyses by integrating longitudinal genomic data with overlapping transcriptomic data. We apply single-cell-based deconvolution and spatial imaging approaches to infer a tumor’s physical structure and identify the cell state interactions across IDH-wild-type and IDH-mutant glioma. Collectively, we find that gliomas exhibit several common transcriptional and compositional changes at recurrence that represent promising therapeutic targets for delaying disease progression.
Results
GLASS Cohort
We expanded the GLASS cohort, with an emphasis on collecting orthogonal RNA sequencing profiles, to 381 patients treated across 37 hospitals (Table S1). After applying quality control filters, the final cohort was comprised of 304 patients, with 168 having RNA sequencing data for two or more time points, 256 having DNA sequencing data for two or more time points, and 115 having overlapping RNA and DNA available for at least two time points. The cohort of 168 patients used for RNA sequencing analyses comprised each of the three major glioma subtypes, with 128 IDH-wild-type (IDHwt), 31 IDH-mutant 1p/19q intact (IDHmut-noncodel), and 9 IDH-mutant 1p/19q co-deleted (IDHmut-codel) glioma pairs (Figure 1A; Table S2). Given the limited number of IDHmut-codel cases, we pooled the IDH-mutant categories (IDHmut), unless specified otherwise. All processed genomic data and clinical annotation are available via https://www.synapse.org/glass.
Figure 1. Longitudinal cellular heterogeneity in glioma.

(A) Each column represents an initial (I) and recurrent (R) tumor pair. Pairs are arranged based on the combined representation of the proneural and mesenchymal subtypes in their initial tumors. The first track indicates whole exome (WXS) or whole genome sequencing (WGS) data availability. The next three tracks indicate bulk subtype signature representation. Stacked bar plots indicate cell state composition based on the single cell-based deconvolution method, CIBERSORTx. (B) Sankey plot indicating whether the highest-scoring transcriptional subtype changed at recurrence. Numbers in parentheses indicate number of samples of each subtype: proneural (Pro.), classical (Class.) and mesenchymal (Mes.). (C) Left: Average cell state composition of transcriptional subtypes (left) and initial and recurrent tumors by IDH status (right). See also Figure S1 and Tables S1, S2, and S3.
Longitudinal cellular heterogeneity in glioma
We first assessed the representation of the classical, mesenchymal, and proneural bulk transcriptional subtypes across the GLASS cohort. IDHwt tumors exhibited primarily classical and mesenchymal characteristics compared to IDHmut tumors, which were largely proneural (Figure 1A). Longitudinally, the dominant subtype in IDHwt tumors switched in 49% of patients, with classical to mesenchymal being the most common transition. In contrast, 78% of IDHmut tumors remained proneural at both time points (Figure 1B). We next deconvoluted the GLASS gene expression dataset by applying CIBERSORTx (Newman et al., 2019) using reference cell state signatures derived from 55,284 single-cell transcriptomes from 11 adult patients spanning glioma subtypes and time points (Johnson et al., 2021) (Table S3). Unsupervised analyses of this data identified 12 cell states representing the glial, stromal, immune, and neoplastic cells commonly observed in glioma. The neoplastic population expressed a shared set of markers (e.g., SOX2) and was split across three pan-glioma cell states, differentiated-like, stem-like, and proliferating stem-like, that together captured the developmental, lineage commitment, and proliferation states observed across numerous glioma single-cell studies (Bhaduri et al., 2020; Castellan et al., 2021; Couturier et al., 2020; Garofano et al., 2021; Neftel et al., 2019; Richards et al., 2021; Tirosh et al., 2016; Venteicher et al., 2017; Wang et al., 2019; Yuan et al., 2018). Specifically, the differentiated-like state encompassed neoplastic cells exhibiting oligodendrocyte-like, astrocyte-like (EGFR+), and mesenchymal-like (CD44+) processes, while the stem-like states could be segregated by cell cycle activity (Ki67+) and resembled undifferentiated and progenitor-like neoplastic cells (OLIG2+) (Neftel et al., 2019; Venteicher et al., 2017). To validate this approach, we applied the method to bulk glioma RNAseq profiles that had ground truth cellular proportions determined by 1) synthetic mixing of single-cell profiles, 2) single-cell RNAseq, and 3) histo-cytometry of whole-slide multiplex immunofluorescence scans (Figures S1A–C). Together, these orthogonal analyses supported the validity of the CIBERSORTx deconvolution approach in glioma.
When deconvoluting the GLASS dataset, we observed variations in cellular composition across each subtype consistent with prior literature (Neftel et al., 2019; Wang et al., 2017). The classical and mesenchymal subtypes were dominated by differentiated-like neoplastic cells, with mesenchymal samples also having high levels of stromal and immune cells. The proneural subtype, in contrast, consisted mostly of proliferating stem-like and stem-like neoplastic cells (Figure 1C). Subtype compositions were similar regardless of whether the tumor was initial or recurrent, and we observed similar associations in The Cancer Genome Atlas (TCGA) glioma cohort. (Figure S1D, S1E). Longitudinally, IDHwt tumors had significantly higher levels of oligodendrocytes and significantly lower levels of differentiated-like neoplastic cells at recurrence (P = 5e-6 and 4e-3, paired t-test). These changes remained significant even after accounting for the extent of surgical resection, suggesting a greater admixture of neoplastic cells and oligodendrocytes (Figure S1F). We observed similar changes in cellular composition when using an independent IDHwt glioma cell state classification model (Neftel et al., 2019), including a significant decrease at recurrence in the astrocyte-like neoplastic cell state that is dominant in classical tumors (P = 7e-3, paired t-test; Figure S1G). Recurrent IDHmut tumors exhibited significantly higher levels of proliferating stem-like neoplastic cells and a significantly lower differentiated-like neoplastic cell fraction (P = 1e-3 and 2e-6, paired t-test; Figure 1C). Stratifying this group by 1p/19q co-deletion status revealed that the increase in proliferating stem-like cells was only significant in the IDHmut-noncodel subtype, while IDHmut-codel tumors exhibited a significant increase in stem-like cells (P = 0.04, paired t-test; Figure S1H). Overall, these results indicated that IDHwt and IDHmut tumors undergo distinct cell state changes at recurrence.
Histological features underlie subtype switching and cell state changes at recurrence
Intratumoral heterogeneity is a hallmark of glioma and is abundant in hematoxylin and eosin-stained (H&E) tissue slides, where features such as microvascular proliferation and necrosis are used for diagnosis and grading by pathologists (Kristensen et al., 2019). The Ivy Glioblastoma Atlas Project (Ivy GAP) has defined and microdissected five “anatomic” features on the basis of reference histology, including two features at the tumor periphery (leading edge and infiltrating tumor), and three features in the tumor core (cellular tumor, pseudopalisading cells around necrosis, and microvascular proliferation) (Puchalski et al., 2018). Each feature exhibits a distinct transcriptional profile, suggesting that the cell state composition changes we observed at recurrence may be related to changes in a tumor’s underlying physical structure. To better understand this relationship, we assessed the cellular composition of each feature through transcriptional deconvolution and multiplex immunofluorescence (Figures 2A, S2A). Leading-edge features, which have been shown to exhibit proneural subtype and neural tissue characteristics (Gill et al., 2014; Puchalski et al., 2018), were rich in oligodendrocytes and stem-like neoplastic cells. Pseudopalisading cells around necrosis features, which are areas of hypoxia, exhibited high levels of differentiated-like neoplastic cells. Conversely, microvascular proliferation features were enriched in proliferating stem-like neoplastic cells, supporting the role of oxygen in influencing cell state. Finally, the cellular tumor feature exhibited sample-specific variation, with high levels of differentiated-like neoplastic cells in IDHwt samples and high levels of stem-like cells in IDHmut samples. Overall, each cell state’s distribution was more significantly associated with the histological feature than with the patient from which it was derived (two-way ANOVA; Figure S2B).
Figure 2. Histological features underlie subtype switching and cell state changes at recurrence.

(A) Cell state composition of each of the reference histology-defined Ivy GAP features across 10 patients. Each patient is indicated by a different color in the patient track. (B) Left: Average histological feature composition of transcriptional subtypes (left) and initial and recurrent tumors by IDH status (right) in GLASS. (C) Heatmap depicting the changes in each histological feature between initial and recurrent tumors undergoing the indicated subtype transition. The initial subtype is indicated in the columns and the recurrent subtype is indicated in the rows. Colors represent the change in fraction of the indicated features. (D) Heatmap depicting the Pearson correlation coefficients measuring the association between the change in a histological feature and the change in a cell state when going from an initial tumor to recurrence. In (C) and (D) * indicates a significant correlation (P < 0.05). (E) Left: Ladder plot depicting the change in the adjusted stem-like cell proportion between paired initial and recurrent tumors undergoing a proneural-to-mesenchymal transition. Right: The average adjusted neoplastic cell proportions for the tumor pairs outlined on the left. Neoplastic cell proportions were adjusted for the presence of non-neoplastic cells as well as non-cellular tumor content. See also Figure S2 and Table S4.
We next examined how feature representation varied over time by deconvoluting the GLASS dataset with Ivy GAP feature-specific gene signatures. To assess performance, we compared the resulting proportions to pathologist estimates of related features in a subset of samples with matched H&E slides (Table S4). This revealed that the method accurately distinguished periphery- and tumor core-associated features (Figure S2C) and identified expected correlations between the pseudopalisading cells around necrosis feature and pathologist estimates of the slide area occupied by necrosis (Figure S2D). However, in recurrent samples, deconvolution performance of some features was influenced by the presence of recurrence-specific histological features not profiled by Ivy GAP (Figure S2E). In GLASS, differences in each bulk transcriptional subtype’s anatomy were consistent with their underlying cell state composition (Figure 2B). Longitudinally, IDHwt tumors had significantly higher leading-edge content at recurrence (P = 4e-5, paired t-test; Figure 2B), consistent with the oligodendrocyte increase in this subtype (Figure 1C). In most cases this increase was independent of whether a tumor underwent a transcriptional subtype transition, suggesting it was a general feature at recurrence (Figure 2C). At the cell state level, we found that changes in the abundance of different neoplastic cell states over time associated with changes in different histological features in a subtype-dependent manner (Figure 2D). Specifically, in IDHwt tumors, changes in the abundance of differentiated-like, stem-like, and proliferating stem-like cells positively associated with changes in pseudopalisading cells around necrosis, leading edge, and microvascular proliferation features, respectively.
Given these associations, we hypothesized that some subtype switches in IDHwt tumors are attributable to changes in histological feature composition over time. To test this, we inferred the cell state composition of each sample’s tumor core by adjusting for the presence of non-neoplastic cells and leading-edge content. While several subtype switches were associated with changes in at least one neoplastic cell fraction pre-adjustment, the strongest difference observed post-adjustment was a decrease in stem-like cells in tumors that underwent a proneural-to-mesenchymal transition (P = 3e-4, paired t-test; Figures S2F, S2G). This association remained significant after adjusting for the remaining non-cellular tumor features, suggesting that tumors undergoing this switch exhibit a loss of stem-like cells independent of histological feature composition (Figures 2E, S2F). Collectively, the results indicate that most IDHwt subtype switches relate to changes in a tumor’s underlying physical structure and microenvironment. However, changes observed in the proneural-to-mesenchymal transition may be indicative of tumor-wide changes that reflect neoplastic cell-intrinsic processes at recurrence.
Acquired somatic alterations at recurrence associate with changes in cellular composition
While most tumors exhibited changes in cell state and associated histological feature composition, the factors underlying these changes remained unclear. Somatic genetic alterations have been shown to associate with cell state distribution in IDHwt and IDHmut glioma (Johnson et al., 2021; Neftel et al., 2019; Tirosh et al., 2016; Verhaak et al., 2010). We thus hypothesized that genetic changes at recurrence impact cellular composition. To test this, we compared neoplastic cell state distribution between samples that acquired or lost driver mutations. Within IDHmut tumors, this revealed acquired alterations in cell cycle regulators, including deletions in CDKN2A and amplifications in CCND2, to be associated with increases in proliferating stem-like cells (P = 3e-3, paired t-test, n = 6; Figure 3A). Whole slide multiplex immunofluorescence scans of a recurrent IDHmut tumor with an acquired CDKN2A deletion showed a significantly higher number of SOX2+/Ki67+ cells in comparison to the matched primary, confirming the association (P < 1e-5, Fisher’s exact test; Figure 3B). We did not observe this association in IDHwt tumors, which typically harbor CDKN2A deletions at initial presentation (Figure S3A).
Figure 3. Acquired somatic alterations at recurrence associate with changes in cellular composition.

(A) Left: Ladder plot depicting the change in the proliferating stem-like cell proportion between paired initial and recurrent IDHmut tumors that acquired CDKN2A deletions or CCND2 amplifications. Right: Stacked bar plot depicting the average proportions of each cell state for the tumor pairs in the ladder plots. (B) Left: Representative multiplex immunofluorescence images from a matched initial and recurrent IDHmut tumor pair that acquired a CDKN2A deletion at recurrence. Right: Stacked bar plot depicting the proportion of SOX2+/Ki67+ cells among all SOX2+ cells across the entire tissue section for each sample. (C) Top: Ladder plots depicting the change in the proliferating stem-like cell proportion between paired initial and recurrent tumors, stratified by hypermutation status. Paired t-test P-values are indicated. Bottom: Average proportions of each cell state for the tumor pairs outlined above. (D) Left: Representative multiplex immunofluorescence images from a matched initial and recurrent IDHwt tumor pair that was hypermutated at recurrence. Right: Stacked bar plot depicting the proportion of SOX2+/Ki67+ cells among all SOX2+ cells across the entire tissue section for each sample. (E) Change in proliferating stem-like cell fraction between initial and recurrent tumors from IDHmut tumor pairs. (F) Kaplan-Meier plot depicting the survival distributions of patients that exhibited an increase or non-increase in proliferating stem-like cells at recurrence. P-value from log-rank test. In (B) and (D), scale bars represent 50 μm. See also Figure S3.
We next examined how neoplastic cell states associated with treatment-induced hypermutation, which frequently occurs after the administration of alkylating agents such as temozolomide (Barthel et al., 2019). In both IDHwt and IDHmut glioma, hypermutation also associated with increased proliferating stem-like neoplastic cells (P < 0.05, paired t-test, n = 13 and 7, respectively; Figure 3C). Multiplex immunofluorescence scans of an IDHwt tumor pair with a hypermutated recurrence confirmed this association, with the recurrence having significantly higher number of SOX2+/Ki67+ cells (P < 1e-5, Fisher’s exact test; Figure 3D). In IDHmut tumors, hypermutation largely occurred independent of acquired copy number changes in CDKN2A and CCND2, suggesting that there are multiple genetic routes to increasing proliferating stem-like neoplastic cells at recurrence (Figure 3E). Notably, neither of these alterations associated with changes in microvascular proliferation, suggesting that increases in proliferating stem-like neoplastic cells were a result of genetics and not microenvironmental interactions (Figure S3B). Survival analyses revealed that increases in proliferating stem-like neoplastic cells in IDHmut tumors were significantly associated with reduced overall survival (P = 0.02, log-rank test; Figure 3F), and remained so after adjusting for age, grade, and 1p/19q co-deletion status (P = 0.02, Wald test; Figure S3C). Collectively, these results indicate that genetic evolution at recurrence can alter neoplastic glioma cells toward a more proliferative phenotype that associates with poor prognosis.
In addition to neoplastic cells, genetic alterations have been associated with changes in the microenvironmental composition of tumors (Wellenstein and de Visser, 2018). We thus examined how each non-neoplastic cell state differed across tumor pairs that acquired or lost selected driver mutations at recurrence. In IDHwt tumors, non-hypermutated recurrences that acquired NF1 mutations all underwent a mesenchymal transition and exhibited increases in granulocytes and myeloid cells, with the granulocyte association being significant (P = 0.03, paired t-test, n = 3; Figure S3D). Additionally, several copy number alterations, such as loss of EGFR or PDGFRA amplifications, associated with increased non-neoplastic cell content (P < 0.05, paired t-test, n = 11 and n = 4, respectively), and a transition to the mesenchymal subtype (P = 0.05, Fisher’s exact test; Figures S3E and S3F). We did not observe any significant changes in the fractions of non-neoplastic cells when comparing hypermutated recurrences with their corresponding non-hypermutated initial tumors, including T cells (Figure S3G). These results together indicate that while genetic evolution is a major driver of changes in neoplastic cell state composition at recurrence, it has less of an effect on a tumor’s microenvironment during this time.
Neuronal signaling activity is increased in recurrent IDHwt tumors
Only a subset of tumors demonstrated a genetic-associated increase in proliferating stem cell content at recurrence. We hypothesized that in remaining gliomas, treatment-induced cell state changes may not manifest as a ubiquitous shift in cellular composition. To test this, we utilized our pan-glioma single-cell RNAseq dataset (Johnson et al., 2021) as a reference to deconvolute GLASS bulk gene expression profiles into their component differentiated-like, stem-like, proliferating stem-like, and myeloid gene expression profiles (Figure S4A). To validate these profiles, we compared them to those derived from fluorescence-activated cell sorting (FACS)-purified glioma-specific CD45− and myeloid populations (Klemm et al., 2020). This revealed strong concordance between the corresponding profiles of each cell state (Figures S4B and S4C). We next compared the cell state-specific gene expression profiles between the initial and recurrent tumor for each pair receiving temozolomide and/or radiotherapy. In IDHwt tumors, 10.0% of the 7,511 genes that could be inferred in stem-like cells were significantly differentially expressed at recurrence (false discovery rate (FDR) < 0.05, Wilcoxon signed-rank test). This number was 7.6% of the 11,641 differentiated-like state genes and 6.3% of the 6,019 proliferating stem-like state genes (Figure 4A; Table S5). Based on these results, we defined recurrence-specific signatures as the genes that were significantly up-regulated at recurrence in each cell state. Within our pan-glioma single-cell dataset, we confirmed the recurrence-specific nature of each signature by comparing their expression between single neoplastic cells from unmatched recurrent and initial tumors (Figure S4D). To understand the functions these cell states up-regulate at recurrence, we then performed gene ontology (GO) enrichment analysis on each signature. This revealed that the stem-like signature was significantly enriched in terms relating to neuronal signaling, while the differentiated-like and proliferating stem-like signatures exhibited similar, but weaker, associations (Figures 4B and S4E).
Figure 4. Neuronal signaling activity is increased in recurrent IDHwt tumors.
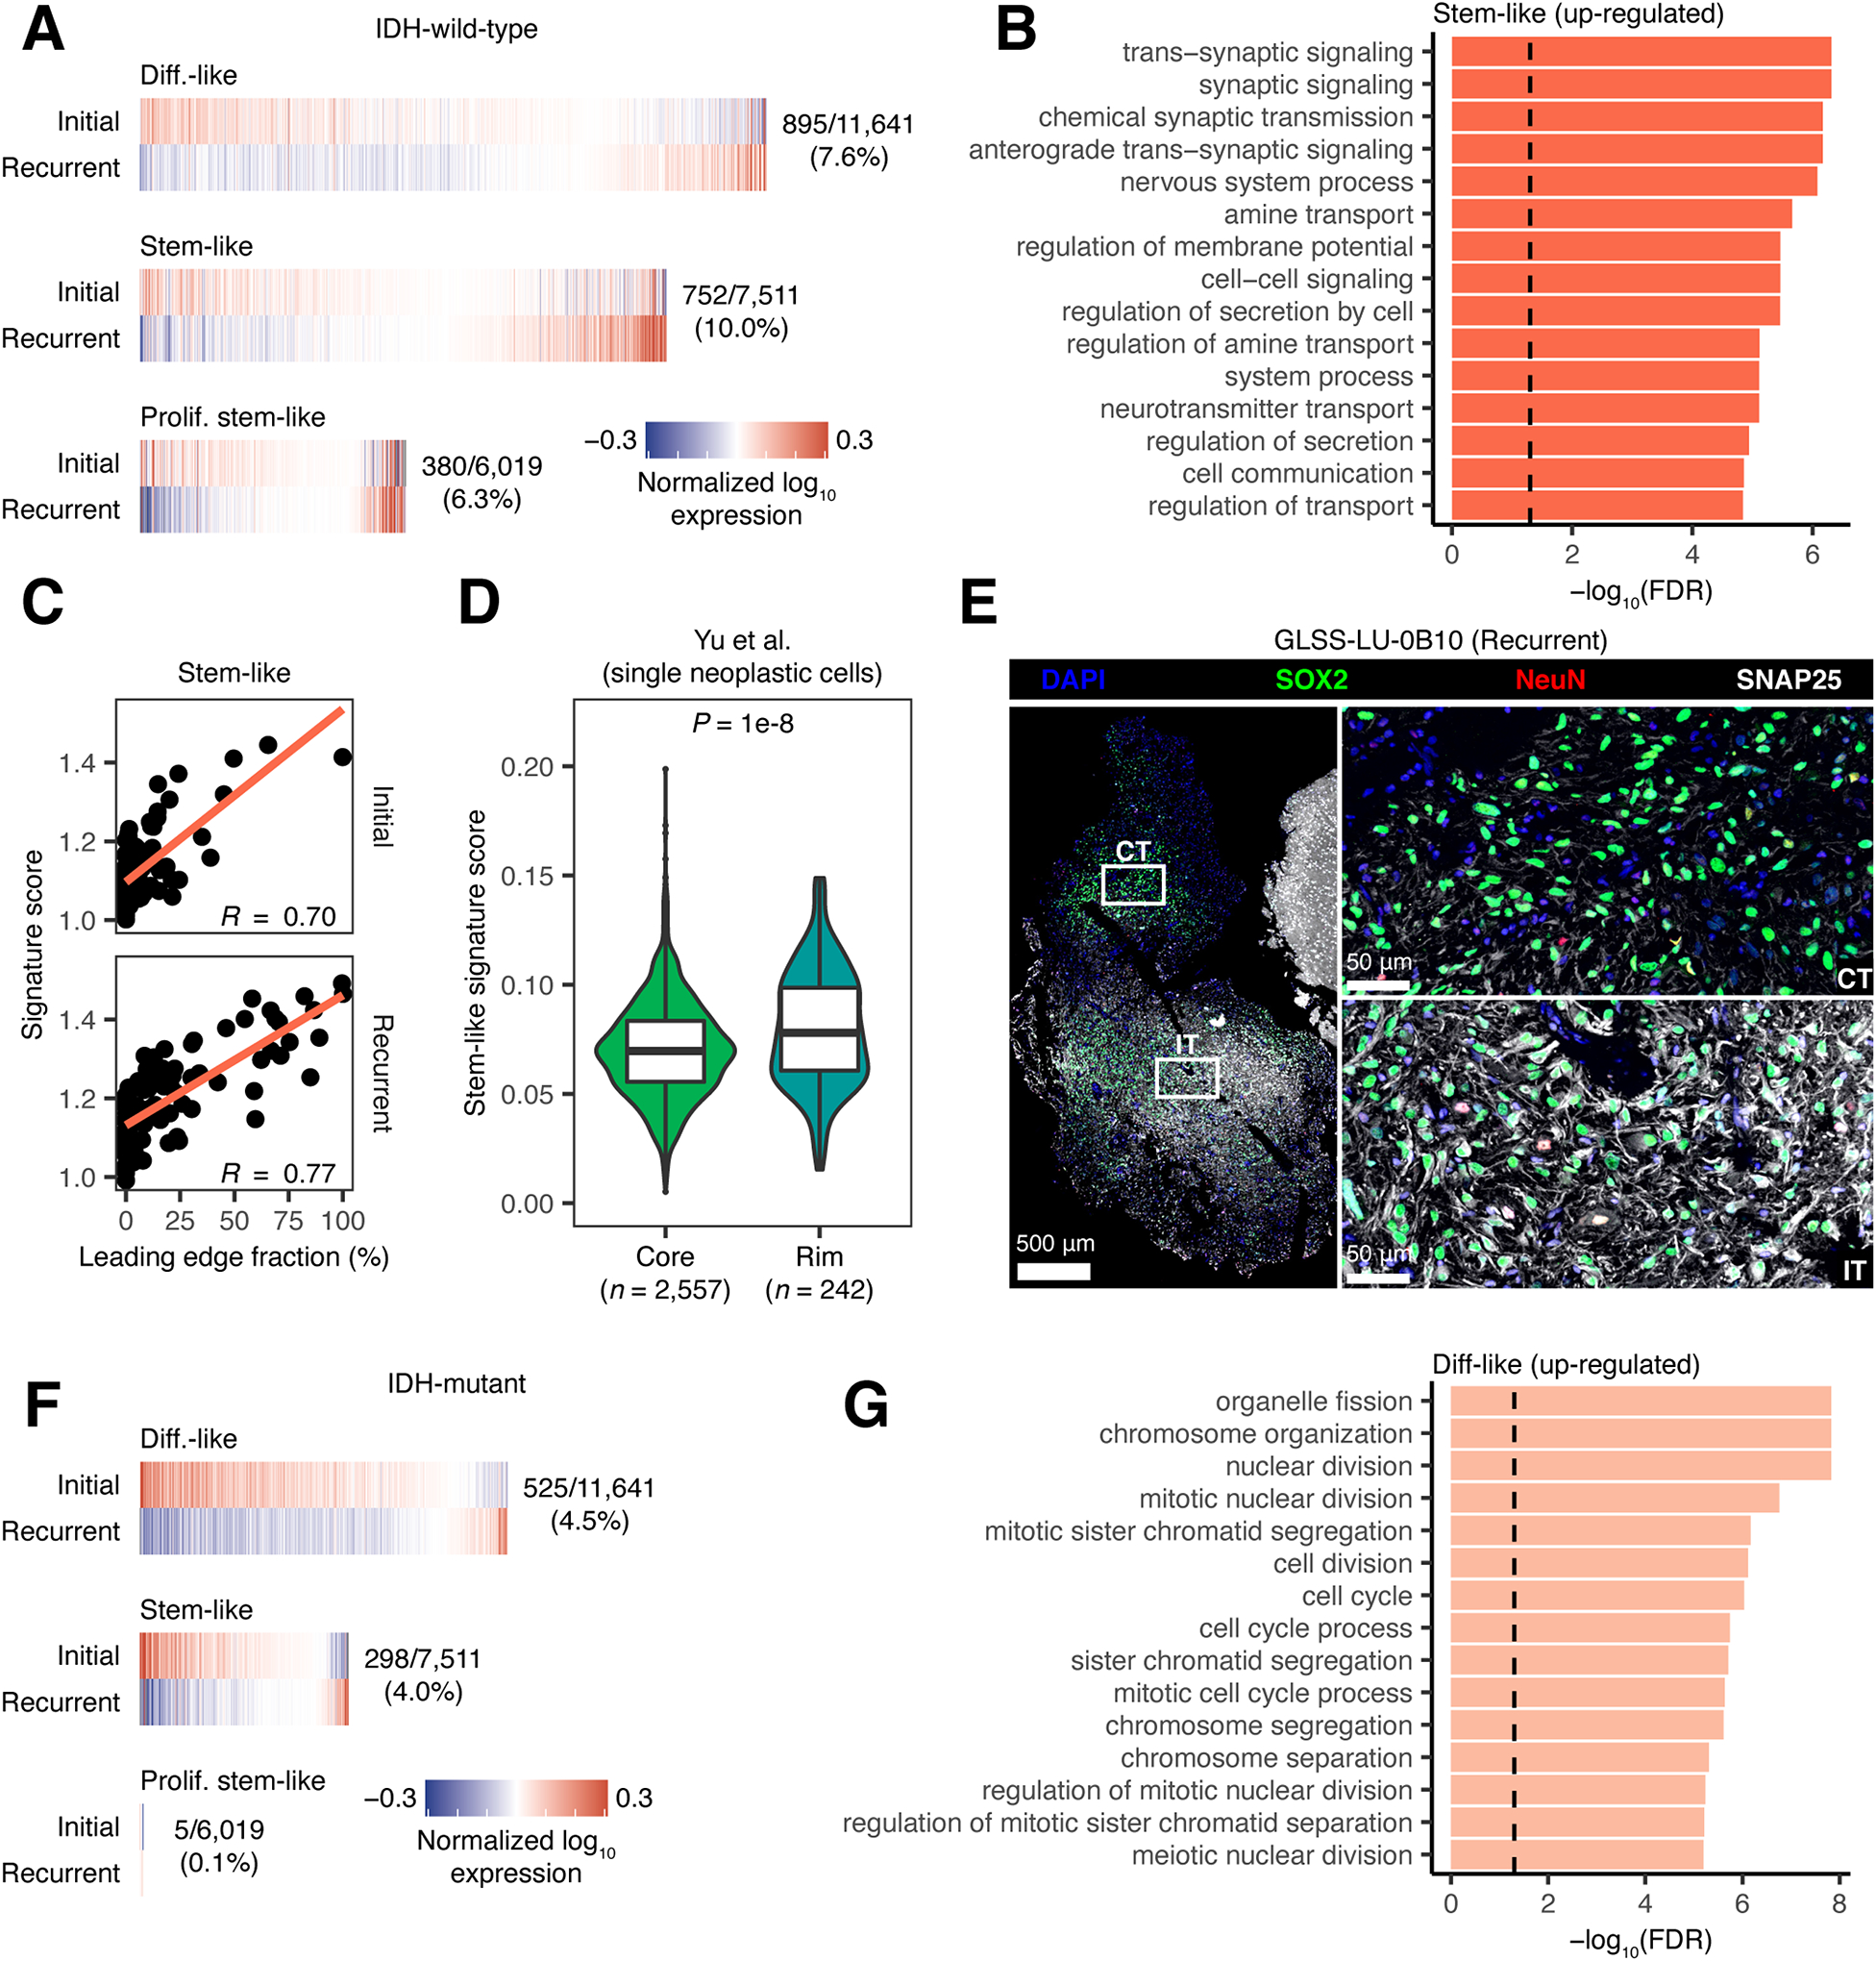
(A) Heatmaps depicting the average normalized log10 expression level of genes that were differentially expressed between neoplastic cell states from initial and recurrent IDHwt tumors that received treatment. Fractions indicate the number of differentially expressed genes out of the number of genes inferred for that cell state’s profile. (B) Bar plot depicting the −log10(FDR) from a GO enrichment analysis of the genes significantly up-regulated at recurrence in stem-like neoplastic cell-specific gene expression profiles from IDHwt tumors. (C) Scatterplot depicting the association between leading edge fraction and the average expression of the stem-like neoplastic cell recurrence signature for samples in the GLASS dataset. (D) Violin plot depicting the average expression of the stem-like neoplastic cell recurrence signature in neoplastic single-cells collected from the invasive rim and tumor core of 9 grade 4 gliomas (Yu et al., 2020). P-value from Wilcoxon rank-sum test. (E) Multiplex immunofluorescence images of the interface between the cellular tumor (top right; CT) and infiltrating tumor (bottom right; IT) histological features in a recurrent IDHwt tumor. Histological features were defined by a neuropathologist using the H&E image in Figure S4F. (F) Heatmaps depicting the average normalized log10 expression level of genes that were differentially expressed between neoplastic cell states from initial and recurrent IDHmut tumors that received treatment. Fractions are as outlined in (A). (G) Bar plot depicting the −log10(FDR) from a GO enrichment analysis of the genes significantly up-regulated at recurrence in differentiated-like neoplastic cell-specific gene expression profiles from IDHmut tumors. In (B) and (G), dashed line corresponds to FDR < 0.05. See also Figure S4 and Table S5.
Given our observation that recurrent IDHwt tumors show an increase in oligodendrocytes and leading-edge content, we hypothesized that neuronal signaling in stem-like neoplastic cells may result from tumor-neuron interactions. To test this hypothesis, we examined how the stem-like neoplastic cell recurrence signature associated with histological feature content in the GLASS cohort. This revealed a positive association between neuronal signaling in the stem-like neoplastic cell-specific expression and leading-edge content (Figure 4C). Notably, we observed this result at both time points, suggesting that neuronal signaling in stem-like neoplastic cells may be driven more by tumor-neuron interactions themselves than neoplastic cell-intrinsic changes that take place at recurrence. We next evaluated neuronal signaling by comparing how expression of the stem-like neoplastic cell recurrence signature differed between single neoplastic cells collected from the invasive rim, where there are high levels of neurons, versus those collected from the tumor core (Yu et al., 2020). This revealed significantly higher signature expression at the invasive rim, further supporting the association between neuronal signaling and tumor-neuron interactions (Figure 4D). Finally, we performed multiplex immunofluorescence to examine how neoplastic cell expression of neuronal markers differed between pathologist-annotated histological features in recurrent glioma (Figure S4F). Within the infiltrating tumor region, we found neurons (NeuN+) and a high number of neoplastic cells (SOX2+) staining positively for SNAP25, a neuronal marker that was part of our stem-like neoplastic cell recurrence signature. In contrast, there were few neurons and no SNAP25+ cells in the cellular tumor region (Figure 4E). Collectively, these results suggest that increased normal cell content at recurrence associates with higher signaling between neoplastic cells and neighboring neural cells. While we did not observe an association between increased neuronal signaling in stem-like neoplastic cells and overall survival (P > 0.05, Wald test), neuron-to-glioma synapses have previously been implicated in increased tumor growth and invasion (Venkataramani et al., 2019; Venkatesh et al., 2015; Venkatesh et al., 2019; Venkatesh et al., 2017). Our results are consistent with these findings and support a model of greater tumor invasion into the normal brain at recurrence that could be facilitated by increased interactions between neurons and neoplastic cells.
The neoplastic cell state signatures in recurrent IDHmut tumors that received treatment were distinct from those in IDHwt tumors, with the largest proportion of differentially expressed genes found in the differentiated-like instead of the stem-like state (FDR < 0.05, Wilcoxon signed-rank test; Figure 4F, Table S5). The genes in the differentiated-like state that were up-regulated at recurrence were significantly enriched in terms relating to the cell cycle and mitosis (FDR < 0.05; Figure 4G), while the stem-like signature exhibited similar associations at a relaxed significance threshold (FDR < 0.1; Figure S4G). These signatures were consistent with those found in higher grade tumors, and accordingly, we observed that these changes were strongest in the tumor pairs that recurred at a higher grade (Figure S4H). Furthermore, when we compared signature expression in single cells of the same cell state, we found that the signatures were differentially expressed in cells derived from grade 3 versus grade 2 tumors (Figure S4I). Taken together, these results indicate that IDHwt and IDHmut tumors recur in distinct manners that reflect distinct microenvironmental and genetics contributions.
Mesenchymal tumors exhibit a distinct myeloid cell phenotype
The mesenchymal subtype has been associated with high levels of myeloid cells, treatment resistance, and poor patient survival (Bhat et al., 2013; Kim et al., 2021; Wang et al., 2017). We thus sought to understand the factors driving tumors toward this subtype over time. Confirming previous findings, IDHwt tumors with a mesenchymal recurrence exhibited a significantly shorter surgical interval compared to those with non-mesenchymal recurrences (P = 0.03, log-rank test; Figure S5A) (Wang et al., 2017). However, this association was weaker in a multi-variate model (Figure S5B). Single-cell studies have previously shown that samples of this subtype exhibit high levels of neoplastic cells that express a distinct mesenchymal-like expression signature (Neftel et al., 2019). Analysis of the neoplastic cell state-specific expression profiles in samples undergoing a mesenchymal transition revealed that differentiated-like cells, but not stem-like cells, up-regulated this signature at recurrence (Figure S5C).
Given the changes in cellular composition associated with a mesenchymal transition, we hypothesized a role for interactions between tumor-infiltrating myeloid cells and neoplastic cells. To test this, we compared the myeloid compartment between glioma subtypes, by deconvoluting the myeloid-specific gene expression profiles from 687 TCGA glioma transcriptomes. The myeloid compartment in IDHwt tumors was characterized by high blood-derived macrophage signature activity (Muller et al., 2017), while myeloid cells in IDHmut-noncodel tumors exhibited high expression of genes associated with brain-resident microglia (Figure 5A). Stratifying this cohort by transcriptional subtype revealed that the blood-derived macrophage signature was directly correlated with mesenchymal subtype representation, while microglial gene expression was highest amongst tumors of the mixed subtype classification that is seen most frequently in IDHmut-noncodel glioma (Figure S5D). Consistent with these results, principal component analysis of tumor and normal brain myeloid cell expression profiles revealed that those from proneural tumors most closely resembled those from normal brain tissue, while mesenchymal myeloid profiles were more distinct (Figure S5E). Histological feature associations in IDHwt tumors revealed that the blood-derived macrophage signature was positively correlated with the abundance of microvascular proliferation and pseudopalisading cells around necrosis features, while the microglia signature associated with leading-edge content. In contrast, the blood-derived macrophage signature was negatively associated with leading-edge content in IDHmut tumors, while the microglia signature did not exhibit any clear associations (Figure S5F). Longitudinally, when holding transcriptional subtype constant, we observed very few differentially expressed genes in the myeloid cell profiles from matched initial and recurrent tumors (Figure S5G). However, the myeloid profiles in IDHmut tumors that increased grade at recurrence exhibited a significant decrease in microglia signature expression, suggesting a shift in myeloid cell states away from brain-resident microglia (P = 4e-4, Wilcoxon signed-rank test; Figure 5B).
Figure 5. Mesenchymal tumors exhibit a distinct myeloid cell phenotype.

(A) Left: Uniform Manifold Approximation and Projection (UMAP) dimensionality reduction plot of the CIBERSORTx-inferred myeloid profiles from TCGA. Right: UMAP plot colored based on the relative mean expression of macrophage and microglia signatures. (B) Box and ladder plots depicting the difference in the mean expression of the indicated signatures between initial and recurrent IDHmut tumors from GLASS that do and do not recur at higher grades. *** indicates Wilcoxon signed-rank test P-value < 1e-3. (C) Heatmap depicting the normalized expression z-score of genes that were differentially expressed between myeloid cells from mesenchymal and non-mesenchymal TCGA tumors. Top sidebar indicates the bulk mesenchymal score of each sample divided by 1,000. Right sidebar indicates the −log10 Wilcoxon rank-sum test FDR of the association for each gene. Bottom sidebar indicates the transcriptional subtype of each sample per panel (A). (D) Box and ladder plots depicting the difference in the mean expression of the mesenchymal myeloid signature between initial and recurrent IDHwt tumors undergoing a mesenchymal transition in GLASS. **** indicates Wilcoxon signed-rank test P < 1e-5. (E) Boxplot depicting the mean mesenchymal myeloid signature expression for CIBERSORTx-inferred myeloid profiles from different histological features in the Ivy GAP dataset: leading edge (LE), infiltrating tumor (IT), cellular tumor (CT), pseudopalisading cells around necrosis (PAN), and microvascular proliferation (MVP). (F) Representative multiplex immunofluorescence images of myeloid cells near blood vessels from classical (left) and mesenchymal (right) IDHwt tumors. Scale bars represent 20 μm. See also Figure S5 and Tables S6, S7, and S8.
Macrophages are highly plastic and capable of changing their transcriptional programs in response to different stimuli (Xue et al., 2014). We thus hypothesized that different glioma transcriptional subtypes would exhibit distinct myeloid expression programs. To test this, we compared myeloid-specific expression profiles from each transcriptional subtype to those from normal brain tissue (Figure S5H; Table S6). Myeloid cells from the classical and mesenchymal subtypes exhibited an immunosuppressive phenotype, with each signature including genes from the blood-derived macrophage signature as well as the immune checkpoint genes, PDCD1LG2 and IDO1. In addition to this shared signature, myeloid cells from mesenchymal glioma specifically upregulated another 300 genes, suggesting a distinct biology. To better understand the processes taking place in this subtype, we directly compared the myeloid gene expression profiles between mesenchymal and non-mesenchymal IDHwt tumors in TCGA. This analysis revealed a 186-gene signature that was significantly upregulated in mesenchymal tumors (FDR < 0.05, fold-change > 1.5; Figure 5C, Table S7) and enriched in chemokine signaling and lymphocyte chemotaxis functions (Figure S5I). Expression of this signature in single myeloid cells from our single-cell dataset was strongly associated with bulk RNAseq mesenchymal glioma subtype score from the same patient (R = 0.89, P = 3e-3; Figure S5J). Longitudinally, IDHwt tumors undergoing a mesenchymal transition exhibited myeloid-specific expression profiles with significantly higher expression of this signature at recurrence (P = 8e-8, Wilcoxon signed-rank test; Figure 5D).
Overall, these analyses revealed a mesenchymal-specific myeloid cell state that associated with dynamic changes in neoplastic cell expression over time. We hypothesized that these cells represent a subset of blood-derived macrophages that interact directly with mesenchymal neoplastic cells. We used the Ivy GAP dataset to determine where this myeloid cell state resided in the tumor. This revealed that the mesenchymal myeloid signature expression was strongest in the pseudopalisading cells around necrosis and microvascular proliferation features that also harbor high levels of blood-derived macrophages (Figure 5E). Correlating the myeloid-specific expression of this signature with histological feature proportions in TCGA revealed similar results (Figure S5K). We next performed a ligand-receptor interaction analysis to identify candidate ligand-receptor pairs that associate with mesenchymal-transitions over time. To probe these interactions, we downloaded a set of 1,894 literature-supported ligand-receptor pairs (Ramilowski et al., 2015) and identified all pairs that had one component expressed in a tumor’s deconvoluted myeloid profile and the other expressed in the differentiated-like neoplastic cell profile. We then compared how the longitudinal expression change of each component associated with the change in each tumor pair’s mesenchymal subtype score. This identified 105 putative ligand-receptor pairs where each component exhibited a positive association (R > 0, FDR < 0.05). Of these pairs, 49 also exhibited these associations in our single-cell dataset (Table S8). This analysis revealed that expression of oncostatin M (OSM) and oncostatin M receptor (OSMR) by myeloid cells and differentiated-like neoplastic cells, respectively, was one of the strongest correlates of the mesenchymal subtype, consistent with studies showing that this signaling associates with mesenchymal-like expression programs both in vitro and in vivo (Hara et al., 2021; Junk et al., 2017). To determine whether spatial convergence of OSM-expressing myeloid cells (CD14+) and mesenchymal-like neoplastic cells (CD44+/SOX2+) takes place in human tissue samples, we examined their distribution using multiplex immunofluorescence. In mesenchymal IDHwt glioma, we observed high OSM expression in myeloid cells near blood vessels and mesenchymal neoplastic cells, while these expression patterns were not observed in classical glioma (Figure 5F). These analyses together identify a candidate ligand-receptor interaction that can potentially be targeted to change a tumor’s trajectory following treatment.
Antigen presentation is disrupted at recurrence in IDHmut-noncodel glioma
The interactions between myeloid cells and mesenchymal neoplastic cells suggest a role for the immune system in shaping glioma evolution. T cells may drive cancer evolution through the elimination of neoantigen-presenting tumor subclones (Grasso et al., 2018; McGranahan et al., 2017; Rooney et al., 2015; Rosenthal et al., 2019; Zhang et al., 2018). While rare in glioma, these cells have been shown to select for epigenetic changes and specific genetic alterations (Gangoso et al., 2021; Kane et al., 2020) and converge with rare, recorded responses to immune checkpoint inhibition (Cloughesy et al., 2019; Zhao et al., 2019). We hypothesized that if T cell selection was taking place in glioma, we would observe high rates of loss-of-heterozygosity (LOH) in the human leukocyte antigen (HLA) genes that are central to the presentation of neoantigens. We observed HLA LOH in at least one timepoint in 19% of GLASS patients (Figure 6A). Within IDHwt and IDHmut-codel tumors, HLA LOH was found at similar rates between initial and recurrent tumors, with most affected pairs exhibiting this alteration at both time points. In contrast, significantly more IDHmut-noncodel tumors acquired HLA LOH at recurrence (P = 0.04, Fisher’s exact test), suggesting this alteration could be under positive selection. To test this, we used a simulation approach (McGranahan et al., 2017) that determined whether focal losses of the HLA genes occurred at a higher rate than expected by chance given a sample’s overall somatic copy number alteration (SCNA) burden. In both IDHwt and IDHmut recurrences we did not observe evidence of positive selection using this approach (P > 0.05). Furthermore, we did not observe an association between HLA LOH status and T cell-mediated selection metrics, including the fraction of infiltrating T cells in each tumor (Figure 6B), the rates of neoantigen depletion (Figure S6A), and the number of neoantigens binding to the kept versus lost alleles (Figures S6B).
Figure 6. Antigen presentation is disrupted at recurrence in IDHmut-noncodel glioma.

(A) Left: Sankey plots indicating whether a tumor pair acquires or loses HLA LOH at recurrence. Colored lines indicate HLA LOH in the initial tumor, dark gray lines indicate acquired HLA LOH. Right: Stacked bar plot indicating the proportion of samples for each glioma subtype that acquired HLA LOH at recurrence. * Fisher’s exact test P-value < 0.05. (B) Violin plot depicting the difference in T cell proportion in samples with and without HLA LOH. P-values from t-test. (C) Left: Ladder plots depicting the change in SCNA burden between paired initial and recurrent IDHmut-noncodel tumors that did and did not acquire HLA LOH. P-values from Wilcoxon signed-rank test. Right: Boxplot depicting the difference in the change in SCNA burden between IDHmut-noncodel tumor pairs that did and did not acquire HLA LOH. P-value from Wilcoxon rank-sum test. See also Figure S6.
Overall, our results suggested that HLA LOH in glioma was not selected for, contrasting it with other cancer types. We hypothesized instead it was a passenger event, and thus would be more likely to occur in samples with high SCNA burdens. In support of this, we found that IDHmut-noncodel tumors that acquired HLA LOH at recurrence exhibited significantly larger increases in SCNA burden than those that did not (P = 0.02, Wilcoxon rank-sum test; Figure 6C). In IDHwt tumors, we did not observe these longitudinal associations. However, at both the initial and recurrent time points IDHwt tumors with HLA LOH exhibited significantly higher SCNA burdens than those with both HLA alleles, supporting that HLA LOH is a passenger event in these tumors as well (P < 0.05, Wilcoxon rank-sum test; Figure S6C). Taken together, these results suggest that disruption of antigen presentation in glioma is likely a byproduct of genome-wide copy number changes rather than being a result of selection by cytolytic T cells.
Discussion
Here, we combined longitudinal, single-cell, and spatially resolved datasets to comprehensively define the transcriptional and compositional changes that gliomas sustain at recurrence. Supplementing the treatment-associated genetic alterations we previously described (Barthel et al., 2019; Kocakavuk et al., 2021), we have identified three distinct recurrence-specific phenotypes: neuronal, mesenchymal, and proliferative. Through integrative profiling, we found that each phenotype converges with cellular, genetic, and histological features that emerge at recurrence (Figure 7). Consequently, they associate with less favorable clinical trajectories and are present in IDHwt and IDHmut tumors at different rates, with IDHwt tumors exhibiting all three phenotypes at recurrence and a subset of IDHmut tumors exhibiting the proliferative phenotype. Notably, these are not mutually exclusive, with some IDHwt tumors simultaneously exhibiting features associated with multiple phenotypes. Overall, this grouping offers a framework through which to better understand progression in diffuse glioma and can help guide clinical decisionmaking for recurrent disease.
Figure 7. Recurrent diffuse gliomas can be grouped into three recurrence phenotypes.
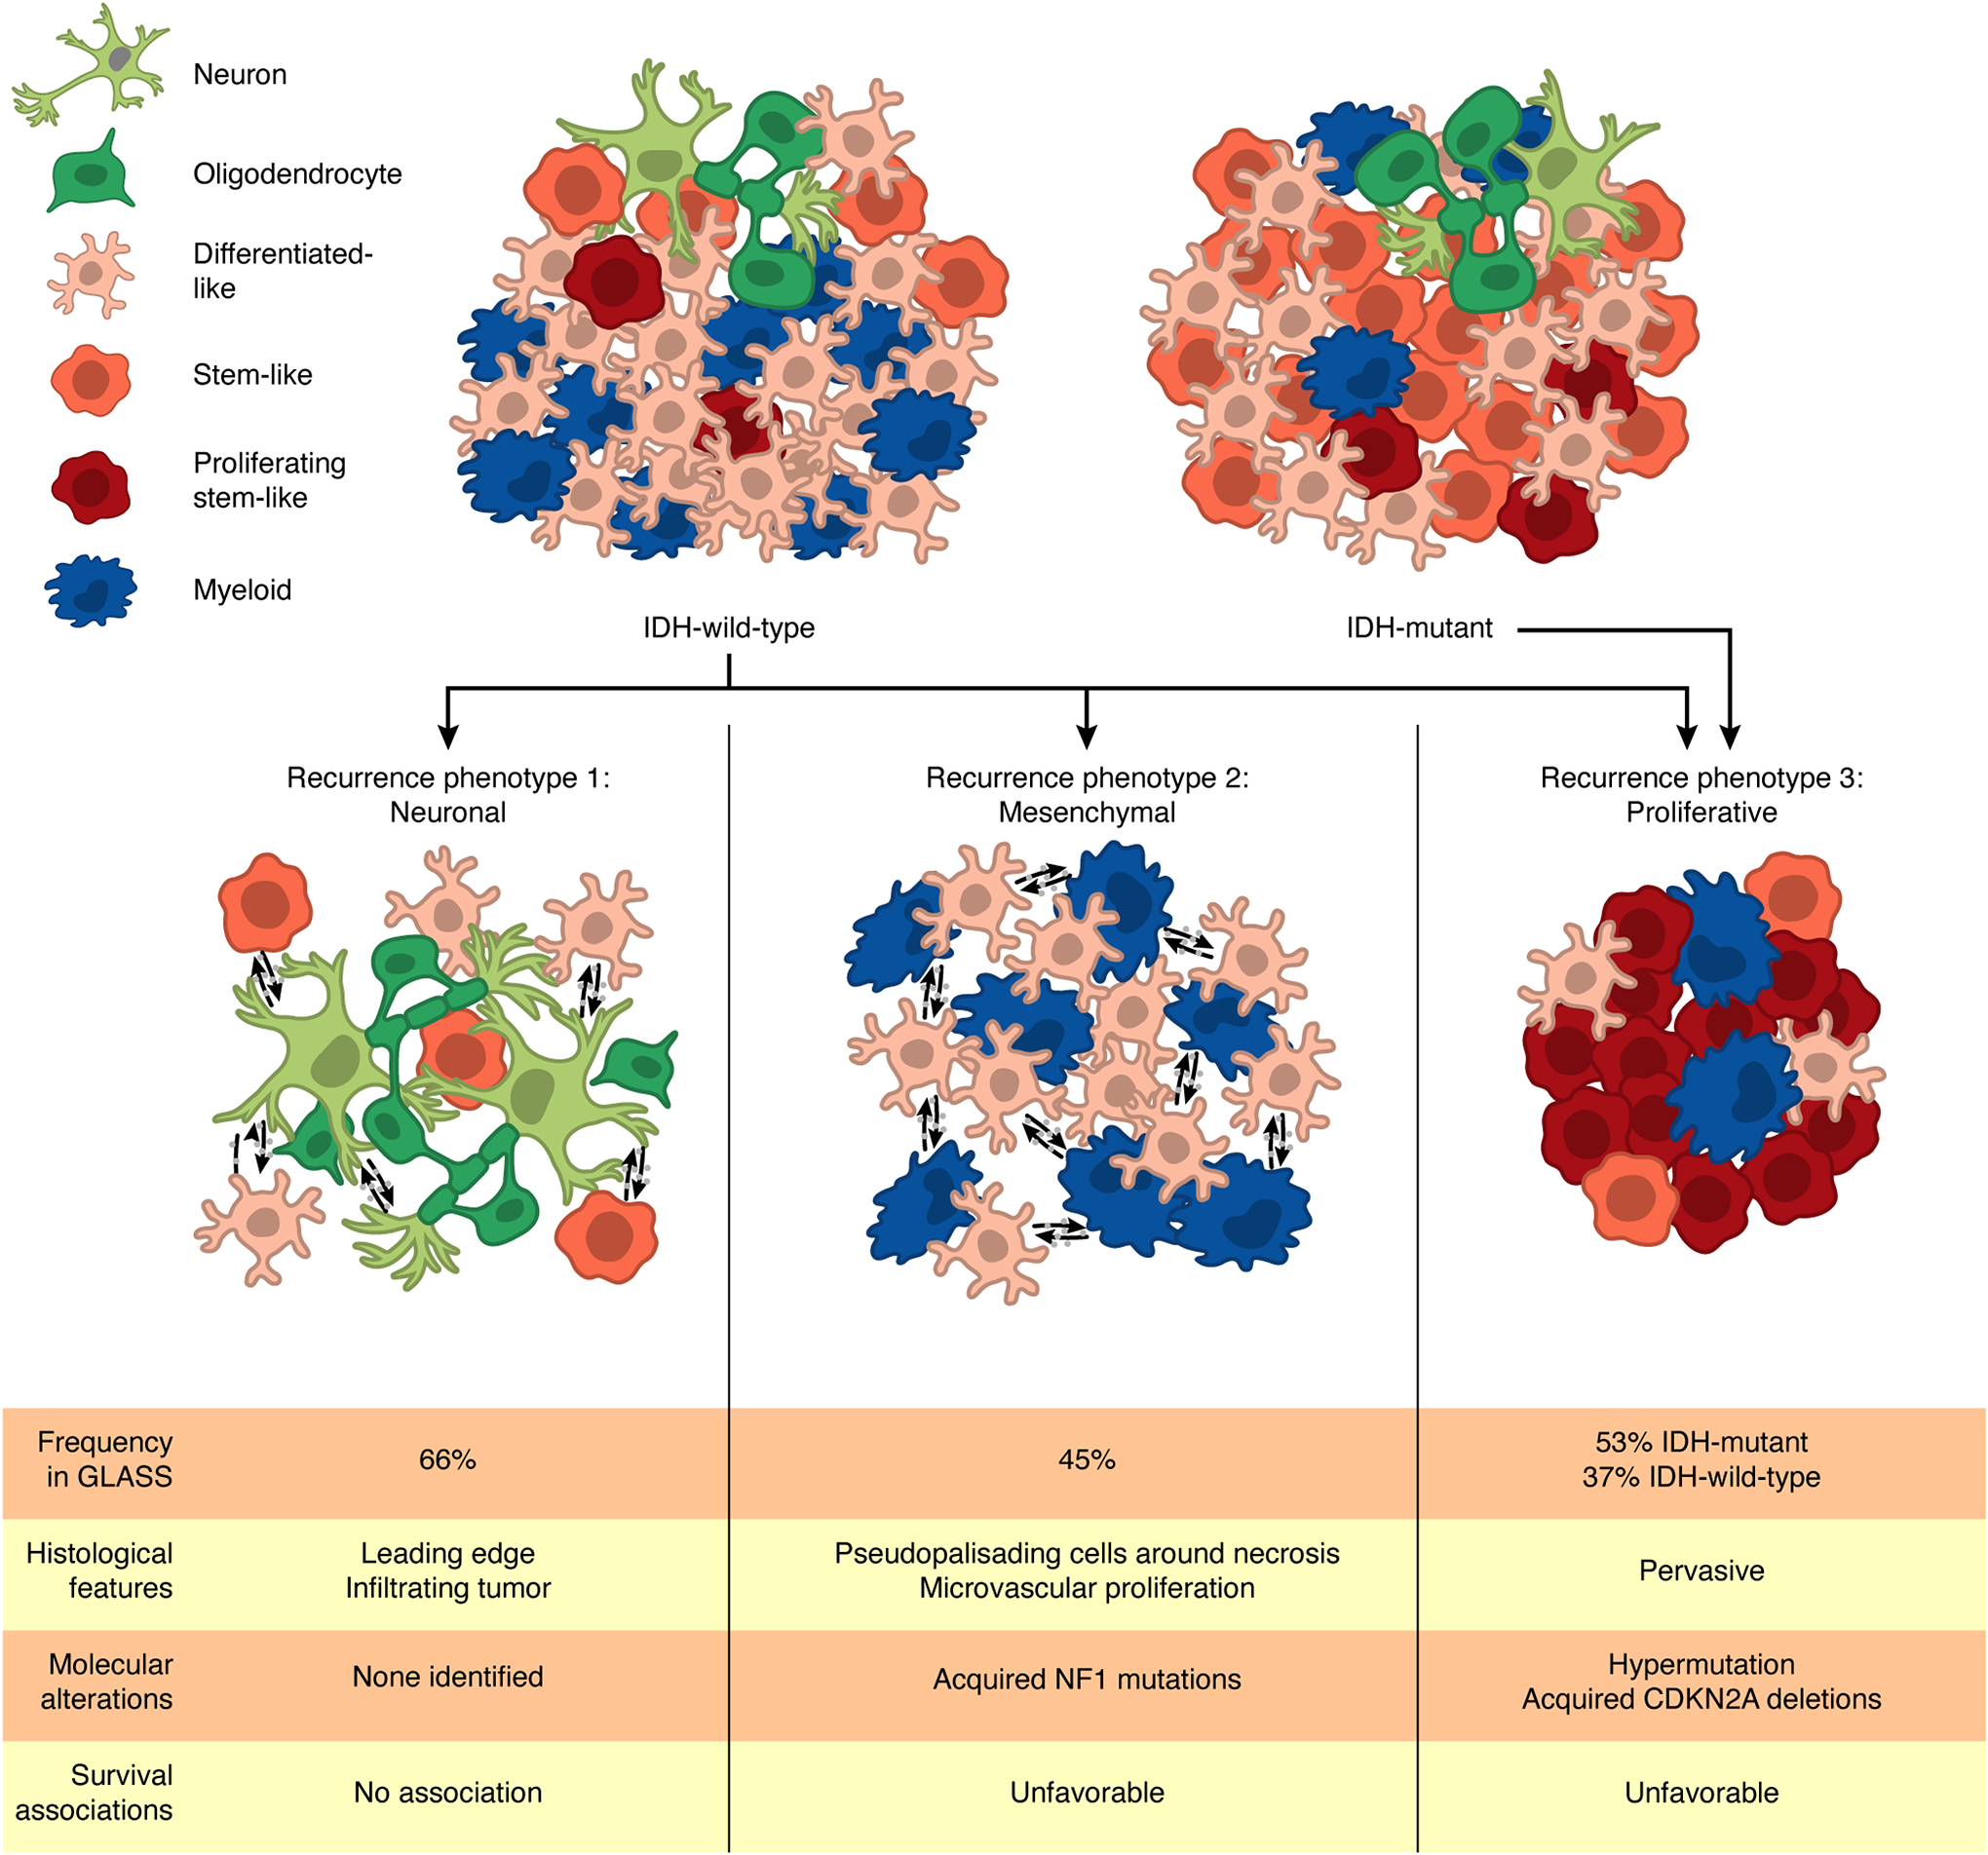
Analysis of the GLASS dataset reveals that recurrent IDHwt and IDHmut tumors can be grouped into three recurrence phenotypes: neuronal, mesenchymal, and proliferative. Each of these phenotypes is associated with specific cellular and histological features and molecular alterations with some also associating with poor patient survival. Some tumors can exhibit multiple phenotypes at once. Frequencies of the neuronal, mesenchymal, and proliferative phenotypes in the GLASS cohort were determined based on the number of recurrent samples that exhibited increased oligodendrocyte content, were classified as the mesenchymal transcriptional subtype, and increased proliferating stem-like content, respectively.
Through single-cell- and histology-based deconvolution approaches, we observed that IDHwt tumors exhibited significant increases in oligodendrocytes and leading-edge features that were consistent with increased infiltration into the brain parenchyma at recurrence. Stem-like neoplastic cells of these tumors, especially cells at the invasive tumor margin, overexpressed genes related to neuronal signaling. Overall, these changes occurred in 66% of the IDHwt tumor pairs in the GLASS cohort, suggesting that this neuronal phenotype is a frequent feature at recurrence. This phenotype likely derives from exposure of neoplastic cells to neuronal cells that may exist at diagnosis but is more frequent at recurrence when more tumor cells have invaded the neighboring brain tissue. Our findings build upon a growing appreciation of the role neuron-glioma interactions play in glioma invasion and progression (Venkataramani et al., 2019; Venkatesh et al., 2015; Venkatesh et al., 2019).
Other cohort-wide changes in the microenvironmental composition of recurrent IDHwt tumors were limited. However, in agreement with other studies, we found that myeloid cell phenotypes varied in relation to tumor subtype and neoplastic cell state (Chen et al., 2021; Klemm et al., 2020; Ochocka et al., 2021; Pombo Antunes et al., 2021; Sa et al., 2020). Notably, myeloid cells in mesenchymal tumors exhibited a distinct transcriptional program compared to other subtypes. This signature was apparent in tumors undergoing a mesenchymal transition suggesting a distinct myeloid cell state is involved in driving tumors toward the mesenchymal subtype in response to treatment. In support, ligand-receptor analyses revealed several candidate signaling pairs associated with mesenchymal transitions, including the previously identified OSM-OSMR interaction (Hara et al., 2021; Junk et al., 2017). Resolving the directionality of these tumor-myeloid interactions, and determining whether additional factors mediate them, will help predict which tumors will exhibit a mesenchymal phenotype at recurrence.
A subset of IDHwt and IDHmut gliomas exhibited a proliferative phenotype that was characterized by increased proliferating stem-like neoplastic cells and shorter overall survival. Analysis of the acquired somatic alterations in these tumors revealed that this phenotype was associated with temozolomide-driven hypermutation and acquired alterations of the cell cycle regulators CDKN2A and CCND2, which have been shown to occur exclusively in post-radiation IDHmut gliomas (Kocakavuk et al., 2021). These findings suggest tumors undergo co-occurring genetic and cell phenotype evolutionary processes in response to chemo- and radiotherapy. Our data highlights an unmet clinical need for tools that predict treatment-induced genetic changes and identify patients that may benefit from subsequent chemoradiation-sensitizing therapies.
Therapy resistance remains a significant obstacle for patients with diffuse glioma and must be overcome to improve quality of life and survival. Overall, our results reveal that gliomas undergo changes in cell states that associate with changes in genetics and the microenvironment, providing a baseline towards building predictive models of treatment response. Future efforts by the GLASS Consortium include expansion of the cohort, integration of digitized tissue sections, and associating clinical and genomic datasets with radiographic imaging data (Bakas et al., 2020). Going forward, the transcriptional and compositional changes we have identified can be integrated with imaging-based results to further assess the molecular and microenvironmental heterogeneity of glioma and identify clinically targetable factors to aid in shaping a patient’s disease trajectory.
Limitations of the Study
The GLASS patient cohort consists of relatively younger individuals who had a more favorable clinical outcome resulting from the requirement they can sustain multiple surgical procedures across their disease trajectory. Findings from our study may be less applicable to patients experiencing severe disease. Regarding the methods used in this study, bulk RNAseq profile deconvolution approaches are limited in their ability to detect rare cellular subpopulations and can only attribute cell state-specific expression activity to the cell states defined in their input signature matrix. The signature matrices we used lacked neurons and astrocytes, as well as recurrence-specific histological features, limiting the direct assessment of their respective contributions to mediating treatment resistance. Due to these limitations, our analyses were mainly directed toward understanding the broad differences between longitudinal samples and transcriptional subtypes where we were well-powered to make comparisons.
STAR Methods
Resource Availability
Lead Contact
Further information and requests for resources should be directed to the lead contact, Roel Verhaak (Roel.Verhaak@jax.org).
Materials Availability
This study did not generate new unique reagents.
Data and Code Availability
Estimated count and transcript per million gene expression matrices as well as mutation calls, copy number calls, and all downstream tables generated for this study can be downloaded on Synapse (https://www.synapse.org/glass). Digitized H&E images are available on the Digital Slide Archive (https://styx.neurology.emory.edu/girder/#collection/625dda70622f966e826a0446).
All custom scripts, pipelines, and code used in data processing and figure creation is available on the project’s Github repository (https://github.com/fsvarn/GLASSx).
Any additional information required to reanalyze the data reported in this paper is available from the lead contact upon request.
Experimental Model and Subject Details
Human Subjects
Human tissue collection was performed with written informed consent from patients. The protocol used to collect and sequence specimens, or collect and analyze data from patients, was approved by the institutional review board (IRB) of the Jackson Laboratory (17-007 DUA MDA 17349-JGM, 17-008 DUA MDA 17425-JGM, 18-003 DUA Kyoto-JGM, 18-004 DUA Samsung-JGM, 18-005 DUA Vienna-JGM, 18-006 DUA Dana-JGM, 18-008 DUA LEEDS-JGM, 19-007 DUA DKFZ-JGM, 19-008 DUA Case-JGM, 20-005 DUA HenryF-JGM, 20-015 DUA MDA-JGM, 20-26541 dbGaP-JGM, 2019-057-JGM, 2019-084-JGM). Patients were males and females. Clinical characteristics of the cohort are summarized in Table S2.
Method Details
GLASS Datasets
Datasets added to GLASS came from both published and unpublished sources (Table S1). Collectively, the newly added data consisted of DNA-sequencing data from 109 glioma samples (53 patients) and RNA-sequencing data from 392 samples (206 patients).
Newly generated DNA- and RNA-sequencing data was collected for a cohort of frozen samples from Henry Ford Health System and Seoul National University. For the Henry Ford Health System cohort, DNA and RNA were simultaneously extracted from each sample using the AllPrep DNA/RNA Mini Kit from Qiagen (#80204). Exon capture was then performed using the Agilent SureSelectXT Low-Input Reagent Kit and the V6 + COSMIC capture library and the resulting reads were subjected to 150 base pair paired-end sequencing at the University of Southern California using an Illumina NovaSeq 6000. RNA from these tissues was processed and sequenced at Psomagen. For the Seoul National University cohort, DNA and RNA were simultaneously extracted from each tumor sample at The Jackson Laboratory for Genomic Medicine using the AllPrep DNA/RNA Mini Kit from Qiagen (#80204). For blood samples, DNA was extracted using the QIAamp DNA Mini and Blood Mini Kit from Qiagen (#51104). 200ng of DNA was sheared to 400bp using a LE220 focused-ultrasonicator (Covaris) and size selected using Ampure XP beads (Beckman Coulter). The fragments were treated with end-repair, A-tailing, and ligation of Illumina unique adapters (Illumina) using the KAPA Hyper Prep Kit (Illumina) from Roche (#7962363001). Whole genome libraries were then subjected to 150 base pair paired-end sequencing on the Illumina NovaSeq 6000 to achieve 25X coverage for normal samples and >35–40X coverage for tumor samples. RNAseq libraries were prepared with the KAPA mRNA Hyperprep kit from Roche (#8098123702) and then sequenced using an Illumina NovaSeq 6000 platform generating paired-end reads of 150 base pairs.
New RNAseq data was also generated for cohorts coming from Case Western Reserve University, the Chinese University of Hong Kong, the Luxembourg Institute of Health, and MD Anderson Cancer Center. For Case Western Reserve University, RNA from frozen tissues was processed at Tempus (Chicago, IL) using the Tempus xO assay and then sequencing using an Illumina HiSeq 4000 platform. For the Chinese University of Hong Kong cohort, RNAseq libraries were prepared with the KAPA Stranded mRNAseq kit (Roche) and then sequenced at The Jackson Laboratory for Genomic Medicine using an Illumina HiSeq4000 platform generating paired-end reads of 75 base pairs. For the Luxembourg Institute of Health cohort, RNAseq libraries were prepared with the KAPA mRNA Hyperprep kit (Roche) and then sequenced at The Jackson Laboratory for Genomic Medicine using an Illumina NovaSeq 6000 platform generating paired-end reads of 150 base pairs. For the MD Anderson cohort, purified double-stranded cDNA generated from 150 ng of FFPE sample-derived RNA was prepared using the NuGEN Ovation RNAseq System and subjected to paired-end sequencing using an Illumina HiSeq 2000 or HiSeq 2500 platform.
The remaining datasets were generated as described in their respective publications (cited below). For most of these cohorts, whole exome and/or whole genome sequencing data were downloaded and processed as described during creation of the initial GLASS dataset (Barthel et al., 2019). RNAseq fastq files from the Samsung Medical Center (SM) cohort were delivered via hard disk and are available to download from the European Genome-Phenome Archive (EGA) under accession numbers EGAS00001001041 and EGAS00001001880 (Kim et al., 2015b; Wang et al., 2016). RNAseq bam files for the original Henry Ford Health System (HF) and the University of California San Francisco (SF) cohorts were downloaded from EGA under accession numbers EGAS00001001033 and EGAS00001001255, respectively, and converted to fastq files for subsequent processing using bedtools (Kim et al., 2015a; Mazor et al., 2015; Quinlan and Hall, 2010). RNAseq fastq files for the University of Leeds (LU) cohort were downloaded from EGA under accession number EGAS00001003790 (Droop et al., 2018). For the first Columbia cohort (CU-R), which consisted of samples originally collected from the Istituto Neurologico C. Besta, RNAfastq files were delivered via hard disk and are available to download at the Sequencing Read Archive (SRA) under BioProject number PRJNA320312 (Wang et al., 2016). For the second Columbia cohort (CU-P), which featured samples that had been treated with immune checkpoint inhibitors, raw fastq reads for whole exome and RNAseq were obtained from SRA under BioProject number PRJNA482620 (Zhao et al., 2019). RNAseq fastq files from the Low Grade Glioma (LGG) and Glioblastoma Multiforme (GBM) projects in TCGA were obtained from the Genomic Data Commons legacy archive (https://portal.gdc.cancer.gov/legacy-archive/) (Brennan et al., 2013; Cancer Genome Atlas Research et al., 2015).
For each dataset, clinical data based on patient medical records was provided by the participating institution or, when not available, was obtained from the dataset’s respective publication. To create a shared clinical dataset to be used throughout the study, clinical data sheets were combined and organized into a common set of variables as previously described in the Supplementary Information of the original GLASS study (Barthel et al., 2019).
Public Datasets
Processed and batch-corrected RNAseq data from the TCGA and Genotype-Tissue Expression (GTEx) projects were obtained from the University of California Santa Cruz Xenabrowser (cohort: TCGA TARGET GTEx, dataset ID: TcgaTargetGtex_rsem_gene_tpm, author: UCSC TOIL RNA-seq recompute) (Goldman et al., 2020), and then subset to only include TCGA glioma (GBM/LGG), GTEx Brain Frontal Cortex, and GTEx Cortex samples. Normalized gene-level fragments per kilobase million (FPKM) for the Ivy Glioblastoma Atlas Project (Ivy GAP) dataset were obtained from the Ivy GAP website (https://glioblastoma.alleninstitute.org/static/download.html) (Puchalski et al., 2018). Processed single-cell data and associated metadata for a set of 28 IDHwt glioblastomas processed using SmartSeq2 was obtained from the Broad Single Cell Portal (Study: Single cell RNA-seq of adult and pediatric glioblastoma; https://singlecell.broadinstitute.org/single_cell/study/SCP393/single-cell-rna-seq-of-adult-and-pediatric-glioblastoma) (Neftel et al., 2019). Raw count data and metadata from a multi-sector single-cell RNAseq dataset (Yu et al., 2020) was obtained from the Gene Expression Omnibus (GSE117891) and processed using the “NormalizeData” function in the R package “Seurat” v3.2.3 (Stuart et al., 2019). Neoplastic cells in this dataset were determined as described previously (Garofano et al., 2021). Raw count data and clinical annotation data from a set of glioma-derived cell populations purified using fluorescence activated cell sorting (FACS) were obtained from the Brain Tumor Immune Micro Environment (BrainTIME) portal and converted to counts per million (CPM) for downstream analysis (https://joycelab.shinyapps.io/braintime/) (Klemm et al., 2020).
Whole exome and whole genome analysis
Whole exome and genome alignment, fingerprinting, variant detection, variant post-processing, mutation burden calculation, copy number segmentation, copy number calling, copy number-based purity, ploidy, HLA typing, and neoantigen calling were all performed using previously described pipelines that were developed during the initial GLASS data release (Barthel et al., 2019). Briefly, whole exome and whole genome reads were aligned to the b37 genome (human_g1k_v37_decoy) using Burrows-Wheeler Aligner (BWA) MEM 0.7.17 (Li and Durbin, 2009) and pre-processed according to GATK Best Practices with GATK 4.0.10.1 (McKenna et al., 2010). Fingerprinting on the resulting files was performed using ‘CrosscheckFingerprints’ to confirm all readgroups from a given sample and all samples from a given patient match, with all mismatches being labelled and dropped from downstream analysis. Somatic mutations were called using GATK4.1 MuTect2. Hypermutation was defined for all recurrent tumors that had more than 10 mutations per megabase sequenced, as described previously (Barthel et al., 2019). Copy number segmentation and calling was performed according to GATK Best Practices as previously described. Copy number-based tumor purity and ploidy were determined using TITAN (Ha et al., 2014). Four-digit HLA class I types were determined from the normal .bam files for each sample using OptiType v1.3.2 (Szolek et al., 2014). Neoantigens were called from each patient’s somatic mutations and HLA types using pVACseq v4.0.10 (Hundal et al., 2016). Neoantigen depletion was calculated as described previously (Barthel et al., 2019). Loss of heterozygosity (LOH) for each sample’s HLA type was called from their respective matched tumor and normal bam files using LOHHLA run with default parameters and a coverage filter of 10 (McGranahan et al., 2017). HLA LOH was called if the estimated copy number for an allele using binning and B-allele frequency was < 0.5 and the P-value for allelic imbalance was < 0.05 (paired t-test). Positive selection of focal HLA LOH events was determined using a previously described simulation approach (McGranahan et al., 2017) where a tumor’s null probability of deletion LOH for a given genomic region was determined based on the overall proportion of its genome exhibiting a deletion LOH event according to TITAN.
RNA preprocessing
To ensure each RNAseq file matched to the DNA and RNAseq files from their respective sample and patient, RNAseq fastq files were aligned to the b37 genome using STARv2.7.5 (Dobin et al., 2013) and the resulting bams were then preprocessed using the same pipelines described for DNA sequencing (Barthel et al., 2019). Fingerprinting was then performed on each bam at the readgroup and patient levels using ‘CrosscheckFingerprints.’ For each patient-level comparison, each RNA bam was compared to all other RNA and DNA bams coming from the same patient. All mismatches were labelled and dropped from downstream analysis.
RNAseq fastq files were pre-processed with fastp v0.20.0 (Chen et al., 2018). Transcripts per million (TPM) values were then calculated from each sample’s pre-processed files using kallisto v0.46.0 (Bray et al., 2016) inputted with an index file built from the Ensemblv75 reference transcriptome. Strand-specific library preparation information was obtained for each sample from the source provider or using STARv2.7.5 quantMode set with the ‘GeneCounts’ parameter. The resulting TPM values for each sample were combined into a transcript expression matrix for downstream analysis. To create a gene expression matrix, transcript TPM values were collapsed and summed by their respective gene symbols.
Quality control
To be included in longitudinal downstream analyses, all samples from the same patient had to be collected at least one month apart, as described previously (Barthel et al., 2019). For DNA samples to be included in longitudinal downstream analyses, two samples from a given patient had to pass a previously described quality control process based on fingerprinting, coverage, and copy number variation (Barthel et al., 2019). For RNA samples to be included in longitudinal downstream analyses, two samples from a given patient had to pass a patient-level fingerprinting filter that ensured that the RNA samples matched each other and the patient’s respective DNA samples if available. Tumor pairs that had DNA and RNA that passed filtering at each timepoint were used in all downstream analyses that integrated DNA and RNA data.
Bulk transcriptional subtype classification
Bulk transcriptional subtyping was performed on each GLASS or TCGA sample’s processed RNAseq profile using the “ssgsea.GBM.classification” R package (Wang et al., 2017). This method outputs an enrichment score quantifying the representation of each of the three bulk glioma subtypes in a sample as well as a P-value indicating the significance of this representation. For analyses that required a single subtype to be assigned to each sample, the subtype with the lowest P-value was chosen. In cases where there were ties between subtypes, the subtype with the highest enrichment score was chosen. For analyses that did not require a single subtype designation, all subtypes with P-value < 0.05 were assigned to the sample, with “mixed” subtype designations used when all subtypes were equally represented.
Joint single-cell and bulk RNAseq dataset
Single-cell and bulk RNA sequencing data were generated and processed as previously described (Johnson et al., 2021) and are available for download on Synapse (https://www.synapse.org/#!Synapse:syn2225778). Briefly, tumor surgical specimens were freshly collected, minced, and partitioned into single-cell and bulk fractions from the same tumor aliquot. The tissues aliquoted for single cell analyses were then mechanically and enzymatically dissociated using the Brain Tumor Dissociation Kit (P) (Miltenyi Cat. No. 130-095-942). FACS was performed to select for viable single cells (Propidium Iodide-, Calcein+ singlets) and enrich for tumor cells by limiting the proportion of non-tumor cells (e.g., immune (CD45+) and endothelial (CD31+) cells). Sorted cells were then loaded on a 10X Chromium chip using the single-cell 3’ mRNA kit (10X Genomics). The Cell Ranger pipeline (v3.0.2) was used to convert Illumina base call files to fastq files and align fastqs to hg19 10X reference genome (version 1.2.0) to be compatible with our bulk sequencing data. Data preprocessing and analysis was performed using the Scanpy package (1.3.7) (Wolf et al., 2018) with batch correction performed using BBKNN (Polanski et al., 2020). RNA was extracted for tissues with sufficient tissue and bulk RNAseq libraries were prepared with KAPA mRNA HyperPrep kit (Roche). Bulk RNA sequencing data was processed with the same pipeline as the GLASS samples.
Deconvolution analyses
Cellular proportions and cell state-specific gene expression matrices were inferred from bulk RNAseq gene expression matrices using CIBERSORTx (Newman et al., 2019). Reference scRNAseq signature matrices were created from our internal 10x-derived scRNAseq dataset (Johnson et al., 2021) and a publicly available SmartSeq2-derived scRNAseq dataset (Neftel et al., 2019) using the ‘Create Signature Matrix’ module on the CIBERSORTx webserver (https://cibersortx.stanford.edu/) with default parameters and quantile normalization disabled. The Ivy GAP signature matrix was downloaded from a prior publication (Puchalski et al., 2018). The CIBERSORTx webserver currently recommends users input no more than 5,000 different single-cell profiles when creating their signature matrix (Steen et al., 2020). To meet this recommendation, our internal scRNAseq dataset, which is made up of 55,284 single cells, was randomly downsampled to 5,000 cells using the ‘sample’ command in R with the seed set to 11. The cells not included in signature matrix formation were then set aside for validation analyses.
Single-cell-derived cellular proportions and cell state-specific gene expression profiles were inferred from bulk RNAseq datasets using the CIBERSORTx High-Resolution docker container (https://hub.docker.com/r/cibersortx/hires) following CIBERSORTx instructions. For all runs, the bulk RNAseq dataset was input as the ‘mixture’ file and the respective signature matrix was input as the ‘sigmatrix’ file. For runs using our 10x-derived internal scRNAseq signatures, batch correction was done in ‘S-mode’ by setting the ‘rmbatchSmode’ parameter to TRUE, while for runs using SmartSeq2-derived scRNAseq signatures batch correction was done in ‘B-mode’ by setting the ‘rmbatchBmode’ parameter to TRUE. For each run, the input signature matrix’s respective CIBERSORTx-created “source gene expression profile” was input for batch correction. For all runs, the ‘subsetgenes’ parameter was set to a file containing the intersection of the gene symbols between the run’s respective source gene expression profile and the bulk RNAseq matrix that was being deconvoluted. For the run applying our internal scRNAseq dataset to the bulk GLASS RNAseq matrix, the ‘groundtruth’ parameter was set to a ground truth FACS-purified dataset that was generated as described below. Cellular proportions representing pre-created Ivy GAP signatures were inferred using the ‘Impute Cell Fractions’ module on the CIBERSORTx webserver set to relative mode with quantile normalization and batch correction disabled and 100 permutations for significance analysis.
Immunofluorescence staining and image acquisition
Tissue samples used in multiplex immunofluorescence microscopy were formalin-fixed, paraffin-embedded and sectioned to a thickness of 5 μm unless otherwise stated. Tissue sections were heated at 58°C for 10 minutes, dewaxed in Histoclear (National Diagnostics) for 20 min and rehydrated in a graded series of alcohol (ethanol:deionized water 100:0, 90:10, 70:30, 50:50, 0:100; 5 min each). Heat-induced epitope retrieval (95°C) was conducted in citrate buffer (pH 6) for 15 min using a BioSB TinoRetriever. After antigen retrieval, tissue sections were permeabilized with PBS 0.1% Triton-X100, washed with PBS and consecutively treated with Fc Receptor Block (Innovex bioscience) for 40 min + Background Buster (Innovex bioscience) for an additional 30 min. The sections were then stained with primary antibodies, diluted in PBS + 5% BSA overnight at 4°C, and then washed and stained with the secondary antibodies at room temperature for 30 minutes. Afterwards, tissues were washed and secondary antibodies were saturated with rabbit normal serum diluted at 1/20 in PBS for 15 minutes at room temperature. Tissues were then stained with directly conjugated antibody mix for 1 hour at room temperature and washed. Nuclei were counterstained with 4’,6-diamidino-2-phenylindole (1ug/mL) or SytoxBlue 1/3000 for 2 minutes. Tissues were then mounted in Fluoromount-G mounting media.
Images were acquired on a Leica SP8 confocal microscope equipped with an automated motorized stage. Spectral unmixing was achieved with combination of white light laser tuned laser line for each specific fluorophore, tunable detection window for each marker and sequential acquisition. Whole-slide scans were acquired with a dry 20x objective, while partial slide scans for the panels that included OSM and SNAP25 were acquired with a 40x oil immersion objective. Tiles were stitched and max projected using Leica LAS X software.
Histo-cytometry
Quantification of single-cell protein expression from immunofluorescence scans was performed using histo-cytometry as previously described (Gerner et al., 2012; Wang et al., 2018; Wu et al., 2018). Briefly, each whole slide tissue scan was segmented using Imaris software (version 9.0.2). Using the “spot” function in Imaris, images were segmented using individual cells with a nucleus equal or larger than 5 μm as a seeding point to extend each cells’ surface. The accuracy of the segmentation was manually verified for each sample and adjusted if needed. For each generated spot, x and y coordinates and mean intensity values for all channels were combined and exported into Flowjo v10 to select regions of interest, if needed. Final coordinates and intensity values were exported into a csv file for further analysis in R.
Validation of cell state proportions
Cell state proportions derived from our internal scRNAseq dataset were validated using three approaches. In the first approach, synthetic mixtures were made using the single-cell gene expression profiles that had been left out of signature creation. Each synthetic mixture represented the average expression profile of 5,000 single cells where the number of cells of one cell state were manually set and the remaining cells were randomly sampled. Each cell state had its level manually set in 11 mixtures, where it represented 0% of the cells in the first mixture and then increased in 10% increments until reaching 100% in the final mixture. In cases where there were fewer than 5,000 single cells of a given cell state, making 100% representation not possible, the preset proportion instead represented the percent of available cells of that cell state rather than the percent of cells in the mixture. Each synthetic mixture had its true proportions recorded and the resulting mixtures were input into CIBERSORTx for deconvolution. Comparisons of the true and inferred proportions were then performed through correlation analysis.
In the second approach, the cell state proportions inferred from bulk RNAseq data were compared to the cell state proportions quantified by scRNAseq for each sample in our internal scRNAseq dataset. Some samples in the scRNAseq dataset were enriched for CD45− cells via FACS and therefore precluded true cell state abundance when considering both neoplastic and non-neoplastic cells. To address this, comparisons were restricted to the relative proportions of each neoplastic cell state. Non-neoplastic cell proportions were removed, and neoplastic cells proportions were then renormalized so that the sum of each neoplastic cell state proportion in each sample added up to 1.
In the third approach, cell state proportions inferred from bulk RNAseq data were compared to the cell state proportions quantified through multiplex immunofluorescence and histo-cytometry analyses performed on whole tissue scans for a subset of samples in the GLASS cohort. To determine the identity of each cell in a tissue scan, expression thresholds were set for each marker based on the marker’s expression distribution across the dataset. For bimodal distributions the threshold was set to the local minima between the two maxima, while for normal distributions the threshold was set to the global maximum. Cells that were negative for all markers were excluded from further analysis. To facilitate comparisons between expression and immunofluorescence-based estimates, analyses were restricted only to the cell states identified in both platforms, and the resulting fractions were renormalized so that the sum of each proportion added up to 1.
Annotation and validation of histological features
Digitized images of H&E slides were obtained for a subset of GLASS samples and stored centrally on the Digital Slide Archive (https://styx.neurology.emory.edu/girder/). In a subset of samples for which FFPE slides were available for multiplex immunofluorescence staining, representative histological features were digitally outlined by a board-certified neuropathologist.
Transcriptomic histological deconvolution was validated by comparing expression-based and neuropathologist-based estimates of feature abundance. To accomplish this, a team of six neuropathologists were instructed to estimate the proportion of the slide area occupied by different histological features for 10 GLASS samples (5 primary-recurrent tumor pairs) where the H&E slide was directly adjacent to the tumor region sent for RNA-sequencing. Neuropathologists were blinded to the type of glioma in each slide and did not have knowledge of the expression-based scores prior to scoring. To standardize feature evaluation across neuropathologists, common definitions for each feature were established. Definitions for features expected to be observed in both primary and recurrent tumors were loosely based on those used by Ivy GAP, while recurrence-specific features were collaboratively defined by the neuropathologist team. During the evaluation process, each evaluator received a template with these feature definitions and was instructed to annotate the entire slide so that the total estimates for each sample summed to 100% (Table S4). Consensus pathology estimates for each slide were then calculated as the mean neuropathologist estimate of a given feature and were used for all downstream analyses. Results for the necrosis feature samples were additionally reproduced using publicly available neuropathologist estimates from TCGA H&E slides (Cooper et al., 2012).
Histological feature adjustment
For analyses examining how histological features influenced subtype switching, a tumor sample’s cell state composition profile was adjusted to remove cell states that could be attributed to a specific histological feature. To do this, the tumor sample’s proportion of a given histological feature was multiplied by the average proportion of each cell state from all samples of that feature in Ivy GAP. These numbers were then subtracted from their respective cell state’s proportion in the tumor sample and the resulting profile was then renormalized so that all proportions summed to 1. In cases where the new cell state proportion was less than 0, the value was set to 0 before renormalization.
Validation of cell state gene expression profiles
Concordance between CIBERSORTx-inferred cell state-specific gene expression profiles and a ground truth set of FACS-purified gene expression profiles was assessed using the ‘groundtruth’ parameter in CIBERSORTx. The ground truth dataset used in this step was generated from a previously released glioma dataset (Klemm et al., 2020) by collapsing all glioma-derived CD45− profiles into an average CD45− profile and all glioma-derived macrophage/microglia profiles into an average myeloid cell profile. This dataset was input into CIBERSORTx using the ‘groundtruth’ parameter during the run applying our internal scRNAseq signature matrix to the GLASS bulk RNAseq dataset. The resulting quality control files output during this run, primarily “SM_GEPs_HeatMap.txt”, were then used to perform correlation analyses assessing the similarity between the inferred neoplastic cell and myeloid profiles and the ground truth profiles.
Cell state gene expression profile analysis
To facilitate downstream analyses on each CIBERSORTx-inferred cell state-specific gene expression profile, each of the resulting expression matrices were log-transformed and all genes that could not be imputed or had a variance of 0 across the dataset were removed. For each cell state-specific gene expression matrix, Wilcoxon signed-rank tests were used to determine the differentially expressed genes between initial and recurrent tumors and the resulting P-values were corrected for multiple testing using the Benjamini-Hochberg procedure. Signature scores in cell state-specific gene expression profiles and single-cell RNAseq profiles were defined as the average expression of the genes in the signature. In cases where the expression of some of the genes in the signature could not be determined, the intersection of the signature and the available genes was taken when calculating the signature score. For GO enrichment analyses on signatures derived from cell state-specific gene expression profiles, the background gene set only included the genes CIBERSORTx was able to impute for the cell state from which the signature was derived.
Quantification and Statistical Analysis
All data analyses were conducted in R v3.6.1 and PostgreSQL 10.6. GO enrichment analyses were performed using the “classic” algorithm in the R package “topGO” v2.38.1. Survival analyses were performed using the R “survival” package. When comparing variables between groups, t-tests were used for cell state proportions while non-parametric tests were used for all other variables (i.e., gene expression, signature score, neoantigen number).
Supplementary Material
Figure S1. Validation of deconvolution results. Related to Figure 1. (A) Scatterplots depicting the association between the true proportion and the CIBERSORTx-inferred proportion for each cell state in gene expression profiles from synthetic mixtures composed of different combinations of single cells. (B) Scatterplots depicting the association between the proportion of each neoplastic cell state determined from single-cell RNAseq and the non-neoplastic cell-adjusted neoplastic cell state proportion inferred from CIBERSORTx applied to each sample’s respective bulk tumor RNAseq profile. (C) Scatterplots depicting the associations between the relative proportions of proliferating stem-like neoplastic cells (SOX2+, Ki67+), stem-like neoplastic cells (SOX2+, OLIG2+, Ki67-), differentiated-like neoplastic cells (SOX2+, OLIG2-, Ki67-, EGFR+ or CD44+), and myeloid cells (CD14+, SOX2-) inferred using multiplex immunofluorescence and the corresponding cell state proportions inferred from expression data using CIBERSORTx. Myeloid cell CIBERSORTx fraction represents the sum of the myeloid, granulocyte, and dendritic cell fractions. In all plots, Pearson correlation coefficients are indicated. (D) The average cell state composition of each bulk transcriptional subtype across initial and recurrent GLASS samples. (E) The average cell state composition of each bulk transcriptional subtype across all TCGA samples. (F) Left: Stacked bar plot indicating the proportion of IDHwt tumors that underwent a gross total resection at each time point. Right: The average proportions of each cell state for tumors that underwent a subtotal resection at initial and a gross total resection at recurrence (Subtotal-gross total) and tumors that underwent a gross total resection at both time points (Gross total-gross total). (G) Left: The average Neftel et al. cell state composition of each bulk transcriptional subtype for all IDHwt GLASS tumors. Right: The average Neftel et. al cell state composition of initial and recurrent IDHwt tumors. (H) The average cell state composition of initial and recurrent IDHmut tumors stratified by 1p/19q co-deletion status. Colors for all panels are indicated at the bottom of the figure. See also Tables S1, S2, and S3.
Figure S2. Relationship between cell state and histological feature composition. Related to Figure 2. (A) Representative H&E and multiplex immunofluorescence images for each Ivy GAP histological feature. Features were identified by a neuropathologist based on the H&E images on the left. The leading edge, infiltrating tumor, and cellular tumor features are from GLSS-LU-0B10 (primary), while the pseudopalisading cells around necrosis and microvascular proliferation features are from GLSS-LU-00B9 (primary). Scale bars represent 50 μm. (B) Bar plot depicting the −log10 P-value from a two-way ANOVA measuring whether the fractions of each cell state in a sample associate with the patient the sample was derived from (red bar) and the feature the sample represents (blue bar). Dashed line corresponds to P = 0.05. (C) Heatmap depicting the Pearson correlation coefficients measuring the association between pathologist and CIBERSORTx estimates of nucleated tumor core- and periphery-related histological features. Evaluations were performed across 5 initial and 5 recurrent samples (D) Scatterplots depicting the association between pathologist estimates of necrosis and CIBERSORTx estimates of the IvyGAP pseudopalisading cells around necrosis feature in the GLASS and TCGA datasets. Shapes indicate initial and recurrence status. (E) Heatmap depicting the Pearson correlation coefficients measuring the association between pathologist estimates of recurrence-specific nucleated histological features and CIBERSORTx estimates of IvyGAP features. Evaluations were performed across 5 recurrent samples. In (C-E), pathologist estimates were based on the relative percent of the H&E slide area occupied by a given feature while CIBERSORTx estimates were based on RNAseq. Abbreviations: leading edge (LE), infiltrating tumor (IT), cellular tumor (CT), pseudopalisading cells around necrosis (PAN), and microvascular proliferation (MVP). (F) Heatmap depicting the changes in each neoplastic cell state between initial and recurrent tumors undergoing the indicated subtype transition. The initial subtype is indicated in the columns and the recurrent subtype is indicated in the rows. Each row of heatmaps reflects a different histological feature adjustment. Colors represent the change in fraction of the indicated features between initial and recurrent tumors, while * indicates a paired t-test P-value < 0.05. (G) Left: Ladder plot depicting the change in the adjusted stem-like cell proportion between paired initial and recurrent tumors undergoing a proneural-to-mesenchymal transition. Right: The average adjusted proportions for neoplastic cells for the tumor pairs outlined on the left. Neoplastic cell proportions were adjusted for the presence of non-neoplastic cells and leading-edge content. See also Table S4.
Figure S3. Cell state changes in samples that have acquired or lost somatic alterations. Related to Figure 3. (A) Left: Ladder plot depicting the change in the proliferating stem-like cell proportion between paired initial and recurrent IDHwt tumors that acquired CDKN2A deletions or CCND2 amplifications. Right: Stacked bar plot depicting the average proportions of each cell state for the tumor pairs in the ladder plots. (B) Ladder plots depicting the difference in microvascular proliferation fraction in IDHwt tumors that acquired hypermutation and IDHmut tumors that acquired a cell cycle alteration or hypermutation at recurrence. (C) Forest plot depicting the results of a multivariable Cox proportional hazards model that included proliferating stem-like cell increase, age, initial grade, and 1p/19q co-deletion status as variables. Points represents the hazard ratio and lines represent the 95% confidence interval. P-values were calculated using the Wald test. (D) Left: Ladder plots depicting the change in granulocyte proportion in IDHwt tumors that acquired mutations in NF1 at recurrence. Right: The average proportions of each cell state for the tumor pairs in the ladder plots. (E) Non-neoplastic cell state differences in IDHwt tumors that lost EGFR or PDGFRA amplifications at recurrence. Panel is split by alteration. Ladder plots depict the change in the non-neoplastic cell state proportion between paired initial and recurrent tumors while stacked bar plots depict the average proportions of each cell state for these tumors. (F) Sankey plot indicating whether the highest scoring transcriptional subtype changed at recurrence for the tumors depicted in (E). Each color reflects the transcriptional subtype in the initial tumors. Numbers in parentheses indicate number of samples. Subtype abbreviations: proneural (Pro.), classical (Class.) and mesenchymal (Mes.). (G) Ladder plots depicting the difference in T cell fraction in tumors that underwent hypermutation at recurrence. In all figures, P-values were calculated using a paired t-test unless otherwise noted.
Figure S4. Validation and analysis of cell state-specific gene expression profiles. Related to Figure 4. (A) Schema for single-cell RNAseq-based deconvolution of cell state-specific gene expression profiles using the pan-glioma single-cell RNAseq dataset (Johnson et al., 2021). (B) Heatmap depicting the relationship between the CIBERSORTx-inferred gene expression profiles and gene expression profiles from analogous cell types from a FACS-purified ground truth dataset (Klemm et al., 2020). In the CD45neg column in the Klemm et al. heatmap, which represents a composite gene expression profile from the non-immune cells purified from a collection of glioma tumors, gene expression patterns from all three neoplastic cell states can be observed. (C) Heatmap depicting the correlation coefficients between each CIBERSORTx-inferred cell state-specific gene expression profile and the gene expression profiles from the FACS-purified ground truth dataset. (D) Boxplot depicting the average signature expression in single cells of the indicated neoplastic cell states from unmatched initial and recurrent IDHwt tumors. (E) Bar plot depicting the −log10(FDR) from a GO enrichment analysis of the genes significantly up-regulated at recurrence in the differentiated-like and proliferating stem-like neoplastic cell-specific gene expression profiles from IDHwt tumors. The top 5 GO terms for each cell state are included. Dashed line corresponds to FDR < 0.05. (F) H&E image used to define the histological features used for multiplex immunofluorescence staining in Figure S4E. Neuropathologist annotations of cellular tumor and infiltrating tumor features are highlighted in the indicated colors. Scale bar represents 500 μm. (G) Bar plot depicting the −log10(FDR) from a GO enrichment analysis of the genes significantly up-regulated at recurrence in the differentiated-like neoplastic cell-specific gene expression profiles from IDHmut tumors. Dashed line corresponds to FDR < 0.1. (H) Boxplot depicting the average signature expression in neoplastic cell state-specific gene expression profiles for each IDHmut tumor pair in GLASS. Comparisons are stratified based on whether the tumor pair was grade stable or exhibited a grade increase at recurrence. (I) Boxplot depicting the average signature expression in single cells of the indicated neoplastic cell states from grade 2 and grade 3. In (D) and (I), single-cells were derived from the joint single-cell and bulk RNAseq dataset (Johnson et al., 2021). Across all panels, **** indicates Wilcoxon rank-sum test P-value < 1e-5, *** indicates Wilcoxon signed rank test P-value < 1e-3 and * indicates P < 0.05. See also Table S5.
Figure S5. Characterization of the mesenchymal myeloid signature. Related to Figure 5. (A) Kaplan-Meier plot depicting the surgical interval distributions of patients with tumors that were and were not mesenchymal at recurrence. P-value was calculated using the log-rank test. (B) Forest plot depicting the results of a multivariable Cox proportional hazards model that included recurrent tumor subtype, age, and initial grade as variables. Points represents the hazard ratio and lines represent the 95% confidence interval. P-values were calculated using the Wald test. (C) Box and ladder plots depicting the difference in the median-normalized mean expression of the Neftel et al. MES-like signature between initial and recurrent IDHwt tumors from GLASS undergoing a mesenchymal transition. Point colors indicate transcriptional subtype. P-values were calculated using the Wilcoxon signed-rank test. (D) Boxplots depicting the average macrophage and microglia gene expression signatures in CIBERSORTx-inferred myeloid-specific gene expression profiles from TCGA. Samples are stratified by IDH and 1p/19q co-deletion status (left) and bulk transcriptional subtype (right). **** indicates Wilcoxon rank-sum test P-value < 1e-5. (E) Left: Principal component analysis plot of the CIBERSORTx-inferred myeloid profiles from TCGA and GTEx. Colors indicate bulk transcriptional subtype; shapes indicate tissue subtype. Right: Density plot depicting the distribution of principal component 1 (PC1) among each transcriptional subtype. (F) Bar plots depicting the Spearman correlation coefficients measuring the association between the myeloid-specific expression scores for the macrophage and microglia signatures versus the presence of the four Ivy GAP histological features in TCGA. The features measured were leading edge (LE), cellular tumor (CT), pseudopalisading cells around necrosis (CTpan), and microvascular proliferation (CTmvp). (G) Heatmaps depicting the average normalized log10 expression level of genes that were differentially expressed between myeloid cell states from initial and recurrent IDHwt and IDHmut tumors in GLASS that did not undergo a subtype switch. Fractions indicate the number of differentially expressed genes out of the number of genes inferred for that cell state’s profile. (H) Upset plot depicting the intersection of significantly up-regulated genes in the myeloid-specific gene expression profiles from each transcriptional subtype relative to normal brain cortex. Intersections between signatures are shown in the combination matrix. Number of genes uniquely found in each set are indicated above each bar. (I) Bar plot depicting the −log10(FDR) from a GO enrichment analysis for the genes in the mesenchymal myeloid signature. (J) Scatterplot depicting the association between the mean mesenchymal myeloid signature expression in single myeloid cells and the mesenchymal subtype score calculated from bulk RNAseq for each patient. (K) Bar plots depicting the Spearman correlation coefficients measuring the association between the myeloid-specific expression scores for the mesenchymal myeloid signature versus the presence of the four Ivy GAP histological features in TCGA, as in (F). See also Tables S6 and S7.
Figure S6. Analysis of neoantigen-mediated T cell selection in glioma. Related to Figure 6. (A) Scatterplots depicting the association between the T cell proportion and the neoantigen depletion rate in initial and recurrent GLASS samples. (B) Box and ladder plots depicting the difference in the number of neoantigens binding to the kept and lost allele. Points are colored based on whether the sample was an initial or recurrent tumor. P-values were calculated using the Wilcoxon signed-rank test. (C) Violin plots depicting the distribution of the somatic copy number alteration burden in initial and recurrent IDHwt GLASS samples that did and did not exhibit HLA LOH. P-values were calculated using the Wilcoxon rank-sum test.
Table S1. Sequencing centers and hospitals with corresponding GLASS barcode designations for newly added GLASS data. Related to Figure 1.
Table S2. Clinical characteristics of GLASS RNAseq cohort arranged by glioma molecular subtype and timepoint. Related to Figure 1.
Table S3. CIBERSORTx single-cell signature matrix. Related to Figure 1.
Table S4. Histological feature pathology definitions and pathologist annotations. Related to Figure 2.
Table S5. Cell state-specific post-treatment gene signatures. Related to Figure 4.
Table S6. Transcriptional subtype-specific myeloid gene signatures. Related to Figure 5.
Table S7. Mesenchymal myeloid gene signature. Related to Figure 5.
Table S8. Candidate ligand-receptor interactions associated with mesenchymal transition. Related to Figure 5.
Key Resource Table
| REAGENT or RESOURCE | SOURCE | IDENTIFIER |
|---|---|---|
| Antibodies | ||
| BV421 anti KI67 | BD Biosciences | RRID:AB_2686897 |
| AF488 anti SOX2 | Thermo Fisher Scientific | RRID:AB_2574479 |
| AF555 anti EGFR | Cell Signaling Technology | Cat #5108S |
| Rabbit anti CD14 | Abcam | RRID:AB_2889158 |
| AF647 anti Olig2 | Abcam | Cat# ab225100 |
| AF700 anti CD44 | Novus Biologicals | Cat# NBP1-41266AF700 |
| AF568 Goat anti Rabbit Highly cross absorbed secondary antibody | Thermo Fisher Scientific | RRID:AB_10563566 |
| AF594 anti SNAP25 | Novus Biologicals | Cat# NBP2-74245AF594 |
| AF700 anti NeuN | Novus Biologicals | Cat# NBP1-92693AF700 |
| AF647 anti alpha SMA | Novus Biologicals | Cat# NBP2-34522AF647 |
| JF549 anti Oncostatin M | Novus Biologicals | Cat# NB120-10842JF549 |
| Biological samples | ||
| Glioma tissue and matched normal blood | Henry Ford Health System | N/A |
| Glioma tissue and matched normal blood | Seoul National University | N/A |
| Chemicals | ||
| Histo-Clear | National Diagnostics | Cat#HS-202 |
| Antigen Retrieval Buffer (Citrate, pH6) | Abcam | Cat#ab93678 |
| Fc Receptor Blocker | Innovex | Cat#NB309 |
| Background Buster | Innovex | Cat#NB306 |
| Fluoromount G | SouthernBiotech | Cat#0100-01 |
| Cover Glass | Thermo Scientific | Cat#152450 |
| Slides | Denville Scientific | Cat#M1021 |
| Saponin | Sigma | Cat#S7900-100G |
| Triton X-100 | Sigma | Cat#T8787 |
| Bovin serum albumin IgG free | Jackson Immuno Research | RRID:AB_2336946 |
| Normal rabbit serum | Jackson Immuno Research | RRID:AB_2337123 |
| Sytox blue | Thermo Fisher | Cat#S11348 |
| DAPI | Thermo Fisher | Cat#D1306 |
| Critical commercial assays | ||
| AllPrep DNA/RNA Mini Kit | Qiagen | Cat#80204 |
| SureSelectXT Low-Input Reagent Kit | Agilent | Cat#5191-4080 |
| SureSelectXT Human All Exon V6 +COSMIC | Agilent | Cat#5190-9307 |
| QIAamp DNA Mini Kit | Qiagen | Cat#51104 |
| KAPA Hyper Prep Kit (Illumina) | Roche | Cat#7962363001 |
| KAPA mRNA Hyperprep Kit | Roche | Cat#8098123702 |
| Tempus xO Assay | Tempus | N/A |
| KAPA stranded mRNAseq Kit | Roche | Cat#7962207001 |
| NuGEN Ovation RNAseq System | Tecan | Cat#7102-A01 |
| Deposited data | ||
| Processed DNA somatic alteration data | This paper | https://www.synapse.org/glass |
| RNAseq pseudocount and TPM data | This paper | https://www.synapse.org/glass |
| Digitized H&E images | This paper | https://styx.neurology.emory.edu/girder/#collection/625dda70622f966e826a0446 |
| Custom pipeline and analysis code | This paper | https://github.com/fsvarn/GLASSx/ |
| Longitudinal glioma RNAseq fastq files | European Genome Phenome Archive | EGAS00001001041 |
| Longitudinal glioma RNAseq fastq files | European Genome Phenome Archive | EGAS00001001880 |
| Longitudinal glioma RNAseq bam files | European Genome Phenome Archive | EGAS00001001033 |
| Longitudinal glioma RNAseq bam files | European Genome Phenome Archive | EGAS00001001255 |
| Longitudinal glioma RNAseq fastq files | European Genome Phenome Archive | EGAS00001003790 |
| Longitudinal glioma RNAseq fastq files | Sequencing Read Archive | BioProject#PRJNA320312 |
| Longitudinal glioma whole exome and RNAseq fastq files | Sequencing Read Archive | BioProject# PRJNA482620 |
| Longitudinal TCGA GBM LGG RNAseq fastq files | Genomic Data Commons | https://portal.gdc.cancer.gov/ |
| TOIL TCGA TARGET GTEx RNAseq TPM data | University of California Santa Cruz Xenabrowser | https://xenabrowser.net/datapages/ |
| Ivy Glioblastoma Atlas Project RNAseq FPKM data | Ivy GAP | https://glioblastoma.alleninstitute.org/static/download.html |
| Processed glioblastoma single-cell data | Broad Single Cell Portal | Study: Single cell RNA-seq of adult and pediatric glioblastoma |
| Multi-sector single-cell glioma RNAseq count data | Gene Expression Omnibus | GSE117891 |
| RNAseq count data from FACS-sorted glioma cell populations | BrainTIME Portal | https://joycelab.shinyapps.io/braintime/ |
| b37 reference genome (human_g1k_v37_decoy) | GATK Resource Bundle | https://gatk.broadinstitute.org/hc/en-us/articles/360035890811Resource-bundle |
| Pan-glioma single-cell RNAseq data | Synapse | https://www.synapse.org/#!Synapse:syn26375549 |
| Software and algorithms | ||
| bedtools | Quinlan and Hall, 2010 | https://bedtools.readthedocs.io/en/latest/ |
| Seuratv3.2.3 | Stuart et al., 2019 | https://satijalab.org/seurat/ |
| BWA MEM 0.7.17 | Li and Durbin, 2009 | http://bio-bwa.sourceforge.net/ |
| GATK 4.0.10.1 | McKenna et al., 2010 | https://gatk.broadinstitute.org/hc/en-us |
| TITAN | Ha et al., 2014 | https://github.com/gavinha/TitanCNA |
| OptiType v1.3.2 | Szolek et al., 2014 | https://github.com/FRED-2/OptiType |
| pVACseq v4.0.10 | Hundal et al., 2016 | https://pvac-seq.readthedocs.io/en/latest/ |
| LOHHLA | McGranahan et al., 2017 | https://bitbucket.org/mcgranahanlab/lohhla/ |
| STARv2.7.5 | Dobin et al., 2013 | https://github.com/alexdobin/STAR |
| fastp v0.20.0 | Chen et al., 2018 | https://github.com/OpenGene/fastp |
| kallisto v0.46.0 | Bray et al., 2016 | https://pachterlab.github.io/kallisto/ |
| ssgsea.GBM.classificati on | Wang et al., 2017 | N/A |
| CIBERSORTx webserver | Newman et al., 2019 | https://cibersortx.stanford.edu/ |
| CIBERSORTx docker | Newman et al., 2019 | https://hub.docker.com/r/cibersortx/hires |
| Imaris 9.0.2 and 9.4 | Bitplane | http://www.bitplane.com/imaris/imaris |
| Flowjo v10 | Flowjo LLC | https://www.flowjo.com/solutions/flowjo |
| R v3.6.1 | The R Project for Statistical Computing | https://www.r-project.org/ |
| topGO v2.38.1 | Bioconductor | https://bioconductor.org/packages/release/bioc/html/topGO.html |
Highlights.
Longitudinal glioma evolution follows an IDH mutation-dependent trajectory
Hypermutation and CDKN2A deletions underlie increased proliferation at recurrence
Recurrent IDH-wild-type neoplastic cells upregulate neuronal signaling programs
Mesenchymal transitions associate with distinct myeloid cell interactions
Acknowledgements
We thank the patients and their families for their generous donation to biomedical research. We gratefully acknowledge the Genome Technology, Single-Cell Biology, and Microscopy services at The Jackson Laboratory for expert assistance, and Z. Reifsnyder (Jackson Laboratory) for graphic design. We thank R. Puchalski for his helpful suggestions when designing the histopathology validation studies. This work is supported by National Institutes of Health grants, R01CA237208, R21NS114873, R21CA256575, U2CCA252979 (RGWV), P30CA034196 (RGWV, KP), R01CA222146 (HN, LMP, ID), P30CA016672, P50CA127001 (JTH), P30CA13148 (EGVM), U01CA242871, R01NS042645, U24CA189523 (SB); The University of Texas MD Anderson Cancer Center Glioblastoma Moon Shots Program™ (JTH, DRO); São Paulo Research Foundation grants 2018/00583-0, 2019/14928-1 (TMM); NCI-FCRDC contract 28XS100 (EGVM); the Leeds Hospitals Charity grant 9R11/14-11 and UKRI Fellowship MR/T020504/1 (LFS); Dutch Cancer Society project 11026 (PW); European Union’s Horizon 2020 GLIOTRAIN initiative (#766069) (ATB, KW); the Department of Defense grants CA170278 (HN, TSS), W81XWH1910246 (RGWV). This work was also supported by generous gifts from the Dabbiere family (RGWV). Tissue banking within Brain Tumour Northwest is supported by the Sydney Driscoll Neuroscience Foundation, and within Leeds by Yorkshire’s Brain Tumour Charity and OSCAR’s Pediatric Brain Tumour Charity. FPB was supported by the JAX Scholar program and the National Cancer Institute (K99CA226387). KCJ was the recipient of an American Cancer Society Fellowship (130984-PF-17-141-01-DMC). FSV is supported by the JAX Scholar Program and a postdoctoral fellowship from The Jane Coffin Childs Memorial Fund for Medical Research.
Declaration of Interests
RGWV is a co-founder of Boundless Bio and a consultant for Stellanova Therapeutics. MK has received research funding from AbbVie and Bristol Myers Squibb, is on the advisory board for Janssen, and has received honoraria from The Jackson Laboratory. DRO has received funding from Integra and Agios. FPB has performed consulting for Bristol Myers Squibb. MW has received research grants from Abbvie, Adastra, Apogenix, Merck, Sharp & Dohme, Merck, Novocure and Quercis, and honoraria for lectures or advisory board participation or consulting from Abbvie, Adastra, Basilea, Bristol Meyer Squibb, Celgene, Medac, Merck, Sharp & Dohme, Merck, Nerviano Medical Sciences, Novartis, Orbus, Philogen, Roche, Tocagen and yMabs. AMEW reported receiving institutional financial support for an advisory role from Polyphor, IPSEN, Karyopharm, and Novartis; unrestricted research grants from IPSEN and Novartis; and study budgets from Abbvie, BMS, Genzyme, Karyopharm Therapeutics, and Roche, all outside the submitted work. HKG has performed consulting for AbbVie and is a member of the speaker bureau for AbbVie and Igynta. KP is a scientific advisory board member and owns stock in Cue Biopharma.
Footnotes
Publisher's Disclaimer: This is a PDF file of an unedited manuscript that has been accepted for publication. As a service to our customers we are providing this early version of the manuscript. The manuscript will undergo copyediting, typesetting, and review of the resulting proof before it is published in its final form. Please note that during the production process errors may be discovered which could affect the content, and all legal disclaimers that apply to the journal pertain.
The full list of GLASS Consortium authors can be found following the lead contact information; the full author list and their affiliations are available in a supplemental file
References
- Bakas S, Ormond DR, Alfaro-Munoz KD, Smits M, Cooper LAD, Verhaak R, and Poisson LM (2020). iGLASS: imaging integration into the Glioma Longitudinal Analysis Consortium. Neuro Oncol 22, 1545–1546. [DOI] [PMC free article] [PubMed] [Google Scholar]
- Barthel FP, Johnson KC, Varn FS, Moskalik AD, Tanner G, Kocakavuk E, Anderson KJ, Abiola O, Aldape K, Alfaro KD, et al. (2019). Longitudinal molecular trajectories of diffuse glioma in adults. Nature 576, 112–120. [DOI] [PMC free article] [PubMed] [Google Scholar]
- Bhaduri A, Di Lullo E, Jung D, Muller S, Crouch EE, Espinosa CS, Ozawa T, Alvarado B, Spatazza J, Cadwell CR, et al. (2020). Outer Radial Glia-like Cancer Stem Cells Contribute to Heterogeneity of Glioblastoma. Cell Stem Cell 26, 48–63 e46. [DOI] [PMC free article] [PubMed] [Google Scholar]
- Bhat KPL, Balasubramaniyan V, Vaillant B, Ezhilarasan R, Hummelink K, Hollingsworth F, Wani K, Heathcock L, James JD, Goodman LD, et al. (2013). Mesenchymal differentiation mediated by NF-kappaB promotes radiation resistance in glioblastoma. Cancer Cell 24, 331–346. [DOI] [PMC free article] [PubMed] [Google Scholar]
- Bray NL, Pimentel H, Melsted P, and Pachter L (2016). Near-optimal probabilistic RNA-seq quantification. Nat Biotechnol 34, 525–527. [DOI] [PubMed] [Google Scholar]
- Brennan CW, Verhaak RG, McKenna A, Campos B, Noushmehr H, Salama SR, Zheng S, Chakravarty D, Sanborn JZ, Berman SH, et al. (2013). The somatic genomic landscape of glioblastoma. Cell 155, 462–477. [DOI] [PMC free article] [PubMed] [Google Scholar]
- Cancer Genome Atlas Research, N., Brat DJ, Verhaak RG, Aldape KD, Yung WK, Salama SR, Cooper LA, Rheinbay E, Miller CR, Vitucci M, et al. (2015). Comprehensive, Integrative Genomic Analysis of Diffuse Lower-Grade Gliomas. N Engl J Med 372, 2481–2498. [DOI] [PMC free article] [PubMed] [Google Scholar]
- Castellan M, Guarnieri A, Fujimura A, Zanconato F, Battilana G, Panciera T, Sladitschek HL, Contessotto P, Citron A, Grilli A, et al. (2021). Single-cell analyses reveal YAP/TAZ as regulators of stemness and cell plasticity in Glioblastoma. Nat Cancer 2, 174–188. [DOI] [PMC free article] [PubMed] [Google Scholar]
- Ceccarelli M, Barthel FP, Malta TM, Sabedot TS, Salama SR, Murray BA, Morozova O, Newton Y, Radenbaugh A, Pagnotta SM, et al. (2016). Molecular Profiling Reveals Biologically Discrete Subsets and Pathways of Progression in Diffuse Glioma. Cell 164, 550–563. [DOI] [PMC free article] [PubMed] [Google Scholar]
- Chen AX, Gartrell RD, Zhao J, Upadhyayula PS, Zhao W, Yuan J, Minns HE, Dovas A, Bruce JN, Lasorella A, et al. (2021). Single-cell characterization of macrophages in glioblastoma reveals MARCO as a mesenchymal pro-tumor marker. Genome Med 13, 88. [DOI] [PMC free article] [PubMed] [Google Scholar]
- Chen S, Zhou Y, Chen Y, and Gu J (2018). fastp: an ultra-fast all-in-one FASTQ preprocessor. Bioinformatics 34, i884–i890. [DOI] [PMC free article] [PubMed] [Google Scholar]
- Cloughesy TF, Mochizuki AY, Orpilla JR, Hugo W, Lee AH, Davidson TB, Wang AC, Ellingson BM, Rytlewski JA, Sanders CM, et al. (2019). Neoadjuvant anti-PD-1 immunotherapy promotes a survival benefit with intratumoral and systemic immune responses in recurrent glioblastoma. Nat Med 25, 477–486. [DOI] [PMC free article] [PubMed] [Google Scholar]
- Consortium G (2018). Glioma through the looking GLASS: molecular evolution of diffuse gliomas and the Glioma Longitudinal Analysis Consortium. Neuro Oncol 20, 873–884. [DOI] [PMC free article] [PubMed] [Google Scholar]
- Cooper LA, Gutman DA, Chisolm C, Appin C, Kong J, Rong Y, Kurc T, Van Meir EG, Saltz JH, Moreno CS, et al. (2012). The tumor microenvironment strongly impacts master transcriptional regulators and gene expression class of glioblastoma. Am J Pathol 180, 2108–2119. [DOI] [PMC free article] [PubMed] [Google Scholar]
- Couturier CP, Ayyadhury S, Le PU, Nadaf J, Monlong J, Riva G, Allache R, Baig S, Yan X, Bourgey M, et al. (2020). Single-cell RNA-seq reveals that glioblastoma recapitulates a normal neurodevelopmental hierarchy. Nat Commun 11, 3406. [DOI] [PMC free article] [PubMed] [Google Scholar]
- Dobin A, Davis CA, Schlesinger F, Drenkow J, Zaleski C, Jha S, Batut P, Chaisson M, and Gingeras TR (2013). STAR: ultrafast universal RNA-seq aligner. Bioinformatics 29, 15–21. [DOI] [PMC free article] [PubMed] [Google Scholar]
- Droop A, Bruns A, Tanner G, Rippaus N, Morton R, Harrison S, King H, Ashton K, Syed K, Jenkinson MD, et al. (2018). How to analyse the spatiotemporal tumour samples needed to investigate cancer evolution: A case study using paired primary and recurrent glioblastoma. Int J Cancer 142, 1620–1626. [DOI] [PubMed] [Google Scholar]
- Gangoso E, Southgate B, Bradley L, Rus S, Galvez-Cancino F, McGivern N, Guc E, Kapourani CA, Byron A, Ferguson KM, et al. (2021). Glioblastomas acquire myeloid-affiliated transcriptional programs via epigenetic immunoediting to elicit immune evasion. Cell. [DOI] [PMC free article] [PubMed] [Google Scholar]
- Garofano L, Migliozzi S, Oh YT, D’Angelo F, Najac RD, Ko A, Frangaj B, Caruso FP, Yu K, Yuan J, et al. (2021). Pathway-based classification of glioblastoma uncovers a mitochondrial subtype with therapeutic vulnerabilities. Nat Cancer 2, 141–156. [DOI] [PMC free article] [PubMed] [Google Scholar]
- Gerner MY, Kastenmuller W, Ifrim I, Kabat J, and Germain RN (2012). Histo-cytometry: a method for highly multiplex quantitative tissue imaging analysis applied to dendritic cell subset microanatomy in lymph nodes. Immunity 37, 364–376. [DOI] [PMC free article] [PubMed] [Google Scholar]
- Gill BJ, Pisapia DJ, Malone HR, Goldstein H, Lei L, Sonabend A, Yun J, Samanamud J, Sims JS, Banu M, et al. (2014). MRI-localized biopsies reveal subtype-specific differences in molecular and cellular composition at the margins of glioblastoma. Proc Natl Acad Sci U S A 111, 12550–12555. [DOI] [PMC free article] [PubMed] [Google Scholar]
- Goldman MJ, Craft B, Hastie M, Repecka K, McDade F, Kamath A, Banerjee A, Luo Y, Rogers D, Brooks AN, et al. (2020). Visualizing and interpreting cancer genomics data via the Xena platform. Nat Biotechnol 38, 675–678. [DOI] [PMC free article] [PubMed] [Google Scholar]
- Grasso CS, Giannakis M, Wells DK, Hamada T, Mu XJ, Quist M, Nowak JA, Nishihara R, Qian ZR, Inamura K, et al. (2018). Genetic Mechanisms of Immune Evasion in Colorectal Cancer. Cancer Discov 8, 730–749. [DOI] [PMC free article] [PubMed] [Google Scholar]
- Ha G, Roth A, Khattra J, Ho J, Yap D, Prentice LM, Melnyk N, McPherson A, Bashashati A, Laks E, et al. (2014). TITAN: inference of copy number architectures in clonal cell populations from tumor whole-genome sequence data. Genome Res 24, 1881–1893. [DOI] [PMC free article] [PubMed] [Google Scholar]
- Hara T, Chanoch-Myers R, Mathewson ND, Myskiw C, Atta L, Bussema L, Eichhorn SW, Greenwald AC, Kinker GS, Rodman C, et al. (2021). Interactions between cancer cells and immune cells drive transitions to mesenchymal-like states in glioblastoma. Cancer Cell 39, 779–792 e711. [DOI] [PMC free article] [PubMed] [Google Scholar]
- Hundal J, Carreno BM, Petti AA, Linette GP, Griffith OL, Mardis ER, and Griffith M (2016). pVAC-Seq: A genome-guided in silico approach to identifying tumor neoantigens. Genome Med 8, 11. [DOI] [PMC free article] [PubMed] [Google Scholar]
- Johnson KC, Anderson KJ, Courtois ET, Gujar AD, Barthel FP, Varn FS, Luo D, Seignon M, Yi E, Kim H, et al. (2021). Single-cell multimodal glioma analyses identify epigenetic regulators of cellular plasticity and environmental stress response. Nat Genet 53, 1456–1468. [DOI] [PMC free article] [PubMed] [Google Scholar]
- Junk DJ, Bryson BL, Smigiel JM, Parameswaran N, Bartel CA, and Jackson MW (2017). Oncostatin M promotes cancer cell plasticity through cooperative STAT3-SMAD3 signaling. Oncogene 36, 4001–4013. [DOI] [PMC free article] [PubMed] [Google Scholar]
- Kane JR, Zhao J, Tsujiuchi T, Laffleur B, Arrieta VA, Mahajan A, Rao G, Mela A, Dmello C, Chen L, et al. (2020). CD8(+) T-cell-Mediated Immunoediting Influences Genomic Evolution and Immune Evasion in Murine Gliomas. Clin Cancer Res 26, 4390–4401. [DOI] [PMC free article] [PubMed] [Google Scholar]
- Kim H, Zheng S, Amini SS, Virk SM, Mikkelsen T, Brat DJ, Grimsby J, Sougnez C, Muller F, Hu J, et al. (2015a). Whole-genome and multisector exome sequencing of primary and post-treatment glioblastoma reveals patterns of tumor evolution. Genome Res 25, 316–327. [DOI] [PMC free article] [PubMed] [Google Scholar]
- Kim J, Lee IH, Cho HJ, Park CK, Jung YS, Kim Y, Nam SH, Kim BS, Johnson MD, Kong DS, et al. (2015b). Spatiotemporal Evolution of the Primary Glioblastoma Genome. Cancer Cell 28, 318–328. [DOI] [PubMed] [Google Scholar]
- Kim Y, Varn FS, Park SH, Yoon BW, Park HR, Lee C, Verhaak RGW, and Paek SH (2021). Perspective of mesenchymal transformation in glioblastoma. Acta Neuropathol Commun 9, 50. [DOI] [PMC free article] [PubMed] [Google Scholar]
- Klemm F, Maas RR, Bowman RL, Kornete M, Soukup K, Nassiri S, Brouland JP, Iacobuzio-Donahue CA, Brennan C, Tabar V, et al. (2020). Interrogation of the Microenvironmental Landscape in Brain Tumors Reveals Disease-Specific Alterations of Immune Cells. Cell 181, 1643–1660 e1617. [DOI] [PMC free article] [PubMed] [Google Scholar]
- Kocakavuk E, Anderson KJ, Varn FS, Johnson KC, Amin SB, Sulman EP, Lolkema MP, Barthel FP, and Verhaak RGW (2021). Radiotherapy is associated with a deletion signature that contributes to poor outcomes in patients with cancer. Nat Genet 53, 1088–1096. [DOI] [PMC free article] [PubMed] [Google Scholar]
- Korber V, Yang J, Barah P, Wu Y, Stichel D, Gu Z, Fletcher MNC, Jones D, Hentschel B, Lamszus K, et al. (2019). Evolutionary Trajectories of IDH(WT) Glioblastomas Reveal a Common Path of Early Tumorigenesis Instigated Years ahead of Initial Diagnosis. Cancer Cell 35, 692–704 e612. [DOI] [PubMed] [Google Scholar]
- Kristensen BW, Priesterbach-Ackley LP, Petersen JK, and Wesseling P (2019). Molecular pathology of tumors of the central nervous system. Ann Oncol 30, 1265–1278. [DOI] [PMC free article] [PubMed] [Google Scholar]
- Li H, and Durbin R (2009). Fast and accurate short read alignment with Burrows-Wheeler transform. Bioinformatics 25, 1754–1760. [DOI] [PMC free article] [PubMed] [Google Scholar]
- Louis DN, Perry A, Reifenberger G, von Deimling A, Figarella-Branger D, Cavenee WK, Ohgaki H, Wiestler OD, Kleihues P, and Ellison DW (2016). The 2016 World Health Organization Classification of Tumors of the Central Nervous System: a summary. Acta Neuropathol 131, 803–820. [DOI] [PubMed] [Google Scholar]
- Mazor T, Pankov A, Johnson BE, Hong C, Hamilton EG, Bell RJA, Smirnov IV, Reis GF, Phillips JJ, Barnes MJ, et al. (2015). DNA Methylation and Somatic Mutations Converge on the Cell Cycle and Define Similar Evolutionary Histories in Brain Tumors. Cancer Cell 28, 307–317. [DOI] [PMC free article] [PubMed] [Google Scholar]
- McGranahan N, Rosenthal R, Hiley CT, Rowan AJ, Watkins TBK, Wilson GA, Birkbak NJ, Veeriah S, Van Loo P, Herrero J, et al. (2017). Allele-Specific HLA Loss and Immune Escape in Lung Cancer Evolution. Cell 171, 1259–1271 e1211. [DOI] [PMC free article] [PubMed] [Google Scholar]
- McKenna A, Hanna M, Banks E, Sivachenko A, Cibulskis K, Kernytsky A, Garimella K, Altshuler D, Gabriel S, Daly M, et al. (2010). The Genome Analysis Toolkit: a MapReduce framework for analyzing next-generation DNA sequencing data. Genome Res 20, 1297–1303. [DOI] [PMC free article] [PubMed] [Google Scholar]
- Muller S, Kohanbash G, Liu SJ, Alvarado B, Carrera D, Bhaduri A, Watchmaker PB, Yagnik G, Di Lullo E, Malatesta M, et al. (2017). Single-cell profiling of human gliomas reveals macrophage ontogeny as a basis for regional differences in macrophage activation in the tumor microenvironment. Genome Biol 18, 234. [DOI] [PMC free article] [PubMed] [Google Scholar]
- Neftel C, Laffy J, Filbin MG, Hara T, Shore ME, Rahme GJ, Richman AR, Silverbush D, Shaw ML, Hebert CM, et al. (2019). An Integrative Model of Cellular States, Plasticity, and Genetics for Glioblastoma. Cell 178, 835–849 e821. [DOI] [PMC free article] [PubMed] [Google Scholar]
- Newman AM, Steen CB, Liu CL, Gentles AJ, Chaudhuri AA, Scherer F, Khodadoust MS, Esfahani MS, Luca BA, Steiner D, et al. (2019). Determining cell type abundance and expression from bulk tissues with digital cytometry. Nat Biotechnol 37, 773–782. [DOI] [PMC free article] [PubMed] [Google Scholar]
- Ochocka N, Segit P, Walentynowicz KA, Wojnicki K, Cyranowski S, Swatler J, Mieczkowski J, and Kaminska B (2021). Single-cell RNA sequencing reveals functional heterogeneity of glioma-associated brain macrophages. Nat Commun 12, 1151. [DOI] [PMC free article] [PubMed] [Google Scholar]
- Polanski K, Young MD, Miao Z, Meyer KB, Teichmann SA, and Park JE (2020). BBKNN: fast batch alignment of single cell transcriptomes. Bioinformatics 36, 964–965. [DOI] [PMC free article] [PubMed] [Google Scholar]
- Pombo Antunes AR, Scheyltjens I, Lodi F, Messiaen J, Antoranz A, Duerinck J, Kancheva D, Martens L, De Vlaminck K, Van Hove H, et al. (2021). Single-cell profiling of myeloid cells in glioblastoma across species and disease stage reveals macrophage competition and specialization. Nat Neurosci 24, 595–610. [DOI] [PubMed] [Google Scholar]
- Puchalski RB, Shah N, Miller J, Dalley R, Nomura SR, Yoon JG, Smith KA, Lankerovich M, Bertagnolli D, Bickley K, et al. (2018). An anatomic transcriptional atlas of human glioblastoma. Science 360, 660–663. [DOI] [PMC free article] [PubMed] [Google Scholar]
- Quinlan AR, and Hall IM (2010). BEDTools: a flexible suite of utilities for comparing genomic features. Bioinformatics 26, 841–842. [DOI] [PMC free article] [PubMed] [Google Scholar]
- Ramilowski JA, Goldberg T, Harshbarger J, Kloppmann E, Lizio M, Satagopam VP, Itoh M, Kawaji H, Carninci P, Rost B, et al. (2015). A draft network of ligand-receptor-mediated multicellular signalling in human. Nat Commun 6, 7866. [DOI] [PMC free article] [PubMed] [Google Scholar]
- Richards LM, Whitley OKN, MacLeod G, Cavalli FMG, Coutinho FJ, Jaramillo JE, Svergun N, Riverin M, Croucher DC, Kushida M, et al. (2021). Gradient of Developmental and Injury Response transcriptional states defines functional vulnerabilities underpinning glioblastoma heterogeneity. Nature Cancer 2, 157–173. [DOI] [PubMed] [Google Scholar]
- Rooney MS, Shukla SA, Wu CJ, Getz G, and Hacohen N (2015). Molecular and genetic properties of tumors associated with local immune cytolytic activity. Cell 160, 48–61. [DOI] [PMC free article] [PubMed] [Google Scholar]
- Rosenthal R, Cadieux EL, Salgado R, Bakir MA, Moore DA, Hiley CT, Lund T, Tanic M, Reading JL, Joshi K, et al. (2019). Neoantigen-directed immune escape in lung cancer evolution. Nature 567, 479–485. [DOI] [PMC free article] [PubMed] [Google Scholar]
- Sa JK, Chang N, Lee HW, Cho HJ, Ceccarelli M, Cerulo L, Yin J, Kim SS, Caruso FP, Lee M, et al. (2020). Transcriptional regulatory networks of tumor-associated macrophages that drive malignancy in mesenchymal glioblastoma. Genome Biol 21, 216. [DOI] [PMC free article] [PubMed] [Google Scholar]
- Steen CB, Liu CL, Alizadeh AA, and Newman AM (2020). Profiling Cell Type Abundance and Expression in Bulk Tissues with CIBERSORTx. In Stem Cell Transcriptional Networks: Methods and Protocols, Kidder BL, ed. (New York, NY: Springer US; ), pp. 135–157. [DOI] [PMC free article] [PubMed] [Google Scholar]
- Stuart T, Butler A, Hoffman P, Hafemeister C, Papalexi E, Mauck WM 3rd, Hao Y, Stoeckius M, Smibert P, and Satija R (2019). Comprehensive Integration of Single-Cell Data. Cell 177, 1888–1902 e1821. [DOI] [PMC free article] [PubMed] [Google Scholar]
- Szolek A, Schubert B, Mohr C, Sturm M, Feldhahn M, and Kohlbacher O (2014). OptiType: precision HLA typing from next-generation sequencing data. Bioinformatics 30, 3310–3316. [DOI] [PMC free article] [PubMed] [Google Scholar]
- Tirosh I, Venteicher AS, Hebert C, Escalante LE, Patel AP, Yizhak K, Fisher JM, Rodman C, Mount C, Filbin MG, et al. (2016). Single-cell RNA-seq supports a developmental hierarchy in human oligodendroglioma. Nature 539, 309–313. [DOI] [PMC free article] [PubMed] [Google Scholar]
- Venkataramani V, Tanev DI, Strahle C, Studier-Fischer A, Fankhauser L, Kessler T, Korber C, Kardorff M, Ratliff M, Xie R, et al. (2019). Glutamatergic synaptic input to glioma cells drives brain tumour progression. Nature 573, 532–538. [DOI] [PubMed] [Google Scholar]
- Venkatesh HS, Johung TB, Caretti V, Noll A, Tang Y, Nagaraja S, Gibson EM, Mount CW, Polepalli J, Mitra SS, et al. (2015). Neuronal Activity Promotes Glioma Growth through Neuroligin-3 Secretion. Cell 161, 803–816. [DOI] [PMC free article] [PubMed] [Google Scholar]
- Venkatesh HS, Morishita W, Geraghty AC, Silverbush D, Gillespie SM, Arzt M, Tam LT, Espenel C, Ponnuswami A, Ni L, et al. (2019). Electrical and synaptic integration of glioma into neural circuits. Nature 573, 539–545. [DOI] [PMC free article] [PubMed] [Google Scholar]
- Venkatesh HS, Tam LT, Woo PJ, Lennon J, Nagaraja S, Gillespie SM, Ni J, Duveau DY, Morris PJ, Zhao JJ, et al. (2017). Targeting neuronal activity-regulated neuroligin-3 dependency in high-grade glioma. Nature 549, 533–537. [DOI] [PMC free article] [PubMed] [Google Scholar]
- Venteicher AS, Tirosh I, Hebert C, Yizhak K, Neftel C, Filbin MG, Hovestadt V, Escalante LE, Shaw ML, Rodman C, et al. (2017). Decoupling genetics, lineages, and microenvironment in IDH-mutant gliomas by single-cell RNA-seq. Science 355. [DOI] [PMC free article] [PubMed] [Google Scholar]
- Verhaak RG, Hoadley KA, Purdom E, Wang V, Qi Y, Wilkerson MD, Miller CR, Ding L, Golub T, Mesirov JP, et al. (2010). Integrated genomic analysis identifies clinically relevant subtypes of glioblastoma characterized by abnormalities in PDGFRA, IDH1, EGFR, and NF1. Cancer Cell 17, 98–110. [DOI] [PMC free article] [PubMed] [Google Scholar]
- Wang J, Cazzato E, Ladewig E, Frattini V, Rosenbloom DI, Zairis S, Abate F, Liu Z, Elliott O, Shin YJ, et al. (2016). Clonal evolution of glioblastoma under therapy. Nat Genet 48, 768–776. [DOI] [PMC free article] [PubMed] [Google Scholar]
- Wang L, Babikir H, Muller S, Yagnik G, Shamardani K, Catalan F, Kohanbash G, Alvarado B, Di Lullo E, Kriegstein A, et al. (2019). The Phenotypes of Proliferating Glioblastoma Cells Reside on a Single Axis of Variation. Cancer Discov 9, 1708–1719. [DOI] [PMC free article] [PubMed] [Google Scholar]
- Wang M, Yao LC, Cheng M, Cai D, Martinek J, Pan CX, Shi W, Ma AH, De Vere White RW, Airhart S, et al. (2018). Humanized mice in studying efficacy and mechanisms of PD-1-targeted cancer immunotherapy. FASEB J 32, 1537–1549. [DOI] [PMC free article] [PubMed] [Google Scholar]
- Wang Q, Hu B, Hu X, Kim H, Squatrito M, Scarpace L, deCarvalho AC, Lyu S, Li P, Li Y, et al. (2017). Tumor Evolution of Glioma-Intrinsic Gene Expression Subtypes Associates with Immunological Changes in the Microenvironment. Cancer Cell 32, 42–56 e46. [DOI] [PMC free article] [PubMed] [Google Scholar]
- Wellenstein MD, and de Visser KE (2018). Cancer-Cell-Intrinsic Mechanisms Shaping the Tumor Immune Landscape. Immunity 48, 399–416. [DOI] [PubMed] [Google Scholar]
- Wen PY, Weller M, Lee EQ, Alexander BM, Barnholtz-Sloan JS, Barthel FP, Batchelor TT, Bindra RS, Chang SM, Chiocca EA, et al. (2020). Glioblastoma in adults: a Society for Neuro-Oncology (SNO) and European Society of Neuro-Oncology (EANO) consensus review on current management and future directions. Neuro Oncol 22, 1073–1113. [DOI] [PMC free article] [PubMed] [Google Scholar]
- Wolf FA, Angerer P, and Theis FJ (2018). SCANPY: large-scale single-cell gene expression data analysis. Genome Biol 19, 15. [DOI] [PMC free article] [PubMed] [Google Scholar]
- Wu TC, Xu K, Martinek J, Young RR, Banchereau R, George J, Turner J, Kim KI, Zurawski S, Wang X, et al. (2018). IL1 Receptor Antagonist Controls Transcriptional Signature of Inflammation in Patients with Metastatic Breast Cancer. Cancer Res 78, 5243–5258. [DOI] [PMC free article] [PubMed] [Google Scholar]
- Xue J, Schmidt SV, Sander J, Draffehn A, Krebs W, Quester I, De Nardo D, Gohel TD, Emde M, Schmidleithner L, et al. (2014). Transcriptome-based network analysis reveals a spectrum model of human macrophage activation. Immunity 40, 274–288. [DOI] [PMC free article] [PubMed] [Google Scholar]
- Yu K, Hu Y, Wu F, Guo Q, Qian Z, Hu W, Chen J, Wang K, Fan X, Wu X, et al. (2020). Surveying brain tumor heterogeneity by single-cell RNA-sequencing of multi-sector biopsies. Natl Sci Rev 7, 1306–1318. [DOI] [PMC free article] [PubMed] [Google Scholar]
- Yuan J, Levitin HM, Frattini V, Bush EC, Boyett DM, Samanamud J, Ceccarelli M, Dovas A, Zanazzi G, Canoll P, et al. (2018). Single-cell transcriptome analysis of lineage diversity in high-grade glioma. Genome Med 10, 57. [DOI] [PMC free article] [PubMed] [Google Scholar]
- Zhang AW, McPherson A, Milne K, Kroeger DR, Hamilton PT, Miranda A, Funnell T, Little N, de Souza CPE, Laan S, et al. (2018). Interfaces of Malignant and Immunologic Clonal Dynamics in Ovarian Cancer. Cell 173, 1755–1769 e1722. [DOI] [PubMed] [Google Scholar]
- Zhao J, Chen AX, Gartrell RD, Silverman AM, Aparicio L, Chu T, Bordbar D, Shan D, Samanamud J, Mahajan A, et al. (2019). Immune and genomic correlates of response to anti-PD-1 immunotherapy in glioblastoma. Nat Med 25, 462–469. [DOI] [PMC free article] [PubMed] [Google Scholar]
Associated Data
This section collects any data citations, data availability statements, or supplementary materials included in this article.
Supplementary Materials
Figure S1. Validation of deconvolution results. Related to Figure 1. (A) Scatterplots depicting the association between the true proportion and the CIBERSORTx-inferred proportion for each cell state in gene expression profiles from synthetic mixtures composed of different combinations of single cells. (B) Scatterplots depicting the association between the proportion of each neoplastic cell state determined from single-cell RNAseq and the non-neoplastic cell-adjusted neoplastic cell state proportion inferred from CIBERSORTx applied to each sample’s respective bulk tumor RNAseq profile. (C) Scatterplots depicting the associations between the relative proportions of proliferating stem-like neoplastic cells (SOX2+, Ki67+), stem-like neoplastic cells (SOX2+, OLIG2+, Ki67-), differentiated-like neoplastic cells (SOX2+, OLIG2-, Ki67-, EGFR+ or CD44+), and myeloid cells (CD14+, SOX2-) inferred using multiplex immunofluorescence and the corresponding cell state proportions inferred from expression data using CIBERSORTx. Myeloid cell CIBERSORTx fraction represents the sum of the myeloid, granulocyte, and dendritic cell fractions. In all plots, Pearson correlation coefficients are indicated. (D) The average cell state composition of each bulk transcriptional subtype across initial and recurrent GLASS samples. (E) The average cell state composition of each bulk transcriptional subtype across all TCGA samples. (F) Left: Stacked bar plot indicating the proportion of IDHwt tumors that underwent a gross total resection at each time point. Right: The average proportions of each cell state for tumors that underwent a subtotal resection at initial and a gross total resection at recurrence (Subtotal-gross total) and tumors that underwent a gross total resection at both time points (Gross total-gross total). (G) Left: The average Neftel et al. cell state composition of each bulk transcriptional subtype for all IDHwt GLASS tumors. Right: The average Neftel et. al cell state composition of initial and recurrent IDHwt tumors. (H) The average cell state composition of initial and recurrent IDHmut tumors stratified by 1p/19q co-deletion status. Colors for all panels are indicated at the bottom of the figure. See also Tables S1, S2, and S3.
Figure S2. Relationship between cell state and histological feature composition. Related to Figure 2. (A) Representative H&E and multiplex immunofluorescence images for each Ivy GAP histological feature. Features were identified by a neuropathologist based on the H&E images on the left. The leading edge, infiltrating tumor, and cellular tumor features are from GLSS-LU-0B10 (primary), while the pseudopalisading cells around necrosis and microvascular proliferation features are from GLSS-LU-00B9 (primary). Scale bars represent 50 μm. (B) Bar plot depicting the −log10 P-value from a two-way ANOVA measuring whether the fractions of each cell state in a sample associate with the patient the sample was derived from (red bar) and the feature the sample represents (blue bar). Dashed line corresponds to P = 0.05. (C) Heatmap depicting the Pearson correlation coefficients measuring the association between pathologist and CIBERSORTx estimates of nucleated tumor core- and periphery-related histological features. Evaluations were performed across 5 initial and 5 recurrent samples (D) Scatterplots depicting the association between pathologist estimates of necrosis and CIBERSORTx estimates of the IvyGAP pseudopalisading cells around necrosis feature in the GLASS and TCGA datasets. Shapes indicate initial and recurrence status. (E) Heatmap depicting the Pearson correlation coefficients measuring the association between pathologist estimates of recurrence-specific nucleated histological features and CIBERSORTx estimates of IvyGAP features. Evaluations were performed across 5 recurrent samples. In (C-E), pathologist estimates were based on the relative percent of the H&E slide area occupied by a given feature while CIBERSORTx estimates were based on RNAseq. Abbreviations: leading edge (LE), infiltrating tumor (IT), cellular tumor (CT), pseudopalisading cells around necrosis (PAN), and microvascular proliferation (MVP). (F) Heatmap depicting the changes in each neoplastic cell state between initial and recurrent tumors undergoing the indicated subtype transition. The initial subtype is indicated in the columns and the recurrent subtype is indicated in the rows. Each row of heatmaps reflects a different histological feature adjustment. Colors represent the change in fraction of the indicated features between initial and recurrent tumors, while * indicates a paired t-test P-value < 0.05. (G) Left: Ladder plot depicting the change in the adjusted stem-like cell proportion between paired initial and recurrent tumors undergoing a proneural-to-mesenchymal transition. Right: The average adjusted proportions for neoplastic cells for the tumor pairs outlined on the left. Neoplastic cell proportions were adjusted for the presence of non-neoplastic cells and leading-edge content. See also Table S4.
Figure S3. Cell state changes in samples that have acquired or lost somatic alterations. Related to Figure 3. (A) Left: Ladder plot depicting the change in the proliferating stem-like cell proportion between paired initial and recurrent IDHwt tumors that acquired CDKN2A deletions or CCND2 amplifications. Right: Stacked bar plot depicting the average proportions of each cell state for the tumor pairs in the ladder plots. (B) Ladder plots depicting the difference in microvascular proliferation fraction in IDHwt tumors that acquired hypermutation and IDHmut tumors that acquired a cell cycle alteration or hypermutation at recurrence. (C) Forest plot depicting the results of a multivariable Cox proportional hazards model that included proliferating stem-like cell increase, age, initial grade, and 1p/19q co-deletion status as variables. Points represents the hazard ratio and lines represent the 95% confidence interval. P-values were calculated using the Wald test. (D) Left: Ladder plots depicting the change in granulocyte proportion in IDHwt tumors that acquired mutations in NF1 at recurrence. Right: The average proportions of each cell state for the tumor pairs in the ladder plots. (E) Non-neoplastic cell state differences in IDHwt tumors that lost EGFR or PDGFRA amplifications at recurrence. Panel is split by alteration. Ladder plots depict the change in the non-neoplastic cell state proportion between paired initial and recurrent tumors while stacked bar plots depict the average proportions of each cell state for these tumors. (F) Sankey plot indicating whether the highest scoring transcriptional subtype changed at recurrence for the tumors depicted in (E). Each color reflects the transcriptional subtype in the initial tumors. Numbers in parentheses indicate number of samples. Subtype abbreviations: proneural (Pro.), classical (Class.) and mesenchymal (Mes.). (G) Ladder plots depicting the difference in T cell fraction in tumors that underwent hypermutation at recurrence. In all figures, P-values were calculated using a paired t-test unless otherwise noted.
Figure S4. Validation and analysis of cell state-specific gene expression profiles. Related to Figure 4. (A) Schema for single-cell RNAseq-based deconvolution of cell state-specific gene expression profiles using the pan-glioma single-cell RNAseq dataset (Johnson et al., 2021). (B) Heatmap depicting the relationship between the CIBERSORTx-inferred gene expression profiles and gene expression profiles from analogous cell types from a FACS-purified ground truth dataset (Klemm et al., 2020). In the CD45neg column in the Klemm et al. heatmap, which represents a composite gene expression profile from the non-immune cells purified from a collection of glioma tumors, gene expression patterns from all three neoplastic cell states can be observed. (C) Heatmap depicting the correlation coefficients between each CIBERSORTx-inferred cell state-specific gene expression profile and the gene expression profiles from the FACS-purified ground truth dataset. (D) Boxplot depicting the average signature expression in single cells of the indicated neoplastic cell states from unmatched initial and recurrent IDHwt tumors. (E) Bar plot depicting the −log10(FDR) from a GO enrichment analysis of the genes significantly up-regulated at recurrence in the differentiated-like and proliferating stem-like neoplastic cell-specific gene expression profiles from IDHwt tumors. The top 5 GO terms for each cell state are included. Dashed line corresponds to FDR < 0.05. (F) H&E image used to define the histological features used for multiplex immunofluorescence staining in Figure S4E. Neuropathologist annotations of cellular tumor and infiltrating tumor features are highlighted in the indicated colors. Scale bar represents 500 μm. (G) Bar plot depicting the −log10(FDR) from a GO enrichment analysis of the genes significantly up-regulated at recurrence in the differentiated-like neoplastic cell-specific gene expression profiles from IDHmut tumors. Dashed line corresponds to FDR < 0.1. (H) Boxplot depicting the average signature expression in neoplastic cell state-specific gene expression profiles for each IDHmut tumor pair in GLASS. Comparisons are stratified based on whether the tumor pair was grade stable or exhibited a grade increase at recurrence. (I) Boxplot depicting the average signature expression in single cells of the indicated neoplastic cell states from grade 2 and grade 3. In (D) and (I), single-cells were derived from the joint single-cell and bulk RNAseq dataset (Johnson et al., 2021). Across all panels, **** indicates Wilcoxon rank-sum test P-value < 1e-5, *** indicates Wilcoxon signed rank test P-value < 1e-3 and * indicates P < 0.05. See also Table S5.
Figure S5. Characterization of the mesenchymal myeloid signature. Related to Figure 5. (A) Kaplan-Meier plot depicting the surgical interval distributions of patients with tumors that were and were not mesenchymal at recurrence. P-value was calculated using the log-rank test. (B) Forest plot depicting the results of a multivariable Cox proportional hazards model that included recurrent tumor subtype, age, and initial grade as variables. Points represents the hazard ratio and lines represent the 95% confidence interval. P-values were calculated using the Wald test. (C) Box and ladder plots depicting the difference in the median-normalized mean expression of the Neftel et al. MES-like signature between initial and recurrent IDHwt tumors from GLASS undergoing a mesenchymal transition. Point colors indicate transcriptional subtype. P-values were calculated using the Wilcoxon signed-rank test. (D) Boxplots depicting the average macrophage and microglia gene expression signatures in CIBERSORTx-inferred myeloid-specific gene expression profiles from TCGA. Samples are stratified by IDH and 1p/19q co-deletion status (left) and bulk transcriptional subtype (right). **** indicates Wilcoxon rank-sum test P-value < 1e-5. (E) Left: Principal component analysis plot of the CIBERSORTx-inferred myeloid profiles from TCGA and GTEx. Colors indicate bulk transcriptional subtype; shapes indicate tissue subtype. Right: Density plot depicting the distribution of principal component 1 (PC1) among each transcriptional subtype. (F) Bar plots depicting the Spearman correlation coefficients measuring the association between the myeloid-specific expression scores for the macrophage and microglia signatures versus the presence of the four Ivy GAP histological features in TCGA. The features measured were leading edge (LE), cellular tumor (CT), pseudopalisading cells around necrosis (CTpan), and microvascular proliferation (CTmvp). (G) Heatmaps depicting the average normalized log10 expression level of genes that were differentially expressed between myeloid cell states from initial and recurrent IDHwt and IDHmut tumors in GLASS that did not undergo a subtype switch. Fractions indicate the number of differentially expressed genes out of the number of genes inferred for that cell state’s profile. (H) Upset plot depicting the intersection of significantly up-regulated genes in the myeloid-specific gene expression profiles from each transcriptional subtype relative to normal brain cortex. Intersections between signatures are shown in the combination matrix. Number of genes uniquely found in each set are indicated above each bar. (I) Bar plot depicting the −log10(FDR) from a GO enrichment analysis for the genes in the mesenchymal myeloid signature. (J) Scatterplot depicting the association between the mean mesenchymal myeloid signature expression in single myeloid cells and the mesenchymal subtype score calculated from bulk RNAseq for each patient. (K) Bar plots depicting the Spearman correlation coefficients measuring the association between the myeloid-specific expression scores for the mesenchymal myeloid signature versus the presence of the four Ivy GAP histological features in TCGA, as in (F). See also Tables S6 and S7.
Figure S6. Analysis of neoantigen-mediated T cell selection in glioma. Related to Figure 6. (A) Scatterplots depicting the association between the T cell proportion and the neoantigen depletion rate in initial and recurrent GLASS samples. (B) Box and ladder plots depicting the difference in the number of neoantigens binding to the kept and lost allele. Points are colored based on whether the sample was an initial or recurrent tumor. P-values were calculated using the Wilcoxon signed-rank test. (C) Violin plots depicting the distribution of the somatic copy number alteration burden in initial and recurrent IDHwt GLASS samples that did and did not exhibit HLA LOH. P-values were calculated using the Wilcoxon rank-sum test.
Table S1. Sequencing centers and hospitals with corresponding GLASS barcode designations for newly added GLASS data. Related to Figure 1.
Table S2. Clinical characteristics of GLASS RNAseq cohort arranged by glioma molecular subtype and timepoint. Related to Figure 1.
Table S3. CIBERSORTx single-cell signature matrix. Related to Figure 1.
Table S4. Histological feature pathology definitions and pathologist annotations. Related to Figure 2.
Table S5. Cell state-specific post-treatment gene signatures. Related to Figure 4.
Table S6. Transcriptional subtype-specific myeloid gene signatures. Related to Figure 5.
Table S7. Mesenchymal myeloid gene signature. Related to Figure 5.
Table S8. Candidate ligand-receptor interactions associated with mesenchymal transition. Related to Figure 5.
Data Availability Statement
Estimated count and transcript per million gene expression matrices as well as mutation calls, copy number calls, and all downstream tables generated for this study can be downloaded on Synapse (https://www.synapse.org/glass). Digitized H&E images are available on the Digital Slide Archive (https://styx.neurology.emory.edu/girder/#collection/625dda70622f966e826a0446).
All custom scripts, pipelines, and code used in data processing and figure creation is available on the project’s Github repository (https://github.com/fsvarn/GLASSx).
Any additional information required to reanalyze the data reported in this paper is available from the lead contact upon request.