Abstract
Nuclear receptor-binding SET domain-containing 2 (NSD2) is the primary enzyme responsible for the dimethylation of lysine 36 of histone 3 (H3K36), a mark associated with active gene transcription and intergenic DNA methylation. In addition to a methyltransferase domain, NSD2 harbors two proline-tryptophan-tryptophan-proline (PWWP) domains and five plant homeodomains (PHDs) believed to serve as chromatin reading modules. Here, we report a chemical probe targeting the N-terminal PWWP (PWWP1) domain of NSD2. UNC6934 occupies the canonical H3K36me2-binding pocket of PWWP1, antagonizes PWWP1 interaction with nucleosomal H3K36me2 and selectively engages endogenous NSD2 in cells. UNC6934 induces accumulation of endogenous NSD2 in the nucleolus, phenocopying the localization defects of NSD2 protein isoforms lacking PWWP1 that result from translocations prevalent in multiple myeloma (MM). Mutations of other NSD2 chromatin reader domains also increase NSD2 nucleolar localization and enhance the effect of UNC6934. This chemical probe and the accompanying negative control UNC7145 will be useful tools in defining NSD2 biology.
NSD2 (also known as MMSET and WHSC1) is a protein lysine methyltransferase that belongs to the NSD family, which also includes NSD1 and NSD3. NSD2 predominantly dimethylates H3K36 (ref. 1) and is aberrantly expressed, amplified or somatically mutated in multiple types of cancer2. Notably, the t(4; 14) NSD2 translocation in MM and the hyperactivating NSD2 E1099K mutation in a subset of pediatric acute lymphoblastic leukemia (ALL) both result in altered chromatin methylation, which is reported to drive oncogenesis1,3-7. Functionally, NSD2 is responsible for the bulk of H3K36me2 in diverse cell types. Dimethylation of H3K36 by both NSD1 and NSD2 recruits DNMT3a at intergenic regions to control DNA methylation and regulate development and homeostasis8,9. NSD2 is also required for efficient non-homologous end joining and homologous recombination, two canonical DNA repair pathways10,11.
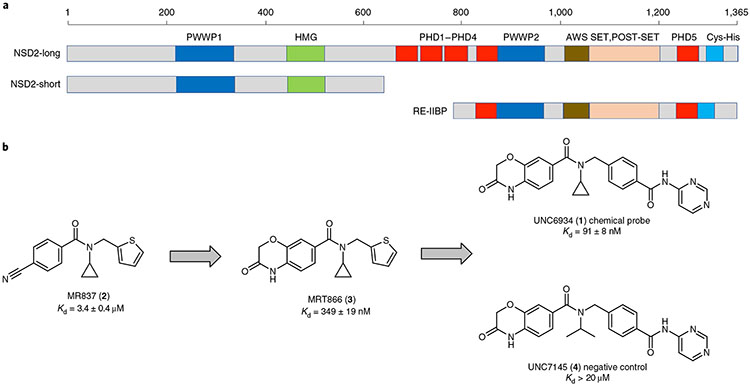
In addition to its catalytic domain, NSD2 has multiple protein–protein interaction (PPI) modules with known or potential chromatin reading functions, including five PHDs and two PWWP domains2 as well as a putative DNA-binding high mobility group box (HMG-box) domain (Fig. 1a). Mounting evidence suggests that these reader domains play important roles in NSD2 function, but their individual and/or collective roles are still being elucidated2. Many PWWP domains are known H3K36 di- and trimethyl (me2/me3) reading modules that engage methyl-lysine and simultaneously interact with nucleosomal DNA adjacent to H3K36 (refs. 12,13). The isolated N-terminal PWWP domain of NSD2 (NSD2-PWWP1) binds H3K36me2/H3K36me3 nucleosomes; this interaction presumably is mediated by a conserved aromatic cage and stabilizes NSD2 at chromatin8. Mutation of conserved aromatic cage residues abrogates NSD2-PWWP1 binding to nucleosomal H3K36me2 but has only a modest effect on global H3K36 methylation levels in cells8. However, H3K36 methylation has been shown to be abolished following mutation of the second PHD domain (PHD2)14. Chromatin association is preserved with the PHD2 mutant but is lost following combined truncation of PWWP1, PHD1, PHD2 and part of PHD3 (that is, the RE-IIBP isoform) due to cytoplasmic retention14. Conversely, NSD2-PWWP1 truncated variants show nucleolar accumulation15,16. Overall, these data suggest a complex regulatory system for NSD2 in which distinct combinations of structural modules contribute to subcellular localization, substrate engagement and lysine methylation.
Fig. 1 ∣. NSD2 protein architecture and NSD2-PWWP1 ligands.
a, Domain architecture of the three splicing isoforms, NSD2-long, NSD2-short and RE-IIBP. b, Chemical series progression; successive rounds of optimization starting from compound MR837 (ref. 19) led to MRT866 and finally the chemical probe UNC6934. UNC7145 is a structurally similar negative control compound.
Due to their role in disease and biology, there has been much recent interest in targeting the NSD methyltransferases with small molecules. High-quality, cell-active and selective inhibitors of NSD2 and NSD3 catalytic activity remain elusive; however, irreversible small-molecule inhibitors of the NSD1 SET domain that demonstrate on-target activity in NUP98-NSD1 leukemia cells have recently been reported17. While their PHD domains have thus far not been targetable, we have had recent success with the NSD3 and NSD2-PWWP domains, suggesting their druggability. Specifically, we reported a potent chemical probe targeting the NSD3-PWWP that repressed MYC mRNA levels and reduced the proliferation of leukemia cell lines18. Additionally, we recently described the development of an antagonist of NSD2-PWWP1, which binds with modest potency and abrogates H3K36me2 binding19. Therefore, we hypothesized that targeting the PWWP domain(s) of NSD2 with highly potent and selective chemical probes may be a strategy to modulate NSD2 engagement with chromatin, subcellular localization and/or catalytic function.
In this study, we report a chemical probe, UNC6934 (1), that selectively binds in the aromatic cage of NSD2-PWWP1, thereby disrupting its interaction with H3K36me2 nucleosomes. UNC6934 potently and selectively binds full-length NSD2 (fl-NSD2) in cells and induces partial disengagement from chromatin, consistent with a cooperative chromatin-binding mechanism relying on multiple protein interfaces. UNC6934 promotes nucleolar localization of NSD2, phenocopying previously characterized PWWP1-disrupting mutations prevalent in t(4; 14) MMs15,16. Furthermore, we identified two active nucleolar localization sequences in NSD2 and demonstrated cooperativity between multiple chromatin reader modules to prevent nucleolar sequestration. Our data demonstrate that UNC6934 is a potent and selective drug-like molecule suitable as a high-quality chemical probe to interrogate the function of NSD2-PWWP1.
Results
Discovery of a potent ligand targeting NSD2-PWWP1.
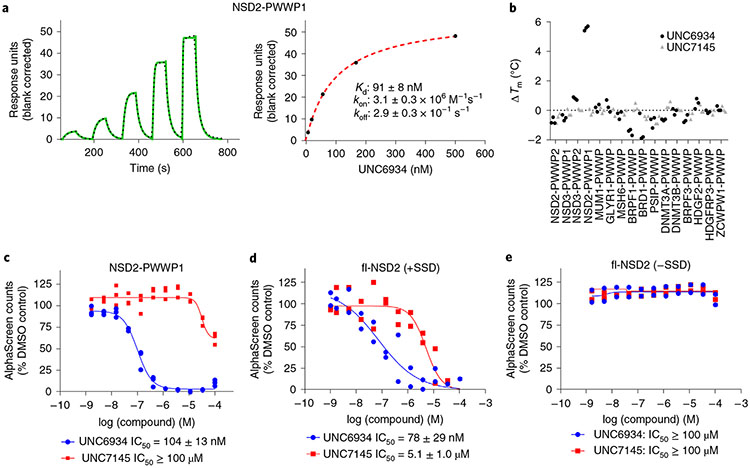
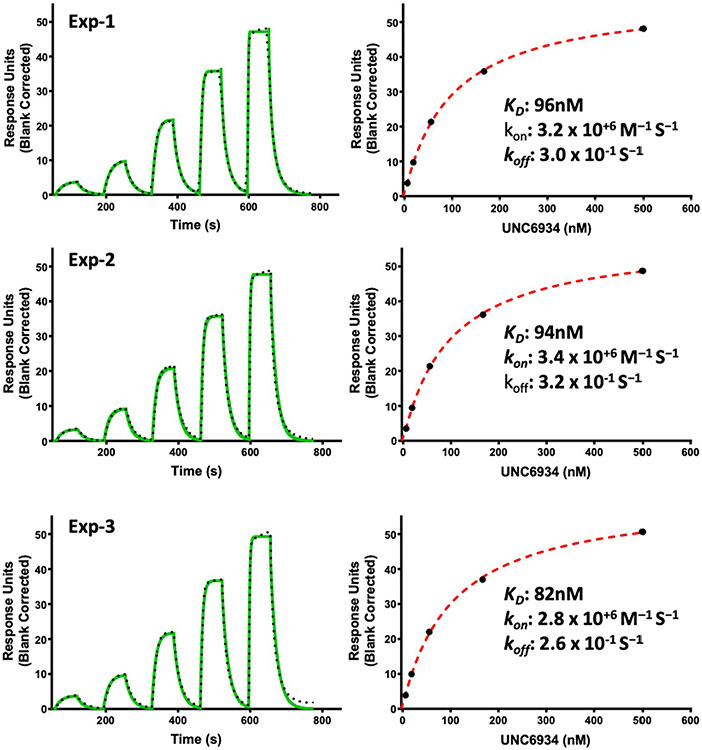
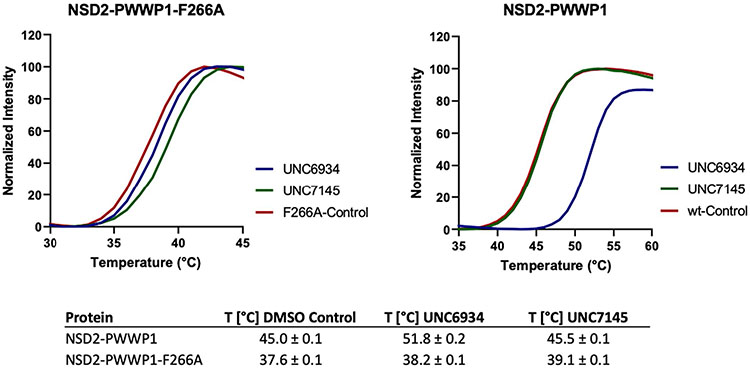
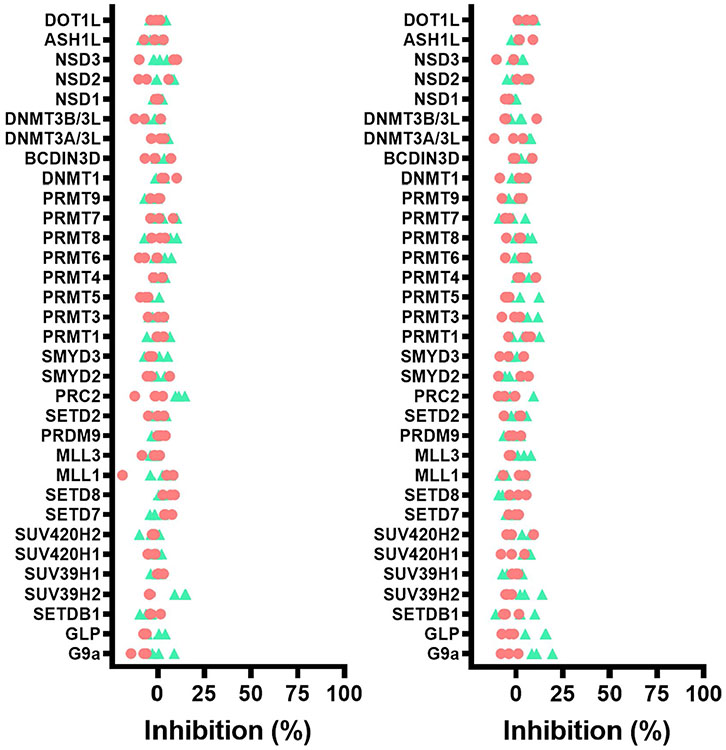
We recently described the use of virtual screening, target class screening and ligand-based scaffold hopping approaches to identify ligands of the NSD2-PWWP1 domain as starting points for further development19. This initial effort led to MR837 (2), which binds NSD2-PWWP1 with a Kd of 3.4 ± 0.4 μM, as determined by surface plasmon resonance (SPR). Based on the crystal structure of MR837 in complex with NSD2 (Protein Data Bank (PDB): 6UE6), molecular docking simulations predicted that a benzoxazinone bicyclic ring would favorably replace the cyanophenyl group of MR837. We confirmed that MRT866 (3) binds NSD2-PWWP1 with a Kd of 349 ± 19 nM (Fig. 1b) and occupies the aromatic cage of PWWP1 similar to MR837, as determined by X-ray crystallography (PDB: 7MDN; Supplementary Table 1). The benzoxazinone ring of MRT866 makes more extensive van der Waals interactions with NSD2-PWWP1 than MR837 and engages in an additional hydrogen bond with the side chain of Q321. Further structure-based optimization focused on the replacement of the thiophene ring and resulted in UNC6934, which binds NSD2-PWWP1 with a Kd of 91 ± 8 nM, as determined by SPR (Figs. 1b and 2a and Extended Data Fig. 1). Interestingly, conversion of the cyclopropyl group of UNC6934 to an isopropyl moiety as in UNC7145 (4) (Fig. 1b) resulted in no appreciable binding up to 20 μM; therefore, UNC7145 is an ideal negative control compound. To confirm that UNC6934 is binding in the methyl-lysine binding pocket of NSD2-PWWP1, we generated NSD2-PWWP1 with a key aromatic cage mutant (F266A). In contrast to wild-type (WT) protein, UNC6934 did not result in significant thermal stabilization of the NSD2-PWWP1 F266A mutant (Extended Data Fig. 2). Furthermore, UNC6934 is selective for NSD2-PWWP1 over 15 other human PWWP domains, as assessed by differential scanning fluorimetry (DSF) (Fig. 2b), and did not inhibit any of a panel of 33 methyltransferase domains, including the H3K36 methyltransferases NSD1, NSD2, NSD3 and SETD2 (Extended Data Fig. 3a). UNC7145 was inactive against all PWWP domains and methyltransferases tested (Fig. 2b and Extended Data Fig. 3b).
Fig. 2 ∣. Biophysical characterization of UNC6934.
a, SPR analysis of the binding of UNC6934 to NSD2-PWWP1. Left, representative sensorgram (green) with the kinetic fit (black dots). Right, steady-state response (black circles) with the steady-state 1:1 binding model fitting (red dashed line). The indicated kinetic data were obtained from triplicate experiments (Extended Data Fig. 1). b, Selectivity profile of UNC6934 and UNC7145 against a panel of PWWP domains measured by DSF (compounds were tested at 100 μM in three independent experiments). c, Effect of UNC6934 and UNC7145 on the binding of NSD2-PWWP1 to nucleosomal H3K36me2, as measured by AlphaScreen. Each binding interaction was performed in triplicate (n = 3 independent experiments), and all data were normalized to the DMSO control. d,e, Effect of UNC6934 and UNC7145 on the binding of fl-NSD2 to nucleosomal H3K36me2 (n = 2 independent experiments), as measured by AlphaScreen, in the presence (d) or absence (e) of SSD (2 μg ml−1).
UNC6934 disengages NSD2-PWWP1 from methylated nucleosomes.
NSD2-PWWP1 is postulated to stabilize the binding of NSD2 on chromatin, primarily through the recognition of H3K36me2 (ref. 8). Therefore, we next used an AlphaScreen-based proximity assay to investigate the effect of UNC6934 on the interaction of NSD2 with semi-synthetic designer nucleosomes (dNucs)9. We first evaluated 6 × His-tagged NSD2-PWWP1 binding to a range of lysine-methylated semi-synthetic dNucs (me0, me1, me2 and me3 at H3K4, H3K9, H3K27, H3K36 and H4K20) and confirmed interaction with di- and trimethyl H3K36 with a preference for the former (Extended Data Fig. 4), as previously reported8. UNC6934 disrupted the interaction between NSD2-PWWP1 and nucleosomal H3K36me2 in a dose-dependent manner with a half-maximum inhibitory concentration (IC50) of 104 ± 13 nM, while UNC7145 had no measurable effect (Fig. 2c).
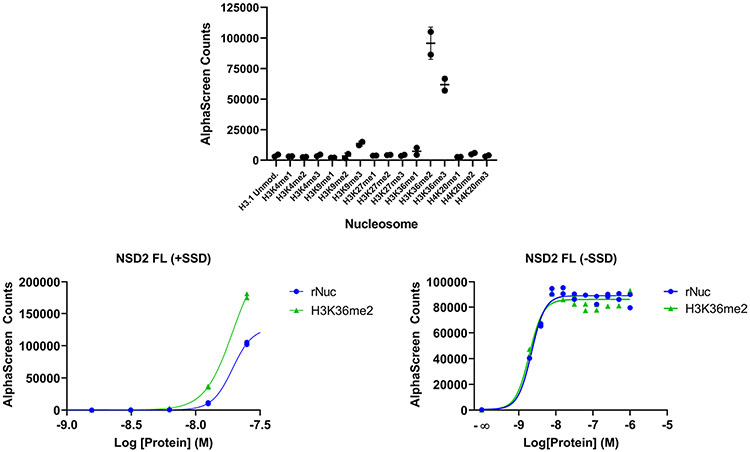
We next asked whether UNC6934 could disrupt the interaction between fl-NSD2 and nucleosomal substrates by AlphaScreen. Initial optimization experiments revealed no apparent preference of fl-NSD2 for H3K36me2 over unmodified nucleosome (rNuc; Extended Data Fig. 4), likely because of multivalent DNA binding via both PWWP and SET domains12,13,20. To test this hypothesis, we repeated the experiment in the presence of salmon sperm DNA (SSD; a commonly used blocker of non-specific DNA interactions) and identified a signal window where H3K36me2 binding was improved over rNuc (Extended Data Fig. 4). Under these experimental conditions, UNC6934 effectively disengages fl-NSD2 from nucleosomal H3K36me2 (IC50 = 78 ± 29 nM) ~65-fold more potently than negative control UNC7145 (IC50 = 5.1 ± 1 μM) (Fig. 2d). UNC6934 was unable to displace fl-NSD2 in the absence of SSD, confirming the important contribution of DNA binding to chromatin engagement (Fig. 2e). Together, these results indicate that NSD2 binding to nucleosomes is multivalent, and, therefore, UNC6934 can efficiently disengage fl-NSD2 from H3K36me2-modified nucleosomes only in the presence of excess competitive DNA.
UNC6934 occupies the H3K36me2-binding pocket of NSD2-PWWP1.
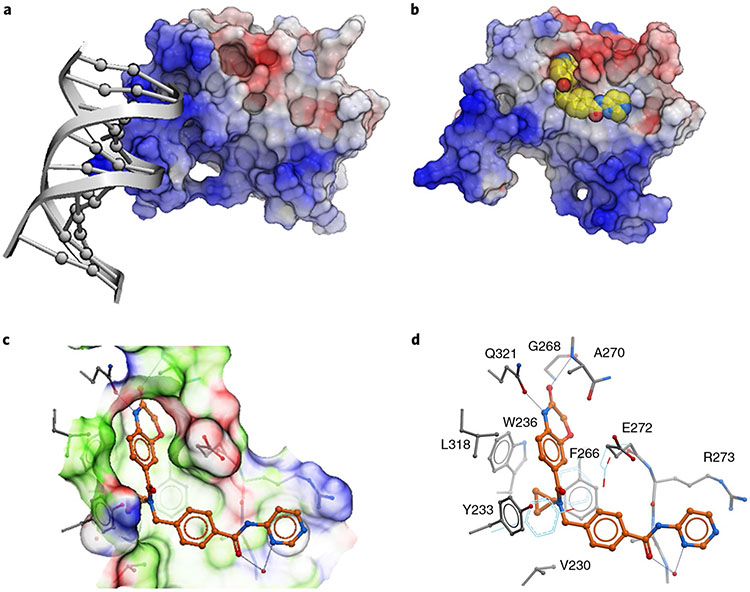
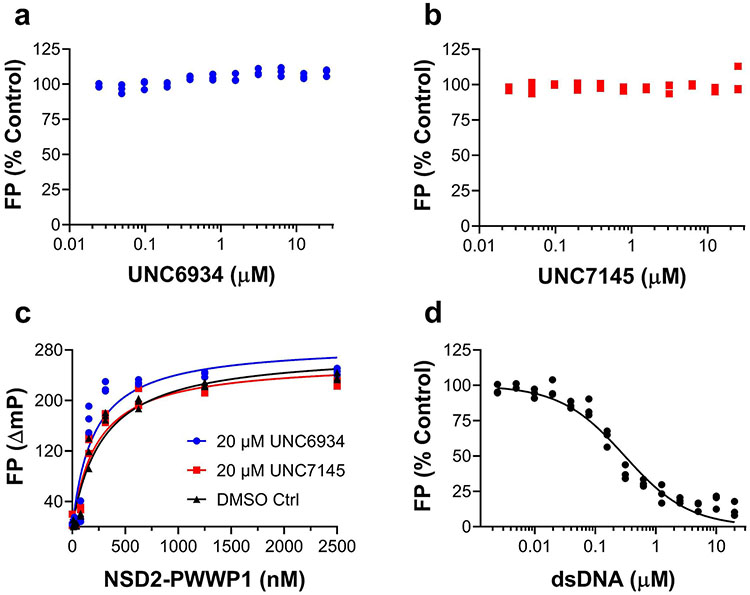
PWWP domains have both a methyl-lysine-binding pocket and a DNA-binding surface12. To better understand these interactions, we solved the crystal structure of NSD2-PWWP1 in complex with UNC6934 (Supplementary Table 1). While DNA binds a basic surface area where the side chains of K304, K309 and K312 are engaged in direct electrostatic interactions with the DNA phosphate backbone (Fig. 3a; PDB: 5VC8), UNC6934 occupies the canonical methyl-lysine-binding pocket adjacent to the DNA-binding surface. Despite the proximity of the DNA- and chemical probe-binding sites, UNC6934 does not compete with NSD2-PWWP1 DNA binding in a fluorescence polarization assay (Extended Data Fig. 5). Rather, the probe adopts a pose where the cyclopropyl ring is deeply inserted in the aromatic cage composed of Y233, W236 and F266 (Fig. 3b,c; PDB: 6XCG). The extremely tight fit at the aromatic cage rationalizes the lack of binding of the corresponding negative control, UNC7145, where a bulkier isopropyl replaces the cyclopropyl group (Fig. 1b). The non-bonded carbons of an isopropyl group are separated by ~2.5 Å (for example, PDB: 1NA3), while the corresponding atoms are 1.5 Å apart in the cyclopropyl ring of UNC6934. The structure further explains the observed loss of binding of UNC6934 to the F266A NSD2-PWWP1 mutant (Extended Data Fig. 2). Unlike the DNA-binding surface, the UNC6934-binding pocket is mildly electronegative, as would be expected for a site accommodating a positively charged methyl-lysine side chain. Interestingly, the pocket is partly occluded in the apo structure and undergoes a conformational rearrangement of three side chains (Y233, F266 and E272) following UNC6934 binding (Fig. 3d). Overall, our structural data confirm that UNC6934 competes directly with H3K36me2 for binding to NSD2-PWWP1, thereby disrupting high-affinity binding to H3K36me2 nucleosomes.
Fig. 3 ∣. Crystal structures of NSD2-PWWP1.
a,b, Structure of NSD2-PWWP1 in complex with DNA (PDB: 5VC8) (a) and UNC6934 (PDB: 6XCG) (b). Color coding is according to electrostatic potential; blue, electropositive; red, electronegative. c,d, Atomic interactions between UNC6934 and surrounding side chains. Color coding is according to binding properties; green, hydrophobic; blue, hydrogen bond donor; red, hydrogen bond acceptor (c). Side chain conformations observed in the apo state are in light blue (d).
Our structural data also help to explain the exquisite selectivity of UNC6934 for NSD2-PWWP1 over other PWWP domains. Mapping the side chains positioned within 5 Å of the bound ligand in our cocrystal structure onto a multiple sequence alignment of all human PWWP domains identified the degree of conservation among binding pocket residues exploited by UNC6934. We found that the binding pocket of NSD3-PWWP1 is by far the closest to that of NSD2-PWWP1, with only three of the side chains lining the binding pocket differing between both domains. In NSD2, G268 is at the bottom of a cavity accommodating the benzoxazinone of UNC6934, and replacing this residue with the serine of NSD3 would be expected to occlude ligand binding. This is consistent with the ability of UNC6934 to stabilize NSD2-PWWP1 but not NSD3-PWWP1 or any other tested human PWWP domains in a thermal shift assay (Fig. 2b), strongly suggesting selectivity of the chemical probe. In further support, UNC6934 and UNC7145 were profiled against a set of 90 central nervous system receptors, channels and transporters (Supplementary Table 2). Of those inhibited >50% by UNC6934 at 10 μM (two in total), the human sodium-dependent serotonin transporter receptor was the only protein inhibited by UNC6934 with a measurable inhibitory constant (Ki = 1.4 ± 0.8 μM).
UNC6934 selectively engages NSD2-PWWP1 in cells.
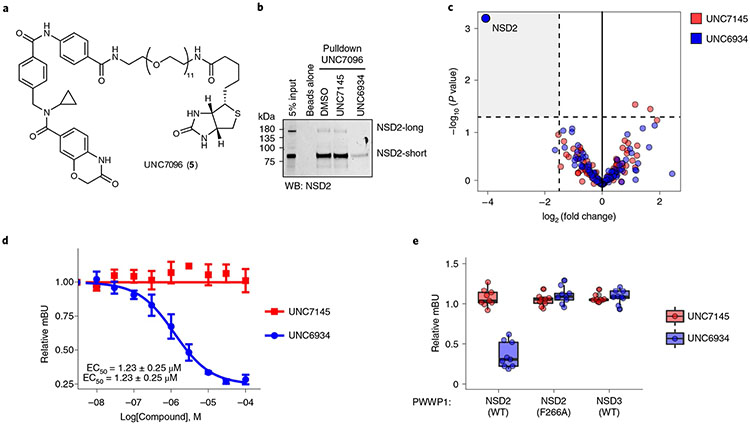
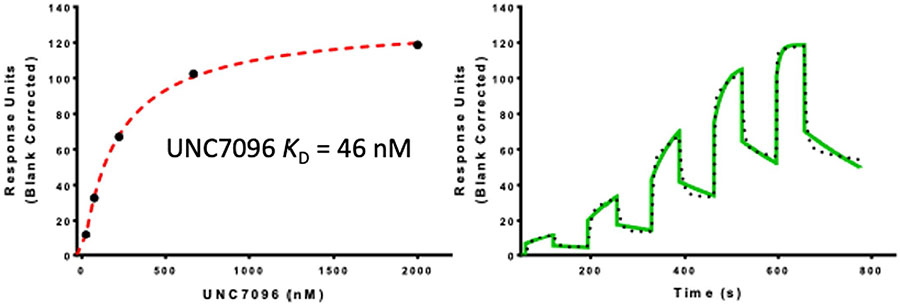
To profile ligand selectivity and target engagement in a cellular context, we synthesized UNC7096 (5), a biotin-labeled affinity reagent containing a close analog of UNC6934 for chemical pulldown experiments (Fig. 4a). We first verified that UNC7096 is a high-affinity NSD2-PWWP ligand by SPR, measuring a Kd of 46 nM, comparable to UNC6934 (Extended Data Fig. 6). UNC7096 efficiently enriched both NSD2-short (MMSETI) and NSD2-long (MMSETII) isoforms from KMS-11 whole-cell lysates, as determined by immunoblotting (Fig. 4b). Chemiprecipitation of NSD2 by UNC7096 could also be blocked by preincubating KMS-11 lysates with 20 μM UNC6934 but not the negative control compound UNC7145 (Fig. 4b). Label-free proteomic analysis of the UNC7096 pulldown experiments identified NSD2 as the only protein significantly depleted by competition with UNC6934 (Fig. 4c), whereas preincubation of lysates with UNC7145 did not considerably alter the enrichment profile. Collectively, these experiments demonstrate selective binding of UNC6934 to endogenous NSD2 protein within cell lysates.
Fig. 4 ∣. Cellular target engagement and selectivity.
a, Chemical structure of UNC7096, a UNC6934-derived biotin affinity purification reagent. b, Representative NSD2 immunoblot analysis of UNC7096–streptavidin bead pulldowns from KMS-11 whole-cell lysates after preincubation with either DMSO, 20 μM UNC7145 or 20 μM UNC6934. The experiment was repeated on at least four separate occasions with similar results; WB, western blot. c, Selectivity profiling by chemical proteomics. Volcano plots show significantly displaced proteins from immobilized UNC7096 pulldowns by competition with 20 μM UNC6934 or UNC7145 relative to DMSO control. Significantly depleted hits were considered as a fold enrichment less than −2 and a P value of <0.05 (n = 3 independent replicates). P values and enrichment were determined using the Bioconductor package DEP, as described in ref. 37. d, Effect of UNC6934 and UNC7145 treatment on NanoBRET signal produced by the interaction between NSD2-PWWP1–NanoLuc and histone H3.3–HaloTag in U2OS cells; half-maximum effective concentration (EC50) = 1.23 ± 0.25 μM. The plot shows data points from three independent replicates (n = 3); mBU, mean corrected NanoBRET ratios. e, Box and point plots showing the effect of 10 μM UNC6934 or UNC7145 on the interaction between H3.3–HaloTag and NanoLuc-tagged WT NSD2-PWWP1, NSD2-PWWP1 F266A (aromatic cage mutant) or NSD3-PWWP1 using a NanoBRET PPI assay (each point represents one technical replicate from three independent experiments; n = 3). Box plots show the median bound by the upper and lower quartiles with whiskers extending to 1.5 times the interquartile range.
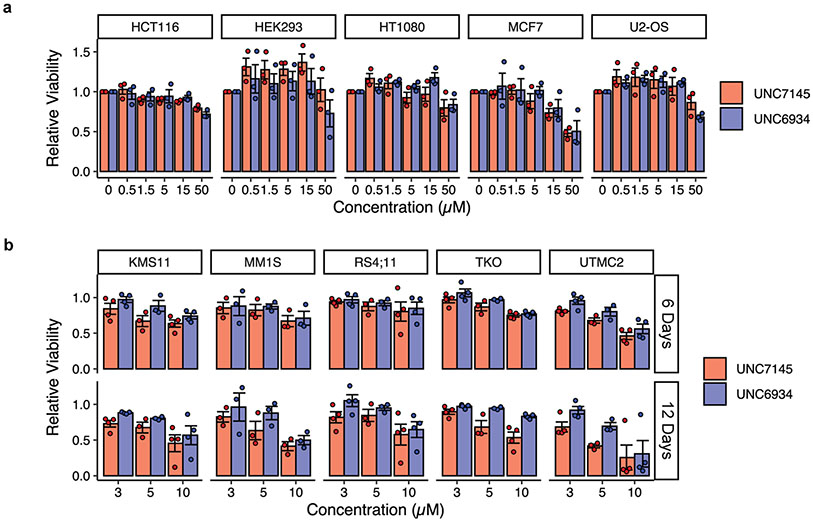
To quantify the extent to which UNC6934 engages NSD2 in live cells, we used a NanoBRET PPI assay to measure bioluminescence resonance energy transfer (BRET) between a NanoLuc–NSD2-PWWP1 fusion protein (donor) and a chloroalkane fluorophore (acceptor) bound to a HaloTag–histone H3.3 fusion in U2OS cells21. We observed a dose-dependent decrease in BRET signal following treatment with UNC6934 (EC50 = 1.23 ± 0.25 μM) but not with the negative control compound UNC7145 (Fig. 4d). The BRET signals of an NSD2-PWWP1 aromatic cage mutant (F266A) or NSD3-PWWP1 were unaffected by UNC6934 (10 μM), supporting selective engagement of the NSD2-PWWP1 methyl-lysine binding pocket (Fig. 4e). In further support of minimal off-target activity and the suitability of UNC6934 to query NSD2-PWWP1 function in cells, we found no acute cytotoxic effects following treatment of adherent or hematopoietic malignancy cell lines with UNC6934 or UNC7145 up to 5 μM over 3–12 d (Extended Data Fig. 7).
Perturbing reader domains promotes nucleolar localization.
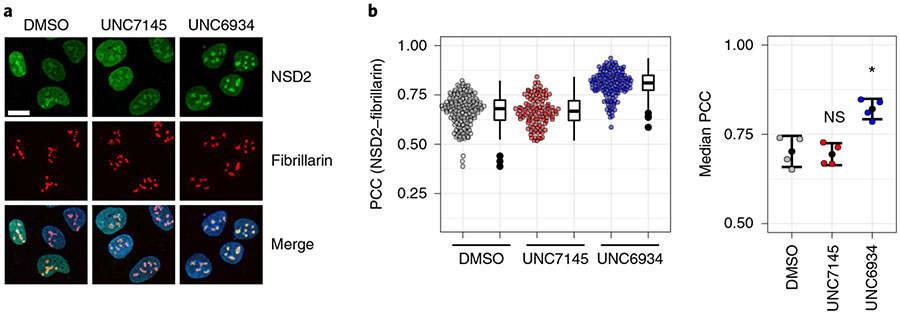
Reader domains are critical for the recruitment and positioning of epigenetic proteins at defined loci across the genome, and small-molecule antagonism of reader domains is known to alter the localization of chromatin-associated target proteins22,23. We therefore reasoned that PWWP1 antagonism by UNC6934 may affect NSD2 localization within the nucleus. To test this hypothesis, we used confocal microscopy to evaluate the localization of endogenous NSD2 in U2OS cells treated for 4 h with 5 μM UNC6934 or negative control UNC7145 (Extended Data Fig. 8a). Following treatment with UNC6934, we observed an increase in NSD2 signal within nucleoli, the subnuclear membrane-less organelles that house ribosomal DNA (rDNA) for preribosomal transcription and processing. Interestingly, t(4; 14) chromosome translocations in MM, which juxtapose the IgH enhancer and NSD2, promoting overexpression of the latter, can result in truncation/inactivation of PWWP1 and nucleolar enrichment, suggesting that its PWWP1 domain contributes to NSD2 exclusion from the nucleolus15,16. Therefore, UNC6934 appears to phenocopy NSD2 N-terminal PWWP1 truncations, while UNC7145 has no effect.
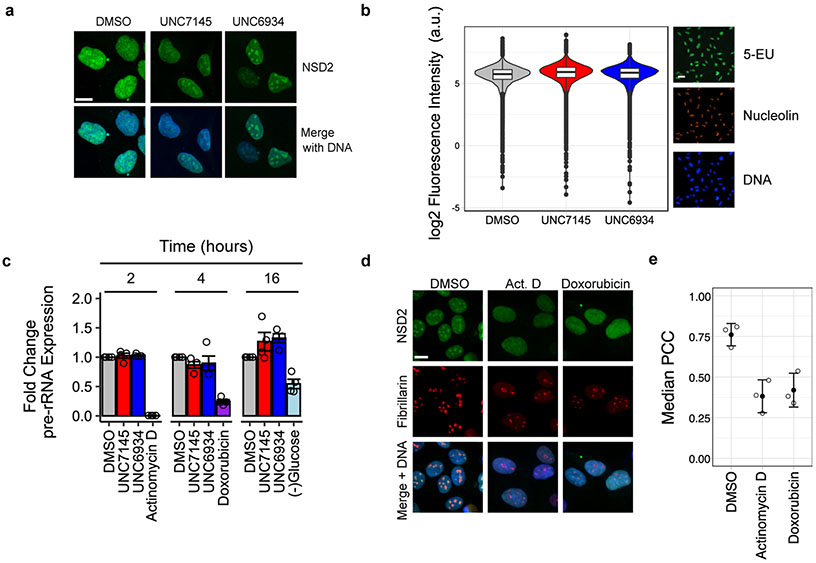
To validate this result, we repeated the imaging experiments while costaining for the nucleolar marker fibrillarin and used the Pearson correlation coefficient (PCC) to measure the extent of NSD2 and fibrillarin colocalization (Fig. 5a,b). The PCC is a common statistic for this approach and measures the correlation in signal intensity between two fluorescent molecules (values range between −1 and 1, representing no correlation and absolute correlation, respectively). We observed a significant increase in the correlation between NSD2 and fibrillarin signals in response to UNC6934, confirming an increase in the nucleolar localization of NSD2. These data support the engagement of endogenous NSD2 by UNC6934 in cells and suggest that loss of H3K36me2 binding by NSD2-PWWP1 promotes nucleolar accumulation of NSD2. While we found no significant effect on ribosomal RNA (rRNA) transcription in response to UNC6934 (Extended Data Fig. 8b,c), we did observe a steady-state pool of nucleolar NSD2 that was sensitive to RNA polymerase I inhibition (actinomycin D; 50 nM) or genotoxic agents (doxorubicin; 1 μM), conditions known to significantly alter the protein composition of nucleoli24,25 (Extended Data Fig. 8d,e). Overall, these results indicate that UNC6934-mediated antagonism of PWWP1 leads to accumulation of endogenous NSD2 in the nucleolus.
Fig. 5 ∣. UNC6934 promotes enrichment of endogenous NSD2 in the nucleolus.
a, Representative confocal microscopy images of NSD2 and fibrillarin staining in U2OS cells treated for 4 h with DMSO vehicle control, 5 μM UNC7145 or 5 μM UNC6934; scale bar, 15μm. Similar results were observed on at least four separate occasions. b, Quantification of colocalization between NSD2 and the nucleolar marker fibrillarin as determined by PCC. Left, a representative box and point plot shows the distribution for one biological replicate with each point representing the PCC per nuclei measured across at least four fields of view. Box plots show the median bound by the upper and lower quartiles with whiskers extending to 1.5 times the interquartile range. Right, the median PCC per nucleus is shown for four independent biological replicates as colored points (n = 4; significance relative to DMSO control determined using a Holm–Bonferroni adjusted two-sided t-test; UNC7145, P = 0.780; UNC6934, *P = 0.011). The mean±s.d. for all replicates is shown as a single black point with error bars; NS, not significant.
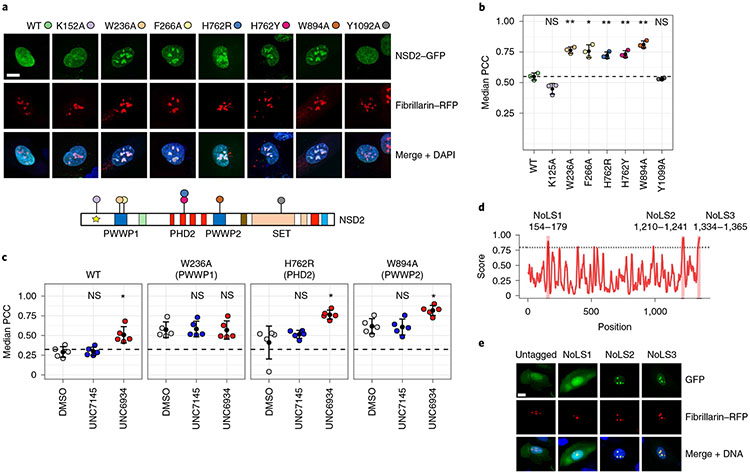
To test if subnuclear localization is exclusively mediated by the PWWP1 domain, we mutated green fluorescent protein (GFP)-tagged NSD2 at critical sites within several distinct chromatin recruitment modules. This included an N-terminal short linear motif that engages BET proteins (K125A)22,26, two key aromatic cage residues in the PWWP1 domain (W236A and F266A)12, two PHD2 mutants that disrupt recruitment to target loci and disable H3K36me2 methyltransferase activity in cells (H762R and H762Y)14, a presumptive inactivating aromatic cage mutation in PWWP2 (W894A) and a catalytic-dead mutant of the methyltransferase domain (Y1092A)1. We found that disruption of any one of the canonical reader domains (PWWP1, PHD2 and PWWP2) promoted enrichment of NSD2 in nucleoli (Fig. 6a,b). These observations suggest that it is the loss of chromatin binding that leads to the nucleolar retention of NSD2, and that multiple NSD2 reader domains cooperate to maintain appropriate nuclear sublocalization.
Fig. 6 ∣. Multivalent interactions dictate the nuclear localization of NSD2.
a, Representative confocal microscopy of U2OS cells coexpressing GFP-tagged NSD2 WT and NSD2 mutants and red fluorescent protein (RFP)-tagged fibrillarin; scale bar, 15μm. Similar results were observed on three separate occasions. Domain schematic of NSD2 indicates the position of each mutation. b, Quantification of colocalization between RFP-tagged fibrillarin and NSD2 WT or mutants by median PCC per biological replicate between NSD2 and fibrillarin signals across three independent experiments (n = 3; P values derived from a Holm–Bonferroni-adjusted two-sided unpaired t-test compared to WT sequence; K125A = 0.0730, W236A = 0.0042, F266A = 0.0250, H762R = 0.0071, H762Y = 0.0071, W894A = 0.0026 and Y1099A = 0.3800). For each experiment, PCC per nucleus was measured across 16 fields of view. c, Assessing domain cooperativity by treating NSD2–GFP point mutants with DMSO control, 5 μM UNC7145 or 5 μM UNC6934 and measuring colocalization by PCC (n = 5 independent experiments; significance was assessed as P < 0.05 by Holm–Bonferroni-adjusted two-sided unpaired t-test compared to DMSO for each mutant; WT: UNC7145, P = 0.840 (NS) and UNC6934, *P = 0.012; W236A: UNC7145, P = 1 (NS) and UNC6934, P = 1 (NS); H762R: UNC7145, P = 0.33 (NS) and UNC6934, *P=0.034; W894A: UNC7145, P = 0.88 (NS) and UNC6934, *P = 0.012. The mean±s.d. is shown as a single black point with error bars. d, Computational prediction of NoLSs in NSD2 using the NoD algorithm38. e, Representative fluorescent images of cells expressing GFP tagged with putative NoLSs from NoD; scale bar, 15μm. Experiments were repeated on three separate occasions with similar results observed.
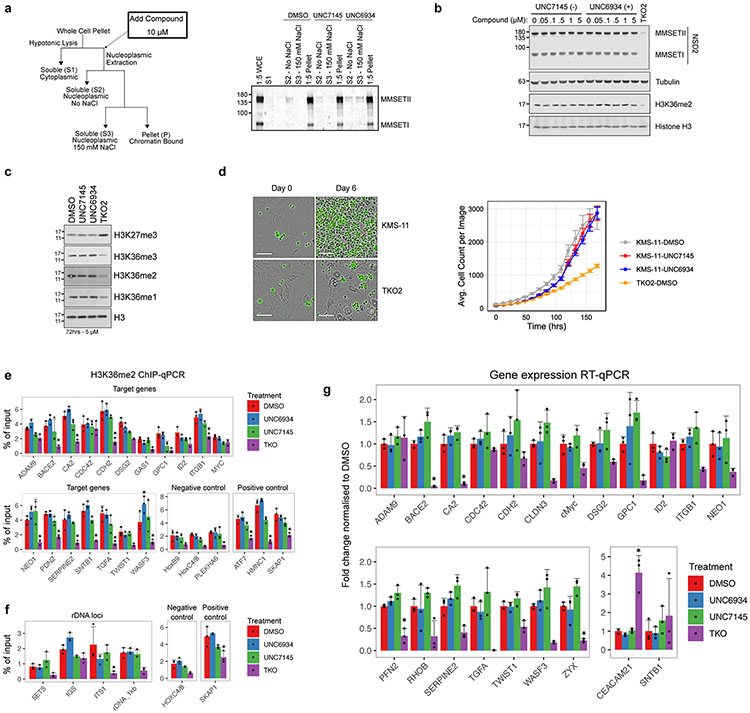
We next used UNC6934 to test the cooperativity of the NSD2 reader domains toward nucleolar localization. To do so, we treated cells transfected with RFP–fibrillarin and GFP-tagged NSD2 (WT, W236A, H762R or W894A) for 4 h with 5 μM UNC6934 or UNC7145. In cells expressing WT NSD2–GFP, we observed an increase in nucleolar signal following treatment with UNC6934. Importantly, while the PWWP1 aromatic cage mutant (W326A) had a higher baseline nucleolar localization than WT, no further increase was observed following UNC6934 treatment, again supporting PWWP1-dependent activity of the probe (Fig. 6c). However, in cells expressing the PHD2 and PWWP2 mutants, we observed an additive effect with UNC6934 treatment. In addition to higher baseline nucleolar localization due to their respective mutations, there was a further increase in nucleolar colocalization following UNC6934 treatment compared to both the DMSO control and the negative control UNC7145. These observations support a model in which NSD2 reader domains act cooperatively in recruiting NSD2 to chromatin and preventing nucleolar sequestration. Antagonizing the interaction between NSD2-PWWP1 and H3K36me2 may therefore not be sufficient to fully disengage fl-NSD2 from chromatin. Indeed, we only observed a modest release of fl-NSD2 from chromatin following treatment with UNC6934 in cell fractionation experiments as well as no changes in global H3K36 methylation or the proliferation of KMS-11 t(4; 14) MM cells grown on bone marrow stroma (Extended Data Fig. 9a-d). Additionally, we did not observe changes in loci-specific H3K36me2 levels or mRNA levels of NSD2 target genes, such as adhesion genes6,27,28 in response to UNC6934 (Extended Data Fig. 9e-g).
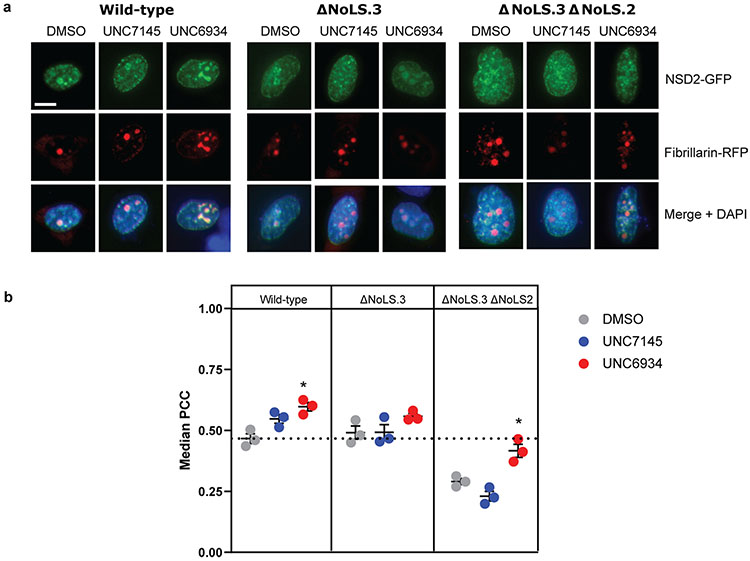
To further define the features of NSD2 that drive its nucleolar targeting, we used nucleolar localization sequence detector (NoD)29 to computationally predict putative nucleolar localization sequences (NoLSs) within NSD2 (Fig. 6d). Of the three NoLSs predicted with high confidence, we found that two were arginine-rich sequences within the C terminus that could robustly target GFP to nucleoli (Fig. 6e). Dual deletion of NoLS2 and NoLS3 in the context of fl-NSD2–GFP drastically reduced nucleolar localization (Extended Data Fig. 10). These results suggest a competitive situation between chromatin reader domains and NoLSs, and support a model in which perturbation of NSD2 chromatin-binding modules enables the activity of C-terminal NoLSs to dominate, leading to nucleolar accumulation.
Discussion
Here, we describe the development of UNC6934, a chemical probe targeting NSD2, a potent and well-characterized driver of both hematological malignancies and solid tumors. UNC6934 follows the recently described BI-9321, which targets the closely related PWWP1 domain of NSD3 (ref. 18). UNC6934 and BI-9321 are chemically distinct and selective, establishing PWWP domains as tractable targets for future chemical biology and drug discovery efforts.
Importantly, UNC6934 satisfies stringent criteria for high-quality chemical probes as fit-for-purpose research tools30-32, including <100 nM in vitro potency (Kd of 91 ± 8 nM by SPR; IC50 of 104 ± 13 nM by AlphaScreen) and significant cellular activity at 1 μM (IC50 = 1.23 ± 0.25 μM by NanoBRET PPI assay). Additionally, we found no significant off-targets by chemical proteomics and in vitro screening of functionally relevant proteins, including a large number of human PWWP domains, methyltransferases and membrane proteins. Further demonstration of cellular activity and specific target engagement is evident from the robust changes in endogenous NSD2 localization in response to PWWP1 antagonism by UNC6934. We also show limited cytotoxicity of UNC6934 and its negative control counterpart UNC7145, signifying their suitability for cell biology experiments exploring the function of the NSD2-PWWP1 reader domain.
Nucleoli are dynamic membrane-less nuclear structures that act as the site of ribosome transcription and preassembly and also as integral organizational hubs in the regulation of many non-canonical functions33. It is now widely appreciated that the shuttling of proteins between the nucleolus and nucleoplasm is a critical feature of nuclear biology, regulating stress responses, DNA repair, recombination and transcription33-35. Here, we define active NoLSs in the NSD2 C terminus, which likely drive nucleolar sequestration of NSD2 in response to modulation of its chromatin-binding domains. Altering the balance of nucleoplasmic versus nucleolar NSD2 through PWWP1 antagonism by UNC6934 did not have a significant effect on ribosome transcription or global levels of H3K36me2, suggesting instead that these features may provide a mechanism to rapidly tune the subnuclear localization of NSD2 in response to stimuli. Supporting this idea, a recent report showed that epigenetic proteins, including NSD2, are sequestered within the nucleolus in response to heat shock stress as a mechanism for subsequent rapid recovery and epigenome maintenance36. Given our observations of a steady-state pool of nucleolar NSD2, the question remains how balance and control of nucleolar–nucleoplasmic NSD2 levels may influence function of the methyltransferase in normal and diseased cells. Cytoplasmic localization of an NSD2 variant lacking PWWP1 and the first three PHD domains was also reported14, suggesting that the subcellular compartmentalization of NSD2 is fine-tuned by its reader domains, which could be achieved by masking subcellular localization sequences or by engagement of subcellular-specific substrates.
Our data highlight the multivalent nature of NSD2 recruitment to chromatin, whereby chromatin reader domains and DNA-binding interfaces act cooperatively to coordinate its activity on chromatin. These findings highlight the utility of UNC6934 as a tool to interrogate the contributions of NSD2-PWWP1 in this interplay. Finally, because of its role in MM and other cancers, NSD2 has long been a drug target of interest, but despite much community effort, there is no selective, cell-active inhibitor of its catalytic activity. UNC6934 provides a clear starting point for the development of bifunctional molecules, like proteolysis-targeting chimeras (PROTACs), to induce proteasomal degradation of NSD2 and antagonize its function in disease.
Methods
Expression and purification of biotinylated NSD2-PWWP1.
Construct and expression.
A DNA fragment encoding human NSD2 (residues 208–368) was amplified by PCR and subcloned into p28BIOH-LIC vector downstream of an AviTag and upstream of a poly-histidine coding region. Following transformation into Escherichia coli BL21(DE3), cells were amplified at 37 °C by inoculating Terrific Broth with overnight culture, both supplemented with 50 μg ml−1 kanamycin and 35 μg ml−1 chloramphenicol. When the optical density at 600 nm (OD600) of the culture reached 0.8–1.5, the temperature was lowered to 16 °C, the target protein was overexpressed by inducing cells with 0.5 mM isopropyl-1-thio-d-galactopyranoside (IPTG), and d-biotin was added at 10 μg ml−1 final concentration and incubated overnight before being collected (7,000 r.p.m. for 10 min at 4 °C) using a Beckman Coulter centrifuge.
Cell collection and lysis.
Collected cells were resuspended in 20 mM Tris-HCl, pH 7.5, 500 mM NaCl, 5 mM imidazole and 5% glycerol and 1× protease inhibitor cocktail (100× protease inhibitor stock in 70% ethanol (0.25 mg ml−1 aprotinin, 0.25 mg ml−1 leupeptin, 0.25 mg ml−1 pepstatin A and 0.25 mg ml−1 E-64) or Pierce Protease Inhibitor Mini Tablets, EDTA-free. The cells were lysed chemically by rotating 30 min with 0.5% CHAPS, 1 mM DTT, 1 mM PMSF and 15 μl of benzonase nuclease (in-house) followed by sonication at a frequency of 7 Hz (5 s on/7 s off) for 5 min (Sonicator 3000, Misoni). The crude extract was clarified by high-speed centrifugation (60 min at 36,000g at 4 °C) in a Beckman Coulter centrifuge.
Purification.
The clarified lysate was then loaded onto an open column containing preequilibrated Ni2+-nitrilotriacetate (Ni-NTA; Qiagen). The column was washed with 20 mM Tris-HCl, pH 7.5, 500 mM NaCl, 5% glycerol and 5 mM imidazole and then with 1 mM d-biotin in PBS followed by 20 mM Tris-HCl, pH 7.5, 500 mM NaCl, 5% glycerol and 20 mM imidazole. Finally, the protein was eluted by running 20 mM Tris-HCl, pH 7.5, 500 mM NaCl, 5% glycerol and 250 mM imidazole. The eluted protein was then supplemented with 1 mM TCEP and concentrated to be further purified by gel filtration on a HiLoad Superdex200 16/600 using an ÄKTA Pure (GE Healthcare). The gel filtration column was preequilibrated with 20 mM Tris-HCl, pH 8.0, 500 mM NaCl and 5% glycerol. The purity of the fractions was assessed on SDS–PAGE gels, and pure fractions (>95%) were pooled, concentrated and flash-frozen.
Surface plasmon resonance.
SPR was performed as described previously39 with modifications. Biotinylated NSD2-PWWP1 domain was immobilized on the flow cell of an SA sensor chip in 1× HBS-EP buffer (10 mM HEPES, pH 7.4, 150 mM NaCl, 3 mM EDTA and 0.05% Tween 20), yielding approximately 5,000 response units, according to manufacturer’s protocol, while another flow cell was left empty for reference subtraction. UNC6934 and UNC7145 were tested at 2 μM as the highest concentration, and a dilution factor of 0.33 was used to yield five concentrations. Experiments were performed using the same buffer with 0.5% DMSO in single-cycle kinetics with 60 s of contact time and a dissociation time of 120 s at a flow rate of 75 μl min−1.
Molecular docking.
The X-ray structure of the PWWP domain of NSD2 in complex with MR837 (PDB: 6UE6) was prepared with PrepWizard (Schrodinger) using the standard protocol, including the addition of hydrogens, the assignment of bond order, the assessment of the correct protonation states and a restrained minimization using the OPLS3 force field. Receptor grids were calculated at the centroid of the ligand with the option to dock ligands of similar size, and a hydrogen-bonding constraint with the backbone of A270 was defined. Over 6,000 commercially available chemical analogs of MR837 were prepared with LigPrep (Schrodinger). The resulting library was then docked using Glide SP (Schrodinger) with default settings. Also, the core docking option was turned on to allow only ligand poses that had their core aligned within 1.0 Å of the reference core (the cyclopropyl and the amide group of MR837). Only 448 compounds fitted and were ranked by Glide. Finally, after a visual inspection, 20 compounds were ordered. Optimization and structure–activity relationship (SAR) leading from MRT866 to UNC6934 was guided by free energy perturbation and will be presented elsewhere.
dCypher binding assays.
Semi-synthetic dNucs were from EpiCypher. Two phases of dCypher testing on the PerkinElmer AlphaScreen platform were performed as previously described39. In phase A, His-tagged human NSD2-PWWP1 (amino acids 208–368) was titrated to positive (H3K36me2) and negative (H3K36me0) control nucleosomes at a range of NaCl concentrations (50, 100, 150, 200 and 250 mM) to determine binding curves and identify salt preference, level of sensitivity, signal saturation and signal over background. In phase B, an optimal His-NSD2-PWWP1 concentration was used to probe the biotinylated nucleosome panel (me0-me1-me2-me3 at H3K4, H3K9, H3K27, H3K36 and H4K20). For all dCypher testing, 5 μl of His-tagged NSD2 (format/concentration as indicated) was incubated with 5 μl of biotinylated nucleosome (10 nM) for 30 min at 23 °C in salt-optimized assay buffer (150 mM NaCl, 20 mM Tris, pH 7.5, 0.01% bovine serum albumin (BSA), 0.01% NP-40 and 1 mM DTT) in a 384-well Optiplate (PerkinElmer, 6007299). A mixture of 10 μl of 5 μg ml−1 nickel-chelate acceptor beads (PerkinElmer) and 20 μg ml−1 streptavidin donor beads (PerkinElmer) was prepared in nucleosome bead buffer (as the assay buffer minus DTT) and added to each well. The plate was incubated at room temperature in subdued lighting for 60 min, and the AlphaScreen signal was measured on a PerkinElmer 2104 EnVision (680-nm laser excitation, 570-nm emission filter ± 50-nm bandwidth). Each binding interaction was performed in duplicate. His-tagged fl-NSD2 was from Reaction Biology. When present, SSD (concentration as noted) was added at the NSD2–nucleosome preincubation step. For antagonist testing, compound stocks were dissolved in DMSO and diluted to 400 μM in assay buffer (and further dilutions were prepared in assay buffer supplemented with 2% DMSO). Five microliters of compound and 5 μl of NSD2-PWWP1 (40 nM) or fl-NSD2 (10 nM) were combined and incubated for 15 min at 23 °C. Then, 5 μl of H3K36me2 dNuc (10 nM) in assay buffer was added and incubated for 30 min at 23 °C. Donor/acceptor beads and signal detection were as above. The apparent IC50 was determined by a ten-point data curve (in duplicate) to identify upper and lower plateaus, with values calculated for compounds inhibiting ≥50% of signal.
Selectivity assays.
Selectivity of UNC6934 for NSD2-PWWP1 over 15 other PWWP domains was tested using DSF as previously described40. In brief, the assay determined the effect of 100 μM UNC6934 and UNC7145 on the thermal stability of NSD2-PWWP1 and 15 PWWP domains from various proteins. All proteins tested in these selectivity experiments were used at a final concentration of 0.1 mg ml−1 in buffer (100 mM HEPES, pH 7.5, and 150 mM NaCl) containing 5× Sypro Orange (Invitrogen; 5,000× stock solution). The temperature scan curves were fitted to a Boltzmann sigmoid function, and the Tm values were obtained from the midpoint of the transition. More than a 2 °C increase in stability of the protein (ΔTm > 2 °C) was considered as a confirmation of binding. Selectivity against 33 methyltransferases was determined as previously described41. Selectivity against 90 central nervous system receptors, channels and transporters was conducted at the NIMH Psychoactive Drug Screening Program42.
Crystallography.
Protein expression and purification.
NSD2-PWWP1 (amino acids 211–350) was subcloned into the pET28-MHL vector. The recombinant protein was overexpressed in E. coli BL21(DE3)-V2R-pRARE2 induced with 0.25 mM IPTG at 16 °C overnight. The cell pellet was dissolved and further lysed in a buffer containing 20 mM Tris-HCl, pH 7.5, 500 mM NaCl and 5% glycerol. Supernatant was collected after centrifugation at 16,000g for 1 h. The supernatant was loaded on to an Ni-NTA column (GE Healthcare) preequilibrated with lysis buffer, washed with 20 mM Tris-HCl, pH 7.5, 500 mM NaCl and 25 mM imidazole and then eluted in 20 mM Tris-HCl, pH 7.5, 150 mM NaCl and 250 mM imidazole. Purified protein was treated with tobacco etch virus (TEV) proteases to remove the tag. The treated sample was further analyzed by affinity chromatography and gel filtration column (GE Healthcare). Finally, the pure protein was concentrated to 20 mg ml−1 in a buffer containing 20 mM Tris-HCl, pH 7.5, and 150 mM NaCl.
Crystallization.
The purified protein was mixed at a molar ratio of 1:3 with compound UNC6934 or MRT866 followed by incubation at room temperature for 30 min. The UNC6934 protein mixture precipitated quickly when adding the compound into the protein solution. After centrifugation at 13,000g for 10 min, the supernatant mixture was crystallized by the sitting-drop vapor-diffusion method at 18 °C by mixing 0.5 μl of the complex samples with 0.5 μl of the reservoir solution, and crystals appeared in a condition containing 1.6 M (NH4)2SO4, 0.01 M MgCl2 and 0.1 M HEPES (pH 7.5) after 2 d. The MRT866 protein mixture was clear and crystallized using the sitting-drop vapor-diffusion method at 18 °C and a crystallization buffer of 25% P3350, 0.2 M MgCl2 and 0.1 M HEPES (pH 7.5). Before data collection, both kinds of crystals were freshly soaked in the mother liquor complemented with 15–20% glycerol and flash-frozen in liquid nitrogen.
Data collection and structure determination.
The diffraction data for NSD2-PWWP1 + UNC6934 were collected at 100 K on the home source Rigaku FR-E superbright, and the data set was processed using the HKL-3000 suite43. The structure was solved by molecular replacement methods with PHASER (v2.8.2) using PDB entry 5VC8 as a search template. REFMAC (v5.8.0258) was used for structure refinement44. GRADE (v1.2.13) (http://www.globalphasing.com) was used to generate all restraints for compound refinement. The graphics program COOT45 (v0.8.9.2 EL(ccp4)) was used for model building and visualization. MOLPROBITY46 (v4.5) was used for structure validation. X-ray diffraction data for NSD2-PWWP1 + MRT866 were collected at 100 K on an APS beamline 19ID (Argonne National Laboratory). The data set was processed using the XDS suite47. The structure was solved by molecular replacement with MOLREP48 (v11.7.01). Geometry restraints for compound MRT866 refinement were prepared with AceDRG49 (v196). The graphics program COOT45 was used for model building and visualization. Restrained refinement and validation were conducted with BUSTER50 (v2.10.3) and MOLPROBITY46, respectively.
NSD2-PWWP1 DNA-binding and displacement assay.
Double-stranded DNA (dsDNA) (32 bp) was prepared by annealing 6-FAM-5′-TCTTCTGGTCCGGATGGTAGTTAAGTGTTGAG-3′ and 5′-CTCAACACTTAACTACCATCCGGACCAGAAGA-3′. The fluorescein-labeled dsDNA (5 nM) and NSD2-PWWP1 (500 nM) were incubated for 30 min in the presence of increasing concentrations of UNC6934, UNC7145 or unlabeled 32-bp dsDNA in 20 mM HEPES, pH 7.5, 20 mM NaCl, 1 mM DTT and 0.01% Triton X-100. After a 30-min incubation at 23 °C, the resulting fluorescence polarization signal was measured using a BioTek Synergy 4 (BioTek) instrument, and fluorescence polarization values were calculated as the percentage of DMSO control solution.
Plasmids.
For NanoBRET PPI assays, the histone H3.3–HaloTag fusion vector was from Promega, while the sequences for the NSD2 or NSD3-PWWP1 domain were cloned in frame into a pNLF1-C [CMV/Hygro] vector (Promega) using the In-Fusion HD Cloning kit (Takara). Point mutations were introduced using the Q5 Site-Directed Mutagenesis kit (New England BioLabs). For fluorescence microscopy, C-terminal GFPSpark-tagged NSD2 WT was from Sino Biological. NSD2 point mutants were generated using mutagenic primers with a Q5 Site-Directed Mutagenesis kit from New England BioLabs. pTagRFP-C1-fibrillarin (D. Sabatini, MIT) was from Addgene (plasmid 70649) and pEGFP-C1-fibrillarin was a gift from S. Huang, Northwestern University (Addgene, plasmid 26673, RRID: Addgene_26673)51.
Cell culture.
Cell lines were cultured according to standard aseptic mammalian tissue culture protocols in 5% CO2 at 37 °C with regular testing for mycoplasma contamination using the MycoAlert Mycoplasma Detection kit (Lonza). HCT116, HEK293, HT1080, MCF7 and U2OS cells were cultured in DMEM supplemented with 10% fetal bovine serum (FBS) (Wisent) and 100 U ml−1 penicillin and 100 μg ml−1 streptomycin (Wisent). OP9 bone marrow stromal cells, before proliferation assays, were cultured in α-MEM medium with GlutaMAX (Invitrogen) containing 20% FBS (Wisent), 55 μmol liter−1 β-mercaptoethanol (Invitrogen) and 100 U ml−1 penicillin and 100 μg ml−1 streptomycin (Wisent). KMS-11 parental and TKO2 cells, a kind gift from J. Licht, University of Florida, were cultured in RPMI (Wisent) supplemented with 10% FBS (Wisent) and 100 U ml−1 penicillin and 100 μg ml−1 streptomycin (Wisent).
NanoBRET PPI assay.
For NanoBRET PPI assays, U2OS cells plated in six-well plates were transfected with 1.8 μg of C-terminally tagged histone H3-HaloTag Fusion Vector DNA and 0.2 μg of C-terminally tagged NSD2-PWWP1–NanoLuc (WT or F266A) or NSD3-PWW1–NanoLuc using X-tremeGENE HP DNA Transfection Reagent (Sigma), following the manufacturer’s instructions. The next day, cells were trypsinized and resuspended in DMEM/F12 (no phenol red) supplemented with 4% FBS, penicillin (100 U ml−1) and streptomycin (100 μg ml−1) at a density of 1.1 × 10⁵ cells per ml. Cells were then divided into two pools. HaloTag NanoBRET 618 Ligand (Promega) was added to the first pool, and DMSO was added to the second pool, following the manufacturer’s instructions. Cells were plated in 96-well white plastic plates (Greiner) in the presence or absence of compounds for 20 h. Next, NanoBRET NanoGlo Substrate (Promega) solution was added to each well. Donor emission at 450 nm (filter, 450 nm/band-pass 80 nm) and acceptor emission at 618 nm (filter, 610 nm/long-pass) was measured within 10 min of substrate addition using a CLARIOstar microplate reader (Mandel). mBU values were calculated by subtracting the mean of 618/460 signal from cells without a NanoBRET 618 Ligand × 1,000 from the mean of 618/460 signal from cells with a NanoBRET 618 Ligand × 1,000.
Chemical proteomics.
To prepare whole-cell lysates, KMS-11 cells were washed two times with 1× PBS, lysed by resuspension in high-salt lysis buffer (20 mM HEPES, pH 7.5, 350 mM KCl, 1% Triton X-100 and a protease inhibitor cocktail containing aprotinin, leupeptin, pepstatin A and E-64) and passed through a 25-gauge needle five times followed by a 20-min incubation on ice. Cell lysates were cleared by centrifugation at 18,000g for 20 min at 4 °C. Cleared supernatant was diluted to 150 mM KCl and 0.4% Triton X-100 with 20 mM HEPES, pH 7.5, including fresh protease inhibitors. Sample protein concentrations were determined using a bicinchoninic acid (BCA) assay (Thermo Scientific). For each pulldown, 3 mg of cell lysate was preincubated with either DMSO control, 20 μM UNC7145 or 20 μM UNC6934 (final concentration) for 1 h with rotation at 4 °C. For each sample, 25 μl of M270 Dynabeads (Thermo Scientific) was prepared by washing three times in low-salt wash buffer (10 mM Tris-HCl pH 7.9, 100 mM NaCl and 0.1% NP-40), followed by incubation with 1 μM UNC7096 (biotinylated probe) for 1 h at 4 °C. The unbound biotinylated compound was removed by three washes with low-salt buffer. UNC7096-bound beads were then added to each sample followed by incubation for 1 h with rotation at 4 °C. Beads were then washed three times with low-salt wash buffer followed by two washes with 50 mM ammonium bicarbonate. On-bead digestion was performed by overnight incubation at 37 °C with 2 μg of MS-grade trypsin (Promega). The following morning, an additional 2 μg of trypsin was added to each sample and incubated at 37 °C for 4–6 h. The supernatant, containing digested peptides, was collected. Beads were then washed twice with water, and the supernatant was pooled with digested peptides. Samples were then acidified with formic acid to a final concentration of 2% and flash-frozen before drying under vacuum and running on a Thermo Scientific LTQ Orbitrap Velos.
Label-free quantitative mass spectrometry data analysis.
Raw MS/MS files were searched and quantified using MaxQuant version 1.6.7.0 using the UP000005640 UniProt human database (containing 20,605 protein entries, last modified 2019 November 5), with label-free quantification enabled and variable modifications oxidized methionine (+15.9949 Da) and deamidated asparagine (+0.9840) set. First search peptide tolerance and main search peptide tolerance were set at 30 and 6 ppm, respectively. For all other parameters, default settings were used.
Differential enrichment analysis was performed using the DEP package (v1.8.0) in R (v3.5.1). Briefly, samples were filtered for proteins identified in two of three replicates of at least one condition, normalized by variance-stabilizing normalization and tested for differential enrichment relative to pulldowns competed with DMSO vehicle control.
Fluorescence microscopy.
For immunofluorescence, cells were fixed with 2% formaldehyde in 1× PBS for 10 min at room temperature, followed by three washes in 1× PBS and permeabilization with 0.25% Triton X-100 in 1× PBS. Samples were then blocked with 1% BSA (Sigma) in 1× PBS and 0.1% Tween 20 (PBS-T) for 1 h at room temperature and incubated overnight with primary antibodies staining for NSD2 (Abcam, ab75359, RRID: AB_1310816; 1:500) and fibrillarin (Abcam, ab5821, RRID: AB_2105785; 1:1,000). Cells were washed three times with 1× PBS, followed by staining with fluorescent anti-rabbit (Alexa Fluor 647 conjugate, Cell Signaling Technologies, 4414, RRID: AB_10693544; 1:1,000) and anti-mouse (Alexa Fluor 488 conjugate, Cell Signaling Technologies, 4408, RRID: AB_10694704; 1:1,000) for 1 h at room temperature. Unbound secondary antibodies were removed by three 1× PBS washes, and the DNA was stained with Hoechst 33342 (Cell Signaling Technologies).
For microscopy of fluorescent fusion proteins, U2OS cells were seeded in 48-well plates 24 h before transfection with 0.125 μg of NSD2–GFP and 0.125 μg of fibrillarin–RFP using X-tremeGENE 360 following the manufacturer’s guidelines (Millipore Sigma). Cells were incubated an additional 24 h before compound treatment or direct fixation. Cells were fixed with 2% formaldehyde in 1× PBS for 10 min at room temperature. DNA was then stained with Hoechst 33342.
For confocal microscopy, images were acquired with a Quorum Spinning Disk Confocal Microscope equipped with 405-, 491-, 561- and 642-nm lasers (Zeiss) and processed with Volocity software (PerkinElmer) and ImageJ. For localization measurements of fluorescent fusion proteins, images were acquired with an EVOS FL Auto 2 Imaging System (Thermo Scientific Invitrogen). Colocalization measurements were quantified using a custom CellProfiler (v3.1.9)52 analysis pipeline.
Western blotting for global H3K36me2.
Cells were treated with compound for 72 h before collection by centrifugation at 300g for 5 min. Cells were washed in 1× PBS and resuspended in lysis buffer containing 20 mM Tris-HCl (pH 8.0), 150 mM NaCl, 1 mM EDTA, 10 mM MgCl2, 0.5% Triton X-100, 30 μg μl−1 benzonase and fresh protease inhibitors. After incubation for 3 min at room temperature, SDS was added to a final concentration of 1%. Samples were boiled in SDS loading buffer before western blotting using the NuPAGE electrophoresis and transfer system (Invitrogen) and near-infrared detection for H3K36me2 (Abcam, ab9049, RRID: AB_1280939; 1:2,000), histone H3 (Abcam, ab10799, RRID: AB_470239; 1:5,000), α-tubulin (DSHB, E7, RRID: AB_528499; 1:5,000) and NSD2 (Abcam, ab75359, RRID: AB_1310816; 1:1,000). Immunoblots were imaged on a Li-Cor Odyssey CLx and quantified in Image Studio Lite v5.2.5 (Li-Cor Biosciences).
Cell proliferation assessment.
Cells were seeded at a density of 50,000 cells in 12-well plates and incubated for 6–12 d, with two technical replicates per dose (3 μM, 5 μM and 10 μM) of UNC6934 or UNC7145. After 6 d, culture medium was refreshed by transferring one-fifth of the cell suspension into a new plate with 1× chemical probe concentration. Cell viability was measured by reading luminescence using an opaque-walled 96-well plate after a 20-min incubation with CellTiter-Glo 2.0 reagent (50 μl per well, mixed 1:1 with cell suspension). Luminescence was recorded using the CLARIOstar plate reader (BMG Labtech). Results from the cytotoxicity assay are expressed as percentage of induced cytotoxicity compared to DMSO-treated control; error bars indicate s.e.m.
Proliferation of KMS-11 cocultured with OP9 murine bone marrow stromal cells.
KMS-11 parental and TKO2 cells, harboring a knockout NSD2 expression from the t(4; 14) allele, were transduced with GFP lentivirus, and cells were sorted by FACS to obtain a homogenous GFP-expressing population. Cells were treated with compound at 5 μM for 10 d before seeding on a confluent monolayer of OP9 bone marrow stromal cells at a density of 2,000 cells per well of a 96-well plate. Proliferation was monitored by counting GFP-expressing cells over time using an IncuCyte live-cell imaging and analysis platform (Sartorius).
5-Ethyl uridine incorporation assay.
5-Ethyl uridine (5-EU) incorporation assays to measure changes in nucleolar transcription were performed as previously described53. To measure nucleolar transcription, cells were pretreated with either 5 μM UNC6934, UNC7145 or DMSO vehicle for 30 min and then fed 5-EU for an additional 45 min. Cells were fixed with 2% paraformaldehyde in PBS for 10 min at room temperature and then stained for nucleolin. Nascent RNA was labeled using the Click-iT RNA Alexa Fluor 594 imaging kit (Thermo Fisher Scientific), as per the supplier’s instructions. Images were acquired using a EVOS FL Auto 2 Imaging System (Thermo Scientific Invitrogen). Image preprocessing, masking and intensity measurements were done using a custom CellProfiler (v3.1.9)52 analysis pipeline.
Reverse transcription–quantitative PCR.
Total RNA was first isolated using the Monarch Total RNA Miniprep kit (New England BioLabs) following the manufacturer’s protocol. Isolated RNA was reverse transcribed using the iScript cDNA Synthesis kit (Bio-Rad). Reverse transcription–quantitative PCR (RT–qPCR) was performed using a CFX384 Touch Real-Time PCR Detection System (Bio-Rad) and PowerUp SYBR Green Master Mix (Thermo Fisher, 100029284). Relative transcript levels were determined by the ΔΔCt method and normalized to the housekeeping genes B2M and TBP, as indicated. Primer sequences are shown in Supplementary Table 3.
H3K36me2 chromatin immunoprecipitation–quantitative PCR.
KMS-11 cells were cultured at a starting density of 2 × 10⁵ cells per ml and treated with UNC6934 (5 μM), UNC7145 (10 μM) or DMSO for 72 h. TKO cells were cultured for 72 h at a starting density of 2 × 10⁵ cells per ml. H3K36me2 chromatin immunoprecipitation–quantitative PCR (ChIP–qPCR) was performed using the SimpleChIP Enzymatic Chromatin IP kit (Magnetic Beads, Cell Signal Technologies, 9003) according to the manufacturer’s protocol with minor modifications. Cells (1 × 10⁷) were fixed for 10 min at room temperature in 10 ml of 1% paraformaldehyde in PBS. One milliliter of 10× glycine was added, and cells were washed once in PBS and centrifuged, and the supernatant was removed. Cell pellets were snap-frozen and stored at −80 °C. All buffers were prepared ready for use according to manufacturer’s instructions and kept on ice. Cells (1 × 10⁷) were thawed and lysed in buffer A, washed once in buffer B and resuspended in 1 ml of buffer B before treatment with 0.5 μl of micrococcal nuclease for 10 min at 37 °C. Digests were stopped by adding 10 μl of 0.5 M EDTA. Digested nuclei were pelleted at 16,000g for 1 min at 4 °C, resuspended in 100 μl of ChIP buffer and transferred to 0.2-ml thin-walled PCR tubes (Axygen). Samples were sonicated using a Qsonica sonicator set to 100% amplitude for a total of 8 min of sonication time with 30-s on/20-s off intervals. Lysates were clarified by centrifugation at 9,400g for 10 min at 4 °C. Chromatin was diluted to 1 ml, and 50 μl was removed as 5% input and stored at −20 °C. One microliter of anti-H3K36me2 (Abcam, 176921) was added, and chromatin was incubated overnight rotating at 4 °C. Magnetic protein G beads (30 μl) were added, and samples were incubated for a further 3 h. Beads were pelleted using a magnetic rack, and three low-salt and one high-salt washes were performed for 5 min rotating at 4 °C. Bound chromatin was resuspended in 150 μl of elution buffer, and 110 μl of elution buffer was added to 5% input samples before both were incubated in a thermomixer at 65 °C for 30 min with shaking at 1,200 r.p.m. DNA was purified using a NucleoSpin Gel and PCR Clean-up kit (Macherey-Nagel) with buffer NTB according to the manufacturer’s instructions. Primers were designed to the gene body of target genes or to control regions known to exhibit high or low H3K36me2 in KMS-11 cells. Ten-microliter qPCR reactions were performed on ChIP and Input DNA using SSO Advanced SYBR green universal qPCR master mix (Bio-Rad) in a CFX384 Touch Real-Time PCR Detection System. The percentage of input was calculated in R using the equation percent of input = (2(Ct input − Ct ChIP)/(100/5)) × 100. A two-way analysis of variance (ANOVA) was performed with target gene and treatment as variables. The interaction effect was significant (P < 0.05), so Tukey post hoc testing was done with an adjusted P value threshold of 0.05 for target genes that were significantly different compared to DMSO control.
Cell fractionation.
KMS-11 cell pellets were washed in 1× PBS and resuspended in 200 μl of Hypotonic Buffer A (10 mM HEPES, pH 7.5, 10 mM KCl, 1.5 mM MgCl2, 0.3 M sucrose, 1 mM TCEP and protease inhibitors) per 1 × 10⁶ cells. The cell suspension was incubated on ice for 15 min followed by centrifugation at 1,300g for 5 min. The supernatant was collected and cleared by centrifugation to produce the cytoplasmic (S1) fraction. The pellet was washed in Buffer A and resuspended in an equal volume of Buffer B −No NaCl (3 mM EDTA, 3 mM EGTA, 1 mM TCEP and protease inhibitors) with/without 10 μM UNC6934 or UNC7145 negative control. Following incubation on ice for 30 min, the S2 fraction was centrifuged at 1,300g for 5 min. The supernatant was again collected, and the pellet was resuspended in an equal volume of Buffer B + NaCl (150 mM NaCl, 3 mM EDTA, 3 mM EGTA, 1 mM TCEP and protease inhibitors) with/without 10 μM UNC6934 or UNC7145 negative control. Following incubation on ice for 10 min, samples were centrifuged at 1,300g for 5 min with the supernatant yielding the salt-extracted nucleoplasmic (S3) fraction. The chromatin-bound or pellet fraction (P) was then resuspended in an equal volume of histone buffer (20 mM Tris-HCl, pH 7.5, 150 mM NaCl, 1 mM EDTA, 10 mM MgCl2, 1% Triton X-100, 1 mM TCEP, 30 μg μl−1 benzonase and protease inhibitors). Samples were boiled in SDS loading buffer before western blotting with antibodies to NSD2 (Abcam, ab75359, RRID: AB_1310816; 1:1,000) using the NuPAGE electrophoresis and transfer system (Invitrogen). Immunoblots were imaged on a Li-Cor Odyssey CLx and quantified in Image Studio Lite v5.2.5 (Li-Cor Biosciences).
Statistics.
Quantitative data are presented as mean ± s.d. or s.e.m., as specified in the figure legends. Statistical tests were performed using Prism 7 (GraphPad). For comparisons among multiple independent groups, one-way ANOVA with post hoc Tukey’s test was used. For imaging experiments, PCCs were calculated using built-in functions in CellProfiler (v3.1.9). Welch t-tests to compare median PCC values of independent biological replicates were calculated with R (v3.5.1). For chemical proteomics experiments, adjusted P values and enrichment scores were calculated using the DEP package (v1.8.0) for proteomic analysis in R (v3.5.1).
Extended Data
Extended Data Fig. 1 ∣. Triplicate SPR analysis of the binding of UNC6934 to NSD2-PWWP1.
Left: Representative sensorgram (green) with the kinetic fit (black dots). Right: Steady-state response (black circles) with the steady-state 1:1 binding model fitting (red dashed line).
Extended Data Fig. 2 ∣. Binding of UNC6934 and UNC7145 to wt-NSD2-PWWP1 and its F266A mutant.
The binding of both compounds to NSD2-PWWP1 F266A mutant in parallel to the wild-type (wt) was assessed by DSF in quadruplicate at 100 μM of each compound. Assays were performed in 100 mM HEPES, 150 mM NaCl, pH 7.5, as previously described (https://doi.org/10.1038/nprot.2007.321). Tm (°C) values are presented as mean±SD in the above table. High fluorescence background and weak transitions were observed in the presence of F266A mutant protein. The Tm of the F266A mutant (37.6 ± 0.1 °C) was much lower than the wt-NSD2-PWWP1 (45 ± 0.1 °C).
Extended Data Fig. 3 ∣. Selectivity profile.
Inhibitory activity of 1 and 10 μM (red and green resp.) UNC6934 (a) or UNC7145 (b) on a panel of 33 protein methyltransferases. Experiments run as three independent measurements. Constructs used for NSD1, NSD2 and NSD3 correspond to the catalytic domain (residues 1810-2120, 934-1241 and 1014-1323 respectively).
Extended Data Fig. 4 ∣. Nucleosome binding data obtained by AlphaScreen.
Binding profile of NSD2-PWWP1 against a panel of methylated designer nucleosomes (top). Results shown are two independent experiments showing mean ± sd. Binding of full-length NSD2 to unmethylated or H3K36me2 nucleosomes with and without an excess of salmon sperm DNA (bottom). n = 2 independent experiments.
Extended Data Fig. 5 ∣. NSD2-PWWP1 DNA binding and displacement assay.
A fluorescence polarization (FP)-based DNA displacement assay was used to test the ability of (a) UNC6934 and (b) UNC7145 to displace dsDNA from NSD2-PWWP1. Maximum FP signal was generated using 500 nM of NSD2-PWWP1 and 5 nM fluorescein-labelled dsDNA (32 bp) as described in materials and methods and was considered as 100%. Various concentrations of each compound up to 25 μM was tested for displacement of the dsDNA. UNC6934 and UNC7145 showed no significant effect on dsDNA binding to NSD2-PWWP1. In a complementary experiment, (c) binding of dsDNA to NSD2-PWWP1 in the presence of 20 μM (●) UNC6934, and 20 μM (■) UNC7145 or (▲) no compound was tested at various concentrations of NSD2-PWWP1 up to 2.5 μM. No significant difference in the pattern of dsDNA binding to NSD2-PWWP1 was observed in the presence of either compound, indicating UNC6934 and UNC7145 are not binding to the dsDNA binding site. In addition, (d) the unlabeled dsDNA (32 bp) was tested as a control for displacing the fluorescein-labelled dsDNA. Unlabeled dsDNA was able to compete with the labelled dsDNA for the dsDNA binding site with a displacement constant (Kdisp) of 300nM. The final DMSO concentration was 0.5% in all experiments. Experiments were performed in triplicate (n = 3).
Extended Data Fig. 6 ∣. Binding of UNC7096 to NSD2-PWWP1.
SPR sensorgram (solid green) is shown with the kinetic fit (black dots), and Kd values were generated from kinetic fitting; The steady state responses (black circles) were shown with the steady state 1:1 binding model fitting (red dashed line). NSD2-PWWP1 domain was immobilized on the flow cell of an CM5 sensor chip in 1x HBS-EP buffer, yielding ~4000 RU. Using buffer with 0.5% DMSO and single cycle kinetics with 60 s contact time and a dissociation time of 120 s at a flow rate of 75 μL/min.
Extended Data Fig. 7 ∣. Cytotoxicity Profiling of UNC6934 and UNC7145.
a, Effect of UNC6934 and UNC7145 on cell viability after a 72-hour treatment. Cells (HCT116, HEK293, HT1080, MCF7 and U2OS lines) were treated with indicated concentrations of either UNC7145 or UNC6934 in 96-well plates and nuclei counted by staining Vybrant™ DyeCycle™ Green Stain and imaging on an IncuCyte live-cell analysis system. Each point represents the average number of cells across fields relative to DMSO treated control (n = 3 independent experiments). Plots show each experiment as a point. Bars represent the mean relative cell number ± sem. b, Effect of UNC6934 and UNC7145 on cell viability after 6- and 12-days treatment. Cells (KMS-11, MM1S, RS4;11, TKO and UTMC2 lines) were treated with indicated concentrations of either UNC7145 or UNC6934 in 12-well plates and percentage of viable cells was measured by CellTiter-Glo® luminescent cell viability assay. Bar plots show the mean relative viability ± sem (n = 3 or 4 experiments).
Extended Data Fig. 8 ∣. Effect of UNC6934 & nucleolar perturbation on NSD2 localization and rRNA expression.
a, Confocal microscopy of U2OS cells treated for 4 hours with 5 μM UNC6934 or UNC7145 stained for NSD2 (green) and DNA (blue; Hoechst 33342), scale bar = 15μm. Experiments were repeated on three separate occasions with similar results. b, UNC6934 has no significant effect on pre-rRNA expression. 5-EU incorporation assay to measure nascent rRNA synthesis in cells pre-treated for 1 hour with 5 μM UNC6934 or UNC7145. On the left, violin and boxplots generated from three independent experiments show the log2 fluorescence intensity of 5-EU signal within nucleolar regions defined by staining with a nucleolin antibody per nucleus. On the right, representative microscopy images captured on an EVOS FL Auto 2 microscope from three independent experiments are shown (scale bar = 60μm). c, pre-rRNA expression levels measured by RT-qPCR show no major effect on ribosome transcription in response to 5 μM UNC6934 or UNC7145 at 2, 4, or 16 hours. Expression levels of pre-rRNA shown are relative to DMSO control and normalized to the beta-2-microglobulin housekeeping gene. Each time point represents an independent experiment with four technical replicates. Data shown as mean ± sd. Included in each time point is a control treatment known to disrupt rRNA expression51,55,56, controls include at 2 hours - 250 nM actinomycin D, at 4 hours - 1 μM doxorubicin, and at 16 hours - glucose starvation. Primer sequences are shown in Supplementary Table 3. d, Nucleolar perturbation alters the localization of NSD2. Representative confocal microscopy images of NSD2 and fibrillarin staining in U2OS cells treated for four hours with DMSO control, 50 nM actinomycin D, or 1 μM doxorubicin (scale bar = 15μm). Experiment was repeated on three separate occasions as quantified in e, Quantification of co-localization between NSD2 and the nucleolar marker fibrillarin as determined by Pearson correlation coefficient (PCC). The median Pearson Correlation Coefficient is shown for three independent biological replicates (n = 3). The mean ± sd is shown as a single black point with error bars.
Extended Data Fig. 9 ∣. Effect of UNC6934 on KMS11 t(4;14) multiple myeloma cell line.
a, Cellular fractionation experiments in KMS-11 cells show increased displacement of NSD2 from chromatin in the S3 fraction containing 150 mM NaCl relative to DMSO or UNC7145 treated cell lysates. On the left, a schematic of the fractionation protocol. On the right, western blot analysis of NSD2 in each fraction. 1:5 indicates a fifth of the sample was run on the SDS-PAGE relative to other samples. Experiment was repeated on two separate occasions with similar results. b, Western blot analysis of global H3K36me2 levels in KSM-11 cells treated for 72 hours with several doses of either UNC7145 or UNC6934 shows no significant change in response to compound. A well-characterized isogenic line harboring a deletion of exon 7 in the mutated KMS-11 NSD2 allele is included as a control (TKO2). Experiment was repeated on two separate occasions with similar results. c, Western blot analysis of global H3K36me1, H3K36me2, H3K36me3 and H3K27me3 levels in KSM-11 cells treated for 72 hours with 5 μM of UNC6934. Histone H3 is included as a loading control. Experiment was repeated on two separate occasions with similar results. d, UNC6934 does not affect the proliferation of KMS-11 cells on bone marrow stroma in vitro. Stable GFP expressing KMS-11 and isogenic TKO lines were pre-treated with 5 μM of either UNC7145 or UNC6934 for 10 days prior to plating on a confluent layer of the OP9 murine bone stromal cell line. Proliferation was monitored by measuring GFP+ cells over the course of seven days on an IncuCyte live cell analysis system. Representative images are shown on left (scale bar = 90μm). On the right, the average cell count per image is shown for two independent experiments, each with at least six technical replicates. Data shown as mean ± sd. e, Impact of compound treatment on H3K36me2 in KMS-11 cells. H3K36me2 ChIP-qPCR is shown at selected NSD2 target genes and (f) rDNA loci and positive and negative control regions. Each color represents a different treatment or cell type. KMS-11 cells were treated with DMSO (red bars), 5 μM UNC6934 (blue bars), or 5 μM UNC7145 (green bars). NSD2 translocated allele knockout (TKO, purple bars) control cells are shown. Each bar represents the mean percentage input of three independent samples (n = 3) and error bars indicate standard deviation. Target genes that are significantly different compared to DMSO control are indicated (*, Two-way ANOVA with Tukey post-hoc test adjusted P < 0.05; specific P values are as follows: ChIP-qPCR target genes- BACE2 P = 0.002373; CA2 P = 4.01e-06; CDH2 P = 3.31e-09; ITGB1 P = 0.008311; NEO1 P = 0.000298; PDN2 P = 0.000139; SERPINE2 P = 0.000110; SNTB1 P = 1.03e-08; TGFA P=6.85e-09; WASF3-(UNC6934) P = 0.037971; WASF3-(TKO) P = 0.004125; ATF7 P = 0.000929; HMNC1 P=7.80e-13 SKAP1 P = 0.000110. rDNA loci target genes-ITS1 P = 0.00126; SKAP1 P = 5.92e-06). g, UNC6934 has no significant effect on mRNA levels of NSD2 targets. mRNA levels measured by RT-qPCR show no significant effects on transcription of selected NSD2 targets in response to compound treatment. KMS-11 cells were treated for 72 hours with 5 μM UNC6934 or UNC7145. NSD2 translocated allele knockout (TKO) cells were cultured for 72 hours and were used as control. Transcription levels shown are relative to DMSO control and normalized to the TATA-box-binding protein housekeeping gene. Each bar represents the mean value of three independent samples (n = 3) and error bars indicate standard error. Target genes that are significantly different compared to DMSO control are indicated (*, One-way ANOVA with Tukey post-hoc test adjusted P<0.05; specific P values are as follows: RT-qPCR target genes- BACE2 P = 0.007717; CA2 P = 0.007717; PNF2 P = 0.007717; CEACAM21 P = 0.007182; ZYX P = 0.028332).
Extended Data Fig. 10 ∣. Deletion of the Nucleolar Localization Sequences significantly reduces NSD2 nucleolar localization driven by UNC6934.
a, Representative confocal microscopy of U2OS cells co-expressing GFP-tagged NSD2 wild-type/mutants and RFP-tagged fibrillarin (scale bar = 10 μm). Transfected cells were treated for four hours with DMSO control, 5 μM UNC6934 or 5 μM UNC7145 and co-localization was measure by Pearson correlation coefficient (PCC). b, Quantification of co-localization between RFP-tagged fibrillarin and NSD2 wild-type or mutants by median PCC per biological replicate between NSD2 and fibrillarin signal across three independent experiments (n = 3; P-values derived from a two-way ANOVA to DMSO control for each panel are indicated as *P = 0.022). For each experiment, PCC/nucleus was measured across ten fields of view. Data shown as mean ± sd.
Supplementary Material
Acknowledgements
The Structural Genomics Consortium is a registered charity (no. 1097737) that receives funds from AbbVie, Bayer AG, Boehringer Ingelheim, Canada Foundation for Innovation, Eshelman Institute for Innovation, Genentech, Genome Canada through Ontario Genomics Institute (OGI-196), EU/EFPIA/OICR/McGill/KTH/Diamond Innovative Medicines Initiative 2 Joint Undertaking (EUbOPEN grant 875510), Janssen, Merck KGaA (also known as EMD in Canada and the United State), Merck & Co (also known as MSD outside Canada and the United States), Pfizer, Takeda and Wellcome (106169/ZZ14/Z). We acknowledge the Natural Sciences and Engineering Research Council of Canada (NSERC) for a postdoctoral fellowship awarded to D.D. This work was supported by the National Cancer Institute, NIH (grant R01CA242305) to L.I.J. M.S. gratefully acknowledges NSERC (grant RGPIN-2019-04416). Research in EpiCypher was supported by NIH grants R44GM117683 and R44GM116584. This work was supported by Cancer Research Society operating grant (25418) to D.B.-L. We thank T. Hajian for purifying proteins and L. Halabelian for providing fluorescein-labeled dsDNA. We thank the University of North Carolina’s Department of Chemistry Mass Spectrometry Core Laboratory, especially D. Wallace, for their assistance with MS analysis. The Mass Spectrometry Core Laboratory is supported by the National Science Foundation under grant number CHE-1726291. Research reported in this publication was supported, in part, with funding by the University of North Carolina’s School of Medicine Office of Research. We thank F. Potjewyd for reviewing the primary synthesis data supporting this manuscript. Receptor-, channel- and transporter-binding profiles were generously provided by the National Institute of Mental Health’s Psychoactive Drug Screening Program, contract number HHSN-271-2018-00023-C (NIMH PDSP). The NIMH PDSP is directed by B.L. Roth at the University of North Carolina at Chapel Hill and Project Officer J. Driscoll at NIMH, Bethesda MD, USA. For experimental details, please refer to the PDSP web site at https://pdsp.unc.edu/ims/investigator/web/.
Footnotes
Competing interests
M.R.M., I.K.P., N.W.H., M.J.M., M.A.C. and M.-C.K. are employees of EpiCypher, a commercial developer and supplier of reagents and platforms used in this study: recombinant semi-synthetic dNucs and the dCypher binding assay. The remaining authors declare no competing interests.
Extended data is available for this paper at https://doi.org/10.1038/s41589-021-00898-0.
Supplementary information The online version contains supplementary material available at https://doi.org/10.1038/s41589-021-00898-0.
Online content
Any methods, additional references, Nature Research reporting summaries, source data, extended data, supplementary information, acknowledgements, peer review information; details of author contributions and competing interests; and statements of data and code availability are available at https://doi.org/10.1038/s41589-021-00898-0.
Reporting Summary. Further information on research design is available in the Nature Research Reporting Summary linked to this article.
Data availability
The MS proteomics data have been deposited to the ProteomeXchange Consortium via the PRIDE54 partner repository with the data set identifier PXD017641. Additionally, the code used to analyze the proteomics data has been posted to Zenodo at https://doi.org/10.5281/zenodo.5153406. The structures of NSD2-PWWP1 in complex with MRT866 and UNC6934 were deposited to the PDB with accession numbers 7MDN and 6XCG respectively. Source data are provided with this paper.
References
- 1.Kuo AJ et al. NSD2 links dimethylation of histone H3 at lysine 36 to oncogenic programming. Mol. Cell 44, 609–620 (2011). [DOI] [PMC free article] [PubMed] [Google Scholar]
- 2.Bennett RL, Swaroop A, Troche C & Licht JD The role of nuclear receptor-binding SET domain family histone lysine methyltransferases in cancer. Cold Spring Harb. Perspect. Med 7, a026708 (2017). [DOI] [PMC free article] [PubMed] [Google Scholar]
- 3.Keats JJ et al. In multiple myeloma, t(4;14)(p16;q32) is an adverse prognostic factor irrespective of FGFR3 expression. Blood 101, 1520–1529 (2003). [DOI] [PubMed] [Google Scholar]
- 4.Mirabella F et al. MMSET is the key molecular target in t(4;14) myeloma. Blood Cancer J 3, e114 (2013). [DOI] [PMC free article] [PubMed] [Google Scholar]
- 5.Jaffe JD et al. Global chromatin profiling reveals NSD2 mutations in pediatric acute lymphoblastic leukemia. Nat. Genet 45, 1386–1391 (2013). [DOI] [PMC free article] [PubMed] [Google Scholar]
- 6.Swaroop A et al. An activating mutation of the NSD2 histone methyltransferase drives oncogenic reprogramming in acute lymphocytic leukemia. Oncogene 38, 671–686 (2019). [DOI] [PMC free article] [PubMed] [Google Scholar]
- 7.Oyer JA et al. Point mutation E1099K in MMSET/NSD2 enhances its methyltranferase activity and leads to altered global chromatin methylation in lymphoid malignancies. Leukemia 28, 198–201 (2014). [DOI] [PMC free article] [PubMed] [Google Scholar]
- 8.Sankaran SM, Wilkinson AW, Elias JE & Gozani O A PWWP domain of histone-lysine N-methyltransferase NSD2 binds to dimethylated Lys-36 of histone H3 and regulates NSD2 function at chromatin. J. Biol. Chem 291, 8465–8474 (2016). [DOI] [PMC free article] [PubMed] [Google Scholar]
- 9.Weinberg DN et al. The histone mark H3K36me2 recruits DNMT3A and shapes the intergenic DNA methylation landscape. Nature 573, 281–286 (2019). [DOI] [PMC free article] [PubMed] [Google Scholar]
- 10.Shah MY et al. MMSET/WHSC1 enhances DNA damage repair leading to an increase in resistance to chemotherapeutic agents. Oncogene 35, 5905–5915 (2016). [DOI] [PMC free article] [PubMed] [Google Scholar]
- 11.Zhang J et al. PTEN methylation by NSD2 controls cellular sensitivity to DNA damage. Cancer Discov. 9, 1306–1323 (2019). [DOI] [PMC free article] [PubMed] [Google Scholar]
- 12.Qin S & Min J Structure and function of the nucleosome-binding PWWP domain. Trends Biochem. Sci 39, 536–547 (2014). [DOI] [PubMed] [Google Scholar]
- 13.Vermeulen M et al. Quantitative interaction proteomics and genome-wide profiling of epigenetic histone marks and their readers. Cell 142, 967–980 (2010). [DOI] [PubMed] [Google Scholar]
- 14.Huang Z et al. NSD2 is recruited through its PHD domain to oncogenic gene loci to drive multiple myeloma. Cancer Res. 73, 6277–6288 (2013). [DOI] [PubMed] [Google Scholar]
- 15.Keats JJ et al. Overexpression of transcripts originating from the MMSET locus characterizes all t(4;14)(p16;q32)-positive multiple myeloma patients. Blood 105, 4060–4069 (2005). [DOI] [PMC free article] [PubMed] [Google Scholar]
- 16.Marango J et al. The MMSET protein is a histone methyltransferase with characteristics of a transcriptional corepressor. Blood 111, 3145–3154 (2008). [DOI] [PMC free article] [PubMed] [Google Scholar]
- 17.Huang H et al. Covalent inhibition of NSD1 histone methyltransferase. Nat. Chem. Biol 16, 1403–1410 (2020). [DOI] [PMC free article] [PubMed] [Google Scholar]
- 18.Böttcher J et al. Fragment-based discovery of a chemical probe for the PWWP1 domain of NSD3. Nat. Chem. Biol 15, 822–829 (2019). [DOI] [PubMed] [Google Scholar]
- 19.Freitas R Fde et al. Discovery of small-molecule antagonists of the PWWP domain of NSD2. J. Med. Chem 64, 1584–1592 (2021). [DOI] [PMC free article] [PubMed] [Google Scholar]
- 20.Li W et al. Molecular basis of nucleosomal H3K36 methylation by NSD methyltransferases. Nature 590, 498–503 (2021). [DOI] [PMC free article] [PubMed] [Google Scholar]
- 21.Machleidt T et al. NanoBRET—a novel BRET platform for the analysis of protein–protein interactions. ACS Chem. Biol 10, 1797–1804 (2015). [DOI] [PubMed] [Google Scholar]
- 22.Lambert J-P et al. Interactome rewiring following pharmacological targeting of BET bromodomains. Mol. Cell 73, 621–638 (2019). [DOI] [PMC free article] [PubMed] [Google Scholar]
- 23.James LI et al. Discovery of a chemical probe for the L3MBTL3 methyllysine reader domain. Nat. Chem. Biol 9, 184–191 (2013). [DOI] [PMC free article] [PubMed] [Google Scholar]
- 24.Andersen JS et al. Nucleolar proteome dynamics. Nature 433, 77–83 (2005). [DOI] [PubMed] [Google Scholar]
- 25.Halim VA et al. Doxorubicin-induced DNA damage causes extensive ubiquitination of ribosomal proteins associated with a decrease in protein translation. Mol. Cell Proteomics 17, 2297–2308 (2018). [DOI] [PMC free article] [PubMed] [Google Scholar]
- 26.Zhang Q et al. Structural mechanism of transcriptional regulator NSD3 recognition by the ET domain of BRD4. Structure 24, 1201–1208 (2016). [DOI] [PMC free article] [PubMed] [Google Scholar]
- 27.Brito JLR et al. MMSET deregulation affects cell cycle progression and adhesion regulons in t(4;14) myeloma plasma cells. Haematologica 94, 78–86 (2009). [DOI] [PMC free article] [PubMed] [Google Scholar]
- 28.Lauring J et al. The multiple myeloma associated MMSET gene contributes to cellular adhesion, clonogenic growth, and tumorigenicity. Blood 111, 856–864 (2008). [DOI] [PMC free article] [PubMed] [Google Scholar]
- 29.Scott MS, Boisvert F-M, McDowall MD, Lamond AI & Barton GJ Characterization and prediction of protein nucleolar localization sequences. Nucleic Acids Res. 38, 7388–7399 (2010). [DOI] [PMC free article] [PubMed] [Google Scholar]
- 30.Arrowsmith CH et al. The promise and peril of chemical probes. Nat. Chem. Biol 11, 536–541 (2015). [DOI] [PMC free article] [PubMed] [Google Scholar]
- 31.Frye SV The art of the chemical probe. Nat. Chem. Biol 6, 159–161 (2010). [DOI] [PubMed] [Google Scholar]
- 32.Blagg J & Workman P Choose and use your chemical probe wisely to explore cancer biology. Cancer Cell 32, 268–270 (2017). [DOI] [PMC free article] [PubMed] [Google Scholar]
- 33.Iarovaia OV et al. Nucleolus: a central hub for nuclear functions. Trends Cell Biol. 29, 647–659 (2019). [DOI] [PubMed] [Google Scholar]
- 34.Pederson T The nucleolus. Cold Spring Harb. Perspect. Biol 3, a000638 (2011). [DOI] [PMC free article] [PubMed] [Google Scholar]
- 35.Shaw PJ & Jordan EG The nucleolus. Annu. Rev. Cell Dev. Biol 11, 93–121 (1995). [DOI] [PubMed] [Google Scholar]
- 36.Azkanaz M et al. Protein quality control in the nucleolus safeguards recovery of epigenetic regulators after heat shock. eLife 8, e45205 (2019). [DOI] [PMC free article] [PubMed] [Google Scholar]
- 37.Zhang X et al. Proteome-wide identification of ubiquitin interactions using UbIA-MS. Nat. Protoc 13, 530–550 (2018). [DOI] [PubMed] [Google Scholar]
- 38.Scott MS, Troshin PV & Barton GJ NoD: a nucleolar localization sequence detector for eukaryotic and viral proteins. BMC Bioinformatics 12, 317 (2011). [DOI] [PMC free article] [PubMed] [Google Scholar]
- 39.Weinberg DN et al. The histone mark H3K36me2 recruits DNMT3A and shapes the intergenic DNA methylation landscape. Nature 573, 281–286 (2019). [DOI] [PMC free article] [PubMed] [Google Scholar]
- 40.Allali-Hassani A et al. Discovery of a chemical probe for PRDM9. Nat. Commun 10, 5759 (2019). [DOI] [PMC free article] [PubMed] [Google Scholar]
- 41.Scheer S et al. A chemical biology toolbox to study protein methyltransferases and epigenetic signaling. Nat. Commun 10, 19 (2019). [DOI] [PMC free article] [PubMed] [Google Scholar]
- 42.Besnard J et al. Automated design of ligands to polypharmacological profiles. Nature 492, 215–220 (2012). [DOI] [PMC free article] [PubMed] [Google Scholar]
- 43.Minor W, Cymborowski M, Otwinowski Z & Chruszcz M HKL-3000: the integration of data reduction and structure solution—from diffraction images to an initial model in minutes. Acta Crystallogr. D Biol. Crystallogr 62, 859–866 (2006). [DOI] [PubMed] [Google Scholar]
- 44.Murshudov GN, Vagin AA & Dodson EJ Refinement of macromolecular structures by the maximum-likelihood method. Acta Crystallogr. D Biol. Crystallogr 53, 240–255 (1997). [DOI] [PubMed] [Google Scholar]
- 45.Emsley P & Cowtan K Coot: model-building tools for molecular graphics. Acta Crystallogr. D Biol. Crystallogr 60, 2126–2132 (2004). [DOI] [PubMed] [Google Scholar]
- 46.Davis IW, Murray LW, Richardson JS & Richardson DC MOLPROBITY: structure validation and all-atom contact analysis for nucleic acids and their complexes. Nucleic Acids Res. 32, W615–W619 (2004). [DOI] [PMC free article] [PubMed] [Google Scholar]
- 47.Kabsch W XDS. Acta Crystallogr. D Biol. Crystallogr 66, 125–132 (2010). [DOI] [PMC free article] [PubMed] [Google Scholar]
- 48.Vagin A & Teplyakov A Molecular replacement with MOLREP. Acta Crystallogr. D Biol. Crystallogr 66, 22–25 (2010). [DOI] [PubMed] [Google Scholar]
- 49.Long F et al. AceDRG: a stereochemical description generator for ligands. Acta Crystallogr. D Struct. Biol 73, 112–122 (2017). [DOI] [PMC free article] [PubMed] [Google Scholar]
- 50.Smart OS et al. Exploiting structure similarity in refinement: automated NCS and target-structure restraints in BUSTER. Acta Crystallogr. D Biol. Crystallogr 68, 368–380 (2012). [DOI] [PMC free article] [PubMed] [Google Scholar]
- 51.Chen D & Huang S Nucleolar components involved in ribosome biogenesis cycle between the nucleolus and nucleoplasm in interphase cells. J. Cell Biol 153, 169–176 (2001). [DOI] [PMC free article] [PubMed] [Google Scholar]
- 52.McQuin C et al. CellProfiler 3.0: next-generation image processing for biology. PLoS Biol. 16, e2005970 (2018). [DOI] [PMC free article] [PubMed] [Google Scholar]
- 53.Yang L et al. Regulation of SirT1–nucleomethylin binding by rRNA coordinates ribosome biogenesis with nutrient availability. Mol. Cell. Biol 33, 3835–3848 (2013). [DOI] [PMC free article] [PubMed] [Google Scholar]
- 54.Deutsch EW et al. The ProteomeXchange consortium in 2017: supporting the cultural change in proteomics public data deposition. Nucleic Acids Res. 45, D1100–D1106 (2017). [DOI] [PMC free article] [PubMed] [Google Scholar]
- 55.Boulon S, Westman BJ, Hutten S, Boisvert F-M & Lamond AI The nucleolus under stress. Mol. Cell 40, 216–227 (2010). [DOI] [PMC free article] [PubMed] [Google Scholar]
- 56.Burger K et al. Chemotherapeutic drugs inhibit ribosome biogenesis at various levels. J. Biol. Chem 285, 12416–12425 (2010). [DOI] [PMC free article] [PubMed] [Google Scholar]
Associated Data
This section collects any data citations, data availability statements, or supplementary materials included in this article.
Supplementary Materials
Data Availability Statement
The MS proteomics data have been deposited to the ProteomeXchange Consortium via the PRIDE54 partner repository with the data set identifier PXD017641. Additionally, the code used to analyze the proteomics data has been posted to Zenodo at https://doi.org/10.5281/zenodo.5153406. The structures of NSD2-PWWP1 in complex with MRT866 and UNC6934 were deposited to the PDB with accession numbers 7MDN and 6XCG respectively. Source data are provided with this paper.


