Abstract
This cross-sectional study examines monthly blood donations from individuals aged 16 years and older to estimate the population with antibodies to SARS-CoV-2 from infection or vaccination.
By testing for both SARS-CoV-2 spike and nucleocapsid antibodies, seroprevalence studies can estimate the proportion of a population with antibodies from previous infection (nucleocapsid antibody or infection-induced seroprevalence) and from infection or vaccination (spike antibody or combined infection- and vaccine-induced seroprevalence). US seroprevalence from July 2020 to May 2021 based on blood donations was reported previously.1 This report includes monthly estimates through the conclusion of the study in December 2021.
Methods
Methods were previously described.1 Briefly, this repeated cross-sectional study included monthly blood donations from individuals aged 16 years and older from 66 study regions that included all 50 states; Washington, DC; and Puerto Rico. Specimens were tested for spike and nucleocapsid antibodies with total immunoglobulin assays (eMethods in the Supplement). Results were weighted to account for demographic differences between donors and the general population. Seroprevalence in December 2021 and changes between May and December 2021 were estimated by age, sex, race and ethnicity, and census region. (See Figure 1 legend for information on race and ethnicity.)
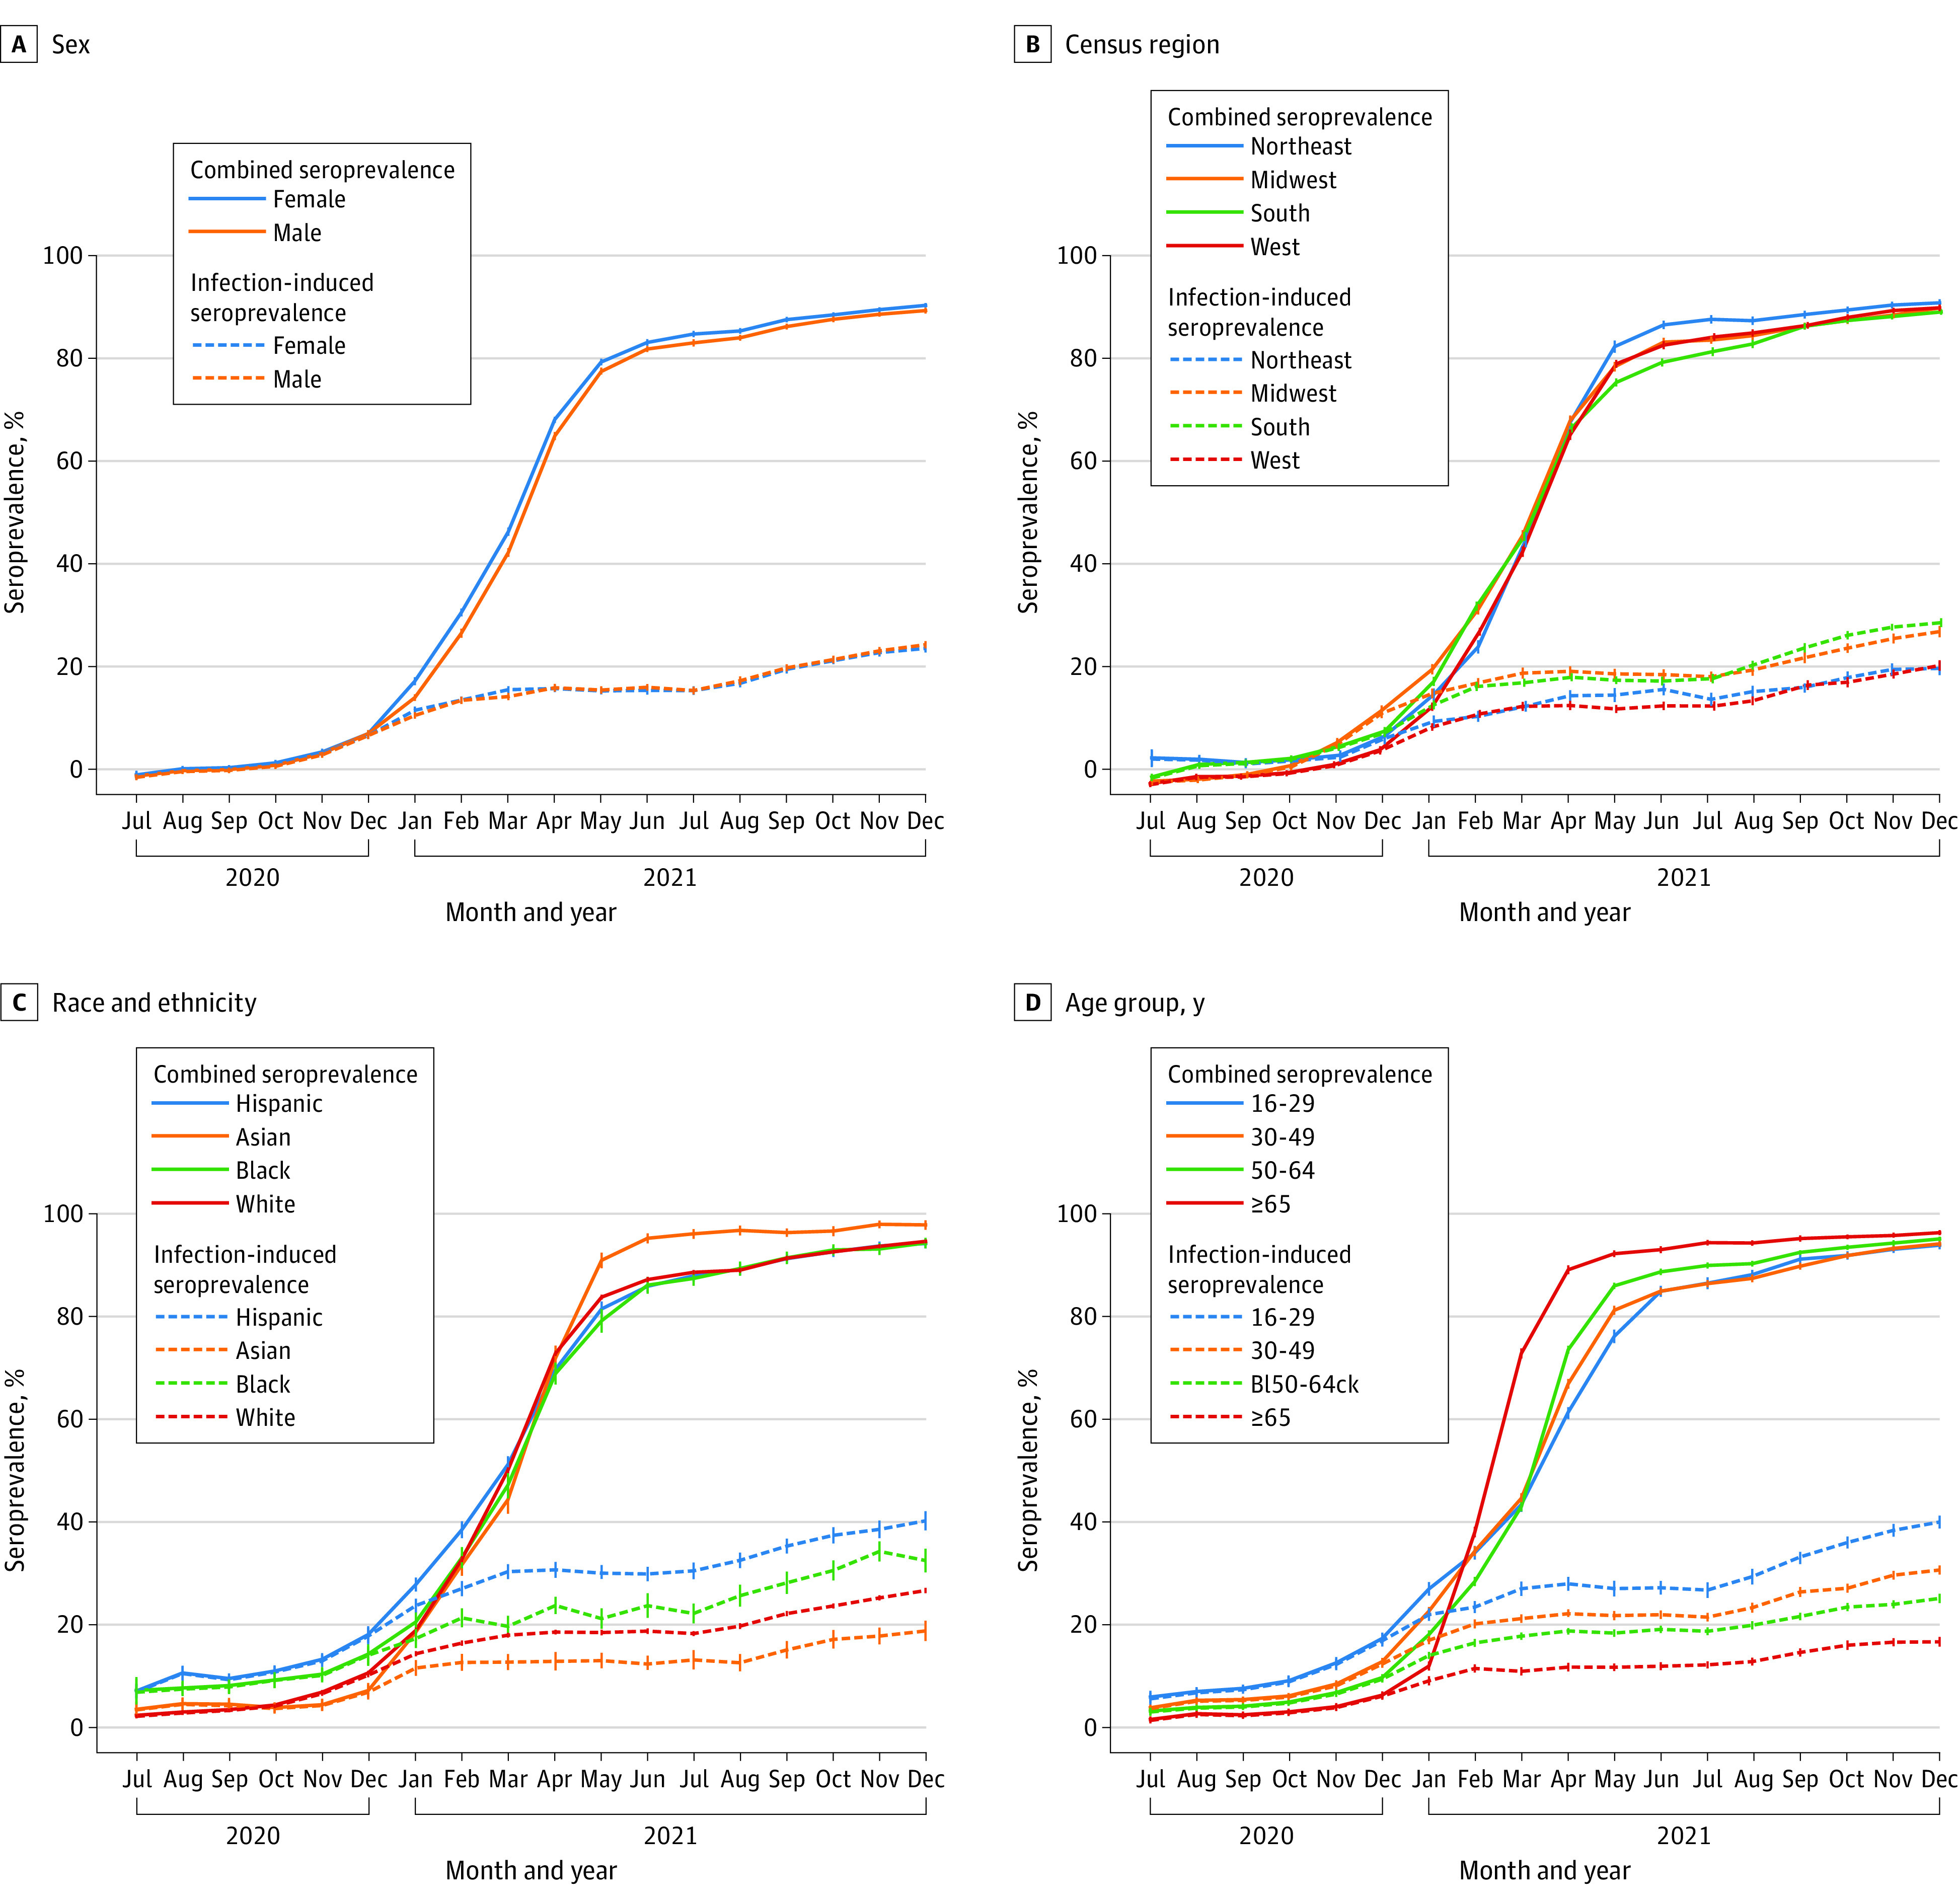
Figure 1. SARS-CoV-2 Seroprevalence by Census Region, Race and Ethnicity, Sex, and Age, US, July 2020-December 2021.

Blood donations were collected from a catchment area representing 69% of the US population in July 2020, increasing to 74% from October 2020 through December 2021. The solid lines represent the proportion of the population with antibodies from infection, vaccination, or both (antispike/combined seroprevalence). The dashed lines represent the proportion of the population with antibodies from infection (antinucleocapsid/infection-induced seroprevalence). Whiskers represent 95% CIs. Seroprevalence was estimated by race and ethnicity because infection and vaccination rates have been demonstrated to differ correspondingly. Blood donors self-identified race and ethnicity from 7 mutually exclusive categories: American Indian, Asian, Black, Hispanic, White, more than 1 race, and other. American Indian, more than 1 race, and other are not shown owing to small numbers. Of 2 475 061 blood donor specimens from donors residing in the study regions, 66 953 (2.7%) were excluded for missing race and ethnicity information and 16 (<0.1%) were excluded for missing data on sex or age. The x-axis tick marks represent the middle of each month.
Increases in infection-induced seroprevalence from January through December 2021 were compared with vaccination rates. Fully vaccinated was defined as receipt of at least 2 messenger RNA COVID-19 vaccine doses or at least 1 dose of Ad26.COV2.S (Janssen) according to data reported to the Centers for Disease Control and Prevention. The fully vaccinated rate was measured as of December 31, 2021, among adults aged 18 years or older residing in counties corresponding to each study region. Correlation between vaccination rates and increases in seroprevalence were assessed via linear regression. Analyses were conducted with R version 4.1.2. Significance was tested with a 2-sided t test on the regression slope coefficient, with P < .05 considered significant. This study was approved by institutional review boards of the University of California, San Francisco and Westat as non–human participants research.
Results
Between July 2020 and December 2021, among 2 408 093 included specimens, 1 210 270 (50.3%) were donated by women, 2 034 035 (84.5%) by non-Hispanic White donors, 293 234 (12.2%) by people aged 16 to 29 years, 512 600 (21.3%) by those aged 65 years or older, and 2 102 626 (87.3%) by those who had donated previously. From May through December 2021, the infection-induced seroprevalence increased from 20.2% (95% CI, 19.9%-20.6%) to 28.8% (95% CI, 28.4%-29.2%) and the combined seroprevalence from 83.3% (82.9%-83.7%) to 94.7% (95% CI, 94.5%-94.9%) (Figure 1). In December 2021, the infection-induced seroprevalence was highest in people aged 16 to 29 years (40.0% [95% CI, 38.9%-41.0%]), in non-Hispanic Black (32.5% [95% CI, 30.4%-34.6%]) and Hispanic (40.2% [95% CI, 38.6%-41.9%]) populations, and in people living in the South (33.5% [95% CI, 32.8%-34.1%]) and Midwest (31.7% [95% CI, 30.8%-32.6%]) (Figure 1). All demographic groups had a combined seroprevalence of 92.9% or more.
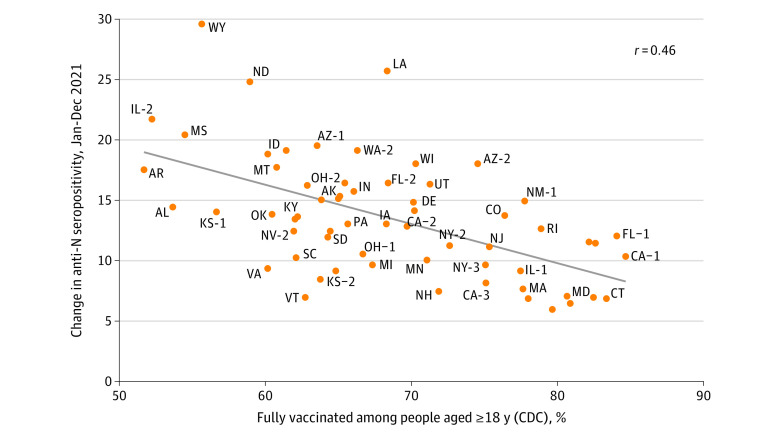
Higher vaccination rates correlated with a smaller increase in infection-induced seroprevalence (regression line slope = −0.32; P < .001) (Figure 2). During 2021, infection-induced seroprevalence increased by 10.64% (95% CI, 10.62%-10.66%) in study regions with greater than 80% rates of fully vaccinated populations, whereas in those with less than 60% fully vaccinated populations it increased by 19.84% (95% CI, 19.82%-19.86%).
Figure 2. Association Between Study Region December 2021 Vaccination Rate and Increase in Infection-Induced Seroprevalence During 2021.
Fully vaccinated rates were measured with vaccine data as reported to the Centers for Disease Control and Prevention (CDC). Fully vaccinated was defined according to CDC definitions (ie, receipt of ≥2 messenger RNA COVID-19 vaccine doses or ≥1 Ad26.COV2.S dose [Janssen]). The fully vaccinated rate was measured as of December 31, 2021, among adults aged 18 years or older residing in the counties corresponding to each study region. Methods to form the study regions and a map of the study regions have been published.1 Georgia and Hawaiʻi regions were removed because county of residence was missing for most records. The increase in seroprevalence was measured as the change in infection-induced seroprevalence (ie, the N antibody seroprevalence) per increase in vaccine percentage from January 2021 to December 2021 to estimate the number of infections that occurred after COVID-19 vaccination administration had begun. A regression line is displayed in gray (slope = −0.32; P < .001). The correlation coefficient was −0.46. N indicates nucleocapsid.
Discussion
In this study of US blood donations, the combined seroprevalence from infection or vaccination reached 94.7% by December 2021. Despite this, record levels of infection and reinfections were reported as the Omicron variant became predominant in early 2022.2 The high infection rates are likely related to increased transmissibility and enhanced immune escape mutations of the Omicron variant, along with waning protection from previous vaccination and infection.3,4,5 During 2021, the infection-induced seroprevalence increased more in regions with low vaccination rates compared with those with high ones. The ability of SARS-CoV-2 variants to cause widespread transmission in the setting of high seroprevalence illustrates the value of COVID-19 vaccines, including recommended booster doses, to maximize protection.
Study limitations include that seroprevalence in blood donors might not represent the seroprevalence in the general population, children were not included, and the association of lower vaccination rates and increases in seroprevalence does not prove causality and might be confounded by increased adherence to nonpharmaceutical interventions in study regions with higher vaccination rates.1
Section Editors: Jody W. Zylke, MD, Deputy Editor; Kristin Walter, MD, Associate Editor.
eMethods.
Additional Acknowledgments.
References
- 1.Jones JM, Stone M, Sulaeman H, et al. Estimated US infection- and vaccine-induced SARS-CoV-2 seroprevalence based on blood donations, July 2020-May 2021. JAMA. 2021;326(14):1400-1409. doi: 10.1001/jama.2021.15161 [DOI] [PMC free article] [PubMed] [Google Scholar]
- 2.Centers for Disease Control and Prevention . COVID data tracker. Accessed March 23, 2022. https://covid.cdc.gov/covid-data-tracker
- 3.Fan Y, Li X, Zhang L, Wan S, Zhang L, Zhou F. SARS-CoV-2 Omicron variant: recent progress and future perspectives. Signal Transduct Target Ther. 2022;7(1):141. doi: 10.1038/s41392-022-00997-x [DOI] [PMC free article] [PubMed] [Google Scholar]
- 4.Ferdinands JM, Rao S, Dixon BE, et al. Waning 2-dose and 3-dose effectiveness of mRNA vaccines against COVID-19–associated emergency department and urgent care encounters and hospitalizations among adults during periods of Delta and Omicron variant predominance—VISION Network, 10 states, August 2021-January 2022. MMWR Morb Mortal Wkly Rep. 2022;71(7):255-263. doi: 10.15585/mmwr.mm7107e2 [DOI] [PMC free article] [PubMed] [Google Scholar]
- 5.Hall V, Foulkes S, Insalata F, et al. ; SIREN Study Group . Protection against SARS-CoV-2 after Covid-19 vaccination and previous infection. N Engl J Med. 2022;386(13):1207-1220. doi: 10.1056/NEJMoa2118691 [DOI] [PMC free article] [PubMed] [Google Scholar]
Associated Data
This section collects any data citations, data availability statements, or supplementary materials included in this article.
Supplementary Materials
eMethods.
Additional Acknowledgments.


