SUMMARY
Down syndrome (DS) is one of the main genetic abnormalities of newborns. Therefore, prenatal diagnosis of this syndrome is of paramount importance to the family and the community. The microbiota system is important in early brain development. We tried to study and compare gut microbiota (GM) composition in pregnancies that resulted in DS neonates with pregnancies that resulted in healthy children. The study population consisted of 21 pregnant women having delivered DS newborns (group 1) and 22 pregnant women who had given birth to healthy newborns (group 2). The GM composition was determined and compared between the two groups. There were no significant age and gestational age differences between the two groups (p>0.005 both). Regarding GM analysis, microorganisms of the families Clostridiaceae and Pasteurellaceae were more abundant in the group of women having delivered DS neonates than the group of women having delivered healthy newborns (p<0.05). The results of our pilot study showed that the GM system might have a role in the pathophysiology of DS. The GM changes may be used in the prenatal diagnosis and prevention of this syndrome. Further studies are needed in this field.
Key words: Brain, Down syndrome, Microbiota, Pregnancy, Outcome, Screening
Introduction
Most neonatal deaths are due to genetic disorders. More than one-fourth of pediatric hospital admissions are due to these genetic disorders. So, detection and management of these risky pregnancies are important from the viewpoint of both the mother and the baby. Measuring maternal alpha-fetoprotein, human chorionic gonadotropin, unconjugated estriol and inhibin-A levels at 14-18 weeks of gestation (known as a quadruple screening test) may help in determining adverse pregnancy outcomes (Down syndrome [DS], neural tube defects, etc.) and advising further investigations (such as amniocentesis) and follow-up (1, 2). The human microbiome, i.e. trillions of bacteria that reside on or inside the body, has been implicated in the pathophysiology of many diseases (3, 4). Gut microbiota (GM; complex bacterial community located in the gastrointestinal tract) influences the development and diseases of the central nervous system (3). Recent studies show that maternal microbiota affects pregnancy outcome and/or infant health (5-8). During the first trimester, GM composition is similar to that in non-pregnant women. Later, the levels of Faecalibacterium and microorganism diversity decrease, whereas the levels of Proteobacteria and Actinobacteria increase (9). In a study by Crusell et al. (10), the GM composition of pregnant women with gestational diabetes mellitus was similar to that in non-pregnant women with type 2 DM both during pregnancy and after delivery. To our knowledge, there is no study of GM composition in women with DS pregnancies. There is also only one study of GM composition in DS persons, conducted by Biagi et al. (11). In this study, DS persons had increased Parasporobacterium and Sutterella species in their GM analysis. Additionally, the abundance of Sutterella microorganisms was significantly correlated with the Aberrant Behavior Checklist total score (11).
Therefore, we tried to study and compare the GM composition between pregnancies having ended in giving birth to DS newborns and pregnancies with healthy newborns.
Materials and Methods
This prospective study was approved by the institutional Ethics Board (SBU Istanbul Bakırkoy Training and Research Hospital, approval no. 2018-04-16) and conducted according to the Declaration of Helsinki. It was performed in the Prenatal Diagnosis Center, Obstetrics and Gynecology Department, Istanbul Kanuni Sultan Suleyman Training & Research Hospital, University of Health Sciences, Turkey. Pregnant women having undergone karyotyping of fetal DS (by chorionic villous, amniocentesis, or cordocentesis sampling, according to gestational age) due to advanced maternal age or elevated risk of fetal aneuploidies based on prenatal screening were invited to participate in this prospective study. Those who agreed and gave their written consent were enrolled in the study. According to karyotyping results, 21 pregnant women were included in group 1 (trisomy [T]21 fetus pregnancy). The other group (control group) consisted of 23 age-matched pregnant women with chromosomally normal fetuses.
Inclusion criteria for both groups were age ≥18 years, singleton pregnancy, and availability of karyotyping results. Exclusion criteria were inability to give written consent (both groups), presence of other fetal chromosomal anomalies (group 2), using medications that might affect GM composition (both groups), presence of acute and/or chronic infection or inflammation (both groups), and presence of any malignancies (both groups).
Upon inclusion in the study, stool samples (for GM analysis) were obtained at the hospital and kept at -80 °C until analysis. Each sample was given a special code (to conceal the participant’s identity). Two participants from group 1 (withdrawal of their acceptance) and one participant from group 2 (due to using herbs available in markets) were excluded from the study. So, the final analysis included 43 participants (21 in group 1 and 22 in group 2).
Microbiota analysis
Stool sample collection and DNA isolation
From each participant, about 1 g or 1 mL stool was self-collected into a 15-mL container (prefilled with 9 mL DNA/RNA Shield). As mentioned above, the collected samples were kept in our laboratory at -80 °C until analysis. Following the manufacturer’s instruction, isolation and genomic purification of stool microbiota samples were done with the ZymoBIOMICSTM DNA Microprep Kit (Zymo Research, Irvine, CA, USA). After this stage, the isolated DNA samples were sent to the Zymo Research Central Laboratory (CA, USA) for further analysis. This analysis was done by the service procurement method. This laboratory was completely blinded to the sample groups.
Targeted library preparation
The DNA samples were prepared for targeted sequencing with the Quick-16S™ NGS Library Prep Kit (Zymo Research, Irvine, CA, USA). These primers were custom-designed by Zymo Research to provide the best coverage of the 16S gene while maintaining high sensitivity. The primer sets used in this project were Quick-16S™ Primer Set V3-V4 (Zymo Research, Irvine, CA, USA).
The sequencing library was prepared using an innovative library preparation process in which polymerase chain reactions (PCR) were performed in real-time PCR machines to control cycles and therefore limit PCR chimera formation. The final PCR products were quantified with qPCR fluorescence readings and pooled together based on equal molarity. The final pooled library was cleaned up with the Select-a-Size DNA Clean & Concentrator™ (Zymo Research, Irvine, CA, USA), then quantified with TapeStation® (Agilent Technologies, Santa Clara, CA, USA) and Qubit® (Thermo Fisher Scientific, Waltham, WA, USA).
Control samples
The ZymoBIOMICS® Microbial Community Standard (Zymo Research, Irvine, CA, USA) was used as a positive control for each DNA extraction if performed. The ZymoBIOMICS® Microbial Community DNA Standard (Zymo Research, Irvine, CA, USA) was used as a positive control for each targeted library preparation. Negative controls (i.e. blank extraction control, blank library preparation control) were included to assess the level of bioburden carried by the wet-lab process. Sequencing: the final library was sequenced on Illumina® MiSeq™ with a v3 reagent kit (600 cycles). The sequencing was performed with >10% PhiX spike-in.
Bioinformatic analysis
Unique amplicon sequences were inferred from raw reads using the DADA2 pipeline (12). Chimeric sequences were also removed with the DADA2 pipeline. Taxonomy assignment was performed using Uclust from QIIME v.1.9.1. Taxonomy was assigned with the Zymo Research Database, a 16S database that is internally designed and curated, as reference.
Composition visualization, alpha diversity, and beta diversity analyses were performed with QIIME v.1.9.1 (13). If applicable, a taxonomy with significant abundance among different groups was identified by LEfSe using default settings (14). Other analyses such as heatmaps, Taxa2SV_deomposer, and PCoA plots were performed with internal scripts.
Statistical analyses
Alpha diversity of GM was measured by the number of Operational Taxonomic Units (OTUs), the Shannon diversity index, the Chao1 index, Faith’s phylogenetic diversity (PD) whole tree. An input phylogenetic tree was used for calculating beta diversity. Hypothesis testing in microbial taxa was performed by comparing alpha and beta diversity indices. Depending on the normal distribution or non-distribution of data, the t-test or related non-parametric test (Mann-Whitney U test) was used.
The relative abundance of single taxa within the GM of every subject was expressed as a percentage of the whole number of bacteria detected by metagenomic analyses. Significant differences in the phylum- or genus-level abundance between DS pregnant women and healthy pregnant controls were assessed by Mann-Whitney U tests and corrected for multiple comparisons using the Benjamini-Hochberg method when appropriate.
Our hypothesis was to test the association between microbiome and host, i.e. whether the microbiome composition or ‘dysbiotic’ microbiome was linked to the health or disease of the host. For example, in our research, we hypothesized that dysbiosis was associated with the presence or absence of DS resulting pregnancies.
The Spearman correlation coefficient evaluated relationships between serologic variables and microbial biodiversity variables (Shannon index). We used Spearman correlation, which is robust to nonlinear relationships and outliers.
The OTU data were used to calculate the index of biodiversity Chao1 and to perform beta diversity analysis with the Principal Coordinate Analysis (PCoA) method based on unweighted UniFrax.
The overall fecal microbiota composition, in terms of interindividual variability, was compared between DS and normal pregnancies using PERMANOVA.
In the sample collection period, power analysis is conducted to estimate how many samples are needed to provide sufficient power (e.g., 80%) to correctly conclude on a difference between the groups. We estimated a sample size of 21 for each group for an effect size of 0.9 to compare beta diversity between the groups. We used GPower 3.1 to conduct power analysis. As in the study by Bingula et al. (15), a sample size of 20 participants in each group was sufficient for microbiota composition comparison. All other analyses were done using R version 3.6.2, considering p≤0.05 as significant. Vegan, micropower R, and UniFrac R packages were used on analyses (16).
Results
To highlight the possible GM signatures of DS resulting pregnancies, the microbiota structure from 21 pregnant women having delivered DS newborns (group 1), mean age 34.08±5.48 (min-max: 20-46) years were enrolled in the study and compared with that from 22 pregnant women having given birth to normal children (group 2), mean age 32.40±7.64 (min-max: 20-42) years. Gestational age was 21.40±5.02 (min-max: 12-31) weeks in group 1 and 21.70±5.30 (min-max: 16-32) weeks in group 2. According to independent samples t-test results, there were no significant differences in the mean age and mean gestational age between the two groups (p=0.21 and p=0.96, respectively). Thus, any age- or gestational age-related effect on microbiota structure was excluded.
Microbiota analysis
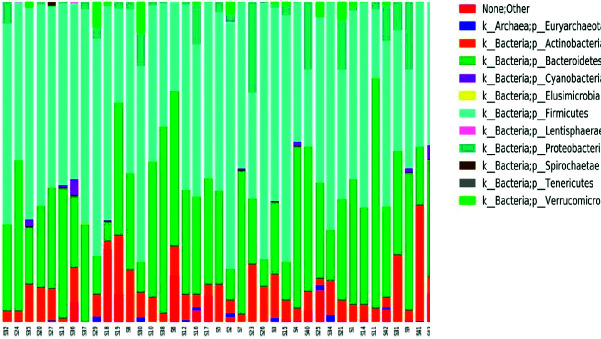
Taxonomy composition graphics show microbial composition at different taxonomic levels, i.e. at phylum and family levels (Fig. 1). Numbers were given to each OTU included in the study. Numbers between S32 and S2 indicate women giving birth to children with DS, while numbers between S7 and S39 indicate women giving birth to normal children.
Fig. 1.
A stacked bar chart showing phylum level abundance profiles of the enrolled women.
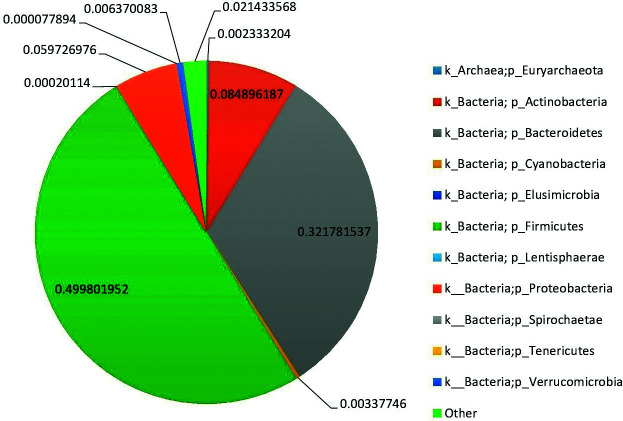
The relative abundance of phylum-level assigned OTUs is reported in pregnancies that resulted in DS newborns and in normal pregnancies (Figs. 2 and 3, respectively). Colors were assigned for all phyla detected. According to our data, the GM of DS persons was largely predominated by Firmicutes (relative abundance (rel. ab.) 49.9%), Bacteroidetes (rel. ab. 32.2%), and Actinobacteria (rel. ab. 8.4%). With relative abundance values below 5%, Elusimicrobia, Spirochaetes, Tenericutes, Lentisphaerae, Euryarchaeota, Cyanobacteria, and Verrucomicrobia were largely subdominant phyla. The GM of normal pregnant women was largely predominated by Firmicutes (rel. ab. 55.4%), Bacteroidetes (rel. ab. 29.8%), and Actinobacteria (rel. ab. 7.4%). With relative abundance values below 5%, Elusimicrobia, Spirochaetes, Tenericutes, Lentisphaerae, Euryarchaeota, Cyanobacteria, Proteobacteria, and Verrucomicrobia were largely subdominant phyla.
Fig. 2.
Average phylum level abundance profiles of gut microbiota of the enrolled Down syndrome pregnancies.
Fig. 3.
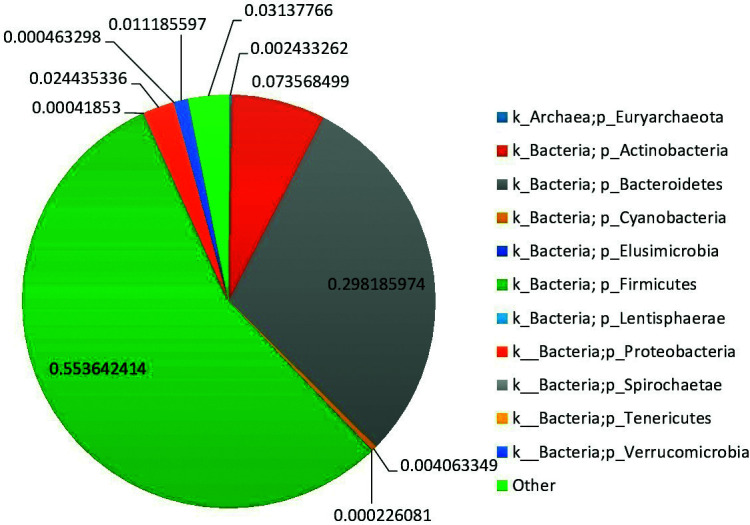
Average phylum level abundance profiles of gut microbiota of the enrolled normal pregnancies.
The most represented families in DS gut microbial communities were Prevotellaceae (rel. ab. 25.7%), Lachnospiraceae (rel. ab. 24.1%), Ruminococcaceae (rel. ab. 16.8%), and Bifidobacteriaceae (rel. ab. 5.2%). The most represented families in normal gut microbial communities were Lachnospiraceae (rel. ab. 25.6%), Prevotellaceae (rel. ab. 24.3%), Ruminococcaceae (rel. ab. 19.4%), and Bifidobacteriaceae (rel. ab. 4.5%).
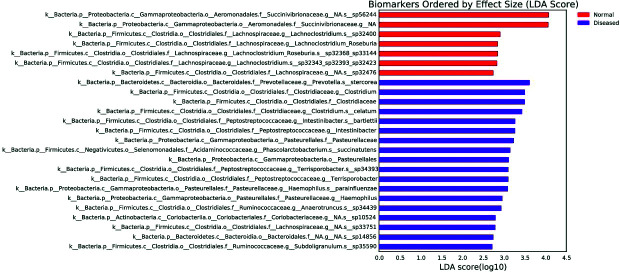
The lower taxonomic levels are not shown due to limited space; however, the two groups were compared to the lowest taxon as possible based on the Linear discriminant analysis Effect Size (LEfSe), which is a tool developed by the Huttenhower group to find biomarker bacteria between two or more groups based on relative abundances.
The LefSE chart creates a chart with bars that represent the effect size (linear discriminant analysis, LDA) for a particular taxon in a particular group (Fig. 4). The length of the bar represents a log10 transformed LDA score. The colors indicate which taxon is more common than in the other group. Here, the taxa that showed significance in normal and DS resulting pregnancy groups are shown with red and purple bars, respectively. According to the LefSe chart, Succinivibrionaceae (family) and Lachnoclostridium_Roseburia (genus) were more dominant in normal than in DS pregnancies, whereas Pasteurellales (order), Clostridiaceae (family), Pasteurellaceae (family), Clostridium (genus), Intestinibacter (genus), Terrisporobacter (genus) and Haemophilus (genus) abundances were significantly higher in the women with DS resulting pregnancies than in the women with normal pregnancies.
Fig. 4.
Linear discriminant analysis Effect Size (LEfSe) graph.
Alpha diversity and beta diversity comparisons
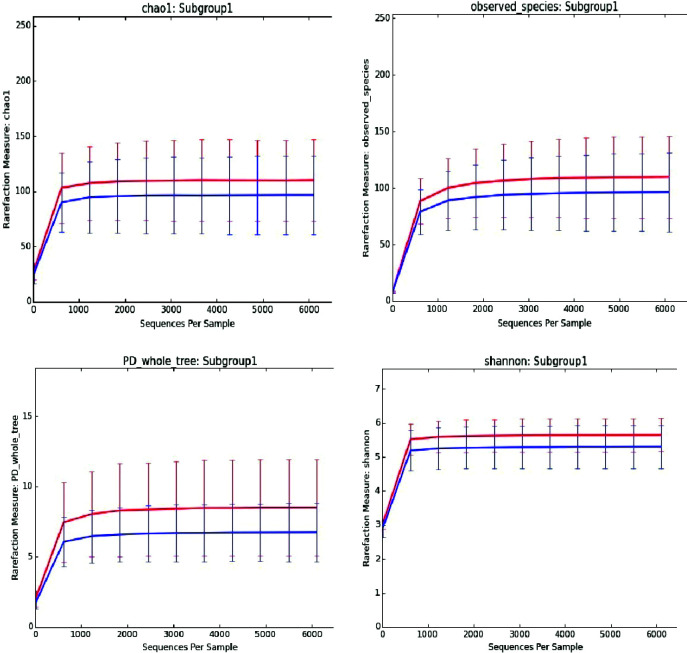
Change in microbial diversity of the intestinal microbiome is an important indicator for most diseases. Therefore, we compared these conditions with microbial diversity in women with DS and normal resulting pregnancy. Superimposition of the rarefaction curves of different α-diversity metrics (PD whole tree, observed OTUs, the Chao1 measure of microbial richness, and the Shannon index of biodiversity) are shown in Figure 5. The sequencing depths used in the analysis were 10, 619, 1228, 1837, 2446, 3055, 3664, 4273, 4882, 5491, 6100 curves that reached the plateau, approximating the saturation level, after 1228 reads.
Fig. 5.
Average gut microbiota biodiversity of the 43 stool samples analyzed by 16S rRNA microbial profiling metagenomics techniques of the patients with normal pregnancy (blue) and Down syndrome resulting pregnancy (red). The curves represent the average Chao1 index (up left), observed species (up right), PD whole tree (down left) and Shannon index (down right), corresponding to the number of Operational Taxonomic Units (OTUs), at increasing sequencing depth.
Differences between the Shannon, Chao1, observed species, and PD whole tree indices were examined for each sequencing. According to the results of the Mann-Whitney U test, pregnant women with DS had more diversity (measured by Shannon index) and richness (measured by Chao1 index) than normal ones (p<0.001). In other words, the pregnant women with DS had more OTU members and more skewed distributions.
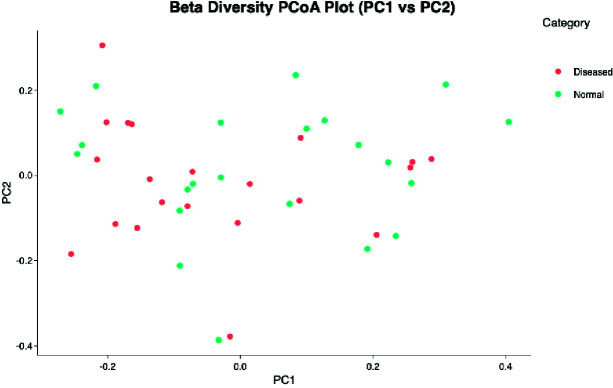
Beta diversity is a measure of microbial diversity differences between samples. The PCoA graph created using the matrix of the matched distance between the Bray-Curtis difference and the samples calculated is illustrated in Figure 6. Each point in the figure represents the entire microbial composition profile. Thus, the samples with similar microbial composition profiles are close to each other.
Fig. 6.
Gut microbiota in cases and controls: comparison of the overall fecal microbiota composition, represented with 2D Principal Coordinate Analysis (PCoA) scatterplot based on the Bray-Curtis distance matrix.
There was no significant difference in fecal microbiota composition between the women with DS pregnancies and normal pregnancies in terms of beta diversity (PERMANOVA, p=0.104). In addition, the PCoA of β-diversity comparison using Bray Curtis distances did not reveal a significant separation of microbial communities between the DS and normal resulting pregnancies (Fig. 6) (Table 1).
Table 1. Clinical metadata: main characteristics and comparison of diseased and control groups.
| Normal pregnancy (n=22) | Down syndrome resulting pregnancy (n=21) | ||||||||||
|---|---|---|---|---|---|---|---|---|---|---|---|
| M | SD | M | IQR | Min; max | M | SD | M | IQR | Min; max | p | |
| Age (yrs) | 32.4 | 7.64 | 32.5 | 12.5 | 20; 46 | 34.8 | 5.48 | 37 | 6 | 20; 42 | 0.21* |
| Gestational age | 21.7 | 5.30 | 19.5 | 8 | 16; 32 | 21.4 | 5.02 | 22 | 7 | 12; 31 | 0.96* |
M = median; SD = standard deviation; IQR = interquartile range; 95% Bias Corrected and Accelerated (BCA) bootstrap confidence interval for median differences, *independent samples t-test
Discussion
Down syndrome is one of the most common incurable chromosome abnormalities in humans (17). Amniocentesis (an invasive test) is required for a definitive diagnosis of DS during pregnancy. To the best of our knowledge, this issue has not been evaluated and studied in DS resulting pregnancies. GM has a role in the gut-brain axis. Evidence is emerging about nutrition and GM in the development and function of the nervous system (18, 19). Altering GM composition (by diet, probiotics, etc.) may prevent the symptoms (or their severity) of development of some neurodegenerative diseases (20). So, studying this issue in DS resulting pregnancies is of paramount importance. Even in DS persons, there is only one study evaluating their GM composition. In this sole study, Parasporobacterium and Sutterella microorganisms were more abundant in DS resulting pregnancy group (in comparison to the healthy pregnancy group) (11). So, whether this different GM composition of DS persons is the cause or the result of this disease needs to be studied in-depth (19). Our study tried to compare the GM composition between women with DS resulting pregnancies and women who had delivered healthy babies. One of the essential measures of ecologic diversity is the alpha diversity curve. Pregnant women with DS had more diversity (measured by Shannon index) and richness (measured by Chao1 index) than normal ones (p<0.001). In other words, the women with DS pregnancy had more OTU members and more skewed findings. On the other hand, beta diversity did not reveal a significant separation of microbial communities between the DS and normal resulting pregnancies (PERMANOVA, p>0.05).
Analyzing the Cladogram chart, which helps see the tax difference between the groups, showed the families Clostridiaceae, Pasteurellaceae and Pasteurellales to be more abundant in DS resulting pregnancy group than in the group with normal babies. Studies are ongoing to use GM dysbiosis (microbiomarkers) in the diagnosis and/or treatment of inflammatory bowel disease (21). This is the case in Parkinson’s disease as well (22). Whether these significant findings of GM dysbiosis could be used in the diagnosis and/or prevention of DS during pregnancy needs to be further studied.
Limitations
One of the important limitations of this pilot study was its cross-sectional design. Pre-conception or early conception phase measures of the study parameters might yield more useful information about the role of these parameters in pregnancy outcome, and vice versa. Still, the data obtained in our pilot study will be a pathfinder for such detailed studies in this important and challenging field.
Conclusions
The results of this pilot study are promising. There was a diversity in the GM of women with DS resulting pregnancies. This diversity of the GM system may have a role in the pathophysiology of DS. Whether we could use this system in the diagnosis and/or prevention of DS during the prenatal period needs to be studied in-depth.
Acknowledgment
This study was supported by a fund from the Scientific Research Projects Unit, University of Health Sciences, Turkey (Project No: 2018/044). The funding program authorities did not influence the analysis of the results. It helped only in funding and supplying the necessary equipment and materials for the study. We would like to thank Ms Zeynep Hursitoglu (student at Universite Lille 2, France) for her input on the idea of the study and for typesetting the draft of the manuscript.
References
- 1.Yazdani S, Rouholahnejad R, Asnafi N, Sharbatdaran M, Zakershob M, Bouzari Z. Correlation of pregnancy outcome with quadruple screening test at second trimester. Med J Islam Repub Iran. 2015;29:281. [PMC free article] [PubMed] [Google Scholar]
- 2.Ayaz R, Göktas E, Turkyilmaz G, Asoglu MR. Prenatal identification of aberrant right subclavian artery in isolation: the need for further genetic work-up? Acta Clin Croat. 2020;59(4):582. 10.20471/acc.2020.59.04.03 [DOI] [PMC free article] [PubMed] [Google Scholar]
- 3.Strandwitz P. Neurotransmitter modulation by the gut microbiota. Brain Res. 2018 Aug 15;1693(Pt B):128-33. DOI: 10.1016/j.brainres.2018.03.015 10.1016/j.brainres.2018.03.015 [DOI] [PMC free article] [PubMed]
- 4.Domislović V, Vranešić-Bender D, Barišić A, Brinar M, Ljubas Kelečić D, Rotim C, et al. High prevalence of untreated and undertreated vitamin D deficiency and insufficiency in patients with inflammatory bowel disease. Acta Clin Croat. 2020 Mar 1;59(1):109-18. doi: 10.20471/acc.2020.59.01.13. DOI: 10.20471/acc.2020.59.01.13. 10.20471/acc.2020.59.01.13 [DOI] [PMC free article] [PubMed]
- 5.Dunlop AL, Mulle JG, Ferranti EP, Edwards S, Dunn AB, Corwin EJ. Maternal microbiome and pregnancy outcomes that impact infant health: a review. 2015 Dec;15(6):377-85. DOI: 10.1097/ANC.0000000000000218 10.1097/ANC.0000000000000218 [DOI] [PMC free article] [PubMed]
- 6.Edwards SM, Cunningham SA, Dunlop AL, Corwin EJ. The maternal gut microbiome during pregnancy. MCN Am J Matern Child Nurs. 2017;42(6):310–7. 10.1097/NMC.0000000000000372 [DOI] [PMC free article] [PubMed] [Google Scholar]
- 7.Ferrocino I, Ponzo V, Gambino R, Zarovska A, Leone F, Monzeglio C, et al. Changes in the gut microbiota composition during pregnancy in patients with gestational diabetes mellitus (GDM). Sci Rep. 2018. December 1;8(1):12216. 10.1038/s41598-018-30735-9 [DOI] [PMC free article] [PubMed] [Google Scholar]
- 8.Yang H, Guo R, Li S, Liang F, Tian C, Zhao X, et al. Systematic analysis of gut microbiota in pregnant women and its correlations with individual heterogeneity. NPJ Biofilms Microbiomes. 2020. September 11;6(1):32. 10.1038/s41522-020-00142-y [DOI] [PMC free article] [PubMed] [Google Scholar]
- 9.Nuriel-Ohayon M, Neuman H, Koren O. Microbial changes during pregnancy, birth, and infancy. Front Microbiol. 2016;7:1031. 10.3389/fmicb.2016.01031 [DOI] [PMC free article] [PubMed] [Google Scholar]
- 10.Crusell MKW, Hansen TH, Nielsen T, Allin KH, Rühlemann MC, Damm P, et al. Gestational diabetes is associated with change in the gut microbiota composition in third trimester of pregnancy and postpartum. Microbiome. 2018. December 15;6(1):89. 10.1186/s40168-018-0472-x [DOI] [PMC free article] [PubMed] [Google Scholar]
- 11.Biagi E, Candela M, Centanni M, Consolandi C, Rampelli S, Turroni S, et al. Gut microbiome in Down syndrome. PLoS One. 2014. November 11;9(11):e112023. 10.1371/journal.pone.0112023 [DOI] [PMC free article] [PubMed] [Google Scholar]
- 12.Callahan BJ, McMurdie PJ, Rosen MJ, Han AW, Johnson AJA, Holmes SP. DADA2: High-resolution sample inference from Illumina amplicon data. Nat Methods. 2016. June 29;13(7):581–3. 10.1038/nmeth.3869 [DOI] [PMC free article] [PubMed] [Google Scholar]
- 13.Caporaso JG, Kuczynski J, Stombaugh J, Bittinger K, Bushman FD, Costello EK, et al. QIIME allows analysis of high-throughput community sequencing data. Nat Methods. 2010. May;7(5):335–6. 10.1038/nmeth.f.303 [DOI] [PMC free article] [PubMed] [Google Scholar]
- 14.Segata N, Izard J, Waldron L, Gevers D, Miropolsky L, Garrett WS, et al. Metagenomic biomarker discovery and explanation. Genome Biol. 2011 Jun 24;12(6):12:R60. DOI: 10.1186/gb-2011-12-6-r60. 10.1186/gb-2011-12-6-r60 [DOI] [PMC free article] [PubMed]
- 15.Bingula R, Filaire M, Radosevic-Robin N, Berthon J-Y, Bernalier-Donadille A, Vasson M-P, et al. Characterisation of gut, lung, and upper airways microbiota in patients with non-small cell lung carcinoma: study protocol for case-control observational trial. Medicine (Baltimore). 2018. December 1;97(50):e13676. 10.1097/MD.0000000000013676 [DOI] [PMC free article] [PubMed] [Google Scholar]
- 16.Xia Y, Sun J, Chen D-G. Statistical Analysis of Microbiome Data with R. ICSA Book Series in Statistics. Singapore: Springer, 2018. [Google Scholar]
- 17.Down Syndrome. Other FAQs | NICHD - Eunice Kennedy Shriver National Institute of Child Health and Human Development [Internet]. [cited 2020 Oct 19]. Available from: https://www.nichd.nih.gov/health/topics/down/conditioninfo/faqs
- 18.Ceppa F, Mancini A, Tuohy K. Current evidence linking diet to gut microbiota and brain development and function. Int J Food Sci Nutr. 2019. February 2;70(1):1–19. 10.1080/09637486.2018.1462309 [DOI] [PubMed] [Google Scholar]
- 19.Butler MI, Mörkl S, Sandhu KV, Cryan JF, Dinan TG. The gut microbiome and mental health: what should we tell our patients? Le microbiote intestinal et la santé mentale : que devrions-nous dire à nos patients? Can J Psychiatry. 2019. November;64(11):747–60. 10.1177/0706743719874168 [DOI] [PMC free article] [PubMed] [Google Scholar]
- 20.Fang P, Hsiao EY. Gut microbes tune inflammation and lifespan in a mouse model of amyotrophic lateral sclerosis. Nature. 2020. June;582(7810):34–5. 10.1038/d41586-020-01335-3 [DOI] [PubMed] [Google Scholar]
- 21.Dickson I. Gut microbiota: diagnosing IBD with the gut microbiome. Nat Rev Gastroenterol Hepatol. 2017. April;14(4):195. 10.1038/nrgastro.2017.25 [DOI] [PubMed] [Google Scholar]
- 22.Nair AT, Ramachandran V, Joghee NM, Antony S, Ramalingam G. Gut microbiota dysfunction as reliable non-invasive early diagnostic biomarker in the pathophysiology of Parkinson’s disease: a critical review. J Neurogastroenterol Motil. 2018;24:30–42. 10.5056/jnm17105 [DOI] [PMC free article] [PubMed] [Google Scholar]


