Abstract
The members of the infant microbiome are governed by feeding choice (breastmilk vs. formula). Regardless of feeding choice, a competitive growth advantage can be provided to commensals through prebiotics - either human milk oligosaccharides (HMOs) or plant oligosaccharides that are supplemented into formula. To characterize how prebiotics modulate commensal – pathogen interactions, we have designed and studied a minimal microbiome where a pathogen, Streptococcus agalactiae engages with a commensal, Streptococcus salivarius. We discovered that while S. agalactiae suppresses the growth of S. salivarius via increased lactic acid production, galacto-oligosaccharides (GOS) supplementation reverses the effect. This result has major implications in characterizing how single species survive in the gut, what niche they occupy, and how they engage with other community members.
Keywords: minimal microbiome, human milk oligosaccharides, galacto-oligosaccharides, streptococcus, lactic acid
Entry for the Table of Contents

Insert text for Table of Contents here. The study of infant microbiome and how the flora is affected by feeding choice has recently gained interest. We designed a two species microbiome in which the pathogenic Streptococcus agalactiae encounters the commensal Streptococcus salivarius. We uncovered that the common infant formula supplement, galacto-oligosaccharides is able to reverse the effects of S. salivarius growth suppression by S. agalactiae.
Introduction
The gut microbiome is home to a densely populated community of microorganisms. This community provides the host with nutritional and physiological benefits and protection against pathogens.[1] As the gut is a nutrient deplete environment, microorganisms have evolved strategies to either coexist or compete with other organisms for resources. While some species adjust their metabolism to use secondary metabolites, others are more aggressive and directly engage with their competitors through chemical warfare. For example, commensal bacteria prevent colonization of pathogens through consumption of essential nutrients, production of antimicrobials that inhibit adhesion, and production of metabolites that stimulate the host immune response.[2] In the case of the infant microbiome, these community dynamics are influenced by several factors including mode of delivery, antibiotic exposure, and feeding source.
In terms of neonatal health and wellness, few pathogens rival the importance of the gram-positive bacteria Streptococcus agalactiae which colonizes the gastrointestinal tract and vaginal epithelium of pregnant women.[3] With ca. 25% of pregnant women carrying S. agalactiae at the time of delivery, infants are at high risk for infection via vertical transmission either in utero or during labor and delivery.[3a, 4] S. agalactiae infections are a leading cause of neonatal sepsis, meningitis, pneumonia, bacteraemia, and morbidity.[5] Currently, the only effective recourse against S. agalactiae infection is intrapartum antibiotic prophylaxis (IAP).[6] However, while IAP significantly reduces the risk of S. agalactiae early-onset disease, antibiotic treatment is not unflawed.[7] In addition to resistance evolution, antibiotics are associated with dysbiosis of the gut microbiota in both mother and child.[8]
To characterize the body’s defense mechanisms against S. agalactiae, we previously explored the antimicrobial and antibiofilm properties of human milk oligosaccharides (HMOs) against this organism. After lactose and lipids, HMOs are the third most abundant macromolecule in human breast milk.[9] In their most widely understood mechanism, HMOs are prebiotics that stimulate the growth of beneficial gut bacteria.[9] Our contribution to this area started with the discovery that HMOs possess both bacteriostatic and antibiofilm activity against not only S. agalactiae, but several of the highly infectious ESKAPE pathogens.[10] We hypothesized that HMOs act by increasing cell membrane permeability. This hypothesis was due, in part, to our observation that HMOs potentiate intracellular-targeting antibiotics.[11] Additionally, through metabolomic analysis, we confirmed that HMOs disrupt several metabolic pathways critical to cell membrane development and maintenance.[11b]
In the time since these discoveries, we developed an interest in characterizing how commensal – pathogen dyads are affected by each other’s oligosaccharide metabolism. Indeed, this question is one critical to infant health and wellness. For example, it is well-established that breastfeeding provides all protective and immunological components necessary for an infant’s growth and development.[12] Formula companies strive to deliver optimal nutrition to the infant by attempting to mimic human breast milk as closely as is ethical. Due to their known prebiotic and antiadhesive properties, HMOs and, more commonly, plant oligosaccharides are supplemented into commercially available formula.[13] For example, the plant fiber’s galacto-oliogosaccharides (GOS) and fructo-oligosaccharides (FOS) are added to formula to mimic the function of HMOs.[14] While these molecules are still used, modern formulations are frequently using 2’-fucosyllactose (2’-FL) and lacto-N-neotetraose (LNnT) as supplements.[14a, 15] Interestingly, although supplementation is routine, several aspects of the strategy are poorly understood. For example, it is not well-characterized how the addition of fiber effects microbial community dynamics. In the study described herein, we hypothesize that HMOs and plant polymers differentially effect the growth dynamics between commensals and pathogens. To test this hypothesis, we studied the relationship between two microorganisms, S. agalactiae and Streptococcus salivarius (S. salivarius). While the majority of streptococcal species are pathogenic in nature, S. salivarius is one of the prominent commensal species in both the oral and gut microbiomes.[16] S. salivarius is also one of the earliest colonizers of healthy infants, typically present immediately after birth.[16b, 17] S. salivarius K12, is a probiotic successfully used to prevent and treat S. pyogenes, the bacteria that causes strep throat.[18] In this study, we hypothesized that coculturing S. salivarius with S. agalactiae - in addition to oligosaccharide supplementation – would enable characterizing the growth effects of oligosaccharide metabolism on both commensal and pathogenic bacteria in a minimal, model infant microbiome.
Results and Discussion
S. agalactiae suppresses the growth of Streptococcus salivarius. Growth suppression is reversed through GOS supplementation.
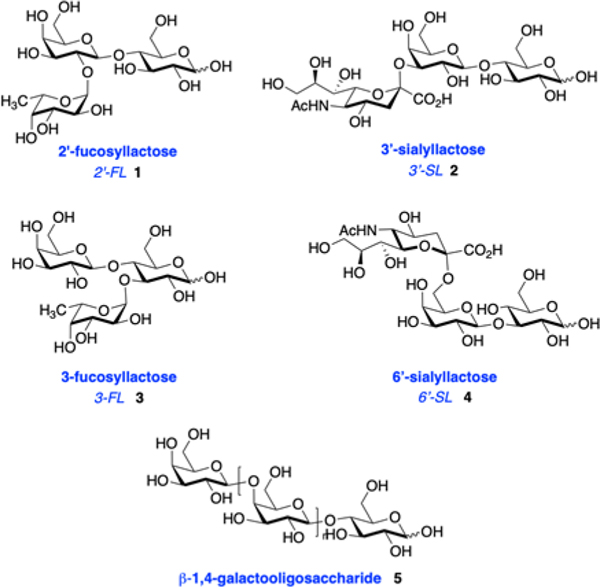
In an orienting experiment, we screened six oligosaccharide prebiotics for their antimicrobial activity. Four of the substrates were HMOs: 2′-fucosyllactose (2′-FL, 1), 3′-siallylactose (3′-SL, 2), 3-fucosyllactose (3-FL, 3), and 6′-siallyactose (6′-SL, 4). Additionally, we studied galacto-oligosaccharides (GOS, 5), as they are a formula supplement and a cocktail of HMOs isolated from the breast milk of 7 donors (Figure 1). The growth of S. agalactiae (strain GB00002) and S. salivarius (strain ATCC 19258) were assessed over a period of 24 hours and quantified using OD600 absorbance readings. Antimicrobial activity was evaluated by comparing growth and viability of either S. agalactiae or S. salivarius in unsupplemented medium to growth in medium with oligosaccharide supplementation (Figure 2). The test substrates were dosed at ca. 5 mg/mL, the low end of concentrations commonly observed in human milk or infant formula.
Figure 1.
Structures of oligosaccharide prebiotics used in this study.
Figure 2.
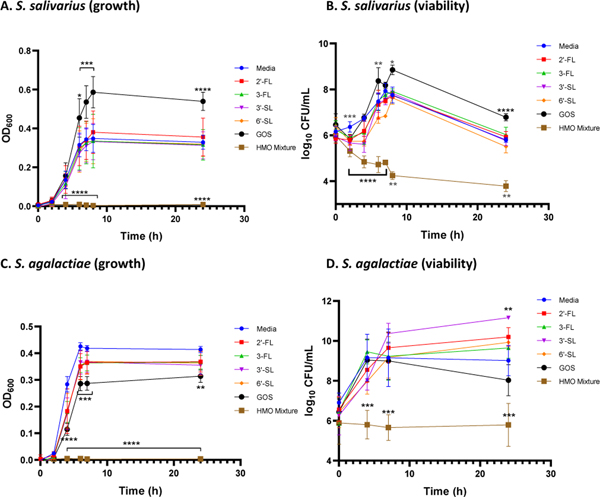
Effects of single-entity oligosaccharides and the HMO cocktail at ca. 5 mg/mL on growth and viability of S. salivarius (ATCC 19258) and S. agalactiae (GB00002). Growth was quantified via OD600 readings at 0, 2, 4, 6, 7, 8, and 24 h. Mean OD600 for each time point is indicated by the corresponding symbols. Viability was assessed by enumeration of CFU/mL performed at 0, 2, 4, 6, 7, 8, and 24 h for S. salivarius and 0, 4, 7, and 24 h for S. agalactiae. Log10 CFU/mL for each HMO and time point is designated by the corresponding symbols. (A) Growth of S. salivarius (OD600) in the presence of single-entity oligosaccharides and the HMO cocktail. (B) Viability of S. salivarius (CFU/mL) corresponding to the OD values graphed in Figure 2A. (C) Growth of S. agalactiae (OD600) in the presence of single-entity oligosaccharides and the HMO cocktail. (D) Viability of S. agalactiae (CFU/mL) corresponding to the OD values graphed in Figure 2C. Data displayed represent the relative mean growth ratios ± SEM of three independent experiments, each with three technical replicates. In (A) ∗∗∗∗ represents p < 0.0001, *** represents p = 0.0009 and p = 0.0003, and * represents p = 0.0132 by two-way ANOVA with post hoc Dunnett’s multiple comparison test comparing the growth of S. salivarius in each oligosaccharide supplementation condition to the growth of S. salivarius in medium alone. In (B) ∗∗∗∗ represents p < 0.0001, *** represents p = 0.0005, ** represents p = 0.0085, p = 0.0062, and p = 0.0022, and * represents p = 0.0484 by two-way ANOVA with post hoc Dunnett’s multiple comparison test comparing the growth of S. salivarius in each oligosaccharide supplementation condition to the growth of S. salivarius in medium alone. In (C) ∗∗∗∗ represents p < 0.0001, *** represents p = 0.0009 and p = 0.0007, and ** represents p = 0.0015 by two-way ANOVA with post hoc Dunnett’s multiple comparison test comparing the growth of S. agalactiae in each HMO supplementation condition to the growth of S. agalactiae in medium alone. In (D) *** represents p = 0.0010, p = 0.0005, and p = 0.0002, and ** represents p = 0.0037 by two-way ANOVA with post hoc Dunnett’s multiple comparison test comparing the growth of S. agalactiae in each oligosaccharide supplementation condition to the growth of S. agalactiae in medium alone.
In the S. salivarius model, GOS increases growth starting at hour 6, with an increase of 64% at 24 hours. To contrast, the HMO cocktail completely inhibits growth of S. salivarius over the entirety of the 24-hour experiment. Interestingly, the four naturally occurring HMOs did not have a significant effect on S. salivarius growth. As expected, in the S. agalactiae model, the HMO cocktail suppressed growth over the entire 24-hour period. However, in a result that contrasts the S. salivarius assay, GOS reduced cellular growth starting at hour 4, with a 24% decrease at 24 hours. 3-FL (11%), 3′-SL (14%), and 6′-SL (12%) also significantly decreased the growth of S. agalactiae at 24 hours. This result is particularly interesting as GOS has not previously been evaluated as an antimicrobial agent. Similar trends were observed for bacterial viability across both strains. Specifically for S. salivarius, GOS increased viability starting at hour 6, with an increase of 18% at 24 hours. As was observed with S. salivarius growth, the HMO cocktail significantly reduced viability of the entire 24-hour period. In the S. agalactiae model, viability was also significantly reduced over the same time period for the HMO cocktail.
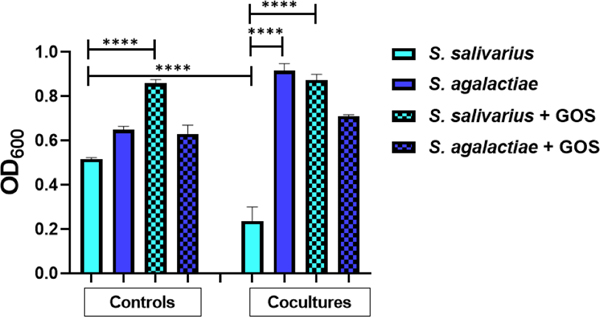
With an understanding of how S. salivarius and S. agalactiae respond to oligosaccharide supplementation, and the intriguing contrast in growth responses to GOS, we moved to explore the growth dynamics of the two strains in a two-species microbiome (coculture) with and without GOS supplementation. We used the transwell plate system for coculturing which enables characterization of the interactions between two bacterial cell populations (Figure 3). While the organisms are physically separated by a semi-permeable membrane; all macromolecules, primary, and secondary metabolites passively diffuse across the plate. As a control, both strains were grown in their own wells. Grown separately, we observed a 25% difference in growth between the two strains. As expected, upon supplementation with GOS, we observed a 67% increase in the growth of S. salivarius. Interestingly, we observed an extreme suppression of S. salivarius growth by S. agalactiae in coculture. Specifically, we observed a 54% decrease from the solo culture, a 286% difference in growth between the two strains, and a 40% increase of S. agalactiae growth from the solo culture. The addition of GOS allowed both S. salivarius and S. agalactiae growth to completely rebound to that of the solo culture.
Figure 3.
S. agalactiae suppresses growth of S. salivarius in coculture; GOS supplementation reverses this suppression. The first four bars represent controls in which S. salivarius (ATCC 19258) and S. agalactiae (GB00002) were grown separately, either with or without GOS supplementation at ca. 5 mg/ml. The last four bars represent the two strains grown in coculture either with or without GOS supplementation at ca. 5 mg/ml. Growth was quantified via OD600 readings at 24 h. Data displayed represent the relative mean growth ratios ± SEM of three independent experiments, each with three technical replicates. **** represents p < 0.0001 by one-way ANOVA with post hoc Dunnett’s multiple comparison test comparing the mean growth of each condition with the mean of every other condition.
An acidic environment caused by S. agalactiae lactic acid production is likely contributing to S. salivarius growth inhibition.
We hypothesized S. agalactiae was producing a metabolite in response to cell-to-cell interactions with a competitor. To test this hypothesis, we explored the inhibitory effects of cell-free supernatants. The phenotype was still observed upon treatment with S. agalactiae cell-free supernatants from both solo and cocultures (Figure S1). To narrow down whether proteins, lipids, carbohydrates, or DNA are responsible for growth inhibition we incubated the cell-free supernatants with proteinase K, lipase, α-amylase, or DNAase I for 24 hours (Figure 4). Surprisingly, we did not observe S. salivarius growth inhibition by S. agalactiae from both solo and cocultures upon incubation with each enzyme. Hypothesizing that each enzyme is highly buffered, we added 1 mM TRIS buffer to the cell-free supernatants. Just as was observed with the enzymatic experiments, we did not observe suppression of S. salivarius growth. Thus, we concluded S. salivarius inhibition is only observed in an acidic environment (Tables S1 and S2).
Figure 4.
Suppression of S. salivarius by S. agalactiae is combatted when the supernatants from overnight cultures are treated with DNAase I, lipase, α-amylase, proteinase K, or 1 mM TRIS buffer. Supernatants from overnight solo cultures and cocultures are treated with enzyme or TRIS buffer to determine if the suppression of S. salivarius by S. agalactiae is reversed. Cultures with GOS supplementation were added at ca. 5 mg/ml. Growth was quantified via OD600 readings at 24 h. Data displayed is a combined from treatments with all four enzymes and TRIS buffer. Data displayed represent the relative mean growth ratios ± SEM of three independent experiments, each with three technical replicates.
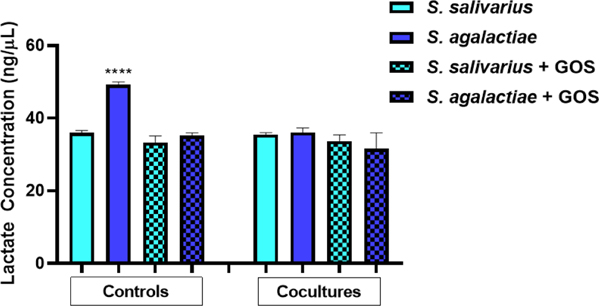
S. agalactiae produces a myriad of virulence factors responsible for its pathogenesis and ability to persist in harsh environments. In addition to pore-forming toxins, biofilms, and sialylated capsular polysaccharides, lactic acid has recently been implicated in the virulence of S. agalactiae.[19] S. agalactiae produces lactic acid as an end product of anaerobic carbohydrate fermentation.[19b] We hypothesized that lactic acid production was contributing to the suppression of S. salivarius growth. Accordingly, a lactic acid production assay was employed to measure the concentration of lactic acid present in each sample in Figure 3. Using the lactic acid standard curve (Figure S3), the concentration of lactic acid was calculated (Figure 5). In the solo cultures, S. agalactiae produced ca. 49.2 ng/µL of lactic acid. The remaining cocultures produced an average of 34.5 ng/µL lactic acid, 30% less than S. agalactiae in medium alone. This data validates the hypothesis that S. agalactiae is producing a significant amount of lactic acid – likely contributing to its modulation of S. salivarius growth.
Figure 5.
S. agalactiae in medium alone produces significantly more lactic acid compared to all other conditions tested. The first four bars represent controls in which S. salivarius (ATCC 19258) and S. agalactiae (GB00002) were grown separately, either with or without GOS supplementation at ca. 5 mg/ml. The last four bars represent the two strains grown in coculture either with or without GOS supplementation at ca. 5 mg/ml. Lactic acid concentration was quantified via OD450 readings at 24 h. Data displayed represent the relative mean growth ratios ± SEM of three independent experiments, each with three technical replicates. **** represents p < 0.0001 by one-way ANOVA with post hoc Dunnett’s multiple comparison test comparing growth in S. agalactiae in medium alone to growth in all other conditions.
Reversal of S. salivarius suppression is carbohydrate specific to GOS and galactose.
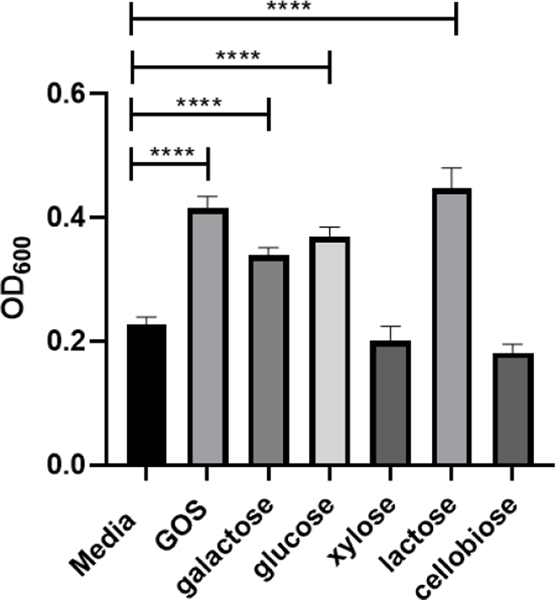
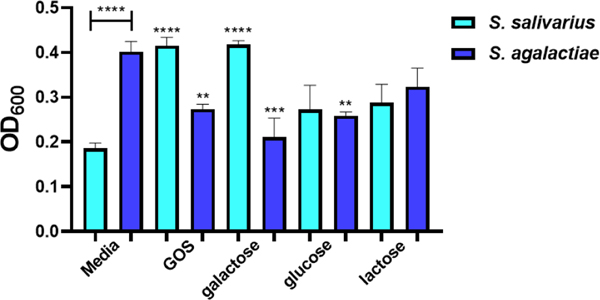
We questioned whether the rebound of S. salivarius growth in coculture with S. agalactiae was specific to GOS or if other carbohydrates could produce this phenotype. We elected to screen three monosaccharides and two disaccharides against S. salivarius to determine if they elicit the same response as GOS (Figure 6). Perhaps not surprisingly, galactose, glucose, and lactose all increased growth by 48%, 62%, and 96%, respectively. We next set up cocultures with supplementation of these three carbohydrates and GOS (Figure 7). Interestingly, only GOS and galactose caused S. salivarius growth to fully rebound from the suppression triggered by S. agalactiae. Since GOS is a polymer composed of between two and eight monomeric units of galactose, we conclude this reversal of S. salivarius inhibition is specific to galactose.
Figure 6.
Effects of mono-, di-, and oligosaccharides at ca. 5 mg/mL on growth of S. salivarius (ATCC 19258). Growth was quantified via OD600 readings at 24 h. Data displayed represent the relative mean growth ratios ± SEM of three independent experiments, each with three technical replicates. **** represents p < 0.0001 by one-way ANOVA with post hoc Dunnett’s multiple comparison test comparing growth in carbohydrate-supplemented Todd-Hewitt Broth (THB) to growth in carbohydrate-free THB.
Figure 7.
In coculture, GOS and galactose supplementation assist in circumnavigating the suppression of S. salivarius by S. agalactiae. Growth of S. salivarius (ATCC 19258) and S. agalactiae (GB00002) supplemented with ca. 5 mg/ml of GOS, galactose, glucose, and lactose were compared to growth of S. salivarius and S. agalactiae grown in THB medium alone. Growth was quantified via OD600 24 h. Data displayed represent the relative mean growth ratios ± SEM of three independent experiments, each with three technical replicates. **** represents p < 0.0001, *** represents p = 0.0006, ** represents p = 0.0099 and p = 0.0085 by one-way ANOVA with post hoc Dunnett’s multiple comparison test comparing growth in carbohydrate-supplemented Todd-Hewitt Broth (THB) to growth in carbohydrate-free THB.
Conclusion
In summary, we have provided strong evidence that increased lactic acid production plays a significant role in S. agalactiae modulation of S. salivarius. Intriguingly, supplementation of galactose/GOS circumnavigates this inhibition of S. salivarius growth. This result is a critical first step toward understanding commensal-pathogen interactions in carbohydrate-rich environments. Moving forward, our goal is to continue characterizing how oligosaccharides influence interactions between microbiome community members.
Experimental Section
Materials and Methods
2′-fucosyllactose, 3-fucosyllactose, 3′-sialyllactose, 6′-sialyllactose, D-galactose, and D-cellobiose were purchased from Carbosynth. Lactose and D-glucose were purchased from Sigma Aldrich. D-xylose was purchased from Oakwood Chemical. Galacto-oligosaccharides were purchased from FrieslandCampina.
HMO isolation
Human milk was obtained from 7 healthy, lactating women between 3 days and 3 months postpartum and stored between −80 and –20°C. Deidentified milk was provided by Jörn-Hendrik Weitkamp from the Vanderbilt Department of Pediatrics. Milk samples were thawed and then centrifuged at 3750 rpm for 45 min. Following centrifugation, the resultant top lipid layer was removed. The proteins were then removed by diluting the remaining sample with roughly 1:1 (vol/vol) 180 or 200 proof ethanol, chilling the sample briefly, and centrifuging for 45 min at 3750 rpm, followed by removal of the resulting HMO-containing supernatant. Following concentration of the supernatant in vacuo, the HMO-containing extract was dissolved in 0.2 M phosphate buffer (pH 6.5) and heated to 37°C. 1 mL of β-Galactosidase from Kluyveromyces lactis was added, and the reaction mixture was stirred until lactose hydrolysis was complete. The reaction mixture was diluted with roughly 1:0.5 (vol/vol) 180 or 200 proof ethanol, chilled briefly, and then centrifuged at 3750 rpm for 30 min. The supernatant was removed and concentrated in vacuo, and the remaining salts, glucose, and galactose were separated from the oligosaccharides using size exclusion chromatography with P-2 gel (H2O eluent). The oligosaccharides were then dried by lyophilization. Correspondingly, HMO isolates from donors were combined and solubilized in water to reach a final concentration of 102.6 mg/ml.
Bacterial strains and culture conditions
S. agalactiae strain GB00002 was previously recovered from a vaginal/rectal swab taken from a pregnant mother prior to childbirth [20]; it was previously classified as a serotype Ia strain belonging to multilocus sequence type (ST)-23 [21]. S. salivarius strain (ATCC 19258) is a type strain. Both strains were grown on tryptic soy agar plates supplemented with 5% sheep blood (blood agar plates) at 37 °C in ambient air overnight. Strains were subcultured from blood agar plates into 5 mL of Todd-Hewitt broth (THB) and incubated under shaking conditions at 180 rpm at 37 °C in ambient air overnight. Following overnight incubation, bacterial density was quantified through absorbance readings at 600 nm (OD600) using a Promega GloMax-Multi Detection System plate reader. Bacterial numbers were determined using the predetermined coefficient of 1 OD600 = 109 CFU/mL.
Bacterial growth assays and viability assays
Bacterial strains were grown overnight as described above and used to inoculate fresh THB at a concentration of 106 colony forming units per 200 μL of growth media in 96 well tissue culture treated, sterile polystyrene plates (Corning, Inc.). Compounds were dissolved in DI water to achieve a concentration of 80 mg/mL and filtered through a 0.2 μm syringe filter. Compounds were added to achieve final carbohydrate concentrations of ca. 10, 5, 2.5, 1.25, 0.625, and 0.3125 mg/mL. Bacteria grown in THB in the absence of any compounds served as the control. Cultures were grown under static conditions at 37 °C in ambient air for 24 h. Growth was quantified through spectrophotometric reading at OD600 with readings taken at 0, 2, 4, 6, 7, and 8 h then a final reading at 24 h. Viability was assessed through serial dilution and plating onto blood agar plates followed by quantification of viable CFU/mL with readings taken at 0, 2, 4, 6, 7, 8, and 24 h for S. salivarius and 0, 4, 7, and 24 h for S. agalactiae.
Coculture model system
Bacterial strains were grown overnight as described above and used to inoculate fresh THB to achieve 5 × 10⁵ CFU/ml. To 12-well tissue culture-treated, sterile polystyrene plates was added the inoculated media in the presence of HMO or carbohydrate to achieve a final volume of 3 ml per well. Bacteria grown in medium in the absence of any compounds served as the controls. To a 6-well culture treated, sterile, polystyrene transwell plate was added 3 ml of THB media below and above the membrane. Bacterial strains were grown overnight as described above and used to inoculate the fresh THB on each side of the membrane to achieve 5 × 10⁵ CFU/ml (S. agalactiae on bottom and S. salivarius on top). Compounds were added to each side of the membrane to achieve a final carbohydrate concentration of ca. 5 mg/mL. Bacteria grown in THB in the absence of any compounds served as the control. Cultures were grown under static conditions at 37 °C in ambient air or in a CO2 incubator for 24 h. Growth was quantified through spectrophotometric reading at OD600.
Supernatant treated cultures
Cocultures were set up as described above. The media and cells from overnight growth plates were removed from each side of the transwell and transferred to 15 ml conical centrifuge tubes. The samples were centrifuged at 5000 rpm for 15 min to generate a bacterial pellet. The supernatant was removed and filtered through a 0.2 μm syringe filter. To a 6-well culture treated, sterile, polystyrene transwell plate was added 3 ml of THB media below the membrane. The filtered supernatant was added to the top of the membrane. Bacterial strains were grown overnight as described above and used to inoculate the fresh THB on the bottom of the membrane to achieve 5 × 10⁵ CFU/ml (S. agalactiae if S. salivarius supernatant on top, S. salivarius if S. agalactiae supernatant on top). Compounds were added to each side of the membrane to achieve a final carbohydrate concentration of ca. 5 mg/mL. Bacteria grown in THB in the absence of any compounds served as the control. Cultures were grown under static conditions at 37 °C in ambient air for 24 h. For enzyme and buffer treated supernatants, 15 µl of either DNAase I, proteinase K, lipase, α-amylase or 1 mM TRIS buffer was added to supernatants and incubated for 1 hour at 37 °C before adding to the transwell plates. Cultures were then grown under static conditions at 37 °C in ambient air for 24 h. Growth was quantified through spectrophotometric reading at OD600.
Lactic acid production assay
Cocultures were set up as described above. Lactate standards for colorimetric detection were prepared as described using the Sigma-Aldrich using Lactate Assay Kit II. Media and cells were removed and centrifuged the samples at 5000 rpm for 10 minutes to remove insoluble material. 50 µl of the soluble fraction was added to each well of a 96 well tissue culture treated, sterile polystyrene plates (Corning, Inc.). 50 µl of the appropriate Reaction Mix (as prepared from the Sigma-Aldrich Lactate Assay Kit II) was added to each well. The plates were mixed using a horizontal shaker for 30 minutes at room temperature while protected from light. The absorbance was read at OD450. The values obtained from the lactate standards were used to plot a standard curve. The amount of lactate in each sample was determined from the standard curve.
Statistical analysis
All data shown signify three independent experiments each with three technical replicates. Data are expressed as the mean ± SEM. Statistical analyses were performed in GraphPad Prism Software v. 8.2.1. Statistical significance was determined using one-way analysis of variance (ANOVA) with post hoc Dunnett’s multiple-comparison test comparing growth in the presence of ca. 5 mg/ml HMOs or carbohydrates to growth in medium alone.
Supplementary Material
Acknowledgements
This work was supported by the National Science Foundation under Grant No. 1847804 to S.D.T. and the National Institutes of Health under Grant No. R01HD090061 to J.A.G. S.D.T. is supported by a Dean’s Faculty Fellowship from the College of Arts & Science at Vanderbilt University and is a fellow of the Alfred P. Sloan foundation and a Camille Dreyfus Teacher-Scholar.
Supporting information for this article is given via a link at the end of the document.
Footnotes
Notes
The authors declare no competing financial interest.
References
- [1].Turroni F, Milani C, Duranti S, Lugli GA, Bernasconi S, Margolles A, Di Pierro F, van Sinderen D, Ventura M, Ital J Pediatr 2020, 46, 16. [DOI] [PMC free article] [PubMed] [Google Scholar]
- [2].Abt MC, Pamer EG, Curr Opin Immunol 2014, 29, 16–22. [DOI] [PMC free article] [PubMed] [Google Scholar]
- [3].Yadeta aT. A., Worku A, Egata G, Seyoum B, Marami D, Berhane Y, Infect Drug Resist 2018, 11, 397–404. [DOI] [PMC free article] [PubMed] [Google Scholar]; Shabayek bS., Spellerberg B, Front Microbiol 2018, 9, 437. [DOI] [PMC free article] [PubMed] [Google Scholar]
- [4].Scasso S, Laufer J, Rodriguez G, Alonso JG, Sosa CG, Int I Gynecol Obstet 2015, 129, 9–12. [DOI] [PubMed] [Google Scholar]
- [5].Phares aC. R., Lynfield R, Farley MM, Mohle-Boetani J, Harrison LH, Petit S, Craig AS, Schaffner W, Zansky SM, Gershman K, Stefonek KR, Albanese BA, Zell ER, Schuchat A, Schrag SJ, JAMA 2008, 299, 2056–2065. [DOI] [PubMed] [Google Scholar]; Lee bC.-C., Hsu J-F, Prasad Janapatla R, Chen C-L, Zhou Y-L, Lien R, Chiu C-H, Sci Rep 2019, 9, 13525. [DOI] [PMC free article] [PubMed] [Google Scholar]; Stoll cB. J., Hansen NI, Sánchez PJ, Faix RG, Poindexter BB, Van Meurs KP, Bizzarro MJ, Goldberg RN, Frantz ID 3rd, Hale EC, Shankaran S, Kennedy K, Carlo WA, Watterberg KL, Bell EF, Walsh MC, Schibler K, Laptook AR, Shane AL, Schrag SJ, Das A, Higgins RD, Pediatrics 2011, 127, 817–826. [DOI] [PMC free article] [PubMed] [Google Scholar]; Polin dR. A., Harris MC, Semin Neonatol 2001, 6, 157–172. [DOI] [PubMed] [Google Scholar]
- [6].Turrentine MA, Ramirez MM, Mastrobattista JM, Infect Dis Obstet Gynecol 2009, 2009, 934698. [DOI] [PMC free article] [PubMed] [Google Scholar]
- [7].Cagno CK, Pettit JM, Weiss BD, Am Fam Physician 2012, 86, 59–65. [PubMed] [Google Scholar]
- [8].Dierikx aT. H., Visser DH, Benninga MA, van Kaam AHLC, de Boer NKH, de Vries R, van Limbergen J, de Meij TGJ, J Infect 2020, 81, 190–204. [DOI] [PubMed] [Google Scholar]; Zimmermann bP., Curtis N, Arch Dis Child Fetal Neonatal Ed 2020, 105, 201–208 [DOI] [PubMed] [Google Scholar]; Kim cH., Sitarik AR, Woodcroft K, Johnson CC, Zoratti E, Curr Allergy Asthma Rep 2019, 19, 22. [DOI] [PMC free article] [PubMed] [Google Scholar]
- [9].Bode L, Glycobiology 2012, 22, 1147–1162. [DOI] [PMC free article] [PubMed] [Google Scholar]
- [10].Ackerman aD. L., Craft KM, Doster RS, Weitkamp JH, Aronoff DM, Gaddy JA, Townsend SD, ACS Infect Dis 2018, 4, 315–324. [DOI] [PMC free article] [PubMed] [Google Scholar]; Ackerman bD. L., Doster RS, Weitkamp JH, Aronoff DM, Gaddy JA, Townsend SD, ACS Infect Dis 2017, 3, 595–605. [DOI] [PMC free article] [PubMed] [Google Scholar]
- [11].Craft aK. M., Gaddy JA, Townsend SD, ACS Chem Biol 2018, 13, 2020–2026. [DOI] [PubMed] [Google Scholar]; Chambers bS. A., Moore RE, Craft KM, Thomas HC, Das R, Manning SD, Codreanu SG, Sherrod SD, Aronoff DM, McLean JA, Gaddy JA, Townsend SD, mBio 2020, 11, e00076–00020. [DOI] [PMC free article] [PubMed] [Google Scholar]
- [12].Ballard O, Morrow AL, Pediatr Clin North Am 2013, 60, 49–74. [DOI] [PMC free article] [PubMed] [Google Scholar]
- [13].Ackerman DL, Craft KM, Townsend SD, Carbohydr Res 2017, 437, 16–27. [DOI] [PMC free article] [PubMed] [Google Scholar]
- [14].Hegar aB, Wibowo Y, Basrowi RW, Ranuh RG, Sudarmo SM, Munasir Z, Atthiyah AF, Widodo AD, Supriatmo M Kadim A Suryawan N Diana R Manoppo C Vandenplas Y, Pediatr Gastroenterol Hepatol Nutr 2019, 22, 330–340. [DOI] [PMC free article] [PubMed] [Google Scholar]; Sangwan bV., Tomar SK, Singh RR, Singh AK, Ali B, J Food Sci 2011, 76, R103–111. [DOI] [PubMed] [Google Scholar]
- [15].Vandenplas Y, Berger B, Carnielli VP, Ksiazyk J, Lagström H, Sanchez Luna M, Migacheva N, Mosselmans JM, Picaud JC, Possner M, Singhal A, Wabitsch M, Nutrients 2018, 10. [DOI] [PMC free article] [PubMed] [Google Scholar]
- [16].Tsunoda aY., Asahara T, Nomoto K, Yoshioka Y, Fukuma E, Pediatric Health Med Ther 2018, 9, 173–180. [DOI] [PMC free article] [PubMed] [Google Scholar]; Kaci bG., Goudercourt D, Dennin V, Pot B, Doré J, Ehrlich SD, Renault P, Blottière HM, Daniel C, Delorme C, Appl Environ Microbiol 2014, 80, 928–934. [DOI] [PMC free article] [PubMed] [Google Scholar]
- [17].Carlsson aJ., Grahnén H, Jonsson G, Wikner S, J Dent Res 1970, 49, 415–418. [DOI] [PubMed] [Google Scholar]; Palma bT. H., Harth-Chú EN, Scott J, Stipp RN, Boisvert H, Salomão MF, Theobaldo JD, Possobon RF, Nascimento LC, McCafferty JW, Faller L, Duncan MJ, Mattos-Graner RO, J Med Microbiol 2016, 65, 1456–1464. [DOI] [PubMed] [Google Scholar]
- [18].Wescombe aP. A., Hale JD, Heng NC, Tagg JR, Future Microbiol 2012, 7, 1355–1371 [DOI] [PubMed] [Google Scholar]; Di Pierro bF., Colombo M, Zanvit A, Risso P, Rottoli AS, Drug, Healthcare Patient Saf 2014, 6, 15–20. [DOI] [PMC free article] [PubMed] [Google Scholar]
- [19].Rajagopal aL, Future Microbiol 2009, 4, 201–221. [DOI] [PMC free article] [PubMed] [Google Scholar]; Kling bD. E., Cavicchio AJ, Sollinger CA, Madoff LC, Schnitzer JJ, Kinane TB, Microb Pathog 2009, 46, 43–52. [DOI] [PubMed] [Google Scholar]
- [20].Spaetgens R, DeBella K, Ma D, Robertson S, Mucenski M, Davies HD, Obstet Gynecol 2002, 100, 525–533. [DOI] [PubMed] [Google Scholar]
- [21].Manning SD, Lewis MA, Springman AC, Lehotzky E, Whittam TS, Davies HD, Clin Infect Dis 2008, 46, 1829–1837. [DOI] [PMC free article] [PubMed] [Google Scholar]
Associated Data
This section collects any data citations, data availability statements, or supplementary materials included in this article.


