Abstract
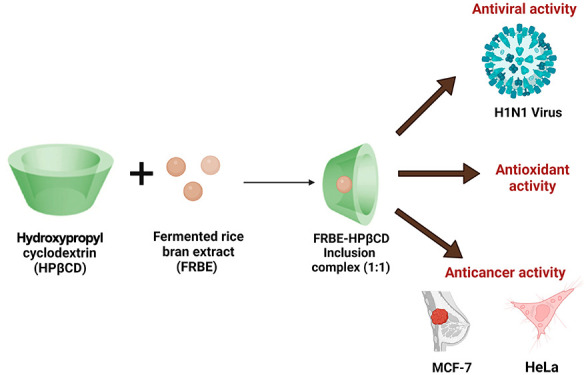
Egyptian rice bran was fermented with baker’s yeast, and released phenolics were extracted with aqueous methanol to give fermented rice bran extract (FRBE). The analysis of the FRBE with ultra-performance liquid chromatography–electrospray ionization–tandem mass spectrometry revealed 21 compounds, mainly phenolic acids and flavonoids. The FRBE was then complexed with (2-hydroxypropyl)-β-cyclodextrin (HPβCD) via noncovalent host–guest inclusion complexation using the thin-film hydration technique to improve the hydrophilicity and bioactivity of the FRBE. The formation of the inclusion complex was confirmed using HPLC, 1H NMR, FT-IR, and a phase solubility study. In addition, the biological activities of the complex were investigated. The FRBE/HPβCD inclusion complex had more pronounced antioxidant, antiviral, and anticancer activities compared to free FRBE. These findings warrant the future investigation of potential medical applications of FRBE.
1. Introduction
Rice bran is a nutrient-rich byproduct that is primarily used as a low-cost cattle feed or discarded as waste.1 The bran constitutes about 10% of the weight of a rice grain and is rich in nutritional components and bioactive phytochemicals such as vitamin E (tocopherols and tocotrienols), γ-oryzanol, and phenolics,2,3 which may positively affect human health.
The content of phenolic acids in rice bran is relatively high; however, nearly 70% of them are present in the ester form with the arabinoxylans present in cell walls.2,4 Accordingly, these compounds have reduced bioavailability. Phenolic acids can be released from their esters by either incubating them with extracellular phenolic esterase and xylanase enzymes or micro-organism fermentation. For industrial applications, fermentation with food-grade micro-organisms is considered a cost-effective and affordable process for liberating and extracting phenolic acids from rice bran powder and increasing their antioxidant activities. Saccharomyces cerevisiae (commercially known as baker’s yeast) has been the most common organism used in baking and brewing since ancient times. Bread containing fermented wheat bran was reported to have better phenolic content and antioxidant activity.5 Being a cost-effective and highly available source with generally recognized as safe (GRAS) status, S. cerevisiae produces enzymes like β-glucosidases, carboxylesterases, and possibly feruloyl esterases.6−8 The aqueous extract of baker’s yeast-fermented rice bran demonstrated antistress and antifatigue effects on rats.9 Additionally, fermented rice bran extract showed an anti-photoaging effect on UV-induced normal skin fibroblast cultures10 and effectively reduced cytotoxicity and inhibited melanogenesis in B16F1 melanoma.11 Despite its promising biomedical applications, fermented rice bran suffers some drawbacks that might hinder its clinical use, such as low hydrophilicity, poor bioavailability, and inability to selectively target the organ of interest. Many delivery vehicles were reported to successfully improve the therapeutic effects of various natural and synthetic drugs via either encapsulation or complexation,12 including nanocapsules,13 chitosan-coated poly(lactic-6-glycolic acid) (PLGA) nanoparticles, supramolecules,14,15 liposomes,16 and PLGA–PEG nanoparticles.17,18
Cyclodextrins (CDs) and their derivatives are amphiphilic supramolecular systems widely used as host molecules to accommodate various therapeutically active guest molecules via noncovalent inclusion complexation.18,19 The resulting host–guest inclusion complexes display improved water solubility, bioavailability, and physicochemical and biological properties. In particular, (2-hydroxypropyl)-β-cyclodextrin (HPβCD) is an extensively used CD derivative due to its biocompatibility and high hydrophilicity.18,19
In this study, the methanolic extract of fermented Egyptian rice bran (FRBE) powder containing ferulic acid as a marker phenolic compound was prepared. The FRBE was then complexed with (2-hydroxypropyl)-β-cyclodextrin (FRBE/HPβCD) using the thin-film hydration approach to improve the water solubility of FRBE and hence enhance its biological activities. The designed complex was characterized using 1H NMR spectroscopy, a phase solubility study, and Fourier transform infrared spectroscopy (FT-IR). Furthermore, the antioxidant, antiviral, and cytotoxic activities were investigated for both free FRBE and the FRBE/HPβCD complex.
2. Materials and Methods
2.1. Materials
2-Hydroxypropyl-β-cyclodextrin was purchased from BLD Pharmatech Co., Limited (Cincinnati, OH). Streptomycin, penicillin, fetal bovine serum, trichloroacetic acid (TCA), Dulbecco’s modified Eagle’s medium (DMEM), and tris(hydroxymethyl)aminomethane (TRIS) were obtained from Lonza (Basel, Switzerland). 2,2-Diphenyl-1-picryl-hydrazyl-hydrate (DPPH), 2,4,6-tripyridyl-6s-triazine (TPTZ), and FeCl3·6H2O were purchased from Sigma-Aldrich (St. Louis, MO). The antimycotic solution and trypsin-EDTA were obtained from Gibco BRL (Grand Island, NY).
2.2. Plant Materials
Heat-stabilized Egyptian rice bran (RB) was obtained from International Trade and Marketing Company (Giza, Egypt). The RB powder used was harvested from the short-grain Japonica rice (Sakha 101) cultivar and composed of 14% fats, including 1.5% free fatty acids; 13% protein, including 7.2% leucine 7.2%, 4.5% lysine, and 4.2% valine; and carbohydrates, including 1.1% fermentable sugars and 25% dietary fiber.
2.3. Fermentation of Rice Bran with Commercial Baker’s Yeast
Fermentation was performed as reported elsewhere20,21 with a slight modification. A sample of the heat-stabilized Egyptian rice bran powder (500 g) was sieved through a 40 mesh sieve and subjected to solid-state fermentation with previously hydrated (with 90 mL of sterile water for 1 h) commercial baker’s yeast (3% w/w). Then, the activated yeast was added to the medium, and the mixture was homogenized. Sterile water was added gradually to make a dough (the ratio of sieved rice bran powder to water was 1:1.5 w/v). The dough was spread in an oven tray, covered with sterile gauze, and statically incubated in the dark at 37 °C for 48 h (the humidity in the incubation area was between 60% and 70%). The dough was left to dry in an oven at 50 °C for 24 h. The dried mass was ground, passed through mesh (420 μm), packed in polyethylene bags (labeled as fermented powder), and stored at −30 °C for future use. Similarly, a sample of RB powder (500 g) treated with the same procedure was hydrated with sterile water (90 mL without baker’s yeast) and processed as above to give the control powder.
2.4. Preparation of Methanolic Extracts (FRBE and RBE)
The dried powder (100 g of the fermented or control powder) was separately extracted with 50% methanol (500 mL × 3) using a sonication bath for 15 min. The extracts were separately concentrated under reduced pressure and freeze-dried to give FRBE (13.5 g) and RBE (12.4 g) from the fermented and control samples, respectively. The phytochemical profile and ferulic acid contents of FRBE and RBE were determined by HPLC as described below (Figure S1).
2.4.1. HPLC Apparatus and Conditions
An Agilent 1100 serial system (Agilent Technologies, Palo Alto, CA) equipped with a quaternary pump and a G1322A-series1200 online degasser was used. Agilent Chemstation software was used for data acquisition and processing. The HPLC analysis was carried out on a reversed-phase column (C18, 5 μm particle size, 250 × 4 mm column, Merck, Germany) provided with a C-18 guard column, and the temperature was maintained at 25 °C. The mobile phase was composed of acetonitrile (solvent A) and 0.3% H3PO4 in H2O (solvent B) using the gradient elution mode from 18% A/B to 35% A/B in 17 min, then 100% A in 1 min, at a flow rate of 1 mL/min and an injection volume of 20 mL. UV detection was set at 325 nm.
2.4.2. HPLC Quantification of Ferulic Acid (FA)
The content of ferulic acid (FA), the major phenolic acid in the RBE and FRBE, was determined by HPLC using a standard curve of FA. The standard curve of FA was constructed by dissolving an aliquot (4 mg) of FA (Sigma-Aldrich Chemical Co., St. Louis, MO) in 5 mL of methanol. The solution (800 mg/mL) was stored at 4 °C. Five serial concentrations of the stock solution in methanol, namely 2.56, 6.40, 12.8, 32.0, and 64.0 mg/mL, were prepared. Aliquots (20 mL) of each were injected in triplicate in the HPLC system, and the calibration curve was constructed by plotting the mean peak area versus the concentration. Linearity was assessed by the linear regression method and calculated by the least-squares method. The correlation coefficient (R2) of the standard calibration curve was 0.9998, and the linearity of the peak of FA was in the concentration range of 2.56–64.0 mg/mL.
Then, 50 mg samples of powdered FRBE and RBE were transferred to a 5 mL measuring flask and reconstituted in 50% aqueous methanol with sonication. The measuring flask was completed to the mark with the solvent, and the sample was filtered through a 0.45 mm membrane filter before HPLC analysis. The FA contents in FRBE and RBE were calculated to be 0.697 ± 0.011 and 0.318 ± 0.011 mg/g extract, respectively.
2.5. UPLC/ESI-MS-MS Analysis of the Fermented Rice Bran Extract
The LC-MS-MS characterization was carried out on Xevo TQD triple quadrupole system (Waters Corporation, Milford, MA) equipped with an ESI source. The ion trap MS system was coupled to a UPLC instrument equipped with a reversed-phase C-18 column (Acquity UPLC BEH C18 column, 1.7 μm particle size, 2.1 × 50 mm column). The analysis was performed according to the method and parameters that were developed by Bakr et al. 2021,22 with slight modifications in the mobile phase gradient flow as follows: 0–2 min, 5% B; 2–5 min, 5–20% B; 5–15 min, 20–30% B; 15–22 min, 30–50% B; 22–25 min, 50%B; 25–26 min, 50–80% B; 26–29 min, 80–5%; and 29–30 min, 5% B. Solvent A was water and solvent B was acetonitrile, and both were acidified with 0.1% formic acid.
2.6. Fabrication of the Methanolic Extract of the Fermented Egyptian Rice Bran Extract–(2-Hydroxypropyl)-β-cyclodextrin Host–Guest Complex (FRBE/HPβCD)
The FRBE/HPβCD host–guest complex was prepared by thin-film hydration.23 Concisely, the FRBE powder was dissolved in a sufficient amount of methanol. Then, the resulting solution was evaporated under reduced pressure in a round-bottom flask using a rotary evaporator to form a thin film. Afterward, the thin film was hydrated with a HPβCD solution (5% w/v). The obtained complex solution was then sonicated for 45 min using a bath sonicator (Elmasonic P30 H, Elma Hans Schmidbauer, Singen, Germany). Then, the complex solution was filtered through a 0.22 μm nylon filter (for purification), then freeze-dried using a TOPTION TOPT-10C freeze-dryer (Toption Group Co., Xi’an, China). A sample (25 mL) of the FRBE/HPβCD complex solution was concentrated to 4 mL under reduced pressure, then transferred to a 5 mL measuring. The volume was made up to the mark with water. The concentrated solution was filtered through a 0.45 μm membrane filter before the HPLC analysis. Similarly, the HPβCD solution (5% w/v) was filtered and analyzed by HPLC (used as blank).
2.7. 1H NMR Spectroscopy of the FRBE/HPβCD Inclusion Complex
1H NMR spectra of HPβCD and the FRBE/HPβCD complex were obtained at room temperature on a 400 MHz FT-NMR spectrometer (ECA-500, JEOL, Tokyo, Japan) in deuterium oxide using a scanning range of 1–13 ppm.
2.8. FT-IR Spectroscopy of the FRBE/HPβCD Inclusion Complex
The FT-IR spectra of free FRBE, HPβCD, and the prepared inclusion complex were recorded via Fourier transform infrared (FT-IR) spectroscopy using an FTIR-8400s (Shimadzu, Japan) spectrometer. Samples were first compressed with KBr into disks and then scanned, and spectra were recorded in the range of 500–4000 cm–1.
2.9. Phase Solubility Study
The generation of the FRBE/HPβCD complex was confirmed, and the stoichiometry of the complex was determined by conducting a phase solubility study as detailed by Higuchi and Connors, with slight modifications.18,23 Aqueous solutions (5 mL) containing various concentrations of HPβCD (0–14 mM) were added to an excess amount of FRBE. The obtained mixtures were then wrapped and shaken at 25 °C until equilibrium was reached. Afterward, the mixtures were centrifuged at 5000 rpm for 15 min (Hermle Z326 K, Germany), and the supernatant was analyzed using a UV spectrophotometer (FLUOstar Omega microplate reader, BMG Labtech, Offenburg, Germany). The absorbance was measured at 260 nm.24,25
The stability constant (Ks) was determined using eq 1.18,24,25
| 1 |
where S is the slope of the linear correlation and S0 is the intrinsic solubility. The stability constant was estimated using ferulic acid, since HPLC analysis revealed that this compound was the marker compound.
2.10. Total Antioxidant Activity
DPPH and FRAP assays were used to evaluate the antioxidant activities of HPβCD, FRBE, and the FRBE-HPβCD inclusion complex as detailed in our previously reported methods.13,14,26−28
2.11. Cytopathic Effect (CPE) Reduction Antiviral Assay
The antiviral assay was done using human influenza H1N1 and Madin–Darby canine kidney (MDCK) cells. The cytopathic effect (CPE) reduction test was used to investigate the antiviral activities of HPβCD, FRBE, and the FRBE/HPβCD inclusion complex in cell culture systems as described in our previously reported method.18
2.12. Cell Viability Assay (Sulforhodamine B Colorimetric (SRB) Assay)
Cervical cancer (HeLa) and breast adenocarcinoma (MCF-7) cell lines were treated with various concentrations of HPβCD, FRBE, and the FRBE/HPβCD inclusion complex. The cell viability of cancer cells was assessed using the SRB assay, and the IC50 (μg/mL) values were calculated using our previously reported methods.13,14
2.13. Statistical Analysis
All tests were carried out in triplicate, and mean values were computed. Data are presented as the mean ± SD. Data analysis was conducted using the two-tailed Student’s t test at a confidence interval of 95% (considering the difference statistically significant when the p < 0.05).
3. Results and Discussion
3.1. Analysis of the Fermented Rice Bran Extract by UPLC/ESI-MS-MS
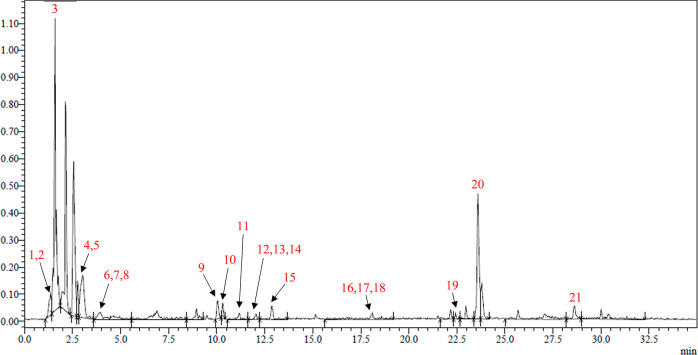
The LC-MS-MS analysis of the FRBE led to the tentative identification of 21 compounds (Figure 1 and Table 1). Compound 1 was tentatively identified as a nitrogenous compound, with no evidence of its molecular formula. Pantolactone (2), 2-octanal (8), and heptanal (11) were detected previously as volatile members of the unpleasant aroma of the rice bran.29 Gluconic acid (3) and citric acid (5) were previously identified in fermented rice bran extract from aLentinus edodes liquid mycelia culture.30 In a recent study of the effect of fermentation with Trichoderma viride on the defatted rice bran, succinic acid (4), p-coumaric acid (13), ferulic acid (15), and p-hydroxybenzoic acid (16) were detected as examples of organic and phenolic acids released from the bound polyphenols. Moreover, two phenolic acids, cinnamic acid (6) and coumaroyl quinic acid (17), were identified; both were previously detected in the extract of rice bran fermented by Aspergillus strains and in red- and black-pigmented rice bran, respectively.31,32 Five flavonoids were tentatively identified as irilone (7), apigenin-6/8-C-pentoside-8/6-C-hexoside (9), tectoridin (12), hispidulin (14), and dimethyl quercetin (20). Compounds 7, 12, 14, and 20 were previously identified in a pigmented rice bran variety,32 while compound 9 was previously identified in the extracts of rice seeds.33 Four fatty acid derivatives were identified: pentadecanoic acid (10), which was previously detected in solid-state rice bran fermented with Pleurotus sapidus,34 methyl stearate (18), hydroxyeicosanoic acid (19), and methyl stearate (21), which were also identified in rice bran oil.35,36
Figure 1.
UPLC-ESI-MS/MS ion chromatogram (in the negative ion mode) of the fermented rice bran extract, which was separated on an ACQUITY UPLC-BEH C18 1.7 μm and 2.1 × 50 mm column.
Table 1. LC-MS-MS Analysis in the Negative Mode of the Fermented Rice Bran Extract.
| no. | name | Rt | molecular formula | MS1 [M – H]− | MS2 | refs |
|---|---|---|---|---|---|---|
| 1 | unidentified nitrogenous compound | 1.31 | 194 | 176, 149, 74, 59 | ||
| 2 | pantolactone | 1.34 | C6H10O3 | 129 | 127 | (29) |
| 3 | gluconic acid | 1.58 | C6H12O7 | 195 | 129, 99, 75, 59 | (30) |
| 4 | succinic acid | 3.02 | C4H6O4 | 117 | 99, 73 | (37) |
| 5 | citric acid | 3.05 | C?H?O? | 191 | 129, 111, 87, 85 | (30,37) |
| 6 | cinnamic acid | 3.96 | C9H8O2 | 147 | 103 | (31) |
| 7 | irilone | 3.99 | C16H10O6 | 297 | 205, 93 | (32) |
| 8 | 2-octanal | 4.01 | C8H14O | 125 | 97, 55 | (29) |
| 9 | apigenin-6/8-C-pentoside-8/6-C-hexoside | 10.05 | C26H28O14 | 563 | 503, 473, 383 | (33) |
| 10 | pentadecanoic acid | 10.31 | C15H30O2 | 241 | 223, 195 | (34) |
| 11 | heptanal | 11.18 | C7H14O | 113 | 85, 69 | (29) |
| 12 | tectoridin | 12.01 | C22H22O11 | 461 | 325, 279 | (32) |
| 13 | p-coumaric acid | 12.05 | C9H8O3 | 163 | 119 | (31,32,37,38) |
| 14 | hispidulin | 12.09 | C16H12O6 | 299 | 284 | (32) |
| 15 | ferulic acid | 12.87 | C10H10O4 | 193 | 178, 149, 134, 106 | (31,32,37,38) |
| 16 | p-hydroxybenzoic acid | 18.1 | C7H6O3 | 137 | 93 | (37,38) |
| 17 | coumaroylquinic acid | 18.19 | C16H18O8 | 337 | 191, 119 | (32) |
| 18 | methyl stearate | 18.3 | C19H38O2 | 297 | ND | (35) |
| 19 | hydroxyeicosanoic acid | 22.43 | C20H40O3 | 327 | ND | (36) |
| 20 | dimethyl quercetin | 22.97 | C17H14O7 | 329 | 283 | (32) |
| 21 | methyl palmitate | 28.61 | C17H34O2 | 293 | ND | (35) |
4.2. Characterization of the Fabricated FRBE/HPβCD Inclusion Complex
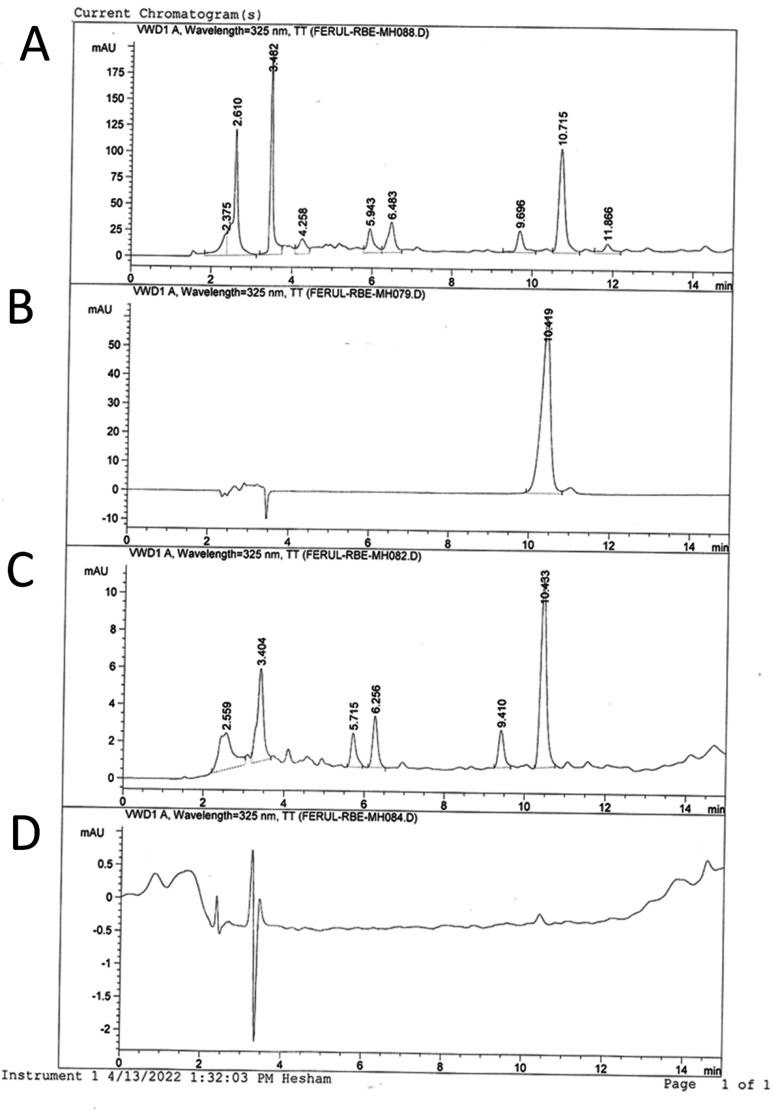
The FRBE used to form an inclusion complex with HPβCD was analyzed by HPLC (measured at 325 nm), which yielded a characteristic profile. The ferulic acid content was 0.69 mg/g of extract (Figure S1). On the other hand, the formation of the FRBE/HPβCD inclusion complex was confirmed by superimposing HPLC profile of the FRBE/HPβCD complex onto that of FRBE (Figure 2) and supported by the FRBE-induced chemical shift of the inside protons of the HPβCD cavity (section 4.2.1). Additionally, the FT-IR spectra of FRBE, HPβCD, and the inclusion complex (section 4.2.2) support the inclusion of FRBE in the cavity of the HPβCD.
Figure 2.
HPLC profiles of (A) FRBE, (B) standard ferulic acid, (C) the FRBE/HPβCD inclusion complex, and (D) plain HPβCD (blank).
4.2.1. 1H NMR Spectroscopy of the FRBE/HPβCD Inclusion Complex
1H NMR analyses can confirm the formation of host–guest complexation between HPβCD and other guest molecules. Moreover, they give more insights into whether the guest molecule is incorporated within the host hydrophobic cavities (inclusion complexation) or externally bound to the host molecule. In the case where the guest molecule is included in the HPβCD cavity, remarkable upfield shifts of the protons positioned in the inner cavity (H-3 and H-5) are caused by the shielding effect of the guest. However, minor chemical shifts (either upfield or downfield) will take place in the case of the protons located on the external surface of HPβCD (H-1, H-2, H-4, and H-6).39−42
Herein, the formation of the FRBE/HPβCD complex was suggested on the basis of alterations in the chemical shifts (Δδ, ppm) of the protons of free HPβCD as compared to the chemical shifts the protons of HPβCD complexed to FRBE (Figure S2). The 1H NMR chemical shifts (Δδ, ppm) of HPβCD protons in the absence and presence of FRBE are shown in Table 2. In this way, it was demonstrated that the protons inside the HPβCD cavity (H-3 and H-5) had undergone higher FRBE-induced chemical shifts than those on the external surface (H-1, H-2, H-4, and H-6). The stronger upfield shifts of the inner protons are attributed to the presence of the FRBE’s aromatic rings inside the cavity of HPβCD. These findings suggest that FRBE is complexed with HPβCD via host–guest inclusion complexation.
Table 2. Induced Chemical Shifts (δ, ppm) of the Protons of Free HPβCD Compared to Those of the Protons of HPβCD Complexed to FRBE.
| HPβCD | H-1 | H-2 | H-3 | H-4 | H-5 | H-6 |
|---|---|---|---|---|---|---|
| δHPβCD | 4.898 | 3.548 | 3.767 | 3.472 | 3.310 | 3.849 |
| δFRBE/HPβCD complex | 4.909 | 3.557 | 3.797 | 3.467 | 3.339 | 3.854 |
| Δδ | –0.011 | –0.009 | –0.03 | 0.005 | –0.029 | –0.004 |
4.2.2. FT-IR Analysis of the FRBE/HPβCD Inclusion Complex
The FT-IR spectra of FRBE, HPβCD, and the inclusion complex were compared to assess the inclusion of FRBE in the cavity of the HPβCD (Figure 3). Changes in the shape and intensity of the guest’s FT-IR peaks could give insights into the formation of inclusion complexes.42
Figure 3.
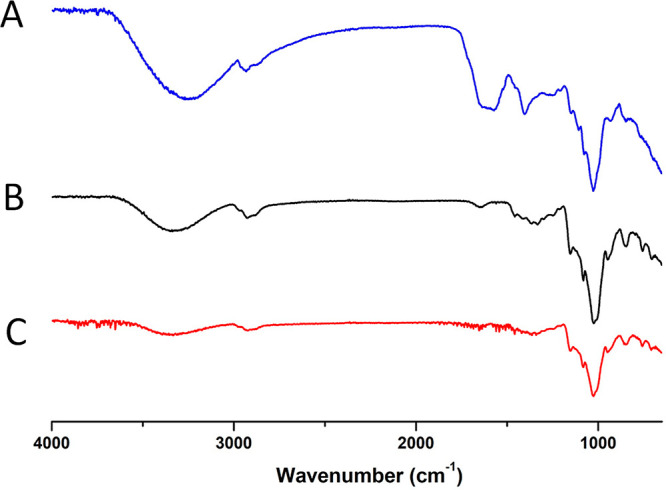
Fourier transform infrared (FT-IR) spectra of (A) FRBE, (B) HPβCD, and (C) the FRBE/HPβCD inclusion complex.
In the present study, the FT-IR spectrum of FRBE showed four characteristic peaks at 3420.0 (−OH stretching vibrations), 1620.0 (C=O stretching), 1400.0 (−CH bending), and 1099.0 cm–1 (C–O–C), (Figure 2). The FT-IR spectra of both HPβCD and the FRBE/HPβCD complex are similar due to the low amount of FRBE in the medium due to its inclusion within the HPβCD cavity. On the other hand, some variations were observed in the peaks of the FRBE after its inclusion in HPβCD. The peak at 1620.0 cm–1 (C=O stretching) disappeared. Additionally, the intensity of the peak at 3420.0 cm1 (−OH stretching vibrations) was considerably reduced. These findings suggest the inclusion of the FRBE in the cavity of HPβCD.
4.2.3. Phase Solubility Study
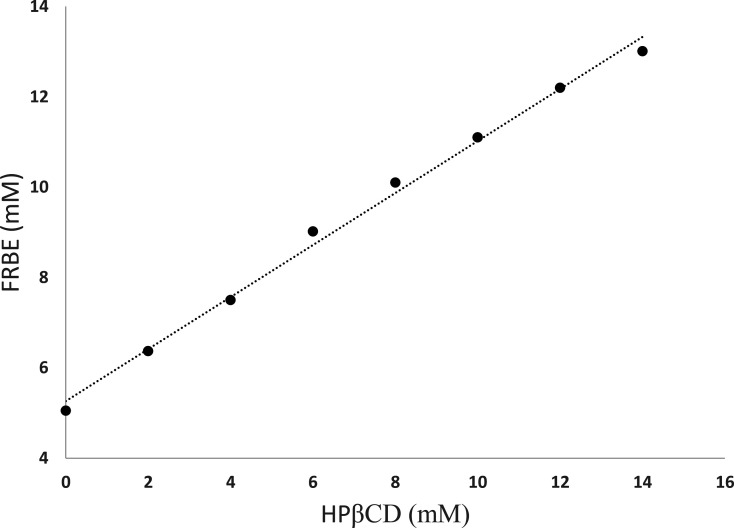
The solubility of FRBE was studied by plotting the change in its concentration with the HPβCD concentration at 25 °C, as demonstrated in Figure 4. Furthermore, the phase solubility study was used to determine the stoichiometry and the stability constant of the FRBE/HPβCD complex. The solubility of FRBE increased gradually with the concentration of HPβCD, suggesting a linear relationship with an R2 value of 0.995. As reported previously, the obtained phase solubility diagram follows the AL-type pattern, suggesting host–guest complexation with a molar ratio of 1:1 (FRBE/HPβCD).18,24 Furthermore, the slope was more than 0.0 and less than 1.0, confirming the stoichiometry of 1:1.24 Moreover, the solubility of FRBE was about five-times higher than its intrinsic solubility. The value of the intercept, the slope of the phase solubility diagram, and the estimated stability constant value of the FRBE/HPβCD complex are presented in Table 3. The calculated stability constant was 256.3 M–1, suggesting the reasonable stability of the designed inclusion complex.25
Figure 4.
Phase solubility study of FRBE in the presence of various increasing concentrations of HPβCD.
Table 3. Phase Solubility Study Parameters and the Estimated Stability Constant (Ks) of the FRBE/HPβCD Inclusion Complex.
| complex | intercept | slope | R2 | stability constant (Ks, M–1) |
|---|---|---|---|---|
| FRBE/HPβCD | 0.0053 | 0.576 | 0.995 | 256.3 |
4.2.4. Total Antioxidant Activity
The antioxidant activities of the FRBE/HPβCD inclusion complex, HPβCD, and free FRBE were studied and compared using DPPH and FRAP assays (Figure 5). The findings were expressed with reference to the Trolox standard as a micromoles Trolox equivalent (TE) per milligram of the sample. The designed FRBE/HPβCD inclusion complex exhibited higher antioxidant activities of 151.30 ± 10.73 and 81.59 ± 2.58 μM TE/mg complex as compared to those of the free FRBE (9.65 ± 2.30 and 7.09 ± 2.26 μM TE/mg complex) when assessed by DPPH and FRAP assays, respectively. On the other hand, HPβCD showed no antioxidant activity. The antioxidant activity of FRBE is attributed to the presence of phenolic acids (mainly ferulic acid) and flavonoids that can scavenge free radicals.43 Moreover, the inclusion of FRBE in the HPβCD cavity improved the former’s water solubility and hence its contact with the hydrophilic free radicals, leading to a dramatic increase in its antioxidant activity compared to that of free FRBE.44
Figure 5.
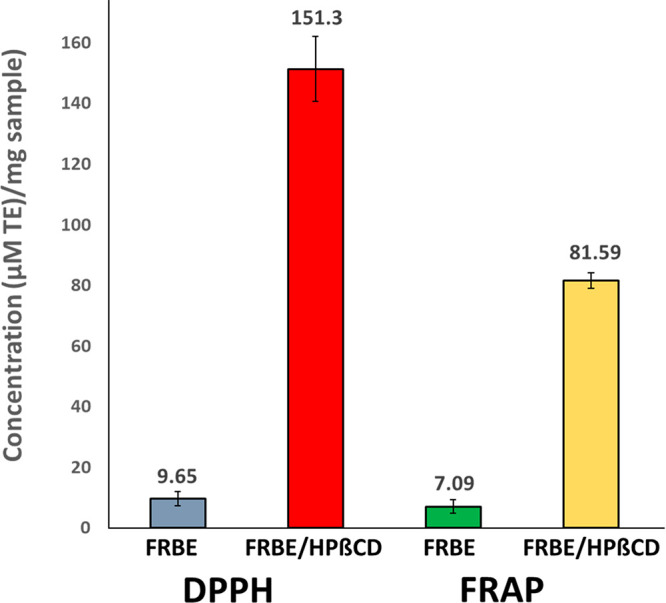
DPPH and FRAP assays of the FRBE/HPβCD inclusion complex compared to those of FRBE. Antioxidant activities are expressed with reference to the Trolox standard as micromoles Trolox equivalent (TE) per milligram of the complex. Data are presented as the mean ± standard deviation (n = 3).
4.2.5. Cytotoxicity and Antiviral Activity Assays
To date, synthetic antiviral agents suffer from many shortcomings, including severe adverse reactions, nonselectivity, and resistance.18 This requires the exploration of natural alternatives that are more potent, safe, and can overcome drug resistance. In this study, the antiviral activity of FRBE was investigated against influenza A (H1N1) and compared to those of the FRBE/HPβCD inclusion complex and HPβCD using the cytopathic effect (CPE) reduction assay (Table 4). HPβCD exhibited no antiviral activity. FRBE showed moderate antiviral activity and had a minimum impact on MDCK host cells (IC50 of 9.5 μg/mL, CC50 of 63.9 μg/mL, and selectivity index (CC50/IC50) of 6.7). On the other hand, the fabricated FRBE/HPβCD inclusion complex exhibited more potent antiviral activity (fivefold) against the H1N1 influenza virus with a negligible effect on the host cells (IC50 of 2.1 μg/mL, CC50 of 91.8 μg/mL, and selectivity index of 43.5).
Table 4. Antiviral Activities of HPβCD, FRBE, and the FRBE/HPβCD Inclusion Complex against the Influenza A (H1N1) Virus.
| sample | CC50 (μg/mL) | IC50 (μg/mL) | selectivity index (SI) |
|---|---|---|---|
| HPβCD | 0 | 0 | 0 |
| FRBE | 63.9 | 9.5 | 6.7 |
| FRBE/HPβCD inclusion complex | 91.8 | 2.1 | 43.5 |
FRBE contains five flavonoid compounds, namely irilone, apigenin-6/8-C-pentoside-8/6-C-hexoside, tectoridin, hispidulin, and dimethyl quercetin. These flavonoids exert antiviral activity by inhibiting viral RNA polymerases and proteases and, at the same time, altering the viral proteins.45 The enhanced antiviral activity of the prepared inclusion complex, compared to that of free FRBE, can probably be attributed to the increased hydrophilicity of the guest (after its complexation with HPβCD) and, consequently, its pharmacological activity.46
4.2.6. Cell Viability Assay
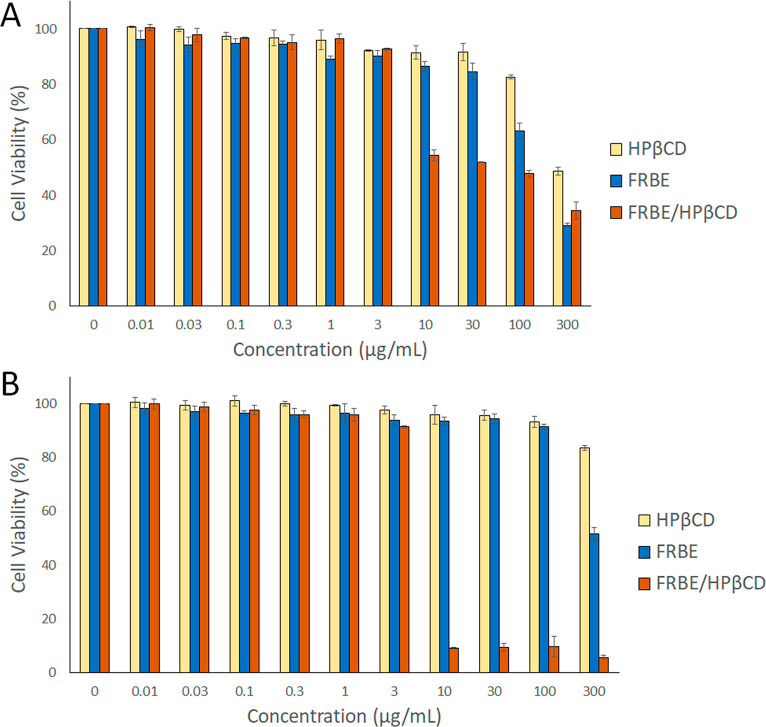
Cell viabilities of breast adenocarcinoma (MCF-7) and cervical cancer (HeLa) cell lines treated with various concentrations (0.01–300 μg/mL) of HPβCD, FRBE, and the FRBE/HPβCD inclusion complex were evaluated using the sulforhodamine B (SRB) assay (Table 5 and Figure 6). The HPβCD host displayed no significant cytotoxicity on either cancer cell line. After 48 h of incubation, MCF-7 and HeLa cell lines showed a statistically significant decrease (p < 0.05) in cell viability when treated with the FRBE/HPβCD inclusion complex, with IC50 values of 0.60 ± 0.02 and 0.50 ± 0.01 μg/mL, compared to those treated with equivalent concentrations of FRBE, with IC50 values of 145.9 ± 1.7 and 312.2 ± 2.5 μg/mL, respectively. The inclusion of FRBE in the HPβCD cavity dramatically improved the former’s cytotoxicity on both cancer cells. Several studies reported the use of HPβCD as a host molecule for many natural and synthetic drugs to improve their anticancer activities.47,48 Including drugs in the HPβCD cavity offers many advantages, such as improving water solubility, stability, and bioavailability while preserving bioactivity. Furthermore, HPβCD protects drug molecules from any unintended reactions that might cause their degradation and facilitates the diffusion of drugs to their site of action without the loss of their biological activities.47,48 This study also shed more light on the potential of the anticancer activity of FRBE, which is attributed to the phenolic acids. The main phenolic acid is ferulic acid, which minimizes DNA single-strand breaks and lipid peroxidation by increasing the levels of cytoprotective enzymes and scavenging the reactive oxygen species inside the cells.49
Table 5. In Vitro Cytotoxic Activities of HPβCD, FRBE, and the FRBE/HPβCD Inclusion Complex against MCF-7 and HeLa after 48 h of Treatmenta.
|
in
vitro cytotoxic activity (IC50, μg/mL) |
|||
|---|---|---|---|
| cells | HPβCD | FRBE | FRBE/HPβCD |
| MCF-7 | 310.0 ± 3.7 | 145.9 ± 1.7 | 0.6 ± 0.02 |
| HeLa | >300 | 312.2 ± 2.5 | 0.5 ± 0.01 |
Data represent the mean ± standard deviation of triplicate values.
Figure 6.
SRB assay of (A) MCF-7 and (B) HeLa cancer cell lines treated with HPβCD, FRBE, and the FRBE/HPβCD inclusion complex at several concentrations (0.01–300 μg/mL). A statistically significant increase in cytotoxicity was evident during treatments with the FRBE/HPβCD inclusion complex compared to treatments with FRBE at concentrations ≥10 μg/mL (p < 0.05).
5. Conclusions
In this study, Egyptian rice bran was fermented using dry yeast, and the major phenolics were released and extracted. Twenty-one different compounds in the FRBE extract were annotated using UPLC/ESI-MS. FRBE powder containing ferulic acid as a marker phenolic compound was then included within the cavity of HPβCD via host–guest interactions to improve the former’s water solubility, stability, and biological activity. The FRBE/HPβCD inclusion complex displayed antioxidant and anticancer activities better than those of free FRBE. Additionally, the prepared complex demonstrated potent antiviral activity against the H1N1 influenza virus while having a minimal cytotoxic effect on the MDCK host cells.
Acknowledgments
This work was supported by a grant from the American University in Cairo to H.M.E.A.
Supporting Information Available
The Supporting Information is available free of charge at https://pubs.acs.org/doi/10.1021/acsomega.2c01281.
HPLC profiles of the methanolic extracts of fermented rice bran extract (FRBE) and nonfermented rice bran extract (RBE) and 1H NMR spectra of HPβCD and the FRBE/HPβCD complex (PDF)
Author Contributions
∇ These authors contributed equally to this work.
The authors declare no competing financial interest.
Supplementary Material
References
- Ryan E. P. Bioactive food components and health properties of rice bran. J. Am. Vet. Med. Assoc. 2011, 238 (5), 593–600. 10.2460/javma.238.5.593. [DOI] [PubMed] [Google Scholar]
- Călinoiu L. F.; Vodnar D. C. Whole grains and phenolic acids: A review on bioactivity, functionality, health benefits and bioavailability.. Nutrients 2018, 10, 1615. 10.3390/nu10111615. [DOI] [PMC free article] [PubMed] [Google Scholar]
- Zhu D.; Sánchez-Ferrer A.; Nyström L. Antioxidant activity of individual steryl ferulates from various cereal grain sources. J. Nat. Prod. 2016, 79 (79), 308–16. 10.1021/acs.jnatprod.5b00880. [DOI] [PubMed] [Google Scholar]
- Cai S.; Wang O.; Wu W.; Zhu S.; Zhou F.; Ji B.; Gao F.; Zhang D.; Liu J.; Cheng Q. Comparative study of the effects of solid-state fermentation with three filamentous fungi on the total phenolics content (TPC), flavonoids, and antioxidant activities of subfractions from oats (Avena sativa L.). J. Agric. Food Chem. 2012, 60 (1), 507–513. 10.1021/jf204163a. [DOI] [PubMed] [Google Scholar]
- Joginder S. D.; Kamal M.; Pardeep K. S.; Pooja S.; Surekha Bio-enrichment of phenolics and free radicals scavenging activity of wheat (WH-711) fractions by solid state fermentation with Aspergillus oryzae. Afr. J. Biochem. Res. 2016, 10 (2), 12–19. 10.5897/AJBR2015.0854. [DOI] [Google Scholar]
- Lomolino G.; Lante A.; Crapisi A.; Spettoli P.; Curioni A. Detection of Saccharomyces cerevisiae carboxylesterase activity after native and sodium dodecyl sulfate electrophoresis by using fluorescein diacetate as substrate. Electrophoresis 2001, 22, 1021–1023. . [DOI] [PubMed] [Google Scholar]
- Coghe S.; Benoot K.; Delvaux F.; Vanderhaegen B.; Delvaux F. R. Ferulic acid release and 4-vinylguaiacol formation during brewing and fermentation: Indications for feruloyl esterase activity in Saccharomyces cerevisiae. J. Agric. Food Chem. 2004, 52, 602–608. 10.1021/jf0346556. [DOI] [PubMed] [Google Scholar]
- Hernández L. F.; Espinosa J. C.; Fernández-González M.; Briones A. β-glucosidase activity in a Saccharomyces cerevisiae wine strain. Int. J. Food Microbiol. 2003, 80, 171–176. 10.1016/S0168-1605(02)00149-6. [DOI] [PubMed] [Google Scholar]
- Kim K. M.; Yu K. W.; Kang D. H.; Suh H. J. Anti-stress and anti-fatigue effect of fermented rice bran. Phytother. Res. 2002, 16, 700–702. 10.1002/ptr.1019. [DOI] [PubMed] [Google Scholar]
- Seo Y. K.; Jung S. H.; Song K. Y.; Park J. K.; Park C. S. Anti-photoaging effect of fermented rice bran extract on UV-induced normal skin fibroblasts. Eur. Food Res. Technol. 2010, 231, 163–9. 10.1007/s00217-010-1261-3. [DOI] [Google Scholar]
- Chung S. Y.; Seo Y. K.; Park J. M.; Seo M. J.; Park J. K.; Kim J. W.; Park C. S. Fermented rice bran downregulates MITF expression and leads to inhibition of α-MSH induced melanogenesis in B16F1 melanoma. Biosci Biotechnol Biochem. 2009, 73, 1704–10. 10.1271/bbb.80766. [DOI] [PubMed] [Google Scholar]
- Tammam S. N.; Azzazy H. M. E. A.; Lamprecht A. Biodegradable Particulate Carrier Formulation and Tuning for Targeted Drug Delivery. J. Biomed Nanotechnol. 2015, 11, 555–577. 10.1166/jbn.2015.2017. [DOI] [PubMed] [Google Scholar]
- Fahmy S. A.; Issa M. Y.; Saleh B. M.; Meselhy M. R.; Azzazy H. M. E. S. Peganum harmala alkaloids self-assembled supramolecular nanocapsules with enhanced antioxidant and cytotoxic activities. ACS Omega 2021, 6 (18), 11954–11963. 10.1021/acsomega.1c00455. [DOI] [PMC free article] [PubMed] [Google Scholar]
- Azzazy H.M.E.-S.; Fahmy S. A.; Mahdy N. K.; Meselhy M. R.; Bakowsky U. Chitosan-Coated PLGA Nanoparticles Loaded with Peganum harmala Alkaloids with Promising Antibacterial and Wound Healing Activities. Nanomaterials 2021, 11, 2438. 10.3390/nano11092438. [DOI] [PMC free article] [PubMed] [Google Scholar]
- Fahmy S. A.; Ponte F.; Fawzy I. M.; Sicilia E.; Azzazy H.M.E.-S. Betaine host–guest complexation with a calixarene receptor: Enhanced in vitro anticancer effect. RSC Adv. 2021, 11, 24673–24680. 10.1039/D1RA04614D. [DOI] [PMC free article] [PubMed] [Google Scholar]
- Fahmy S. A.; Ponte F.; Sicilia E.; El-Said Azzazy H. M. Experimental and Computational Investigations of Carboplatin Supramolecular Complexes. ACS Omega 2020, 5, 31456–31466. 10.1021/acsomega.0c05168. [DOI] [PMC free article] [PubMed] [Google Scholar]
- El-Shafie S.; Fahmy S. A.; Ziko L.; Elzahed N.; Shoeib T.; Kakarougkas A. Encapsulation of nedaplatin in novel pegylated liposomes increases its cytotoxicity and genotoxicity against a549 and u2os human cancer cells. Pharmaceutics 2020, 12, 863. 10.3390/pharmaceutics12090863. [DOI] [PMC free article] [PubMed] [Google Scholar]
- Fahmy S. A.; Mahdy N. K.; Al Mulla H.; ElMeshad A. N.; Issa M. Y.; Azzazy H.M.E.-S. PLGA/PEG Nanoparticles Loaded with Cyclodextrin-Peganum harmala Alkaloid Complex and Ascorbic Acid with Promising Antimicrobial Activities. Pharmaceutics 2022, 14, 142. 10.3390/pharmaceutics14010142. [DOI] [PMC free article] [PubMed] [Google Scholar]
- Nikolic I. L.; Savic I. M.; Popsavin M. M.; Rakic S. J.; Mihajilov-Krstev T. M.; Ristic I. S.; Eric S. P.; Savić-Gajic I. M. Preparation, characterization and antimicrobial activity of inclusion complex of biochanin A with (2-hydroxypropyl)-β-cyclodextrin. J. Pharm. Pharmacol. 2018, 70 (70), 1485–1493. 10.1111/jphp.13003. [DOI] [PubMed] [Google Scholar]
- Feddern V.; Furlong E. B.; Soares L. A. Efeitos da fermentação nas propriedades físico-químicas e nutricionais do farelo de arroz. Food Science and Technology 2007, 27, 800–4. 10.1590/S0101-20612007000400020. [DOI] [Google Scholar]
- Christ-Ribeiro A.; Chiattoni L. M.; Mafaldo C. R.; Badiale-Furlong E.; de Souza-Soares L. A. Fermented rice-bran by Saccharomyces cerevisiae: Nutritious ingredient in the formulation of gluten-free cookies. Food Bioscience. 2021, 40, 100859. 10.1016/j.fbio.2020.100859. [DOI] [Google Scholar]
- Bakr R. O.; Shahat E. A.; Elissawy A. E.; Fayez A. M.; Eldahshan O. A. Evaluation of the hepatoprotective activity of Pulicaria incisa subspecies candolleana and in silico screening of its isolated phenolics. J. Ethnopharmacol 2021, 271, 113767. 10.1016/j.jep.2020.113767. [DOI] [PubMed] [Google Scholar]
- Higuchi T.; Connors K. A. Phase Solubility Techniques. Adv. Anal. Chem. Instrum. 1965, 4, 117–212. [Google Scholar]
- Kurkov S. V.; Ukhatskaya E. V.; Loftsson T. Drug/cyclodextrin: Beyond inclusion complexation. J. Incl. Phenom. Macrocycl. Chem. 2011, 69, 297–301. 10.1007/s10847-010-9756-x. [DOI] [Google Scholar]
- Savic-Gajic I.; Savic I. M.; Nikolic V. D.; Nikolic L. B.; Popsavin M. M.; Kapor A. J. Study of the solubility, photostability and structure of inclusion complexes of carvedilol with β-cyclodextrin and (2-hydroxypropyl)-β-cyclodextrin. J. Incl Phenom Macrocycl Chem. 2016, 86, 7–17. 10.1007/s10847-016-0635-y. [DOI] [Google Scholar]
- Boly R.; Lamkami T.; Lompo M.; Dubois J.; Guissou G. I. DPPH Free Radical Scavenging Activity of Two Extracts from Agelanthus dodoneifolius (Loranthaceae) Leaves. Int. J. Toxicol. Pharmacol. Res. 2016, 8 (1), 29–34. [Google Scholar]
- Chen Z.; Bertin R.; Froldi G. EC50 estimation of antioxidant activity in DPPH assay using several statistical programs. Food Chem. 2013, 138, 414–420. 10.1016/j.foodchem.2012.11.001. [DOI] [PubMed] [Google Scholar]
- Benzie I. F.; Strain J. J. The ferric reducing ability of plasma (FRAP) as a measure of “antioxidant power”: The FRAP assay. Anal. Biochem. 1996, 239, 70–76. 10.1006/abio.1996.0292. [DOI] [PubMed] [Google Scholar]
- Gao C.; Li Y.; Pan Q.; Fan M.; Wang L.; Qian H. Analysis of the key aroma volatile compounds in rice bran during storage and processing via HS-SPME GC/MS. J. Cereal Sci. 2021, 99, 103178. 10.1016/j.jcs.2021.103178. [DOI] [Google Scholar]
- Kim S. P.; Lee S. J.; Nam S. H.; Friedman M. The composition of a bioprocessed shiitake (Lentinus edodes) mushroom mycelia and rice bran formulation and its antimicrobial effects against Salmonella enterica subsp. enterica serovar Typhimurium strain SL1344 in macrophage cells and in mice. BMC Complement Altern Med. 2018, 18, 322. 10.1186/s12906-018-2365-8. [DOI] [PMC free article] [PubMed] [Google Scholar]
- Ritthibut N.; Oh S.-J.; Lim S.-T. Enhancement of bioactivity of rice bran by solid-state fermentation with Aspergillus strains. LWT 2021, 135, 110273 10.1016/j.lwt.2020.110273. [DOI] [Google Scholar]
- Santos M. C. B.; Barouh N.; Durand E.; Baréa B.; Robert M.; Micard V.; Lullien-Pellerin V.; Villeneuve P.; Cameron L. C.; Ryan E. P.; Ferreira M. S. L.; Bourlieu-Lacanal C. Metabolomics of Pigmented Rice Coproducts Applying Conventional or Deep Eutectic Extraction Solvents Reveal a Potential Antioxidant Source for Human Nutrition. Metabolites 2021, 11 (2), 110. 10.3390/metabo11020110. [DOI] [PMC free article] [PubMed] [Google Scholar]
- Pereira-Caro G.; Cros G.; Yokota T.; Crozier A. Phytochemical profiles of black, red, brown, and white rice from the Camargue region of France. J. Agric. Food Chem. 2013, 61 (33), 7976–86. 10.1021/jf401937b. [DOI] [PubMed] [Google Scholar]
- Omarini A. B.; Labuckas D.; Zunino M. P.; Pizzolitto R.; Fernández-Lahore M.; Barrionuevo D.; Zygadlo J. A. Upgrading the Nutritional Value of Rice Bran by Solid-State Fermentation with Pleurotus sapidus. Fermentation 2019, 5 (2), 44. 10.3390/fermentation5020044. [DOI] [Google Scholar]
- Nguyen D. D.; Dharmaraja J.; Shobana S.; Sundaram A.; Chang S. W.; Kumar G.; Shin H.-S.; Saratale R. G.; Saratale G. D. Transesterification and fuel characterization of rice bran oil: A biorefinery path. Fuel 2019, 253, 975–987. 10.1016/j.fuel.2019.05.063. [DOI] [Google Scholar]
- Ohnishi M.; Park D.-K.; Fujino Y. Existence of Cerebroside-like Lipid in Rice Oil. Agric. Biol. Chem. 1981, 45 (3), 755–757. 10.1080/00021369.1981.10864593. [DOI] [Google Scholar]
- Xie J.; Liu S.; Dong R.; Xie J.; Chen Y.; Peng G.; Liao W.; Xue P.; Feng L.; Yu Q. Bound Polyphenols from Insoluble Dietary Fiber of Defatted Rice Bran by Solid-State Fermentation with Trichoderma viride: Profile, Activity, and Release Mechanism. J. Agric. Food Chem. 2021, 69 (17), 5026–5039. 10.1021/acs.jafc.1c00752. [DOI] [PubMed] [Google Scholar]
- Huang Y. P.; Lai H. M. Bioactive compounds and antioxidative activity of colored rice bran. J. Food Drug Anal 2016, 24 (3), 564–574. 10.1016/j.jfda.2016.01.004. [DOI] [PMC free article] [PubMed] [Google Scholar]
- Gao S.; Liu Y.; Jiang J.; Li X.; Zhao L.; Fu Y.; Ye F. Encapsulation of thiabendazole in hydroxypropyl-β-cyclodextrin nanofibers via polymer-free electrospinning and its characterization. Pest Manag. Sci. 2020, 76, 3264–3272. 10.1002/ps.5885. [DOI] [PubMed] [Google Scholar]
- Veiga F. J. B.; Fernandes C. M.; Carvalho R. A.; Geraldes C. F. G. C. Molecular modelling and 1H-NMR: Ultimate tools for the investigation of tolbutamide: β-cyclodextrin and tolbutamide: Hydroxypropyl-β-cyclodextrin complexes. Chem. Pharm. Bull. 2001, 49, 1251–1256. 10.1248/cpb.49.1251. [DOI] [PubMed] [Google Scholar]
- Yuan C.; Jin Z.; Xu X. Inclusion complex of astaxanthin with hydroxypropyl-β-cyclodextrin: UV, FTIR, 1H NMR and molecular modeling studies. Carbohydr. Polym. 2012, 89, 492–496. 10.1016/j.carbpol.2012.03.033. [DOI] [PubMed] [Google Scholar]
- Ge X.; He J.; Qi F.; Yang Y.; Huang Z.; Lu R.; Huang L. Inclusion complexation of chloropropham with β-cyclodextrin: Preparation, characterization and molecular modeling. Spectrochim. Acta-Part A Mol. Biomol. Spectrosc. 2011, 81, 397–403. 10.1016/j.saa.2011.06.028. [DOI] [PubMed] [Google Scholar]
- Xu Z.; Godber J. S. Antioxidant activities of major components of γ-oryzanol from rice bran using a linolenic acid model. J. Amer. Oil Chem. Soc. 2001, 78 (6), 645–469. 10.1007/s11746-001-0320-1. [DOI] [Google Scholar]
- Teixeira B. N.; Ozdemir N.; Hill L. E.; Gomes C. L. Synthesis and Characterization of Nano-Encapsulated Black Pepper Oleoresin using Hydroxypropyl Beta-Cyclodextrin for Antioxidant and Antimicrobial Applications. J. Food Sci. 2013, 78, N1913–N1920. 10.1111/1750-3841.12312. [DOI] [PubMed] [Google Scholar]
- Ninfali P.; Antonelli A.; Magnani M.; Scarpa E. S. Antiviral Properties of Flavonoids and Delivery Strategies. Nutrients 2020, 12, 2534. 10.3390/nu12092534. [DOI] [PMC free article] [PubMed] [Google Scholar]
- Pinho E.; Grootveld M.; Soares G.; Henriques M. Cyclodextrins as encapsulation agents for plant bioactive compounds. Carbohydr. Polym. 2014, 101, 121–35. 10.1016/j.carbpol.2013.08.078. [DOI] [PubMed] [Google Scholar]
- Sherje A. P.; Kulkarni V.; Murahari M.; Nayak U. Y.; Bhat P.; Suvarna V.; Dravyakar B. Inclusion Complexation of Etodolac with Hydroxypropyl-beta-cyclodextrin and Auxiliary Agents: Formulation Characterization and Molecular Modeling Studies. Mol. Pharmaceutics 2017, 14 (14), 1231–1242. 10.1021/acs.molpharmaceut.6b01115. [DOI] [PubMed] [Google Scholar]
- Khatun B.; Baishya P.; Ramteke A.; Maji T. K. Study of the complexation of structurally modified curcumin with hydroxypropyl beta cyclodextrin and its effect on anticancer activity. New J. Chem. 2020, 44, 4887–4897. 10.1039/C9NJ04408F. [DOI] [Google Scholar]
- Hirose M.; Takahashi S.; Ogawa K.; Futakuchi M.; Shirai T. Phenolics: Blocking agents for heterocyclic amine-induced carcinogenesis. Food Chem. Toxicol. 1999, 37, 985–992. 10.1016/S0278-6915(99)00092-7. [DOI] [PubMed] [Google Scholar]
Associated Data
This section collects any data citations, data availability statements, or supplementary materials included in this article.


