Summary
Proper ectodermal patterning during human development requires previously identified transcription factors such as GATA3 and p63, as well as positional signaling from regional mesoderm1–6. However, the mechanism by which ectoderm and mesoderm factors act to stably pattern gene expression and lineage commitment remains poorly understood. Here we identify the previously unstudied protein Gibbin, encoded by the Xia-Gibbs AT-hook DNA Binding Motif Containing 1 (AHDC1) disease gene7–9, as a key regulator of early epithelial morphogenesis. We find that enhancer/promoter-bound Gibbin interacts with dozens of sequence-specific zinc-finger transcription factors and methyl-CpG binding proteins to regulate expression of mesoderm genes. Gibbin loss causes an increase in DNA methylation at GATA3-dependent mesodermal genes, resulting in loss of signaling between developing dermal and epidermal cell types. Strikingly, Gibbin-mutant hESC-derived skin organoids lack dermal maturation, resulting in p63-expressing basal cells that possess defective keratinocyte stratification. Novel in vivo chimeric CRISPR mouse mutants reveal a spectrum of Gibbin-dependent developmental patterning defects affecting craniofacial structure, abdominal wall closure, and epidermal stratification that mirror patient phenotypes. Our results indicate that the patterning phenotypes seen in Xia-Gibbs and related syndromes derive from abnormal mesoderm maturation as a result of gene-specific DNA methylation decisions.
Introduction
During early embryogenesis, germ layer patterning results in distinct progenitor lineages including neuroectoderm, non-neural ectoderm, and mesoderm, slated to become the brain, epidermis, or dermis, respectively10,11. The interplay of the nascent ectodermal germ layers with key regional mesodermal morphogenic signals wires the basal epithelia program that, once triggered to differentiate, will form craniofacial features, skin, hair, neural tube, and limb symmetry12–14. Mediating the crosstalk of morphogenic signals is a complex network of transcription factors, chromatin remodelers, non-coding RNAs, and cohesin mediators that ensure precise spatial-temporal morphogenesis5,15–17. Alterations in master regulators of both ectoderm and mesoderm maturation are known to cause a spectrum of neurocutaneous syndromes4,5,18,19. While their individual roles have been well-characterized, the mechanism by which these chromatin regulators stably transmit lineage-specific morphogenic information on a gene-by-gene basis remains poorly understood.
As part of a clinical program to produce CRISPR-corrected, medical-grade, cell-derived skin20, our group developed an in vitro organoid system that replicates normal epithelial development to manufacture graftable human keratinocytes. In this system, induced or embryonic stem cells (hESCs) are triggered to differentiate in response to morphogens retinoic acid (RA) and bone morphogenetic protein 4 (BMP4)5. Using this technique, we discovered that up-regulated transcription factors (TFs) such as TFAP2A/C and GRHL2 epigenetically pattern chromatin landscapes and induce p63, the master regulator of stratified epithelium5. Interestingly, mesodermal regulators such as PITX2, PRRX1, and PDGFRA are also induced by RA/BMP4, indicating the requirement of both epidermal and dermal progenitors in this epithelial manufacturing process. However, the mechanism by which these lineage-specific transcription factors work promote differentiation within the same stem cell population remains elusive.
Here, we extend our efforts to understand how ectodermal-mesodermal lineage information is stably transmitted through TFs by interrogating Gibbin, the protein product of the Xia-Gibbs Syndrome AT-hook DNA Binding Motif Containing 1 (AHDC1) locus, and a previously unstudied neurocutaneous syndrome protein. Surprisingly, we find that Gibbin acts with transcription factors such as GATA3 to mature developing mesoderm that wires surface ectoderm stratification. Gibbin loss causes DNA hypermethylation at mesodermal genes, and its interactome and human neurocutaneous disease phenotype closely mirror those lacking function from other neurocutaneous disorder-associated genes such as MECP2, NIPBL, and ADNP21–23. Collectively, our results provide a novel developmental mechanism for pleiotropic Xia-Gibbs Syndrome phenotypes, and exhibit how lineage-specific proteins enforce stable genome changes during differentiation.
Results
Gibbin regulates mesoderm gene expression
To uncover lineage regulators during early epithelial development, we interrogated our previously published differential RNA-seq and enhancer ChIP-seq datasets collected from hESCs following 0 or 7 days of RA/BMP4 treatment (Fig. 1a)5. Among the top 50 induced genes associated with an ectoderm/mesoderm disease phenotype (Fig. 1b) was the AT-hook DNA Binding Motif Containing 1 (AHDC1) locus (Fig. 1c). Heterozygous mutations in AHDC1 have previously been reported by whole exome sequencing as the causal gene for Xia-Gibbs syndrome8,24,25, a developmental disorder characterized by ectoderm-associated intellectual disability, dysmorphic facial features, digit, skin, and hair abnormalities, but also mesoderm-related hypotonic musculature, bone, and cardiac changes. Because no functional information exists for this locus, we subsequently investigated the embryological role of the Xia-Gibbs AHDC1 protein product, which we have coined “Gibbin” to connect disease function with the protein.
Fig. 1: Gibbin regulates mesoderm gene expression during development.
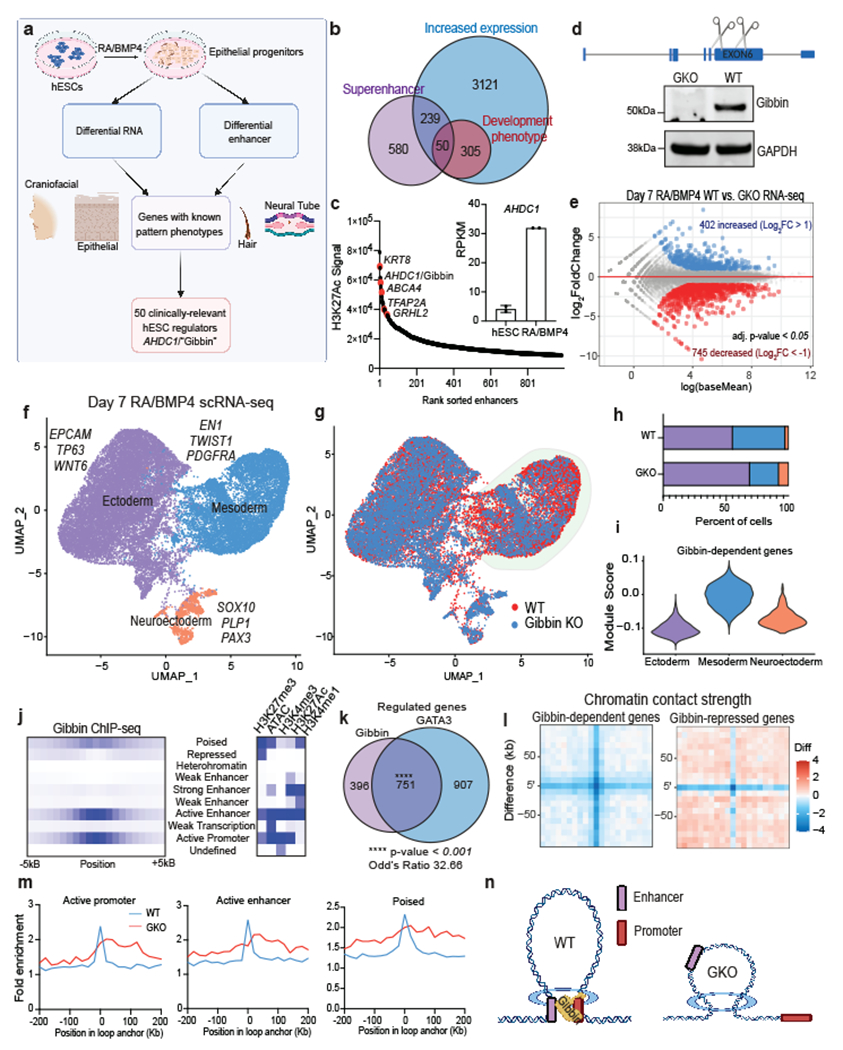
(a) To find regulators of epithelial development, we analyzed previously published RNA-seq and H3K27Ac ChIP-seq from hESCs treated with RA/BMP4 for 0 or 7 days. Top hits were cross-referenced against known developmental phenotypes related to mesoderm/ectoderm patterning. The overlap of these genes can be seen in (b), with a final list of 50 candidates including Gibbin, encoded by the AHDC1 gene. (c) Validation of AHDC1/Gibbin expression changes by ranked enhancers and RPKM. Error bars are mean +/− s.d., n=2 biologically independent samples. (d) Schematic of CRISPR deletion strategy and western blot for the Gibbin KO. Immunoblotting was repeated experimentally twice and GAPDH was run as a processing control. For gel source data, see Supplementary Figure 1. (e) RNA-seq differential expression analysis between WT and GKO hESCs after 7 days of RA/BMP4. Transcript expression is either unchanged (grey), increased (blue, >2-fold), or decreased (red, <2-fold), with an adjusted p-value cutoff <0.05 as measured by DESEQ2, n=2 biologically independent samples. (f) Uniform manifold approximation projection (UMAP) plot of WT and GKO integrated scRNA-seq, colored by cluster or (g) genotype. (h) Proportions of each cell type cluster in WT or GKO scRNA-seq. (i) Expression of Gibbin-dependent genes across scRNA-seq clusters. (j) ChromHMM analysis of Gibbin binding sites showing enrichment of various chromatin states in relation to Gibbin ChIP-seq peaks. (k) Overlap of Gibbin and GATA3 target genes identified by RNA-seq. p-value and odd’s ratio were calculated using a two-sided Fisher’s Exact Test. (l) Aggregate Peak Analysis (APA) showing contact strength difference between WT and GKO loops at Gibbin-regulated genes. (m) ChromHMM fold enrichments at contacts in each cell type. (n) Model depicting the proposed mechanism of Gibbin gene expression control.
To ascertain whether Gibbin regulates gene expression in response to RA/BMP4, we created two CRISPR loss of function mutant hESC clones (Fig. 1d, Extended Data Fig. 1a–b). By RNA-seq, expression of ~1,100 transcripts were significantly altered in the Gibbin KO (GKO) compared to wildtype (WT) (Fig. 1e). 60% of these transcripts are also RA/BMP4-responsive, placing Gibbin as a key mediator of RA/BMP4 signaling (Extended Data Fig. 1c). Interestingly, Gibbin-dependent genes were highly enriched for mesenchymal and mesodermal regulators such as GATA4, HAND2, TWIST1, PITX2, PDGFRA, and PRRX1 (Extended Data Fig. 1d). The expression pattern of AHDC1/Gibbin itself closely mirrored that of mesoderm genes, whose levels began to rise 2-3 days after those of the early ectoderm (Extended Data Fig. 1e). Single cell RNA sequencing (scRNA-seq) confirmed that mesodermal (PDGFRA+) cells as well as individual gene markers for that cluster were severely diminished in the GKO (Fig. 1f–h, Extended Data Fig. 1f–h), and Gibbin-dependent genes identified by RNA-seq were highly enriched in the mesoderm (Fig. 1i). Gibbin effects on the mesoderm were apparent as early as day 3 of RA/BMP4 (Extended Data Fig. 1i–k), reinforcing a central role for Gibbin in lineage specification.
To elucidate the mechanism by which Gibbin regulates gene expression, we stably introduced an inducible, tagged Gibbin transgene to perform ChIP-seq in hESCs after 0 or 7 days with RA/BMP4 treatment (Extended Data Fig. 2a). Day 0 ChIP-seq indicated Gibbin does not bind to DNA in the absence of RA/BMP4, consistent with RNA-seq results which suggest Gibbin does not regulate gene expression in untreated hESCs (Extended Data Fig. 2b–d). After 7 days of RA/BMP4, Gibbin primarily binds active promoters and enhancers (Fig. 1j, Extended Data Fig. 2b–d, e), and is found at ~40% of its transcriptionally-regulated loci (Extended Data Fig. 2f). Interestingly, Gibbin DNA binding itself does not appear to be sufficient to drive gene expression, as ChIP-seq signal was not restricted to the mesoderm lineage or to Gibbin-regulated loci (Extended Data Fig. 2f–g). This observation is consistent across diverse cell types, as similar chromatin state binding, number of peaks, and binding sites at a common set of genes were found in Gibbin ChIP-seq in HepG2 cells (ENCSR168AUX26, Extended Data Fig. 2h–j). Direct Gibbin target genes were enriched for transcription factor activity (Extended Data Fig. 2K), indicating that the non-bound Gibbin-dependent genes are likely indirect, downstream effectors. Together these results suggest that Gibbin binds promoters and enhancers to regulate mesoderm gene expression during early embryonic development.
Gibbin enforces enhancer-promoter contacts
Since Gibbin DNA binding alone does not necessarily induce gene regulation, we next wondered whether the protein works in coordination with other previously identified lineage factors. Using RNA-seq from GATA3, TFAP2A, and TP63 KO cell lines, we found that GKO cells were most similar to GATA3 mutants (Extended Data Fig. 3a). In contrast to TFAP2A and TP63 which are expressed only in the ectoderm, Gibbin and GATA3 are expressed in both the ectoderm and mesoderm and are co-expressed in 47% of all cells after RA/BMP4 (Extended Data Fig. 3b–c). Further, the two regulate a significantly enriched (p-value < 0.0001) set of 751 transcripts by RNA-seq (Fig. 1k). They also bind near the same genes, as 55% of Gibbin-regulated genes are bound by GATA3, and 39% of GATA3-regulated genes are bound by Gibbin. The effect of GATA3 over-expression18 was also abolished when examined in GKO cells, indicating that Gibbin is an important effector of GATA3 activity (Extended Data Fig. 3d). While both proteins bind enhancers and promoters (Fig. 1j and Extended Data Fig. 3e), only around 10% of Gibbin binding sites are directly overlapped with GATA3 binding sites both genome-wide and at mesoderm loci. The average distance between the two proteins on DNA is reflective of typical distances between promoters and enhancers (Extended Data Fig. 3f), suggesting that promoter/enhancer-bound Gibbin interacts with enhancer-bound GATA3 through long-range chromatin contacts.
We next investigated whether Gibbin directly altered GATA3 function to control gene expression. Interestingly, loss of Gibbin had minimal effects on global and lineage-specific chromatin accessibility as measured by ATAC-seq, in stark contrast to loss of GATA3 (Extended Data Fig. 4a–c). Loss of Gibbin had no effect on GATA3 binding site accessibility, GATA3 mRNA expression, or GATA3 DNA binding (Extended Data Fig. 4c–g), suggesting it does not function by modulating GATA3 itself. Since GATA3 and Gibbin appear to bind at enhancer-promoter distances, we used cohesin HiChIP27 to measure 3D chromatin contacts. We found that loss of Gibbin had minimal effects on genome-wide domain organization, insulation, contact probability, or compartmentalization, consistent with our ATAC-seq results (Extended Data Fig. 5a–e). However, we observed an overall reduced number and size of chromatin contacts in the GKO (Extended Data Fig. 5f–h). Aggregate peak analysis (APA) highlighted this distinction, showing that while contact strength was generally decreased at Gibbin-dependent genes, multiple de novo peaks appeared at de-repressed genes in areas distinct from the original contacts (Fig. 1l). These changes represent a subset of contacts that were shifted on one end and did not occur at Gibbin-independent loci (Extended Data Fig. 5i–j). Lost chromatin contacts tended to be anchored at Gibbin-dependent gene promoters (Extended Data Fig. 5k–l). While WT contacts were anchored in gene regulatory regions, GKO de novo anchor points did not overlap with any set of previously defined chromatin marks (Fig. 1m)5,18. Together these results suggest that Gibbin mediates RA/BMP4-induced mesoderm gene expression by maintaining precise gene-specific chromatin contacts between promoters and enhancers (Fig. 1n).
The Gibbin interactome
To identify Gibbin-associated proteins that maintain precise chromatin contacts and to regulate gene expression, we utilized BASU proximal proteomics28,29,30 (Fig. 2a–b, Extended Data Fig. 6a). Mass spectrometry revealed that the Gibbin interactome was heavily enriched for chromatin modifying complexes, enhancer binding proteins, and zinc finger TFs including the entire GATA family (Fig. 2c and Extended Data Fig. 6b–c). Only a small subset of these interactions had been identified in previously published datasets (Fig. 2d, from BioGrid database). Some proteins were unique to either terminus of Gibbin, such as zinc-finger TFs and methyl-binding proteins near the AT-hook domains and MED1/p300 near the PDZ domain (Fig. 2c and Extended Data Fig. 6d–e). Consistent with Gibbin mesoderm function, many of the transcription factor interactors were also expressed specifically in the mesoderm cluster identified by scRNA-seq (Extended Data Fig. 5f). GATA3 proximal proteomics also revealed that the interactomes of Gibbin and GATA3 overlapped by 154 proteins, further confirming their roles as co-regulators (Extended Data Fig. 6g–i).
Fig. 2: Gibbin interacts with zinc finger transcription factors and DNA methylation regulators.
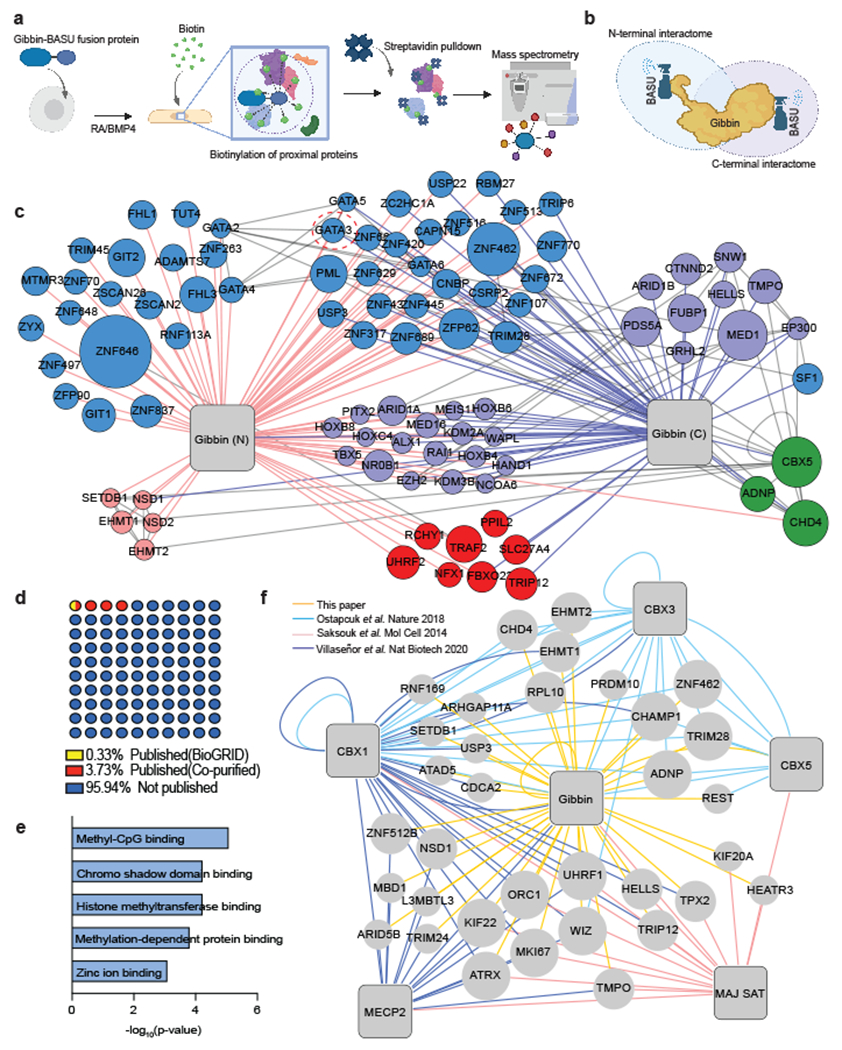
(a) Overview of BASU proximal proteomics workflow used to identify the Gibbin interactome. (b) Graphic displaying the two Gibbin BASU fusion proteins used to identify interacting partners. The biotin ligase “sprayer” was fused to either the N or C terminus of Gibbin, which is proximal to its AT-hook or PDZ domain, respectively. (c) Protein-protein interaction (PPI) map of the top Gibbin interacting proteins found using each fusion protein (SAINT score > 0.9). n=2 biologically independent samples. Proteins in the center were found with both baits. Relevant interacting proteins are subset by molecular function, with node size indicative of average spectral count. Interactions between prey nodes were taken from the BioGRID database. (d) Percentages of Gibbin interacting proteins that have been reported previously on BioGRID or were co-purified previously with Gibbin from a common bait. (e) GO term enrichment of Gibbin interactors co-purified in previous studies. p-values were calculated with a two-tailed Fisher’s Exact Test (via EnrichR). (f) PPI map of Gibbin interactors, including baits from 3 publications using CBX1, CBX3, CBX5, MECP2, or Major Satellites (MAJ SAT) as baits23,31,32.
We were intrigued by the observation that some of the Gibbin interactors are known heterochromatin-bound factors. However, we found that loss of Gibbin did not alter H3K9me3 deposition or heterochromatin (HP1α positive) nuclear bodies (Extended Data Fig. 6j–k), indicating that regulation of heterochromatin is not a core mechanism by which Gibbin regulates gene expression in this context. By contrast, while the majority of the Gibbin interactions were novel (Fig. 2d), a subset had been consistently co-purified with Gibbin in previous studies23,31,32. Overlapping the Gibbin network with these results revealed an enrichment for methyl-CpG binding proteins, methyltransferases, and zinc fingers highlighted by UHRF1, TRIM28, EHMT1/2, and LAP2β (Fig. 2e–f). The dependence of many of these protein complexes on the status of local DNA methylation23,33 suggested Gibbin may act on methylated DNA to regulate enhancer-promoter contacts, a hypothesis we pursued further.
Gibbin loss causes hypermethylation
To test whether Gibbin regulates DNA methylation, we used 850k probe arrays to ascertain differential DNA methylation across known regulatory regions. We took advantage of the observation that RA/BMP4-treated hESCs undergo substantial DNA demethylation during lineage commitment (Fig. 3a). By contrast, loss of Gibbin resulted in striking hypermethylation in RA/BMP4 treated hESCs compared to WT (Fig. 3b, Extended Data Fig. 7a). The majority of these hypermethylated sites were the same loci that normally exhibit RA/BMP4-dependent demethylation (Fig. 3c and Extended Data Fig. 7b–c). Consistent with RNA-seq and ChIP-seq results, loss of Gibbin had virtually no effect on DNA methylation in undifferentiated hESCs (Extended Data Fig. 7d), further indicating that its regulatory properties are RA/BMP4-dependent. Further, hypermethylation occurred at Gibbin-dependent genes on active promoters and enhancers (Fig. 3d and Extended Data Fig. 7e). DNA methyltransferase (DNMT) enzymatic activity was globally increased in GKO cells, despite no change in expression for known DNMTs (Fig. 3e and Extended Data Fig. 7f). Together these results indicate that loss of Gibbin coincides with inappropriate DNA methylation at mesodermal loci.
Fig. 3: Loss of Gibbin causes DNA hypermethylation and decreased CTCF deposition.
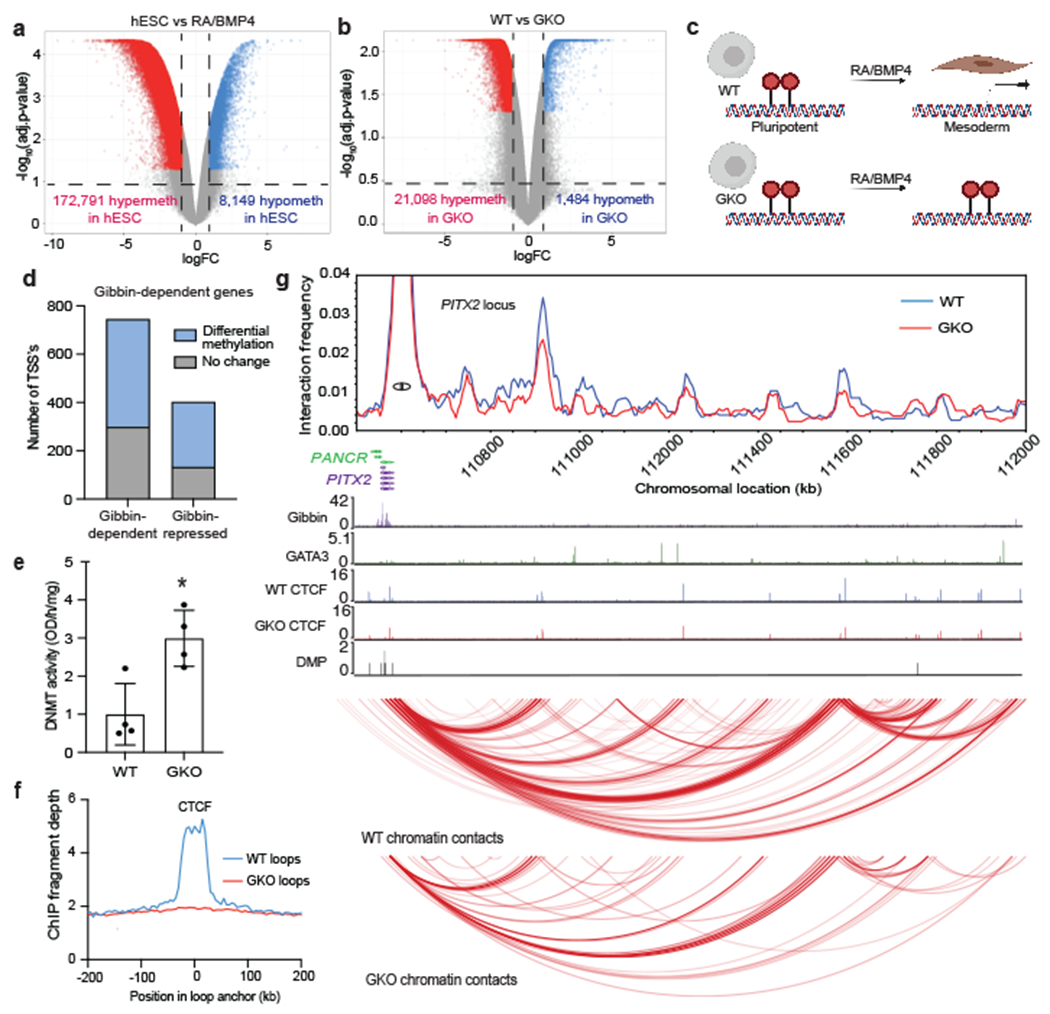
(a) Volcano plot of differentially methylated probes (DMPs) between untreated and RA/BMP4 treated hESCs, or (b) between WT and GKO cells treated with RA/BMP4 for 7 days. Signal at each probe is either unchanged (grey), hypermethylated (red, >2-fold), or hypomethylated (blue, <2-fold), with an adjusted p-value cutoff <0.01 as measured by limma. n=2 biologically independent samples. (c) Graphic demonstrating the model that global demethylation occurs in hESCs in response to RA/BMP4 treatment. This demethylation is partially lost in Gibbin mutant cells at mesoderm loci. (d) Number of Gibbin target gene TSS’s with differential methylation. (e) Global DNMT enzymatic activity increases in GKO cells. Error bars are mean +/− s.d., n=4 biologically independent samples averaged from 2 technical replicates repeated across 2 different runs. * represents p-value <0.05 calculated by a two-tailed t-test (p=0.0108). (f) CTCF ChIP-seq signal in GKO chromatin contacts identified by cohesin HiChIP. (g) Virtual 4C plot of normalized cohesin HiChIP signal the PITX2 locus, overlayed with a WashU Genome Browser screenshot depicting Gibbin, GATA3, and WT/GKO CTCF ChIP-seq peaks, DMP pileups, and FitHiChIP contacts. The PITX2 TSS was used as an anchor point in constructing the 4C plot.
Because methylation of promoter/enhancer DNA blocks CTCF binding34,35, we hypothesized that Gibbin toggles regulation of methylation with CTCF deposition. Consistent with this hypothesis, we observed a striking loss of chromatin contact signal at CTCF binding sites in GKO cells (Fig. 3f). By ChIP-seq, we also found decreased CTCF binding at over 2,700 sites which overlapped with altered expression, shifted chromatin contacts, and differential methylation (Extended Data Fig. 7g–i). Two important Gibbin-regulated loci illustrate its role in maintaining and preventing precise gene expression (Fig. 3g and Extended Data Fig. 7j). PITX2, the Axenfeld-Rieger Syndrome disease gene that functions in mesoderm to regulate left-right asymmetry and craniofacial patterning, is positively regulated by Gibbin and GATA336. In GKO cells, this locus loses signal at multiple enhancer-promoter contacts connected by differentially methylated probes (DMPs). Alternatively, Gibbin mutants display loss of ATF3 repression, resulting in strong gene expression in RA/BMP4-treated cells. Two large de novo chromatin contacts appear away from the original contacts, resulting in increased expression in the Gibbin mutant (Extended Data Fig. 7j). Together these results support a role for Gibbin in 3D chromatin regulation in the developing mesoderm through its ability to prevent DNA methylation and promote CTCF binding at mesoderm promoters and enhancers.
Mesoderm-ectoderm communication
Because Gibbin controls the expression of mesodermal master regulators, we interrogated how Gibbin loss affects the lineage trajectory of developing epithelial tissue. To see the effects of Gibbin on lineage specification and skin maturation we extended the in vitro differentiation of WT and GKO cells by switching the media to defined keratinocyte media (DKSFM) for a total of 50 days (Fig. 4a)5,18. By scRNA-seq, we confirmed that this differentiation strategy produced a mixture of both epidermal keratinocytes and dermal fibroblasts (Fig. 4b–c). While AHDC1/Gibbin was expressed in both cell populations during the entire 50-day differentiation, GATA3 expression was eventually restricted to the epidermis by day 50 (Extended Data Fig. 8a–b), indicating Gibbin and GATA3 mesodermal co-regulatory functions occur in early skin commitment. Importantly, we noticed that the GKO PDGFRA+ dermis exhibited an expanded sub-identity (“GKO-specific dermis”) corresponding to a differential pseudotime trajectory branch not present in WT PDGFRA+ cells (Fig. 4d–e). By PCA analysis this branch/cluster was similar to mesoderm cells at earlier timepoints, suggesting a lack of cellular maturation (Fig. 4f). In contrast, the lineage trajectory of ectoderm/epidermal (EPCAM+/KRT5+) cells appeared consistent between the WT and GKO (Extended Data Fig. 8c–d). Consistent with a lack of mature dermis, the GKO cells at day 50 exhibited gene expression changes for many mesenchyme, extracellular matrix, and mature fibroblast markers such as PDGFRA and PRRX1 (Extended Data Fig. 8e–f). Together these results suggest that Gibbin is required for proper mesodermal maturation during formation of the dermis.
Fig. 4: Gibbin regulates mesoderm maturation to pattern skin development.
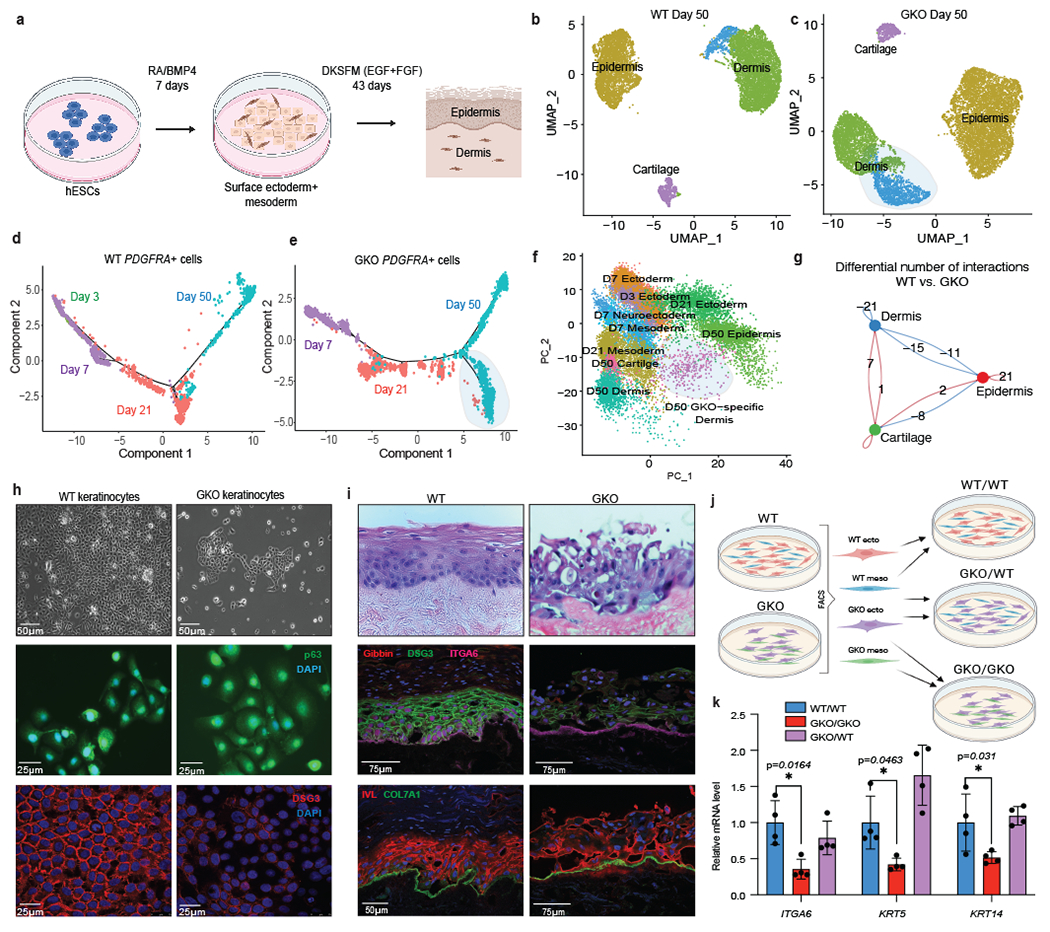
(a) Protocol to differentiate hESCs to mature epidermis/dermis. (b) UMAP of WT or (c) GKO hESCs after 50 total days of differentiation. The GKO-specific dermal population is highlighted. (d) Monocle pseudotime trajectory of WT or (e) GKO PDFRA+ clusters from day 3, 7, 21, and 50 scRNA-seq, with GKO population highlighted (f) PCA plot of merged day 3, 7, 21 and day 50 scRNA-seq. (g) CellChat circle plot showing numbers of differential interactions between WT and GKO cellular identities. Blue indicates less and red indicates more signaling in the GKO compared to the WT. (h) Representative phase contrast, p63, and DSG3 immunofluorescent images from WT and GKO keratinocytes. The bottom panel shows cells which were differentiated with calcium for 72 hours. (i) Immunofluorescent and H&E images from 3D organotypic cell cultures grown using WT or GKO keratinocytes. All imaging was repeated in biological duplicate across 2 independent experiments. (j) Sorting strategy to isolate and recombine ectoderm and mesoderm (day 7) cells between WT and GKO genotypes. PDGFRA, VTCN1, and ABCG2 antibodies were used to sort day 7 cells into mesoderm and ectoderm, which were then re-plated up to 50 days in DKSFM. (k) qPCR for keratinocyte markers measured after sorting, recombination, and 50 days of differentiation. Error bars are mean +/− s.d., n=4 biologically independent samples averaged from 2 technical replicates repeated across 2 different runs. * indicates p-value <0.05 based on two-tailed student’s t-test.
Interestingly, genes which were differentially expressed in the GKO-specific dermal branch were enriched for cell-cell signaling molecules including IGF1/IGFBP, well-known to regulate epidermal stratification37. Because of the critical interplay between the mesoderm and ectoderm during epithelial development11,38,39, we interrogated whether this immature mutant dermis altered communication to the epidermis. Consistent with the known developmental signaling, CellChat40 analyses revealed strong communication coming from the dermis towards the epidermis which was reduced in the GKO (Fig. 4g and Extended Data Fig. 8g–h). To test whether the dermal defects translated into keratinocyte abnormalities, we then isolated WT and GKO ITGA6+ cells. Compared to controls, GKO keratinocytes maintained relatively normal morphology and p63 expression (Fig. 4h). However, these cells exhibited significant transcriptional changes (Extended Data Fig. 8i) including extracellular matrix proteins. Consistent with the transcriptional analysis, particularly striking adhesion abnormalities were observed when we triggered 2D keratinocyte stratification by adding calcium to the media (Fig. 4h, bottom panel)41. Further, GKO 3D skin organoids also produced disorganized, non-adherent, and poorly stratified epithelium (Fig. 4i). Skin stratification proteins such as IVL and DSG3 were reduced, revealing the lack of a polarized and adherent mutant epithelium. This effect was not seen in primary keratinocyte mutants (NHKs) (Extended Data Fig. 8j), indicating Gibbin is not required once keratinocytes are mature. Lastly, we tested whether replacing the mutant mesoderm could rescue the keratinocyte defect. Using the COMET42 algorithm, we identified the surface markers PDGFRA, VTCN1, and ABCG2 to sort out mesoderm or ectoderm day 7 cells by FACS (Fig. 4j and Extended Data Fig. 9a–f). We then recombined the WT mesoderm with GKO ectoderm and found that this rescued the keratinocyte gene expression defects at day 50, confirming that the effects seen in keratinocytes are a direct result of defective mesoderm during epithelial-mesenchymal differentiation (Fig. 4k).
Gibbin mutant mouse
While Gibbin functions with GATA3 initiation to pattern the chromatin landscape in skin differentiation in vitro, interactions with other zinc finger TFs and the Xia-Gibbs disease phenotypes suggest Gibbin may play a wider role in ectodermal patterning. Because no mouse model exists for Gibbin function, we surveyed a range of developmental phenotypes using mosaic CRISPR mutant mouse studies. Mouse pronuclei were injected with CRISPR guide RNAs targeting the Gibbin locus (Fig. 5a). Heterozygous or homozygous Gibbin mutants, but not CRISPR controls, failed to survive past birth, leading us to focus on E18 mosaic mutant embryo phenotypes. We observed that loss of Gibbin caused a spectrum of phenotypes in vivo (Fig. 5b, Extended Data Fig. 10a–b). The most severe embryos were undersized, hypovascularized, missing eyes, had open ventral walls (omphalocele), or friable poorly formed skin easily sloughing from the body (Fig. 5c–d). Less severe mutants displayed eyes open at birth or had craniofacial abnormalities like short snouts or craniosynostosis. Consistent with in vitro findings (Fig. 4i), more severe mutants displayed skin stratification defects including loss of basal and suprabasal markers KRT14 and KRT10 (Fig. 5e). Differentiated skin layers were severely reduced, with the epidermis appearing incompletely attached to the underlying dermis. Less severe mutant skin grafted to nude mice resembles GATA3 mutants6,43–45 as well as recently reported Xia-Gibbs aplasia cutis and hair-thinning phenotypes7,9, including cyst-like structures reminiscent of the previously published DSG3 mutant mouse46 (Extended Data Fig 10c–d). Together these results suggest that Gibbin plays a crucial role in skin differentiation and overall embryonic development in a dose-dependent fashion.
Fig. 5: Loss of Gibbin in vivo causes global development defects.
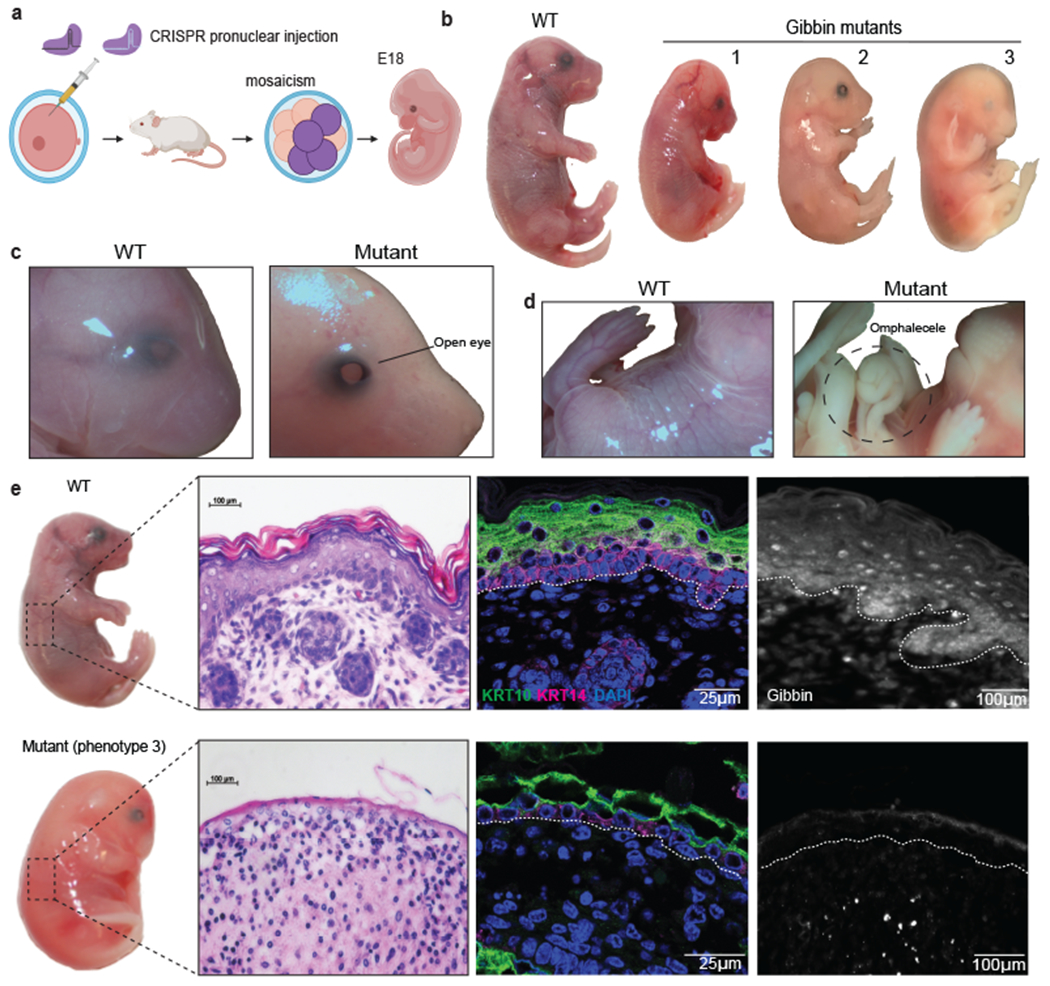
(a) Overview of CRISPR pronuclear strategy to deplete Gibbin in mice. Edited blastocysts were implanted into pseudo-pregnant mothers, and embryos were extracted at embryonic day 18 (E18). Injections were performed in duplicate across 6 different litters totaling n=52 collected embryos. (b) Representative E18 embryos exhibiting a spectrum of Gibbin mutant phenotypes. (c) Close-up images of open eye and (d) omphalocele phenotypes observed in GKO embryos. (e) Immunofluorescence images of E18 mouse skin stained with stratification markers KRT10 and KRT14 from WT and the most severe mutant. All images were repeated in biological duplicate across 2 independent experiments.
Discussion
In this study, we demonstrate through both organoid and in vivo mouse mutagenesis that the Xia-Gibbs protein Gibbin (AHDC1) is a novel mesoderm regulator required for the proper patterning of the epidermis in human skin. Our results indicate that Xia-Gibbs ectodermal defects such as intellectual disability, craniofacial defects, and ectodermal dysplasia7,8,52–54,8,9,25,47–51 derive in part from abnormal mesodermal function. We show that widely-expressed Gibbin integrates information from morphogens like RA, BMP, and other mesodermal regulators like the zinc-finger TF GATA3 to induce the mesoderm lineage by inhibiting DNA methylation, promoting CTCF accumulation, and stabilizing 3D chromatin contacts at lineage promoters/enhancers. Gibbin regulation of 3D chromatin architecture mirrors that of cohesin loader NIPBL (Cornelia de Lange Syndrome) or ADNP (Helsmoortel-Van der Aa Syndrome, HVDAS)55. These observations provide a unifying explanation of how loss of disease gene mesodermal function can result in craniofacial, neural or axial ectoderm defects, as well as mesodermal deficiencies such as intellectual disability, cardiac abnormalities, vasculopathy and hypotonia.
While Gibbin integrates positional information, our study implicates mesodermal DNA methylation and DNMT regulation as a major Gibbin output during skin differentiation. However, it remains elusive whether Gibbin acts directly on a DNMT protein, or if these effects are an indirect result of transcriptional changes. The Gibbin interactome reveals Gibbin association with the DNA methylation maintenance protein UHRF1, leading us to speculate that Gibbin blocks UHRF1 ability to maintain DNMT1-dependent methylation during cell divisions associated with mesoderm differentiation. Consistent with this passive loss model, Gibbin-dependent gene expression arises several days and cell divisions after RA/BMP4 addition. We speculate that this regulation occurs through Gibbin DNA binding, given recent phenotypic studies of AHDC1 missense mutations indicating the protein’s AT-hook domains are critical to its function56. Further, Gibbin’s interaction with CpG “reader” proteins (TMPO, TRIM24, and ZNF512B among others), syndromic overlap with Rett Syndrome (caused by a mutation in MECP28,21), and identification at CpG sites using ChromID31 support the hypothesis that Gibbin associates with CpG reader complexes. Future studies will benefit from systematic mechanistic analyses to elaborate the local chromatin determinants of Gibbin-dependent CTCF/DNA methylation switching in mesodermal maturation.
Methods
Data and Code Availability
Deep sequencing and array data generated in this paper have been deposited in GEO:GSE180495. Previously published datasets analyzed in this study are available at GEO:GSE114846 or through ENCODE (https://www.encodeproject.org/experiments/ENCSR168AUX/). Raw data from BASU experiments are found in Supplementary Table 1. Uncropped immunoblots and FACS gating controls are found in Supplementary Figure 1 and 2. The human reference genome hg38 was downloaded from the UCSC genome browser. The GRCh38 reference genome for single cell mapping can be downloaded from 10X genomics (https://support.10xgenomics.com/single-cell-gene-expression/software/downloads/latest). The manifest and annotation files for methylation analysis can be found at https://github.com/achilleasNP/IlluminaHumanMethylationEPICanno.ilm10b5.hg38. Previously published custom code used in this study is available at https://github.com/OroLabStanford. There are no restrictions in data availability.
Graphics
The cartoon images in Fig. 1a, 1n, Fig. 2a–b, Fig. 3c, Fig. 4a, 4k, and Fig. 5a were created by the co-authors using BioRender.com.
Cell Culture
Human ESCs (H9, female, Stanford Stem Cell Bank), mutant, and transgenic cell lines were seeded in culture plates using Matrigel hESC-Qualified Matrix (BD Corning) and were maintained in Essential 8 media (Life Technologies). Colonies were passaged as clumps every 2 days using 0.5 mM EDTA. Mouse 3T3 J2 fibroblasts (male, ATCC) were maintained in DMEM with 10% FBS. Induced keratinocytes (iKCs) and Normal Human Keratinocytes (NHKs) were maintained in Defined Keratinocyte Medium (Life Technologies). RA/BMP4 differentiation was performed as previously described5. Briefly, hESCs were switched to Essential 6 media supplemented with 5ng/ml BMP4 (R&D Systems) and 1μM RA (Sigma) for seven days. To further differentiate the cells to iKCs, the medium was changed to Defined Keratinocyte Serum Free Medium (DKSFM) with growth supplements containing EGF and FGF (Life Technologies) for 50 days total. To induce terminal keratinocyte differentiation, confluent keratinocytes were cultured in 2μM CaCl2 for 72 hours. All cells are regularly tested for Mycoplasma and were authenticated with sequencing.
Knockout Cell Line Generation
sgRNAs targeting the single coding exon of Gibbin or the DNA binding domain of GATA3 were designed using Benchling. 30 pmol of Cas9 RNP (Thermo Fisher) and 160 pmol of synthetic guide RNA mixture (Synthego) were complexed at room temperature for 10 minutes. 1x10⁶ H9 hESCs were detached with Accutase (Innovative Cell Technologies) and spun into a pellet. The complexed RNP/guide mixture was added to the Human Stem Cell Nucleofection Kit (Lonza) solution, mixed, transferred to a cuvette, and nucleofected using program A-23 on a 2-D Lonza Nucleofector. Cells were seeded onto a 6-well Matrigel coated plate and maintained in Essential 8 media with 1μM Thiazovivan (Stem Cell Technologies). After 48 hours, 5x10³ cells were seeded onto a 10-cm dish and allowed to form colonies in the absence of Thiazovivan. After about 7 days, individual colonies were picked, expanded, and genotyped using GreenTaq (GenScript) and primers surrounding the cut sites. Protein depletion for each knockout was confirmed by immunoblot, and two distinct colonies were chosen for further analysis. sgRNA and genotyping primer sequences can be found in Supplementary Table 3.
RNA Expression Analysis
For RNA extraction, cells were lysed in Trizol (Invitrogen), the aqueous layer was isolated as indicated by the manufacturer, and RNA was purified with RNeasy columns (Qiagen). Real time PCR was performed with SYBR Green PCR master mix (Life Technologies) using a Stratagene real time PCR machine. Primers are listed in Supplementary Table 3. For RNA-seq, DNase (Qiagen) treatment was added to the column prior to elution as per manufacturer instructions. Libraries for RNA-seq were prepared using the KAPA kit for PolyA enriched mRNA-seq (Illumina) according to the manufacturer’s protocol. Libraries were pooled and sequenced on a HiSeq 4000 (Illumina). Two independent, biological replicates were sequenced per cell type.
Immunoblot Analysis
Whole cell extracts were harvested with RIPA buffer supplemented with 1X protease inhibitors (Roche) and run on gradient SDS-PAGE gels (Life Technologies). Proteins were wet transferred onto nitrocellulose membranes (0.45microns, BioRad) at 100V for 1 hour. Membranes were blocked in 5% BSA in TBST for 1 hour. Primary antibodies were diluted in 5% BSA in TBST and added to the membranes overnight at 4°C. Primary antibodies used in this study were AHDC1 (1:50, Abcam), GAPDH (1:5,000, UCSC), GATA3 (1:1,000, Abcam), HA (1:1,000, Abcam), pan-ZNF (1:1,000, Millipore), and IRDye 800CW Streptavidin (1:1,000, Li-COR). Fluorescent secondary antibodies compatible with Odyssey CLx (Li-Cor) were used for 2-color imaging of membranes. Image analysis was performed with ImageStudioLite version 5.2.5 (Li-Cor).
ChIP-seq
To perform Gibbin ChIP-seq we introduced a doxycycline-inducible, HA-tagged Gibbin transgene (Open Biosystems, Clone #100016166). The cDNAs was cloned into a PiggyBac vector (courtesy of Yamanaka lab), which contains a CAG promoter driven rtTA-IRES-BSD cassette and pTRE-driven transgene expression cassette. Expression was induced for 24 hours prior to crosslinking. ChIP-seq was performed as described previously5. 25x106 cross-linked cells were used per ChIP replicate. Briefly, cells were detached with Accutase and crosslinked in solution for 10 minutes in freshly prepared 1% formaldehyde (Thermo Scientific) in PBS. For Gibbin ChIP-seq, freshly collected cells were treated with 5% 1,6-hexanediol in 5mL PBS in suspension for 60 seconds, upon which the solution was immediately diluted with 25mL PBS and 2mL 16% formaldehyde for crosslinking. Cell were quenched in 0.125M glycine, followed by two washes with cold PBS. Cells were lysed in lysis buffer (50mM Tris-HCl pH 8.0, 10mM EDTA, 0.5% SDS, 1X protease inhibitors) for 30 minutes on ice and sonicated twice for 10 minutes on a Diagenode Bioruptor to achieve a chromatin between 200 and 400bp in size. Chromatin was centrifuged, quantified and diluted in dilution buffer up to 2mL (50mM Tris-HCl pH 8.0, 10mM EDTA, 1X protease inhibitors). Sheared chromatin was incubated overnight at 4°C with appropriate antibodies at the following concentrations: GATA3 (5μg/ChIP, Abcam), CTCF (10μg/ChIP, Active Motif), H3K9me3 (10μg/ChIP, Abcam), or HA for the Gibbin ChIP (10μg/ChIP, Abcam). The next day lysates were incubated with 30μL of Dynabead protein G beads (Invitrogen) for 4 hours at 4°C. Beads were washed twice each with low salt buffer (50mM Tris-HCl pH 8.0, 0.15M NaCl, 1mM EDTA pH 8.0, 0.1% SDS, 1% triton X-100, 0.1% sodium deoxycholate), high salt buffer (50mM Tris-HCl pH 8.0, 0.5M NaCl, 1mM EDTA pH 8.0, 0.1% SDS, 1% triton X-100, 0.1% sodium deoxycholate), and LiCl buffer (50mM Tris-HCl pH 8.0, 0.15M LiCl, 1mM EDTA pH 8.0, 1% Nonidet P-40, 0.1% sodium deoxycholate). DNA was eluted in 100μL of elution buffer (50mM NaHCO3, 1% SDS) and crosslinks were reversed with 4μL of 5M NaCl incubated shaking for 16 hours at 67°C. RNA was removed by adding 1μL of 10mg/mL RNase A for 30 minutes at 37°C. DNA was cleaned using the Qiaquick PCR purification kit (Qiagen) and quantified using Qubit (Invitrogen). 10ng of DNA was used to make libraries with the NEBNext kit (New England Biolabs) and AMPure XP beads (Beckman Coulter) according to the manufacturer instructions. Single-end libraries were pooled and sequenced on an Illumina NextSeq 500 and two independent, biological replicates were sequenced per ChIP.
BASU Expression Vectors
To create doxycycline-inducible BASU cell lines, relevant cDNAs were cloned into a PiggyBac vector (courtesy of Yamanaka lab), which contains a CAG promoter driven rtTA-IRES-BSD cassette and pTRE-driven transgene expression cassette. Human Gibbin/AHDC1 (Open Biosystems, Clone #100016166), GATA3 (Integrated DNA Technologies, gBlock), or BASU cDNAs (courtesy of the Khavari lab) were amplified and sub-cloned into the Piggybac plasmid with the In-Fusion HD Cloning Kit (Clontech). The BASU and Transposase expression plasmids (System Biosciences) were co-transfected into H9 hESCs with Lipofectamine LTX Reagent with PLUS Reagent (Thermo Fisher Scientific). Forty-eight hours after transfection, the cells were selected by blasticidin (4μg/mL) for about a week, after which individual clones were picked and expanded. BASU expression and inducibility was confirmed by immunoblotting.
ATAC-seq
ATAC-seq was performed as described previously57. Briefly, 7x10⁴ cells were washed with cold PBS and lysed in 0.1% NP40 RSB buffer. Nuclei were Tn5 transposed with Nextera Transposase at 37°C for 30 minutes, then purified with the Qiagen MinElute PCR Purification Kit. Libraries were amplified for 9-15 total cycles using the Nextera Ad1 and Ad 2.1-2.16 barcodes. Libraries were purified and eluted using the MinElute columns (Qiagen). Library concentrations were determined with Bioanalyzer High-Sensitivity DNA analysis (Agilent). Paired-end libraries for all samples analyzed were pooled and sequenced on an Illumina NextSeq 500 and two independent, biological replicates were sequenced per sample.
Cohesin HiChIP
Cohesin HiChIP was performed as previously described27. Briefly, 25x106 cells were crosslinked, lysed, and digested with MboI (NEB) for 2 hours at 37°C. Each sample was split into two reactions to ensure efficient contact generation. Biotin was incorporated onto DNA ends for 1 hour at 37°C, and then ligated with T4 ligase overnight at room temperature. Nuclei were pelleted, resuspended, and sonicated using a Covaris E220. At this point samples were combined back together. Proximity ligations bound to the cohesin complex were enriched by incubating overnight at 4°C using an SMC1A antibody (Bethyl). Biotinylated DNA was pulled out with Streptavidin C-1 beads (Thermo Fisher), which were then subjected to transposition with 1μL Tn5 (Illumina). DNA was amplified with PCR for 5 cycles and size selected with Ampure XP beads (Beckman Coulter). Three replicates from each cell line were pooled and sequenced on a single NovaSeq S1 flowcell for a total of 2 billion paired reads.
BASU Proximal Proteomics
Doxycycline-inducible BASU fusions were stably expressed in hESCs using piggybac transposition. 2μM doxycycline was added to the culture media for 24 hours to induce expression of the fusion protein, followed by 2 hours of 50μM d-biotin (Thermo Fisher) to label proximal interactors. Cells were collected in RIPA lysis buffer supplemented with 1X protease inhibitor (Roche). Six 15-cm plates were collected per replicate to obtain sufficient protein levels. Whole cell extract was briefly homogenized by sonication with a Diagenode Bioerupter and clarified by centrifugation. Biotinylation in each extract was quantified using a dot blot and inputs was normalized prior to pulldown. Cell extracts were added to 50μL MagReSyn streptavidin beads rotating, overnight at 4°C. Beads were stringently washed twice for five minutes each in three consecutive buffers as described previously29. For immunoblotting, biotinylated proteins were eluted by boiling (95°C, 800rpm) in Laemmli sample buffer supplemented with 10mM D-biotin.
Mass Spectrometry
For mass spectrometry, washed streptavidin beads (MagReSyn) were resuspended in 200μL of 100mM TEAB buffer (Thermo Fisher). Captured proteins were reduced on-bead with 10mM DTT at 55°C for 5 mins, followed by head-over-head incubation at room temperature for 25 more minutes. Proteins were then alkylated in 30mM acrylamide for another 30 minutes, followed by digestion overnight with 0.5μg of trypsin (Promega) per sample. Proteins were then separated from the beads with a magnet and quantified with a Quantitative Fluorometric Peptide Assay (Thermo Fisher). Equal amounts of acidified peptides were de-salted on C18 Monospin reversed phase columns (GL Sciences). The de-salted peptides were dried in a speed-vac before reconstitution in 15μl of reconstitution buffer (2% acetonitrile with 0.1% formic acid); 3μl of this solution was injected on the instrument. Mass spectrometry experiments were performed using an Orbitrap Q-Exactive HFX mass spectrometer (Thermo Scientific, San Jose, CA) with liquid chromatography using a Nanoacquity UPLC (Waters Corporation, Milford, MA). For each LCMS experiment, a flow rate of 300nL/min was used where mobile phase A was 0.2% formic acid in water and mobile phase B was 0.2% formic acid in acetonitrile. 50cm μPAC column from Pharmafluidics was used with New Objective Silica tip emitter. Peptides were directly injected onto the analytical column using a gradient (3%–45% B, followed by a high-B wash) of 80min. The mass spectrometer was operated in a data-dependent fashion using HCD fragmentation for MS/MS spectra generation. All mass spectrometry experiments were performed in duplicate with corresponding run-specific negative controls.
DNA Methylation Assays
DNA was isolated from cells using the Qiagen DNA Blood and Tissue Kit. Bisulfite conversion was performed using the EZ DNA Methylation kit (Zymo), followed by Illumina Methylation EPIC array for Genotyping. The MethylFlash Global DNA Methylation (5-mC) ELISA Easy Kit (Epigentek) was used to measure percent DNA methylation from the same DNA. All methylation experiments were performed in duplicate.
Single Cell RNA-seq
Single cell suspensions were prepared with Accutase, and any large clumps were removed with 40μM cell strainers. Dead cells were eliminated with a dead cell removal kit (Miltenyi) per manufacturer instructions. 10,000 cells at a concentration of 1,000 cells per μL were resuspended in PBS with 0.04% BSA (Miltenyi). Library prep was performed in duplicate with a Chromium Single Cell 3’ Reagent Kit v3.1 (10x Genomics) per manufacturer instructions. Libraries were pooled and sequenced on an S4 Novaseq flowcell.
Fluorescence Associated Cell Sorting (FACS)
Day 7 cells were dissociated in Accutase (Innovative Cell Technologies), and quenched with 10% FBS. Up to 10 million cells were pelleted and resuspended in 250uL of 3% FBS. 2uL of each antibody were added to the suspension and incubated on ice for one hour in the dark. Ectoderm antibodies were VTCN1-PE DAZZLE and ABCG2-PE, and the mesoderm antibody was PDGFRA-APC (BioLegend). Cells were washed three times in 3% FBS, resuspended in 400uL of 3% FBS, and strained with a 40μM cell strainer. Sorting was performed on a FACSAria II instrument in the Stanford Shared FACS Facility obtained using NIH S10 Shared Instrument Grant (S10RR025518-01). Gates were determined using unstained cells. PDGFRA+/ABCG2- cells were sorted out as mesoderm. ABCG2+/VTCN1+ cells were then sorted out to obtain ectoderm. Cells were re-plated at equal ratios on vitronectin (Thermo) coated plates and cultured with RA/BMP4 with 10μM ROCK inhibitor (StemCell Technologies) for 24 hours. ROCK inhibitor was removed for another 24 hours before switching to DKSFM. Gating strategies and negative controls are found in the Supplementary Figure.
Keratinocyte Cell Sorting
After 50 days in differentiation media, cells were dissociated with Accutase (Innovative Cell Technologies), washed, and counted in a wash buffer containing PBS, 1μM EDTA, 2% BSA, and 10μM ROCK inhibitor (StemCell technologies). Cell pellets were resuspended in FcR Blocking reagent (Miltenyi), 20μL FcR to 80μL of wash buffer up to 1x10⁷ cells for 5 minutes at room temperature. CD49F biotin antibody (Miltenyi), was added to the blocked cells at 1:50 in wash buffer and incubated for 20 min at 4°C. Wash buffer was adjusted to 10mL and centrifuged at 1000 rpm 5 minutes, then aspirated to completely remove supernatant. Cells were resuspended in 80μL of buffer and 20μL of Anti-biotin IgG microbeads up to 1x10⁷ cells (Miltenyi) and incubated at 4°C for 15 minutes. Cells were then washed and resuspended in fresh wash buffer up to 4mL. The labeled single cell suspension was MACS separated using AutoMACS (Miltenyi) PosselD program setting. Following separation, the cells were resuspended in Defined Keratinocyte Media (Gibco) and plated on ECM Collagen I coated peptide plates (Corning).
3D Organotypic Cultures
Devitalized de-epidermal human dermis (DED) was prepared as follows. Cadaver skin (New York Firefighter Skin Bank) was freeze-thawed three times to devitalize cells and washed in PBS with 5X penicillin/streptomycin, 5X gentamycin, and 5X fungizone. The sterilized skin was stored in PBS containing 1X penicillin/streptomycin, 1X gentamycin and 1X fungizone at 37°C for one week. The epidermis was then peeled off of the dermis, which was then stored in PBS containing 1X penicillin/streptomycin at 4°C for more than two weeks before use. Devitalized dermis was cut into 1.5cm x1.5cm pieces, and stored epidermis-down in 6-well dish at 37°C to let the dermis to attach to the bottom. 7.5x10⁵ 3T3 J2 fibroblasts were seeded on top of the DED in 2.5mL of DMEM and spun for 15 minutes at 1,000rpm. An additional 7.5x10⁵ cells were added and spun again. Cultures were then incubated at 37°C for 2-3 days and subsequently transferred to a steel supporter with a 1x1-cm hole in a 6-cm dish for an additional 2-3 days. The culture was switched to DKSFM, and 1x10⁶ iKCs were seeded onto the center of DED. After 3 days the culture was lifted to the air-liquid interface and switched to KGM medium (DMEM: Hams F12 3:1, FBS 10%, 1X Nonessential amino-acid, Adenine Hydrochloride 0.18mM, Cholera Toxin 0.1nM, EGF 10ng/ml, Hydrocortisone 0.4μg/ml, Insulin 5μg/ml, Triiodo-L-thyronine 2nM, Transferrin 5μg/ml). After two to four weeks, the organotypic cocultures were collected and the pieces were embedded in OCT and paraffin for downstream analysis.
Immunofluorescent Staining
Cells were fixed with 4% cold paraformaldehyde for 10 minutes, permeabilized with 0.2% Triton X-100 for 10 minutes at room temperature and blocked with 10% horse serum (Vector Laboratories) in 0.2% Triton X-100 for 1 hour at room temperature. Cells were incubated, shaking, overnight at 4°C with primary antibodies. Primary antibodies used in this study are: Gibbin/AHDC1 (1:25, Abcam), KRT14 (1:400, BioLegend), ITGA6 (1:200, Millipore, MAB1378), IVL (1:100, Abcam), DSG3 (1:100, Thermo Fishers), KRT10 (1:500, Covance), COL7A1 (1:250, Millipore), HP1a (1:1000 Santa Cruz), and p63 (1:100 GeneTex). Cells were then incubated with Alexa 488, 555, or 647-conjugated secondary antibodies diluted with 0.2% Triton X-100 in PBS (1:500, Life Technologies) for 1.5 hours at room temperature. Slides were washed three times in PBS, incubated with Hoescht (1:10,000, Life Technologies) for 15 minutes, and mounted onto slides with Prolong Gold (Life Technologies). All fluorescence images were taken using an SP5 confocal laser scanning microscope (Leica) using the Leica Application Suite for Advanced Fluorescence software version 2.7.9. Live cell images were taken with a Leica Live Cell Camera. All images are representative of 10-20 random views of each sample. HP1α foci were quantified and analyzed with a custom python script.
Mouse Pronuclear Injections and Grafting
All animal experiments followed the NIH Guide for the Care and Use of Laboratory Animals and were ethically approved by the Stanford Administrative Panel on Laboratory Animal Care (APLAC) under protocol #11680. All mice were housed under standard conditions (ambient temperature of 72°F, humidity of 42%, 12-hour light/dark cycle), and animal care followed protocols approved by the Institutional Animal Care and Use Committee (IACUC) at Stanford University. To generate zygotes, 4-week-old C57Bl6/J female embryo donor mice were super-ovulated and bred with C57Bl/6 males. Equal amounts of crRNA and tracrRNA (Synthego) were annealed to form crRNA:tracrRNA duplex, and added to Cas9 protein to form RNPs. Zygotes were collected and RNPs were injected into the pronucleus, then 60-100 zygotes were implanted into oviduct of each 8-week-old CD-1 surrogate mother. Pregnant CD-1 surrogates were euthanized at day 18 with CO2. Sterile surgical equipment was used to isolate embryos and separate skin from the body. DNA isolation and genotyping were performed on yolk sacs. Experiments were collected across 2 separate injections and 6 different litters. Mouse allografting was performed in a laminar hood using 8 to 10-week-old female NIH III nude mice anesthetized with an intraperitoneal injection of 0.25cc/25g body weight of rodent cocktail (Ketamine hydrochloride 80mg/kg and Xylazine 16mg/kg). An incision was made into the adult mouse skin to the appropriate size, keeping the capillary bed intact. A small piece of E18 embryo skin was then was placed onto the wound and secured with a 6-0 nylon surgical suture. The wounds were dressed with Tefla non-adhering dressing with some polysporin ointment (Bacitracin Zinc and Polymycin B sulfate) and secured with sutures. After five weeks, the allografts were collected, and the skin pieces were embedded in OCT or paraffin for downstream analysis.
Data Analysis
Motif Discovery and Gene Ontology Analysis
Motif discovery was performed using HOMER v4.11 findMotifsGenome.pl with –size 200. Gene ontology analysis was performed using EnrichR58.
RNA-seq Analysis
.Fastq files were aligned to hg38 using TopHat v2.1.1 (parameters: p 10 --library-type fr-firststrand -r 100 --mate-std-dev 100). Aligned reads were processed to remove PCR duplicates using Samtools v1.8. Raw reads on reference genes and RPKM values were calculated using HOMER analyzeRepeats.pl. To test for differential expression, raw reads were compared using DESEQ2 v1.34.059, and filtered based on an adjusted p-value of < 0.01 and 2-fold change over WT. MA plots were made using ggplot2 v3.3.5 in R.
ChIP-seq Analysis
.Fastq files were aligned to hg38 using bowtie 2.3.4.1 (parameters: -p 24 -S -a -m 1 --best –strata). Read coverage depth for each bam file was generated using bedtools v 2.27.1 genomecov, then deduplicated bam files were filtered to using samtools view for reads with coverage depth of at least 3. Peak calling was carried out with MACS2 v2.27.1 using default settings with an adjusted p-value of 0.01. To filter out non-reproducible peaks, MACS2 peaks from biological replicates were processed through the Irreproducible Discovery Rate (IDR v2.0.3) framework in R using an adjusted p-value cutoff of 0.0160. H3K27Ac enhancers were ranked using the ROSE algorithm61. Differential expression with batch correction was performed using DiffBind v2.2.1. MA plots were made using ggplot2 in R. A custom python script was used to calculate the distance between ChIP-seq peaks5. Heatmaps were made with deeptools v3.5.1.
Mass Spectrometry Analysis
Peptide identification and protein inference was performed on .RAW data files using Byonic v2.14.27 (Protein Metrics, San Carlos, CA). Proteolysis was assumed to be tryptic allowing for N-ragged cleavage with up to two missed cleavage sites. Precursor and fragment mass accuracies were held within 12 ppm. Proteins were held to a false discovery rate of 1%, using standard approaches. Counts were analyzed using the CRAPome v2.062, which calculated SAINT63 scores and fold enrichments over the negative control. SAINT scores greater than or equal to 0.9 were considered significant hits. Protein-protein interaction maps and connectivity calculations were generated with Cytoscape 3.6.1.
ATAC-seq Analysis
Nextera barcodes were removed using TrimGalore 0.5.0. Fastq files were mapped to hg38 using bowtie 2.3.4 (parameters: -p 24 -S -m 1 -X 2000). PCR duplicates and mitochondrial DNA were removed with amtools. MACS2 was used to call peaks with an extension size of 150, a shift of 75, and p-value of 0.01. A union list of the MACS2 called peaks was generated using the merge command from bedtools, and raw reads covering each region were recovered from bam files using bedtools multicov. This list was fed into DESEQ2 for differential expression analysis based on an adjusted p-value of < 0.01 and 2-fold change over WT. Deeptools was used to compute and plot coverage matrices for each cell type surrounding ChIP-seq peaks or target gene TSS regions.
Cohesin HiChIP Analysis
Paired end reads were aligned to hg38 using HiC-Pro v2.11.464. All 3 replicates were pooled to achieve maximum depth, duplicate reads were removed, assigned to MboI restriction fragments, filtered for valid interactions, and then used to generate binned interaction matrices of 5kb, 10kb, or 25kb resolution. The 5kb interaction matrices were used to visualize contacts by Virtual 4C. Raw signal was normalized based on sequencing depth. Unless otherwise specified, all downstream analyses were performed using Genova v1.0.065. The 10kb interaction matrix was used to make matrix plots, calculate Reciprocal Contact Probability (RCP), and call insulation scores and contact domains. Window size for insulation scoring was set to 25, and scores less than −1 were discarded as artifacts. The cutoff for differential insulation between WT and KO was set to an absolute change of −0.2 as previously described33. 25kb matrices were generated to call compartment scores against H3K27Ac ChIP-seq. The 10kb matrix file was used to call high confidence contacts using FitHiChIP v9.066. High confidence contacts were defined as counts > 10, FDR < 0.001. The contacts called in the WT were used as anchor points for Aggregate Peak Analysis (APA) using the 10kb matrices for each cell type. A custom python script was used to anchor ChIP-seq peaks in FitHiChIP contacts, and to further determine which peaks were bound or looped to each gene TSS (+/− 5kB). Bedtools was used to overlap loop coordinates between WT and GKO. Chromatin loop lists were collapsed into bed files so that both loop ends were considered for ChromHMM analysis. The HOMER script annotatePeaks.pl was used to identify the distribution frequencies of CTCF Chip-Seq signal in each set of loop anchors, using a bin size of 500bp and a window size of 200kb. Chromatin loops output by FitHiChIP were visualized using the WashU Genome Browser.
ChromHMM Analysis
Previously published non-neural ectoderm H3K27Ac, H3K27me3, H3K4me1, and H3K4me3 ChIP-seq datasets5 were re-mapped to hg38 as described above. ChromHMM was used to learn and identify chromatin states as instructed as described previously67. Enrichment of each state at ChIP-seq summits, DNA methylation regions, or condensed chromatin loop coordinates was calculated using the NeighborhoodEnrichment command. Enrichments were plotted using Python matplotlib 3.5.0 library for CTCF or Prism for HiChIP experiments.
DNA Methylation Array Analysis
Methylation array .idat files were read using Minfi v1.40.0, and any low-quality probes (detection p-value <0.01) were discarded. Data was swan normalized prior to calculation of M and Beta values. Common CpG SNPs were removed using the dropLociWithSnp command. To extract Differentially Methylated Probes (DMPs), Limma v3.50.0 was used to create a normalized count matrix of M values designed on cell type. Limma estimated the fold changes and standard errors by fitting a linear model for each gene, followed by Empirical Bayes smoothing. Differentially Methylated Regions (DMRs) were determined using the Minfi dmrcate function. DMPs and DMRs were annotated with the Illumina MethylationEPIC annotation file (https://github.com/achilleasNP/IlluminaHumanMethylationEPICanno.ilm10b5.hg38). Volcano plots were generated using ggplot2 in R.
Single Cell RNA-seq Analysis
FASTQ files were processed using 10x Genomics Cell Ranger 6.0.0 and the human genome GRCh38. Cells with UMI counts between 1000 and 8500 were used for further analysis and cells with mitochondrial percentages above 10% were excluded. Downstream analyses were performed with Seurat v 4.0.1. Duplicates for day 7 and day 50 time points were merged into one object and normalized with default parameters. To compare WT and GKO cell types, the Seurat object was split by sample and anchors were identified between samples using FindIntegrationAnchors, followed by integration. 2,000 highly variable features were identified, objects were scaled to regress out cell cycle stages, and PCA was performed using variable features. Cells were clustered using 10 dimensions and a resolution of 0.05 to obtain 3 clusters at day 7 or 4 clusters at day 50. Seurat FindAllMarkers was used for differential expression testing within individual clusters. Monocle 2.16.0 was used for pseudotime analyses. Data was extracted from the Seurat object to create a Monocle cds. The 2,000 variable features were used to order the pseudotime process, and the dimension was reduced using DDRTree and Monocle scaling. Cell trajectories were colored using the previously identified Seurat clusters. CellChat v1.1.2 analysis was performed one each dataset and merged using mergeChellChat. COMET42 analysis was used to select surface markers for cell sorting.
Extended Data
Extended Data Figure 1: Gibbin regulates mesoderm gene expression in response to RA/BMP4.
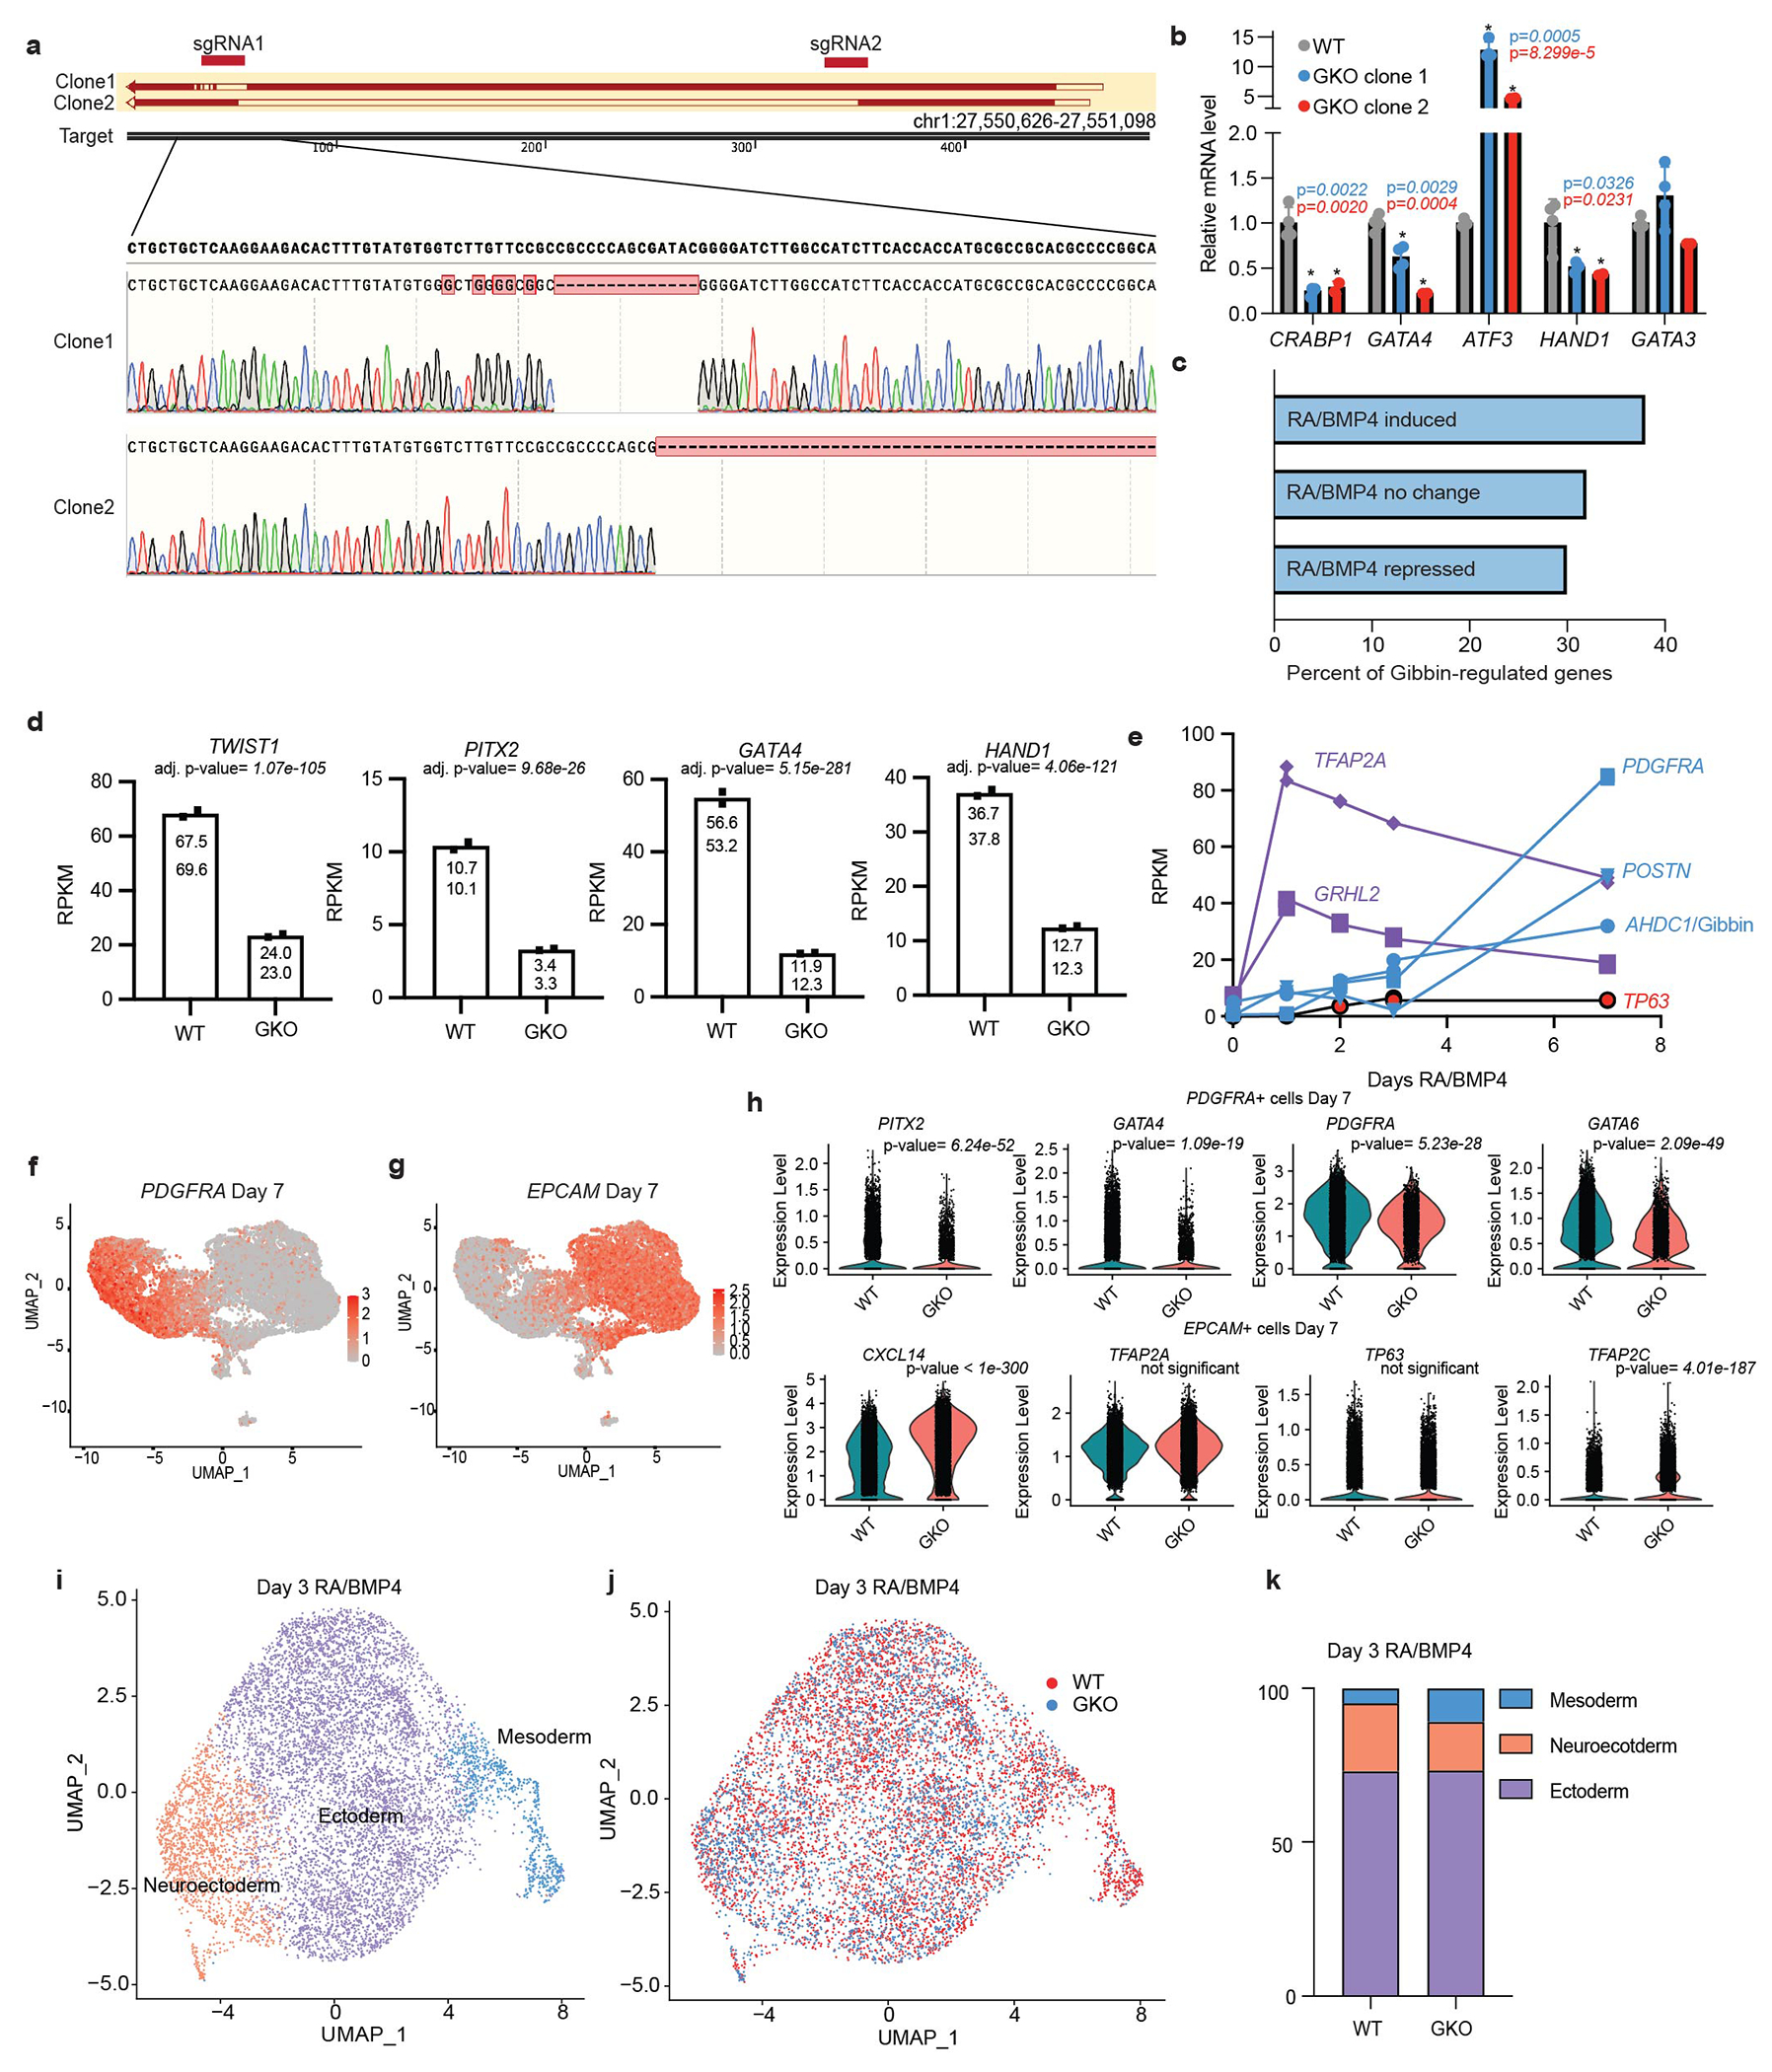
(a) Genotyping evidence from two different GKO hESC clones. (b) Gene expression comparing WT to each GKO clone. Clone 2 was used for the remainder of the study. Error bars are mean +/− s.d., n=4 biologically independent samples averaged from 2 technical replicates repeated across 2 different runs. * Indicates p-value < 0.05 calculated by two-tailed t-test. (c) Proportions of Gibbin-regulated genes that are also altered by RA/BMP4. (d) Representative RPKM values from RNA-seq differential expression after 7 days RA/BMP4. Error bars are mean +/− s.d., n=2 biologically independent samples, adjusted p-values were measured by DESEQ2. (e) Expression patterns of ectoderm (purple, red) or mesoderm (blue) transcripts after RA/BMP4 treatment. (f) UMAP of PDGFRA or (g) EPCAM expression at day 7, marking the mesoderm or ectoderm clusters, respectively. (h) Representative expression plots and adjusted p-values from differential expression testing of scRNA-seq subsets as measured by DESEQ2. (i) UMAP of hESCs after 3 days of RA/BMP4. (j) Integrated UMAP and (k) cluster quantification comparing WT and GKO after 3 days of RA/BMP4.
Extended Data Figure 2: Gibbin ChIP-seq QC.
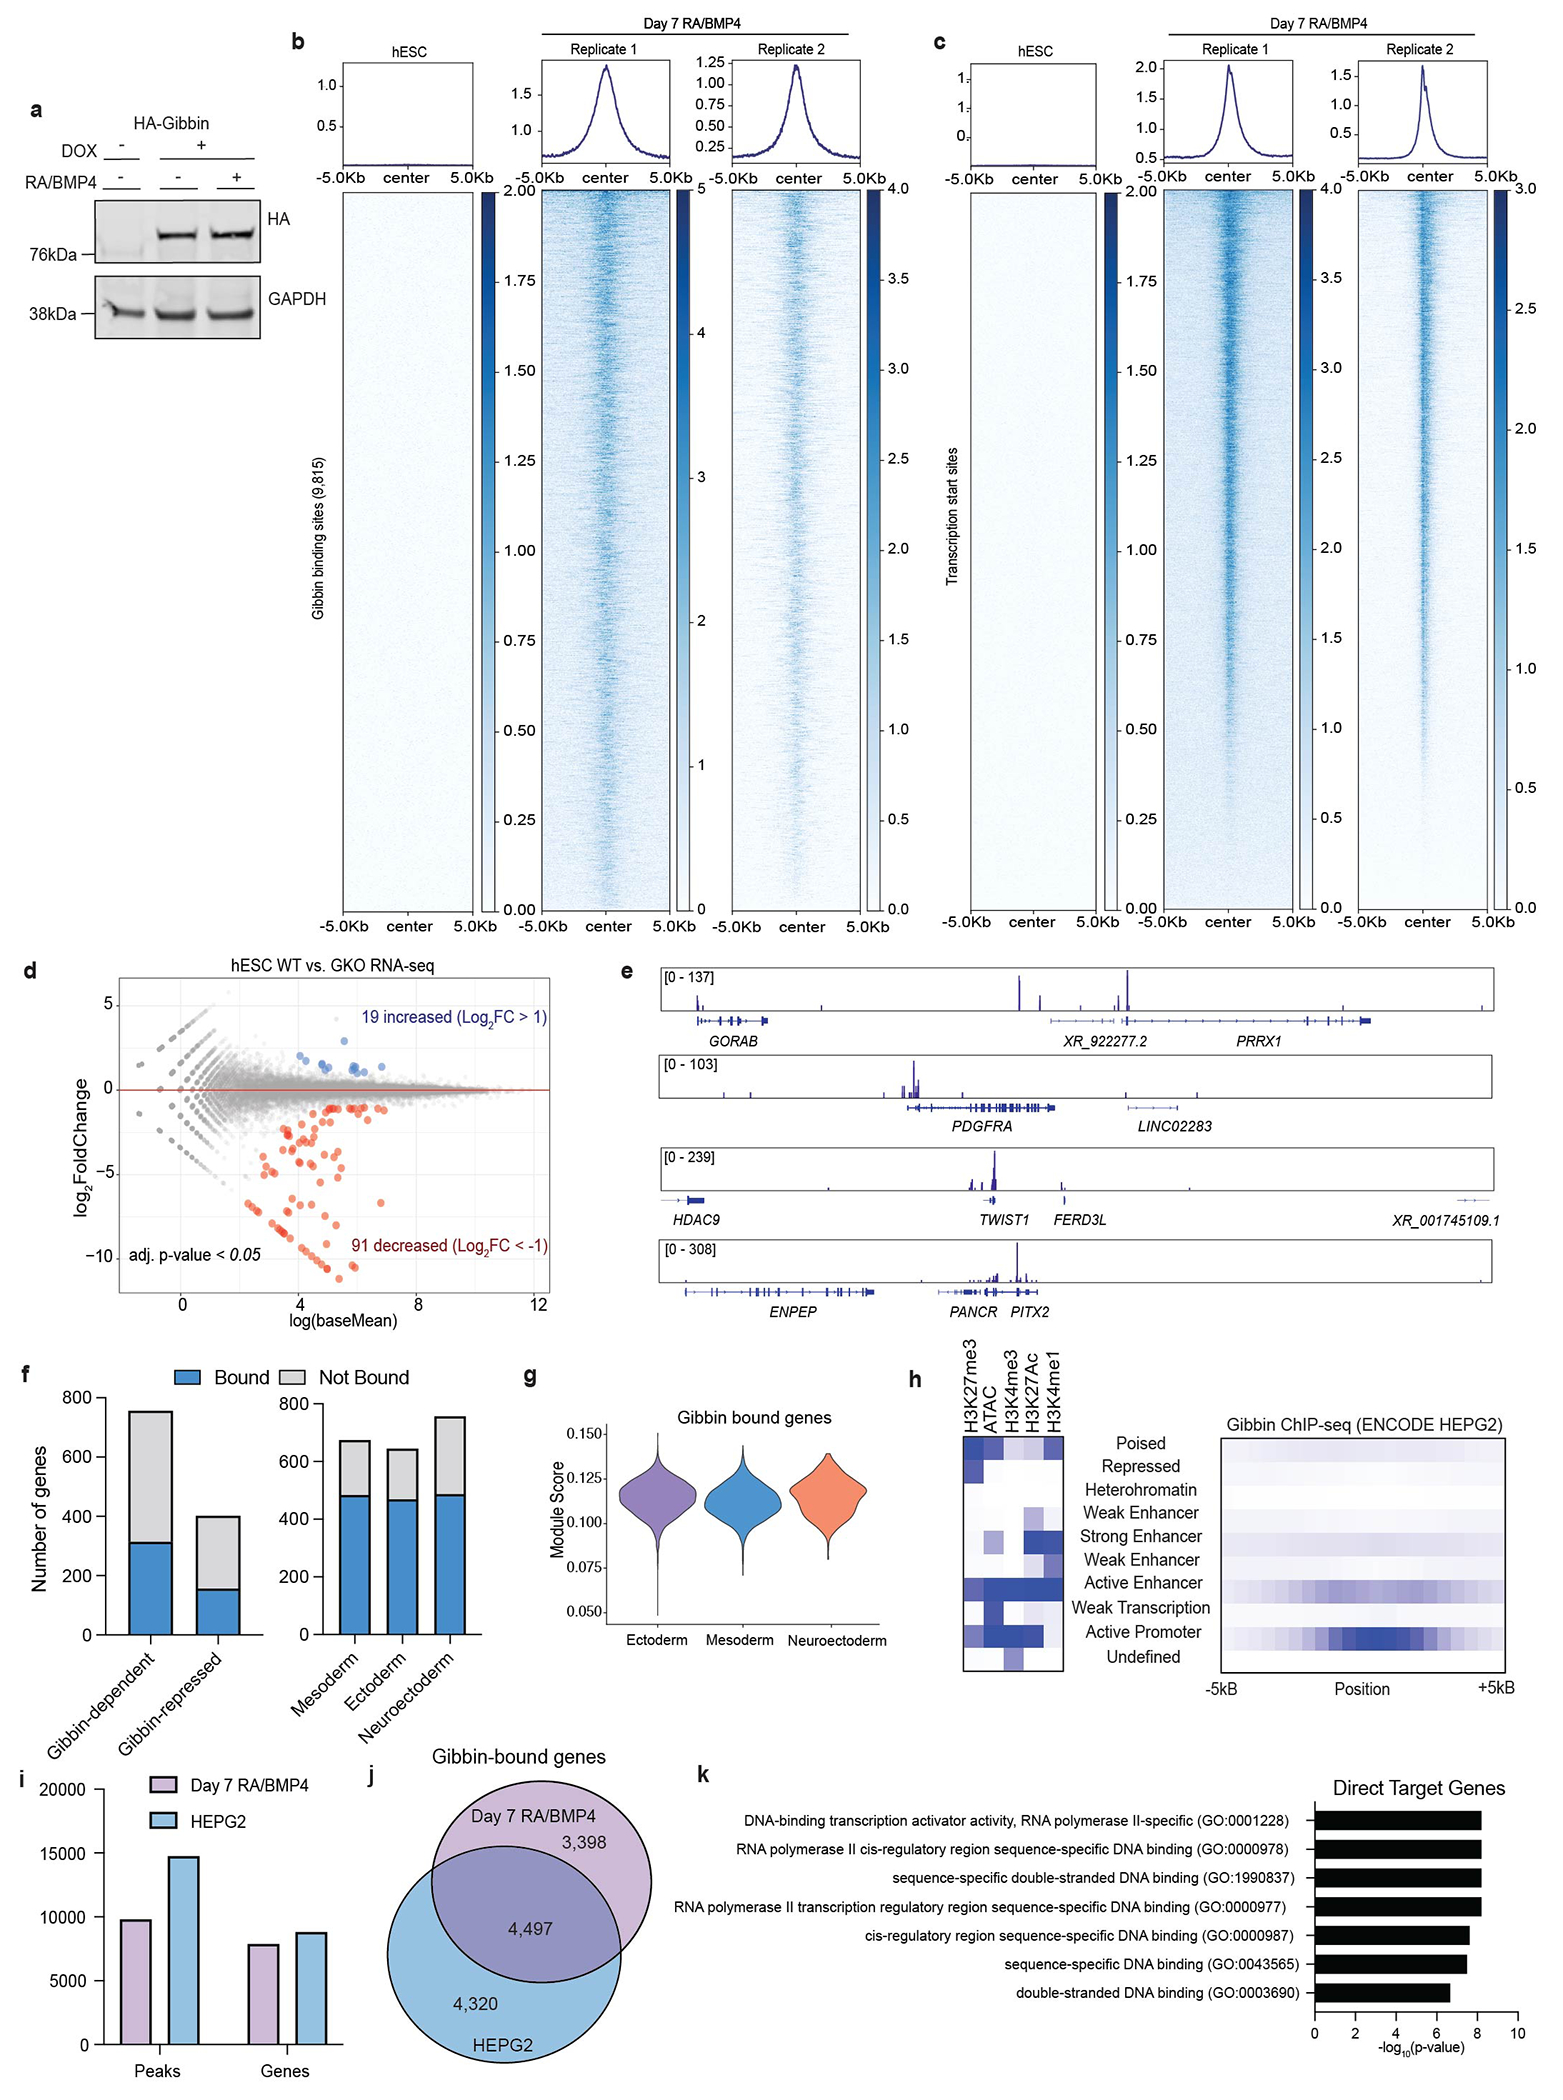
(a) Western blot of doxycycline inducible HA-Gibbin used for ChIP-seq. Immunoblotting was repeated experimentally twice and GAPDH was run on the same gel as a loading control. For gel source data, see Supplementary Figure 1. (b) Gibbin ChIP-seq binding profile in hESCs or after 7 days of RA/BMP4 at Gibbin binding sites or (c) at all gene transcription start sites. n=2 biologically independent samples. (d) Representative Gibbin ChIP-seq tracks at example target genes. (e) Differential expression analysis from untreated hESC RNA-seq between WT and GKO cells. Gene expression is either unchanged (grey), increased (blue, >2-fold), or decreased (red, <2-fold), with an adjusted p-value cutoff < 0.05 as measured by DESEQ2. n=2 biologically independent samples. (f) Number of Gibbin-regulated genes with a nearby Gibbin ChIP-seq peak and number of mesoderm, ectoderm, or neuroectoderm genes (identified by scRNA-seq) that are bound by Gibbin. (g) Expression of Gibbin-bound genes across scRNA-seq clusters. (h) ChromHMM analysis of Gibbin binding sites in HEPG2 cells (from ENCODE26), showing enrichment of various chromatin states in relation to Gibbin ChIP-seq peaks. (i) Numbers of peaks and (j) overlap of genes identified in our Gibbin ChIP-seq dataset or the ENCODE HEPG2 dataset. (k) GO term enrichment for direct, Gibbin-bound target genes as measured using a two-sided Fisher’s Exact Test (via EnrichR).
Extended Data Figure 3: Gibbin and GATA3 are co-expressed.
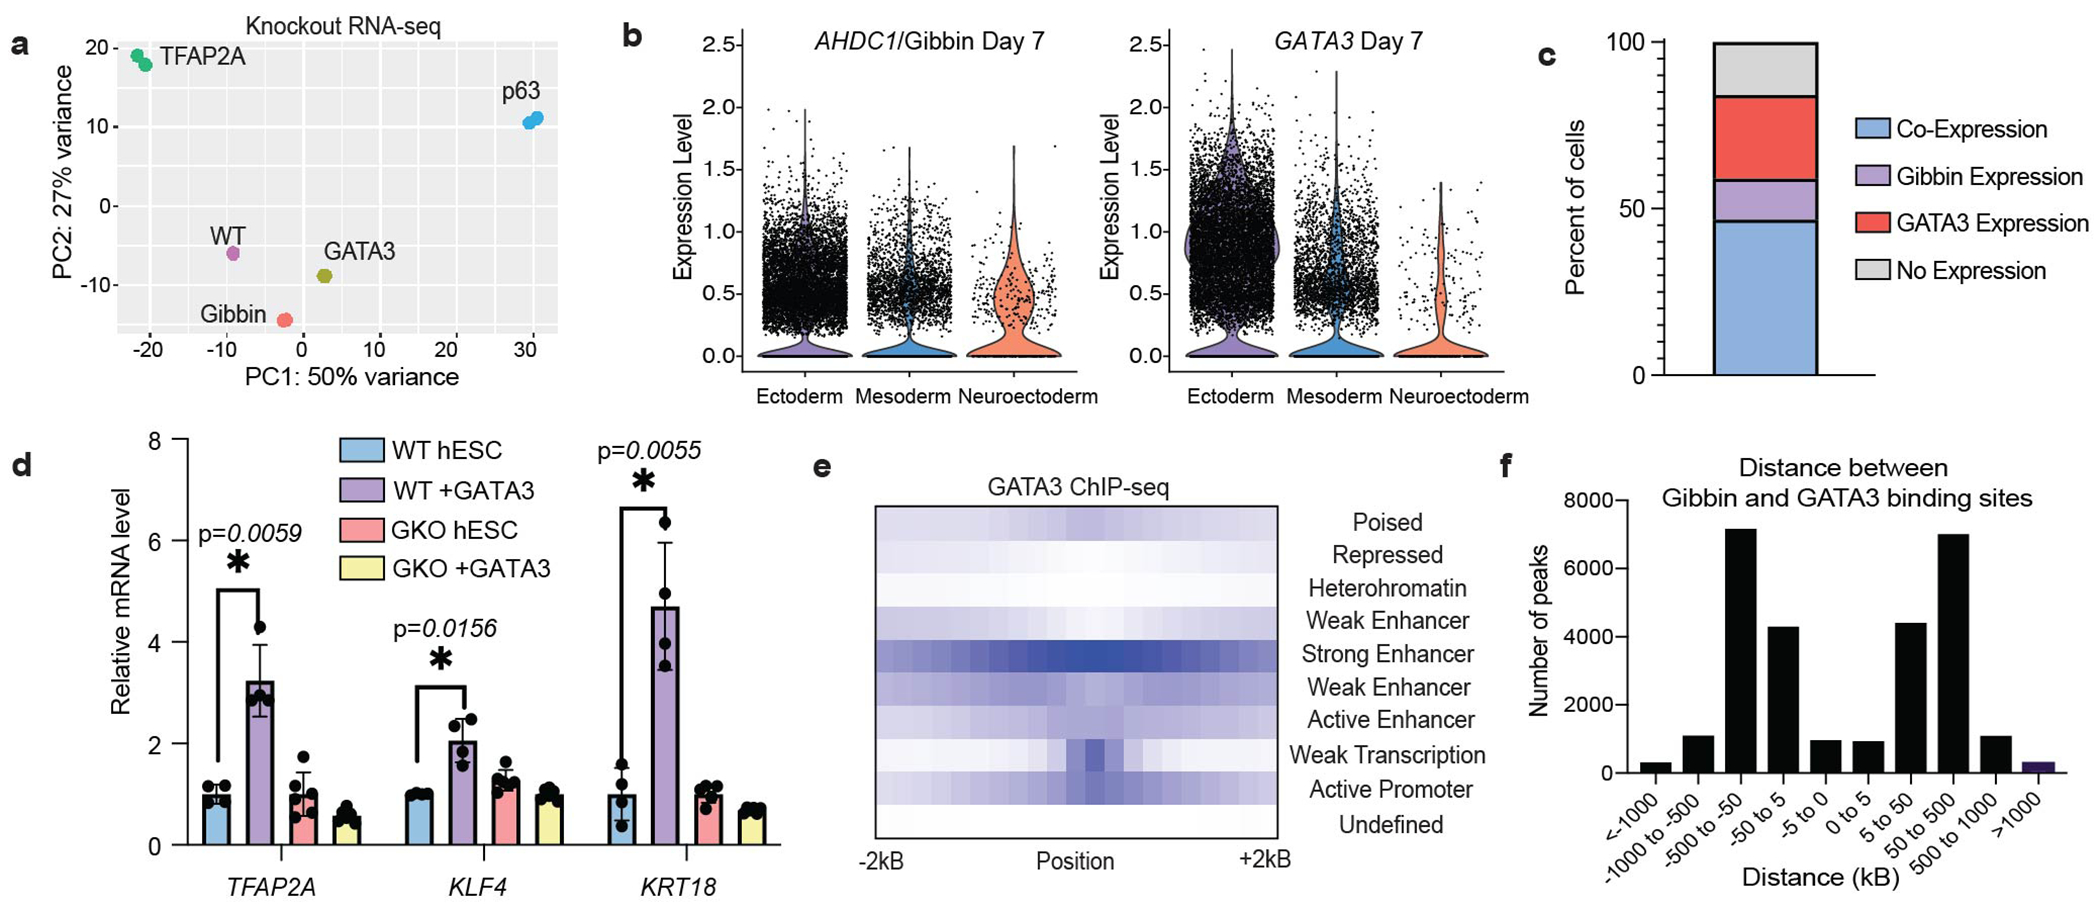
(a) Principal component analysis (PCA) of RNA-seq from WT, GKO, TFAP2A KO, GATA3 KO, and p63 KO cells after 7 days of RA/BMP4 treatment. n=2 biologically independent samples. (b) Violin plot of AHDC1/Gibbin or (b) GATA3 expression in each scRNA-seq cluster after 7 days of RA/BMP4. (c) Percent of cells after 7 days of RA/BMP4 which express AHDC1/Gibbin and/or GATA3. (d) qPCR of transcripts induced by GATA3 overexpression in WT or GKO backgrounds. Error bars are mean +/− s.d., n=3 biologically independent samples averaged from 2 technical replicates. * indicates p-value < 0.05 by two-tailed student’s t-test. (e) ChromHMM analysis of GATA3 binding sites showing enrichment of various chromatin states in relation to GATA3 ChIP-seq peaks. (f) Average distances between Gibbin and GATA3 ChIP-seq peaks.
Extended Data Figure 4: Gibbin does not alter chromatin accessibility or GATA3 DNA binding.
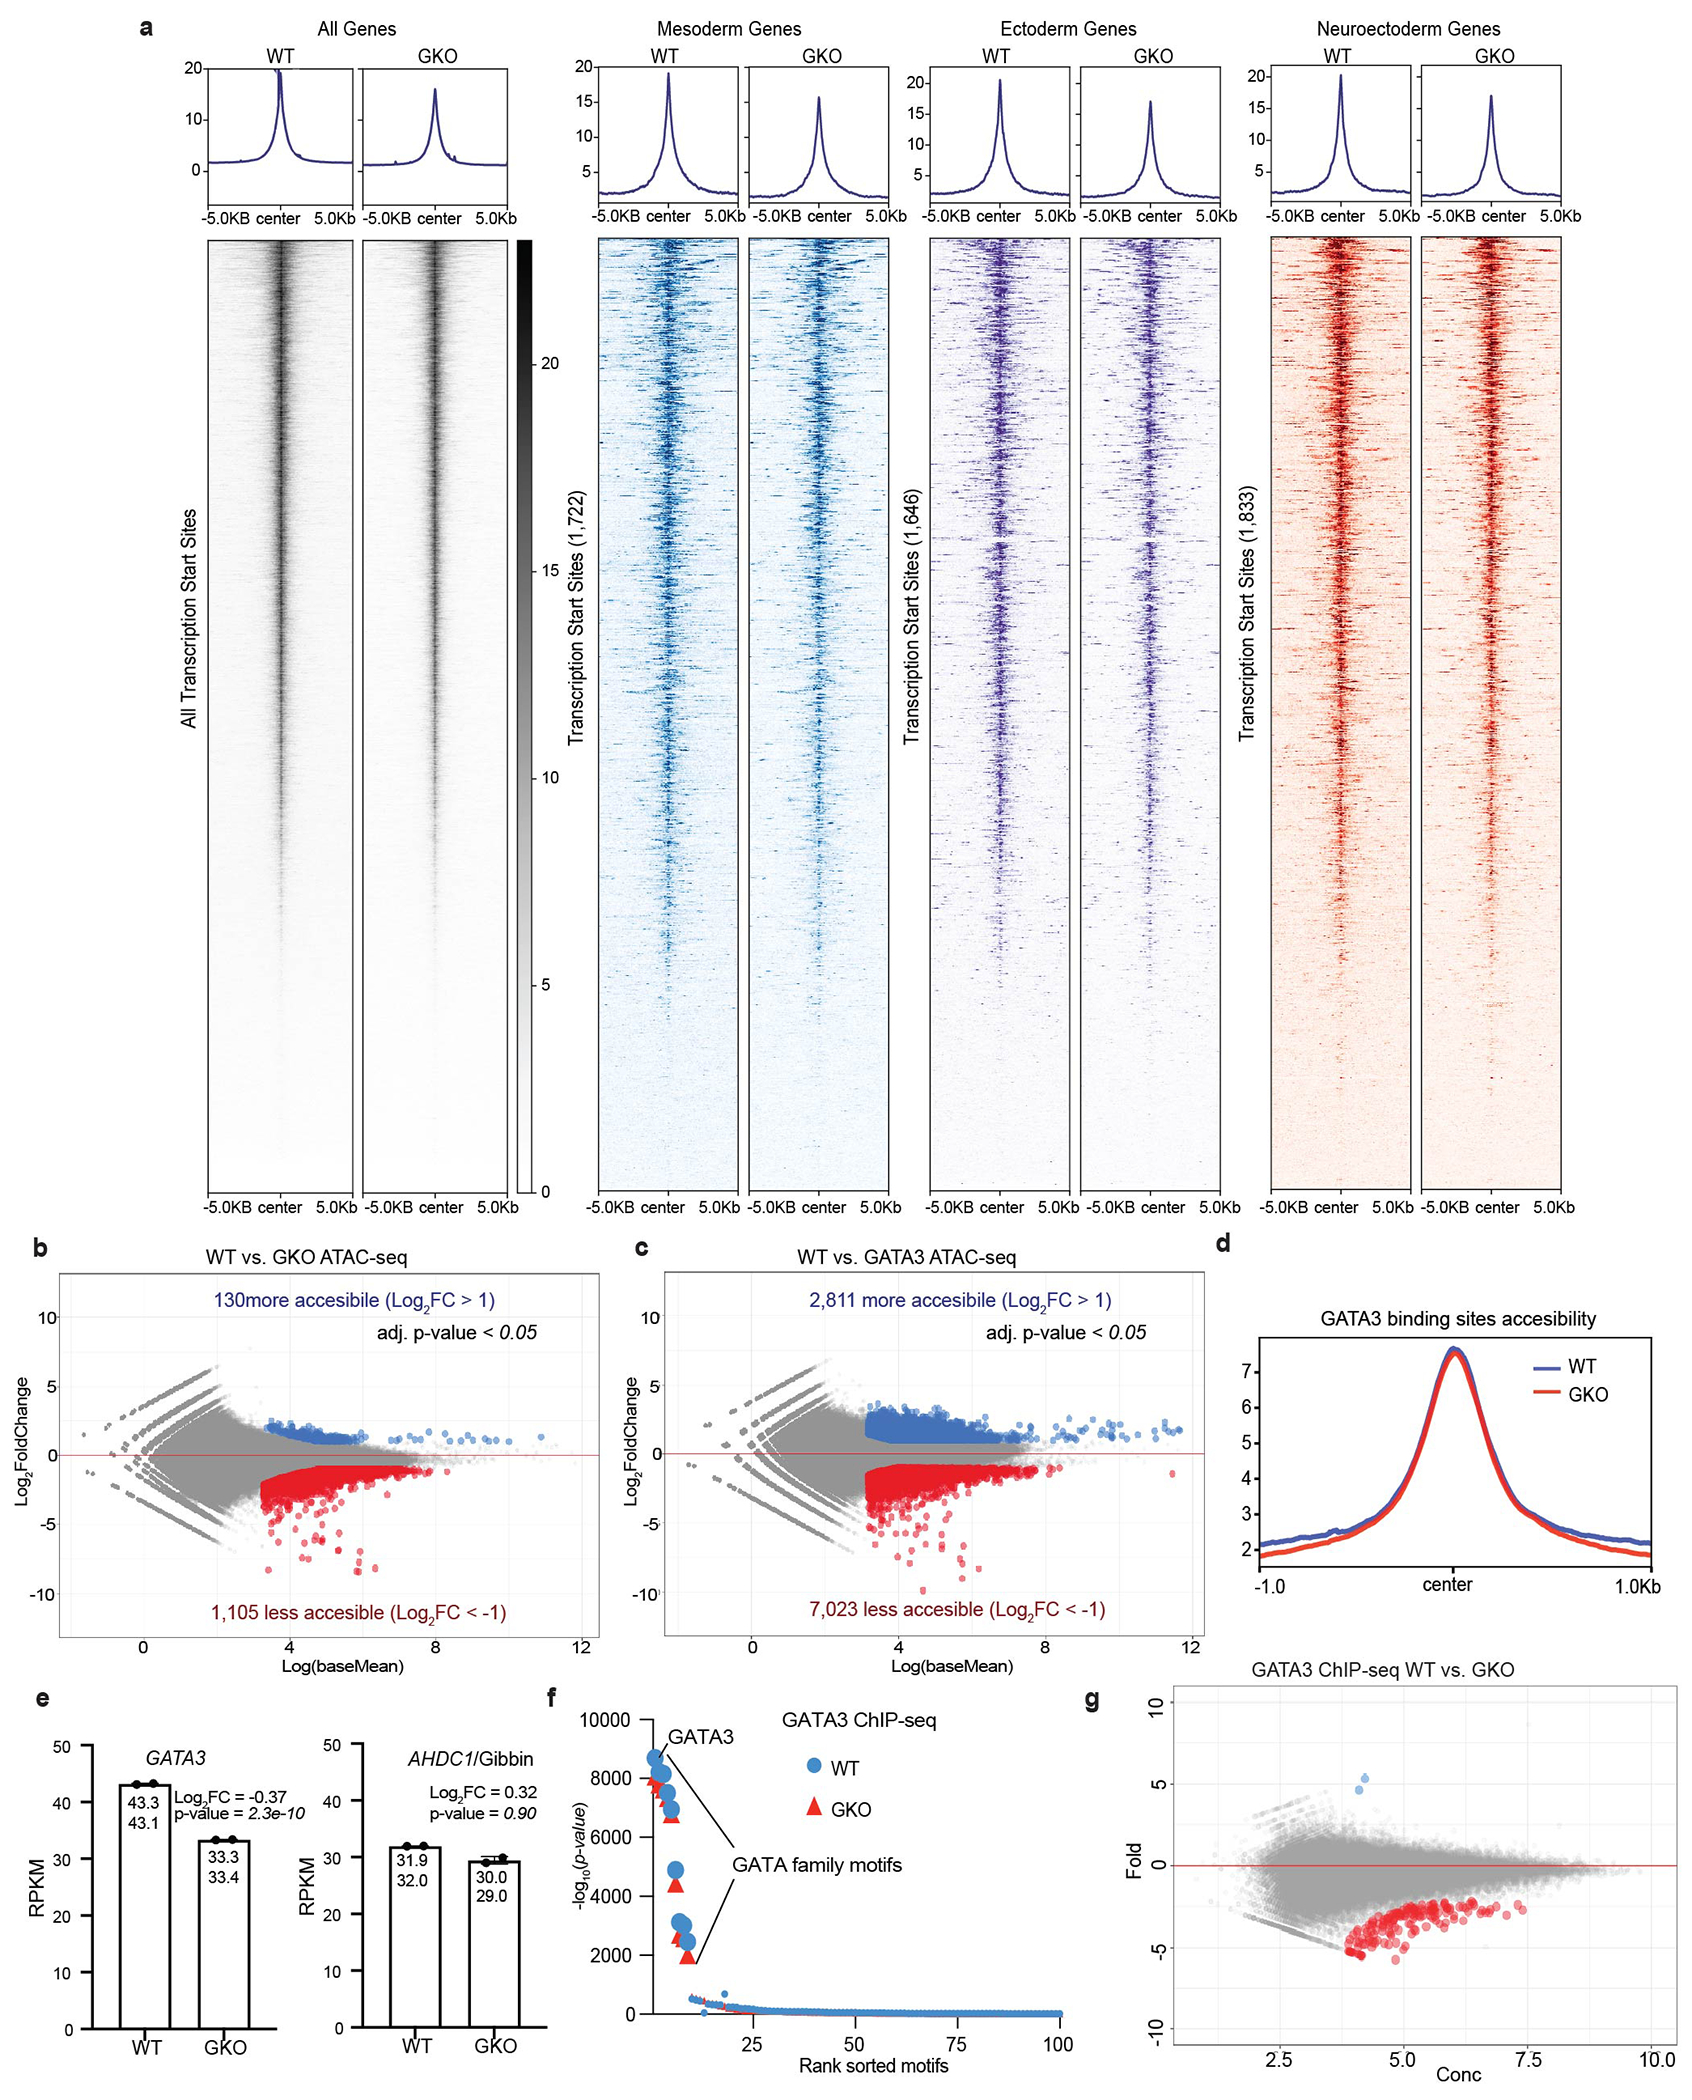
(a) ATAC-seq signal heatmaps in WT or GKO cells at all gene transcription start sites, or those subset by mesoderm, ectoderm, or neuroectoderm. n=2 biologically independent samples. (b) ATAC-seq differential expression analysis comparing WT to Gibbin or (c) GATA3 KO cells after 7 days of RA/BMP4. Differential chromatin accessibility is either unchanged (grey), increased (blue, >2-fold), or decreased (red, <2-fold), with an adjusted p-value cutoff <0.05 measured by DESEQ2. (d) Chromatin accessibility at GATA3 binding sites in WT or GKO cells. (e) RPKM values for GATA3 or AHDC1/Gibbin in reciprocal mutant cell lines. Error bars are mean +/− s.d., n=2 biologically independent samples, adjusted p-value <0.05 as measured by DESEQ2. (f) Known motif enrichment at GATA3 ChIP-seq peaks in WT and GKO cells, calculated by Homer. (g) GATA3 ChIP-seq differential binding analysis comparing WT and GKO cells. GATA3 DNA binding is either unchanged (grey), increased (blue, >2-fold), or decreased (red, <2-fold), with an adjusted p-value cutoff <0.05 as measured by DESEQ2.
Extended Data Figure 5: Gibbin regulates gene expression by maintaining local enhancer-promoter chromatin architecture.
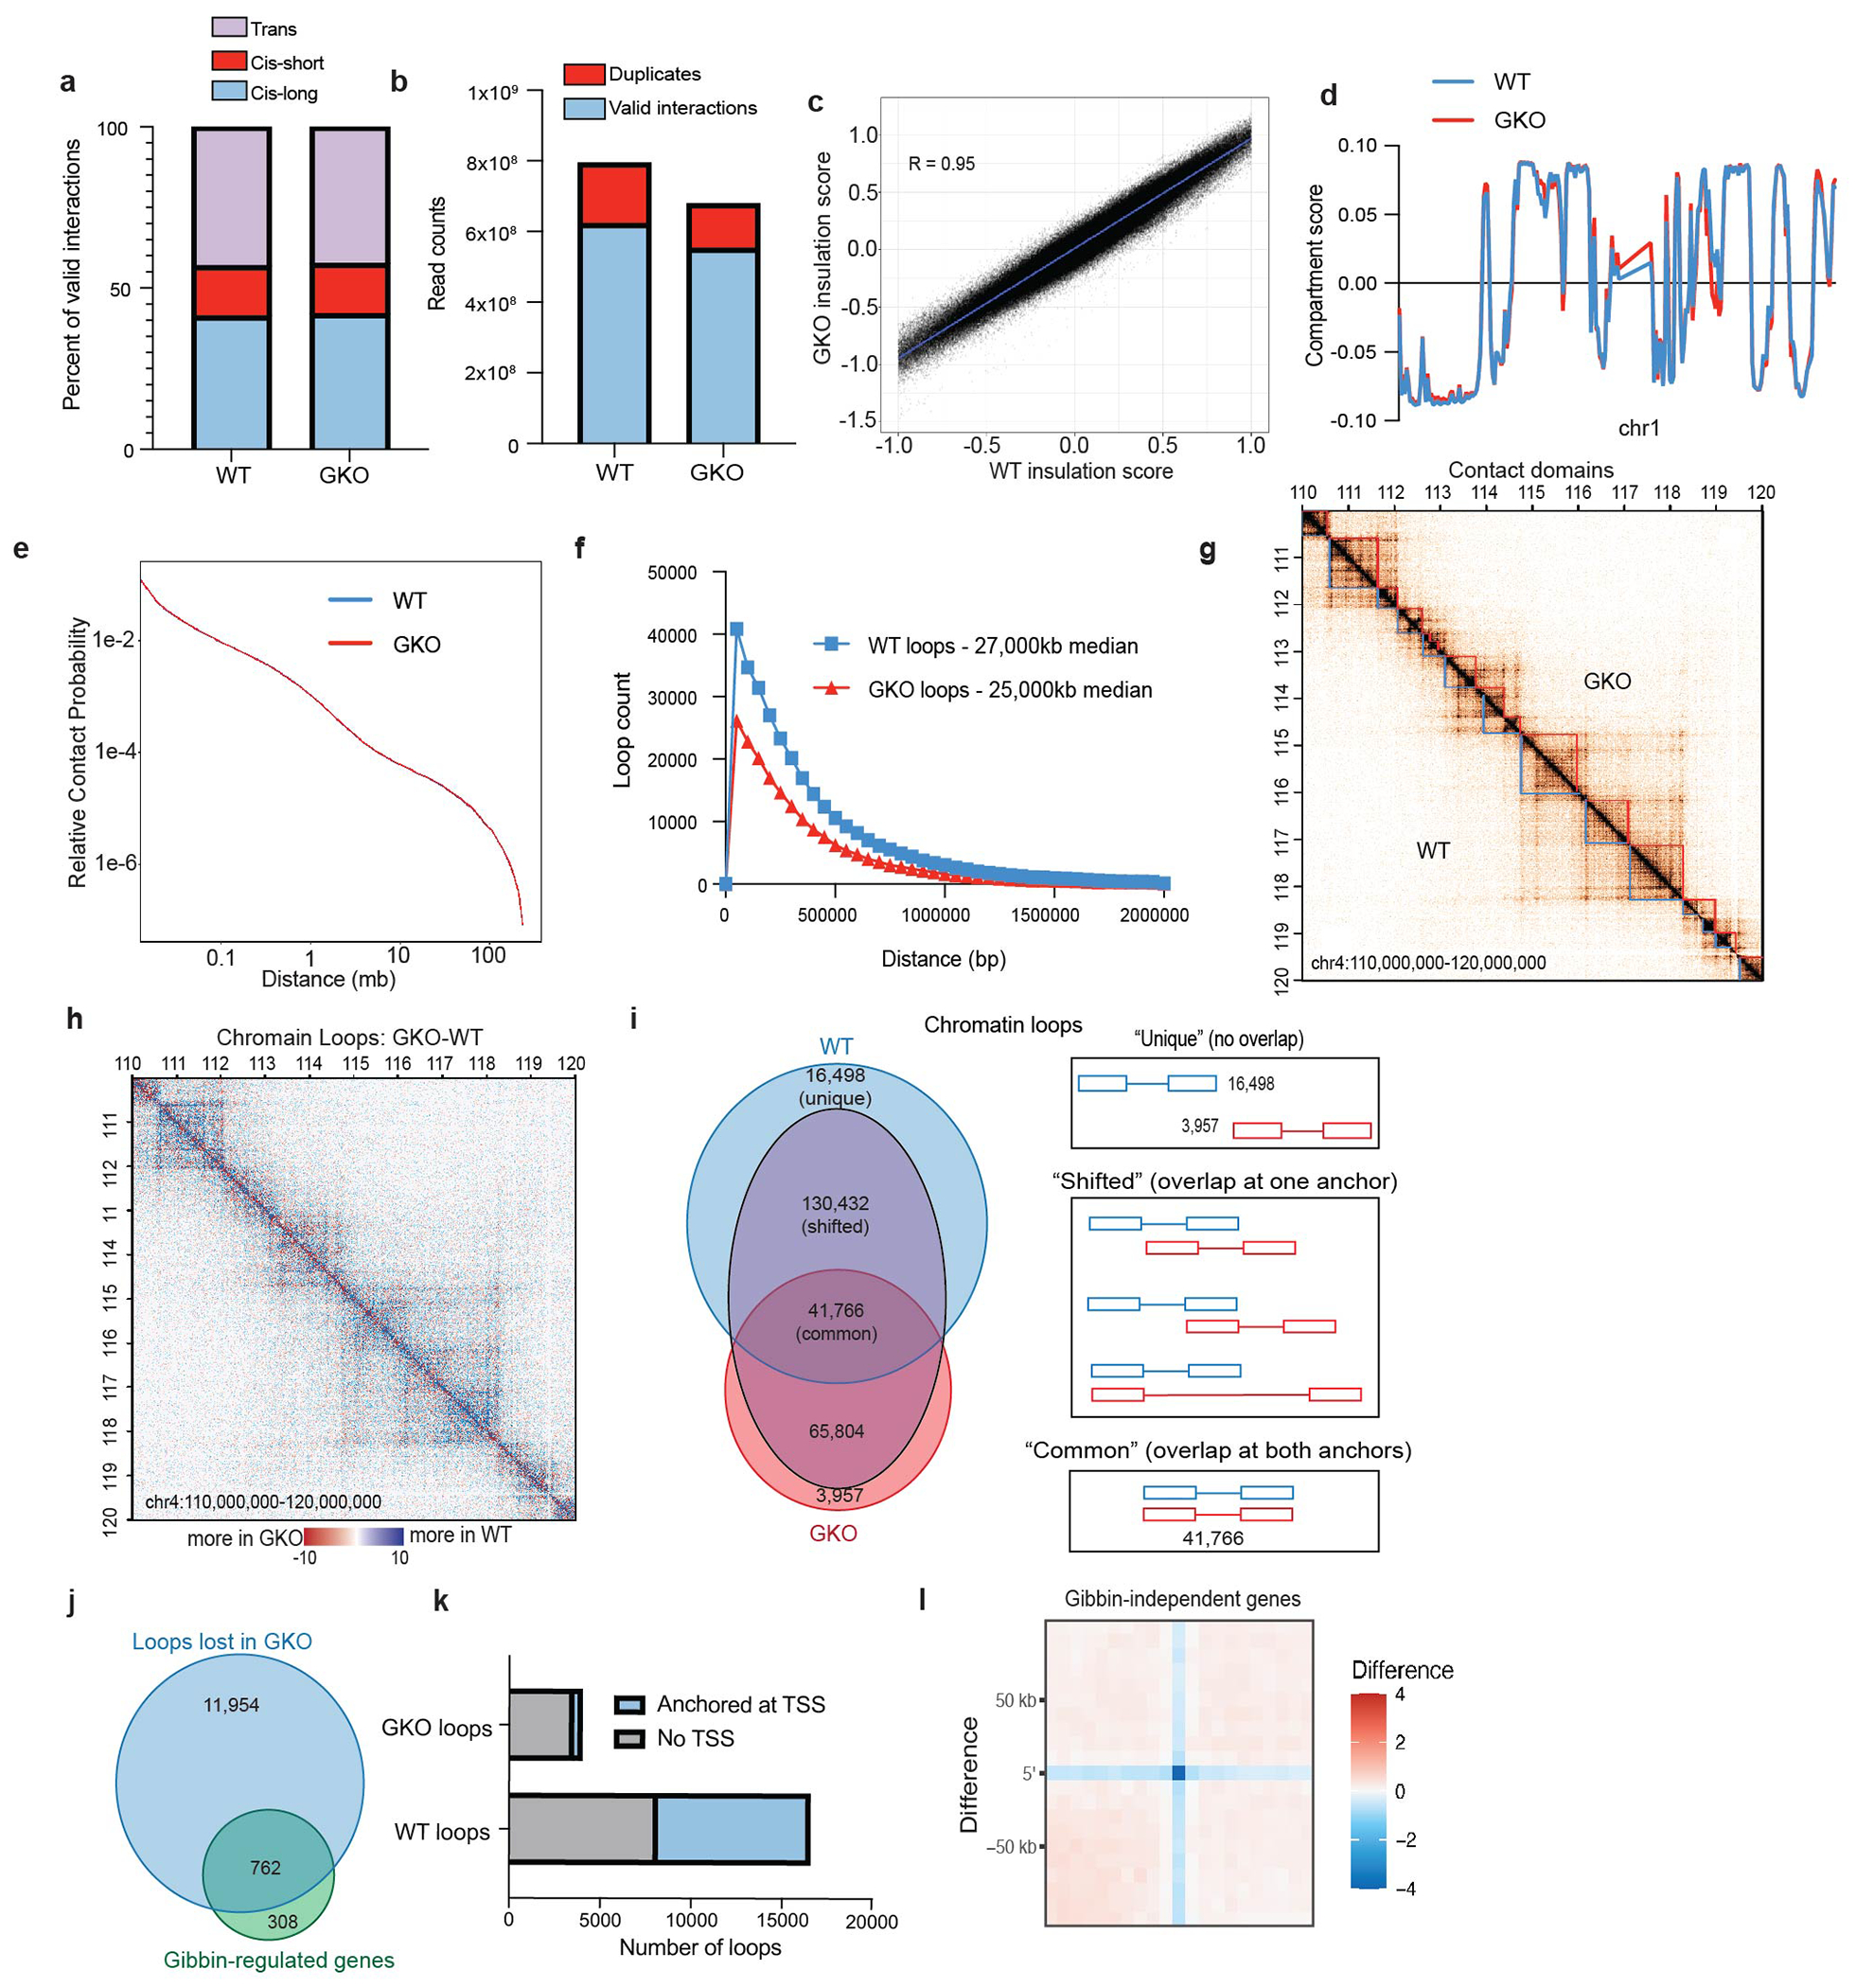
(a) Sequencing depth, PCR duplicates, and (b) valid interaction characterization of cohesin HiChIP libraries. (c) Correlation of insulation scores between WT and GKO. (d) A and B compartment scores for chromosome 1, which are representative of the entire genome. (e) Contact probability relative to contact distance for each cell type. (f) Length of contacts called by FitHiChIP in each cell type. (g) Chromatin contact matrix comparing WT and GKO cohesin HiChIP, overlaid with domains called by insulation score. (h) Contact matrix displaying the difference between GKO and WT cohesin HiChIP signal. Blue indicates greater contact in the WT, while red suggests more contact in the GKO. All matrices display chr4:110,000,000-120,000,000. (i) Overlap of contact coordinates called by FitHiChiP in either the WT and GKO. (j) Number of Gibbin-dependent chromatin contacts that are anchored in Gibbin target gene TSS’s. (k) Number of cell-type specific contacts that have one end anchored in a gene TSS (l) APA showing contact strength difference between WT and GKO cohesin Hi-ChIP at Gibbin-independent genes.
Extended Data Figure 6: Validation of the BASU proximal proteomics system.
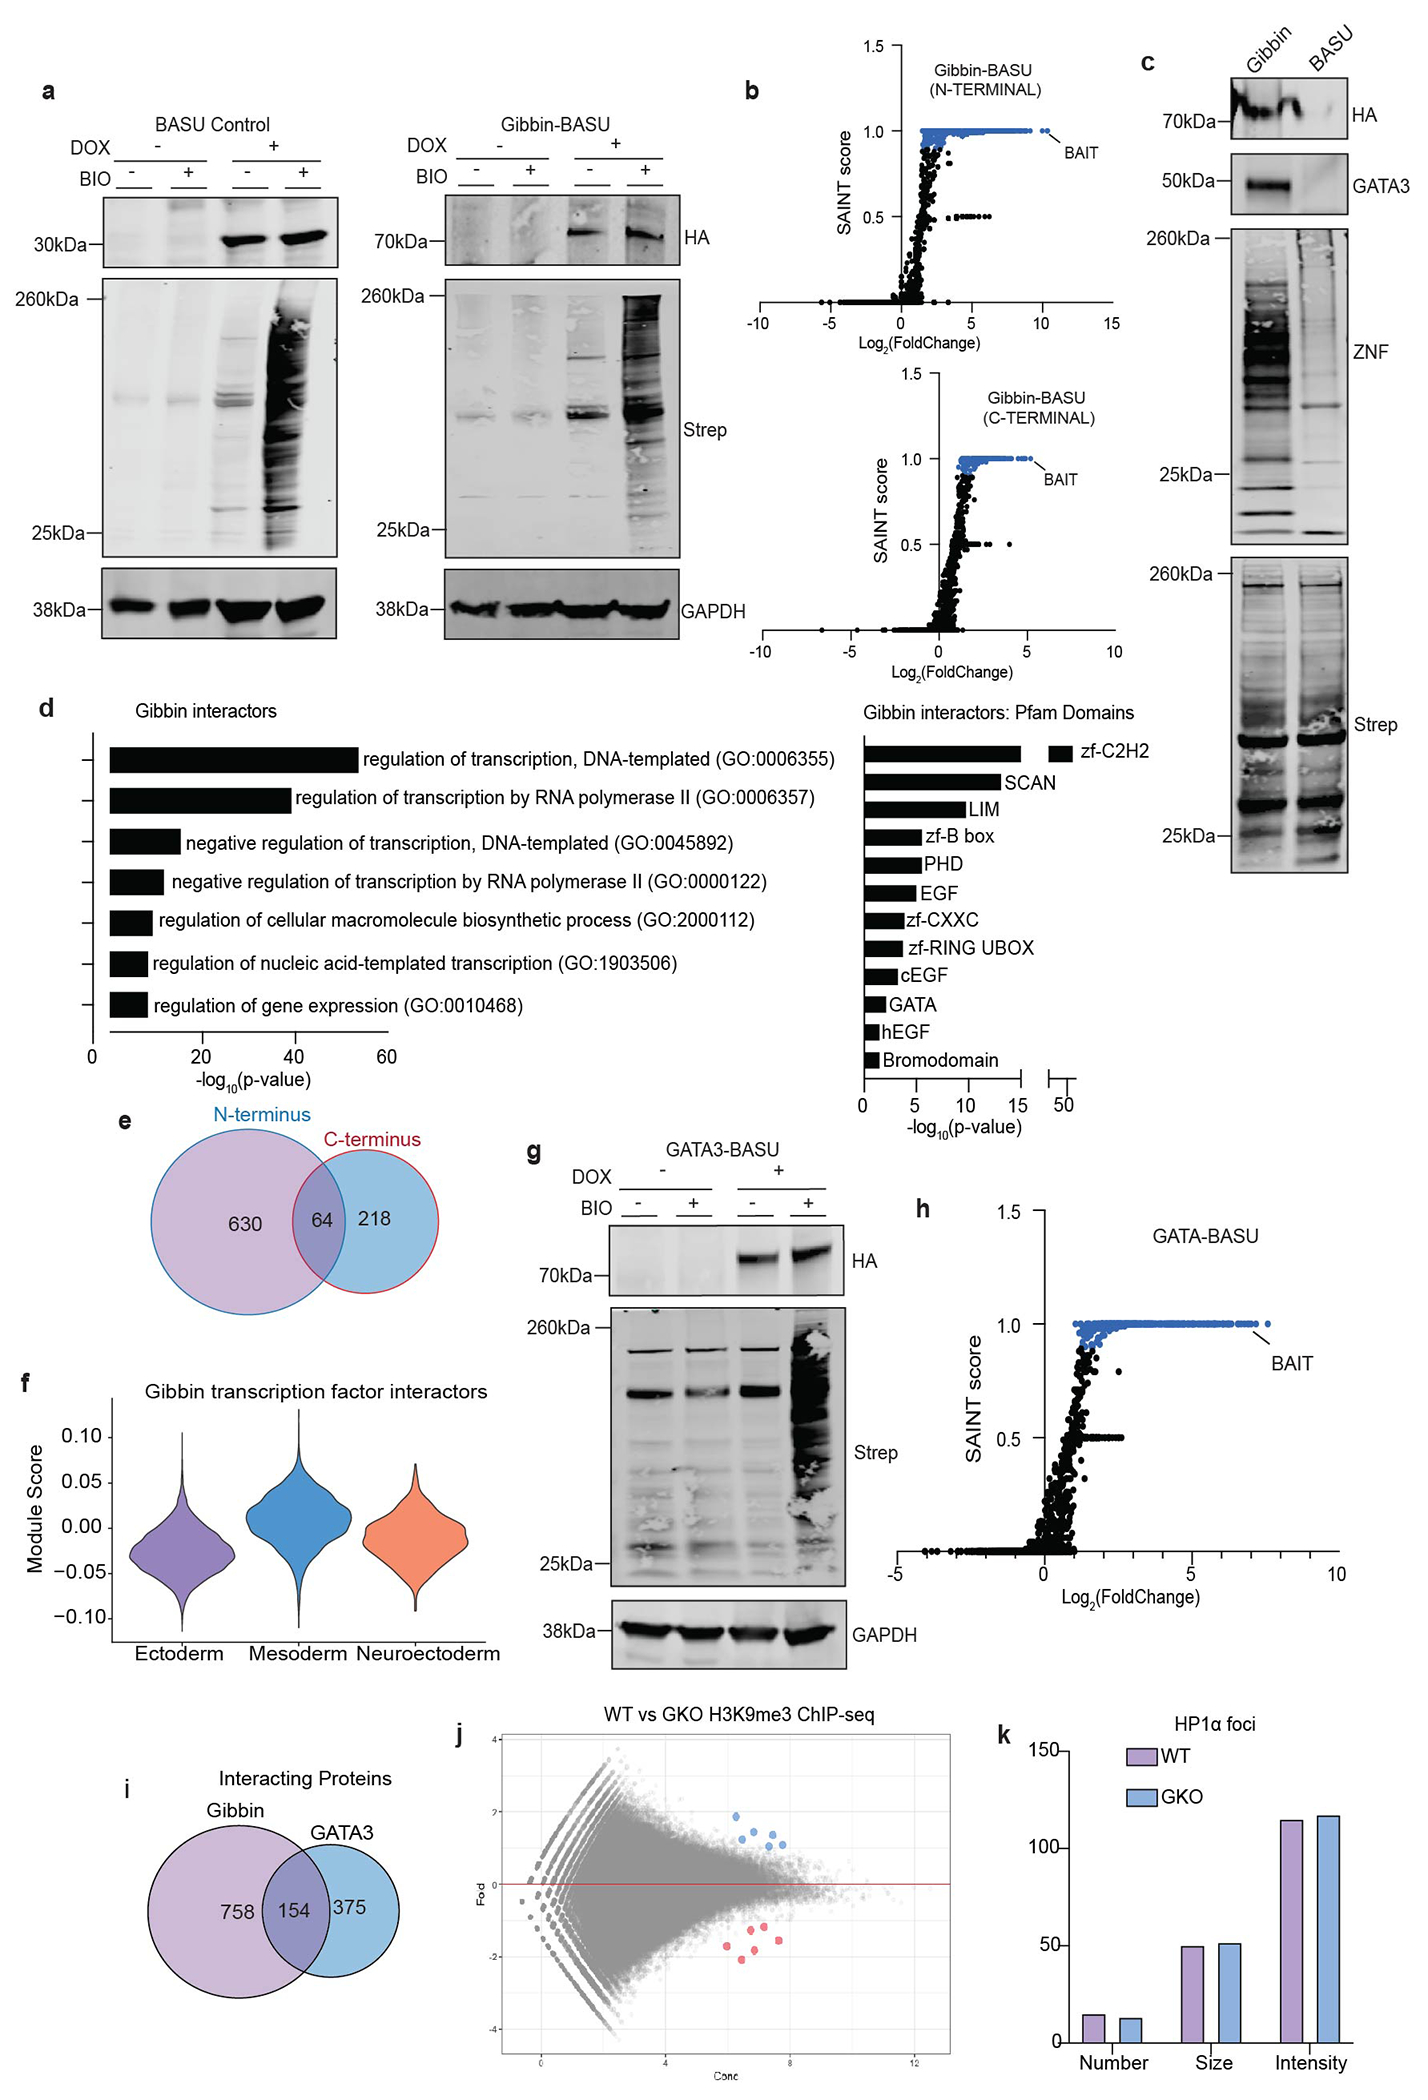
(a) Validation of BASU system from whole cell lysate western blots of hESCs stably expressing doxycycline-inducible, HA-tagged BASU control or Gibbin-BASU fusion proteins. The N-terminal version is shown here. Biotinylated protein was measured using dye-labeled streptavidin (Strep). Signal was only detected in the presence of both doxycycline (DOX) and biotin (BIO). (b) SAINT scores plotted against fold change over the BASU control for all proteins detected by Gibbin-BASU N-terminal or C-terminal mass spectrometry. SAINT scores > 0.9 are indicated in blue. (d) Representative immunoblot of biotinylated extracts from Gibbin-BASU and negative control cells after 24 hours DOX and 2 hours BIO. (d) GO term or Pfam domain enrichment of Gibbin interacting proteins as measured using a two-sided Fisher’s Exact Test (via EnrichR). (e) Overlap of N and C terminal Gibbin interacting proteins identified by BASU. (f) Expression of Gibbin interacting transcription factors across clusters identified by scRNA-seq. (g) Validation of GATA3-BASU system by western blot. (h) SAINT scores and fold change over negative BASU control for all proteins detected by GATA3-BASU mass spectrometry. (i) Overlap of Gibbin and GATA3 interacting proteins from BASU datasets. (j) Differential binding analysis from H3K9me3 ChIP-seq between WT and GKO cells. Signal is either unchanged (grey), increased (blue, >2-fold), or decreased (red, <2-fold), with an adjusted p-value cutoff < 0.05 as measured by DESEQ2, n=2 biologically independent samples. (k) Number, size and intensity measurements of HP1α foci in WT vs GKO cells, quantified from four representative immunofluorescent images for each cell type. All immunoblots were repeated experimentally twice. GAPDH was used as a processing control. For gel source data, see Supplementary Figure 1.
Extended Data Figure 7: Gibbin loss causes DNA hypermethylation independent of DNMT expression.
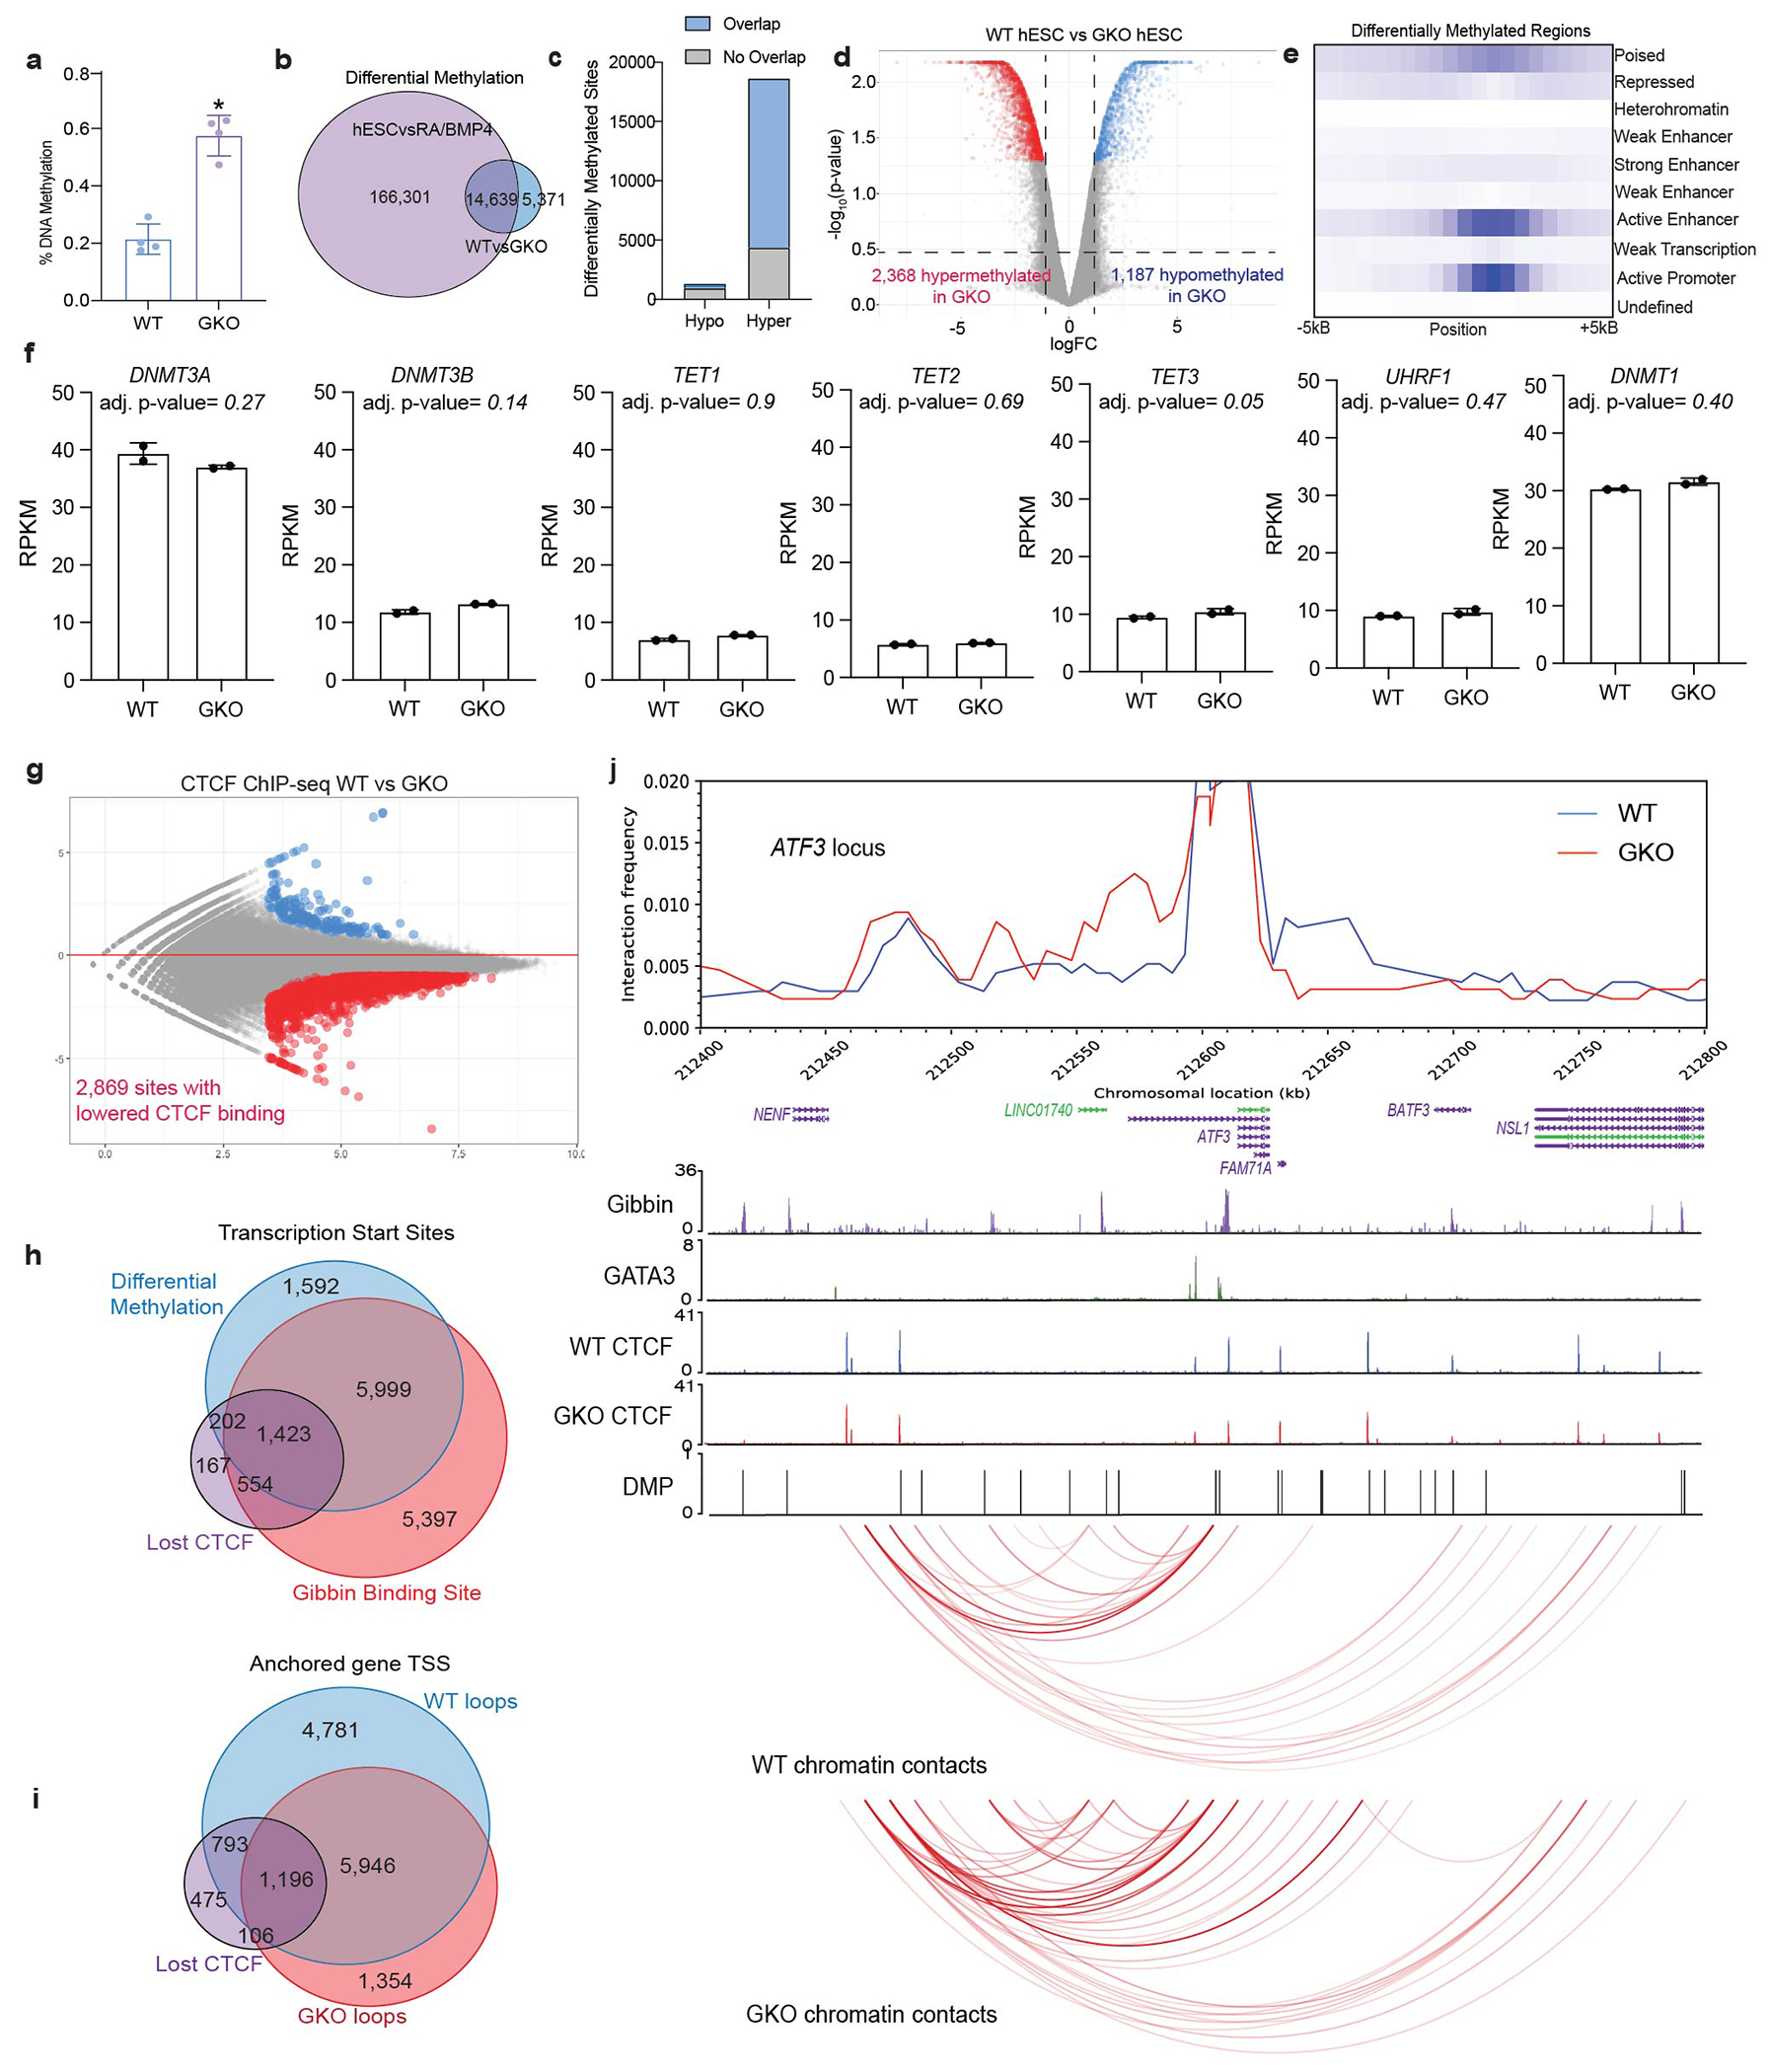
(a) DNA methylation signal in WT and GKO cells as measured by a colorimetric assay. Error bars are mean +/− s.d., n=4 biologically independent samples averaged from 2 technical replicates repeated across 2 different runs. * indicates p-value <0.001 as calculated by two-tailed t-test (p-value=0.0003). (b) Overlap of RA/BMP4-dependent demethylation with Gibbin-dependent hypermethylation. (c) Number of Gibbin-dependent methylation sites that are demethylated during differentiation with RA/BMP4. (d) Volcano plot of differentially methylated probes (DMPs) between WT and GKO hESCs. Signal at each probe is either unchanged (grey), hypermethylated (red, >2-fold), or hypomethylated (blue, <2-fold), with an adjusted p-value cutoff <0.01 as measured by limma. n=2 biologically independent samples. (e) ChromHMM analysis of the DMPs. (f) RPKM and adjusted p-values values for known DNMTs and effectors as measured by differential RNA-seq. Error bars are mean +/− s.d., n=2 biologically independent samples, and adjusted p-values were calculated with DESEQ2. (g) Differential binding analysis from CTCF Chip-seq between WT and GKO cells. CTCF DNA binding is either unchanged (grey), increased (blue, >2-fold), or decreased (red, <2-fold), with an adjusted p-value cutoff <0.05 as measured by DESEQ2. n=2 biologically independent samples. (h) Overlap of genes anchored in WT chromatin contacts, GKO chromatin contacts, and sites of differential CTCF binding. (i) Overlap of genes that are bound by Gibbin and have Gibbin-dependent methylated DNA or CTCF binding sites. (j) Virtual 4C plot of normalized cohesin HiChIP signal for the normally repressed ATF3 locus, overlayed with a WashU Genome Browser screenshot depicting Gibbin, GATA3, and WT/GKO CTCF ChIP-seq peaks, DMP pileups, and FitHiChIP contacts. The ATF3 TSS was used as an anchor point in constructing the 4C plot.
Extended Data Figure 8. Aberrant dermal maturation results in keratinocyte dysfunction.
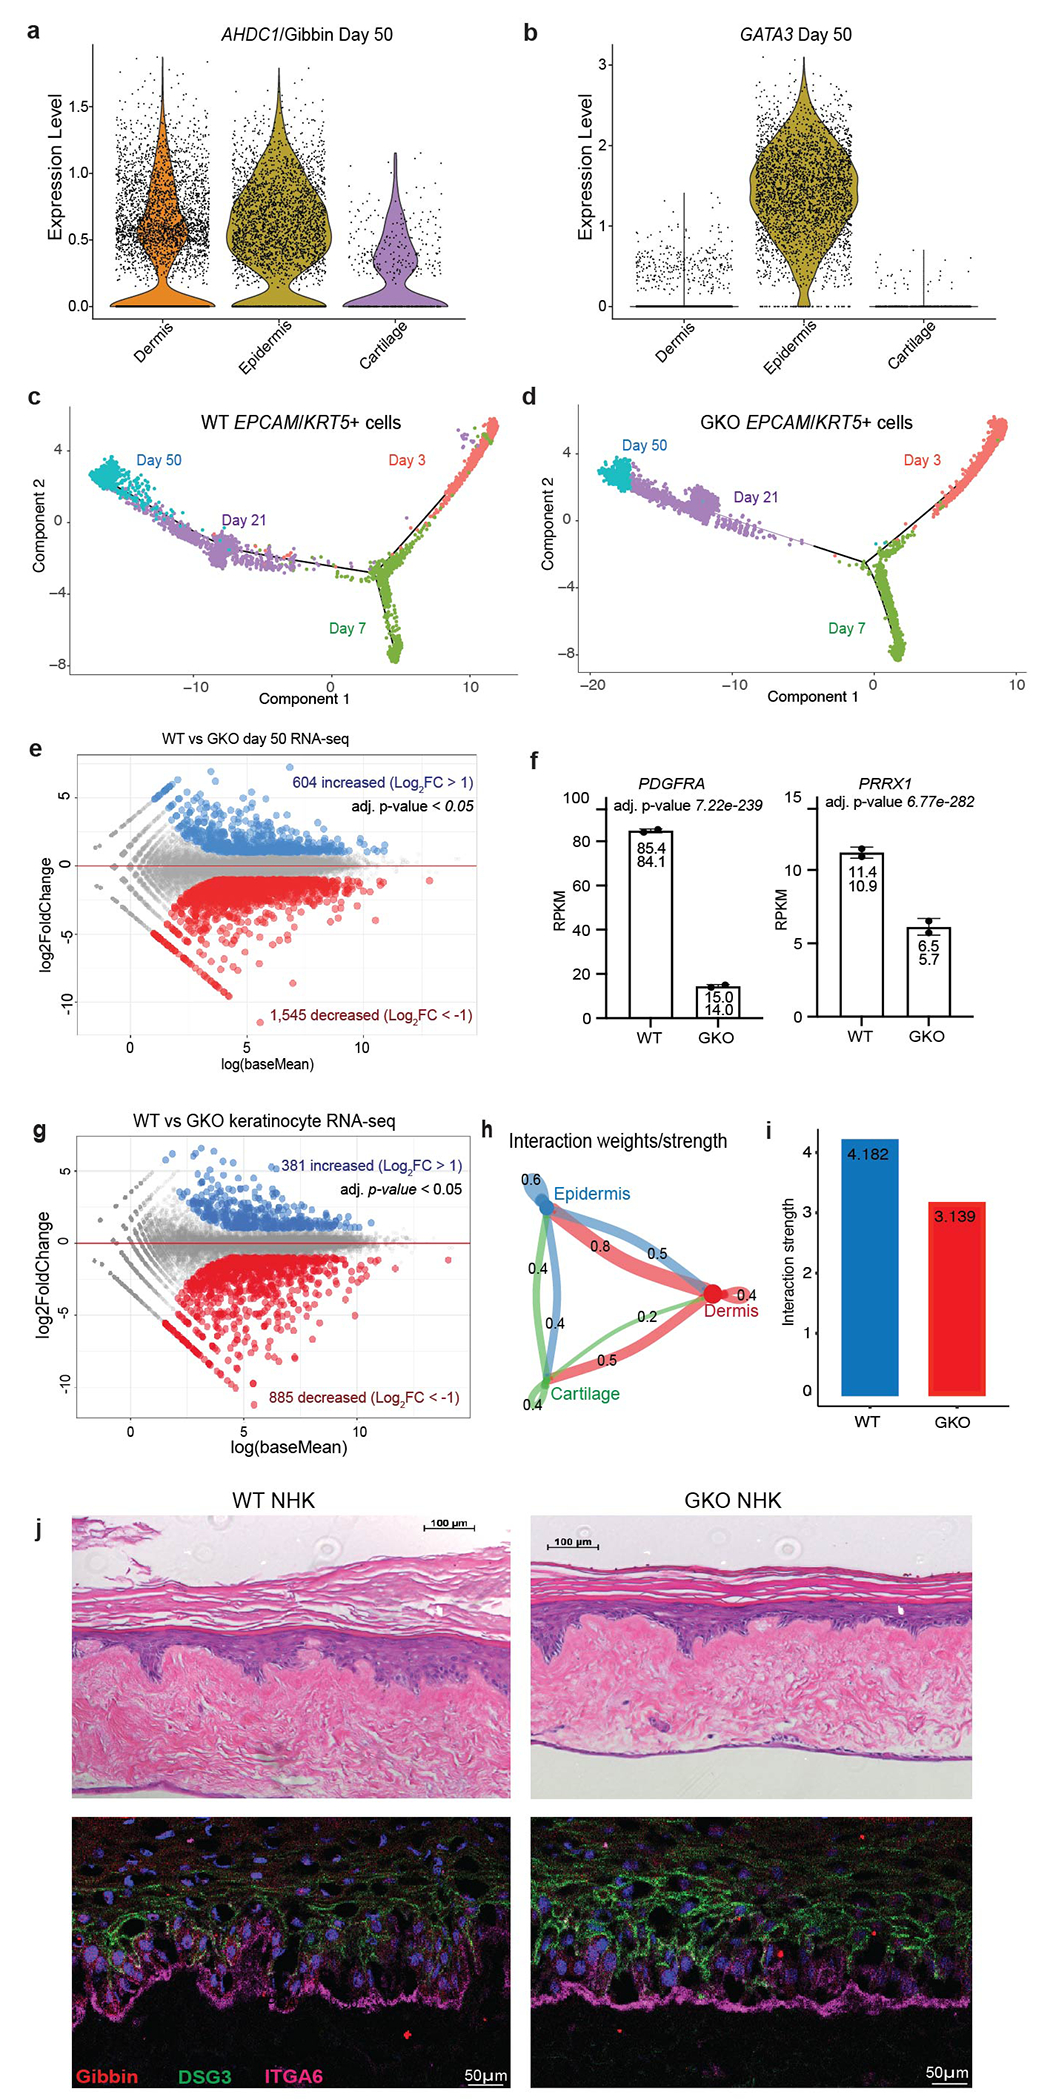
Violin plot of (a) AHDC1/Gibbin or (b) GATA3 expression after 50 days of differentiation. (c) Monocle pseudotime trajectory of the EPCAM+/KRT5+ ectodermal and epidermal clusters from WT or (d) GKO cells. (e) RNA-seq differential expression analysis comparing WT and GKO day 50 cells. Gene expression is either unchanged (grey), increased (blue, >2-fold), or decreased (red, <2-fold), with an adjusted p-value cutoff <0.05 as measured by DESEQ2. n=2 biologically independent samples. (f) Representative RPKM and adjusted p-values from day 50 RNA-seq. Error bars are mean +/− standard deviation. (g) RNA-seq differential expression analysis between WT and GKO keratinocytes, n=2 biologically independent samples. (h) CellChat circle plot showing the number of cell signaling interactions between each identity. (i) Number of cell-cell signaling interactions in WT and GKO day 50 cells as measured by CellChat. (j) H&E and immunofluorescent images of 3D skin organoid cultures generated from primary normal human keratinocyte (NHKs). NHKs were nucleofected with control or Gibbin targeting sgRNAs prior to stratification. Organoids were made in biological triplicate and repeated experimentally twice. All imaging was repeated in biological duplicate across 2 independent experiments.
Extended Data Figure 9. FACS sorting strategy.
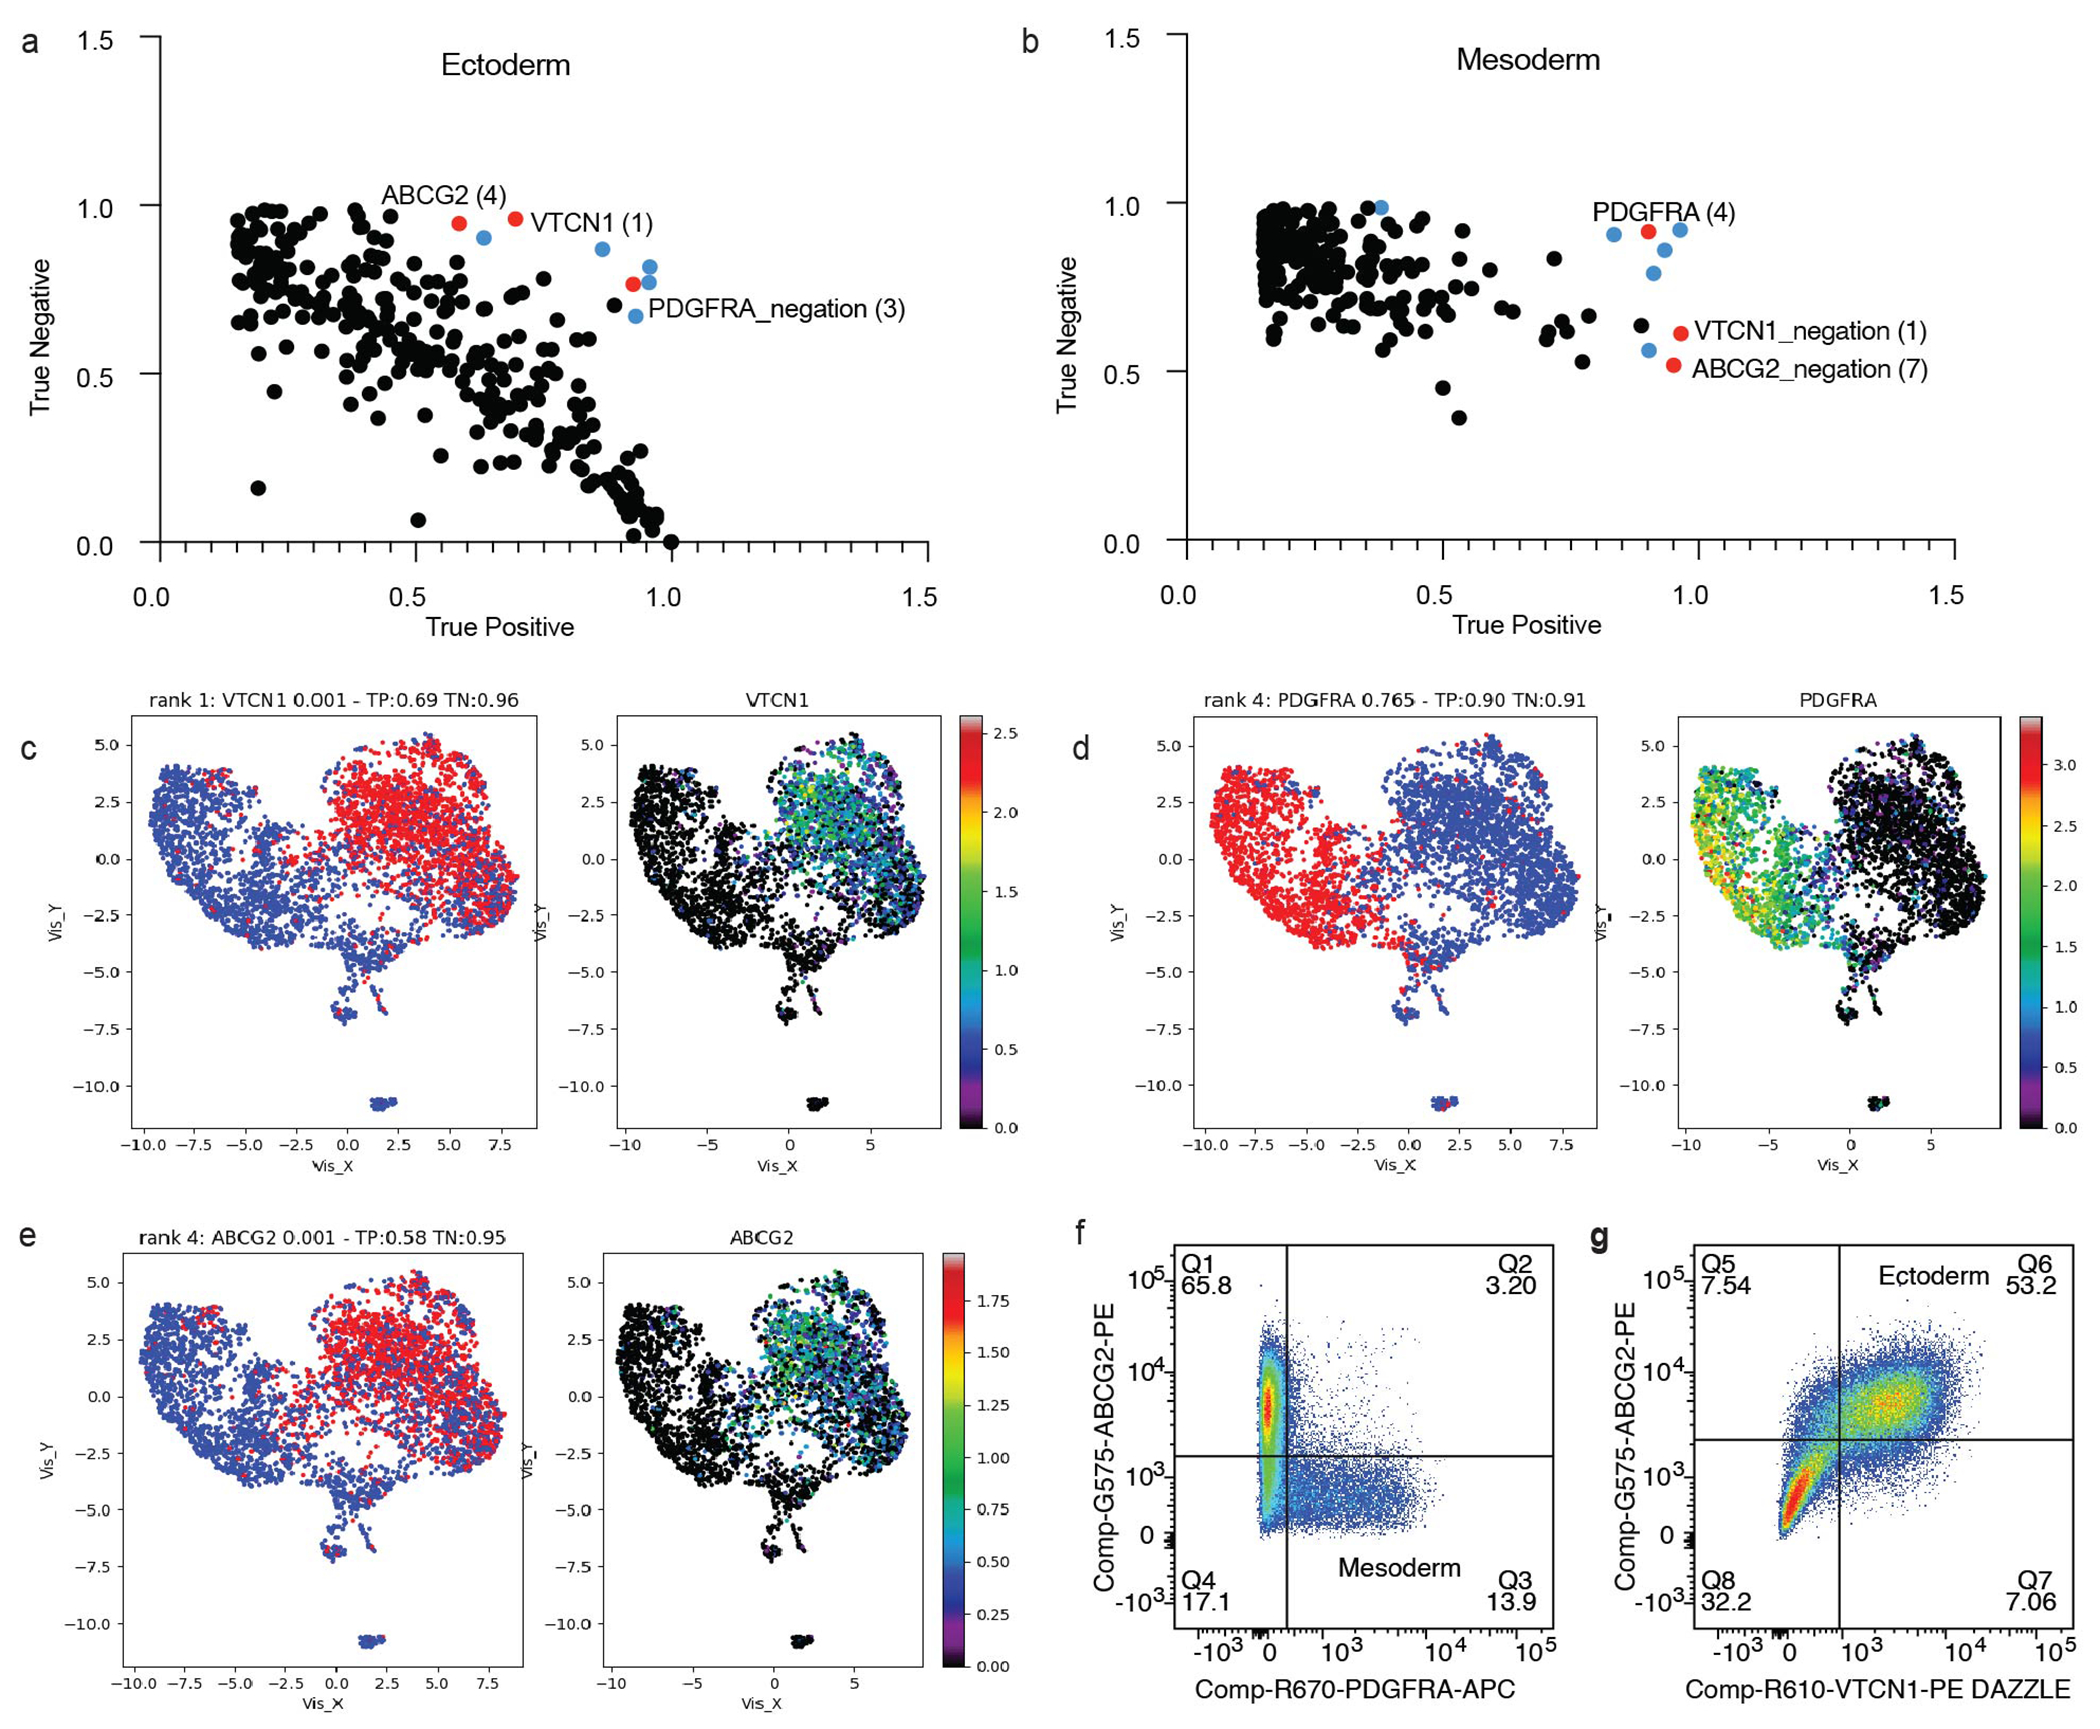
(a) Surface marker rankings identified by COMET for the EPCAM+ ectoderm or the (b) PDGFRA+ mesoderm after 7 days of RA/BMP4. Markers used for further analyses are noted in red, and markers that were tested but did not work well by FACS are noted in blue. (c) Expression patterns and fold changes in day 7 scRNA-seq of markers used for cell sorting including VTCN1 (ectoderm), (d) ABCG2 (ectoderm), and (e) PDGFRA (mesoderm). (f) Fluorescence associated cell sorting (FACS) strategy used to separate day 7 cells into ectoderm and mesoderm. Plots show a distinction between ABCG2+ or PDGFRA+ populations or (g) overlapping ABCG2+ and VTCN1+ populations. Populations were gated on unstained control cells, and the gating strategy can be found in the Supplementary Figure 2.
Extended Data Figure 10: Pronuclear CRISPR Injections Targeting Gibbin Cause a Spectrum of Phenotypes in Mice.
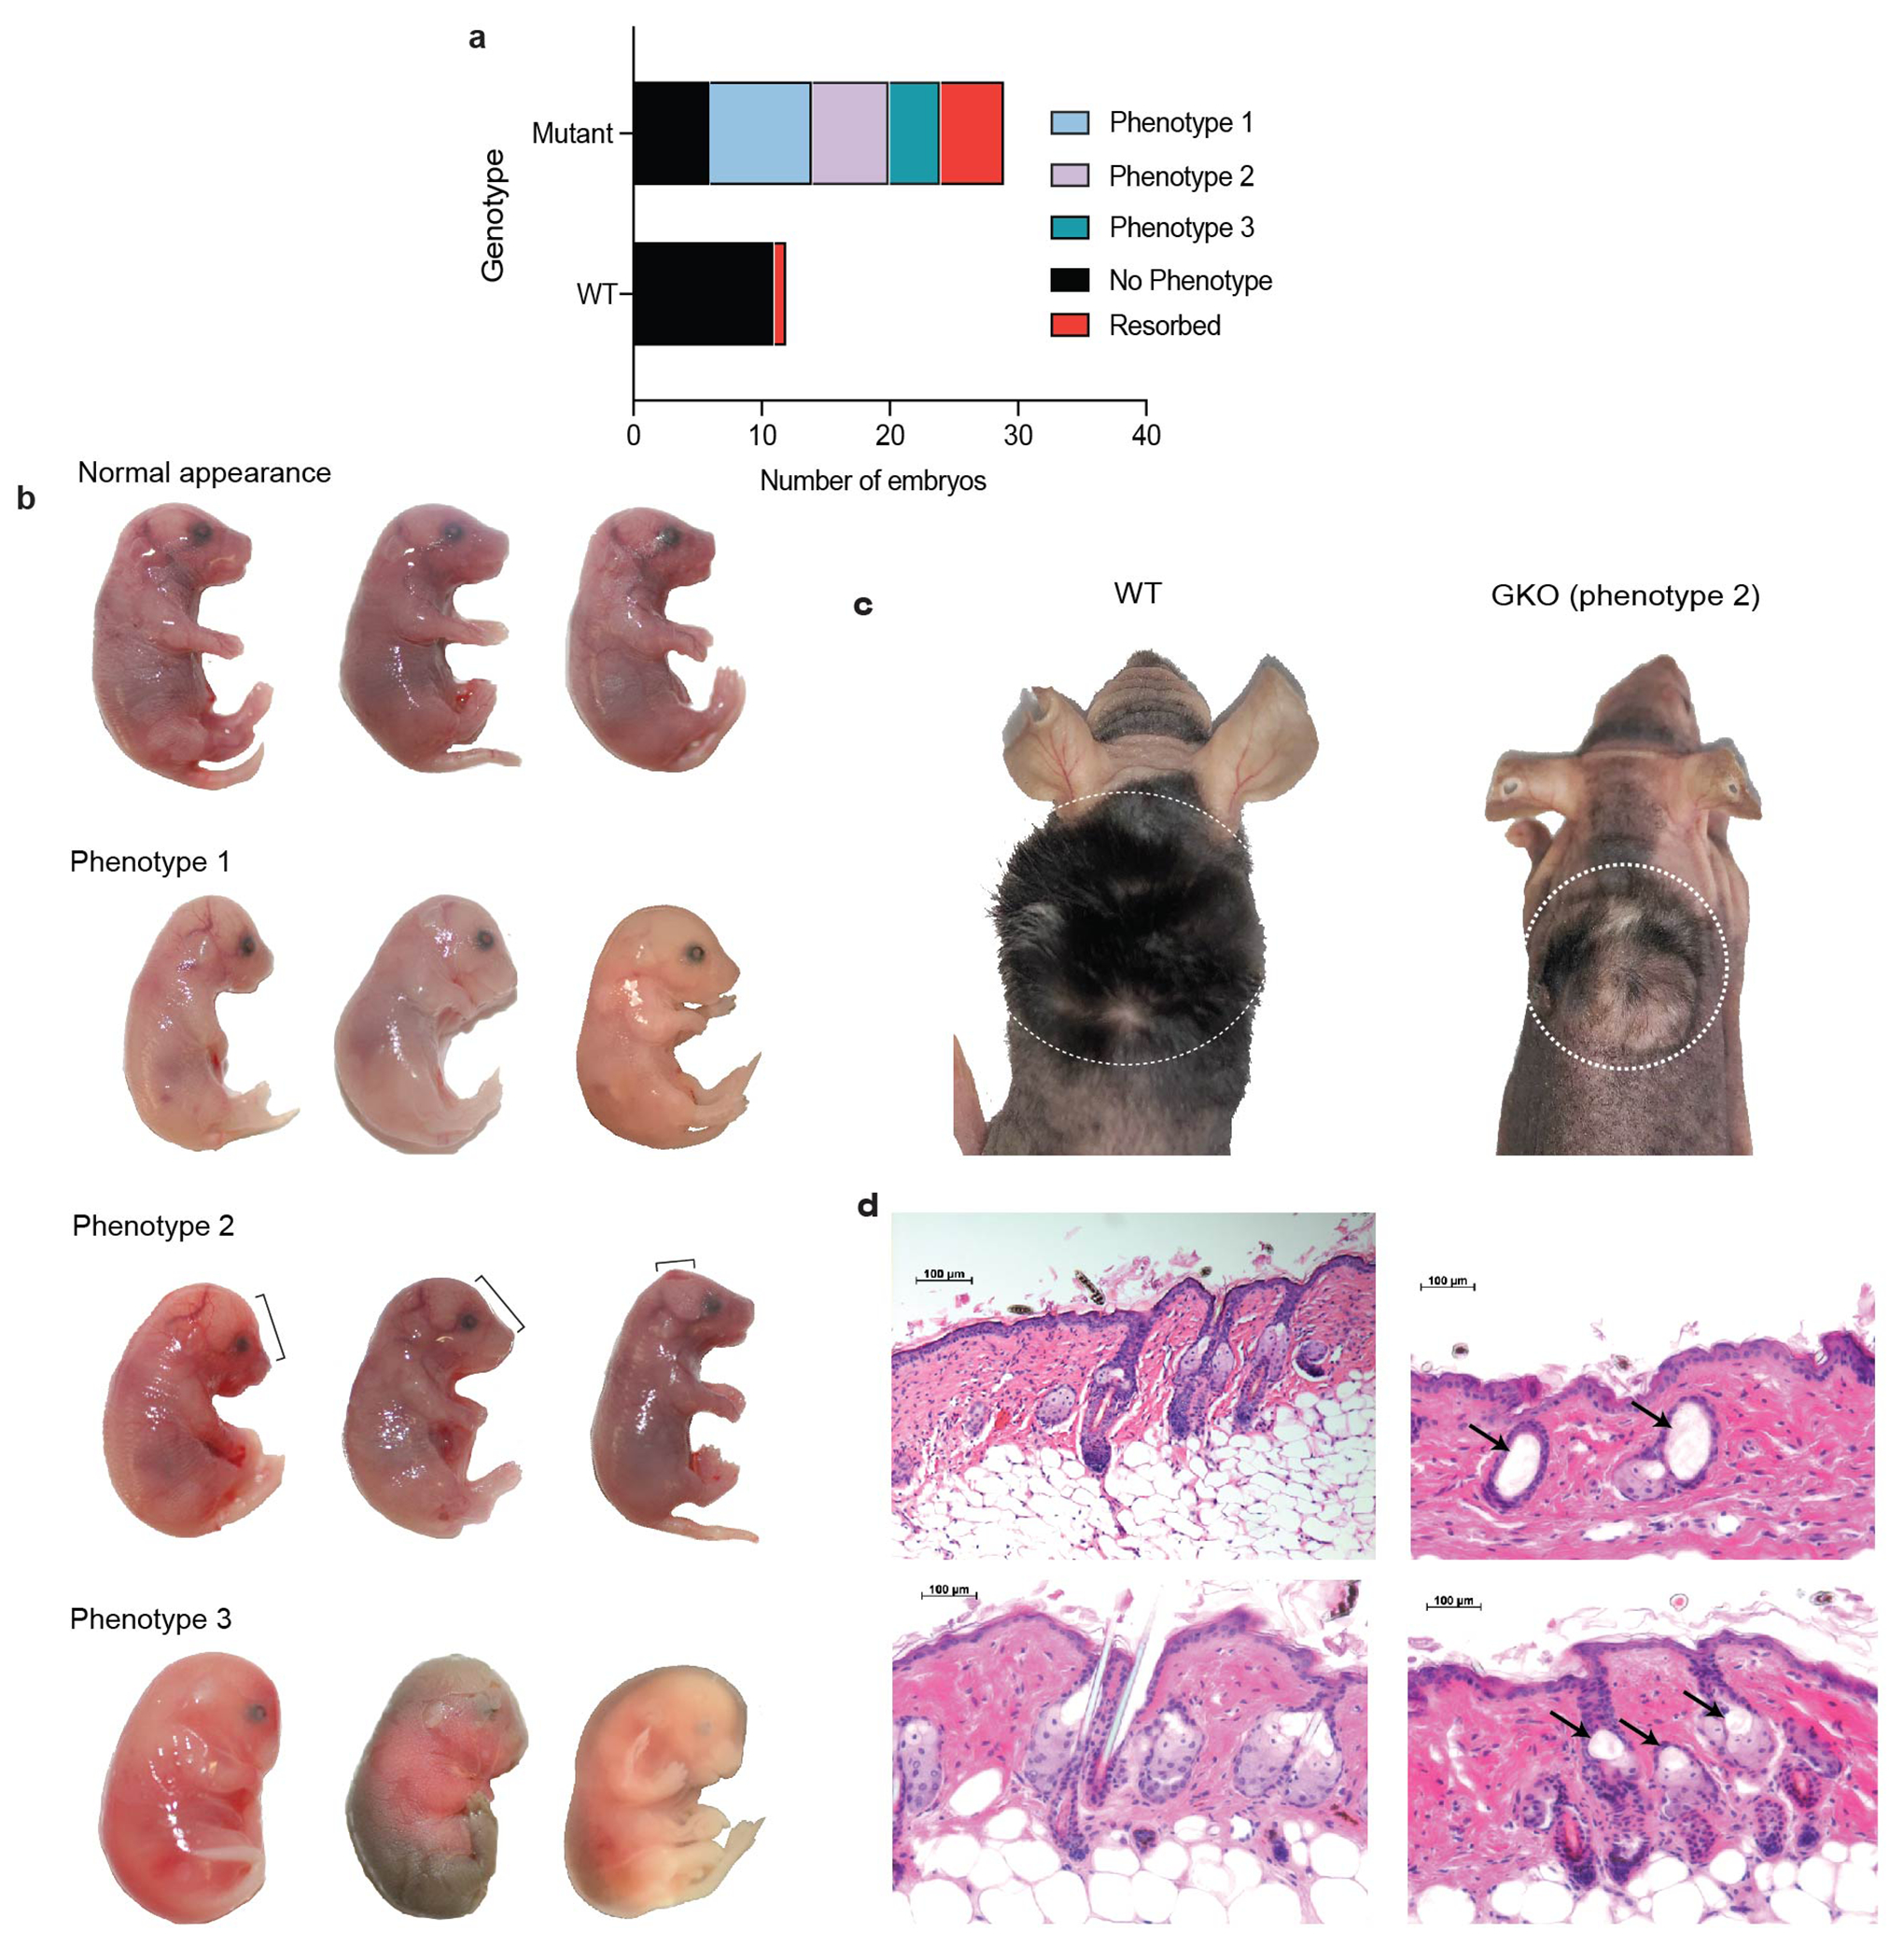
(a) Quantification of three phenotype classes observed following Gibbin depletion in vivo. Mosaic genotypes exhibited CRISPR cutting on at least one allele. (b) Images of mouse embryos harvested 18 days following pronuclear CRISPR injection to deplete Gibbin. Embryos were organized into four phenotypic classes. Injections were performed in duplicate across 6 different litters totaling n=52 collected embryos. (c) Adult mice 5 weeks after receiving grafts from E18 mice. The GKO graft was taken from a more moderate mutant. n=3 for each genotype, and grafting was repeated in two separate experiments. (d) H&E images depicting hair follicle cyst phenotypes from grafted mice. Images are representative of at least 3 biological and 3 technical replicates.
Supplementary Material
Acknowledgments
We thank members of the Oro lab for comments on this manuscript. We thank S. Yamanaka for sharing PiggyBac inducible expression plasmid and Paul Khavari for sharing the BASU cDNA. This work was supported by Ruth L. Kirchstein NRSA (F32AR074221 to A.C.), the Stanford Dean’s Fellowship (to A.C), the Stanford Maternal and Childhood Health Research Institute (to A.C.), NIH (R01ARO73170 to A.O.) and the California Institute of Regenerative Medicine (RT3-07796 to A.O.). Mass Spectrometry was performed at the Vincent Coates Foundation Mass Spectrometry Laboratory, Stanford University Mass Spectrometry and supported in part by NIH P30 CA124435 utilizing the Stanford Cancer Institute Proteomics/Mass Spectrometry Shared Resource. FACS was performed at the Stanford Shared FACS Facility using an instrument obtained with an NIH S10 Shared Instrument Grant (S10RR025518-01).
Footnotes
Competing Interest Declaration
The authors declare no competing interests.
Contributor Information
Ann Collier, Stanford University Program in Epithelial Biology, Stanford, CA, USA.
Angela Liu, Stanford University Program in Epithelial Biology, Stanford University Stem Cell Biology and Regenerative Medicine Program, Stanford, CA, USA.
Jessica Torkelson, Stanford University Program in Epithelial Biology, Stanford, CA, USA.
Jillian Pattison, Stanford University Program in Epithelial Biology, Stanford, CA, USA.
Sadhana Gaddam, Stanford University Program in Epithelial Biology, Stanford, CA, USA.
Hanson Zhen, Stanford University Program in Epithelial Biology, Stanford, CA, USA.
Tiffany Patel, Stanford University Program in Epithelial Biology, Stanford, CA, USA.
Kelly McCarthy, Stanford University Program in Epithelial Biology, Stanford, CA, USA.
Hana Ghanim, Stanford University Stem Cell Biology and Regenerative Medicine Program, Stanford, CA, USA.
Anthony Oro, Stanford University Program in Epithelial Biology, Stanford University Stem Cell Biology and Regenerative Medicine Program, Stanford, CA, USA.
References
- 1.Abe M et al. GATA3 is essential for separating patterning domains during facial morphogenesis. Dev. 148, (2021) doi: 10.1242/DEV.199534. [DOI] [PMC free article] [PubMed] [Google Scholar]
- 2.Tsarovina K et al. Essential role of Gata transcription factors in sympathetic neuron development. Development 131, 4775–4786 (2004). [DOI] [PubMed] [Google Scholar]
- 3.Ralston A et al. Gata3 regulates trophoblast development downstream of Tead4 and in parallel to Cdx2. Development 137, 395–403 (2010). [DOI] [PubMed] [Google Scholar]
- 4.Romano RA et al. ΔNp63 knockout mice reveal its indispensable role as a master regulator of epithelial development and differentiation. Development 139, 772–782 (2012). [DOI] [PMC free article] [PubMed] [Google Scholar]
- 5.Pattison JM et al. Retinoic acid and BMP4 cooperate with p63 to alter chromatin dynamics during surface epithelial commitment. Nature Genetics vol. 50 1658–1665 (2018). [DOI] [PMC free article] [PubMed] [Google Scholar]
- 6.Chikh A et al. Expression of GATA-3 in epidermis and hair follicle: Relationship to p63. Biochem. Biophys. Res. Commun 361, 1–6 (2007). [DOI] [PubMed] [Google Scholar]
- 7.Ellis C, Pai GS & Wine Lee L Atypical aplasia cutis in association with Xia Gibbs syndrome. Pediatr. Dermatol 38, 533–535 (2021). [DOI] [PubMed] [Google Scholar]
- 8.Jiang Y et al. The phenotypic spectrum of Xia-Gibbs syndrome. Am. J. Med. Genet. Part A 176, 1315–1326 (2018). [DOI] [PMC free article] [PubMed] [Google Scholar]
- 9.Ritter AL et al. Variable Clinical Manifestations of Xia-Gibbs syndrome: Findings of Consecutively Identified Cases at a Single Children’s Hospital. Am. J. Med. Genet. Part A 176, 1890–1896 (2018). [DOI] [PubMed] [Google Scholar]
- 10.Tchieu J et al. A Modular Platform for Differentiation of Human PSCs into All Major Ectodermal Lineages. Cell Stem Cell 21, 399–410.e7 (2017). [DOI] [PMC free article] [PubMed] [Google Scholar]
- 11.Liang YC et al. Folding Keratin Gene Clusters during Skin Regional Specification. Dev. Cell 53, 561–576.e9 (2020). [DOI] [PMC free article] [PubMed] [Google Scholar]
- 12.Kelly OG & Melton DA Induction and patterning of the vertebrate nervous system. Trends in Genetics vol. 11 273–278 (1995). [DOI] [PubMed] [Google Scholar]
- 13.Liem KF, Tremml G, Roelink H & Jessell TM Dorsal differentiation of neural plate cells induced by BMP-mediated signals from epidermal ectoderm. Cell 82, 969–979 (1995). [DOI] [PubMed] [Google Scholar]
- 14.Larsen William J., Sherman Lawrence S., Ectoderm WJL: neurulation, neural tube, neural crest. Hum. Embryol 3rd Ed. (2002). [Google Scholar]
- 15.Hota SK & Bruneau BG ATP-dependent chromatin remodeling during mammalian development. Development (Cambridge) vol. 143 2882–2897 (2016). [DOI] [PMC free article] [PubMed] [Google Scholar]
- 16.Pauli A, Rinn JL & Schier AF Non-coding RNAs as regulators of embryogenesis. Nature Reviews Genetics vol. 12 136–149 (2011). [DOI] [PMC free article] [PubMed] [Google Scholar]
- 17.Liu J et al. Transcriptional Dysregulation in NIPBLand Cohesin Mutant Human Cells. PLoS Biol. 7, (2009) doi: 10.1371/journal.pbio.1000119. [DOI] [PMC free article] [PubMed] [Google Scholar]
- 18.Li L et al. TFAP2C- and p63-Dependent Networks Sequentially Rearrange Chromatin Landscapes to Drive Human Epidermal Lineage Commitment. Cell Stem Cell 24, 271–284.e8 (2019). [DOI] [PMC free article] [PubMed] [Google Scholar]
- 19.Li W & Cornell RA Redundant activities of Tfap2a and Tfap2c are required for neural crest induction and development of other non-neural ectoderm derivatives in zebrafish embryos. Dev. Biol 304, 338–354 (2007). [DOI] [PMC free article] [PubMed] [Google Scholar]
- 20.Sebastiano V et al. Human COL7A1-corrected induced pluripotent stem cells for the treatment of recessive dystrophic epidermolysis bullosa. Sci. Transl. Med 6, (2014) doi: 10.1126/scitranslmed.3009540. [DOI] [PMC free article] [PubMed] [Google Scholar]
- 21.Chahrour M & Zoghbi HY The Story of Rett Syndrome: From Clinic to Neurobiology. Neuron vol. 56 422–437 (2007). [DOI] [PubMed] [Google Scholar]
- 22.Sarogni P, Pallotta MM & Musio A Cornelia de Lange syndrome: From molecular diagnosis to therapeutic approach. Journal of Medical Genetics vol. 57 289–295 (2020). [DOI] [PMC free article] [PubMed] [Google Scholar]
- 23.Ostapcuk V et al. Activity-dependent neuroprotective protein recruits HP1 and CHD4 to control lineage-specifying genes. Nature 557, 739–743 (2018). [DOI] [PubMed] [Google Scholar]
- 24.Xia F et al. De novo truncating mutations in AHDC1 in individuals with syndromic expressive language delay, hypotonia, and sleep apnea. Am. J. Hum. Genet 94, 784–789 (2014). [DOI] [PMC free article] [PubMed] [Google Scholar]
- 25.Díaz-Ordoñez L, Ramirez-Montaño D, Candelo E, Cruz S & Pachajoa H Syndromic intellectual disability caused by a novel truncating variant in AHDC1: A case report. Iran. J. Med. Sci 44, 257–261 (2019). [PMC free article] [PubMed] [Google Scholar]
- 26.Savic D et al. CETCh-seq: CRISPR epitope tagging ChIP-seq of DNA-binding proteins. Genome Res. 25, 1581–1589 (2015). [DOI] [PMC free article] [PubMed] [Google Scholar]
- 27.Mumbach MR et al. HiChIP: Efficient and sensitive analysis of protein-directed genome architecture. Nat. Methods 13, 919–922 (2016). [DOI] [PMC free article] [PubMed] [Google Scholar]
- 28.Ramanathan M et al. RN A-protein interaction detection in living cells. Nat. Methods 15, 207–212 (2018). [DOI] [PMC free article] [PubMed] [Google Scholar]
- 29.Roux KJ, Kim DI, Raida M & Burke B A promiscuous biotin ligase fusion protein identifies proximal and interacting proteins in mammalian cells. J. Cell Biol 196, 801–810 (2012). [DOI] [PMC free article] [PubMed] [Google Scholar]
- 30.Roux KJ, Kim DI & Burke B BioID: A screen for protein-protein interactions. Curr. Protoc. Protein Sci 2013, 19.23.1–19.23.14 (2013). [DOI] [PubMed] [Google Scholar]
- 31.Villaseñor R et al. ChromID identifies the protein interactome at chromatin marks. Nat. Biotechnol 38, 728–736 (2020). [DOI] [PMC free article] [PubMed] [Google Scholar]
- 32.Saksouk N et al. Redundant Mechanisms to Form Silent Chromatin at Pericentromeric Regions Rely on BEND3 and DNA Methylation. Mol. Cell 56, 580–594 (2014). [DOI] [PubMed] [Google Scholar]
- 33.Kaaij LJT, Mohn F, van der Weide RH, de Wit E & Bühler M The ChAHP Complex Counteracts Chromatin Looping at CTCF Sites that Emerged from SINE Expansions in Mouse. Cell 178, 1437–1451.e14 (2019). [DOI] [PubMed] [Google Scholar]
- 34.Maurano MT et al. Role of DNA Methylation in Modulating Transcription Factor Occupancy. Cell Rep. 12, 1184–1195 (2015). [DOI] [PubMed] [Google Scholar]
- 35.Wang H et al. Widespread plasticity in CTCF occupancy linked to DNA methylation. Genome Res. 22, 1680–1688 (2012). [DOI] [PMC free article] [PubMed] [Google Scholar]
- 36.Lu MF, Pressman C, Dyer R, Johnson RL & Martin JF Function of rieger syndrome gene in left-right asymmetry and craniofacial development. Nature 401, 276–278 (1999). [DOI] [PubMed] [Google Scholar]
- 37.Günschmann C et al. Insulin/IGF-1 Controls Epidermal Morphogenesis via Regulation of FoxO-Mediated p63 Inhibition. Dev. Cell 26, 176–187 (2013). [DOI] [PMC free article] [PubMed] [Google Scholar]
- 38.Li A et al. Deciphering principles of morphogenesis from temporal and spatial patterns on the integument. Developmental Dynamics vol. 244 905–920 (2015). [DOI] [PMC free article] [PubMed] [Google Scholar]
- 39.Wolpert L Positional information and the spatial pattern of cellular differentiation. J. Theor. Biol 25, 1–47 (1969). [DOI] [PubMed] [Google Scholar]
- 40.Jin S et al. Inference and analysis of cell-cell communication using CellChat. Nat. Commun 12, (2021) doi: 10.1038/s41467-021-21246-9. [DOI] [PMC free article] [PubMed] [Google Scholar]
- 41.Niessen MT, Iden S & Niessen CM The in vivo function of mammalian cell and tissue polarity regulators - How to shape and maintain the epidermal barrier. Journal of Cell Science vol. 125 3501–3510 (2012). [DOI] [PubMed] [Google Scholar]
- 42.Delaney C et al. Combinatorial prediction of marker panels from single‐cell transcriptomic data. Mol. Syst. Biol 15, (2019) doi: 10.15252/msb.20199005. [DOI] [PMC free article] [PubMed] [Google Scholar]
- 43.Kurek D, Garinis GA, van Doorninck JH, van der Wees J & Grosveld FG Transcriptome and phenotypic analysis reveals Gata3-dependent signalling pathways in murine hair follicles. Development 134, 261–272 (2007). [DOI] [PubMed] [Google Scholar]
- 44.Kaufman CK et al. GATA-3: An unexpected regulator of cell lineage determination in skin. Genes Dev. 17, 2108–2122 (2003). [DOI] [PMC free article] [PubMed] [Google Scholar]
- 45.Bardhan T et al. Gata3 is required for the functional maturation of inner hair cells and their innervation in the mouse cochlea. J. Physiol 597, 3389–3406 (2019). [DOI] [PMC free article] [PubMed] [Google Scholar]
- 46.Koch PJ et al. Targeted disruption of the pemphigus vulgaris antigen (desmoglein 3) gene in mice causes loss of keratinocyte cell adhesion with a phenotype similar to pemphigus vulgaris. J. Cell Biol 137, 1091–1102 (1997). [DOI] [PMC free article] [PubMed] [Google Scholar]
- 47.Cheng X et al. Two Chinese Xia-Gibbs syndrome patients with partial growth hormone deficiency. Mol. Genet. Genomic Med 7, (2019) doi: 10.1002/mgg3.596. [DOI] [PMC free article] [PubMed] [Google Scholar]
- 48.Yang S et al. Rare Mutations in AHDC1 in Patients with Obstructive Sleep Apnea. Biomed Res. Int 2019, (2019) doi: 10.1155/2019/5907361. [DOI] [PMC free article] [PubMed] [Google Scholar]
- 49.García-Acero M & Acosta J Whole-Exome Sequencing Identifies a de novo AHDC1 Mutation in a Colombian Patient with Xia-Gibbs Syndrome. Mol. Syndromol 8, 308–312 (2017). [DOI] [PMC free article] [PubMed] [Google Scholar]
- 50.Qin Y, Yang S, Li K & Wei Y 0019 Extreme Trait Next Generation Sequencing Identifies AHDC1 as a Novel Candidate Gene in Obstructive Sleep Apnea. Sleep 41, A8–A9 (2018). [Google Scholar]
Additional References
- 51.Cardoso-Dos-Santos AC et al. Novel AHDC1 Gene Mutation in a Brazilian Individual: Implications of Xia-Gibbs Syndrome. Mol. Syndromol 11, 24–29 (2020). [DOI] [PMC free article] [PubMed] [Google Scholar]
- 52.Billingham RE & Silvers WK Studies on the conservation of epidermal specificies of skin and certain mucosas in adult mammals. J. Exp. Med 125, 429–446 (1967). [DOI] [PMC free article] [PubMed] [Google Scholar]
- 53.Dhouailly D, Prin F, Kanzler B, Viallet JP & Chuong C Molecular basis of epithelial appendage morphogenesis. (1998). [Google Scholar]
- 54.Wu HJ et al. Estrogen modulates mesenchyme-epidermis interactions in the adult nipple. Dev. 144, 1498–1509 (2017). [DOI] [PMC free article] [PubMed] [Google Scholar]
- 55.Helsmoortel C et al. A SWI/SNF-related autism syndrome caused by de novo mutations in ADNP. Nat. Genet 46, 380–384 (2014). [DOI] [PMC free article] [PubMed] [Google Scholar]
- 56.Khayat MM et al. AHDC1 missense mutations in Xia-Gibbs syndrome. Hum. Genet. Genomics Adv 2, (2021) doi: 10.1016/j.xhgg.2021.100049. [DOI] [PMC free article] [PubMed] [Google Scholar]
- 57.Buenrostro JD, Wu B, Chang HY & Greenleaf WJ ATAC-seq: A method for assaying chromatin accessibility genome-wide. Curr. Protoc. Mol. Biol 2015, 21.29.1–21.29.9 (2015). [DOI] [PMC free article] [PubMed] [Google Scholar]
- 58.Chen EY et al. Enrichr: Interactive and collaborative HTML5 gene list enrichment analysis tool. BMC Bioinformatics 14, (2013) doi: 10.1186/1471-2105-14-128. [DOI] [PMC free article] [PubMed] [Google Scholar]
- 59.Love MI, Anders S & Huber W Differential analysis of count data - the DESeq2 package. Genome Biology (2014). [Google Scholar]
- 60.Li Q, Brown JB, Huang H & Bickel PJ Measuring reproducibility of high-throughput experiments. Ann. Appl. Stat 5, 1752–1779 (2011). [Google Scholar]
- 61.Whyte WA et al. Master transcription factors and mediator establish super-enhancers at key cell identity genes. Cell 153, 307–319 (2013). [DOI] [PMC free article] [PubMed] [Google Scholar]
- 62.Mellacheruvu D et al. The CRAPome: A contaminant repository for affinity purification-mass spectrometry data. Nat. Methods 10, 730–736 (2013). [DOI] [PMC free article] [PubMed] [Google Scholar]
- 63.Choi H et al. SAINT: Probabilistic scoring of affinity purificationg-mass spectrometry data. Nat. Methods 8, 70–73 (2011). [DOI] [PMC free article] [PubMed] [Google Scholar]
- 64.Servant N et al. HiC-Pro: An optimized and flexible pipeline for Hi-C data processing. Genome Biol. 16, (2015) doi: 10.1186/s13059-015-0831-x. [DOI] [PMC free article] [PubMed] [Google Scholar]
- 65.Haarhuis JHI et al. The Cohesin Release Factor WAPL Restricts Chromatin Loop Extension. Cell 169, 693–707.e14 (2017). [DOI] [PMC free article] [PubMed] [Google Scholar]
- 66.Bhattacharyya S, Chandra V, Vijayanand P & Ay F Identification of significant chromatin contacts from HiChIP data by FitHiChIP. Nat. Commun 10, (2019) doi: 10.1038/s41467-019-11950-y. [DOI] [PMC free article] [PubMed] [Google Scholar]
- 67.Ernst J & Kellis M Chromatin-state discovery and genome annotation with ChromHMM. Nat. Protoc 12, 2478–2492 (2017). [DOI] [PMC free article] [PubMed] [Google Scholar]
Associated Data
This section collects any data citations, data availability statements, or supplementary materials included in this article.
Supplementary Materials
Data Availability Statement
Deep sequencing and array data generated in this paper have been deposited in GEO:GSE180495. Previously published datasets analyzed in this study are available at GEO:GSE114846 or through ENCODE (https://www.encodeproject.org/experiments/ENCSR168AUX/). Raw data from BASU experiments are found in Supplementary Table 1. Uncropped immunoblots and FACS gating controls are found in Supplementary Figure 1 and 2. The human reference genome hg38 was downloaded from the UCSC genome browser. The GRCh38 reference genome for single cell mapping can be downloaded from 10X genomics (https://support.10xgenomics.com/single-cell-gene-expression/software/downloads/latest). The manifest and annotation files for methylation analysis can be found at https://github.com/achilleasNP/IlluminaHumanMethylationEPICanno.ilm10b5.hg38. Previously published custom code used in this study is available at https://github.com/OroLabStanford. There are no restrictions in data availability.


