

Abstract
COVID-19 is an infectious disease; in some it presents as an uncontrolled, hyperactive immune response, causing severe immunological injury. Existing rodent models do not recapitulate the sustained immunopathology of patients with severe disease. Here, we describe a humanized mouse model of COVID-19 that uses adeno-associated virus to deliver human ACE2 to the lungs of humanized MISTRG6 mice. This model recapitulates innate and adaptive human immune responses to SARS-CoV-2 infection up to 28 days post-infection, with key features of chronic COVID-19 including weight loss, persistent viral RNA, lung pathology with fibrosis, a human inflammatory macrophage response, a persistent interferon-stimulated gene signature, and T-cell lymphopenia. We used this to study two therapeutics on immunopathology: patient-derived antibodies and steroids; We found that the same inflammatory macrophages crucial to containing early infection, later drove immunopathology. This model will enable evaluation of COVID-19 disease mechanisms and treatments.
Introduction:
COVID-19, caused by severe acute respiratory syndrome coronavirus 2 (SARS-CoV-2),1 is a heterogenous disease with few therapeutic options. Although anti-viral immunity mediates viral clearance in mild COVID-19, robust inflammatory cytokines, decreased circulating lymphocytes, dysregulated myeloid and lymphocyte compartments characterize immunopathology in severe COVID-192–13. Accurate model systems are essential to evaluate promising discoveries, but most available rodents and non-human primate models do not reveal the immunopathology seen in patients and are not well-suited to test therapeutics in the context of severe COVID-19 or post-acute sequelae of COVID-1914–21.
ACE2 is a SARS-CoV-2 receptor22–24. SARS-CoV-2 does not infect standard laboratory mice due to differences between mouse and human ACE2 (hACE2) that limit viral entry22–26,. Mice with transgenic or transient hACE2 expression can be infected with SARS-CoV-214–17,25. Although acute viral response, transmission, and vaccine efficacy can be tested in these models, they lack severe, chronic disease (Extended Data Fig.1). We hypothesized that a functional human immune system would model innate and adaptive human immunity during SARS-CoV-2 infection and confer chronicity and pathology seen in patients. Mice with a human immune system (humanized mice), generated via transplantation of human hematopoietic stem and progenitor cells (HSPCs), are invaluable tools to study the human immune system in vivo27,28. MISTRG629 mice were engineered by a human/mouse homolog gene-replacement strategy to provide physiological expression with regard to quantity, location and time of M-CSF (monocytes and tissue macrophage development)30, GM-CSF/IL-3 (lung alveolar macrophages)31, SIRPα (macrophage tolerance to human cells)32, ThPO (hematopoiesis and platelets)33, and IL-6 (improved engraftment and antibody responses )34–36, in a Rag2/Gamma common chain deleted background. When engrafted with human HSPCs, these mice have a comprehensive immune system comparable to humans29,37. Delivering hACE2 via an Adeno-associated virus (AAV)-vector to the lungs18 allows SARS-CoV-2 infection of HSPC engrafted MISTRG6 mice. Thus, we created a humanized mouse model of COVID-19 that recapitulates the human innate and adaptive immune systems that is amenable to the mechanistic study of COVID-19 and its myriad of complications.
Results:
MISTRG6 humanized mice that transiently express hACE2 can be infected with SARS-CoV-2.
We delivered AAV-hACE218 to the lungs of immune-reconstituted MISTRG6 mice (MISTRG6-hACE2) that have been engrafted with human HSPCs (Fig. 1A). MISTRG6-hACE2 mice were then infected with SARS-CoV-2 which yielded comparable viral RNA levels and viral titers to wild type mice18 but with prolonged high viral titers and RNA for at least 35 days post-infection (dpi) (Fig. 1B–C, S1A–B). In contrast, MISTRG6 mice lacking AAV-hACE2 expression did not have detectable viral titers, confirming the necessity of hACE2 for infection (Fig. 1C). Of note, MISTRG6-hACE2 mice that were infected but not engrafted with human HSPCs (and thus lack human immune cells), had lower viral titers than infected mice with human immune cells (Fig. 1C). The presence of human immune cells in MISTRG6-hACE2 mice caused persistent disease with severe, chronic weight loss for at least 35 dpi (Fig. 1D, S1C). MISTRG6-hACE2 humanized mice also exhibited more severe lung pathology compared to other animal models16,18,19,21,38. This lung pathology followed the three stages described in human COVID-19 patients: exudative, organizing, and fibrotic phases4,39–42. At 2dpi, MISTRG6-hACE2 mice showed prominent collection of proteinaceous debris in the alveolar spaces, hallmarks of the exudative phase (Fig. 1E, S1D). Lungs at 4dpi transitioned into organizing phase, highlighted by infiltration of alveolar spaces by lymphocytes, macrophages, and fibroblasts (Fig. 1E, S1D, 2C). Between 14 and 28dpi, expanding infiltration of interalveolar spaces (Fig. 1E, S1D–F) and increasing deposition of collagen, highlighted by thickening of collagen bundles in the lung parenchyma (Fig. 1F, S1D–F), further obliterated alveolar architecture. These changes highlighted the transition from the organizing to fibrotic phase. The architectural remodeling and collagen deposition was more pronounced at 28 and 35dpi resulting in replacement of normal alveolar architecture by dilated cystic spaces, separated by thick interstitial tissue bands (Fig. 1E–F, S1D–F). Thus, these data suggest humanized MISTRG6-hACE2 mice model chronic disease, and recapitulate the severe, persistent lung pathology seen in patients with severe COVID19.
Figure 1. MISTRG6 humanized mice that transiently express hACE2 can be infected with SARS-CoV-2.
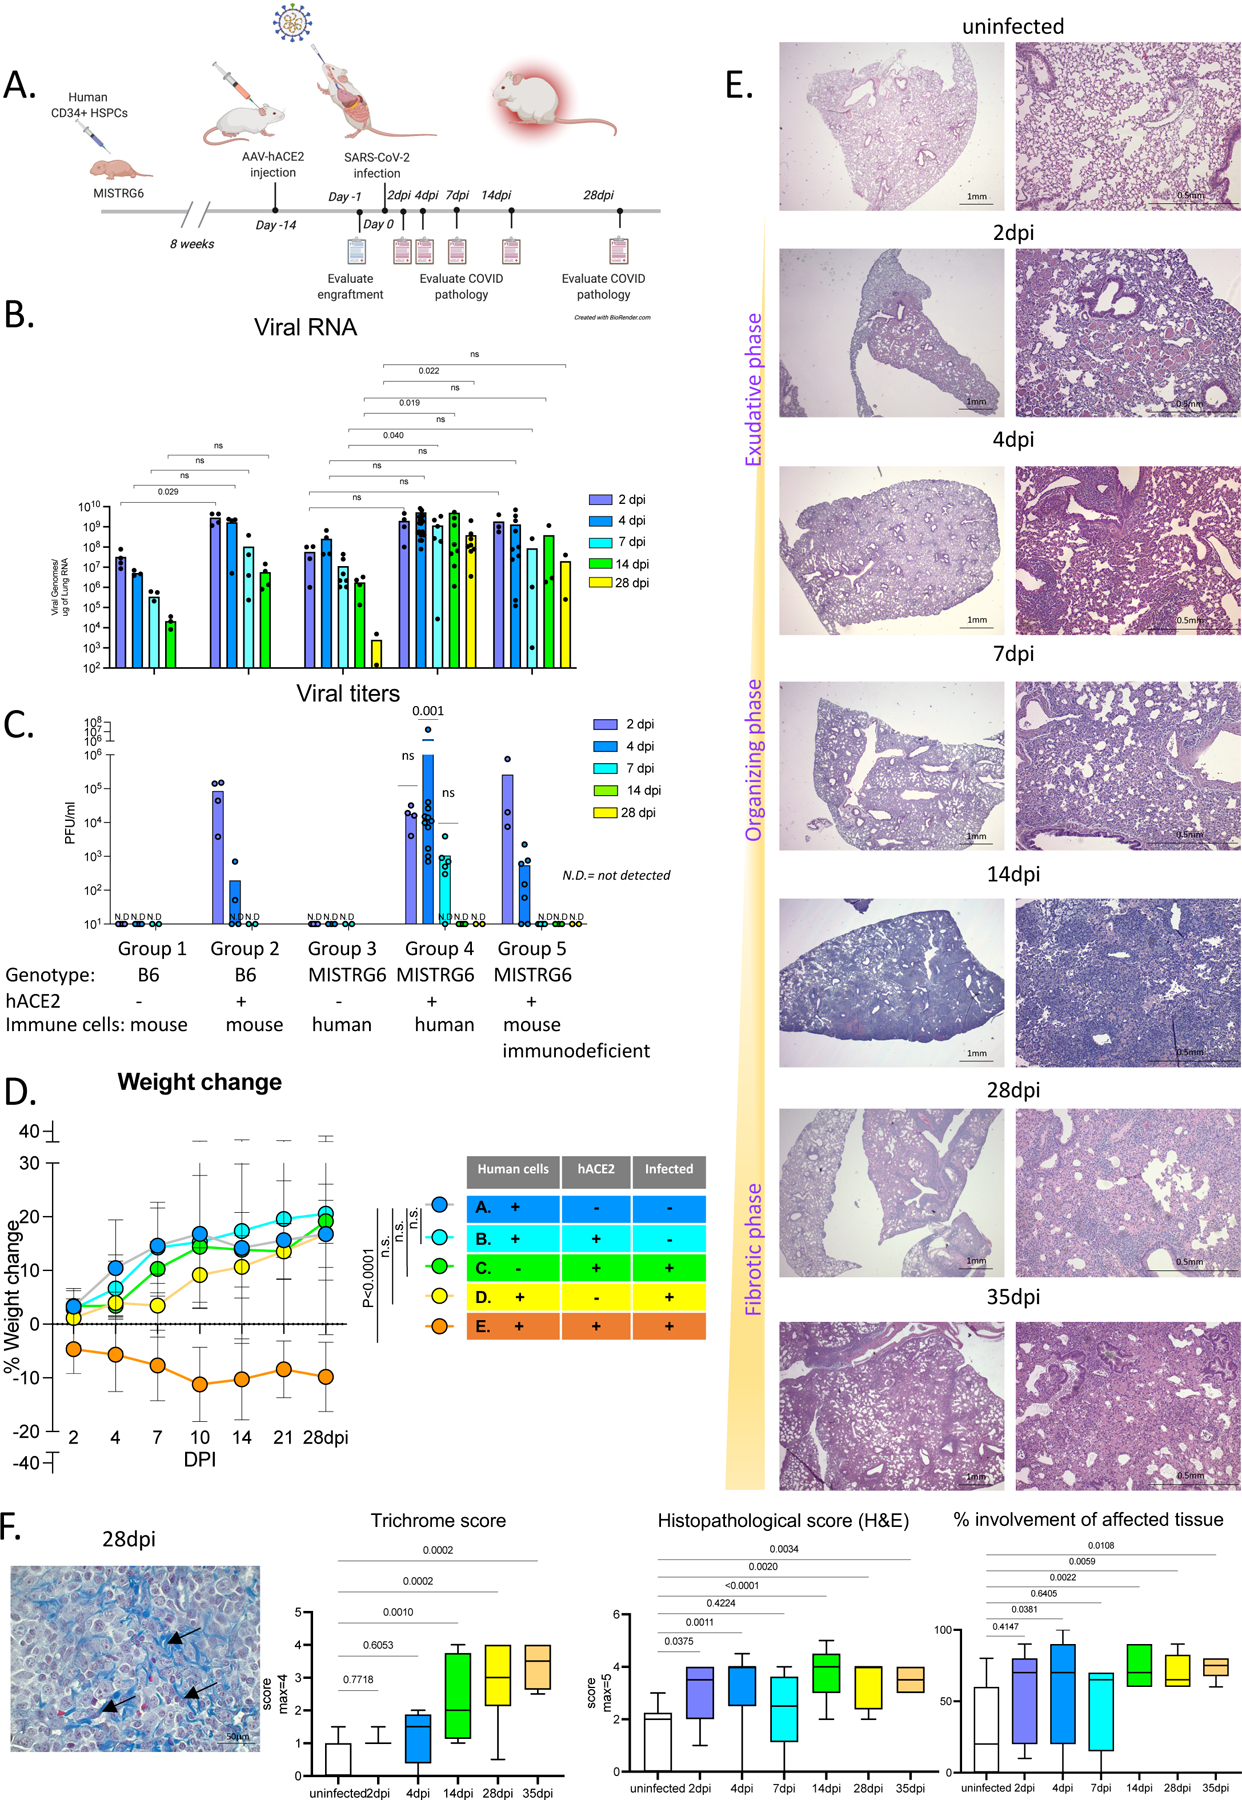
A. Schematic of experimental design. MISTRG6 mice were neonatally reconstituted with human CD34+ cells. After confirmation of human immune cell humanization in circulation, reconstituted MISTRG6 were injected AAV-hACE2 (1011 genomic copies/ml) intratracheally (MISTRG6-hACE2). Following a two-week acclimation and recovery period, MISTRG6-hACE2 mice were infected intranasally with SARS-CoV-2 (106 PFU).
B. Viral RNA (quantification of N gene) C. Viral titers measured by PFU in homogenized lung tissue at 2, 4, 7, 14, 28 days post-infection (dpi) in B6 control or reconstituted or unengrafted MISTRG6 mice expressing or lacking human ACE2 (using standard Vero E6 cells). Group 1: n=4(2dpi), 3(4dpi), 3(7dpi), 3(14dpi), 3(28dpi) biologically independent mice examined over 2 independent experiments. Group 2: n=4(2–28dpi) biologically independent mice examined over 2 independent experiments. Group 3: n=4(2dpi), 4(4dpi), 7(7dpi), 4(14dpi), 2(28dpi) biologically independent mice examined over 3 independent experiments. Group 4: n=(2dpi), 26(4dpi), 6(7dpi), 8(14dpi), 8(28dpi) biologically independent mice examined over at least 4 independent experiments. Group 5: n=3(2dpi), 11(4dpi), 3(7dpi), 3(14dpi), 2(28dpi) biologically independent mice examined over at least 2 independent experiments; Significance in viral RNA was determined by Mann-Whitney, two-tailed test. One-sample t and Wilcoxon test was utilized for comparison of viral titers. Individual values for each mouse and means are presented.
D. Weight change during the course of infection plotted as percent change compared with original weight measured just before inoculation with SARS-CoV-2. Group A-D: N=7, Group E: N= 8 biologically independent mice examined over at least 3 independent experiments for 28 days. Means with SD experiments are presented. Ordinary one-way ANOVA compared to the mean of uninfected reconstituted MISTRG6 mice (Group A) with Dunnett’s multiple comparison test was utilized. Group E p-value <0.0001; Group D p-value= 0.2889; Group C p-value= 0.8926, Group B p-value=0.9974. Means with SD are plotted. Individual values for Group E are presented in Fig S1C.
E. Representative images of H&E staining (2x and 10x magnification) and box and whisker plot (min to max) of the histopathological scores and percent area affected of infected (2, 4, 7, 14, 28 and 35dpi) or uninfected lungs. The whiskers go down to the smallest value (min) and up to the largest (max). The box extends from the 25th to 75th percentiles. The median is shown as a line in the center of the box. Uninfected n=9, 2dpi n=5, 4dpi n=14, 7dpi n=6, 14dpi n=11, 28dpi n=10, 35dpi n=6 biologically independent mice examined over at least 3 independent experiments. Ordinary one-way ANOVA compared to uninfected lungs was utilized. P value was adjusted by Šídák’s multiple comparisons test.
F. Trichrome staining of infected (2, 4, 7, 14, 28 and 35dpi) or uninfected lungs. Representative images (40X) and box and whisker plot (min to max) of the histopathological scores are presented. Arrows indicate areas with Collagen deposition. The extend of fibrosis was determined by the thickness of collagen bundles. The whiskers go down to the smallest value (min) and up to the largest (max). The box extends from the 25th to 75th percentiles. The median is shown as a line in the center of the box. Uninfected n=7, 2dpi n=3, 4dpi n=4, 14dpi n=12, 28dpi n=8, 35dpi n=4 biologically independent mice examined over at least 3 independent experiments. Ordinary one-way ANOVA compared to uninfected lungs was utilized. P value was adjusted by Šídák’s multiple comparisons test. Representative images of all time points are presented as part of Fig S1F.
Figure 2. Immune landscape in MISTRG6-hACE2 mice infected with SARS-CoV-2 is characterized by inflammatory macrophages and monocytes.
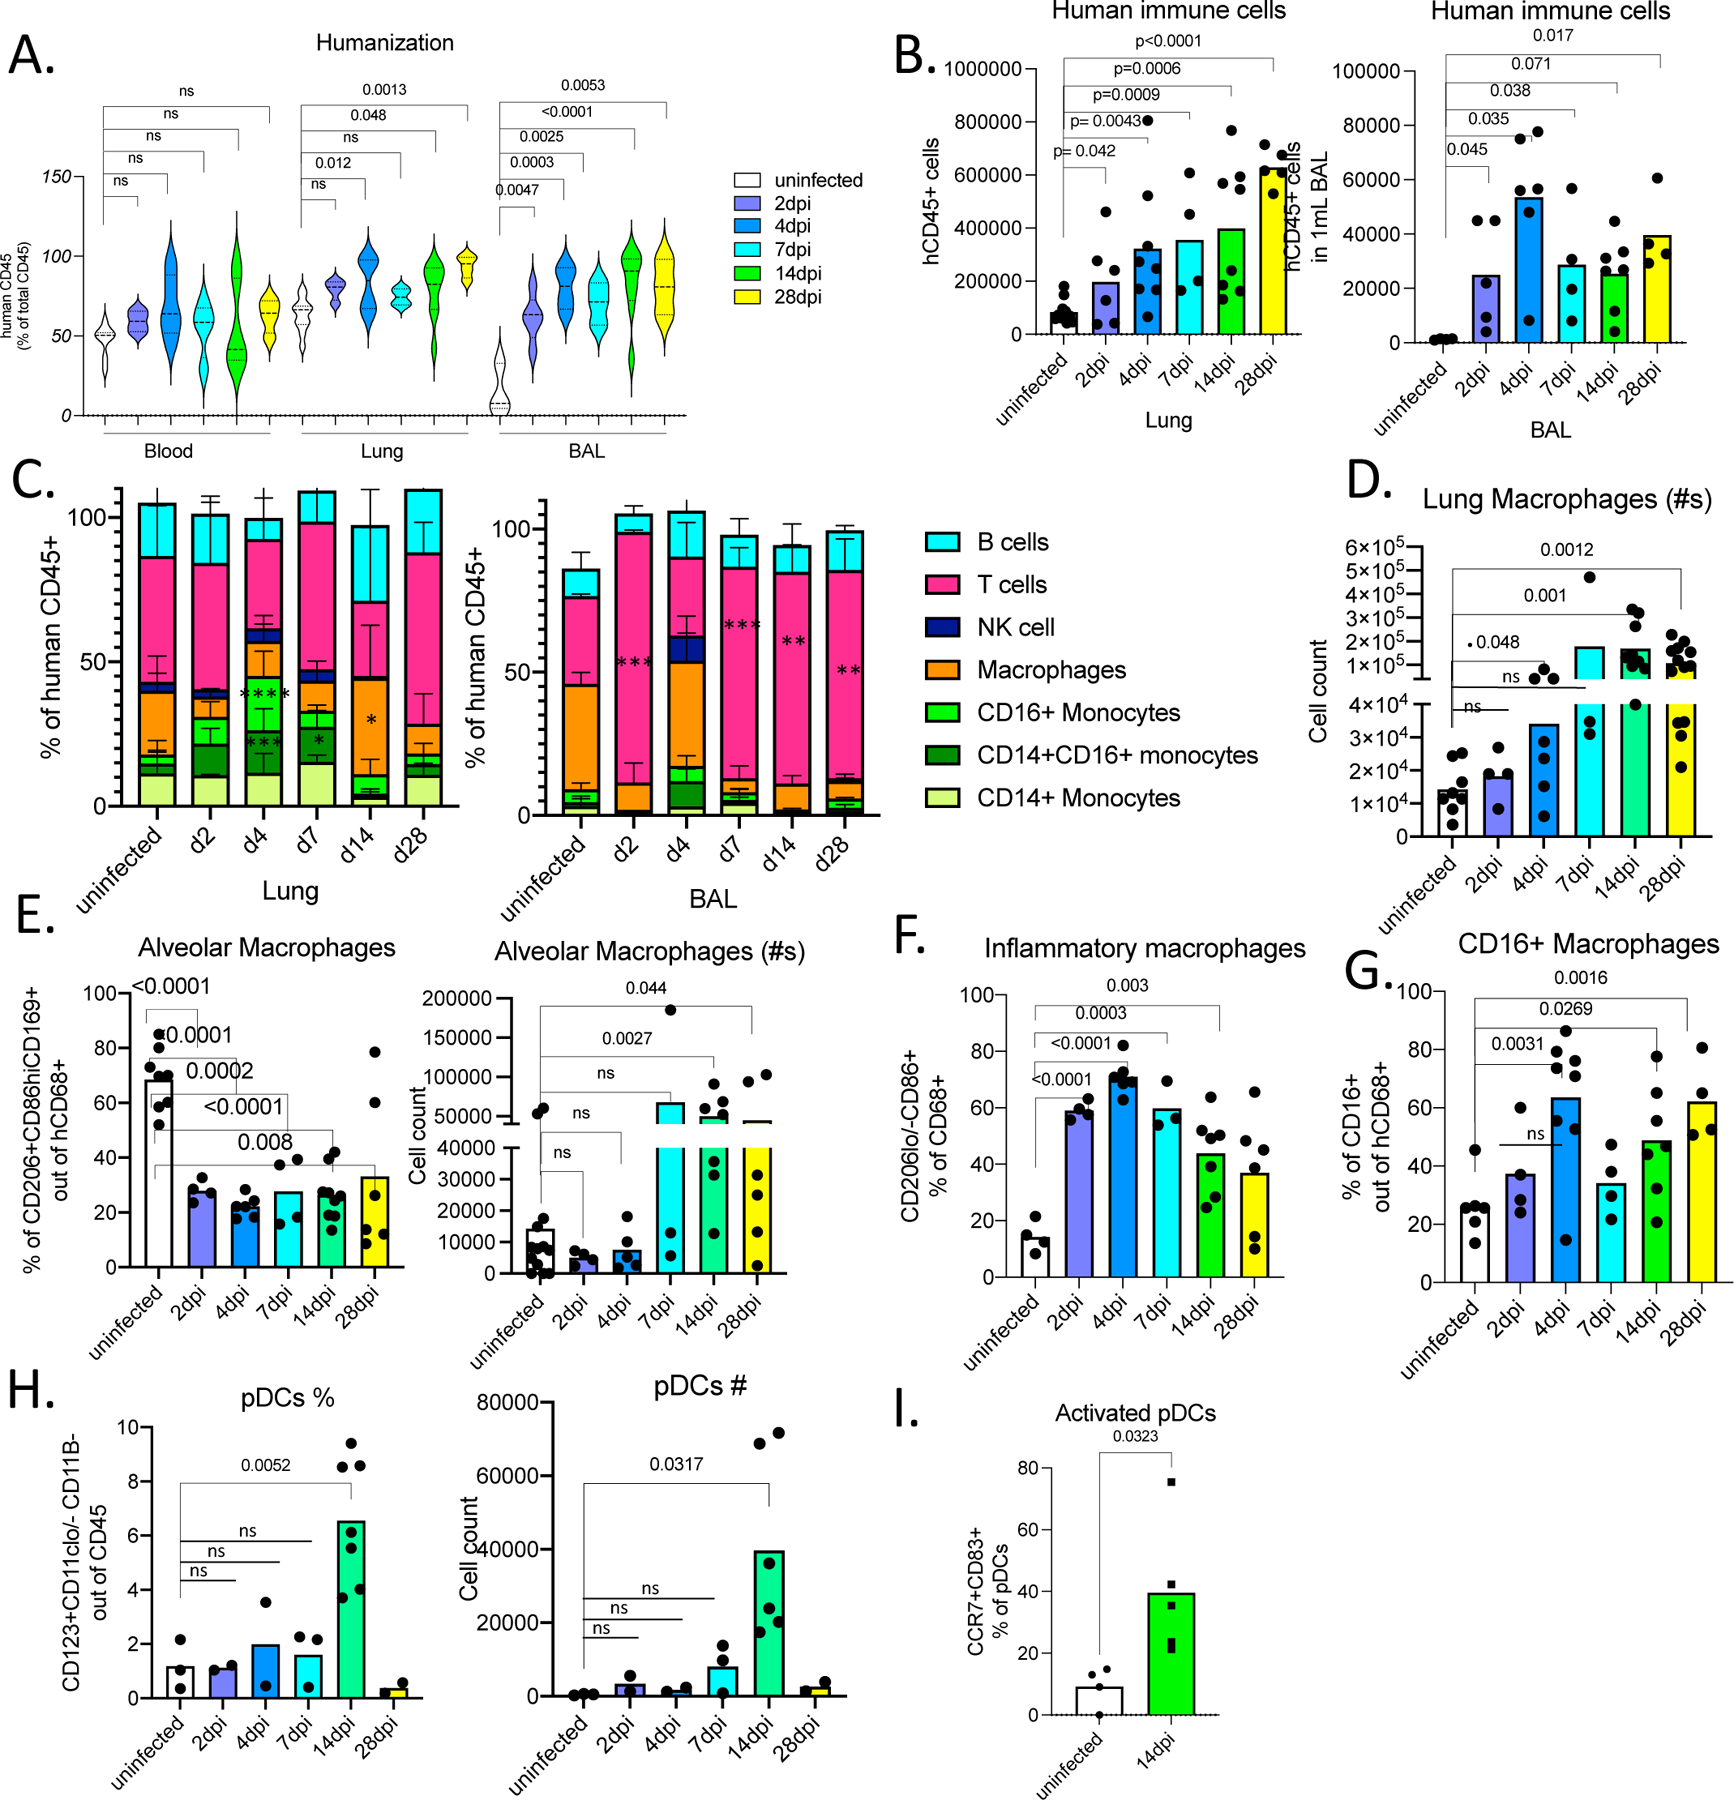
A. Humanization measured by ratio of human CD45+ (human immune cells) cells in total CD45+ cells (mouse and human CD45+ combined) in blood, lungs, and BAL of uninfected and infected MISTRG6-hACE2 mice. Uninfected n=8, 2dpi n=4, 4dpi n=7, 7dpi n=4, 14dpi n=9, 28dpi n=4 biologically independent mice examined over at least 3 independent experiments. Ordinary one-way ANOVA compared to uninfected lungs was utilized. P value was adjusted with Dunnett’s multiple comparison test. Distribution of individual data points is displayed in a violin plot.
B. Human immune cell numbers in lungs and BAL of uninfected and infected mice at 2,4,7,14,28 dpi. Lung: Uninfected n=11, 2dpi n=6, 4dpi n=7, 7dpi n=4, 14dpi n=8, 28dpi n=5 over at least 3 independent experiments. BAL: Uninfected n=4, 2dpi n=5, 4dpi n=6, 7dpi n=4, 14dpi n=7, 28dpi n=4 over at least 3 independent experiments. Unpaired, two-tailed t-test. P values <0.05 are plotted. Individual values for each mouse and means are presented.
C. Human immune lineages lungs and BAL of uninfected and infected mice at 2,4,7,14, 28 dpi within the human CD45+ population. Classical monocytes (CD14+), Intermediate monocytes (CD14+CD16+), non-classical monocytes (CD16+CD14-), macrophages (CD68+), NK cells (NKP46+), T cells (CD3+), B cells (CD19+ and/or CD20+). Statistical significance was deemed by ordinary one-way ANOVA compared to uninfected lungs. P values were adjusted with Dunnett’s multiple comparison test. P values represented by: ns P > 0.05; *P ≤ 0.05; **P ≤ 0.01; ***P ≤ 0.001; **** P ≤ 0.0001. Lung: Uninfected n=8, 2dpi n=4, 4dpi n=7, 7dpi n=3, 14dpi n=9, 28dpi n=5 biologically independent mice examined over at least 3 independent experiments. BAL: Uninfected n=4, 2dpi n=4, 4dpi n=6, 7dpi n=3, 14dpi n=6, 28dpi n=3 biologically independent mice examined over at least 3 independent experiments. P values <0.05 are provided: Lung: CD14+CD16+ monocytes 4dpi=0.0003, 7dpi =0.030; CD16+ monocytes 4dpi<0.0001; Macrophages 14dpi= 0.0114. BAL: T cells 2dpi<0.0001, 7dpi=0.0003, 14dpi=0.003, 28dpi=0.001; Means with SD are plotted.
D. Number of human macrophages in lungs of uninfected and infected mice at 2, 4, 7, 14, 28 dpi. Unpaired, two-tailed t-test. Lung: Uninfected n=8, 2dpi n=4, 4dpi n=7, 7dpi n=3, 14dpi n=9, 28dpi n=6 biologically independent mice examined over at least 3 independent experiments. Individual values for each mouse and means are presented.
E. Frequency and number of human alveolar macrophages marked by CD206hi, CD86+, CD169+ expression within the hCD45+CD68+ population in the lungs of uninfected and infected mice at 2, 4, 7, 14, 28 dpi. N=3–10. Unpaired, two-tailed t-test. Uninfected n=8, 2dpi n=4, 4dpi n=4–6, 7dpi n=3, 14dpi n=7, 28dpi n=6 biologically independent mice examined over at least 3 independent experiments. Individual values for each mouse and means are presented.
F. Frequency of inflammatory human lung macrophages marked by CD206-/lo, CD86hi macrophages within the hCD45+CD68+ population in the lungs of uninfected and infected mice at 2,4,7,14,28 dpi. Unpaired, two-tailed t-test. P values<0.05 plotted. Uninfected n=4, 2dpi n=4, 4dpi n=6, 7dpi n=4, 14dpi n=7, 28dpi n=4 biologically independent mice examined over 3 independent experiments. Individual values for each mouse and means are presented.
G. Frequency of CD16+ human lung macrophages marked by CD16+ cells within the hCD45+CD68+ population in the lungs of uninfected and infected mice at 2,4,7,14,28 dpi. N=4–8. Unpaired, two-tailed t-test. P values<0.05 plotted. Uninfected n=6, 2dpi n=4, 4dpi n=8, 7dpi n=3, 14dpi n=7, 28dpi n=6 biologically independent mice examined over 3 independent experiments. Individual values for each mouse and means are presented. Unpaired t-test, two-tailed. P values <0.05 are plotted.
H. Frequency and number of human plasmacytoid dendritic cells (pDCs) marked by CD123+CD11b-CD11c-/lo cells within hCD45+ population in the lungs of uninfected and infected mice at 2,4,7,14,28 dpi. Unpaired t-test, two-tailed. Uninfected n=3, 2dpi n=2, 4dpi n=2, 7dpi n=3, 14dpi n=7, 28dpi n=2 biologically independent mice examined over at least 2 independent experiments. Individual values for each mouse and means are presented.
I. Frequencies of activated, mature (CD83+ CCR7+) pDCs in infected lungs at 14dpi or uninfected lungs.
Uninfected n=4, 14dpi n=5 biologically independent mice examined over 2 independent experiments. Individual values for each mouse and means are presented. Unpaired t-test, two-tailed. P values <0.05 are plotted.
Inflammatory macrophages and monocytes characterize the Immune landscape in SARS-CoV-2 infected MISTRG6-hACE2 mice.
We next characterized human and mouse immune cells in SARS-CoV-2 infected and uninfected MISTRG6-hACE2 mice by flow cytometry to evaluate the cells that drive immunopathology and viral clearance (Fig. S2A–B). The degree of humanization was comparable in blood between uninfected and infected mice, but SARS-CoV-2 infection drastically increased recruitment of human immune cells to the lower respiratory tract and lung parenchyma, as quantified in whole lung homogenates and bronchioalveolar lavage (BAL) (Fig. 2A–B). The infiltrates present in lungs and BAL at 2–4 dpi consisted of human monocytes, macrophages, and T cells (Fig. 2C), again reminiscent of human COVID-19 lung pathology7. In our model, human neutrophils are lacking so instead we measured mouse neutrophils, the most abundant mouse immune cells in these mice (Fig. S2B). In contrast to persistent human immune cell infiltration, mouse immune cell and neutrophil infiltration was transient, peaking at 4dpi and returning to baseline by 14dpi (Fig. S2B). Variability in neutrophils is in line with human histopathological findings in lungs43. Yet, the cause of such variability and whether this is a result of superimposed bacterial infections is unestablished44,45.
The lung monocytes of infected mice comprised all three human monocyte subsets (CD14+ classical; CD14+CD16+ intermediate; and CD16+ non-classical; Fig. 2C). By contrast, and in line with healthy human lung monocytes46; uninfected humanized mouse lungs harbored only classical CD14+ monocytes which expanded in response to SARS-CoV-2 infection (Fig. 2C). Intermediate and non-classical monocytes infiltrated infected lungs at high frequencies as early as 2dpi, peaking at 4dpi. Macrophage numbers increased at 4dpi, and peaked at 14dpi, remaining high until 28dpi (Fig. 2C, D, S2C,D). By 2dpi, the macrophage compartment was enriched for inflammatory and monocyte-derived macrophages, which outnumbered alveolar macrophages, suggesting macrophages recruited early from the circulation are the long-term contributors of immunopathology (Fig. 2E–G). Plasmacytoid dendritic cells (pDCs), generally known for their contribution to early antiviral response and main producers of type I interferon alpha (IFNα), were enriched substantially later in infection (14dpi in Fig. 2H). Infected mice at 14dpi also showed activated pDCs (Fig. 2I, S2E) marked by CCR7 and CD83 expression47. This coincided with chronically sustained interferon response and sustained inflammatory macrophages, as seen in severe COVID-19 patients7,8,48,49.
Adaptive immune responses of COVID-19 patients are recapitulated in MISTRG6-hACE2 mice infected with SARS-CoV-2.
Human COVID-19 shows profound T cell lymphopenia10,12,16,50 that is recapitulated in our humanized mice. Infected MISTRG6-hACE2 humanized mice presented with a profound loss of T cells, especially CD8+ T cells, in blood and spleens (Fig. 3A–B, Extended Data Fig. 2A–C). Moreover, lung T cells of MISTRG6-hACE2 mice were activated (positive for HLA-DR, CXCR3, ICOS and PD1) and the main producers of IFN-gamma (IFNγ) (Fig. 3C–D, 4B,D) as in COVID-19 patients10–12. T cell populations comprised both TCRalpha/beta T cells (Tαβ), enriched for CD4+, and TCRgamma/delta T cells (Tγδ) in both uninfected and infected mice (Fig. 3E, Extended data Fig.2D). Yet, during the course of infection, as the circulating T cell numbers decline, the total number of T cells in lungs increased with higher representation of Tγδ cells compared with uninfected mice (Fig. 3E). The early T cell response in infected lungs showed an increase in resident and infiltrating Tγδ cells and bystander activated memory Tαβ cells as determined by the lung transcriptional profile (Fig. 4C, Extended Data Fig.4H).
Figure 3. Adaptive immune responses in MISTRG6-hACE2 mice infected with SARS-CoV-2 are characterized by virus specific, activated T cells, IgG+ B cells and systemic lymphopenia.
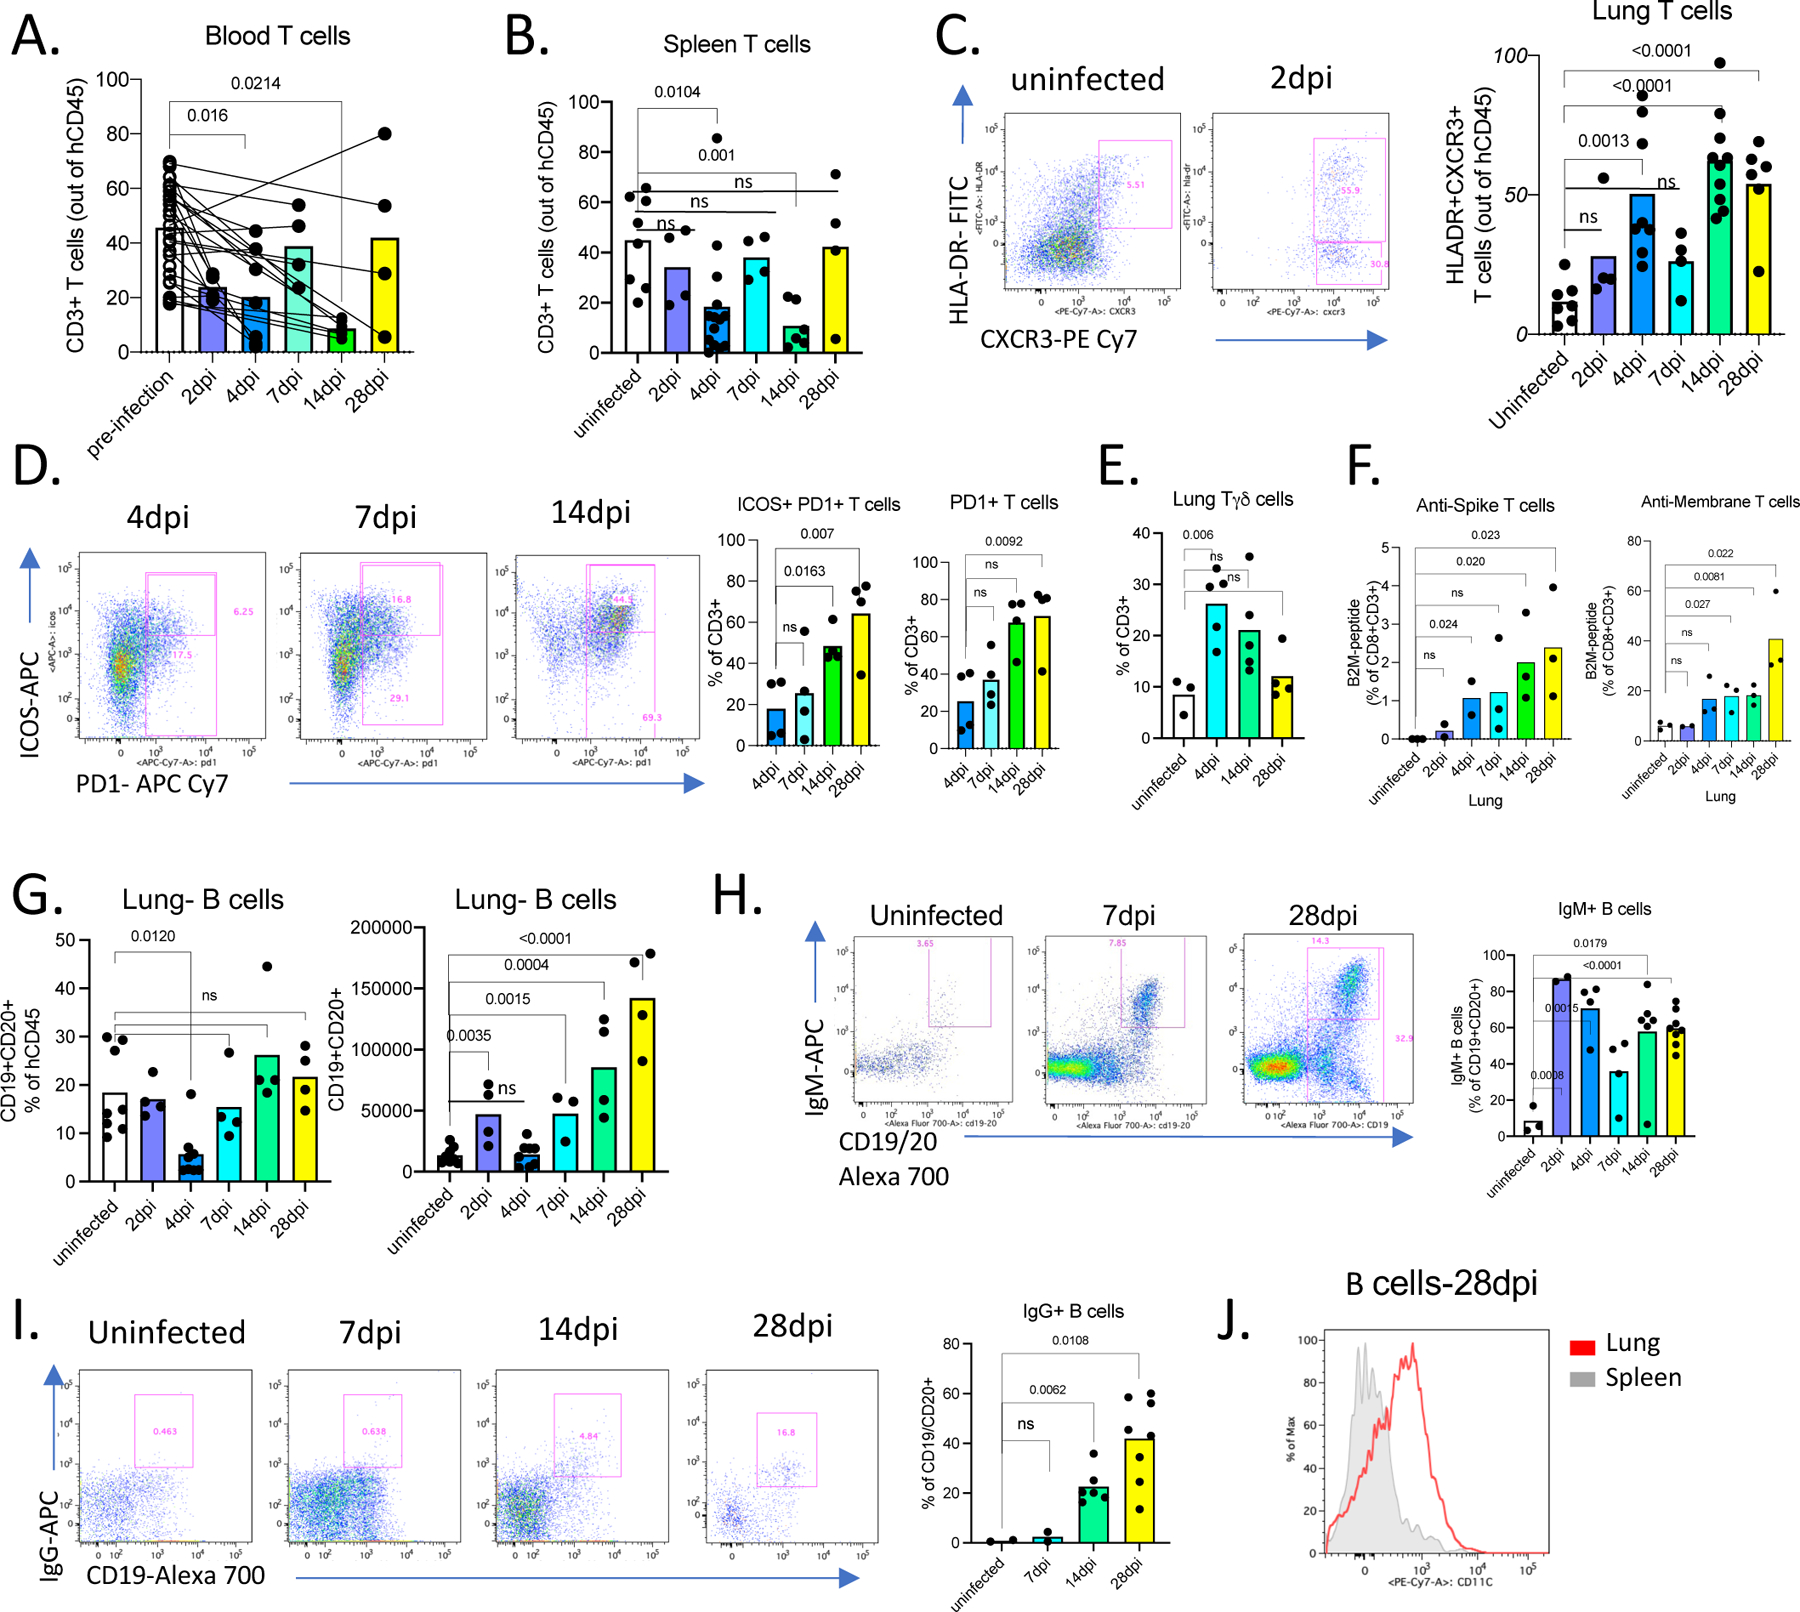
A. Frequencies of human CD3+ T cells within human CD45+ population in the blood pre- and post-infection (2,4,7,14,28dpi). Lines connect pre- and post-infection values for the same mouse. Paired, two-tailed t-test. 2dpi n=4, 4dpi n=7, 7dpi n=4, 14dpi n=6, 28dpi n=4 biologically independent mice examined over 3 independent experiments. Individual values for each mouse and means are presented. P-values<0.05 are plotted.
B. Frequencies of human CD3+ T cells within human CD45+ population in the spleens of uninfected and infected mice at 2,4,7,14,28 dpi. Uninfected n=8, 2dpi n=4, 4dpi n=14, 7dpi n=4, 14dpi n=6, 28dpi n=4 biologically independent mice examined over at least 3 independent experiments. Unpaired, two-tailed t-test. Individual values for each mouse and means are presented. P-values<0.05 are plotted.
C. Representative flow cytometry plots of HLA-DR and CXCR3 expression on human lung T cells and frequencies of HLA-DR+CXCR3+ lung T cells in uninfected and infected mice at 2,4,7,14,28dpi. Uninfected n=7, 2dpi n=4, 4dpi n=8, 7dpi n=4, 14dpi n=9, 28dpi n=6 biologically independent mice examined over at least 3 independent experiments. Unpaired, two-tailed t-test. Individual values for each mouse and means are presented. P-values<0.05 are plotted.
D. Representative flow cytometry plots of ICOS and PD1 expression on human lung T cells and frequencies Icos+ PD1+ or PD1+ T cells in uninfected and infected mice (4,7,14,28dpi). N=4 biologically independent mice examined over at least 3 independent experiments. Unpaired, two-tailed t-test. Individual values for each mouse and means are presented. P-values<0.05 are plotted.
E. Frequencies of TCRgamma/delta T cells (Tγδ) among human lung T cells in uninfected and infected mice (4,14,28dpi). Uninfected n=3, 4dpi n=5, 14dpi n=5, 28dpi n=4 biologically independent mice examined over at least 3 independent experiments. Unpaired, two-tailed t-test. Individual values for each mouse and means are plotted. P-values<0.05 are plotted.
F. Frequencies of anti-viral CD8+ T cells in uninfected and infected mice at 2,4,7,14,28dpi. Human CD8+ T cells from mice that had been engrafted with an HLA-A2 positive source of progenitor cells were stained with viral antigen (peptides of M and S viral proteins)-bearing HLA-A2 tetramers. Uninfected n=3, 2dpi n=2, 4dpi n=3, 7dpi n=3, 14dpi n=3, 28dpi n=3 biologically independent mice examined over 2 independent experiments. Unpaired, two-tailed t-test. Individual values for each mouse and means are presented. P-values<0.05 are plotted.
G. Frequencies and numbers of human B cells within hCD45+ population in the lungs of uninfected or infected mice at 2,4,7,14,28 dpi. Uninfected n=8, 2dpi n=4, 4dpi n=8, 7dpi n=4, 14dpi n=4, 28dpi n=4 biologically independent mice examined over at least 2 independent experiments. Unpaired, two-tailed t-test. Individual values for each mouse and means are presented. P-values<0.05 are plotted.
H. Representative flow cytometry plots and frequencies of IgM+ B cells in the lungs of uninfected and infected mice 2,4,7,14,28dpi. N=3–8. Unpaired, two-tailed t-test. P-values<0.05 are plotted. Uninfected n=3, 2dpi n=2, 4dpi n=4, 7dpi n=4, 14dpi n=6, 28dpi n=8 biologically independent mice examined over at least 2 independent experiments. Unpaired, two-tailed t-test. Individual values for each mouse and means are presented. P-values<0.05 are plotted.
I. Representative flow cytometry plots and frequencies of IgG+ B cells in the lungs of uninfected and infected mice 7,14,28dpi. N=2–8. Unpaired, two-tailed t-test. P-values<0.05 are plotted. Uninfected n=2, 7dpi n=2, 14dpi n=6, 28dpi n=8 biologically independent mice examined over at least 2 independent experiments. Unpaired, two-tailed t-test. Individual values for each mouse and means are presented. P-values<0.05 are plotted.
J. Representative plot of CD11c expression on CD19+ B cells from spleen and lungs of infected mice at 28dpi. N=5. Representative of n=6 for at least 3 independent experiments. All attempts resulted with similar findings.
Figure 4. SARS-CoV-2 lungs sustain ISGs and display SLE like features.
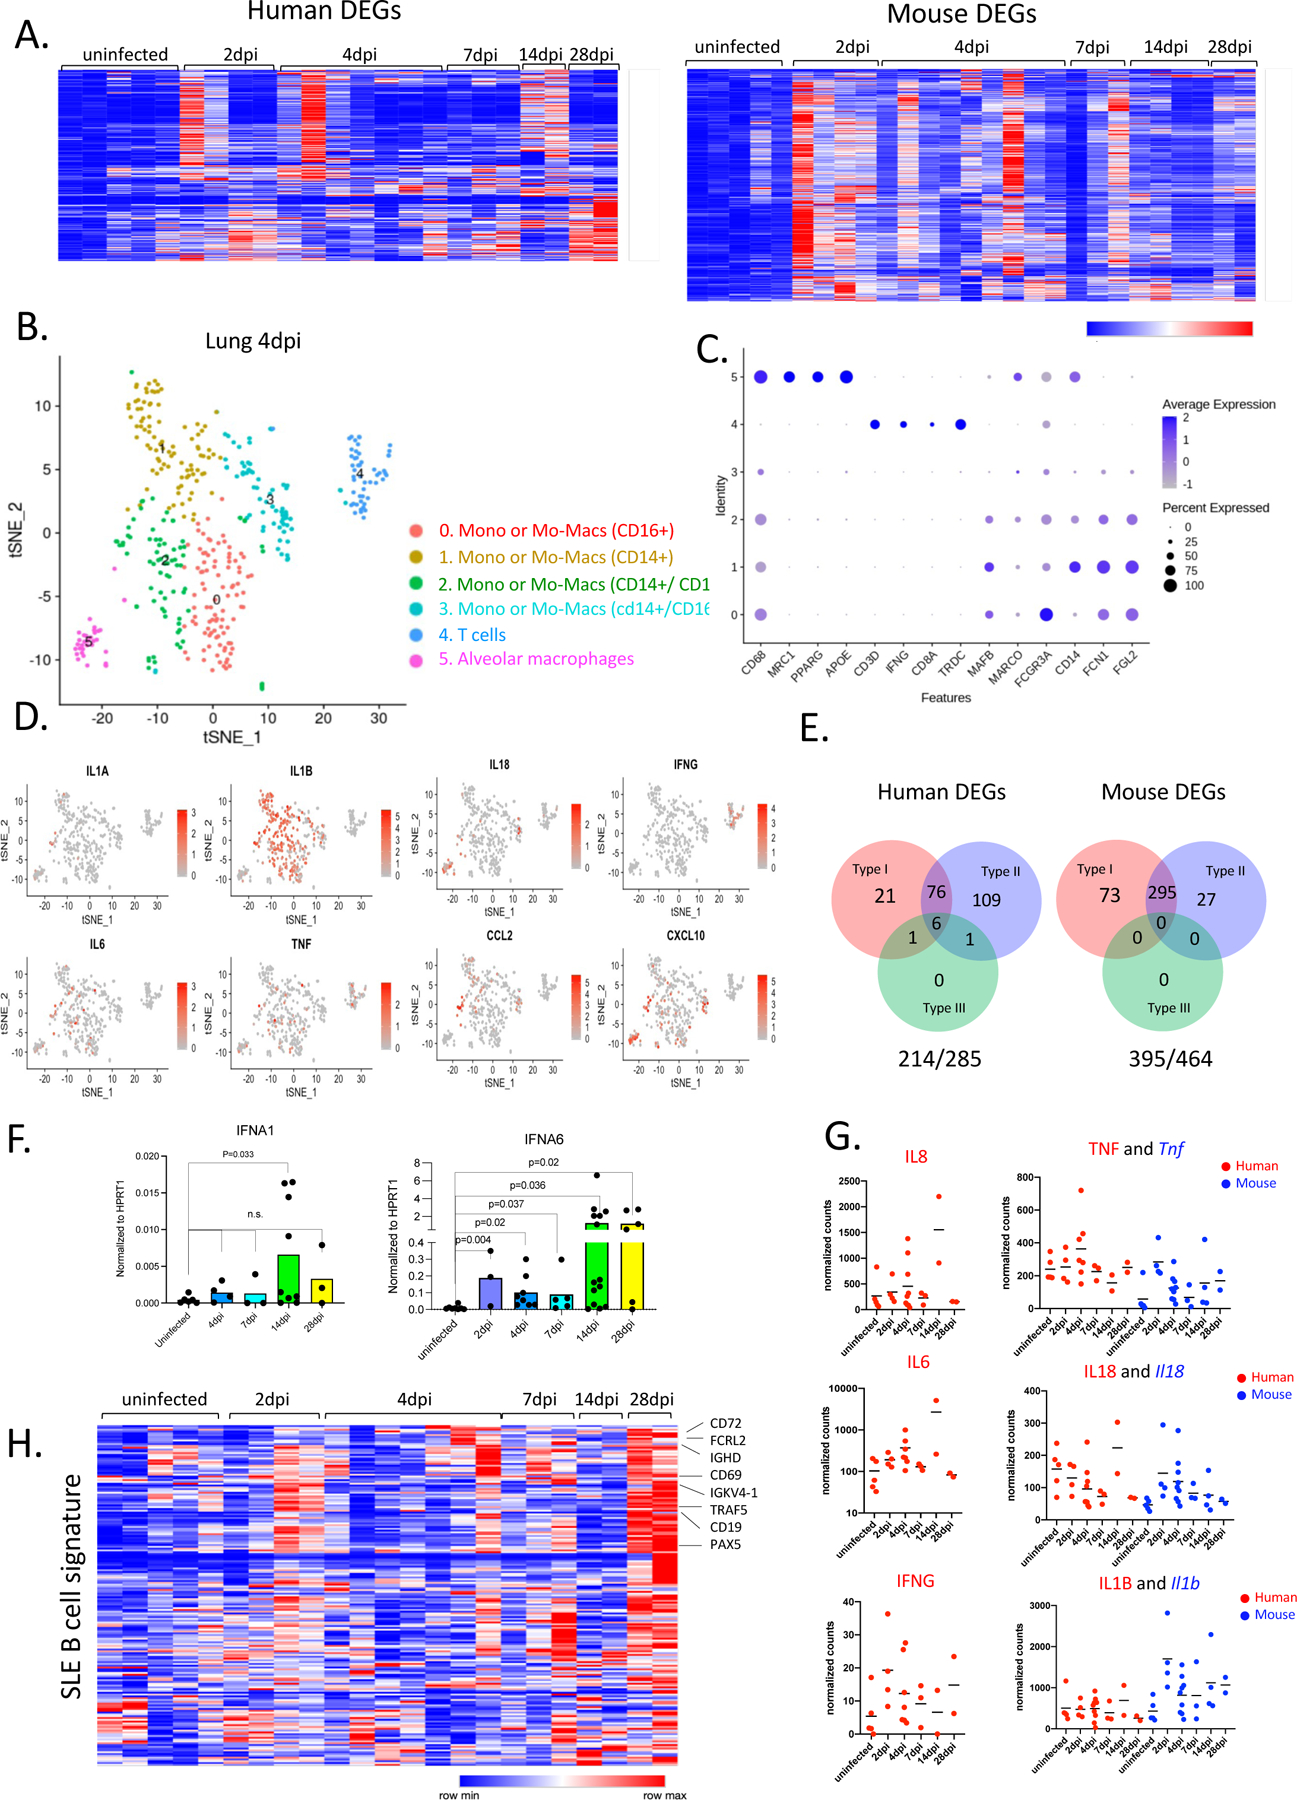
A. Heatmap of differentially regulated human and mouse genes (combined list of genes Log2, FoldChange >1 in each infected time point vs uninfected lungs; adjusted p value<0.05; mean normalized count>5). Transformed normalized counts in lungs of uninfected or infected MISTRG6-hACE2 plotted over the course of infection were clustered using Spearman Correlation. Row min and max of transformed values, calculated by subtracting row mean and dividing by STD for each gene across all samples, are visualized. For the adjusted P values the Bonferroni correction was used. Human genes: Uninfected n=5, 2dpi n=4, 4dpi n=7, 7dpi n=3, 14dpi n=2, 28dpi n=2 biologically independent mice examined over at least 2 independent experiments for all time points. Mouse genes: Uninfected n=5, 2dpi n=4, 4dpi n=9, 7dpi n=3, 14dpi n=4, 28dpi n=2 biologically independent mice examined over at least 2 independent experiments for all time points. Whole tissue lung samples with less than 1% human reads were excluded from analysis (pre-established criterium).
B. t-distributed stochastic neighbor embedding (t-SNE) plot with clustering results of single cell RNA sequencing of human immune cells using the 10X Genomics platform from lungs at 4dpi. Single cell suspensions from whole infected lung at 4dpi were processed and sequenced. There were 421 cells identified as human immune cells.
C. Dot plot of cluster identifying genes for human immune cell clusters described in Fig. 4B.
D. Cluster distribution and expression profile of human inflammatory cytokines for clusters described in Fig. 4B–C.
E. Distribution of ISGs within human and mouse DEGs.
F. Normalized expression of human IFNA1 and IFNA6 mRNA measured by qPCR in homogenized lung tissue of uninfected and infected (2, 4, 7, 14, 28dpi) mice. Expression was normalized to human HPRT1. Unpaired t-test, one-tailed since the distribution is expected to be one-sided. Uninfected n=6, 4dpi n=4, 7dpi n=3, 14dpi n=9, 28dpi n=3 biologically independent mice examined over at least 3 independent experiments. Individual values for each mouse and means are presented. P-values<0.05 are plotted.
G. Normalized counts for inflammatory cytokines implicated in COVID-19 patients. Counts were reported separately for human(red) and mouse(blue) cytokine genes. Based on whole tissue transcriptome data presented in Fig. 4A. Human genes: Uninfected n=5, 2dpi n=4, 4dpi n=7, 7dpi n=3, 14dpi n=2, 28dpi n=2 biologically independent mice examined over at least 2 independent experiments for all time points. Mouse genes: Uninfected n=5, 2dpi n=4, 4dpi n=9, 7dpi n=3, 14dpi n=4, 28dpi n=2 biologically independent mice examined over at least 2 independent experiments for all time points.
H. Heatmap of genes that are implicated in SLE-like B cells based on GSE1032571 in infected lungs of MISTRG6 mice at 2,4,7.14.28 dpi. Row min and max of transformed values, calculated by subtracting row mean and diving by STD for each gene across all samples, are visualized. Uninfected n=5, 2dpi n=4, 4dpi n=7, 7dpi n=3, 14dpi n=2, 28dpi n=2 biologically independent mice examined over at least 2 independent experiments for all time points.
As the human cells in these mice develop within a mouse thymus, we wished to determine whether T cells were responsive to virus in the context of MHC developed in our system. To test this, we stained human CD8+ T cells from infected mice that had been engrafted with an HLA-A2 positive source of HSPCs with viral antigen-bearing HLA-A2 tetramers (Extended data Fig.2E). Virus specific CD8+Tαβ cells against membrane glycoprotein (M) and Spike (S) peptides were detectable as early as 4dpi, peaking at 28dpi (Fig 3F). To test if these T cells could attenuate infection, we transferred sorted lung T cells and total splenocytes from infected mice to unengrafted MISTRG6-hACE2 mice prior to infection with SARS-CoV-2. Viral titers at 4dpi in mice which received prophylactic lung T cells were clearly lower than mice which did not receive human T cells (Extended data Fig.2F). Thus, a functional anti-SARS-CoV-2 T-cell response develops in infected MISTRG6-hACE2 mice.
B cells gradually increased in response to infection, peaking late at 14–28dpi in BAL and lungs (Fig. 3G, Extended data Fig.2G). Although the germinal center B cell response was reported to be suboptimal in reconstituted MISTRG6 mice35, a high proportion of IgM+ B cells were seen early in infection that were subsequently replaced by IgG+ B cells (14dpi and 28dpi) and thus defined the anti-viral B cell response (Fig. 3H–I, Extended data Fig.2H). B cells, particularly late in infection, expressed high levels of CD11c (Fig 3J, Extended data Fig.2I), implicating an inflammatory, systemic lupus erythematosus (SLE)-like extrafollicular B cell response51,52 in humanized COVID-19, reminiscent of the human disease53. In contrast to T cell lymphopenia, B cell numbers in the humanized mice were normal or even increased (Fig 3G, Extended data Fig.2J) as in the majority of patients 54. A robust memory B-cell expansion is detected early in human infection with serum IgM and IgA antibodies detected earlier than IgG30. Initial serum IgM and IgA titers in human SARS-CoV-2 infection decline (~28 days), as IgG titers peak (~49 days)55. We observed a similar dynamic for IgM+ and IgG+ B cells in humanized lungs with IgM+ B cells declining over time and IgG+ B cells emerging at 14dpi and reaching high levels at 28dpi, at which point serum IgG levels also peak (Fig. 3H, I, Extended data Fig.2H,K). Thus, MISTRG6-hACE2 humanized mice recapitulate T and B cell responses induced by SARS-CoV-2 infection in patients.
SARS-CoV-2 lungs sustain ISGs and display SLE-like features.
We evaluated the transcriptional landscape in uninfected and SARS-CoV-2 infected lungs of humanized mice at 2, 4, 7, 14, and 28dpi. Mapping of transcripts to the human genome or the mouse genome separately identified 285 human genes and 516 mouse genes that were over-represented in infected lungs (Fig. 4A, Table S1). This approach served as a proxy for identifying changes in human vs mouse immune cells. Although there was marked heterogeneity in the strength of the response, the anti-viral response was sustained throughout the course of infection, suggesting that early anti-viral responses were either maintained or amplified late in infection (Fig. 4A). Corresponding pathway analysis of these differentially expressed mouse genes (mouse DEGs) identified cellular responses to interferons, cytokine production, ribonuclease activity, and neutrophil activation as top biological processes induced during SARS-CoV-2 infection (Table S2). Human DEGs were enriched for extracellular matrix assembly, opsonization, complement activation with a focus on immune phenotypes in monocytes, activated T cells and B cells; this further corroborated our findings from flow cytometric analysis (Table S2). Similar circuitries of monocytes, macrophages, activated T cells and extrafollicular B cells were described in humans with SARS-CoV-2 pneumonia53,56.
We performed single cell RNA sequencing to better evaluate the phenotype of human and mouse cells in lungs of infected MISTRG6-hACE2 mice. Our transcriptome analysis of human cells at the single cell level also revealed that human macrophages, monocytes, and human T cells were abundant at 4dpi (Fig. 4B–C). Human monocytes infiltrating infected lungs were already differentiating into macrophages at this stage of infection. These infiltrating monocytes and macrophages (clusters 0,1,2,3) were the main producers of inflammatory cytokines IL-1A, IL-1B, TNF and IL-6, like in severe COVID-19 patients6,9–11,13, (Fig. 4B,D). As in recent studies characterizing human COVID-1956, alveolar macrophages in infected MISTRG6-hACE2 mice were the main producers of T cell chemoattractants such as CXCL10 (Fig. 4D). We also monitored mouse immune cells, predominantly enriched for neutrophils (clusters 1,2) few mouse monocytes (clusters 5,6) and macrophages (cluster 3) at 4dpi (Extended Data Fig.3A,B). Mouse neutrophils which peak at 4dpi (Fig. S2B) were the main producers of mouse inflammatory cytokines and chemokines (Il1a, Il1b, TNF, Il18, Cxcl10; Extended Data Fig.3C).
Notably, the majority of the human and mouse DEGs in lungs were type-I or type-II interferon stimulated genes (ISGs) (Fig. 4E, Table S1–3). ISGs were sustained at high levels throughout infection persisting even as late as 14dpi and 28dpi, recapitulating the interferon-dependent phenotypes identified in COVID-19 patients (Fig. 4A,E; Table S2, 3) 13,48,49,57. Despite their fundamental role in many infectious and inflammatory diseases, the direct quantitation of type-I interferons has been challenging in health and disease58. Despite a significant ISG signature, minimal amounts of type-I interferons have been detected in the blood or lungs of patients with severe COVID-1959–62. This contrasts with that seen in patients infected with highly pathogenic influenza viruses63. We first quantified type-I interferons by qPCR. Of the many IFNA gene transcripts we tested (IFNA1, IFNA2, IFNA6, IFNA8, IFNA14, and IFNA21), only IFNA1 and IFNA6 mRNA levels were reliably detected and increased upon infection with SARS-CoV-2, peaking at 14dpi and coincident with pDC numbers in the lung tissue (Fig. 4F). We observed a similar but not significant trend for IFNB levels (Extended Data Fig.3D). Next, we quantified IFNα levels by ELISA in infected and uninfected mice. IFNα levels in serum and BAL, although low, mirrored transcript levels primarily produced by lung pDCs (Extended Data Fig.3E–F). Interferons during the recovery phase of influenza infection have been shown to prevent epithelial cell proliferation and differentiation, hence interfering with lung repair64. Likewise, our findings suggest that sustained type-I interferon signaling may also contribute to persistent lung pathology in COVID-19, as supported by histopathological assessment of 14–28 dpi lungs, when interferon levels are particularly high (Fig. 1E,F, Table S3). Human and mouse DEGs were also enriched for type-II ISGs (Fig. 4E). Type-II interferon, IFNγ, was mainly produced by T cells (Fig. 4D) as early as 2dpi and sustained until 28dpi. (Fig. 4G, Extended Data Fig.3G). In addition, elevated levels of various pro-inflammatory cytokines and chemokines (IL6, IL8, TNF, IL1B, CXCL10, IFNG) peaked or remained high late in infection further supporting delayed immune-resolution (Fig. 4G). An inflammatory cytokine signature (particularly IL66,10 and IL865), recapitulated in our model, was closely correlated with COVID-19 severity in patients6,66. Elevated serum TNF-α levels were not as predictive of severity as other cytokines (IL66,10, IL865) in patients, but correlated with viral load 6,10. TNF-α levels in MISTRG6-hACE2 mice were also higher early in infection with a similar but weaker correlation (Pearson’s r=0.25) between TNF-α and viral N transcript, suggesting a more pronounced role for TNF-α during the acute phase of disease.
Given the role of type-I interferons on bystander activation of T and B cells67,68, we first focused on the genes that typify bystander activation of memory T cells67. This suggested that early in infection (2–4dpi), T cell activation may be an antigen-independent, interferon-driven response (Extended Data Fig.3H). We sought to identify the origin of genes upregulated in patients by validating their expression in our infected mice and then identifying their cellular source69. B cell response in humanized lungs was particularly enriched for genes that are upregulated in moderate and severe COVID-19 patients (Extended Data Fig.3I,J). Lack of germinal center formation coupled with extrafollicular B cell responses correlated with poor clinical outcomes in COVID-19 patients 53,70. In line with these observations, unbiased pathway analysis of the 28dpi lung transcriptome (Fig. 4A, Extended Data Fig.3I, Table S2) and a more focused look at the SLE gene signatures71 identified a particular enrichment of SLE-like extrafollicular responses in lungs of infected mice at 28dpi (Fig. 4H). Furthermore, B cell responses at 28dpi exhibited the features of activated, bystander, clonal B cells that are not vaccine-specific in the context of influenza vaccine response, previously characterized in humans68 (Extended Data Fig.3K), further suggesting a highly inflammatory, bystander B cell response in humanized COVID-1910,11,53,69. Taken together, our lung transcriptome analysis identifies a central role of monocyte derived-macrophage interferon response that persists and is amplified later in infection and suggests that interferons regulate both the innate and adaptive immune response in COVID-19.
Human monoclonal recombinant antibodies as prophylactic and therapeutic interventions impact disease outcome.
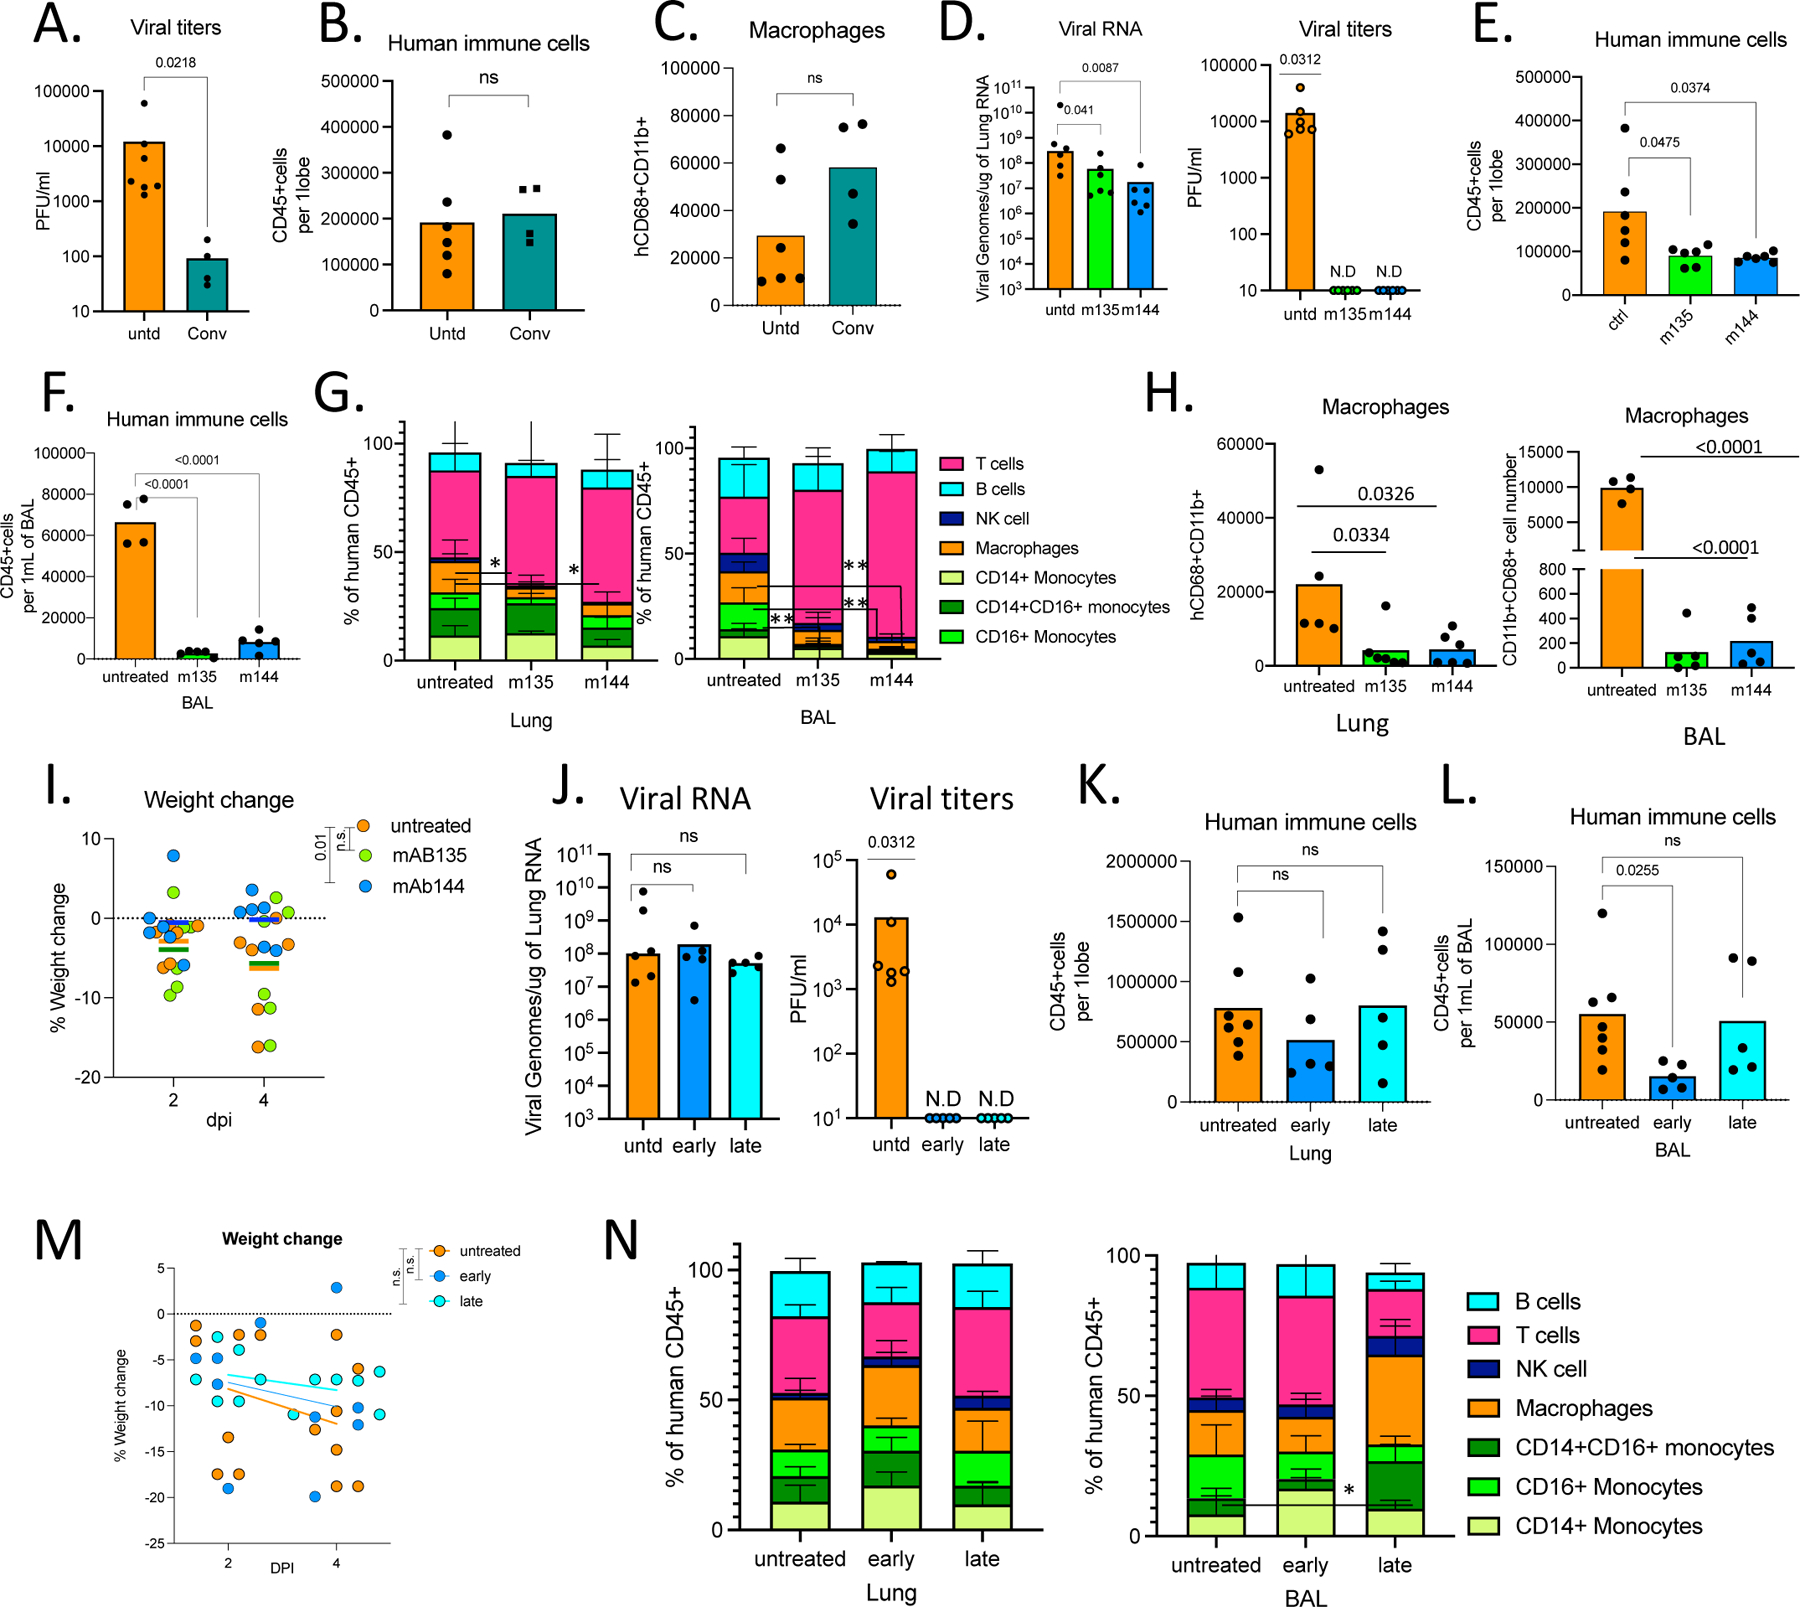
We tested whether MISTRG6-hACE2 mice could be used to evaluate patient-derived human antibodies as modulators of infection. MISTRG6-hACE2 mice were treated with convalescent plasma72 before infection with SARS-CoV-2 (Extended Data Fig.4A). The treated mice had significantly lower viral titers in lungs at 4dpi showing the plasma was partially effective (Fig. 5A). Yet, prophylactic convalescent plasma did not prevent weight loss or histopathological transition into the organizing phase, highlighted by immune cell infiltration, particularly inflammatory macrophages, into the alveolar spaces (Fig. 5B–C, Extended Data Fig. 4B,C) These findings highlight the limited efficacy of prophylactic administration of convalescent plasma in controlling lung pathology73–75. Monoclonal recombinant antibodies (mAbs) cloned from these convalescent patients had high neutralizing activity against SARS-CoV-2 in vitro and in vivo 72,76. Thus, we tested two complementary mAb clones in vivo for prophylactic and therapeutic treatments of SARS-CoV-2 infection in humanized mice (Extended Data Fig.4A,I). Mice were either treated with individual mAbs prior to infection, or with both mAbs combined at two time points post-infection (11- or 35-hours post-infection (hpi)) and analyzed at 4dpi (Extended Data Fig.5A,I). As measured by viral titers and viral RNA in lungs, prophylactic treatment with mAbs prevented SARS-CoV-2 infection (Fig. 5D). Prophylactic antibody administration also attenuated immune infiltration, yielding fewer infiltrating immune cells, particularly macrophages in lungs and BAL (Fig. 5E–H, Extended Data Fig,5D). Although T cell activation in lungs was comparable, possibly due to bystander activation of T cells, treatment with mAb clone-144 reduced infiltrating Tγδ cells in lungs (Extended Data Fig.4E, F), and prevented both systemic T cell lymphopenia (Extended Data Fig.4G,H) and weight loss (Fig. 5I). Next, we tested therapeutic mAb treatment in MISTRG6-hACE2 mice. While therapeutic treatment with mAbs similarly prompted viral clearance at both early and late time points, this failed to prevent immune infiltration or significantly alter the composition of the immune infiltrate in lungs by contrast to prophylaxis (Fig. 5J–N, Extended Data Fig.4J,L,M). Humanized mice treated with both mAbs early (11hpi) had fewer immune cells in BAL at 4dpi compared to untreated and late (35hpi)-treated groups, suggesting the inflammatory responses is attenuated by early but less so by late treatment with mAbs (Fig. 5L). Although neither therapeutic intervention prevented weight loss, early treatment prevented systemic T cell lymphopenia, while later mAb administration had little effect, and a similar infiltration profile as untreated mice at 4dpi (Fig 5N, Extended Data Fig. 4K–M). These findings highlight efficacy of mAb treatment in controlling viral infection and viral titers but underline the need for early treatment to control immunopathology, as noted clinically73–75
Figure 5. Human monoclonal recombinant antibodies as prophylactic and therapeutic interventions impact disease outcome.
A. Viral titers measured by PFU in homogenized lung tissue at 4 dpi in MISTRG6-hACE2 mice that received prophylactic treatment of convalescent patient plasma or left untreated. Paired, two-tailed t-test. Untreated controls: n=6, convalescent treated group n=4 biologically independent mice examined over 2 independent experiments. Individual values for each mouse and means are presented.
B. Human immune cells at 4 dpi in lungs of MISTRG6-hACE2 mice that received prophylactic treatment of convalescent patient serum or left untreated. Paired, two-tailed t-test. Untreated controls: n=6, convalescent treated group n=4 biologically independent mice examined over 2 independent experiments. Individual values for each mouse and means are presented.
C. Human macrophages (hCD45+ hCD68+) at 4 dpi in lungs of MISTRG6-hACE2 mice that received prophylactic treatment of convalescent patient serum or left untreated. Paired, two-tailed t-test. Untreated controls: n=6, convalescent treated group n=4 biologically independent mice examined over 2 independent experiments. Individual values for each mouse and means are presented.
D. Viral RNA and viral titers measured by PFU in homogenized lung tissue at 4 dpi in MISTRG6-hACE2 mice that received prophylactic treatment of monoclonal antibody clone 135 (m135) or clone 144(m144) 8 hours prior to infection or left untreated (untd). N=6. Mann-Whitney, two-tailed test was used for comparison of viral RNA. One-sample Wilcoxon signed rank test was used to determine significance in the viral titer quantification (effect size=0.9, W=21).
E. Human immune cells in lungs of MISTRG6-hACE2 mice received a prophylactic treatment of monoclonal antibody clone 135 (m135) or clone 144(m144) 8 hours prior to infection or left untreated (untd). N=6 biologically independent mice examined over 2 independent experiments. Individual values for each mouse and means are presented. Unpaired t-test, two-tailed.
F. Human immune cells in BAL of MISTRG6-hACE2 mice received a prophylactic treatment of monoclonal antibody clone 135 (m135) or clone 144(m144) 8 hours prior to infection or left untreated (untd). Untreated control n=4, treated group n=5 biologically independent mice examined over 2 independent experiments. Individual values for each mouse and means are presented. Unpaired t-test, two-tailed.
G. Human immune lineages lungs and BAL of mAb treated or untreated mice at 4 dpi within the human CD45+ population. Classical monocytes (CD14+), Intermediate monocytes (CD14+CD16), non-classical monocytes (CD16+CD14-), macrophages (CD68+), NK cells (NKP46+), T cells (CD3+), B cells (CD19+ and/or CD20+). MISTRG6-hACE2 mice received a prophylactic treatment of monoclonal antibody clone 135 (m135) or clone 144(m144) 8 hours prior to infection or left untreated (untd). In lungs, N=6 biologically independent mice examined over 3 independent experiments. Individual values for each mouse and means are presented. In BAL, Untreated control N=4, treated group n=5 biologically independent mice examined over 2 independent experiments. Individual values for each mouse and means are presented. Unpaired t-test, two-tailed. Statistical significance was deemed by comparison to uninfected group. P values represented by: ns P > 0.05; *P ≤ 0.05; **P ≤ 0.01; ***P ≤ 0.001; **** P ≤ 0.0001. Only changes in frequencies of lung macrophages (m135 p value=0.029, m144 p value =0.037) and BAL macrophages (m144 p value =0.0042) and monocytes (CD16+ (m135 p value=0.0051, m144 p value=0.0058) were statistically significant.
H. Human macrophages (hCD45+ hCD68+) at 4 dpi in lungs and BAL of MISTRG6-hACE2 mice that received prophylactic treatment of mAbs (clone 135 or 144) or left untreated. Lungs: Untreated control N=6, treated group n=5 biologically independent mice examined over 3 independent experiments. BAL: Untreated control N=5, treated group n=4 biologically independent mice examined over 2 independent experiments. Individual values for each mouse and means are presented. Unpaired t-test, two-tailed.
I. Weight change in mAb treated mice (prophylaxis) at 2 and 4dpi plotted as percent change compared with original weight measured just before inoculation with SARS-CoV-2. N=6 biologically independent mice examined over 2 independent experiments. RM-one-way ANOVA with Dunnett’s multiple comparison test comparing weight change at 4dpi to untreated group was utilized. P-value for m144=0.01, p-value for m135=0.98. Individual values for each mouse and means are presented.
J. Viral RNA and viral titers measured by PFU in homogenized lung tissue at 4 dpi in MISTRG6-hACE2 mice that received post-infection treatment of a mixed cocktail of monoclonal antibodies clone 135 (m135) and clone 144(m144) or left untreated (untd). Early treatment groups were treated 11 hours post-infection and late treatment 35 hours post-infection. Mann-Whitney, two-tailed test was used for comparison of viral RNA. One-sample Wilcoxon signed rank test was used to determine significance in the viral titer quantification (effect size=0.9, W=21). Untreated control N=6, early and late treated groups n=5 biologically independent mice examined over 3 independent experiments. Individual values for each mouse and means are presented.
K. Human immune cells in lungs of MISTRG6-hACE2 mice that received early, late or no treatment of monoclonal antibody mix. Untreated control N=6, early and late treated groups n=5 biologically independent mice examined over 3 independent experiments. Individual values for each mouse and means are presented.
Unpaired, two-tailed t-test. P-values<0.05 are plotted.
L. Human immune cells in BAL of MISTRG6-hACE2 mice that received early, late or no treatment of monoclonal antibody mix. Untreated control N=4, early and late treated groups n=5 biologically independent mice examined over 3 independent experiments. Individual values for each mouse and means are presented.
Unpaired, two-tailed t-test. P-values<0.05 are plotted. Untreated control N=6, early and late treated groups n=5 biologically independent mice examined over 3 independent experiments. Individual values for each mouse and means are presented.
M. Weight change upon mAb therapeutic treatment at days and days post-infection plotted as percent change compared with original weight measured just before inoculation with SARS-Cov-2. N=6 biologically independent mice examined over 3 independent experiments. Individual values for each mouse and means are presented. One-way ANOVA (Šídák’s multiple comparisons test) comparing weight change at 4dpi to untreated group was utilized. Early treatment vs untreated p value=0.8 and late treatment vs untreated p value=0.49.
N. Human immune lineages lungs and BAL of mAb treated or untreated mice at 4 dpi within the human CD45+ population. Classical monocytes (CD14+), Intermediate monocytes (CD14+CD16), non-classical monocytes (CD16+CD14-), macrophages (CD68+), NK cells (NKP46+), T cells (CD3+), B cells (CD19+ and/or CD20+). MISTRG6-hACE2 mice received a prophylactic treatment of monoclonal antibody clone 135 (m135) or clone 144(m144) 8 hours prior to infection or left untreated (untd). Lung: untreated control N=6, early and late treated groups n=5 biologically independent mice examined over 3 independent experiments. Individual values for each mouse and means are presented. BAL: Untreated control N=4, early and late treated groups n=5 biologically independent mice examined over 3 independent experiments. Individual values for each mouse and means are presented. Statistical significance was deemed by unpaired t-test compared to uninfected group. P values represented by: ns P > 0.05; *P ≤ 0.05; **P ≤ 0.01; ***P ≤ 0.001; **** P ≤ 0.0001. Only changes in frequencies of monocytes (CD14+CD16+) were statistically significant (p value=0.01). Means with SD are plotted.
In Figure 5, MISTRG6 mice were engrafted with CD34+ cells neonatally isolated from at least 2 donors. Pooled or infection matched representative results of at least 2 independent experiments are presented. Only P-values <0.05 are shown. Mean with SD or individual values are plotted.
Accurate timing of corticosteroids is necessary to balance viral clearance and prevent immunopathology.
Our transcriptome analysis revealed glucocorticoids as possible upstream regulators of DEGs that are induced in infected lungs (Fig 4A, Table S3). Moreover, given that dexamethasone is thus far the only therapeutic treatment that has strongly impacted recovery and reduced mortality in patients with severe disease77, we hypothesized that dexamethasone treatment may attenuate immunopathology in mice infected with SARS-CoV-2. To test this hypothesis, we treated mice with dexamethasone for 3 days starting at 7dpi, when the immune infiltration is established but viral titers had declined in lungs (Extended Data Fig.5A). Mice treated with dexamethasone, recovered weight rapidly by 14dpi and resumed weight gain comparable to their uninfected counterparts (Fig. 6A,1D). Dexamethasone treatment reduced human immune infiltration and reversed immune-activation (Fig. 6B–I). Mouse neutrophils in BAL were fewer in dexamethasone treated mice (Extended Data Fig.5B), and inflammatory macrophages were largely absent from dexamethasone treated mouse lungs (Fig 6C–F). Alveolar macrophages, were restored post-therapy to a frequency similar to uninfected animals (Fig 6E,F). Dexamethasone also blocked accumulation of pDCs (Fig 6G) and reduced T cell activation in lungs (Fig 6H,I and Extended Data Fig.5C). Interestingly, dexamethasone treatment also blocked IgG but not IgM specific B cell responses (Extended Data Fig.5D–E). It was notable that lack of immune cells in dexamethasone treated lungs also correlated with lower viral RNA levels by 28dpi (Extended Data Fig.5F). As the immune infiltrate is established early (by 4dpi), we investigated the timing of dexamethasone mediated control of immunopathology for COVID-19. We treated mice early with dexamethasone for 3 days starting at 3dpi once the immune infiltration was established and viral titers were still high (Extended Data Fig.5G). In stark contrast to late treatment, early dexamethasone treated mice became moribund by 7dpi with rapidly declining weights compared with untreated mice (Fig. 6J). Dexamethasone-treated mice had significantly fewer immune cells infiltrating the lungs and lacked inflammatory macrophages (Fig. 6K, Extended Data Fig.5H). Notably, the disabled antiviral response in these mice led to significantly higher viral loads in the lungs (Fig. 6L). These deleterious consequences of early dexamethasone treatment highlight the importance of the early antiviral response to contain the viral infection. Careful exploration of differential timing of dexamethasone treatment distinguishes the early protective anti-viral response and the subsequent pathological immune response.
Figure 6. Accurate timing of corticosteroids is necessary to balance viral clearance and prevent immunopathology.
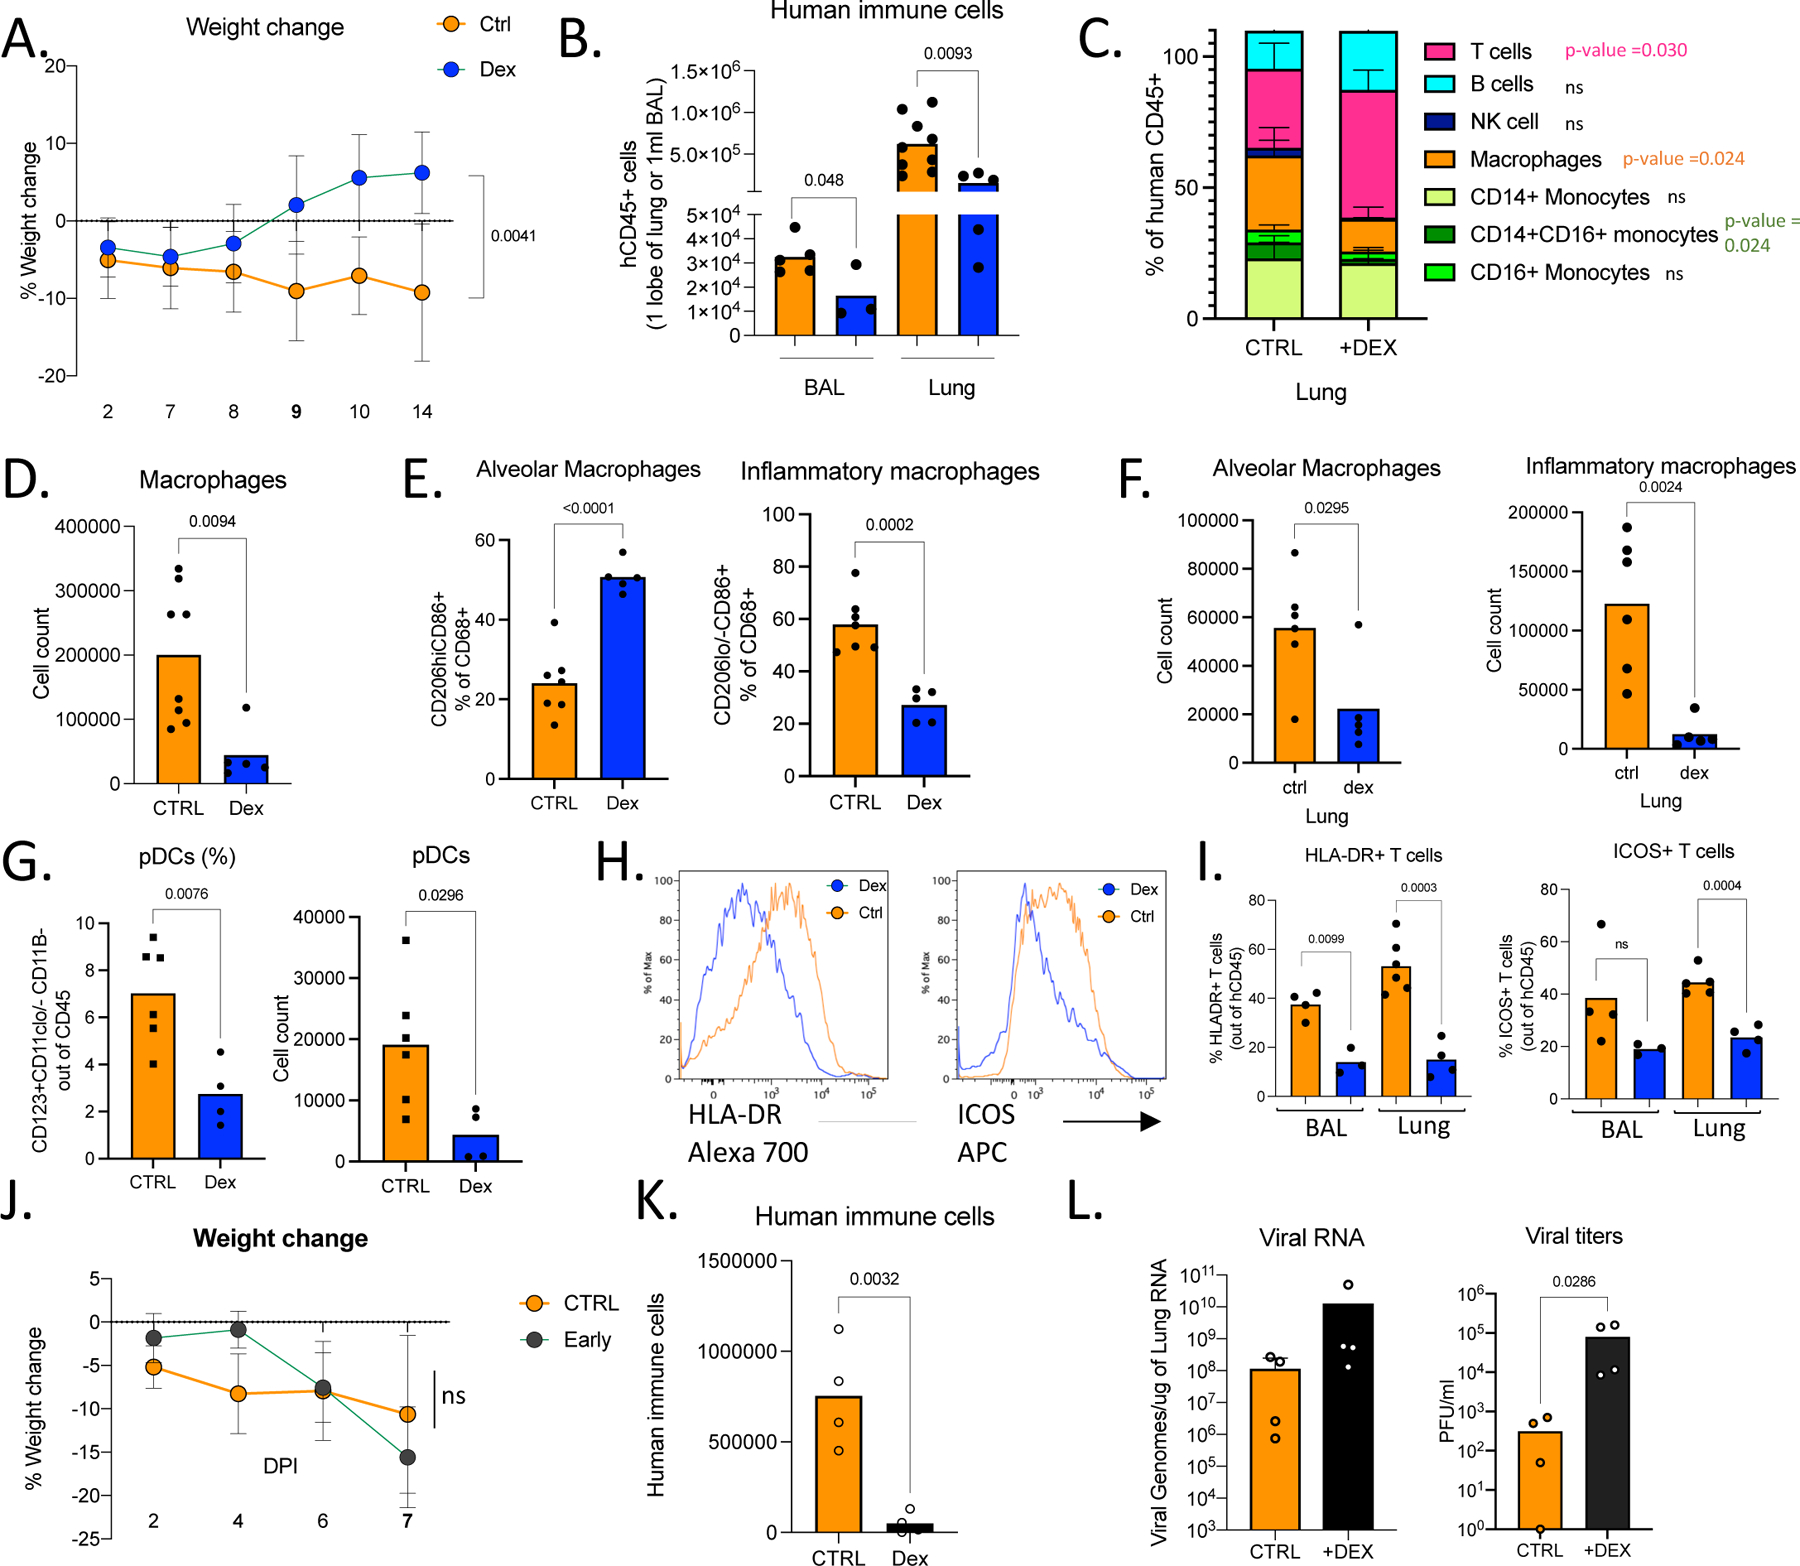
A. Weight change in dexamethasone treated or control mice during SARS-CoV-2 infection plotted as percent change compared with original weight prior to viral inoculation. Mice were treated with dexamethasone at 7,8,9 dpi. Untreated n=8, treated n=6 biologically independent mice examined over 3 independent experiments. Unpaired, two-tailed t-test determined comparing 14dpi values (p=0.0041). Means with SD are plotted.
B. Human immune cells in 14dpi lungs and BAL of MISTRG6-hACE2 mice treated with dexamethasone at 7, 8 9 dpi or left untreated. Untreated n=8, treated n=6 biologically independent mice examined over 3 independent experiments. Unpaired, two-tailed t-test. Individual values for each mouse and means are plotted.
C. Human immune lineages lungs of dexamethasone treated or untreated mice within the human CD45+ population. Classical monocytes (CD14+), Intermediate monocytes (CD14+CD16), non-classical monocytes (CD16+CD14-), macrophages (CD68+), NK cells (NKP46+), T cells (CD3+), B cells (CD19+ and/or CD20+). MISTRG6-hACE2 mice were treated with dexamethasone at 7,8,9dpi. N=4–6. Unpaired, two-tailed t-test.
Untreated n=6, treated n=5 biologically independent mice examined over 3 independent experiments. Means with SD are plotted.
D. Number of human macrophages in lungs of dexamethasone treated and untreated mice at 14dpi. N=6. Unpaired, two-tailed t-test. Untreated n=8, treated n=5 biologically independent mice examined over 3 independent experiments. Individual values for each mouse and means are plotted.
E. Frequencies of alveolar or inflammatory macrophages in the lungs of MISTRG6-hACE2 mice that were treated with dexamethasone or left untreated. N=6. Unpaired, two-tailed t-test. Untreated n=7, treated n=5 biologically independent mice examined over 3 independent experiments. Individual values for each mouse and means are plotted.
F. Numbers of alveolar or inflammatory macrophages in the lungs of MISTRG6-hACE2 mice that were treated with dexamethasone or left untreated. N=6. Unpaired, two-tailed t-test. Untreated n=6, treated n=5 biologically independent mice examined over 3 independent experiments. Individual values for each mouse and means are plotted.
G. Frequencies (left) and numbers (right) of pDCs at 14dpi in the lungs of dexamethasone treated or control mice. N=6. Unpaired, two-tailed t-test. Untreated n=5, treated n=4 biologically independent mice examined over 3 independent experiments. Individual values for each mouse and means are plotted.
H. Representative histograms for HLA-DR expression in lung T cells at 14dpi in dexamethasone treated or control mice. N=6. Unpaired, two-tailed t-test. Representative of n=4 for examined over 2 independent experiments. All attempts resulted with similar findings.
I. Frequencies of HLA-DR+ or ICOS+ T cells at 14dpi in the lungs and BAL of dexamethasone treated or control mice. N=4–6. Unpaired, two-tailed t-test. Lung: untreated n=5, treated n=4 biologically independent mice examined over 3 independent experiments. BAL: untreated n=4, treated n=3 biologically independent mice examined over 3 independent experiments. Individual values for each mouse and means are plotted.
J. Weight change in dexamethasone treated or control mice during SARS-CoV-2 infection plotted as percent change compared with original weight prior to viral inoculation. Mice were treated with dexamethasone at 3,4,5dpi. Untreated n=6, treated n=4 biologically independent mice examined over 2 independent experiments. Unpaired, two-tailed t-test. Means with SD are plotted.
K. Human immune cells in lungs of MISTRG6-hACE2 mice treated with dexamethasone at 3, 4 5 dpi or left untreated (ctrl). N= 4 biologically independent mice examined over 2 independent experiments. Unpaired, two-tailed t-test. Individual values for each mouse and means are plotted
L. Viral RNA and viral titers measured by PFU in homogenized lung tissue at 7 dpi in dexamethasone treated or control mice. N= 4 biologically independent mice examined over 2 independent experiments. Unpaired, two-tailed t-test. Individual values for each mouse and means are plotted. Mann-Whitney test, two-tailed.
MISTRG6 mice were engrafted with CD34+ cells neonatally isolated from at least 2 donors. Pooled or infection matched representative results of at least 2 independent experiments are presented. Only P-values <0.05 are plotted. Mean with SD or individual values are plotted.
Discussion:
Here, we present a humanized COVID-19 mouse model that combines vector-based delivery of hACE2 and a comprehensive human immune system that recapitulates both innate and adaptive human immunity during SARS-CoV-2 infection. Our model supports chronic disease and enables characterization of the effects of patient-derived antibodies and identification of the sources of immunopathology, in particular the aberrant macrophage response.
Limitations of our model include significant variability between individual animals and to a lesser degree between cohorts. Many parameters may contribute to variability. While each cohort is engrafted with HSPCs from the same donor, the degree of engraftment varies between individual animals and thus each individual animal tested is unique in its baseline human immune system. Different cohorts are engrafted with cells from different donors; thus, there is genetic variability between different cohorts which can be exploited in the future. In this study, we utilized 11 different donors as sources of HSPCs. Further variability can result from experimental differences with the amount of AAV administration and efficiency of cellular infection. Transcriptome analysis revealed differences between individual animals in the strength of the inflammatory response, which may also explain the variable outcome observed in disease outcome in human SARS-CoV-2 infection78. Yet, regardless of such heterogeneity, sustained interferon response, as has been postulated in humans13,48,49,57, was a common theme that shaped both early anti-viral innate response and late adaptive immune response in humanized COVID-19.
Sustained viral RNA and gross clinical features including failure to recover body weight and severe lung pathology even at very late time points post-infection, are unique among animal models to our MISTRG6 model, with human immune cells and hACE2 expression, which suggests a potential unique contribution of human immune cells to pathology and/or viral RNA persistence. Human immune cells could produce various factors that may impact infected cells, infection dynamics, or be targets of infection themselves. In human lung autopsies, SARS-CoV-2 genomes have been detected in alveolar macrophages56 which express ACE2. We also have detected viral RNA in sorted human immune cells (hCD45+), specifically in sorted hCD45+CD11b+ cells, enriched for human macrophages, but it is not clear whether RNA detected here is the result of viral replication or a residue of phagocytosed infected epithelial cells. Viral titers measured using sensitive cell culture systems were detectable throughout the duration of disease in engrafted MISTRG6-hACE2 mice. Although lung sampling of viable virus is largely lacking in humans, a few patients with severe disease had positive SARS-CoV-2 culture beyond the acute 10-day window post-symptom onset79–86. Chronic disease manifestations reflected in histopathological abnormalities (significant cellular infiltrates, thickened septa, and collagen deposition) of infected humanized lungs late in infection point to lack of recovery and fibrosis, recapitulating severe human COVID-19 lung pathology. To our knowledge, no other COVID-19 disease model recapitulates the chronic weight loss, sustained high viral RNA and chronic histopathology with pulmonary fibrosis as seen in human patients (Extended Data Fig.1)4,14–19,21,25,38,40–42,87. Nonetheless, chronic, humanized COVID-19 is not a lethal disease, which will stimulate further investigation of variables such as age, pre-existing health conditions and co-morbidities that contribute to high case fatality rate in humans.
Systemic T cell lymphopenia was another common feature of humanized COVID-19 and human disease 11,12,53. Systemic, cyclical lymphopenia that follows rapid, strong activation of T cells in the infected lungs suggest that T cells are continuously recruited, activated, and consumed in the lungs of infected MISTRG6-hACE2 mice. In matched samples, we looked for genes in the lung transcriptome that correlate with spleen T cell frequencies to link systemic lymphopenia to transcriptional changes in lungs. Frequencies of splenic T cells negatively correlated with human expression of genes such as HIF1A, UBAP2L, MIF, FABP7 (Table S4) suggesting inflammation and stress response in lungs, possibly mediated by lung macrophages, may impact systemic lymphopenia. Genes that correlated with systemic lymphopenia were also enriched for ISGs (30/50 top correlating human genes and 26/50 top correlating mouse genes) and suggest some potential therapeutic targets to improve lymphopenia in patients.
MISTRG6-hACE2 mice allowed the study of two aspects of the immune response: infectious viral clearance and immunopathology. We first evaluated patient-derived human antibodies to study this separation. Despite efficient viral clearance, as measured by sharply reduced viral titers, and lack of antibody mediated enhancement of disease, mAbs when given late did not help prevent the potentially pathological inflammatory response suggesting the players of immune-pathology such as the inflammatory macrophages are recruited very early in infection. Our preclinical data are similar to the clinical experience of more than 20 SARS-CoV-2 specific monoclonal antibodies currently in different stages of clinical trial testing73–75. Results so far also support a reduction in viral load upon mAb treatment73. Notably, the antibodies prevent hospitalization and death if administered early. Our model could be particularly useful in evaluating efficacy and timing for these antibodies75. When administered in a timely manner mAbs could be particularly useful in protecting uninfected individuals and preventing transmission from an infected person by rapid clearance of infectious virus.
Separating the two aspects of the immune response, infectious viral clearance and immunopathology recapitulated in our model, may prove useful in the control of COVID-19. Patients may benefit from early mAb treatment coupled with dexamethasone later in infection. Our data suggest that glucocorticoids, specifically dexamethasone, (decoded as upstream regulators of the inflammatory gene signature in humanized COVID-19) should be considered only when viral titers are undetectable, suggesting timing is crucial in promoting immune-protection while preventing pathology and highlighting the importance of accurate and frequent viral detection methods. When applied to chronic disease dexamethasone effectively controls immunopathology and reverses COVID-19 morbidity. As expected, dexamethasone treatment has broad effects and reverses many aspects of immune-activation. Yet, non-specific suppression of the immune system using dexamethasone early in infection was catastrophic.
Even in the absence of previously described high risk criteria, there are debilitating effects among certain COVID-19 patient groups. Although socio-economic factors may be responsible for some or all of these effects, perturbation of the proposed system should allow testing of direct medical effects. Our humanized mouse system can be completely personalized by matching patient HSPCs with antibodies and medical history, allowing testing novel therapeutics to address conflicting reports in pre-clinical models and to predict efficacy in patients.
Materials and Methods
Mice
MISTRG6 was generated by the R. Flavell laboratory by combining mice generated by this lab, the laboratory of Markus Manz and Regeneron Pharmaceuticals based on the Rag2−/− IL2rg-/−129xBalb/c background supplemented with genes for human M-CSF, IL-3, SIRPα, thrombopoietin, GM-CSF and IL6 knocked into their respective mouse loci 29,88. MISTRG6 mice are deposited in Jackson Laboratories and made available to academic, non-profit, and governmental institutions under a Yale-Regeneron material transfer agreement (already approved and agreed to by all parties). Instructions on obtaining the material transfer agreement for this mouse strain will be available along with strain information and upon request. Unconstituted MISTRG6 mice were maintained with cycling treatment with enrofloxacin in the drinking water (Baytril, 0.27 mg/ml). CD1 strain of mice acquired from Charles River Laboratories were used for cross-fostering of MISTRG6 pups upon birth to stabilize healthy microbiota. C57Bl/6 strain of mice (available in Jackson Laboratories) were used as controls for infection with SARS-Cov-2. All mice were maintained under specific pathogen free conditions in our animal facilities (either Biosafety Level 1, 2 or 3) under our Animal Studies Committee-approved protocol. Mice were housed in 14-hour light and 10-hour dark cycle maintained at 40–60% humidity and 72 degrees F +/− 2 degrees. All animal experimentations were performed in compliance with Yale Institutional Animal Care and Use Committee protocols. For SARS- CoV-2–infected mice, all procedures were performed in a BSL-3 facility with approval from the Yale Institutional Animal Care and Use Committee and Yale Environmental Health and Safety.
Transplantation of human CD34+ hematopoietic progenitor cells into mice.
Fetal liver samples were cut in small fragments, treated for 45 min at 37°C with collagenase D (Roche, 200 μg/ml), and prepared into a cell suspension. Human CD34+ cells were purified by performing density gradient centrifugation (Lymphocyte Separation Medium, MP Biomedicals), followed by positive immunomagnetic selection with EasySep™ Human CD34 Positive Selection Kit (Stemcell). For intra-hepatic engraftment, newborn 1–3 day-old pups were injected with 20,000 fetal liver CD34+ cells in 20 μl of PBS were injected into the liver with a 22-gauge needle (Hamilton Company). All use of human materials was approved by the Yale University Human Investigation Committee.
AAV-hACE2 administration
AAV9 encoding hACE2 was purchased from Vector Biolabs (AAV9-CMV-hACE2). Animals were anaesthetized using isoflurane. The rostral neck was shaved and disinfected. A 5-mm incision was made, and the trachea was visualized. Using a 32-G insulin syringe, a 50-μl injection dose of 1011 genomic copies per milliliter of AAV-CMV-hACE2 was injected into the trachea. The incision was closed with 4–0 Vicryl suture and/or 3M Vetbond tissue adhesive. Following administration of analgesic animals were placed in a heated cage until full recovery. Mice were then moved to BSL-3 facilities for acclimation.
SARS-CoV-2 infection
SARS-CoV-2 isolate USA-WA1/2020 was obtained from BEI reagent repository. All infection experiments were performed in a Biosafety Level 3 facility, licensed by the State of Connecticut and Yale University. Mice were anesthetized using 20% vol/vol isoflurane diluted in propylene glycol. Using a pipette, 50 μl of SARS-CoV-2 (1–3×10⁶ PFU) was delivered intranasally.
Therapeutics
MISTRG6-hACE2 mice received prophylactic treatment of convalescent plasma (5ml/kg) or monoclonal antibodies at 10mg/kg (clone 135 -m135 or clone 144-m144) 8 hours prior to infection. SARS-CoV-2 infected MISTRG6-hACE2 mice received a mixed cocktail of monoclonal antibodies clone 135 (m135) and clone 144(m144) at 20mg/kg at 11 hours post-infection for early treatment and 35 hours post-infection for late treatment. SARS-CoV-2 infected MISTRG6-hACE2 were treated with dexamethasone (Sigma) at 10mg/kg for 3 days starting at 7dpi.
Viral titers
Mice were euthanized in 100% isoflurane. Approximately half of the right lung lobe was placed in a bead homogenizer tube with 1 ml of PBS + 2% FBS. After homogenization, 300 μl of this mixture was placed in 1mL Trizol (Invitrogen) for RNA extraction and analysis. Remaining volume of lung homogenates was cleared of debris by centrifugation (3,900 g for 10 min). Infectious titers of SARS-CoV-2 were determined by plaque assay in Vero E6 (standard) or Vero ACE2+TMPRSS2+ (sensitive) cells in DMEM 4% FBS, and 0.6% Avicel RC-58189. Plaques were resolved at 48 h after infection by fixing in 10% formaldehyde for 1 hour followed by staining for 1 hour in 0.5% crystal violet in 20% ethanol. Plates were rinsed in water to visualize plaques. Multiple dilutions of lung homogenates were used to quantify Infectious titers (minimum number of plaques that can be quantified per ml of lung homogenate=10).
Viral RNA analysis
RNA was extracted with the RNeasy mini kit (Qiagen) per the manufacturer’s protocol. SARS-CoV-2 RNA levels were quantified using the Luna Universal Probe Onestep RT-qPCR kit (New England Biolabs) and US CDC real-time RT-PCR primer/probe sets for 2019-nCoV_N1. For each sample, 1 ug of RNA was used.
Histology
Yale pathology kindly provided assistance with embedding, sectioning of lung tissue. A pulmonary pathologist reviewed the slides blinded and identified immune cell infiltration and other related pathologies.
Isolation of cells and flow cytometry
All mice were analyzed at approximately 9–11 weeks of age. Single cell suspensions were prepared from blood, spleen BAL and lung. Mice were euthanized with 100% isoflurane. BAL was performed using standard methods with a 22G Catheter (BD). Blood was collected either retro-orbitally or via cardiac puncture following euthanasia. BAL was performed using standard methods with a 22G Catheter (BD)90. Lungs were harvested, minced, and incubated in a digestion cocktail containing 1 mg/ml collagenase D (Sigma) and 30 μg/ml Dnase I (Sigma-Aldrich) in RPMI at 37°C for 20 min. Tissue was then filtered through a 70-μm filter. Cells were treated with ammonium- chloride-potassium buffer and resuspended in PBS with 1% FBS. Mononuclear cells were incubated at 4C with human (BD) and mouse (BioxCell, BE0307) Fc block for 10 min. After washing, primary antibody staining was performed at 4C for 20 min. After washing with PBS, cells were fixed using 4% paraformaldehyde. For intracellular staining, cells were washed with BD permeabilization buffer and stained in the same buffer for 45 min at room temperature. Samples were analyzed on an LSRII flow cytometer (BDBiosciences). Data were analyzed using FlowJo software 3.2 and plotted using Prism 9 Version 9.2.0 (283).
Adoptive T cell transfer
Infected lungs (14dpi) were processed as described before. Cells were stained with antibodies against human CD45, human/mouse CD11B, human CD3 and mouse CD45. Lung T cells (humanCD45+ mouseCD45- CD11B-CD3+cells) were sorted using BD-Aria Cell Sorter in a Biosafety Level 3 facility. Sorted T cells (10,000) were mixed with total splenocytes (10 million) and injected intravenously to unengrafted MISTRG6-hACE2 mice. These mice were then infected as described before and analyzed at 4dpi.
Antibodies
Antibodies against the following antigens were used: Mouse antigens: CD45 (Clone: 30-F11), Ly6G (1A8), Ly6C (HK1.4), CD31(MEC13.3), CD326 (G8.8); Human antigens: CD45 (HI30), CD3 (UCHT1), CD14 (HCD14), CD16 (3G8), CD19 (HIB19), CD33 (WM53), CD20 (2H7), CD206 (15–2), CD86 (BU63), CD123(6H6), IGM (MHM-88), IGG(M1310G05) CD163 (GHI/61), CD169(7–239) CD68(Y1/82A), CD11B (M1/70), CD11C (3.9), HLA-DR(LN3), CD183 (G025H7), ICOS(C398.4A), PD1 (A17188B), NKp46 (9E2), CD56(MEM-188), CD4(OKT4), CD8(SK1), TCRGD(B1), CCR7(G043H7), CD83(HB15e). All antibodies were obtained from Biolegend, unless otherwise specified.
Details on antibodies were provided as Antigen(clone)/ Fluorochrome/ Supplier/ Catalogue number/ Concentration. Mouse antigens: CD45 (30-F11) PerCP Biolegend 103130 1:200; CD45 (30-F11) FITC Biolegend 103108 1:200; CD45 (30-F11) Brilliant Violet (BV) 711 Biolegend 103147 1:400; Ly6G (1A8) APC/Cyanine7 Biolegend 127624 1:100; Ly6C (HKl.4) BV605 Biolegend 128036 1:400; CD31(MEC13.3) APC/Cyanine7 Biolegend 102507 1:400; CD326 (G8.8) APC/Cyanine7 Biolegend 118218 1:200
Human antigens: CD45(Hl30) BV605 Biolegend 304044 1:100; CD45(Hl30) Pacific Blue Biolegend 304029 1:100; CD3(UCHT1) PE Biolegend 300408 1:200; CD14(HCD14) APC/Cyanine7 Biolegend 325620 1:100; CD16(3G8) PerCP Biolegend 302030 1:200; CD16(3G8) FITC Biolegend 302006 1:100; CD19(HIB19) APC/Cyanine7 Biolegend 302218 1:100; CD19(HIB19) Alexa Fluor 700 Biolegend 302226 1:100; CD33(WM53) APC Biolegend 983902 1:100; CD20(2H7) APC/Cyanine7 Biolegend 302313 1:100; CD20(2H7) Alexa Fluor 700 Biolegend 302322 1:100; CD206(15–2) PE Biolegend 321106 1:100; CD206(15–2) APC Biolegend 321109 1:100; CD86(BU63) PE/Cyanine7 Biolegend 374210 1:100; CD123(6H6) PE Biolegend 306006 1:100; IGM(MHM-88) APC Biolegend 314510 1:100; IGM(MHM-88) APC/Cyanine7 Biolegend 314520 1:100; IGG(M1310G05) APC Biolegend 410712 1:100; IGG(M1310G05) APC/Cyanine7 Biolegend 410732 1:100; CD169(7–239) APC Biolegend 346007 1:100; CD11B(M1/70) BV711 Biolegend 101242 1:100; CD11C(3.9) PE/Cyanine7 Biolegend 301608 1:200; HLA-DR(LN3) Alexa Fluor 700 Biolegend 327014 1:100; HLA-DR(LN3) PerCP Biolegend 327020 1:400; HLA-DR(LN3) FITC Biolegend 327005 1:100; CD183(G025H7) PE/Cyanine7 Biolegend 353720 1:100; ICOS(C398.4A) APC Biolegend 313510 1:100; CD279-PD1(A17188B) APC/Cyanine7 Biolegend 1:100; CD335-NKp46(9E2) PE/Cyanine7 Biolegend 331916 1:100; CD56(MEM-188) APC Biolegend 304610 1:100; CD56(MEM-188) Pacific Blue Biolegend 304629 1:50; CD4(OKT4) BV711 Biolegend 317440 1:100; CD8(SK1) Pacific Blue Biolegend 344718 1:100; CD8(SK1) BV421 Biolegend 344748 1:200; TCRGD(B1) FITC Biolegend 331208 1:100; CD163(GHl/61) APC Biolegend 333610 1:100; CD68(Yl/82A) BV421 Biolegend 333828 1:200; CD83(HB15) APC Biolegend 305311 1:100; CCR7(G043H7) PE/Cyanine7 Biolegend 353226 1:100; Convalescent plasma and monoclonal antibodies (clone 135 and 144) were acquired from M. Nussenzweig as has been previously described72.
Bulk whole tissue lung RNA-sequencing
RNA isolated from homogenized lung tissue used for viral RNA analysis was also used for whole tissue transcriptome analysis. Libraries were made with the help of the Yale Center for Genomic Analysis. Briefly, libraries were prepared with an Illumina rRNA depletion kit and sequenced on a NovaSeq. Raw sequencing reads were aligned to the human-mouse combined genome with STAR [citation: https://doi.org/10.1093/bioinformatics/bts635], annotated and counted with HTSeq [citation: https://doi.org/10.1093/bioinformatics/btu638], normalized using DESeq2 [citation: https://doi.org/10.1186/s13059–014-0550–8], and graphed using the Broad Institute Morpheus web tool. Differential expression analysis was also performed with DESeq2. For IFN-stimulated gene identification, http://www.interferome.org was used with parameters -In Vivo, -Mus musculus or Homo sapiens -fold change up 2 and down 2. Corresponding pathway analysis of differentially expressed mouse and human genes was achieved using multiple platforms (Gene Ontology (GO), Gene Set Enrichment analysis (GSEA), Ingenuity).
ELISA
IFNα (Sigma) ELISAs were performed based on manufacturer’s instruction using serum and BAL fluid from uninfected and infected mice. In short, Triton X-100 and Rnase A were added to serum and BAL samples at final concentrations of 0.5% and 0.5 mg/ml, respectively, and incubated at room temperature (RT) at least 1 hour before use to reduce risk from any potential virus in serum and BAL. For serum IFNA levels, 20uL of serum and for BAL IFNA levels, 100uL of BAL fluid were used.
Gene expression:
RNA from whole tissue samples was extracted with the Rneasy mini kit (Qiagen) per the manufacturer’s protocol RNA from sorted human immune cells (human CD45+), plasmacytoid dendritic cells (PDCs; CD123hi CD11B-), macrophages and monocytes (CD11B+) and rest of human immune cells (CD123-CD11B-CD45+) was extracted using Trizol reagent. Expression was normalized to human ACTB or HPRT1. Individual values and means were plotted. High-Capacity cDNA Reverse Transcription Kit was used to make cDNA. Quantitative reverse transcription PCR (qRT-PCR) was performed using an SYBR FAST universal qPCR kit (KAPA Biosystems). Predesigned KiCqStart primers for IFNA1, IFNA2, IFNA6, IFNA8, IFNA14, IFNA21, IFNB, IFNG, HPRT1, ACE2, Ace2, Hprt1 were purchased from Sigma.
Single Cell RNA Sequencing 10X Genomics
Single cell suspensions from digested lungs were processed for droplet based scRNA-seq and 10000 cells were encapsulated into droplets using 10X Chromium GEM technology. Libraries were prepared in house using Chromium Next GEM Single Cell 3ʹ Reagent Kits v3.1 (10X Genomics). scRNA-seq libraries were sequenced using Nova-Seq. Raw sequencing reads were processed with Cell Ranger 3.1.0 using a human-mouse combined reference to generate a gene cell count matrix. To distinguish human and mouse cells, we counted the number of human genes (nHuman) and mouse genes (nMouse) with nonzero expression in each cell, and selected cells with nHuman > 20 * nMouse as human cells. The count matrix of human cells and human genes was used in the downstream analysis with Seurat 3.291. Specifically, this matrix was filtered retaining cells with > 200 and < 5,000 genes and < 20% mitochondria transcripts. We then log transformed each entry of the matrix by computing log (CPM/100 + 1), where CPM stands for counts per million. To visualize the cell subpopulations in two dimensions, we applied principal component analysis followed by t-SNE, a nonlinear dimension reduction method, to the log-transformed data. Graph-based clustering was then used to generate clusters that were overlaid on the t-SNE coordinates to investigate cell subpopulations. Marker genes for each cluster of cells were identified using the Wilcoxon test with Seurat. For the adjusted P values the Bonferroni correction was used.
Statistical Analysis
Unpaired or paired t-test was used to determine statical significance for changes in immune cell frequencies and numbers while comparing infected mice to uninfected control mice. For experiments where mice were treated with monoclonal antibodies or steroids, one-way ANOVA was used to determine statistical significance across groups and adjusted p value was reported. To determine whether the viral RNA quantification is statistically significant across treatment groups or time points, Mann-Whitney, two-tailed test was used. A one-sample Wilcoxon signed rank test was used as a non-parametric alternative to the one sample t-test to determine whether the viral titer quantification of the untreated condition is significantly different from an undetectable viral load (i.e., viral titer = 0). Note that our data cannot be assumed to be normally distributed. The results indicate there is a significant difference between the untreated and mAb treated mice (e.g., early, late, or prophylactic treatment). For these analyses, we also calculated the effect size (e.g., r = 0.90 (large effect size), V = 21, p-value = 0.03).
Extended Data
Extended Data Figure 1: Comparison of COVID-19 parameters and response to therapeutics in human patients, humanized mice, and other animal models.
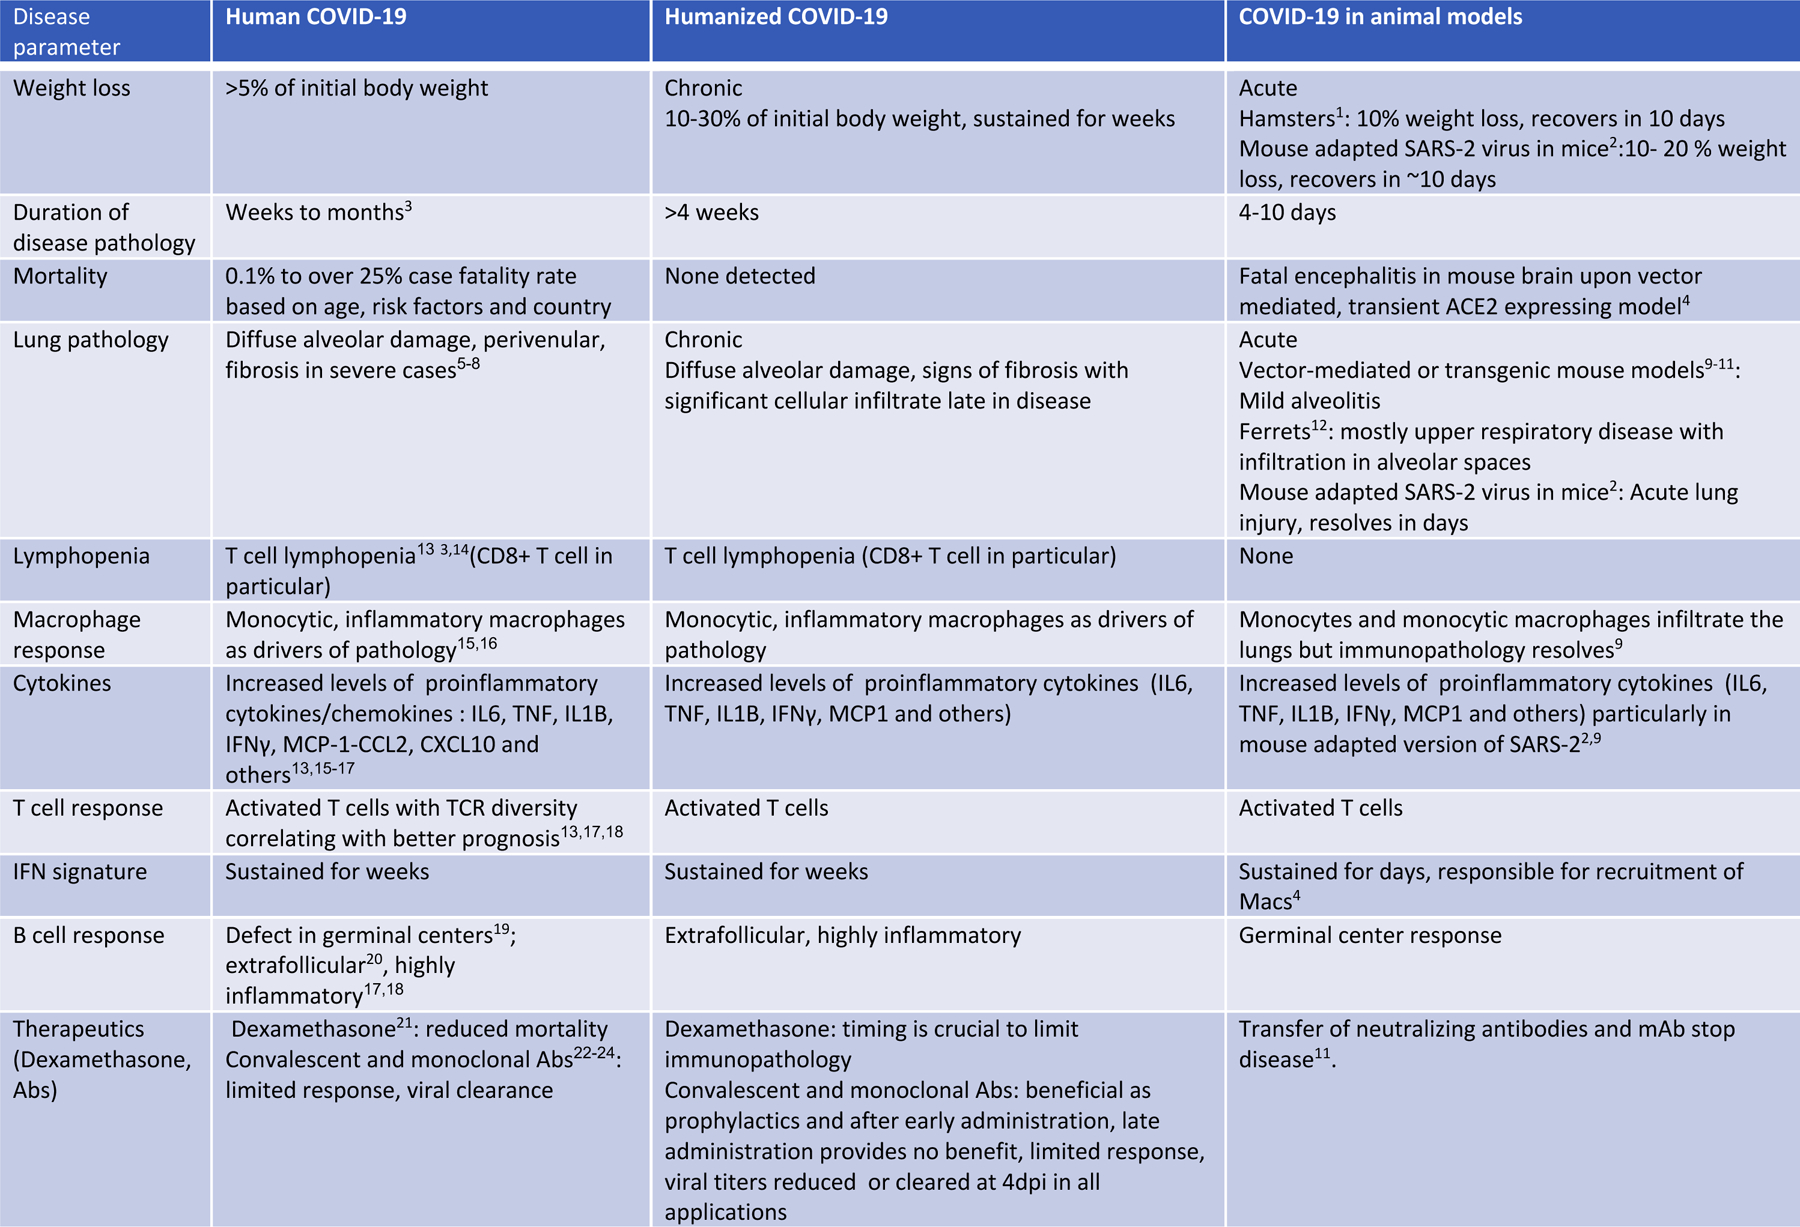
Although substantial anti-viral immunity mediates viral clearance in non-severe COVID-192, robust inflammatory cytokine production, decreased circulating lymphocytes and failure to generate germinal centers characterizes the immunopathology in severe COVID-19 2–4.Dysregulated myeloid5–8 and lymphocyte9–12,56 compartments, including monocytes, macrophages, neutrophils, NK cells and antibody secreting B cells, have been described as players in the observed lung immunopathology of COVID-19. Accurate model systems are essential to rapidly evaluate promising discoveries but most models currently available in mice, ferrets and hamsters do not recapitulate sustained immunopathology described in COVID-19 patients. The following table summarizes various aspects of the human disease and how well these are recapitulated in existing animal models of COVID-19 and in our humanized mouse model of COVID-19.
References:
1 Imai, M. et al. Syrian hamsters as a small animal model for SARS-CoV-2 infection and countermeasure development. Proceedings of the National Academy of Sciences 117, 16587–16595 (2020).
2 Dinnon, K. H. et al. A mouse-adapted model of SARS-CoV-2 to test COVID-19 countermeasures. Nature 586, 560–566 (2020).
3 Huang, C. et al. Clinical features of patients infected with 2019 novel coronavirus in Wuhan, China. The Lancet 395, 497–506, doi:10.1016/S0140–6736(20)30183–5 (2020).
4 Song, E. et al. Neuroinvasion of SARS-CoV-2 in human and mouse brain. Journal of Experimental Medicine 218 (2021).
5 Tian, S. et al. Pathological study of the 2019 novel coronavirus disease (COVID-19) through postmortem core biopsies. Modern Pathology, 1–8 (2020).
6 Menter, T. et al. Postmortem examination of COVID-19 patients reveals diffuse alveolar damage with severe capillary congestion and variegated findings in lungs and other organs suggesting vascular dysfunction. Histopathology 77, 198–209 (2020).
7 Barton, L. M., Duval, E. J., Stroberg, E., Ghosh, S. & Mukhopadhyay, S. Covid-19 autopsies, oklahoma, usa. American Journal of Clinical Pathology 153, 725–733 (2020).
8 Xu, Z. et al. Pathological findings of COVID-19 associated with acute respiratory distress syndrome. The Lancet. Respiratory medicine 8, 420–422, doi:10.1016/S2213–2600(20)30076-X (2020).
9 Israelow, B. et al. Mouse model of SARS-CoV-2 reveals inflammatory role of type I interferon signaling. J Exp Med 217, doi:10.1084/jem.20201241 (2020).
10 Sun, S.-H. et al. A mouse model of SARS-CoV-2 infection and pathogenesis. Cell Host & Microbe (2020).
11 Hassan, A. O. et al. A SARS-CoV-2 infection model in mice demonstrates protection by neutralizing antibodies. Cell 182, 744–753. e744 (2020).
12 Ter Meulen, J. et al. Human monoclonal antibody as prophylaxis for SARS coronavirus infection in ferrets. The Lancet 363, 2139–2141 (2004).
13 Mathew, D. et al. Deep immune profiling of COVID-19 patients reveals distinct immunotypes with therapeutic implications. Science 369 (2020).
14 Tan, L. et al. Lymphopenia predicts disease severity of COVID-19: a descriptive and predictive study. Signal transduction and targeted therapy 5, 1–3 (2020).
15 Zhang, J.-Y. et al. Single-cell landscape of immunological responses in patients with COVID-19. Nature immunology 21, 1107–1118 (2020).
16 Liao, M. et al. Single-cell landscape of bronchoalveolar immune cells in patients with COVID-19. Nature medicine, 1–3 (2020).
17 Lucas, C. et al. Longitudinal analyses reveal immunological misfiring in severe COVID-19. Nature 584, 463–469 (2020).
18 Chen, Z. & Wherry, E. J. T cell responses in patients with COVID-19. Nature Reviews Immunology, 1–8 (2020).
19 Kaneko, N. et al. Loss of Bcl-6-expressing T follicular helper cells and germinal centers in COVID-19. Cell 183, 143–157. e113 (2020).
20 Woodruff, M. C. et al. Extrafollicular B cell responses correlate with neutralizing antibodies and morbidity in COVID-19. Nature immunology 21, 1506–1516 (2020).
21 Group, R. C. Dexamethasone in hospitalized patients with Covid-19—preliminary report. New England Journal of Medicine (2020).
22 Cruz-Teran, C. et al. Challenges and opportunities for antiviral monoclonal antibodies as COVID-19 therapy. Advanced Drug Delivery Reviews (2020).
23 Casadevall, A. & Pirofski, L.-a. The convalescent sera option for containing COVID-19. The Journal of clinical investigation 130 (2020).
24 Chen, P. et al. SARS-CoV-2 neutralizing antibody LY-CoV555 in outpatients with Covid-19. New England Journal of Medicine (2020).
Extended data Figure 2 (matched to Figure 3):
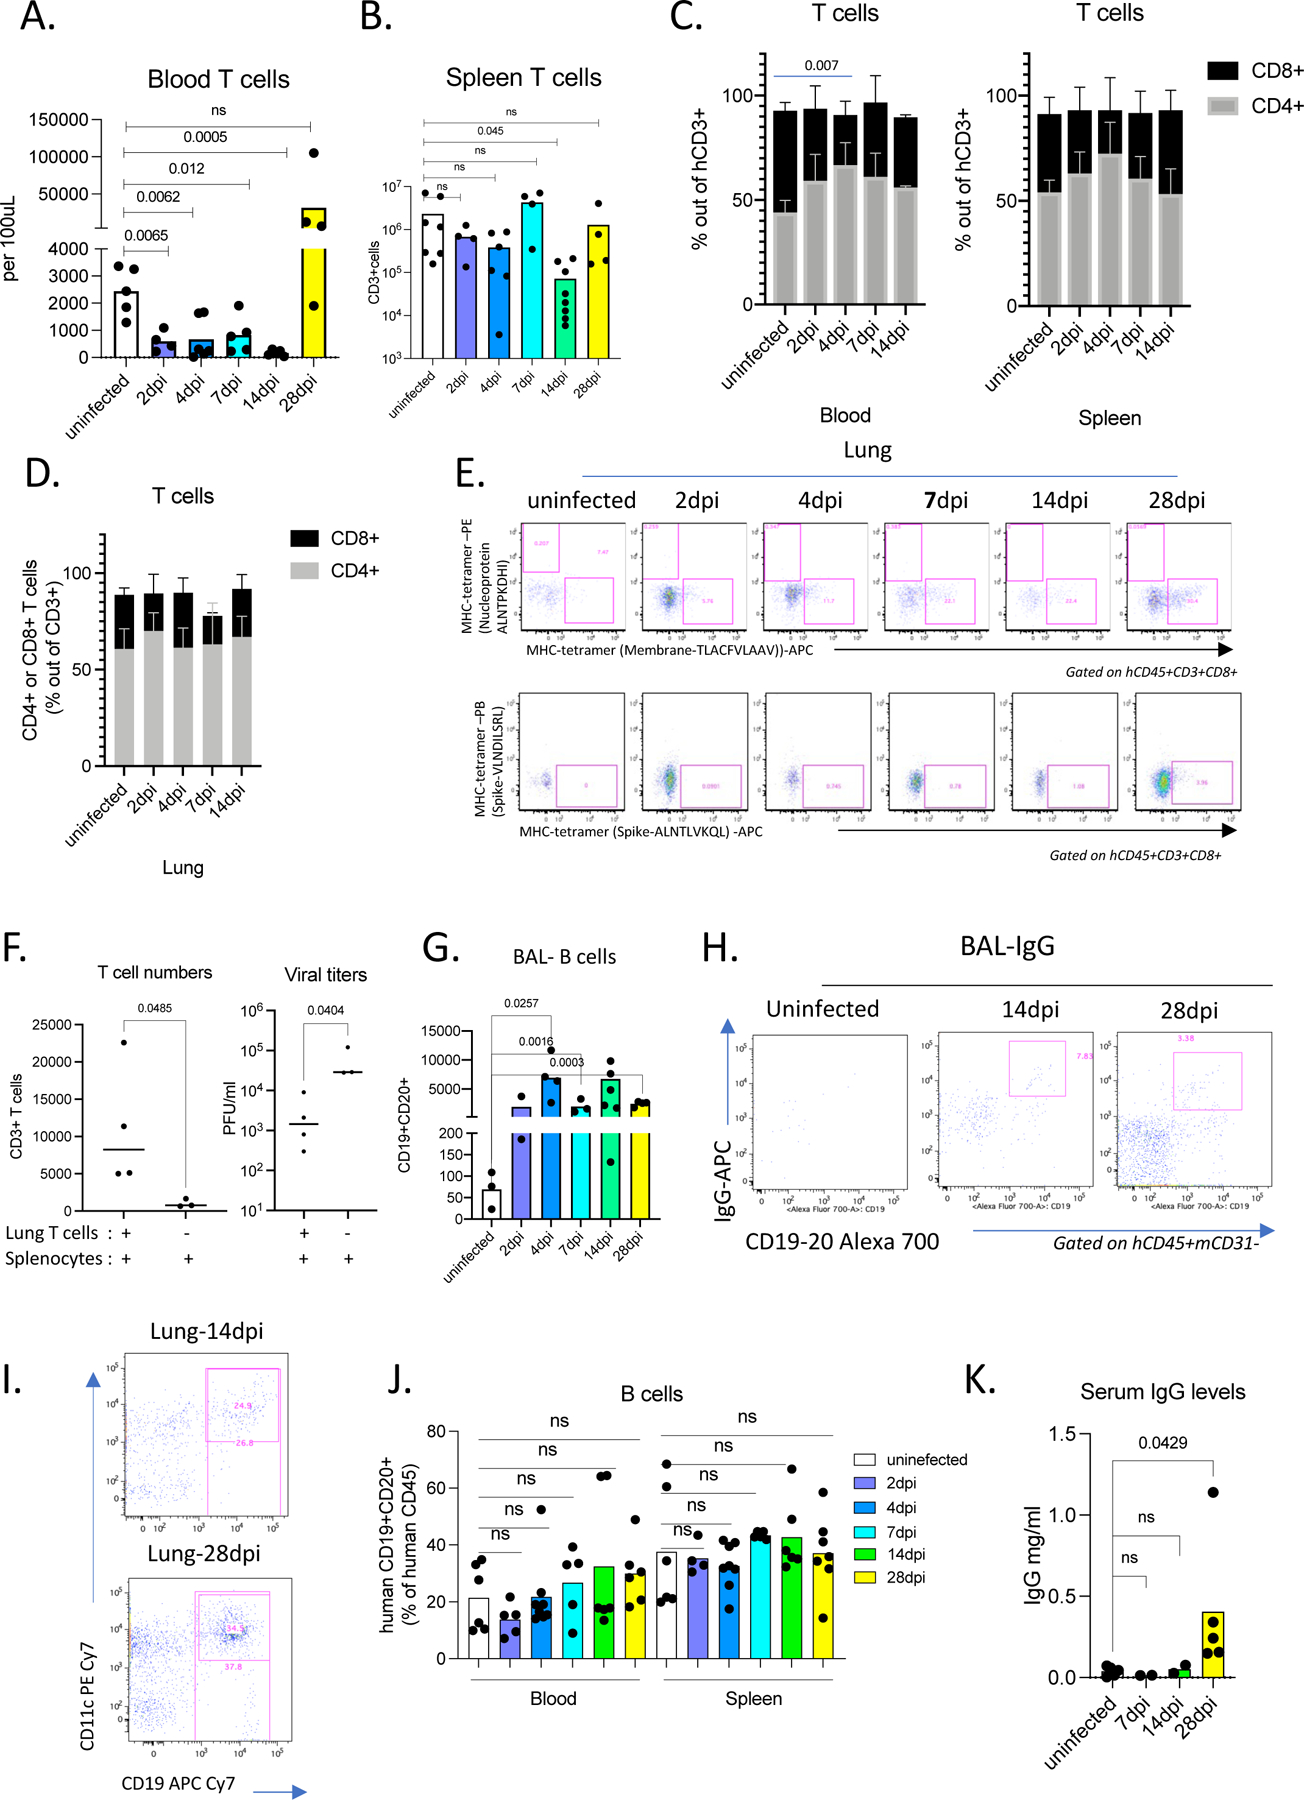
A. Numbers of human T cells in the blood pre- and post-infection (2,4,7,14,28dpi). Unpaired, two-tailed t-test. P-values<0.05 are plotted. Uninfected n=5, 2dpi n=4, 4dpi n=6, 7dpi n=5, 14dpi n=5, 28dpi=4, biologically independent mice examined over at least 3 independent experiments. Individual values for each mouse and means are plotted.
B. Numbers of human T cells in the spleens of uninfected or infected mice (2,4,7,14,28dpi). Unpaired, two-tailed t-test. P-values<0.05 are plotted. Unpaired, two-tailed t-test. Only p-values<0.05 are plotted. Uninfected n=7, 2dpi n=4, 4dpi n=6, 7dpi n=4, 14dpi n=8, 28dpi=4, biologically independent mice examined over at least 3 independent experiments. Individual values for each mouse and means are plotted.
C. Frequencies of human CD4+ or CD8+ T cells within hCD3+ population in the blood and spleens of uninfected or infected mice at 2,4,7,14,28 dpi. Blood: N=4 biologically independent mice examined over at least 2 independent experiments. Means with SD are plotted. Spleen: Uninfected n=5, 2dpi n=4, 4dpi n=6, 7dpi n=4, 14dpi n=4 biologically independent mice examined over at least 3 independent experiments. Individual values for each mouse and means are plotted.
D. Frequencies of human CD4+ or CD8+ T cells within hCD3+ population in the lungs of uninfected or infected mice at 2,4,7,14,28 dpi. Uninfected n=4, 2dpi n=4, 4dpi n=6, 7dpi n=4, 14dpi n=4 biologically independent mice examined over 3 independent experiments. Individual values for each mouse and means are plotted.
E. Representative flow cytometry plots of CD8+ T cells stained with viral antigen bearing HLA-A2 tetramers. HLA-A2 tetramers bound to peptides of Nucleoprotein(N), Membrane protein(M) and Spike protein were used to characterize T cells from uninfected and infected (2,4,7,14,28dpi) mice. Representative of uninfected n=3, 2dpi n=2, 4dpi n=3, 7dpi n=3, 14dpi n=3, 28dpi n=3 biologically independent mice examined over 2 independent experiments.
F. T cell numbers and viral titers following prophylactic T cell transfer in infected mice at 4dpi. Splenocytes and sorted T cells from lungs of 14dpi mice where the contribution of the antigen specific B cell response was minimal were transferred to unengrafted MISTRG-hACE2 (no human immune cells prior to transfer). Control MISTRG-hACE2 mice received splenocytes but not sorted lung T cells (n=3 biologically independent mice examined over 2 independent experiments). These mice were subsequently infected and analyzed at 4dpi for viral titers and human immune cells in lungs. In mice that received sorted lung T cells, human immune compartment in lungs comprised of T cells and few CD16+ monocytes and macrophages but no B cells (n=4 biologically independent mice examined over 2 independent experiments).
G. Numbers of human B cells in the BAL of uninfected or infected mice at 2,4,7,14,28 dpi. N=3–6. Unpaired, two-tailed t-test. P-values<0.05 are plotted. Uninfected n=3, 2dpi n=3, 4dpi n=4, 7dpi n=3, 14dpi n=7, 28dpi n=4 biologically independent mice examined over at least 3 independent experiments. Individual values for each mouse and means are plotted.
H. Representative flow cytometry plots of IgG+ B cells in the BAL of uninfected and infected mice 14 and 28dpi. Representative of n=4 biologically independent mice examined over 3 independent experiments.
I. CD11C and CD19 expression on human immune cells from infected lungs at 14 and 28 dpi. N=4–5. Representative of n=5 (14dpi) and n=4 (28dpi) biologically independent mice examined over at least 3 independent experiments.
J. Frequencies of human B cells marked by CD19 and CD20 expression within hCD45+ population in spleen and blood of uninfected or infected mice at 2,4,7,14,28 dpi. Blood: Uninfected n=6, 2dpi n=5, 4dpi n=8, 7dpi n=5, 14dpi n=6, 28dpi n=6 biologically independent mice examined over at least 3 independent experiments. Spleen: Uninfected n=6, 2dpi n=4, 4dpi n=8, 7dpi n=5, 14dpi n=6, 28dpi n=7 biologically independent mice examined over at least 3 independent experiments. Individual values for each mouse and means are plotted.
K. IgG levels measured by ELISA in serum of uninfected or infected mice at 7,14, 28 dpi. Uninfected n=5, 7dpi n=2, 14dpi n=2, 28dpi n=5 biologically independent mice examined over 2 independent experiments. Individual values for each mouse and means are plotted. Unpaired, two tailed t-test.
Extended Data Figure 3 (matched to Figure 4):
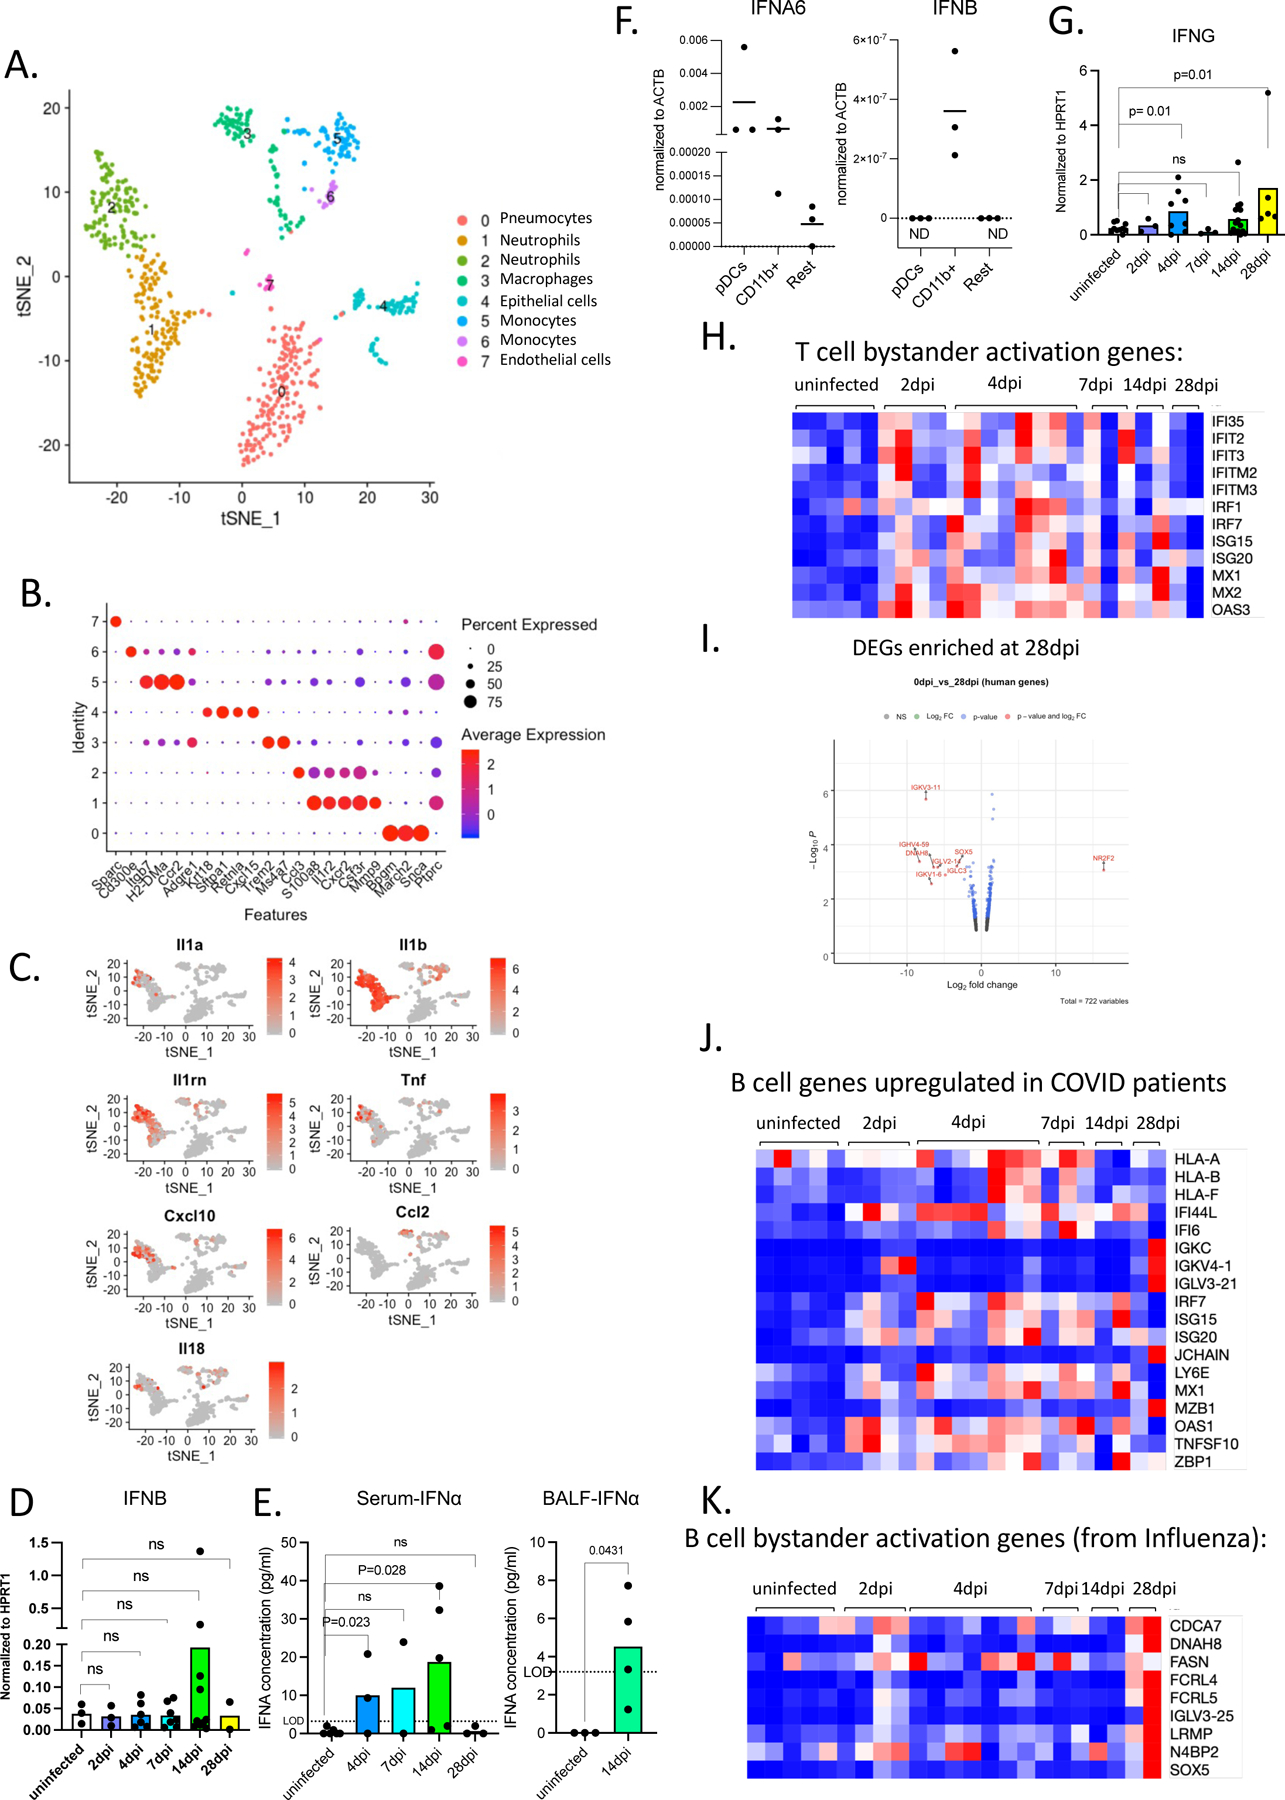
A. t-distributed stochastic neighbor embedding (t-SNE) plot with clustering results of single cell RNA sequencing of mouse cells from lungs at 4dpi. Single cell suspensions from whole infected lung at 4dpi were processed and sequenced. There were 731 cells identified as mouse cells.
B. Dot plot of cluster identifying genes for mouse cell clusters described in S4A.
C. Cluster distribution and expression profile of mouse inflammatory cytokines for clusters described in 4B.
D. Normalized expression of human IFNB measured by qPCR in homogenized lung tissue of uninfected and infected (2,4,7,14,28dpi) mice. Expression was normalized to human HPRT1. Unpaired t-test, one-tailed since the distribution is expected to be one-sided. Uninfected n=3, 2dpi n=3, 4dpi n=6, 7dpi n=7, 14dpi n=10, 28dpi n=2 biologically independent mice examined over at least 3 independent experiments. Individual values for each mouse and means are presented. P-values<0.05 are plotted.
E. IFNA levels measured by ELISA in serum and BAL of uninfected or infected mice. Serum: Uninfected n=6, 4dpi n=3, 7dpi n=2, 14dpi n=5, 28dpi n=3; BAL: Uninfected n=3, 14dpi n=4 biologically independent mice examined over at least 2 independent experiments for all time points. Individual values (average of duplicates) for each mouse and means are plotted.
F. Type I interferon levels (IFNA6 and IFNB) per cell measured by qPCR in sorted human immune cells (human CD45+): plasmacytoid dendritic cells (PDCs; CD123hi CD11B-), macrophages and monocytes (CD11B+) and rest of human immune cells (CD123-CD11B-CD45+). Expression was normalized to human ACTB. Individual values and means are plotted. n=3 biologically independent mice examined over 2 independent experiments. Individual values with means are plotted.
G. Normalized expression of human IFNG measured by qPCR in homogenized lung tissue of uninfected and infected (2,4,7,14,28dpi) mice. Expression was normalized to human HPRT1. Unpaired t-test, one tailed since distribution is expected to be one-sided. Uninfected n=10, 2dpi n=3, 4dpi n=8, 7dpi n=3, 14dpi n=15, 28dpi n=5 biologically independent mice examined over at least 3 independent experiments for all time points.
H. Heatmap of normalized counts for bystander activated memory T cell signature genes 67(based on Low et al., JEM 2020) in lungs of MISTRG6-hACE2 mice infected with SARS-CoV-2. . Row min and max of transformed values, calculated by subtracting row mean and diving by STD for each gene across all samples, are visualized. Uninfected n=5, 2dpi n=4, 4dpi n=7, 7dpi n=3, 14dpi n=2, 28dpi n=2 biologically independent mice examined over at least 2 independent experiments for all time points.
I. Volcano plot showing foldchange and adjusted p-values (by Wald test using DESeq2) of differentially regulated genes at 28dpi compared to uninfected lungs. Genes with FC(Log2)>1 and p value<0.05 are highlighted in red. Replicates of at least 2 mice. Uninfected n=5, 28dpi n=2 biologically independent mice examined over 2 independent experiments.
J. Heatmap of normalized counts for genes that are induced in B cells of patients with moderate or severe COVID-19 in comparison with healthy controls. Normalized counts in lungs of uninfected or infected MISTRG6-hACE2 were plotted over the course of infection. Row min and max of transformed values, calculated by subtracting row mean and diving by STD for each gene across all samples, are visualized. Uninfected n=5, 2dpi n=4, 4dpi n=7, 7dpi n=3, 14dpi n=2, 28dpi n=2 biologically independent mice examined over at least 2 independent experiments for all time points.
K. Heatmap of normalized counts for bystander activated memory B cell signature genes68(based on Horns et al., 2020) in lungs of MISTRG6-hACE2 mice infected with SARS-CoV-2. Row min and max of transformed values, calculated by subtracting row mean and diving by STD for each gene across all samples, are visualized. Uninfected n=5, 2dpi n=4, 4dpi n=7, 7dpi n=3, 14dpi n=2, 28dpi n=2 biologically independent mice examined over at least 2 independent experiments for all time points.
Extended Date Figure 4 (matched to Figure 5):
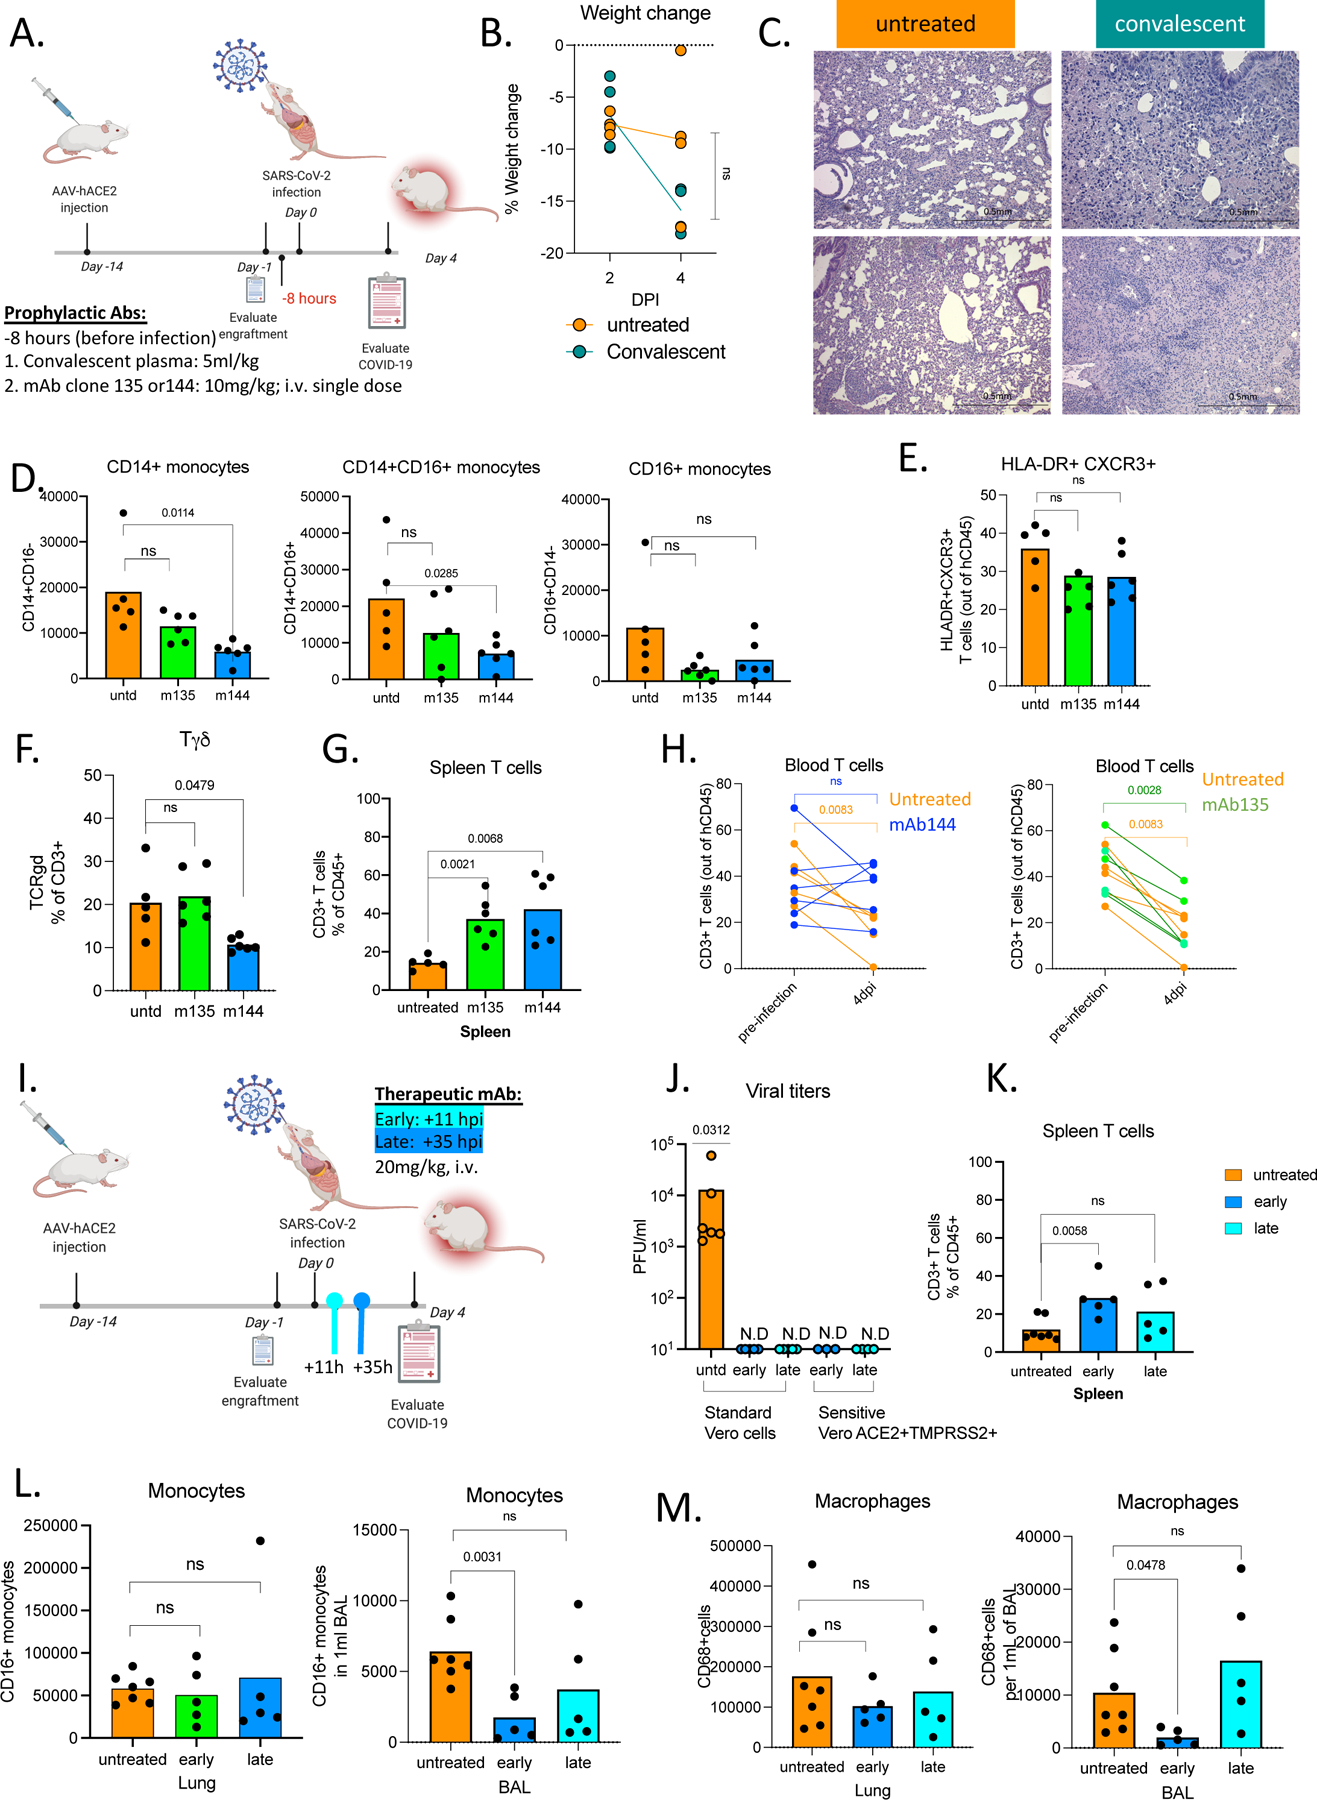
A. Schematic of experimental design of prophylactic antibody treatment MISTRG6-hACE2 mice received prophylactic treatment of convalescent plasma (5ml/kg) or monoclonal antibodies at 10mg/kg (clone 135 -m135 or clone 144-m144) 8 hours prior to infection or left untreated (untd). Mice were euthanized 4dpi. Convalescent plasma samples from the top 30 neutralizers in a cohort of 148 individuals were pooled to create a mixture with an NT50 titer of 1597 against HIV-1 pseudotyped with SARS-CoV-2 S protein72. Sequencing the antibody genes from infected humans has revealed the expansion of closely related Receptor Binding Domain of the Spike protein (RBD)-specific B cell antibody clones in different SARS-CoV-2 infected individuals. Although most convalescent plasma samples obtained from patients who recovered from COVID-19 did not contain high levels of neutralizing activity, RBD-specific antibodies with potent antiviral activity were found in all individuals tested72. Monoclonal recombinant antibodies (mAbs) used in this study were cloned from these convalescent patients and had high neutralizing activity against SARS-CoV-2 in vitro and in vivo in mouse adapted SARS-CoV-2 infection 72,76.
B. Weight change in convalescent plasma treated mice at 2 and 4dpi plotted as percent change compared with original weight measured just before inoculation with SARS-CoV-2. Unpaired t-test, two-tailed comparing 4dpi values. N=4 biologically independent mice examined over 2 independent experiments for all time points. Individual values per each mouse plotted.
C. Representative images (10x magnification) of H&E staining of lungs (4dpi) from mice treated prophylactically with convalescent plasma or left untreated. The histopathological findings mark transition into the organizing phase, highlighted by infiltration of the inter- and intra-alveolar space by lymphocytes macrophages, and fibroblasts. Representative of N=4 biologically independent mice examined over 2 independent experiments for all time points. Individual values for each mouse are plotted.
D. Frequencies of human monocytes (CD14+ classical; CD14+CD16+ intermediate, CD16+ non classical) within human CD45+ cells in the lungs of MISTRG6-hACE2 mice which received a prophylactic treatment of monoclonal antibody clone 135 (m135) or clone 144(m144) 8 hours prior to infection or left untreated (untd). Unpaired, two-tailed t-test. P-values<0.05 are plotted. Untreated N=5, treated n=6 N=4 biologically independent mice examined over 2 independent experiments for all time points. Individual values for each mouse and means are plotted.
E. Frequencies of HLA-DR+CXCR3+ T cells within human CD3+CD45+ cells in lungs of MISTRG6-hACE2 mice which received a prophylactic treatment of monoclonal antibody clone 135 (m135) or clone 144(m144) 8 hours prior to infection or left untreated (untd). Unpaired, two-tailed t-test. N=5–6. P-values<0.05 are plotted. Untreated N=5, treated n=6 N=4 biologically independent mice examined over 2 independent experiments for all time points. Individual values for each mouse and means are plotted.
F. Frequencies of Tγδ cells within human CD3+CD45+ cells in lungs of MISTRG6-hACE2 mice which received prophylactic treatment of monoclonal antibody clone 135 (m135) or clone 144(m144) 8 hours prior to infection or left untreated (untd). Unpaired, two-tailed t-test. N=5–6. P-values<0.05 are plotted. Untreated N=5, treated n=6 N=4 biologically independent mice examined over 2 independent experiments for all time points. Individual values for each mouse and means are plotted.
G. Frequencies of human T cells within human CD45+ cells in spleens of MISTRG6-hACE2 mice received a prophylactic treatment of monoclonal antibody clone 135 (m135) or clone 144(m144) 8 hours prior to infection or left untreated (untd). Unpaired, two-tailed t-test. N=5–6. P-values<0.05 are plotted. Untreated N=5, treated n=6 N=4 biologically independent mice examined over 2 independent experiments for all time points. Individual values for each mouse and means are plotted.
H. Frequencies of human CD3+ T cells within human CD45+ population in the blood pre- and post-infection (2,4,7,14,28dpi). Lines connect pre- and post-infection values for the same mouse. MISTRG6-hACE2 mice received a prophylactic treatment of monoclonal antibody clone 135 (m135) or clone 144(m144) 8 hours prior to infection or left untreated (untd). Paired, two-tailed t-test. P-values<0.05 are plotted. Untreated N=5, treated n=6 N=4 biologically independent mice examined over 2 independent experiments for all time points. Individual values for each mouse are plotted.
I. Schematic of experimental design of post-infection mAb treatment. MISTRG6-hACE2 mice received a mixed cocktail of monoclonal antibodies clone 135 (m135) and clone 144(m144) at 20mg/kg or left untreated (untd). Early treatment groups were treated 11 hours post-infection and late treatment 35 hours post-infection. Monoclonal recombinant antibodies (mAbs) used in this study were cloned from the convalescent patients (whose plasma was used prophylactically before) and had high neutralizing activity against SARS-CoV-2 in vitro and in vivo in mouse adapted SARS-CoV-2 infection 72,76.
J. Viral titers measured by PFU in homogenized lung tissue following early or late therapeutic mAb at 4dpi using Vero E6 (standard assay) Vero-ACE2+TMPRSS2+ (sensitive assay) cells. N=4 biologically independent mice examined over 2 independent experiments measurement with Vero-ACE2+TMPRSS2+ (sensitive assay) cells. Individual values for each mouse are plotted.
K. Frequencies of human T cells within human CD45+ cells in spleens of MISTRG6-hACE2 mice that received early, late or no treatment of monoclonal antibody mix. Unpaired, two-tailed t-test. Untreated n=7, treated n=5 biologically independent mice examined over 3 independent experiments for all time points. Pooled, infection-matched mice are presented. P-values<0.05 are plotted. Individual values representing each mouse are plotted. Individual values for each mouse are plotted.
L. Number of CD16+ human monocytes in lungs of treated and untreated mice at 4dpi. Mice were either MISTRG6-hACE2 mice that received a mixed cocktail of monoclonal antibodies clone 135 (m135) and clone 144(m144) or left untreated (untd). Early treatment group was treated 11 hours post-infection (hpi) and late treatment 35 hpi. Unpaired, two-tailed t-test. Untreated n=7, treated n=5 biologically independent mice examined over 3 independent experiments for all time points. Pooled, infection-matched mice are presented. P-values<0.05 are plotted. Individual values representing each mouse are plotted.
M. Number of human macrophages in lungs of treated and untreated mice at 4dpi. MISTRG6-hACE2 mice that received a mixed cocktail of monoclonal antibodies clone 135 (m135) and clone 144(m144) or left untreated (untd). Early treatment group was treated 11 hours post-infection and late treatment 35 hours post-infection. Unpaired, two-tailed t-test. Untreated n=7, treated n=5 biologically independent mice examined over 3 independent experiments for all time points. Pooled, infection-matched mice are presented. P-values<0.05 are plotted. Individual values representing each mouse are plotted.
Extended data Figure 5 (matched to Figure 6):
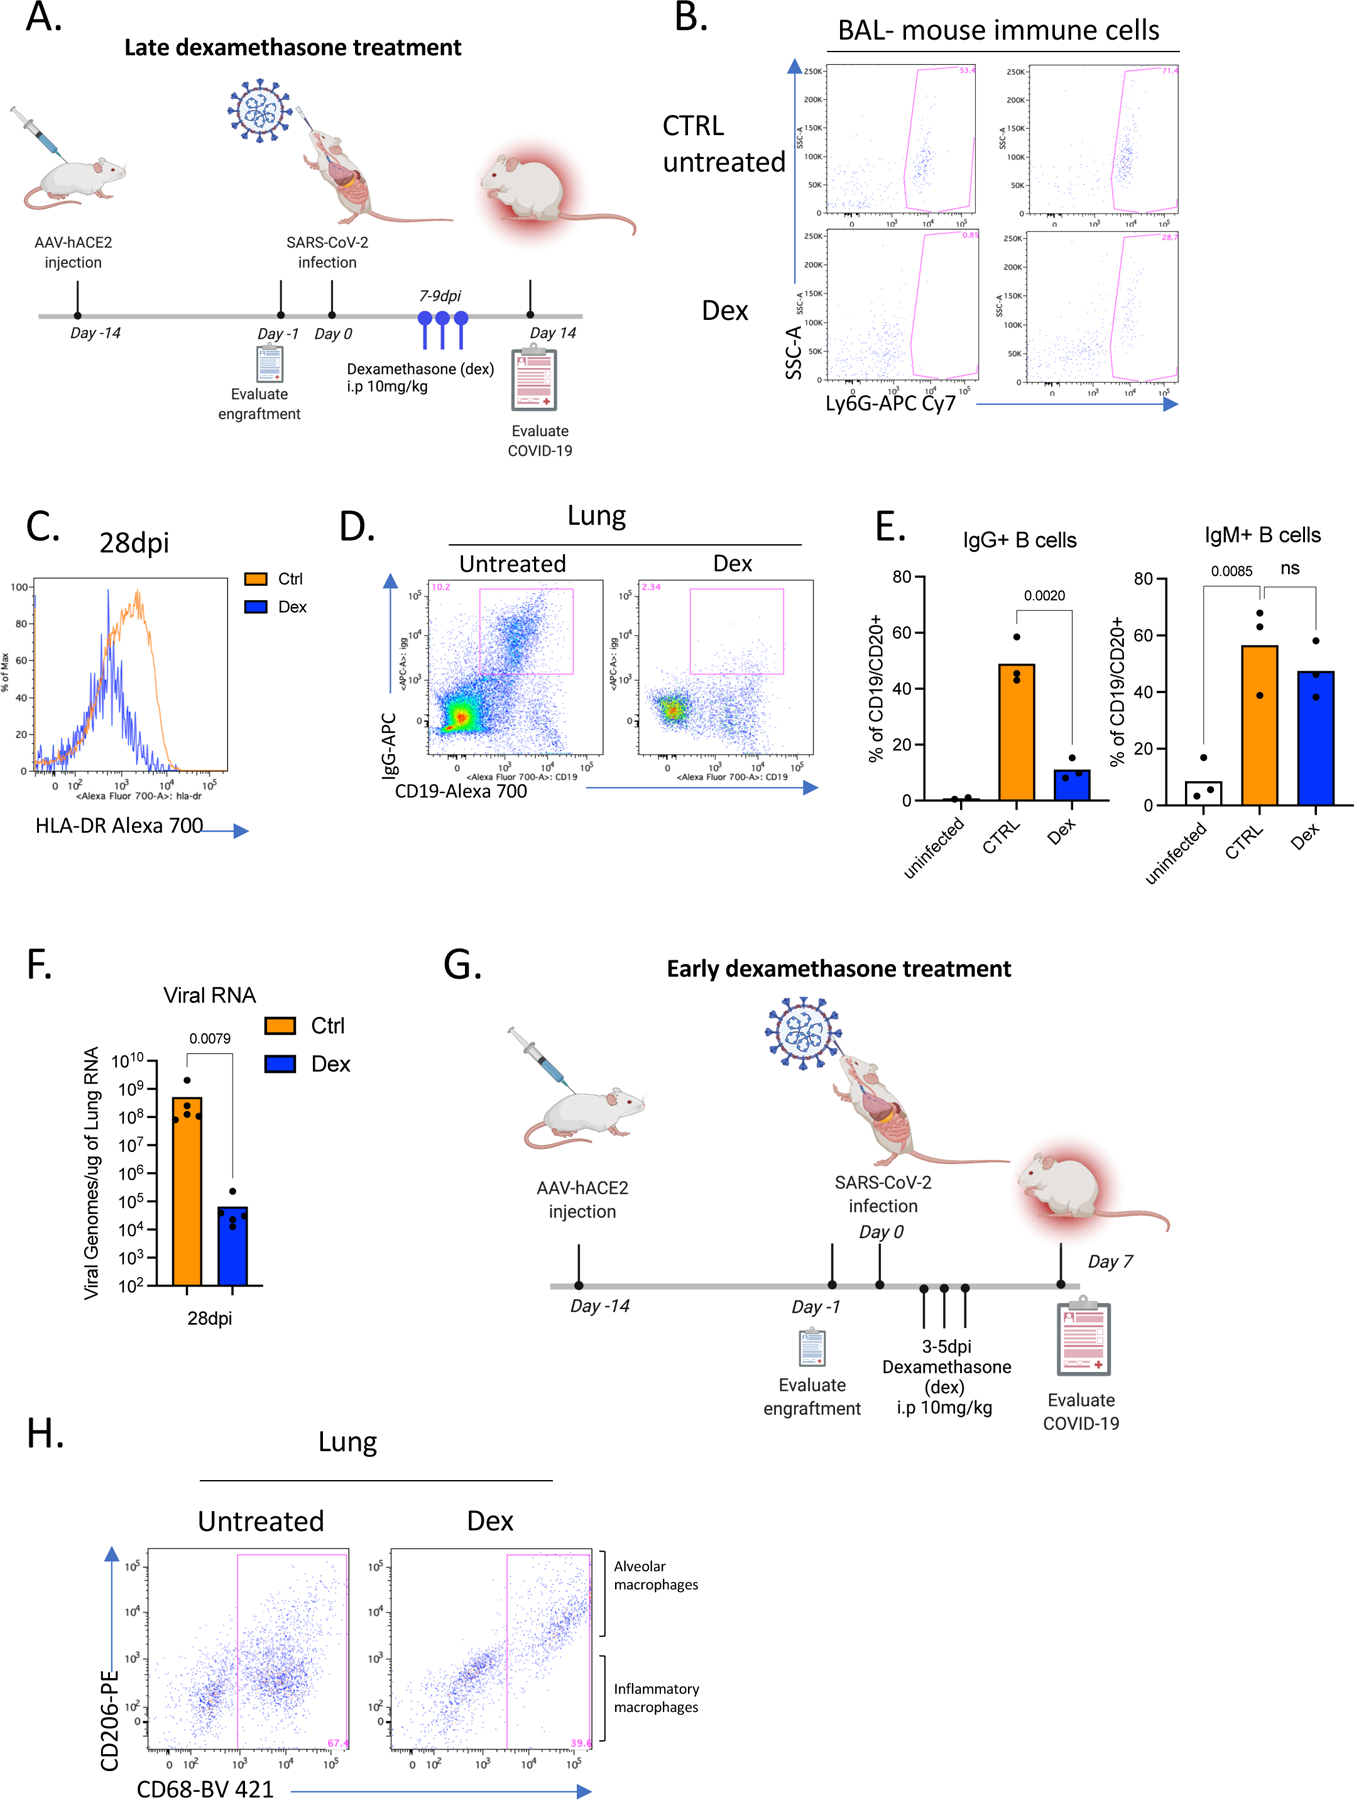
A. Schematic of experimental design of dexamethasone treatment: SARS-CoV-2 infected MISTRG6-hACE2 mice were either treated with dexamethasone on days 7,8,9 post-infection or left untreated. Mice were analyzed either at 14dpi or 28dpi. Mice were treated intraperitoneally (i.p.) with dexamethasone at 10mg/kg dose.
B. Representative flow cytometry plots of Ly6G expressing SSChi cells (mouse neutrophils) within the mouse immune cell population (mouse CD45+) in the BAL of dexamethasone treated or control untreated mice. Representative of 4 biologically independent mice examined over at least 2 independent experiments.
C. HLA-DR expression on lung T cells 28dpi in dexamethasone treated or control mice. Representative of 3 biologically independent mice examined over at least 2 independent experiments.
D. Representative flow cytometry plots of Surface IgG and CD19 expression on human immune cells gated on hCD45+ cells in lungs of untreated or dexamethasone treated mice at 28dpi. N=3 of biologically independent mice examined over at least 2 independent experiments.
E. Frequencies of IgM+ and IgG+ B cells in lungs of untreated or dexamethasone treated mice at 28dpi. Mice were treated with dexamethasone on days 7,8,9 post-infection. N=3 biologically independent mice examined over at least 2 independent experiments. Unpaired t-test, two-tailed.
F. Viral RNA in the lung homogenates of dexamethasone treated or control untreated mice at 28dpi. Mann-Whitney, two-tailed test. N=5 biologically independent mice examined over 3 independent experiments.
G. Schematic of experimental design of SARS-CoV-2 infected MISTRG6-hACE2 mice either treated with dexamethasone on days 3,4,5 dpi or left untreated.
H. CD206 and CD68 expression in lung human immune cells in mice treated with dexamethasone or left untreated at 7dpi. CD206hi+ CD68+ cells are alveolar macrophages. Treated N=4, untreated N=6 biologically independent mice examined over 2 independent experiments. Alveolar macrophages are marked by high CD206 expression. Inflammatory macrophages are enriched in the CD206 negative population which also express CD86 (not shown).
Supplementary Material
Figure S1 (matched to Figure 1): A. Comparison of viral titers measured by PFU in homogenized lung tissue at 4 dpi using Vero E6 cells or Vero-ACE2+TMPRSS2+ cells. Vero-ACE2+TMPRSS2+ cells overexpress ACE222,23 and TMPRSS224, two receptors involved in SARS-CoV-2 infection. Vero-ACE2+TMPRSS2+ cells allow a more sensitive cell culture-based assay for quantification of SARS-CoV-2 titers.
B. Viral titers measured by PFU using Vero-ACE2+TMPRSS2+ cells and viral RNA in homogenized lung tissue at 2, 4, 7 14, 28, 35 dpi. Significance in viral titers (compared 4dpi) was determined by two-tailed unpaired t-test. Viral titers: 2dpi n=2, 4dpi n=5, 7dpi n=2, 14dpi n=8, 28dpi n=7, 35dpi n=6 biologically independent mice examined over at least 3 independent experiment for 14–35dpi. Significance in viral RNA (compared to 4dpi) was determined by Mann-Whitney, two-tailed test. Viral RNA: 2dpi n=4, 4dpi n=22, 7dpi n=6, 14dpi n=7, 28dpi n=8, 35dpi n=6 biologically independent mice examined over at least 3 independent experiment for 14–35dpi. Individual values for each mouse and means are plotted.
C. Weight change of individual mice reconstituted MISTRG6-hACE2 mice on 2,4,7,10,14,21, 28 and 35dpi. 2dpi n=37, 4dpi n=37, 7dpi n=23, 10dpi=16 14dpi n=15, 21dpi=12 28dpi n=10, 35dpi n=4 biologically independent mice examined over at least 3 independent experiment for 14–35dpi. Individual values for each mouse are plotted.
D. Representative H&E images (2x and 10x magnification) of all lungs used in comparison of histopathological scores (Fig. 1E) Each pair of images (2x, 10x magnification) represents an individual mouse. At 2dpi, MISTRG6-hACE2 mice showed prominent collection of proteinaceous debris in the alveolar spaces, which is the hallmark of the exudative phase of human COVID-19 pulmonary pathology. The debris was a mixture of necrotic pneumocytes and vasculopathy associated fibrin. Lungs at 4pi appeared to transition into the organizing phase, highlighted by infiltration of inter and intra alveolar space by lymphocytes macrophages, and fibroblasts (4dpi in Fig 1E–F, Fig S2D). The interalveolar spaces continued to expand between 14 and 28dpi by increasing accumulation of immune and stromal cells. Uninfected n=6, 2dpi n=7, 4dpi n=16, 7dpi n=5. 14dpi, n=10, 28dpi=6, 35dpi=4 biologically independent mice examined over at least 4 independent experiments.
E. Histopathology by H&E staining of infected lungs at higher magnifications at 28dpi. The interalveolar spaces continued to expand by increasing accumulation of immune and stromal cells. Representative of 6 mice examined over at least 4 independent experiments.
F. Representative images (40X) of trichrome staining of all lungs used in comparison of histopathological scores (Fig. 1F). Each image set represents an individual mouse. During 14 to 28dpi period, there was increasing deposition of collagen, highlighted by thickening of collagen bundles in the lung parenchyma and continued obliteration of alveolar architecture (Fig. 1E–F, Fig. S1D–G). These changes highlighted the transition from organizing phase to fibrotic phase. The architectural remodeling and collagen deposition was more pronounced at 28 and 35dpi resulting in replacement of normal alveolar architecture by dilated cystic spaces, separated by thick interstitial tissue bands (also in Fig. 1F). Uninfected n=6, 4dpi n=4, 14dpi, n=9, 28dpi=7, 35dpi=5 biologically independent mice examined over at least 3 independent experiments.
Figure S2 (matched to Figure 2): A. Representative gating strategy of human immune cells in the lungs of infected MISTRG-hACE2 mice.
G. Representative gating strategy and quantification of mouse immune cells and mouse neutrophils in the lungs of infected MISTRG-hACE2 mice. Mouse immune cells: Uninfected n=6, 2dpi n=6, 4dpi n=17, 7dpi n=5, 14dpi, n=6, 28dpi=6, biologically independent mice examined over at least 3 independent experiments. Mouse neutrophils: Uninfected n=3, 2dpi n=4, 4dpi n=11, 7dpi n=3, 14dpi, n=6, 28dpi=7, biologically independent mice examined over at least 3 independent experiments. Individual values for each mouse and means are plotted.
H. Immunohistochemistry (IHC) and H&E staining of matched lungs. Lungs were stained against human CD68, CD3 and CD20 staining. Uninfected n=2, 4dpi n=3, 14dpi, n=3, 28dpi=3, biologically independent mice examined over at least 2 independent experiments.
B. Side-by-side quantification of T (CD3), B(CD20) and macrophages (CD68) cells by IHC and flow cytometry (FC) of matched samples normalized to human immune cells (T+B+Macrophages). B cells were characterized with combined CD19, CD20 expression by flow cytometry. B cells quantified by CD20 expression alone may be underreported by IHC compared to the quantitation by FC. Uninfected n=2, 4dpi n=3, 14dpi, n=3, 28dpi=3, biologically independent mice examined over at least 2 independent experiments. Means with SD are presented.
C. Representative gating strategy for mature (CCR7+) and activated (CD83+) plasmacytoid dendritic cells (pDCs). Representative of n=5 biologically independent mice examined over 2 independent experiments.
Supplementary Table 1: Differentially regulated genes (DEGs) in SARS-CoV-2 infected lungs. Normalized counts, foldchanges in infected lungs compared with respect to uninfected mice and adjusted p values are presented for 516 mouse and 285 human differentially regulated genes. Following numbers of replicates were used in the study: Human genes: Uninfected n=5, 2dpi n=4, 4dpi n=7, 7dpi n=3, 14dpi n=2, 28dpi n=2 biologically independent mice examined over at least 2 independent experiments for all time points. Following numbers of replicates were used in the study: Human genes: Uninfected n=5, 2dpi n=4, 4dpi n=9, 7dpi n=3, 14dpi n=2, 28dpi n=2 biologically independent mice examined over at least 2 independent experiments for all time points. Mouse genes: Uninfected n=5, 2dpi n=4, 4dpi n=9, 7dpi n=3, 14dpi n=4, 28dpi n=2 biologically independent mice examined over at least 2 independent experiments for all time points. Whole tissue lung samples with less than 1% human reads were excluded from human DEG analysis (pre-established criterium). Differential expression analysis was performed with DESeq2 and statistical significance was deemed using Wald test.
Supplementary Table 2: Pathway analysis of mouse and human DEGs in SARS-CoV-2 infected lungs utilizing Gene Ontology(GO), Gene Set Enrichment Analysis (GSEA) and Ingenuity pathway analysis platforms. Following numbers of replicates were used in the study: Human genes: Uninfected n=5, 2dpi n=4, 4dpi n=7, 7dpi n=3, 14dpi n=2, 28dpi n=2 biologically independent mice examined over at least 2 independent experiments for all time points. Mouse genes: Uninfected n=5, 2dpi n=4, 4dpi n=9, 7dpi n=3, 14dpi n=4, 28dpi n=2 biologically independent mice examined over at least 2 independent experiments for all time points. Whole tissue lung samples with less than 1% human reads were excluded from human DEG analysis (pre-established criterium). Differential expression analysis was performed with DESeq2 and statistical significance was deemed using Wald test.
Supplementary Table 3: Distribution of Type I interferon stimulated genes (ISGs) in SARS-CoV-2 infected lungs during the course of infection. Normalized counts for Type I interferon stimulated genes (ISGs) within human DEGs are presented. Following numbers of replicates were used in the study: Human genes: Uninfected n=5, 2dpi n=4, 4dpi n=7, 7dpi n=3, 14dpi n=2, 28dpi n=2 biologically independent mice examined over at least 2 independent experiments for all time points. Mouse genes: Uninfected n=5, 2dpi n=4, 4dpi n=9, 7dpi n=3, 14dpi n=4, 28dpi n=2 biologically independent mice examined over at least 2 independent experiments for all time points. Whole tissue lung samples with less than 1% human reads were excluded from human DEG analysis (pre-established criterium). Differential expression analysis was performed with DESeq2 and statistical significance was deemed using Wald test. For IFN-stimulated gene identification, http://www.interferome.org was used with parameters -In Vivo, Homo sapiens -fold change up 2 and down 2.
Supplementary Table 4: Genes that correlate with systemic lymphopenia. Top 50 negatively and positively correlating genes were ranked using Pearson’s r comparing normalized counts for each gene and the corresponding splenic T cell frequency out of total human immune cells. Following numbers of replicates were used in the comparison: Human genes: Uninfected n=5, 2dpi n=4, 4dpi n=7, 7dpi n=3, 14dpi n=2, 28dpi n=2 biologically independent mice examined over at least 2 independent experiments for all time points. Whole tissue lung samples with less than 1% human reads were excluded from correlation analysis (pre-established criterium).
Acknowledgements:
The generation of the original MISTRG6 model was supported by the Bill and Melinda Gates Foundation. We thank G. Yancopoulos, D. Valenzuela, A. Murphy, and W. Auerbach at Regeneron Pharmaceuticals who generated, in collaboration with our groups, the individual knock-in alleles combined in MISTRG. We thank H. Steach, M. Chiorazzi, I. Odell, E. Eynon, and W. Philbrick and all the other members of the Flavell lab for discussions and comments; J. Alderman, C. Lieber, B. Cadugan and E. Hughes-Picard for administrative assistance; P. Ranney, C. Hughes for mouse colony management; D. Urbanos for human CD34+ cell isolation; L. Devine for help with cell sorting. E. Sefik is a HHMI Fellow of the Damon Runyon Cancer Research Foundation (DRG-2316-18). This work was funded by the Howard Hughes Medical Institute (RAF, MN, and AI)). This study was also supported in part by awards from National Institute of Health grants, R01AI157488 (AI), F30CA239444 (ES), 2T32AI007517, K08AI163493 (BI), AI061093(EM), AI118855(EM), CA016359 (EM), K08 AI128043 (CBW), U01 CA260507 (SH), Burroughs Wellcome Fund (CBW), Patterson Foundation (CBW), Fast Grant from Emergent Ventures at the Mercatus Center (AI, ES, CBW), Mathers Foundation (AI, CBW, EM), and the Ludwig Family Foundation (AI, CBW).
Footnotes
Competing financial interests
RAF is an advisor to Glaxo Smith Kline and Zai Lab.
Data Availability:
All data that support the findings of this study are available within the paper and its Supplementary Information files. The data supporting this publication is available at Figshare.com under project “A Humanized Mouse Model of COVID-19” (https://figshare.com/projects/A_humanized_mouse_model_of_COVID-19/125659).
All 10x Genomics single cell RNA sequencing and bulk RNA sequencing data that support the findings of this study was deposited in the Gene Expression Omnibus (GEO) repository with accession codes GSE186794.
References:
- 1.Letko M, Marzi A & Munster V Functional assessment of cell entry and receptor usage for SARS-CoV-2 and other lineage B betacoronaviruses. Nature microbiology 5, 562–569 (2020). [DOI] [PMC free article] [PubMed] [Google Scholar]
- 2.Huang C et al. Clinical features of patients infected with 2019 novel coronavirus in Wuhan, China. The Lancet 395, 497–506, doi: 10.1016/S0140-6736(20)30183-5 (2020). [DOI] [PMC free article] [PubMed] [Google Scholar]
- 3.Mehta P et al. COVID-19: consider cytokine storm syndromes and immunosuppression. The Lancet (2020). [DOI] [PMC free article] [PubMed] [Google Scholar]
- 4.Xu Z et al. Pathological findings of COVID-19 associated with acute respiratory distress syndrome. The Lancet. Respiratory medicine 8, 420–422, doi: 10.1016/S2213-2600(20)30076-X (2020). [DOI] [PMC free article] [PubMed] [Google Scholar]
- 5.Schulte-Schrepping J et al. Severe COVID-19 is marked by a dysregulated myeloid cell compartment. Cell 182, 1419–1440. e1423 (2020). [DOI] [PMC free article] [PubMed] [Google Scholar]
- 6.Del Valle DM et al. An inflammatory cytokine signature predicts COVID-19 severity and survival. Nat Med 26, 1636–1643, doi: 10.1038/s41591-020-1051-9 (2020). [DOI] [PMC free article] [PubMed] [Google Scholar]
- 7.Liao M et al. Single-cell landscape of bronchoalveolar immune cells in patients with COVID-19. Nature medicine, 1–3 (2020). [DOI] [PubMed] [Google Scholar]
- 8.Zhang JY et al. Single-cell landscape of immunological responses in patients with COVID-19. Nat Immunol 21, 1107–1118, doi: 10.1038/s41590-020-0762-x (2020). [DOI] [PubMed] [Google Scholar]
- 9.Chua RL et al. COVID-19 severity correlates with airway epithelium-immune cell interactions identified by single-cell analysis. Nat Biotechnol 38, 970–979, doi: 10.1038/s41587-020-0602-4 (2020). [DOI] [PubMed] [Google Scholar]
- 10.Lucas C et al. Longitudinal analyses reveal immunological misfiring in severe COVID-19. Nature 584, 463–469 (2020). [DOI] [PMC free article] [PubMed] [Google Scholar]
- 11.Chen Z & Wherry EJ T cell responses in patients with COVID-19. Nature Reviews Immunology, 1–8 (2020). [DOI] [PMC free article] [PubMed] [Google Scholar]
- 12.Mathew D et al. Deep immune profiling of COVID-19 patients reveals distinct immunotypes with therapeutic implications. Science 369 (2020). [DOI] [PMC free article] [PubMed] [Google Scholar]
- 13.Delorey TM et al. COVID-19 tissue atlases reveal SARS-CoV-2 pathology and cellular targets. Nature 595, 107–113, doi: 10.1038/s41586-021-03570-8 (2021). [DOI] [PMC free article] [PubMed] [Google Scholar]
- 14.McCray PB et al. Lethal infection of K18-hACE2 mice infected with severe acute respiratory syndrome coronavirus. Journal of virology 81, 813–821 (2007). [DOI] [PMC free article] [PubMed] [Google Scholar]
- 15.Goldman-Israelow B et al. Mouse model of SARS-CoV-2 reveals inflammatory role of type I interferon signaling. bioRxiv (2020). [DOI] [PMC free article] [PubMed] [Google Scholar]
- 16.Bao L et al. The pathogenicity of SARS-CoV-2 in hACE2 transgenic mice. Nature 583, 830–833, doi: 10.1038/s41586-020-2312-y (2020). [DOI] [PubMed] [Google Scholar]
- 17.Hassan AO et al. A SARS-CoV-2 infection model in mice demonstrates protection by neutralizing antibodies. Cell 182, 744–753. e744 (2020). [DOI] [PMC free article] [PubMed] [Google Scholar]
- 18.Israelow B et al. Mouse model of SARS-CoV-2 reveals inflammatory role of type I interferon signaling. J Exp Med 217, doi: 10.1084/jem.20201241 (2020). [DOI] [PMC free article] [PubMed] [Google Scholar]
- 19.Sun S-H et al. A mouse model of SARS-CoV-2 infection and pathogenesis. Cell Host & Microbe (2020). [DOI] [PMC free article] [PubMed] [Google Scholar]
- 20.Imai M et al. Syrian hamsters as a small animal model for SARS-CoV-2 infection and countermeasure development. Proceedings of the National Academy of Sciences 117, 16587–16595 (2020). [DOI] [PMC free article] [PubMed] [Google Scholar]
- 21.Rockx B et al. Comparative pathogenesis of COVID-19, MERS, and SARS in a nonhuman primate model. Science 368, 1012–1015 (2020). [DOI] [PMC free article] [PubMed] [Google Scholar]
- 22.Xu H et al. High expression of ACE2 receptor of 2019-nCoV on the epithelial cells of oral mucosa. International Journal of Oral Science 12, 8–8, doi: 10.1038/s41368-020-0074-x (2020). [DOI] [PMC free article] [PubMed] [Google Scholar]
- 23.Yan R et al. Structural basis for the recognition of SARS-CoV-2 by full-length human ACE2. Science 367, 1444–1448, doi: 10.1126/science.abb2762 (2020). [DOI] [PMC free article] [PubMed] [Google Scholar]
- 24.Hoffmann M et al. SARS-CoV-2 Cell Entry Depends on ACE2 and TMPRSS2 and Is Blocked by a Clinically Proven Protease Inhibitor. Cell 181, 271–280 e278, doi: 10.1016/j.cell.2020.02.052 (2020). [DOI] [PMC free article] [PubMed] [Google Scholar]
- 25.Yang XH et al. Mice transgenic for human angiotensin-converting enzyme 2 provide a model for SARS coronavirus infection. Comp Med 57, 450–459 (2007). [PubMed] [Google Scholar]
- 26.Li W et al. Efficient replication of severe acute respiratory syndrome coronavirus in mouse cells is limited by murine angiotensin-converting enzyme 2. J Virol 78, 11429–11433, doi: 10.1128/JVI.78.20.11429-11433.2004 (2004). [DOI] [PMC free article] [PubMed] [Google Scholar]
- 27.Theocharides AP, Rongvaux A, Fritsch K, Flavell RA & Manz MG Humanized hemato-lymphoid system mice. Haematologica 101, 5–19, doi: 10.3324/haematol.2014.115212 (2016). [DOI] [PMC free article] [PubMed] [Google Scholar]
- 28.Rongvaux A et al. Human hemato-lymphoid system mice: current use and future potential for medicine. Annu Rev Immunol 31, 635–674, doi: 10.1146/annurev-immunol-032712-095921 (2013). [DOI] [PMC free article] [PubMed] [Google Scholar]
- 29.Rongvaux A et al. Development and function of human innate immune cells in a humanized mouse model. Nature Biotechnology 32, 364–372, doi: 10.1038/nbt.2858 (2014). [DOI] [PMC free article] [PubMed] [Google Scholar]
- 30.Rathinam C et al. Efficient differentiation and function of human macrophages in humanized CSF-1 mice. doi: 10.1182/blood-2010-12-326926 (2011). [DOI] [PubMed] [Google Scholar]
- 31.Willinger T et al. Human IL-3/GM-CSF knock-in mice support human alveolar macrophage development and human immune responses in the lung. Proceedings of the National Academy of Sciences of the United States of America 108, 2390–2395, doi: 10.1073/pnas.1019682108 (2011). [DOI] [PMC free article] [PubMed] [Google Scholar]
- 32.Strowig T et al. Transgenic expression of human signal regulatory protein alpha in Rag2−/−gamma(c)−/− mice improves engraftment of human hematopoietic cells in humanized mice. Proceedings of the National Academy of Sciences of the United States of America 108, 13218–13223, doi: 10.1073/pnas.1109769108 (2011). [DOI] [PMC free article] [PubMed] [Google Scholar]
- 33.Rongvaux A et al. Human thrombopoietin knockin mice efficiently support human hematopoiesis in vivo. Proceedings of the National Academy of Sciences of the United States of America 108, 2378–2383, doi: 10.1073/pnas.1019524108 (2011). [DOI] [PMC free article] [PubMed] [Google Scholar]
- 34.Rongvaux A et al. Development and function of human innate immune cells in a humanized mouse model. Nat Biotechnol 32, 364–372, doi: 10.1038/nbt.2858 (2014). [DOI] [PMC free article] [PubMed] [Google Scholar]
- 35.Yu H et al. A novel humanized mouse model with significant improvement of class-switched, antigen-specific antibody production. Blood 129, 959–969, doi: 10.1182/blood-2016-04-709584 (2017). [DOI] [PMC free article] [PubMed] [Google Scholar]
- 36.Das R et al. Microenvironment-dependent growth of preneoplastic and malignant plasma cells in humanized mice. Nat Med 22, 1351–1357, doi: 10.1038/nm.4202 (2016). [DOI] [PMC free article] [PubMed] [Google Scholar]
- 37.Sippel TR, Radtke S, Olsen TM, Kiem H-P & Rongvaux A Human hematopoietic stem cell maintenance and myeloid cell development in next-generation humanized mouse models. Blood advances 3, 268 (2019). [DOI] [PMC free article] [PubMed] [Google Scholar]
- 38.Roberts A et al. A mouse-adapted SARS-coronavirus causes disease and mortality in BALB/c mice. PLoS Pathog 3, e5, doi: 10.1371/journal.ppat.0030005 (2007). [DOI] [PMC free article] [PubMed] [Google Scholar]
- 39.Polak SB, Van Gool IC, Cohen D, von der Thusen JH & van Paassen J A systematic review of pathological findings in COVID-19: a pathophysiological timeline and possible mechanisms of disease progression. Mod Pathol 33, 2128–2138, doi: 10.1038/s41379-020-0603-3 (2020). [DOI] [PMC free article] [PubMed] [Google Scholar]
- 40.Tian S et al. Pathological study of the 2019 novel coronavirus disease (COVID-19) through postmortem core biopsies. Modern Pathology, 1–8 (2020). [DOI] [PMC free article] [PubMed] [Google Scholar]
- 41.Menter T et al. Postmortem examination of COVID-19 patients reveals diffuse alveolar damage with severe capillary congestion and variegated findings in lungs and other organs suggesting vascular dysfunction. Histopathology 77, 198–209 (2020). [DOI] [PMC free article] [PubMed] [Google Scholar]
- 42.Barton LM, Duval EJ, Stroberg E, Ghosh S & Mukhopadhyay S Covid-19 autopsies, oklahoma, usa. American Journal of Clinical Pathology 153, 725–733 (2020). [DOI] [PMC free article] [PubMed] [Google Scholar]
- 43.Nathan C Neutrophils and COVID-19: Nots, NETs, and knots. J Exp Med 217, doi: 10.1084/jem.20201439 (2020). [DOI] [PMC free article] [PubMed] [Google Scholar]
- 44.Shafran N et al. Secondary bacterial infection in COVID-19 patients is a stronger predictor for death compared to influenza patients. Sci Rep 11, 12703, doi: 10.1038/s41598-021-92220-0 (2021). [DOI] [PMC free article] [PubMed] [Google Scholar]
- 45.Russell CD et al. Co-infections, secondary infections, and antimicrobial use in patients hospitalised with COVID-19 during the first pandemic wave from the ISARIC WHO CCP-UK study: a multicentre, prospective cohort study. Lancet Microbe, doi: 10.1016/S2666-5247(21)00090-2 (2021). [DOI] [PMC free article] [PubMed] [Google Scholar]
- 46.Baharom F et al. Dendritic cells and monocytes with distinct inflammatory responses reside in lung mucosa of healthy humans. The Journal of Immunology 196, 4498–4509 (2016). [DOI] [PubMed] [Google Scholar]
- 47.Villani AC et al. Single-cell RNA-seq reveals new types of human blood dendritic cells, monocytes, and progenitors. Science 356, doi: 10.1126/science.aah4573 (2017). [DOI] [PMC free article] [PubMed] [Google Scholar]
- 48.Zhou Z et al. Heightened Innate Immune Responses in the Respiratory Tract of COVID-19 Patients. 27, 883–890 e882, doi: 10.1016/j.chom.2020.04.017 (2020). [DOI] [PMC free article] [PubMed] [Google Scholar]
- 49.Nienhold R et al. Two distinct immunopathological profiles in autopsy lungs of COVID-19. Nature communications 11, 1–13 (2020). [DOI] [PMC free article] [PubMed] [Google Scholar]
- 50.Tan L et al. Lymphopenia predicts disease severity of COVID-19: a descriptive and predictive study. Signal transduction and targeted therapy 5, 1–3 (2020). [DOI] [PMC free article] [PubMed] [Google Scholar]
- 51.Wang S et al. IL-21 drives expansion and plasma cell differentiation of autoreactive CD11c hi T-bet+ B cells in SLE. Nature communications 9, 1–14 (2018). [DOI] [PMC free article] [PubMed] [Google Scholar]
- 52.Jenks SA et al. Distinct effector B cells induced by unregulated toll-like receptor 7 contribute to pathogenic responses in systemic lupus erythematosus. Immunity 49, 725–739. e726 (2018). [DOI] [PMC free article] [PubMed] [Google Scholar]
- 53.Woodruff MC et al. Extrafollicular B cell responses correlate with neutralizing antibodies and morbidity in COVID-19. Nature immunology 21, 1506–1516 (2020). [DOI] [PMC free article] [PubMed] [Google Scholar]
- 54.Schultheiß C et al. Next-generation sequencing of T and B cell receptor repertoires from COVID-19 patients showed signatures associated with severity of disease. Immunity 53, 442–455. e444 (2020). [DOI] [PMC free article] [PubMed] [Google Scholar]
- 55.Stephens DS & McElrath MJ COVID-19 and the Path to Immunity. Jama 324, 1279–1281 (2020). [DOI] [PMC free article] [PubMed] [Google Scholar]
- 56.Grant RA et al. Circuits between infected macrophages and T cells in SARS-CoV-2 pneumonia. Nature, 1–10. [DOI] [PMC free article] [PubMed] [Google Scholar]
- 57.Dolan ME et al. Investigation of COVID-19 comorbidities reveals genes and pathways coincident with the SARS-CoV-2 viral disease. Scientific reports 10, 1–11 (2020). [DOI] [PMC free article] [PubMed] [Google Scholar]
- 58.Rodero MP et al. Detection of interferon alpha protein reveals differential levels and cellular sources in disease. J Exp Med 214, 1547–1555, doi: 10.1084/jem.20161451 (2017). [DOI] [PMC free article] [PubMed] [Google Scholar]
- 59.Peiffer-Smadja N & Yazdanpanah Y Nebulised interferon beta-1a for patients with COVID-19. The Lancet Respiratory Medicine (2020). [DOI] [PMC free article] [PubMed] [Google Scholar]
- 60.Davoudi-Monfared E et al. A randomized clinical trial of the efficacy and safety of interferon β−1a in treatment of severe COVID-19. Antimicrobial agents and chemotherapy 64 (2020). [DOI] [PMC free article] [PubMed] [Google Scholar]
- 61.Acharya D, Liu G & Gack MU Dysregulation of type I interferon responses in COVID-19. Nature Reviews Immunology 20, 397–398 (2020). [DOI] [PMC free article] [PubMed] [Google Scholar]
- 62.Blanco-Melo D et al. Imbalanced host response to SARS-CoV-2 drives development of COVID-19. Cell (2020). [DOI] [PMC free article] [PubMed] [Google Scholar]
- 63.McNab F, Mayer-Barber K, Sher A, Wack A & O’Garra A Type I interferons in infectious disease. Nat Rev Immunol 15, 87–103, doi: 10.1038/nri3787 (2015). [DOI] [PMC free article] [PubMed] [Google Scholar]
- 64.Major J et al. Type I and III interferons disrupt lung epithelial repair during recovery from viral infection. Science 369, 712–717, doi: 10.1126/science.abc2061 (2020). [DOI] [PMC free article] [PubMed] [Google Scholar]
- 65.Huang W et al. The Inflammatory Factors Associated with Disease Severity to Predict COVID-19 Progression. J Immunol 206, 1597–1608, doi: 10.4049/jimmunol.2001327 (2021). [DOI] [PubMed] [Google Scholar]
- 66.Leisman DE et al. Cytokine elevation in severe and critical COVID-19: a rapid systematic review, meta-analysis, and comparison with other inflammatory syndromes. The Lancet Respiratory Medicine (2020). [DOI] [PMC free article] [PubMed] [Google Scholar]
- 67.Low JS et al. Tissue-resident memory T cell reactivation by diverse antigen-presenting cells imparts distinct functional responses. Journal of Experimental Medicine 217 (2020). [DOI] [PMC free article] [PubMed] [Google Scholar]
- 68.Horns F, Dekker CL & Quake SR Memory B cell activation, broad anti-influenza antibodies, and bystander activation revealed by single-cell transcriptomics. Cell Reports 30, 905–913. e906 (2020). [DOI] [PMC free article] [PubMed] [Google Scholar]
- 69.Zhang J-Y et al. Single-cell landscape of immunological responses in patients with COVID-19. Nature immunology 21, 1107–1118 (2020). [DOI] [PubMed] [Google Scholar]
- 70.Kaneko N et al. Loss of Bcl-6-expressing T follicular helper cells and germinal centers in COVID-19. Cell 183, 143–157. e113 (2020). [DOI] [PMC free article] [PubMed] [Google Scholar]
- 71.Hutcheson J et al. Combined deficiency of proapoptotic regulators Bim and Fas results in the early onset of systemic autoimmunity. Immunity 28, 206–217 (2008). [DOI] [PubMed] [Google Scholar]
- 72.Davide FR et al. Convergent Antibody Responses to SARS-CoV-2 in Convalescent Individuals. Nature. [DOI] [PMC free article] [PubMed] [Google Scholar]
- 73.Cruz-Teran C et al. Challenges and opportunities for antiviral monoclonal antibodies as COVID-19 therapy. Advanced Drug Delivery Reviews (2020). [DOI] [PMC free article] [PubMed] [Google Scholar]
- 74.Casadevall A & Pirofski L -a. The convalescent sera option for containing COVID-19. The Journal of clinical investigation 130 (2020). [DOI] [PMC free article] [PubMed] [Google Scholar]
- 75.Chen P et al. SARS-CoV-2 neutralizing antibody LY-CoV555 in outpatients with Covid-19. New England Journal of Medicine (2020). [DOI] [PMC free article] [PubMed] [Google Scholar]
- 76.Schäfer A et al. Antibody potency, effector function, and combinations in protection and therapy for SARS-CoV-2 infection in vivo. Journal of Experimental Medicine 218 (2020). [DOI] [PMC free article] [PubMed] [Google Scholar]
- 77.Group RC Dexamethasone in hospitalized patients with Covid-19—preliminary report. New England Journal of Medicine (2020). [Google Scholar]
- 78.Ware LB Physiological and biological heterogeneity in COVID-19-associated acute respiratory distress syndrome. The Lancet Respiratory Medicine (2020). [DOI] [PMC free article] [PubMed] [Google Scholar]
- 79.Singanayagam A et al. Duration of infectiousness and correlation with RT-PCR cycle threshold values in cases of COVID-19, England, January to May 2020. Euro Surveill 25, doi: 10.2807/1560-7917.ES.2020.25.32.2001483 (2020). [DOI] [PMC free article] [PubMed] [Google Scholar]
- 80.Arons MM et al. Presymptomatic SARS-CoV-2 Infections and Transmission in a Skilled Nursing Facility. N Engl J Med 382, 2081–2090, doi: 10.1056/NEJMoa2008457 (2020). [DOI] [PMC free article] [PubMed] [Google Scholar]
- 81.Basile K et al. Cell-based culture of SARS-CoV-2 informs infectivity and safe de-isolation assessments during COVID-19. Clin Infect Dis, doi: 10.1093/cid/ciaa1579 (2020). [DOI] [PMC free article] [PubMed] [Google Scholar]
- 82.Decker A et al. Prolonged SARS-CoV-2 shedding and mild course of COVID-19 in a patient after recent heart transplantation. Am J Transplant 20, 3239–3245, doi: 10.1111/ajt.16133 (2020). [DOI] [PMC free article] [PubMed] [Google Scholar]
- 83.Folgueira MD, Luczkowiak J, Lasala F, Pérez-Rivilla A & Delgado R Persistent SARS-CoV-2 replication in severe COVID-19. medRxiv, 2020.2006.2010.20127837, doi: 10.1101/2020.06.10.20127837 (2020). [DOI] [Google Scholar]
- 84.Jeong HW et al. Viable SARS-CoV-2 in various specimens from COVID-19 patients. Clin Microbiol Infect 26, 1520–1524, doi: 10.1016/j.cmi.2020.07.020 (2020). [DOI] [PMC free article] [PubMed] [Google Scholar]
- 85.Liu WD et al. Prolonged virus shedding even after seroconversion in a patient with COVID-19. J Infect 81, 318–356, doi: 10.1016/j.jinf.2020.03.063 (2020). [DOI] [PMC free article] [PubMed] [Google Scholar]
- 86.van Kampen JJA et al. Duration and key determinants of infectious virus shedding in hospitalized patients with coronavirus disease-2019 (COVID-19). Nat Commun 12, 267, doi: 10.1038/s41467-020-20568-4 (2021). [DOI] [PMC free article] [PubMed] [Google Scholar]
- 87.Bussani R et al. Persistence of viral RNA, pneumocyte syncytia and thrombosis are hallmarks of advanced COVID-19 pathology. EBioMedicine 61, 103104 (2020). [DOI] [PMC free article] [PubMed] [Google Scholar]
- 88.Yu H et al. A novel humanized mouse model with significant improvement of class-switched, antigen-specific antibody production. Blood 129, 959–969, doi: 10.1182/blood-2016-04-709584 (2017). [DOI] [PMC free article] [PubMed] [Google Scholar]
- 89.Wei J et al. Genome-wide CRISPR screens reveal host factors critical for SARS-CoV-2 infection. Cell (2020). [DOI] [PMC free article] [PubMed] [Google Scholar]
- 90.Sun F, Xiao G & Qu Z Murine bronchoalveolar lavage. Bio-protocol 7, e2287 (2017). [DOI] [PMC free article] [PubMed] [Google Scholar]
- 91.Stuart T et al. Comprehensive integration of single-cell data. Cell 177, 1888–1902. e1821 (2019). [DOI] [PMC free article] [PubMed] [Google Scholar]
Associated Data
This section collects any data citations, data availability statements, or supplementary materials included in this article.
Supplementary Materials
Figure S1 (matched to Figure 1): A. Comparison of viral titers measured by PFU in homogenized lung tissue at 4 dpi using Vero E6 cells or Vero-ACE2+TMPRSS2+ cells. Vero-ACE2+TMPRSS2+ cells overexpress ACE222,23 and TMPRSS224, two receptors involved in SARS-CoV-2 infection. Vero-ACE2+TMPRSS2+ cells allow a more sensitive cell culture-based assay for quantification of SARS-CoV-2 titers.
B. Viral titers measured by PFU using Vero-ACE2+TMPRSS2+ cells and viral RNA in homogenized lung tissue at 2, 4, 7 14, 28, 35 dpi. Significance in viral titers (compared 4dpi) was determined by two-tailed unpaired t-test. Viral titers: 2dpi n=2, 4dpi n=5, 7dpi n=2, 14dpi n=8, 28dpi n=7, 35dpi n=6 biologically independent mice examined over at least 3 independent experiment for 14–35dpi. Significance in viral RNA (compared to 4dpi) was determined by Mann-Whitney, two-tailed test. Viral RNA: 2dpi n=4, 4dpi n=22, 7dpi n=6, 14dpi n=7, 28dpi n=8, 35dpi n=6 biologically independent mice examined over at least 3 independent experiment for 14–35dpi. Individual values for each mouse and means are plotted.
C. Weight change of individual mice reconstituted MISTRG6-hACE2 mice on 2,4,7,10,14,21, 28 and 35dpi. 2dpi n=37, 4dpi n=37, 7dpi n=23, 10dpi=16 14dpi n=15, 21dpi=12 28dpi n=10, 35dpi n=4 biologically independent mice examined over at least 3 independent experiment for 14–35dpi. Individual values for each mouse are plotted.
D. Representative H&E images (2x and 10x magnification) of all lungs used in comparison of histopathological scores (Fig. 1E) Each pair of images (2x, 10x magnification) represents an individual mouse. At 2dpi, MISTRG6-hACE2 mice showed prominent collection of proteinaceous debris in the alveolar spaces, which is the hallmark of the exudative phase of human COVID-19 pulmonary pathology. The debris was a mixture of necrotic pneumocytes and vasculopathy associated fibrin. Lungs at 4pi appeared to transition into the organizing phase, highlighted by infiltration of inter and intra alveolar space by lymphocytes macrophages, and fibroblasts (4dpi in Fig 1E–F, Fig S2D). The interalveolar spaces continued to expand between 14 and 28dpi by increasing accumulation of immune and stromal cells. Uninfected n=6, 2dpi n=7, 4dpi n=16, 7dpi n=5. 14dpi, n=10, 28dpi=6, 35dpi=4 biologically independent mice examined over at least 4 independent experiments.
E. Histopathology by H&E staining of infected lungs at higher magnifications at 28dpi. The interalveolar spaces continued to expand by increasing accumulation of immune and stromal cells. Representative of 6 mice examined over at least 4 independent experiments.
F. Representative images (40X) of trichrome staining of all lungs used in comparison of histopathological scores (Fig. 1F). Each image set represents an individual mouse. During 14 to 28dpi period, there was increasing deposition of collagen, highlighted by thickening of collagen bundles in the lung parenchyma and continued obliteration of alveolar architecture (Fig. 1E–F, Fig. S1D–G). These changes highlighted the transition from organizing phase to fibrotic phase. The architectural remodeling and collagen deposition was more pronounced at 28 and 35dpi resulting in replacement of normal alveolar architecture by dilated cystic spaces, separated by thick interstitial tissue bands (also in Fig. 1F). Uninfected n=6, 4dpi n=4, 14dpi, n=9, 28dpi=7, 35dpi=5 biologically independent mice examined over at least 3 independent experiments.
Figure S2 (matched to Figure 2): A. Representative gating strategy of human immune cells in the lungs of infected MISTRG-hACE2 mice.
G. Representative gating strategy and quantification of mouse immune cells and mouse neutrophils in the lungs of infected MISTRG-hACE2 mice. Mouse immune cells: Uninfected n=6, 2dpi n=6, 4dpi n=17, 7dpi n=5, 14dpi, n=6, 28dpi=6, biologically independent mice examined over at least 3 independent experiments. Mouse neutrophils: Uninfected n=3, 2dpi n=4, 4dpi n=11, 7dpi n=3, 14dpi, n=6, 28dpi=7, biologically independent mice examined over at least 3 independent experiments. Individual values for each mouse and means are plotted.
H. Immunohistochemistry (IHC) and H&E staining of matched lungs. Lungs were stained against human CD68, CD3 and CD20 staining. Uninfected n=2, 4dpi n=3, 14dpi, n=3, 28dpi=3, biologically independent mice examined over at least 2 independent experiments.
B. Side-by-side quantification of T (CD3), B(CD20) and macrophages (CD68) cells by IHC and flow cytometry (FC) of matched samples normalized to human immune cells (T+B+Macrophages). B cells were characterized with combined CD19, CD20 expression by flow cytometry. B cells quantified by CD20 expression alone may be underreported by IHC compared to the quantitation by FC. Uninfected n=2, 4dpi n=3, 14dpi, n=3, 28dpi=3, biologically independent mice examined over at least 2 independent experiments. Means with SD are presented.
C. Representative gating strategy for mature (CCR7+) and activated (CD83+) plasmacytoid dendritic cells (pDCs). Representative of n=5 biologically independent mice examined over 2 independent experiments.
Supplementary Table 1: Differentially regulated genes (DEGs) in SARS-CoV-2 infected lungs. Normalized counts, foldchanges in infected lungs compared with respect to uninfected mice and adjusted p values are presented for 516 mouse and 285 human differentially regulated genes. Following numbers of replicates were used in the study: Human genes: Uninfected n=5, 2dpi n=4, 4dpi n=7, 7dpi n=3, 14dpi n=2, 28dpi n=2 biologically independent mice examined over at least 2 independent experiments for all time points. Following numbers of replicates were used in the study: Human genes: Uninfected n=5, 2dpi n=4, 4dpi n=9, 7dpi n=3, 14dpi n=2, 28dpi n=2 biologically independent mice examined over at least 2 independent experiments for all time points. Mouse genes: Uninfected n=5, 2dpi n=4, 4dpi n=9, 7dpi n=3, 14dpi n=4, 28dpi n=2 biologically independent mice examined over at least 2 independent experiments for all time points. Whole tissue lung samples with less than 1% human reads were excluded from human DEG analysis (pre-established criterium). Differential expression analysis was performed with DESeq2 and statistical significance was deemed using Wald test.
Supplementary Table 2: Pathway analysis of mouse and human DEGs in SARS-CoV-2 infected lungs utilizing Gene Ontology(GO), Gene Set Enrichment Analysis (GSEA) and Ingenuity pathway analysis platforms. Following numbers of replicates were used in the study: Human genes: Uninfected n=5, 2dpi n=4, 4dpi n=7, 7dpi n=3, 14dpi n=2, 28dpi n=2 biologically independent mice examined over at least 2 independent experiments for all time points. Mouse genes: Uninfected n=5, 2dpi n=4, 4dpi n=9, 7dpi n=3, 14dpi n=4, 28dpi n=2 biologically independent mice examined over at least 2 independent experiments for all time points. Whole tissue lung samples with less than 1% human reads were excluded from human DEG analysis (pre-established criterium). Differential expression analysis was performed with DESeq2 and statistical significance was deemed using Wald test.
Supplementary Table 3: Distribution of Type I interferon stimulated genes (ISGs) in SARS-CoV-2 infected lungs during the course of infection. Normalized counts for Type I interferon stimulated genes (ISGs) within human DEGs are presented. Following numbers of replicates were used in the study: Human genes: Uninfected n=5, 2dpi n=4, 4dpi n=7, 7dpi n=3, 14dpi n=2, 28dpi n=2 biologically independent mice examined over at least 2 independent experiments for all time points. Mouse genes: Uninfected n=5, 2dpi n=4, 4dpi n=9, 7dpi n=3, 14dpi n=4, 28dpi n=2 biologically independent mice examined over at least 2 independent experiments for all time points. Whole tissue lung samples with less than 1% human reads were excluded from human DEG analysis (pre-established criterium). Differential expression analysis was performed with DESeq2 and statistical significance was deemed using Wald test. For IFN-stimulated gene identification, http://www.interferome.org was used with parameters -In Vivo, Homo sapiens -fold change up 2 and down 2.
Supplementary Table 4: Genes that correlate with systemic lymphopenia. Top 50 negatively and positively correlating genes were ranked using Pearson’s r comparing normalized counts for each gene and the corresponding splenic T cell frequency out of total human immune cells. Following numbers of replicates were used in the comparison: Human genes: Uninfected n=5, 2dpi n=4, 4dpi n=7, 7dpi n=3, 14dpi n=2, 28dpi n=2 biologically independent mice examined over at least 2 independent experiments for all time points. Whole tissue lung samples with less than 1% human reads were excluded from correlation analysis (pre-established criterium).
Data Availability Statement
All data that support the findings of this study are available within the paper and its Supplementary Information files. The data supporting this publication is available at Figshare.com under project “A Humanized Mouse Model of COVID-19” (https://figshare.com/projects/A_humanized_mouse_model_of_COVID-19/125659).
All 10x Genomics single cell RNA sequencing and bulk RNA sequencing data that support the findings of this study was deposited in the Gene Expression Omnibus (GEO) repository with accession codes GSE186794.