

ABSTRACT
Background
Everolimus is a potential alternative to embolization and nephrectomy for managing tuberous sclerosis complex (TSC)-associated renal angiomyolipoma (AML). In 2016, National Health Service England approved its use through regional centres for renal AML ≥30 mm showing interval growth. Evidence of lesion stabilization or reduction after 6 months is mandated for continuation of long-term treatment.
Methods
From November 2016 to June 2021, all potentially eligible adult TSC patients with AML across Yorkshire and Humber were referred for assessment and monitoring. Eligible patients underwent baseline renal magnetic resonance imaging (MRI) assessment and a follow-up MRI scan after 6 months on everolimus. Dose titration was guided by trough levels and lesion responsiveness using a new 3D MRI volumetric protocol.
Results
Of 28 patients commencing treatment, 19 tolerated everolimus for >3 months. Overall, 11 patients (40%) discontinued treatment, mostly due to recurrent infections (42%) and allergic reactions (25%). Sixty-eight percent required dose adjustments from the initiating dose (10 mg) due to sub-optimal trough levels (38%), minimal AML response (15%) or adverse events (47%). 3D volumetric assessment confirmed a reduction in AML volume of a pre-selected index lesion in all treatment-naïve cases (n = 14), showing superiority over 2D measurements of lesion diameter.
Conclusion
In this cohort, everolimus promoted AML regression in all patients who tolerated the drug for >6 months with stabilization observed over 3 years. Trough levels enabled individual dose titration to maximize responsiveness and minimize side effects. The use of 3D MRI assessment of lesion volume was superior to 2D measurements of lesion diameter in monitoring treatment response.
Keywords: angiomyolipoma, everolimus, monitoring, safety, treatment outcome, tuberous sclerosis complex
Graphical Abstract
Graphical Abstract.

INTRODUCTION
Tuberous sclerosis complex (TSC) is an autosomal dominant disease with an estimated incidence of 1 in 6000 births [1]. TSC is caused by mutations in either TSC1 or TSC2, with 70–80% of cases resulting from sporadic mutations [2]. These genes encode the hamartin and tuberin proteins, respectively, which regulate the mammalian target of the rapamycin (mTOR) pathway. TSC is mainly diagnosed clinically according to standard 2012 diagnostic criteria with genetic testing performed in cases of diagnostic uncertainty [3].
Dysregulation of the mTOR pathway forms the molecular basis of TSC pathology. mTOR is a serine-threonine kinase and forms two separate complexes, mTOR complex 1 (mTORC1) and mTOR complex 2 (mTORC2). mTORC1 and mTORC2 are differentiated by their interactions, substrate specificity, sensitivity to rapamycin, or respective analogues [4]. Functionally, mTORC1 promotes cell growth and metabolism through promoting mRNA translation, anabolism and protein turnover, while mTORC2 regulates cellular proliferation and survival through regulating cytoskeleton organization, cell migration, ion transport and apoptosis [5].
Angiomyolipomas (AML) are common in TSC, occurring in 80% of TSC patients, and are the leading cause of death in adult TSC due to tumour rupture, bleeding and renal failure [6, 7]. They are benign mesenchymal tumours formed by dysplastic blood vessels, smooth muscle cells and adipose tissue originating from perivascular epithelioid cells [8]. AMLs are typically asymptomatic, slow-growing, bilateral and multifocal. However, AML ≥4 cm can become symptomatic in 68–80% of patients, with flank pain, haematuria or palpable mass, with 50–60% presenting with haemorrhage [9]. Additionally, AML can compress normal renal parenchyma, eventually resulting in end-stage kidney failure [10]. The options for acute management of AML-related bleeding include embolization and surgery. However, these are unsuitable for long-term AML management since either procedure will also damage surrounding healthy parenchyma [11]. In addition, coalescent renal AML are difficult to treat this way and recurrence requires repeated intervention [12].
The mTOR inhibitor everolimus offers a precision medicine approach to treating the underlying disease mechanism in TSC, the multifocal nature of AMLs, minimizing recurrence and addressing other systemic features of TSC. Everolimus directly binds to and inhibits mTORC1, disrupting mRNA translation of proteins involved in cell growth, metabolism and angiogenesis [12]. Correspondingly, the examining everolimus in a Study of Tuberous sclerosis complex (EXIST)-2 trial demonstrated the effectiveness of everolimus in reducing the growth of AMLs [13]. Additionally, the EXIST-1 and -3 trials demonstrated that everolimus improved other features of TSC, including subependymal giant cell astrocytomas (SEGA), seizure frequency and skin lesions [14, 15].
The 2012 International Tuberous Sclerosis Complex Consensus Conference recommended mTOR inhibitors, selective embolization or partial nephrectomy as second-line treatment options for asymptomatic TSC-associated renal AML with a diameter of >3 cm [7]. In 2016, National Health Service (NHS), England approved the use of everolimus in managing TSC-associated AMLs through specialized expert centres. Approved indications were (i) AMLs related to a clinical diagnosis of TSC; and (ii) AMLs of >3 cm diameter demonstrating interval growth [16]. NHS England also mandated evidence of AML stabilization and size reduction on renal magnetic resonance imaging (MRI) or computed tomography (CT) after 6 months of treatment for long-term continuation of treatment [16]. Careful long-term clinical monitoring of treated patients is also necessary for toxicity and side effects [17–19].
There are limited long-term and real-life data on the use of everolimus in renal AML. To our knowledge, only two small studies studying the outcomes of everolimus >3 years of treatment have been published: a Spanish study of four patients over 6 years [20] and a Chinese study of eight patients over 3 years [21], both showing similar efficacy and safety profiles as EXIST-2. In this article, we present 5-year data (2016–21) on the management and outcomes of TSC patients referred to a UK regional specialist centre who were assessed and started on everolimus. We report our experience of monitoring treatment response using novel 3D volume image analysis, serum trough levels and the overall tolerability of everolimus.
MATERIALS AND METHODS
Patient referrals
In September 2016, a regional consultant-led everolimus clinic for renal TSC was established at Sheffield, following the approval of everolimus for the treatment of TSC-AML by NHS England to be prescribed through approved expert tertiary centres and administered through the BlueTeq High-Cost Drug scheme. As the only adult regional centre in Yorkshire and Humber (YnH), all referrals for this indication across the region, a population of approximately 5 million, were assessed at Sheffield. The distribution of referring specialties and referrals from different subregions is shown in Figure 1 and Supplementary data, Table S1. TSC diagnosis was confirmed either clinically or genetically according to the diagnostic criteria laid out by the 2012 International Tuberous Sclerosis Complex Consensus Group [3]. Treatment eligibility was in line with NHS England criteria [16, 22].
FIGURE 1:

Map of referrals of TS patients with AML to Sheffield from across and outside the Yorkshire and Humber region between 2016 and 2021. The size of the circles is proportional to the numbers of patients referred per million population.
Drug initiation, titration and monitoring
All eligible patients were commenced on everolimus (10 mg daily) and followed up monthly for the first 3 months or until they were clinically stable on treatment. Patients had telephone access to a clinical nurse specialist for advice. Adverse events were monitored through patient-reported events, blood results, urinalysis and graded according to the Common Terminology Criteria for Adverse Events 3.0 [23]. Trough levels were taken at every clinic visit and sent to a central laboratory (St Georges Hospital, London). Daily dosing was adjusted to a therapeutic range of 5–15 ng/mL, tolerability of adverse events and AML response. During intercurrent illness (usually infection), treatment was temporarily halted for up to 4 weeks. In patients where treatment cessation exceeded 4 weeks, treatment was considered to be discontinued and the duration for any subsequent reinstatement of treatment recalculated. Baseline characteristics including demographics and imaging results were obtained and recorded from initiation of treatment to the latest clinic visit.
MRI/CT imaging protocol
Renal MRI (occasionally CT) was obtained at baseline, 6 months and annually thereafter. The same imaging modality was used throughout for each patient. MR images were acquired using either 1.5T Avanto Refit or 1.5T Area scanners using sequences shown in Supplementary data, Table S2. The most well-defined lesion was determined by a radiologist and used as the target lesion. Volume and diameter were measured at baseline and in all follow-up studies by a single analyst (P.M.). At baseline, lesion volume was measured by segmenting each slice using commercial software MIM Maestro (MIM Software Inc., Cleveland, OH, USA). All sequences were displayed on the same monitor and any misalignment between images was corrected using a localized rigid registration tool. The contour was delineated using the sequence with the best demarcation of lesion boundary: this varies between patients owing to the variation in tissue composition found with AMLs. The contour was displayed simultaneously on all images. The maximum oblique lesion diameter was automatically calculated from the volume. At follow-up, the same sequence was used to segment the target lesion. An adaptive deformable re-contouring workflow available in MIM Maestro was used to automatically segment the lesion in the follow-up study [24].
Statistical analysis
Quantitative variables were reported as mean ± standard deviation for normally distributed data or median with inter-quartile range 25th and 75th percentiles (IQR25, IQR75) for non-normally distributed data, according to Kolmogorov–Smirnov and Shapiro–Wilks tests. Qualitative variables were reported as absolute frequencies and percentages. All missing data were excluded from the analysis. Target AML diameter and volume changes were analysed using paired t-test and Wilcoxon's signed-rank test respectively. A P-level of <0.05 was considered to be statistically significant. All statistical analyses were performed with SPSS Version 26.
Ethics statement
Patients who underwent genetic testing for TSC in the UK NHS individually consented. All data has been de-identified in this service evaluation.
RESULTS
Referral patterns and overall experience
Between September 2016 and June 2021, 37 adult TSC patients with AMLs were referred to Sheffield for consideration of everolimus treatment. Although the majority were from Sheffield, 62% came from general practice or other hospitals within and outside the region (Figure 1, Supplementary data, Table S1). There was a wide range in the number of referrals (expressed per million population) from different subregions ranging from 0.98 (Cambridgeshire) to 22.6 (Sheffield). Excluding the one patient from Cambridgeshire (referred from outside the normal catchment area), the total number of referrals from within the YnH region (total population 5 018 000) over this period was 36 or 7.8 per million population (pmp). Of these, 19 patients were still on treatment after 12 months equating to 3.8 patients pmp/per year. Based on NHS commissioning figures in 2016 for a total UK population of 63.5 million and estimated annual rates of TS-AML patients on treatment after 12 months for the regional population (calculated 2.38 pmp, YnH), this represents a 37% higher patient numbers treated at 1 year.
Figure 2 summarizes the treatment pathway and clinical outcomes for these patients. Twenty-eight everolimus-naïve patients (75.7%) were commenced on everolimus with a median treatment duration of 19.5 (range, 0.5–46) months. This included two patients previously treated with sirolimus but transferred to everolimus in line with NHS England guidance. Forty percent (11/28) discontinued treatment due to infection (33.3%), non-attendance (8.3%) or other adverse event (58.3%): 32% (9/28) discontinued within 3 months. Patients who did not discontinue treatment within 3 months were able to tolerate treatment for at least 12 months (n = 19). Of these, 73.7% (14/19) experienced dose interruptions (37%) and/or dose reductions (68%), a similar proportion to EXIST-2 (80%) [13]. Indeed, only 31% (6/19) maintained their original dose of 10 mg: 52% (10/19) had dose reductions due to high trough levels or adverse events while 16% (3/19) had a dose increase due to low trough levels and minimal AML response at 10 mg.
FIGURE 2:

Flowchart summarizing 37 TS patients referred for assessment of eligibility for everolimus initiation and their outcomes over 55 months. LFT, liver function test.
Baseline demographics
The baseline demographics of our cohort is summarized in Table 1. There was a similar sex, age and race distribution to the EXIST-2 trial, where 64% were female, the mean age was 34.4 ± 13.8 years and ethnicity was predominantly White (89%) [13]. Eighty-two percent (23/28) had diagnosed epilepsy at baseline, 21% (6/21) reported previous embolization and 1 patient had a partial nephrectomy. Eighty-nine percent (25/28) had a negative family history.
Table 1.
Baseline demographics of patients started on everolimus at our centre
| Characteristic | Everolimus, N = 28 | EXIST-2 trial, N = 112 |
|---|---|---|
| Age, years (mean ± SD) | 34.4 ± 13.8 | 32.5 ± 10.4 |
| Age, category, years, n (%) | ||
| <30 | 11 (39) | 49 (44) |
| ≥30 | 17 (61) | 63 (56) |
| Gender, n (%) | ||
| Male | 10 (36) | 39 (35) |
| Female | 18 (64) | 73 (65) |
| Race, n (%) | ||
| White | 25 (89) | 99 (88) |
| Asian | 2 (7.1) | 11 (9.8) |
| Black African | 1 (3.6) | 0 |
| Diagnosis, n (%) | ||
| Tuberous sclerosis | a27 (96) | 107 (96) |
| Epilepsy, n (%) | ||
| Present | 23 (82) | |
| 0 AE | 4 (14) | |
| 1 AE | 6 (21) | |
| 2 AE | 11 (39) | |
| 3 AE | 2 (7.1) | |
| Absent | 5 (18) | |
| Renal functionb, n (%) | ||
| CKD 1 | 13 (68) | 104 (92.9) |
| CKD 2 | 2 (11) | |
| CKD 3 | 4 (21) | |
| CKD 4 | 0 | |
| CKD 5 | 0 | |
| Previous kidney surgery | ||
| Prior renal AML-related surgery, n (%) | 6 (21) | 42 (38) |
| Prior nephrectomy | 1 (3.6) | 21 (19) |
| Family history, n (%) | ||
| Present | 2 (7.1) | |
| Absent | 25 (89) | |
| Unknown | 1 (3.6) |
One patient with multiple AMLs did not fulfil genetic or clinical criteria for TSC.
Baseline renal function of patients on everolimus for >3 months. AED, anti-epileptic drugs; CKD, chronic kidney disease.
Baseline renal function
All patients on everolimus for >3 months had a baseline estimated glomerular filtration rate (eGFR) of ≥30 mL/min/1.73 m2, the majority having a baseline eGFR of ≥90 mL/min/1.73 m2: chronic kidney disease (CKD) stage 1 (68%), CKD stage 2 (11%), CKD stage 3 (21%). All patients (n = 19) maintained the same CKD stage as a baseline throughout treatment, with no significant change in eGFR. There was a negative correlation between baseline eGFR and age indicating the likely loss of kidney function over time due to AML (Figure 3).
FIGURE 3:
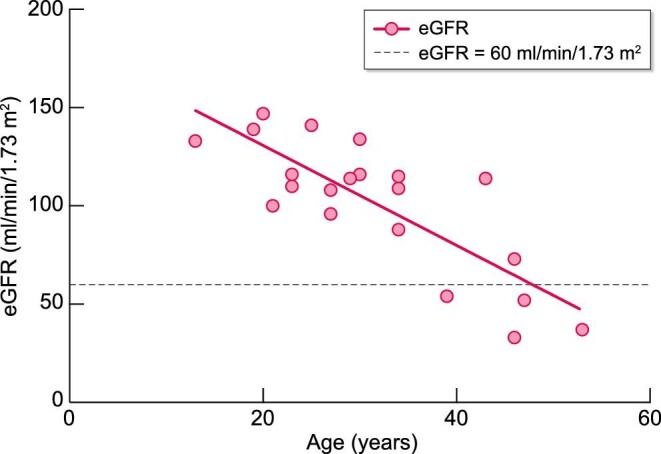
Age and renal function (eGFR) of patients on everolimus for >3 months at their baseline assessment visit.
Adverse events
Of the 28 patients who started on everolimus, 4 (14%) did not experience any adverse events. Infection was the most common cause of treatment discontinuation (33%). The most common non-infective adverse events experienced were mouth ulcers (29%) and hypercholesterolaemia (29%) (Table 2, Supplementary data, Table S3). Only one patient had everolimus discontinued due to abnormal liver function tests.
Table 2.
Adverse events reported or detected
| Adverse event | n (%) | Number of patients who discontinued treatment due to adverse effect, n (%) |
|---|---|---|
| Mouth ulcers | 8 (29) | 1 (3.6) |
| Hypercholesterolaemia | 8 (29) | 0 |
| Infection | 9 (32) | 5 (18) |
| URTIa | 4 (14) | 2 (7.1) |
| LRTIb | 2 (7.1) | 1 (3.6) |
| UTIc | 3 (11) | 0 |
| Sepsis | 1 (3.6) | 1 (3.6) |
| Ear infection | 1 (3.6) | 1 (3.6) |
| Abnormal lab results | ||
| Anaemia | 6 (21) | 0 |
| Deranged LFTd | 2 (7.1) | 1 (3.6) |
| Thrombocytopaenia | 2 (7.1) | 0 |
| Raised glucose | 1 (3.6) | 0 |
| Rash | 5 (18) | 3 (11) |
| Acne-like skin lesion | 3 (11) | 0 |
| Itching | 2 (7.1) | 1 (3.6) |
| Others | 4 (14) | 0 |
Upper respiratory tract infection.
bLower respiratory tract infection.
cUrinary tract infection.
dLiver function test.
Proteinuria
No patient had clinically significant proteinuria (<50 mg/mmol) prior to commencing everolimus. Thirty-one percent (5/16) had proteinuria >50 mg/mmol after commencing everolimus. Proteinuria returned to baseline levels in three patients after dose reduction and/or blood pressure control. In two other patients, everolimus was discontinued for other reasons. Urinalysis was not performed in three patients due to difficulties in obtaining urine samples.
Hypertension
A total of 16% (3/19) developed hypertension after starting everolimus, of which two patients had associated increased proteinuria. Hypertension and proteinuria were normalized (n = 2) or improved (n = 1) using ramipril.
Haematology
A total of 21% (4/19) experienced worsening of anaemia after commencing everolimus: all three patients with grade 2 anaemia had baseline grade 1 anaemia. In one patient, the fall in haemoglobin correlated with a trough level above the therapeutic range and haemoglobin levels corrected after a dose reduction to achieve therapeutic levels. Eleven percent (2/19) developed thrombocytopaenia, associated with high trough levels in one patient; thrombocytopaenia resolved in both patients after dose reduction. All patients had a normal leukocyte count during treatment.
Liver function tests
In one patient, everolimus was discontinued due to a grade 3 raised transaminase at 1 month. In patients taking everolimus for >3 months, deranged transaminases (ALT, AST) were observed in 26% (5/19). One patient had raised transaminase levels at baseline which remained stable throughout the treatment course. The remaining four patients had normal transaminase levels at baseline prior to initiating treatment: the derangement in transaminase levels was attributed to concomitant statin treatment (two), an uncertain cause that resolved spontaneously (one) or to everolimus (one). Finally, one patient experienced a rise in gamma-glutamyl transferase levels during treatment which stabilized without dose changes.
Metabolic changes
Everolimus was not associated with new-onset diabetes in this study. Serum cholesterol levels were increased in 47% (9/19), with 37% (7/19) attaining levels indicated for cholesterol-lowering drugs: cholesterol-lowering drugs reduced cholesterol levels in six patients.
Trough levels and potential drug interactions
Trough levels exceeded the therapeutic range in 11% (2/19). Two drugs, ACE-inhibitors (n = 6) and carbamazepine (n = 7), with known interactions with everolimus (increased risk of angioedema and reduced everolimus concentration, respectively), were frequently prescribed [25, 26]. No patients experienced angioedema in our study. Three patients on carbamazepine had low trough levels, requiring a dose increase to 12.5 mg and 15 mg, respectively, while the remaining patient had a dose reduction due to adverse events.
Response to treatment
Treatment response in 14 everolimus-naïve patients was analysed by 3D volumetric analysis based on serial MR or CT imaging as shown in Table 3. No patient had AML progression, defined from EXIST-2 as ≥25% increase in AML volume or ≥20% increase in either kidney volume from baseline, new AML ≥1 cm, or grade ≥2 AML-related bleeding [27]. We excluded patients on previous sirolimus treatment (n = 2), unavailable pre-treatment (n = 1) or post-treatment (n = 1) scans.
Table 3.
Treatment response to everolimus based on 3D volumetric analysis of a target AML lesion
| N | |||
|---|---|---|---|
| Patients on treatment for >6 months | 19 | ||
| Included from analysis | 13 | ||
| Excluded from analysisa | 6 | ||
| AML measurements | Baseline | At 6 months of treatment | P |
| Median (IQR25, IQR75) volume of target AML (mL) Mean maximum diameter of target AML (cm) Mean reduction in volume of target AML (%) |
11.6 (7.8, 40.1) 4.2 ± 1.5 |
7.6 (4.1, 7.6) 4.0 ± 1.9 36.5 ± 25.5 |
0.001b <0.001c |
Excluded due to insufficient information (5), total kidney volume measurement taken instead (1)
Wilcoxon signed-rank test.
Paired t-test.
MR volumetric measurements of index AML were obtained in 13 patients while CT measurement of total kidney volume (TKV) was obtained in 1 patient (Figure 4). The mean maximum diameter of index AML at baseline was 4.2 ± 1.5 cm with a corresponding median volume of 11.6 (7.8, 40.1) cm3 (n = 13). After 6 months of treatment, the mean index AML maximum diameter was 4.0 ± 1.9cm, with a median volume of 7.6 (4.1, 7.6) cm3, equating to an average volume reduction at 6 month of 36.5 ± 25.5% from baseline. In the patient who had CT imaging, a 34% reduction in TKV was measured at 6 months.
FIGURE 4:

Percentage change in target AML volume over treatment course for patients on everolimus for >6 months with available baseline and serial MRI scans (n = 14).
We also compared changes in maximum lesion diameter to volume in each patient. In eight patients, a decrease in diameter was associated with a reduction in volume as expected. In five patients, however, an increase in diameter was seen despite a reduction in volume at 6 months (Supplementary data, Figure S1). In one patient with an index lesion unresponsive at 6 months (EV20), a second lesion was retrospectively analysed showing volume reduction.
A representative serial MRI image is shown in Supplementary data, Figure S2. The reduction in AML volume in most patients was greatest at 6 months compared with subsequent scans. AML size or TKV was noted to stabilize after 6 months in all treatment-naïve patients with available imaging (n = 12): 67% (8/12) achieved further reductions over 18–42 months, while 33% (4/12) maintained stable disease. No subsequent imaging was available in the two patients. Our results confirm previous reports of the efficacy of everolimus on AML growth in routine clinical practice [13, 20, 28].
DISCUSSION
This article reports the largest clinical case series to date of TSC-AML patients treated with everolimus for 5 years. Our experience confirms the efficacy of everolimus in treating AML but provides valuable ‘real-world’ data of patient tolerability and experience in managing its safe and effective use in the clinic. In general, adverse events especially mouth ulcers and rashes were most common during the first 3 months of treatment leading to the most frequent discontinuations during this period (n = 9). Patients who were able to tolerate everolimus for 3 months (n = 19) were able to continue treatment for at least 12 months. Treatment discontinuation after 12 months (n = 3) was rare but due to recurrent infections (n = 2) and clinic non-attendance (n = 1). Adverse events observed were consistent with the known safety profile of everolimus and were mostly low grade, apart from a single grade 3 raised transaminase [23]. Mouth ulcers (29%) and hypercholesterolaemia (29%) were the most common adverse events recorded, with frequencies similar to the extended 4-year EXIST-2 study [27]. This contrasts with a much higher incidence of stomatitis occurring in 91% (46/47) of patients in a 2-year observational Japanese study of 47 patients, suggesting ethnic differences in the adverse event profile [28].
Overall, the average daily dose prescribed was 8.4 mg, similar to 8.6 mg in EXIST-2. Nonetheless, trough levels within the therapeutic range at any point in the treatment course were observed in only 33% of patients (7/21) regardless of dose. Despite suboptimal levels, a good radiological response was observed in two patients but a minimal response seen in three others. NHS England guidance states that treatment should be discontinued in the absence of AML stabilization after 6 months of everolimus at the maximum tolerated dose up to a daily dose of 10 mg [16]. Our findings indicate that some patients may require more than 10 mg to achieve an optimal response.
A radiological response in AML volume was defined as ≥50% reduction in AML volume from baseline, while disease stabilization was defined as <50% reduction in AML volume from baseline and <25% increase in AML volume over nadir [27]. At 6 months, AML volume was reduced by ≥50% in 36% (5/14) of patients with available imaging in our cohort, a lower response rate compared with EXIST-2 (55%) (39/71) [13]. In the extended EXIST-2 trial, 58% of patients achieved radiological response at any time while 30.4% achieved stable disease [27], whereas 43% (6/14) achieved a volume reduction response at any time while the remaining 57% (8/14) attained disease stability in our study. One potential difference is that we monitored the response of a single index lesion in almost all cases (13/14), whereas EXIST-2 measured the total volumes of several target AMLs. AML response has been defined differently across published studies, with various measurements of diameters of the largest kidney [29] or summation of the volumes of several target AMLs [30–33].
We found the analysis of AML volume from 3D MRI reconstruction was more accurate in determining AML response than diameter. All patients with a radiological response at 6 months demonstrated either stability (n = 4) or further decreases (n = 8) in AML volume on subsequent annual imaging. This confirms data from the extended EXIST-2 trial of persistent reduction in AML volume in 85.7% of patients over an extended treatment period of up to 55 months, with 81.3% of AML progression preceded by dose reduction or interruption [27]. Other published studies also support the long-lasting effects of everolimus on AML stabilization [20, 21].
Our observation that baseline eGFR declines with increasing age is in agreement with the literature, which shows a steeper renal function decline with age in TSC-AML patients in comparison with the general population [32]. CKD is more prevalent in TSC compared with an age-matched population, with 40% having significant eGFR impairment (<60 mL/min/1.73 m2) in patients older than 30 years [33, 34]. Overall, 4.1% of TSC patients reportedly reached CKD stage 3/4 while 4.4% developed end-stage kidney failure, with a median age of 58.5 years [34]. A greater AML disease severity also correlates with advanced CKD and age, implying AML progression over time [32, 35]. Our study demonstrated preservation of baseline kidney function throughout treatment, indicating additional benefits of everolimus in reducing TSC-associated renal function decline. Similar follow-up data from EXIST-2 showed stabilization or improvement in mean eGFR, with declining renal function observed in only a few patients with a baseline eGFR <30 mL/min/1.73 m2 [36]. The underlying mechanisms by which everolimus slows TSC-associated eGFR decline however remain unclear but could include a direct effect on AML shrinkage or other cellular effects directly mediated by mTORC1 [37].
The inherent limitations of our study were of a single regional centre of adult TSC patients of predominant White ethnicity, thus limiting the generalizability of our results to paediatric populations and other races. We only received referrals related to renal AMLs and did not systematically record data on the prevalence of extra-renal features or their response to everolimus. Our data suggest that more patients in our region are being commenced on everolimus than originally estimated by commissioners. It would be of interest to investigate potential regional or centre-specific variation across the UK in a future study.
CONCLUSION
Everolimus promoted AML regression in all TSC patients who tolerated the drug for >3 months, with stabilization observed over 3 years. Trough levels enabled individual dose titration to maximize responsiveness and minimize side effects. Our study also demonstrated the stabilization of baseline kidney function throughout treatment, indicating additional benefits of everolimus in reducing TSC-associated renal function decline. The use of 3D MRI assessment of lesion volume was superior to 2D measurements of lesion diameter in monitoring treatment response.
Supplementary Material
ACKNOWLEDGEMENTS
We thank Peter Brown for help in refining MR sequence acquisition, Manoj Kumar for generating Figure 1, Julie Nichols and Tim Ellam for initial input in helping establish the Sheffield TS everolimus service.
Contributor Information
Noelle K X Chung, The Medical School, University of Sheffield, Sheffield, UK; Sheffield Kidney Institute, Sheffield Teaching Hospitals NHS Foundation Trust, Sheffield, UK.
Peter Metherall, 3D Lab, Medical Imaging and Medical Physics, Sheffield Teaching Hospitals NHS Foundation Trust, Sheffield, UK.
Janet A McCormick, Sheffield Kidney Institute, Sheffield Teaching Hospitals NHS Foundation Trust, Sheffield, UK.
Roslyn J Simms, Sheffield Kidney Institute, Sheffield Teaching Hospitals NHS Foundation Trust, Sheffield, UK.
Albert C M Ong, The Medical School, University of Sheffield, Sheffield, UK; Sheffield Kidney Institute, Sheffield Teaching Hospitals NHS Foundation Trust, Sheffield, UK; Academic Nephrology Unit, Department of Infection, Immunity and Cardiovascular Disease University of Sheffield Medical School, Sheffield, UK.
AUTHORS’ CONTRIBUTIONS
N.K.X.C. collected and analysed data and wrote the article; P.M. defined MR sequence acquisition parameters for 3D volume imaging and analysed all AMLs reported in the study; J.A.M. and R.J.S. collected and recorded data; A.C.M.O. designed and supervised the study and wrote the article. All authors read and approved the final manuscript.
FUNDING
No external funding received.
CONFLICT OF INTEREST STATEMENT
No conflicts declared. The results presented in this article have not been published previously in whole or part, except in abstract form.
REFERENCES
- 1.Osborne J, Fryer A, Webb D. Epidemiology of tuberous sclerosis. Ann N Y Acad Sci 1991; 615: 125–127 [DOI] [PubMed] [Google Scholar]
- 2.Sampson JR, Scahill SJ, Stephenson JBet al. Genetic aspects of tuberous sclerosis in the west of Scotland. J Med Genet 1989; 26: 28–31 [DOI] [PMC free article] [PubMed] [Google Scholar]
- 3.Northrup H, Krueger D. Tuberous sclerosis complex diagnostic criteria update: recommendations of the 2012 International Tuberous Sclerosis Complex Consensus Conference. Pediatr Neurol 2013; 49: 243–243 [DOI] [PMC free article] [PubMed] [Google Scholar]
- 4.Huang J, Manning B. A complex interplay between Akt, TSC2 and the two mTOR complexes. Biochem Soc Trans 2009; 37: 217–222 [DOI] [PMC free article] [PubMed] [Google Scholar]
- 5.Saxton R, Sabatini D. mTOR signaling in growth, metabolism, and disease. Cell 2017; 168: 960–976 [DOI] [PMC free article] [PubMed] [Google Scholar]
- 6.Franz DN, Bissler JJ, McCormack FX. Tuberous sclerosis complex: neurological, renal and pulmonary manifestations. Neuropediatrics 2010; 41: 199–208 [DOI] [PMC free article] [PubMed] [Google Scholar]
- 7.Kingswood J, Bissler J, Budde Ket al. Review of the tuberous sclerosis renal guidelines from the 2012 consensus conference: current data and future study. Nephron 2016; 134: 51–58 [DOI] [PubMed] [Google Scholar]
- 8.Pan CC, Chung MY, Ng KFet al. Constant allelic alteration on chromosome 16p (TSC2 gene) in perivascular epithelioid cell tumour (PEComa): genetic evidence for the relationship of PEComa with angiomyolipoma. J Pathol 2008; 214: 387–393 [DOI] [PubMed] [Google Scholar]
- 9.Halpenny D, Snow A, McNeill Get al. The radiological diagnosis and treatment of renal angiomyolipoma-current status. Clin Radiol 2010; 65: 99–108 [DOI] [PubMed] [Google Scholar]
- 10.Kothary N, Soulen M, Clark Tet al. Renal angiomyolipoma: long-term results after arterial embolization. J Vasc Interv Radiol 2005; 16: 45–50 [DOI] [PubMed] [Google Scholar]
- 11.Sooriakumaran P, Gibbs P, Coughlin Get al. Angiomyolipomata: challenges, solutions, and future prospects based on over 100 cases treated. BJU Int 2010; 105: 101–106 [DOI] [PubMed] [Google Scholar]
- 12.Curatolo P, Moavero R. mTOR inhibitors in tuberous sclerosis complex. Curr Neuropharmacol 2012; 10: 404–415 [DOI] [PMC free article] [PubMed] [Google Scholar]
- 13.Bissler JJ, Kingswood JC, Radzikowska Eet al. Everolimus for angiomyolipoma associated with tuberous sclerosis complex or sporadic lymphangioleiomyomatosis (EXIST-2): a multicentre, randomised, double-blind, placebo-controlled trial. Lancet 2013; 381: 817–824 [DOI] [PubMed] [Google Scholar]
- 14.French JA, Lawson JA, Yapici Zet al. Adjunctive everolimus therapy for treatment-resistant focal-onset seizures associated with tuberous sclerosis (EXIST-3): a phase 3, randomised, double-blind, placebo-controlled study. Lancet 2016; 388: 2153–2163 [DOI] [PubMed] [Google Scholar]
- 15.Franz DN, Belousova E, Sparagana Set al. Long-term use of everolimus in patients with tuberous sclerosis complex: final results from the EXIST-1 study. PLoS One 2016; 11: e0158476. [DOI] [PMC free article] [PubMed] [Google Scholar]
- 16.Specialised Commissioning Team, NHS England . Clinical Commissioning Policy Statement: Everolimus (Votubia®) for treatment of angiomyolipomas associated with tuberous sclerosis. 2016. [Google Scholar]
- 17.Pascual J. The use of everolimus in renal-transplant patients. Int J Nephrol Renovasc Dis 2009; 2: 9–21 [DOI] [PMC free article] [PubMed] [Google Scholar]
- 18.Paplomata E, Zelnak A, O'Regan R. Everolimus: side effect profile and management of toxicities in breast cancer. Breast Cancer Res Treat 2013; 140: 453–462 [DOI] [PubMed] [Google Scholar]
- 19.Yao JC, Shah MH, Ito Tet al. Everolimus for advanced pancreatic neuroendocrine tumors. N Engl J Med 2011; 364: 514–523 [DOI] [PMC free article] [PubMed] [Google Scholar]
- 20.Ruiz Guerrero E, Ledo Cepero MJ, Ojeda Claro Aet al. Renal angiomyolipoma and tuberous sclerosis complex: long-term safety and efficacy outcomes of everolimus therapy. Actas Urol Esp (Engl Ed) 2021; 45: 264–272 [DOI] [PubMed] [Google Scholar]
- 21.Tsai JD, Wei CC, Yang SHet al. Effects of everolimus on tuberous sclerosis complex-associated renal angiomyolipoma: a preliminary report. Nephrology (Carlton) 2017; 22: 1017–1022 [DOI] [PubMed] [Google Scholar]
- 22.NHS England Commissioned Medicines List v16.1. NHS England; 2021 [Google Scholar]
- 23.National Cancer Institute. Common Terminology Criteria for Adverse Events v3.0. 2006 [Google Scholar]
- 24.Johnson PB, Padgett KR, Chen KLet al. Evaluation of the tool “Reg refine” for user-guided deformable image registration. J Appl Clin Med Phys 2016; 17: 158–170 [DOI] [PMC free article] [PubMed] [Google Scholar]
- 25.Grabowsky JA. Drug interactions and the pharmacist: focus on everolimus. Ann Pharmacother 2013; 47: 1055–1063 [DOI] [PubMed] [Google Scholar]
- 26.Duerr M, Glander P, Diekmann Fet al. Increased incidence of angioedema with ACE inhibitors in combination with mTOR inhibitors in kidney transplant recipients. Clin J Am Soc Nephrol 2010; 5: 703–708 [DOI] [PMC free article] [PubMed] [Google Scholar]
- 27.Bissler JJ, Kingswood JC, Radzikowska Eet al. Everolimus long-term use in patients with tuberous sclerosis complex: four-year update of the EXIST-2 study. PLoS One 2017; 12: e0180939. [DOI] [PMC free article] [PubMed] [Google Scholar]
- 28.Hatano T, Chikaraishi K, Inaba Het al. Outcomes of everolimus treatment for renal angiomyolipoma associated with tuberous sclerosis complex: a single institution experience in Japan. Int J Urol 2016; 23: 833–838 [DOI] [PubMed] [Google Scholar]
- 29.Zonnenberg BA, Neary MP, Duh MSet al. Observational study of characteristics and clinical outcomes of Dutch patients with tuberous sclerosis complex and renal angiomyolipoma treated with everolimus. PLoS One 2018; 13: e0204646. [DOI] [PMC free article] [PubMed] [Google Scholar]
- 30.Robles NR, Peces R, Gómez-Ferrer Áet al. Everolimus safety and efficacy for renal angiomyolipomas associated with tuberous sclerosis complex: a Spanish expanded access trial. Orphanet J Rare Dis 2016; 11: 1–9 [DOI] [PMC free article] [PubMed] [Google Scholar]
- 31.Cai Y, Guo H, Wang Wet al. Assessing the outcomes of everolimus on renal angiomyolipoma associated with tuberous sclerosis complex in China: a two years trial. Orphanet J Rare Dis 2018; 13: 43. [DOI] [PMC free article] [PubMed] [Google Scholar]
- 32.Vekeman F, Magestro M, Karner Pet al. Kidney involvement in tuberous sclerosis complex: the impact on healthcare resource use and costs. J Med Econ 2015; 18: 1060–1070 [DOI] [PubMed] [Google Scholar]
- 33.Bissler JJ, Kingswood JC. Optimal treatment of tuberous sclerosis complex associated renal angiomyolipomata: a systematic review. Ther Adv Urol 2016; 8: 279–290 [DOI] [PMC free article] [PubMed] [Google Scholar]
- 34.Kingswood JC, Demuth D, Nasuti Pet al. 318 Real-world assessment of renal involvement in tuberous sclerosis complex (TSC) patients in the United Kingdom (UK). Eur Urol Suppl 2014; 13: e318–e318a [Google Scholar]
- 35.Eijkemans MJC, Van Der Wal W, Reijnders LJet al. Long-term follow-up assessing renal angiomyolipoma treatment patterns, morbidity, and mortality: an observational study in tuberous sclerosis complex patients in the Netherlands. Am J Kidney Dis 2015; 66: 638–645 [DOI] [PubMed] [Google Scholar]
- 36.Bissler JJ, Budde K, Sauter Met al. Effect of everolimus on renal function in patients with tuberous sclerosis complex: evidence from EXIST-1 and EXIST-2. Nephrol Dial Transplant 2019; 34: 1000–1008 [DOI] [PMC free article] [PubMed] [Google Scholar]
- 37.Gödel M, Hartleben B, Herbach Net al. Role of mTOR in podocyte function and diabetic nephropathy in humans and mice. J Clin Invest 2011; 121: 2197–2209 [DOI] [PMC free article] [PubMed] [Google Scholar]
Associated Data
This section collects any data citations, data availability statements, or supplementary materials included in this article.