

ABSTRACT
Mitochondrial remodeling is dysregulated in metabolic diseases but the underlying mechanism is not fully understood. We report here that BDNF (brain derived neurotrophic factor) provokes mitochondrial fission and clearance in skeletal muscle via the PRKAA/AMPK-PINK1-PRKN/Parkin and PRKAA-DNM1L/DRP1-MFF pathways. Depleting Bdnf expression in myotubes reduced fatty acid-induced mitofission and mitophagy, which was associated with mitochondrial elongation and impaired lipid handling. Muscle-specific bdnf knockout (MBKO) mice displayed defective mitofission and mitophagy, and accumulation of dysfunctional mitochondria in the muscle when they were fed with a high-fat diet (HFD). These animals also have exacerbated body weight gain, increased intramyocellular lipid deposition, reduced energy expenditure, poor metabolic flexibility, and more insulin resistance. In contrast, consuming a BDNF mimetic (7,8-dihydroxyflavone) increased mitochondrial content, and enhanced mitofission and mitophagy in the skeletal muscles. Hence, BDNF is an essential myokine to maintain mitochondrial quality and function, and its repression in obesity might contribute to impaired metabolism.
Abbreviations: 7,8-DHF: 7,8-dihydroxyflavone; ACACA/ACC: acetyl Coenzyme A carboxylase alpha; ACAD: acyl-Coenzyme A dehydrogenase family; ACADVL: acyl-Coenzyme A dehydrogenase, very long chain; ACOT: acyl-CoA thioesterase; CAMKK2: calcium/calmodulin-dependent protein kinase kinase 2, beta; BDNF: brain derived neurotrophic factor; BNIP3: BCL2/adenovirus E1B interacting protein 3; BNIP3L/NIX: BCL2/adenovirus E1B interacting protein 3-like; CCL2/MCP-1: chemokine (C-C motif) ligand 2; CCL5: chemokine (C-C motif) ligand 5; CNS: central nervous system; CPT1B: carnitine palmitoyltransferase 1b, muscle; Cpt2: carnitine palmitoyltransferase 2; CREB: cAMP responsive element binding protein; DNM1L/DRP1: dynamin 1-like; E2: estrogen; EHHADH: enoyl-CoenzymeA hydratase/3-hydroxyacyl CoenzymeA dehydrogenase; ESR1/ER-alpha: estrogen receptor 1 (alpha); FA: fatty acid; FAO: fatty acid oxidation; FCCP: carbonyl cyanide-4-(trifluoromethoxy)phenylhydrazone; FFA: free fatty acids; FGF21: fibroblast growth factor 21; FUNDC1: FUN14 domain containing 1; HADHA: hydroxyacyl-CoA dehydrogenase trifunctional multienzyme complex subunit alpha; HFD: high-fat diet; iWAT: inguinal white adipose tissues; MAP1LC3A/LC3A: microtubule-associated protein 1 light chain 3 alpha; MBKO; muscle-specific bdnf knockout; IL6/IL-6: interleukin 6; MCEE: methylmalonyl CoA epimerase; MFF: mitochondrial fission factor; NTRK2/TRKB: neurotrophic tyrosine kinase, receptor, type 2; OPTN: optineurin; PA: palmitic acid; PARL: presenilin associated, rhomboid-like; PDH: pyruvate dehydrogenase; PINK1: PTEN induced putative kinase 1; PPARGC1A/PGC-1α: peroxisome proliferative activated receptor, gamma, coactivator 1 alpha; PRKAA/AMPK: protein kinase, AMP-activated, alpha 2 catalytic subunit; ROS: reactive oxygen species; TBK1: TANK-binding kinase 1; TG: triacylglycerides; TNF/TNFα: tumor necrosis factor; TOMM20: translocase of outer mitochondrial membrane 20; ULK1: unc-51 like kinase 1
KEYWORDS: BDNF, mitochondria, mitophagy, muscle, obesity
Introduction
Mitochondria are intracellular powerhouses that produce most of the ATPs required to support various biochemical reactions. They are dynamic structures that cope with metabolic stress by undergoing constant remodeling through a series of interrelated processes of biogenesis, fusion, fission, and clearance. The mitochondrial content of skeletal muscle cells is increased by enhanced mitochondrial biogenesis under extreme conditions such as endurance exercise that require a supply of high energy. Mitochondria fusion also occurs in the muscles of individuals who participate in extensive endurance training to satisfy a high energy demand [1]. In contrast, when an excess of energy is provided by overfeeding, increased fatty acid (FA) oxidation results in a massive production of reactive oxygen species (ROS) that may destroy mitochondria [2]. Organelle fragmentation (mitofission) will be initiated to selectively target the stressed or damaged mitochondria for lysosomal degradation via autophagy (mitophagy). This process can be triggered by the PINK1 (PTEN induced putative kinase 1)-PRKN/Parkin pathway or “mitophagy receptor”-mediated cascades [3]. In the PINK1-PRKN pathway, PINK1 is rapidly recruited to the stressed mitochondria, where it phosphorylates and stabilizes the ubiquitin ligase PRKN on the outer membrane [4–6]. Mitochondrion-bound PINK1 also phosphorylates ubiquitin, which facilitates the ubiquitin ligase activity of PRKN to ubiquitinate proteins on the mitochondrial surface [7]. The receptor protein SQSTM1/p62 recognizes phosphorylated poly-ubiquitin chains on mitochondrial proteins and links them to lipidated MAP1LC3A/LC3A (microtubule-associated protein 1 light chain 3 alpha) and LC3B on phagophores to promote autophagosome formation [8]. Eventually, the autophagosome will fuse with the lysosome, forming an autolysosome that dismantles mitochondria. Some damaged mitochondria might recruit “mitophagy receptors” such as BNIP3 (BCL2/adenovirus E1B interacting protein 3), BNIP3L/NIX (BCL2/adenovirus E1B interacting protein 3-like) or the outer membrane protein, FUNDC1 (FUN14 domain containing 1) for PINK1-independent autophagosome tethering. These membrane-localized receptors interact directly with LC3 on phagophore to induce mitochondrial removal [9]. All these signaling cascades constitute a quality control system that ensures sufficient functional mitochondria for ATP production, and eliminates damaged mitochondria that could trigger apoptosis [10]. Because the accumulation of defective mitochondria might cause various adverse consequences such as excessive ROS generation, reduced ATP production, and FA accumulation, it is suggested that imbalanced mitochondrial dynamics is responsible for the development of metabolic syndromes [11]. Indeed, disturbance in mitochondrial remodeling has been observed in patients with obesity [12,13]. Nevertheless, the pathological mechanism that interferes with mitochondrial remodeling under energy surplus is still unclear.
BDNF (brain derived neurotrophic factor) was originally identified as a growth factor synthesized in the central nervous system (CNS) that promotes neuron development, cell survival, and neural transmission [14]. It also acts on hypothalamic neurons to suppress food intake and drives thermogenesis [15]. Various non-CNS tissues express BDNF and its cognate receptor NTRK2/TRKB (neurotrophic tyrosine kinase, receptor, type 2) [16], suggesting that BDNF may have extensive physiological roles in peripheral organs. Studies on genetically engineered mice have shown that BDNF controls the development of glycolytic myofibers and muscle regeneration [17,18]. BDNF derived from peripheral tissues also plays a CNS-independent role in energy homeostasis. In cultured muscle cells, BDNF enhances β-oxidation via PRKAA/AMPK (protein kinase, AMP-activated, alpha 2 catalytic subunit) activation [19]. We recently showed that muscle-specific bdnf knockout (MBKO) mice could not shift the predominant fuel source from glucose to FA in skeletal muscle during fasting, suggesting muscle-generated BDNF is a regulator of metabolic flexibility [20]. Furthermore, BDNF from muscle acts distally in pancreatic β cells to stimulate insulin secretion and control glucose metabolism [21]. Nevertheless, it remains unclear if BDNF is involved in the regulation of energy homeostasis during energy surplus. In this report, we demonstrate that muscle-derived BDNF is a new regulator of mitochondrial remodeling in skeletal muscles to cope with lipid overload.
Results
Obesity and fatty acids suppress Bdnf expression in muscle
Both Bdnf and Ntrk2 mRNA are expressed in skeletal muscles and nutrient depletion enhances Bdnf expression in skeletal muscle [20]. We therefore postulated that an energy surplus would decrease Bdnf expression. As anticipated, Bdnf expression progressively declined in the gastrocnemius muscles of female mice fed with the high-fat diet (HFD) (Figure 1A). The reduced Bdnf expression caused by obesity was not observed in the soleus muscles of female mice, indicating that Bdnf expressed in glycolytic fibers might be more sensitive to nutrient status. This is similar to our earlier finding that fasting induces Bdnf expression only in glycolytic muscle [20]. We also found significantly elevated Bdnf in the liver, but no changes in the inguinal white adipose tissues (iWAT) of female mice fed with the HFD (Figure 1A). The obesity-induced change in Bdnf expression was sex-specific because none of the tissues collected from male mice were significantly altered. Immunoblotting confirmed that the amount of BDNF protein significantly decreased in the gastrocnemius muscles of HFD-fed female mice, which was associated with reduced CREB (cAMP responsive element binding protein) S133 phosphorylation (Figure 1B). The change in muscle Bdnf expression might have resulted from hyperlipidemia, because stimulation with palmitic acid (PA) per se was sufficient to suppress Bdnf expression (Figure 1C) and reduce BDNF content (Figure 1D) in C2C12 myotubes. Collectively, these findings suggest that obesity differentially regulates Bdnf expression in peripheral tissues in a sex-specific manner.
Figure 1.

Obesity suppresses Bdnf expression in gastrocnemius muscle. (A) Tissue expression of Bdnf in HFD-fed C57BL/6 J mice was determined by real-time PCR (*: P < 0.05, **: P < 0.01, Student’s t-test, n = 5). (B) Cellular content of BDNF in gastrocnemius muscle of female C57BL/6 J mice fed with chow or HFD for 3 months. Immunoblot quantifications were shown in the right panel (*: P < 0.05, **, P < 0.01, Student’s t-test, n = 3). (C) Bdnf expression in palmitic acid (PA)-stimulated C2C12 myotubes as determined by real-time PCR (***: P < 0.001 vs control, One-way ANOVA, n = 3). (D) Western blot of BDNF content in PA-stimulated C2C12 myotubes.
Deficiency of muscle-generated BDNF exaggerates diet-induced obesity
In order to study the physiological functions of BDNF in skeletal muscle, we developed muscle-specific bdnf knockout (MBKO) mice using the LoxP-Cre system and observed that the MBKO mice were slightly heavier than the Fl/Fl control when fed with standard chow [20]. We then fed MBKO mice with HFD to determine the consequences of Bdnf repression under metabolic stress. Like the findings of the mice fed with standard chow, body weight and composition did not significantly differ between male MBKO and Fl/Fl mice on the HFD (Figs. S1A to S1C). Glucose metabolism was also comparable between male Fl/Fl and MBKO mice fed with the HFD (Figs. S1D to S1F). In contrast, female MBKO mice gained more weight after 10 weeks of consuming the HFD than Fl/Fl mice (Figure 2A). Therefore, we subsequently analyzed only female mice because of the sexually dimorphic response.
Figure 2.

MBKO mice are prone to diet-induced obesity. (A) Body weight of female Fl/Fl and MBKO mice fed with HFD (*: P < 0.05, two-way ANOVA, n = 10). (B) Organ weight of female Fl/Fl and MBKO mice that have been fed with HFD for 14 weeks (**: P < 0.05, Student’s t-test, n = 5–8). (C) Representative adipocyte morphology in the iWAT of female Fl/Fl and MBKO mice that have been fed with HFD for 14 weeks (scale bars: 50 µm). The adipocyte size was quantified and shown in the right panel (*: P < 0.05, Student’s t-test, n = 5). (D) Heat map of circulating adipokine female Fl/Fl and MBKO mice fed with HFD (14 weeks) (*: P < 0.05, **:P < 0.01, Student’s t-test, n = 4). (E) Circulating triacylglyceride (TG) and free fatty acid (FFA) levels in HFD (14 weeks)-fed female Fl/Fl and MBKO mice (*: P < 0.05, Student’s t-test n = 4). (F) Lipid contents in gastrocnemius and soleus muscles of female Fl/Fl and MBKO mice that have been fed with HFD for 14 weeks (*: P < 0.05, **: P < 0.01, Student’s t-test n = 5). (G) Gene expression in gastrocnemius muscle of HFD (14 weeks)-fed female mice as determined by real-time PCR (*: P < 0.05, **: P < 0.01, Student’s t-test, n = 4). (H) The amount of FAO enzymes in the gastrocnemius muscle of HFD-fed female Fl/Fl and MBKO mice was determined by immunoblotting. Quantifications of the immunoblot were shown in the right panels (*: P < 0.05, Student’s t-test, n = 3).
The increased weight of female MBKO mice was associated with an obvious expansion of iWAT mass (Figure 2B) and adipocyte size (Figure 2C). The amount of inflammatory cytokines, TNF/TNFα (tumor necrosis factor), IL6/IL-6 (interleukin-6), CCL5 (chemokine [C-C motif] ligand 5), and CCL2/MCP-1 (chemokine [C-C motif] ligand 2), that are positively associated with metabolic dysfunction were higher in the circulation of MBKO mice (Figure 2D). Notably, the level of the mitochondrial disease marker, FGF21 (fibroblast growth factor 21) [22] was increased in the blood of MBKO mice, suggesting impaired mitochondrial activity. Concentrations of blood triacylglycerides (TG) and free fatty acids (FFA) were also higher in HFD-fed female MBKO mice fed than the Fl/Fl control (Figure 2E). Incomplete β-oxidation was observed in the gastrocnemius muscle of MBKO mice because TG content in the gastrocnemius was comparable between the genotypes but higher levels of FFA and acylcarnitine were detected in MBKO mice (Figure 2F). BDNF might play a glycolytic fiber-specific role in the modulation of lipid metabolism because the lipid profiles did not significantly differ in oxidative myofiber-dominant soleus muscles between Fl/Fl and MBKO mice (Figure 2F). We screened several genes in FA metabolism to determine the possible cause(s) of FFA accumulation in the gastrocnemius muscle of MBKO mice (Table S1). The genes for mitochondrial (Acad [acyl-Coenzyme A dehydrogenase family], Acot [acyl-CoA thioesterase], Hadha [hydroxyacyl-CoA dehydrogenase trifunctional multienzyme complex subunit alpha], Mcee [methylmalonyl CoA epimerase]), and peroxisomal (Ehhadh [enoyl-Coenzyme A, hydratase/3-hydroxyacyl CoenzymeA dehydrogenase]) β-oxidation were significantly downregulated in the gastrocnemius muscles of MBKO mice (Figure 2G). Reduced expression of Cpt2 (carnitine palmitoyltransferase 2), the rate-determining enzyme that removes carnitine from acyl-carnitine in the mitochondrial matrix (Figure 2G), was also detected in gastrocnemius muscle of MBKO mice, which could further explain the higher FFA and acylcarnitine content in their muscles. Concurring with the gene expression data, a lower amount of CPT1B (carnitine palmitoyltransferase 1b, muscle) and ACADVL (acyl-Coenzyme A dehydrogenase very long chain) was found in the muscle of MBKO mice (Figure 2H). These results indicated that the ablation of Bdnf in muscle magnifies diet-induced obesity and ectopic lipid accumulation in the skeletal muscle.
Decreased energy metabolism in HFD-MBKO mice
Next, we examined systemic energy metabolism in MBKO mice to determine how BDNF deficiency in muscles intensifies obesity development. Indirect calorimetry showed that MBKO mice consumed significantly less O2 (Figure 3A) and produced significantly less CO2 (Figure 3B) during the daytime (resting period), suggesting that basal, but not activity-related metabolism, is reduced in MBKO mice. Total energy expenditure in the MBKO mice was also compromised (Figure 3C). The decreased metabolic rate in MBKO mice was not caused by physical inactivity, as locomotion was comparable between the genotypes (Figure 3D). The MBKO mice notably displayed hypophagia (Figure 3E). The daily rhythm of the nutrient preference shift (as clarified by RER change) was not apparent in MBKO mice (Figure 3F), implying that metabolic flexibility is impaired when BDNF production is ablated in muscles.
Figure 3.

Impaired energy metabolism in HFD-fed MBKO mice. Indirect calorimetry values of (A) oxygen consumption, (B) CO2 production, (C) energy expenditure (EE), (D) physical activity, (E) total food intake and respiratory exchange ratio (F) (RER) of female Fl/Fl and MBKO mice fed with HFD for 14 weeks. The gray area represents nighttime (7 pm to 6 am). The average value of the parameter measured in each period was presented (*: P < 0.05, **: P < 0.01, ***: P < 0.001, two-way ANOVA, n = 6). The area under curve (AUC) of each graph was shown in the right panel of the sub-figure (*: P < 0.05, **: P < 0.01, Student’s t-test, n = 6).
Deficiency of BDNF in muscle impairs diet-induced mitochondrial remodeling and accumulation of dysfunctional mitochondria
Mitochondria are the key organelles to maintain energy homeostasis in muscle, and the lower energy metabolism in HFD-fed MBKO mice implies that they might have fewer amounts of mitochondria or the mitochondrial activities were reduced. The amounts of mitochondrial markers (TOMM20 [translocase of outer mitochondrial membrane 20] and PDH [pyruvate dehydrogenase]) (Figure 4A), mitochondrial DNA (Figure 4B), and oxidative phosphorylation complexes (Fig. S2) were more abundant in the skeletal muscles of MBKO, suggesting MBKO mice have more mitochondria in their skeletal muscle than that of Fl/Fl control. The increase in mitochondrial content was not a result of enhanced mitochondrial biogenesis because less amount of PPARGC1A/PGC-1α (peroxisome proliferative activated receptor, gamma, coactivator 1 alpha), the master regulator of mitochondrial synthesis [23], was found in MBKO muscles (Figure 4A). This notion was further supported by the reduced activity of another mitochondrial biogenesis inducer, PRKAA [24], in MBKO muscle, which was revealed by the diminished PRKAA T172 and ACACA/ACC (acetyl-Coenzyme A carboxylase alpha) S65 phosphorylations (Figure 4C).
Figure 4.
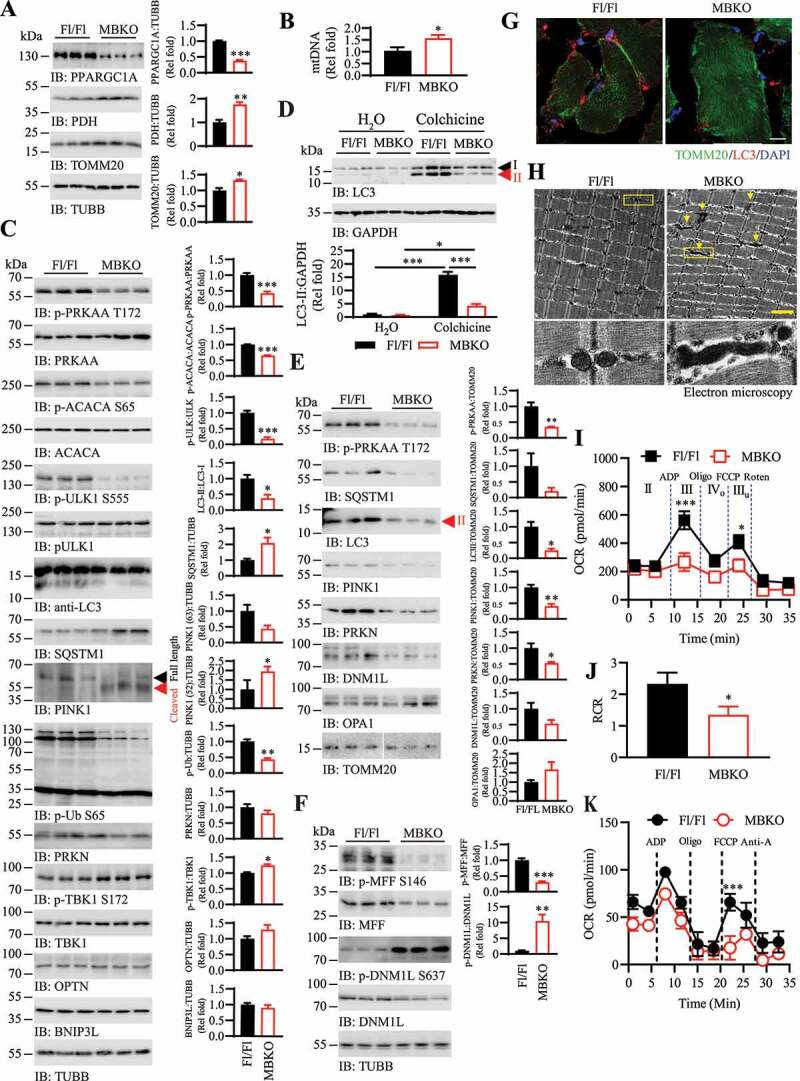
Defective mitochondrial remodeling and accumulation of dysfunctional mitochondrial in the skeletal muscle of MBKO mice. (A) Mitochondrial biogenesis in gastrocnemius muscle of HFD (14 weeks)-fed female Fl/Fl and MBKO mice was examined by immunoblotting. Immunoblot quantifications were shown in the right panel (*: P < 0.01, **: P < 0.01, ***: P < 0.001, Student’s t-test). (B) Mitochondrial DNA content in the gastrocnemius muscle of HFD-fed (14 weeks) female Fl/Fl and MBKO mice as determined by real-time PCR (*: P < 0.01, Student’s t-test, n = 5). (C) Autophagy and mitophagy signaling in gastrocnemius muscle of HFD (14 weeks)-fed female Fl/Fl and MBKO mice as analyzed by western blot. Immunoblot quantifications were shown in the right panel (*: P < 0.05, **: P < 0.01, ***: P < 0.001, Student’s t-test, n = 3). (D) Colchicine-induced LC3-II accumulation in the gastrocnemius muscle of HFD (14 weeks)-fed female Fl/Fl and MBKO mice were determined by western blotting. Quantifications of the immunoblot were shown in the lower panel (*: P < 0.05, ***: P < 0.001, two-way ANOVA, n = 3). (E) Immunoblots of protein contents in mitochondria isolated from gastrocnemius muscle of HFD (14 weeks)-fed female Fl/Fl and MBKO mice. Immunoblot quantifications were shown in the right panel (*: P < 0.05, **: P < 0.01, Student’s t-test, n = 3). (F) Immunoblotting analysis of mitofission signaling in gastrocnemius muscle of HFD (14 weeks)-fed female Fl/Fl and MBKO mice. Immunoblot quantifications were shown in the right panel (**: P < 0.01, ***;: P < 0.01, Student’s t-test, n = 3). (G) Representative immunofluorescence staining of TOMM20 and LC3 in the gastrocnemius muscle of HFD (14 weeks)-fed Fl/Fl and MBKO mice (scale bar: 10 µm). (H) Representative transmission electron microscopy images showing the mitochondrial morphology in the gastrocnemius muscle of HFD (14 weeks)-fed female Fl/Fl and MBKO mice (scale bar: 2 µm). Elongated mitochondria are indicated by the arrows. The mitochondria in the yellow boxes were magnified and shown in the lower panels. (I) Ex vivo respiration of mitochondria isolated from HFD (14 weeks)-fed female Fl/Fl and MBKO mice (*: P < 0.05, ***: P < 0.01, two-way ANOVA, n = 11). Additions of ADP, oligomycin (Oligo), carbonylcyanide-4-(trifluoromethoxy)-phenylhydrazone (FCCP), and rotenone (Roten) was indicated by dash lines. (J) Respiratory control ratio (RCR) of mitochondria isolated from HFD (14 weeks)-fed female Fl/Fl and MBKO mice (*: P < 0.05, Student’s t-test, n = 11). (K) Respiration of mitochondria isolated from the gastrocnemius muscle of HFD (14 weeks)-fed female Fl/Fl and MBKO mice using palmitoyl carnitine/malate as the substrate. Additions of ADP, Oligo, FCCP, and antimycin A (Anti-A) were indicated by dash lines (***: P < 0.01, two-way ANOVA, n = 6).
Cellular mitochondrial numbers are determined by the balance between the synthesis of new mitochondria and clearance of damaged mitochondria. The clearance mechanism was probably blocked in the muscle of MBKO mice, which augmented the mitochondria number. Reduced ULK1 (unc-51 like kinase 1) S555 phosphorylation, decreased LC3 lipidation, and increased SQSTM1 content indicated that autophagy was decreased in the gastrocnemius of HFD-fed MBKO mice (Figure 4C). Moreover, the lower level of LC3-II accumulation in the gastrocnemius of HFD-fed MBKO mice after colchicine treatment further confirmed the blockage of autophagy flux (Figure 4D). To ascertain alterations in the selective removal of mitochondria, we measured the amount of major mitophagy mediators, PINK1 and PRKN, in the muscle of the MBKO mouse. More full-length (63 kDa) PINK1 was found in the muscle of Fl/Fl than MBKO mice but increased proteolytically cleaved (52 kDa) PINK1 was detected in the muscle of MBKO mice (Figure 4C), suggesting that MBKO mouse muscle contains less functional PINK1 [25]. PINK1-mediated ubiquitin S65 phosphorylation [7] was also reduced in the muscles of MBKO mice (Figure 4C). Phosphorylation of TBK1 (TANK-binding kinase 1), another regulator of mitophagy [26], was not compromised in the MBKO muscle (Figure 4C). This observation contradicts the previous findings that PRKAA induced TBK1 S172 phosphorylation to promote mitophagy in cultured muscle cells [27]. Because TBK1 is a dental kinase at the crossroad of inflammatory signaling and selective autophagy [28], its activity is regulated by numerous factors. For instance, signaling molecules like SH2-domain-containing inositol phosphatase 1 [29], and hormones like glucocorticoids [30] are able to modulate the phosphorylation status of TBK1. Further investigations are warranted to verify if these factors are involved in compensating the TBK1 phosphorylation in MBKO muscle. Total amounts of PRKN, TBK1, and other mitophagy receptors such as OPTN (optineurin) and BNIP3L (BCL2/adenovirus E1B interacting protein 3-like) were not significantly changed in the muscle of HFD-fed MBKO mice neither (Figure 4C). The number of mitochondria, the PRKAA-ULK1-LC3 cascade, and PINK1-PRKN signaling were also comparable in the muscles of Fl/Fl and MBKO mice fed with a chow diet (Fig. S3A).
Given that PINK1 is cleaved by the mitochondrial intramembrane protease PARL (presenilin associated, rhomboid-like) to prevent its mitochondrial localization in healthy cells [25], elevated PINK1 truncation in MBKO mouse muscles suggested that their mitochondria would contain less PINK1. Hence, we examined the organelle-associated proteins in mitochondria isolated from the gastrocnemius muscles of HFD-fed mice. As expected, the muscles of MBKO mice contained less mitochondria-bound phosphorylated PRKAA, SQSTM1, LC3-II, and PINK1 (Figure 4E). The amount of PRKN was also reduced in the mitochondria of MBKO mice compared with the Fl/Fl control, which was possibly a result of decreased PINK1-mediated stabilization (Figure 4E). The impaired mitochondrial PINK1 and PRKN tethering were tissue-specific in MBKO mice as the amount of mitochondria-bound PINK1 and PRKN was normal in their liver (Fig. S3B).
Mitofission is tightly associated with mitophagy that a portion of excised mitochondria is tagged for clearance [31]. In addition to initiate bulk autophagy, PRKAA also promotes mitofission through the direct phosphorylation of MFF (mitochondrial fission factor) located on the mitochondrial outer membrane, which consequently promotes the mitochondrial association of DNM1L/DRP1 (dynamin 1-like) [32]. Along with downregulated PRKAA activity (Figure 4C), PRKAA-induced MFF S146 phosphorylation was diminished in the muscle of HFD-fed MBKO mice (Figure 4F) and less DNM1L was detected on their mitochondria (Figure 4E). Phosphorylated DNM1L S637, a mitofission inhibitory signal [33], was increased in MBKO mouse muscles (Figure 4F). These results suggested that mitofission was undermined in the absence of BDNF in skeletal muscle. Indeed, more tubular mitochondria were found in the muscles of HFD-fed MBKO mice, whereas the structure of most mitochondria in the muscles of Fl/Fl control was punctuated (Figure 4G). Transmission electron microscopy analysis further confirmed the presence of elongated mitochondrial in the muscle of MBKO mice (Figure 4H). The myofibers of HFD-fed MBKO mice also contained less LC3 punta than those of the Fl/Fl control (Fig. S4), which concurred with the decreased LC3 lipidation (Figure 4C). Mitofusion mediators bound to mitochondria such as dynamin-related protein OPA1 [34] were not significantly altered in MBKO muscles (Figure 4E), suggesting that the mitofusion mechanism was not affected. Phosphorylations of DNM1L S637 and MFF S146 remained unchanged in the muscles of MBKO mice fed with a chow diet (Fig. S3C), indicating that BDNF is indispensable only for obesity-induced mitochondrial remodeling.
To investigate whether morphological changes affect the functional performance of mitochondria, we analyzed the ex vivo respiratory activity of mitochondria isolated from the gastrocnemius muscle of HFD-fed mice. While state II respiration was comparable between the two genotypes, the mitochondria from MBKO mice had significantly reduced state III and IIIu respirations, implying that their ATP formation and maximal respiratory capacities were lower than that of the Fl/Fl control when using malate and glutamate as the substrate (Figure 4I). Moreover, respiratory control ratio further indicated poor mitochondrial coupling in the muscle of MBKO mice (Figure 4J). The mitochondria isolated from the MBKO mice also displayed a compromised ability in using palmitoyl-carnitine as the substrate (Figure 4K). Collectively, our data suggested that both mitophagy and mitofission were inhibited in the muscles of HFD-fed MBKO mice, and that such inhibition is associated with the accumulation of dysfunctional mitochondria.
Insulin sensitivity is reduced in MBKO mice fed with HFD
Insulin sensitivity and body weight are negatively correlated. Moreover, dysregulated mitochondrial dynamics in metabolically active tissues are accompanied by insulin resistance [35]. Considering that MBKO mice fed with the HFD were heavier and that mitophagy was impaired in their skeletal muscles, we postulated that HFD-fed MBKO mice would have lower insulin sensitivity than Fl/Fl mice. Indeed, blood glucose and insulin levels were higher in the MBKO than in the Fl/Fl mice (Figures 5A and 5B). The MBKO mice also performed poorly in the glucose tolerance test (Figure 5C) and had lower systemic responses in the insulin tolerance test (Figure 5D). Moreover, both glucose infusion (Figure 5E) and turnover (Figure 5F) rates in hyperinsulinemic-euglycemic clamp assays were significantly lower in the MBKO mice, indicating more severe insulin resistance than that in the Fl/Fl control. Insulin-induced glucose uptake was significantly impaired in skeletal muscle (Figure 5G) but not in iWAT (Figure 5H) of MBKO mice. Insulin-suppressed hepatic glucose output was comparable between the two genotypes (Figure 5I), implying muscle-specific insulin resistance in MBKO mice. In support of this notion, insulin provoked less insulin receptor, AKT and TBC1D4/AS160 phosphorylations in the skeletal muscle (Figure 5J), but not in the liver (Fig. S5), of HFD-fed MBKO mice. These results indicated that the deteriorated systemic insulin resistance in HFD-fed MBKO mice could be attributed to decreased insulin sensitivity in skeletal muscle.
Figure 5.

Diet-induced insulin resistance in MBKO mice. (A) Blood glucose level in HFD-fed (14 weeks) female Fl/Fl and MBKO mice that have been fed with HFD (*: P < 0.05, two-way ANOVA, n = 6). (B) Glucose tolerance test of female Fl/Fl and MBKO mice that have been fed with HFD for 14 weeks (n = 6–8). The area under curve (AUC) for the GTT was shown in the right panel (*: P < 0.05, Student’s t-test, n = 6–8). (C) Circulating insulin levels in female Fl/Fl and MBKO mice that have been fed with HFD for 14 weeks (*: P < 0.05, two-way ANOVA, n = 5–7). (D) Insulin tolerance test of female Fl/Fl and MBKO mice that have been fed with HFD for 14 weeks (n = 5–6). Area under curve (AUC) for the ITT was also shown (*: P < 0.05, Student’s t-test, n = 5–6). (E) Glucose infusion rate of HFD (14 weeks)-fed female Fl/Fl and MBKO mice during hyperinsulinemic-euglycemic clamping (*: P < 0.05, Student’s t-test, n = 5–7). (F) Whole-body glucose turnover in HFD (14 weeks)-fed female Fl/Fl and MBKO mice during hyperinsulinemic-euglycemic clamping (*: P < 0.05, Student’s t-test, n = 5–7). (G) Insulin-stimulated glucose uptake by gastrocnemius muscle of HFD (14 weeks)-fed female Fl/Fl and MBKO mice during hyperinsulinemic-euglycemic clamping (*: P < 0.05, Student’s t-test, n = 5–7). (H) Insulin-stimulated glucose uptake by iWAT of HFD (14 weeks)-fed female Fl/Fl and MBKO mice during hyperinsulinemic-euglycemic clamping (n = 5–7). (I) Hepatic glucose production in HFD (14 weeks)-fed female Fl/Fl and MBKO mice during hyperinsulinemic-euglycemic clamping (n = 5–7). (J) Insulin-stimulated signaling in gastrocnemius muscle isolated from female Fl/Fl and MBKO mice that have been fed with HFD for 14 weeks. Immunoblot quantifications were shown in the right panels (**: P < 0.01, Student’s t-test, n = 3).
BDNF promotes mitochondrial remodeling via PRKAA activation
In order to demonstrate the defective mitochondrial behaviors in skeletal muscle of HFD-fed MBKO mice is cell-autonomous; we tested if BDNF stimulation was able to induce mitochondrial remodeling in cultured myotubes. BDNF time-dependently provoked PRKAA and ULK1 phosphorylations in the cytosol of C2C12 myotubes (Figure 6A,B). Interestingly, higher amounts of SQSTM1, LC3-II, PINK1, and DNM1L were found in mitochondria after BDNF stimulation (Figure 6A,B), confirming that BDNF was able to provoke mitophagy and mitofission signaling in muscle cells.
Figure 6.

BDNF promotes mitochondrial fission and mitophagy via PRKAA/AMPK activation. (A) C2C12 cells were stimulated with BDNF (100 ng/ml) for various time intervals, and the cytosolic and mitochondrial proteins were separated. The protein contents in each fraction were analyzed by immunoblotting. An equal amount of proteins (5 µg) was loaded to compare the protein distribution in each fractionated sample. (B) Subcellular fractionation was performed in differentiated C2C12 myotubes after stimulation with BDNF (100 ng/ml). Various proteins in the cytosolic and mitochondrial fractions were analyzed by immunoblotting. (C) C2C12 myotubes were pre-treated with various inhibitors (20 nM K252a, 20 µM Compound C, 10 µM PD98059) for 1 h, following by BDNF stimulation (100 ng/ml) for 6 h. The mitochondria and cytosol were then isolated for immunoblotting analysis. (D) C2C12 myotubes were infected with control adenovirus (Ad-Ctr) or adenovirus expressing shRNA against Bdnf (Ad-shBDNF) for 48 h. Proteins in the mitochondrial and cytosolic fractions were then isolated for immunoblotting analysis. (E) C2C12 myotubes were infected with various adenoviruses for 48 h, followed by BSA-conjugated PA stimulation for 24 h. Cell fractionation was then performed and the amounts of various proteins in the cytosolic and mitochondrial fractions were determined by western blot. (F) Representative immunofluorescence staining of Ad-Ctr or Ad-shBDNF-infected C2C12 myotubes with or without PA (600 µM, 6 h) treatment (scale bar: 15 µm). Pictures in the middle panel are the magnified view of the defined area (yellow square) on the left panels. Mitochondria morphology in the magnified area was highlighted by the computer program MicroP as shown in the right panel. (G) Oxygen consumption rate (OCR) of C2C12 myotubes that have been infected with various adenoviruses (48 h) followed by PA stimulation (600 µM) for 6 h. Additions of oligomycin (oligo, 1 µM), FCCP (1 µM), or antimycin A (AntiA, 1 µM) + rotenone (Roten, 1 µM) were indicated by arrows (n = 4). (H) Mitochondrial activities in Ad-Ctr or Ad-shBDNF-infected C2C12 myotubes after PA (600 µM, 6 h) stimulation (*: P < 0.05, two-way ANOVA, n = 4).
The BDNF-promoted mitophagy was NTRK2- and PRKAA-dependent because incubating C2C12 myotubes with a NTRK2 inhibitor (K252a) or an PRKAA inhibitor (compound C), but not the MAPK1/ERK inhibitor (PD98059), diminished the BDNF-induced mitochondrial recruitment of PRKAA, LC3-II, and PINK1 (Figure 6C). Infection of myotubes with an adenovirus overexpressing a short hairpin (sh) RNA against Bdnf (Ad-shBDNF) did not significantly alter the attachment of PINK1 to mitochondria or change PINK1-mediated ubiquitin phosphorylation (Figure 6D), implying that BDNF is dispensable for basal mitophagy in vitro. However, repressing Bdnf expression significantly diminished PA-induced attachment of activated PRKAA, SQSTM1, LC3-II, PINK1, PRKN, and DNM1L to the mitochondria (Figure 6E). Aligned with the less PINK1 and PRKN in mitochondria, Bdnf-depleted cells have less S65 phosphorylated ubiquitin-attached mitochondrial proteins after PA stimulation (Figure 6E). Mitotracker staining further showed that PA stimulation shifted the tubular mitochondria network to individual granules in control C2C12 myotubes, whereas more filiform mitochondria were retained in Ad-shBDNF-infected myotubes after PA challenge (Figure 6F). These results confirmed the significance of BDNF in PA-induced mitochondrial fragmentation. We then investigated whether the altered morphology of mitochondria after FA challenge affected their oxidative performance using an extracellular flux analyzer (Figure 6G). Although FA stimulation provoked obvious mitofission in Ad-Ctr-infected C2C12 myotubes (Figure 6F), mitochondrial respiration was not altered (Figure 6G). In contrast, mitochondria in Bdnf-depleted cells demonstrated a significant decrease in maximal respiration after PA stimulation (Figure 6G). Moreover, the diminished respiratory reserve in BDNF-deficient cells further indicated that the mitochondrial-related stress-buffering system was impaired in response to PA challenge. Together, our data suggest that BDNF production is important for the maintenance of mitochondrial remodeling to handle FA challenges.
BDNF activates PRKAA via CAMKK2 (calcium/calmodulin-dependent protein kinase kinase 2, beta)
Although we [20] and Mathews et al. [19] have reported that BDNF was able to activate PRKAA in muscle cells, the underlying mechanism is still unknown. In addition to the allosteric regulation by AMP, PRKAA activity could be regulated by the upstream kinase STK11/LKB1- or the CAMKK (calcium/calmodulin-dependent protein kinase kinase) [36,37]. Given that BDNF was an activator of neuronal CAMKK [38], we suspected the Ca2+-CAMKK pathway is also crucial for BDNF to actuate PRKAA in muscle. Using the fluorescent-labeled calcium indicator Fluo-4, we found that BDNF stimulation increased the intracellular Ca2+ concentration ([Ca2+]i) of C2C12 myotubes within 1 min (Figure 7A,B). A dose-dependent elevation of [Ca2+]i in C2C12 cells was detected after BDNF stimulation (Figure 7C). Pre-treatment of C2C12 myotubes with BAPTA-AM, an intracellular Ca2+ chelator, abolished the BDNF-provoked PRKAA phosphorylation, suggesting the surge of [Ca2+]i is important to the PRKAA activation (Figure 7D). Pharmacological inhibition of NTRK2 by K252a, or phospholipase C (a downstream effector of BDNF to induce [Ca2+]i elevation in neuron [39]) by U73122 also significantly diminished the BDNF-trigged PRKAA phosphorylation (Figure 7D). In contrast, suppressing the activity of phosphoinositide 3-kinase by Wortmannin did not affect the BDNF-induced PRKAA phosphorylation (Figure 7D). The inability of BDNF to promote PRKAA phosphorylation in the presence of CAMKK inhibitor STO-609 indicated that CAMKK was indispensable to BDNF-induced PRKAA activation (Figure 7D). This notion was further supported by the failure of BDNF to trigger PRKAA phosphorylation in C2C12 when CAMKK2, the major CAMKK isoform for PRKAA phosphorylation in skeletal muscle [36], was knocked down (Figure 7E,F). Collectively, our data revealed that BDNF-induced PRKAA activation in muscle is Ca2+-CAMKK2 dependent.
Figure 7.

BDNF activates PRKAA via CAMKK2. (A) Representative images of Fluro-4-loaded C2C12 myotubes after BDNF (100 ng/ml) stimulation. Scale bar: 100 µm. (B) Time course study of [Ca2+]i elevation in C2C12 myotubes stimulated with BDNF (100 ng/ml. The dashed line indicates the time when BDNF was introduced (n = 3, ***: P < 0.001 vs PBS after BDNF administration for all time points, two-way ANOVA). (C) The [Ca2+]i was measured in Fluro-4-loaded C2C12 myotubes after being stimulated by various concentrations of BDNF for 30 min (n = 3, ***: P < 0.001, one-way ANOVA vs 0). (D) C2C12 myotubes were pretreated with DMSO, BAPTA-AM (50 µM), K252a (100 nM), STO-609 (10 µg/ml), U73122 (3 µM), or wortmannin (1 µM) for 1 h, followed by PBS or BDNF stimulation (100 ng/ml, 30 min). PRKAA T172 phosphorylation was determined by ELISA (n = 6, *: P < 0.05 vs control, b: P < 0.01 vs BDNF, c: P < 0.001 vs BDNF, one-way ANOVA). (E) Control siRNA (siCtr) or siRNA against Camkk2 (siCAMKK2) was introduced to C2C12 cells by transfection. Expression of Camkk2 in Control siRNA (siCtr) or siRNA against Camkk2 (siCAMKK2) was assessed by real-time PCR (top panel, ***: P < 0.001, Student’s t-test, n = 4). The amount of cellular CAMKK2 after siRNA treatment was determined by immunoblotting (middle panel). (F) The siCtr- or siCAMKK2-treated C2C12 cells were stimulated with PBS or BDNF (100 ng/ml, 30 min). PRKAA T172 phosphorylation was determined by ELISA (n = 6, ***: P < 0.001 vs PBS, c: P < 0.001 vs BDNF, two-way ANOVA).
Mitochondrial dynamics in obese muscle are augmented by 7,8 – dihydroxyflavone (7,8-DHF)
Activation of PINK1/PRKN-dependent mitophagy prevents PA-induced mitochondrial dysfunction, ROS production, and apoptosis [40]. Given that BDNF production is essential for mitochondrial remodeling to alleviate FA-induced stress (Figure 6) and that Bdnf expression is repressed in obese muscle (Figure 1), we investigated whether reinforcing BDNF signaling in obese mice would promote mitochondrial dynamics. Similar to our previous findings [41], consumption of 7,8-DHF significantly reduced the body weight gain in mice with diet-induced obesity (Figure 8A) and enhanced the mitochondrial content in their skeletal muscles (Figure 8B). Autophagy flux was increased in the muscles of 7,8-DHF-treated mice, as evidenced by augmented ULK1 S555 phosphorylation, LC3 lipidation, SQSTM1 degradation (Figure 8C), and colchicine-induced LC3-II accumulation (Figure 8D). Moreover, more mitochondrial attachment of phosphorylated PRKAA, SQSTM1, LC3-II, PINK1, and S65 phosphorylated-ubiquitin were detected in their muscles (Figure 8C). The mitofission markers, DNM1L S616 and MFF S146 phosphorylation, were also augmented, while the expression of mitofusion components MFN2 and OPA1 were reduced or remained unchanged in mice administered with 7,8-DHF compared with the H2O control (Figure 8E).
Figure 8.

7,8-DHF consumption enhances mitophagy and mitofission in diet-induced obese mice. (A) Effect of 7,8-DHF consumption on body weight gain in female diet-induced obese (DIO) mice (*: P < 0.05, two-way ANOVA, n = 5). (B) Western blot analysis of proteins in gastrocnemius muscle of female DIO mice that have been fed with 7,8-DHF for 8 weeks. Immunoblot quantifications were shown in the right panel (*: P < 0.01, **: P < 0.05, Student’s t-test, n = 3). (C) Mitophagy signaling in gastrocnemius muscle of female 7,8-DHF-administrated (8 weeks) DIO mice was analyzed by western blot. Immunoblot quantifications were shown in the right panel (*: P < 0.05, **: P < 0.01, Student’s t-test, n = 3). (D) Colchicine-induced LC3-II accumulation in the gastrocnemius muscle of H2O- or 7,8-DHF-treated DIO mice was determined by western blotting. Quantifications of the immunoblot were shown in the right panel (*: P < 0.05, **: P < 0.01, two-way ANOVA, n = 3). (E) Immunoblotting analysis of mitofission and mitofusion signaling in gastrocnemius muscle of female DIO mice that have been fed with 7,8-DHF for 8 weeks. Immunoblot quantifications were shown in the right panel (*: P < 0.05, Student’s t-test, n = 3). (F) C2C12 myotubes were stimulated with 7,8-DHF (24 h) and the cytosolic and mitochondrial proteins were separated. The proteins in each fraction were analyzed by immunoblotting. An equal amount of proteins (5 µg) was loaded to compare the protein distribution in each fractionated sample. (G) Subcellular fractionation was performed in differentiated C2C12 myotubes after stimulation with 7,8-DHF for 24 h. Various proteins in the cytosolic and mitochondrial fractions were then analyzed by immunoblotting.
We examined 7,8-DHF-induced signaling in C2C12 myotubes to confirm that the escalated mitochondrial remodeling in the muscles of 7,8-DHF-treated mice was not a secondary effect of bodyweight reduction. Figure 8F,G show that 7,8-DHF dose-dependently enhanced PRKAA activation and ULK1 S555 phosphorylation in the cytosol of C2C12 myotubes. Recruitment of activated PRKAA, SQSTM1, LC3-II, PINK1, and DNM1L to the mitochondria was also increased after 7,8-DHF stimulation, which was associated with the elevation of PINK1-mediated mitochondrial protein ubiquitination (Figure 8F,G). Mitofusion was slightly reduced with decreasing amounts of OPA1 in the 7,8-DHF-stimulated mitochondria (Figure 8G). Collectively, these results provide evidence that 7,8-DHF enhanced mitophagy and mitochondrial remodeling in vitro and in vivo.
Discussion
Mitochondrial remodeling is an important intracellular quality control process that removes damaged or dysfunctional mitochondria to prevent them from contaminating healthy mitochondria [42]. Genetic manipulations in laboratory animals have shown that dysregulation of mitochondrial biogenesis, mitophagy, mitofission or mitofusion is detrimental to animal health [43]. Metabolic diseases such as obesity in humans are also associated with altered activity in these processes [12]. Although the molecular machinery like PRKN and PINK1 that execute these events has been extensively studied, the effects of the upstream regulators or extracellular factors that control these vital processes in skeletal muscles are less clear. In particular, the role of muscle-secreted myokines in mitochondrial quality control is poorly defined. We found here that muscle-generated BDNF promotes mitochondrial remodeling via the CAMKK-PRKAA pathway (Figure 7). In addition to its function as an energy sensor, PRKAA promotes mitochondrial synthesis through PPARGC1A [44], triggers the formation of autophagosomes by enhancing ULK1 activity and its downstream PRKN phosphorylation [45,46], initiates mitophagy by promoting the expression and mitochondrial recruitment of PINK1 [47–49], and catalyzes mitofission by increasing MFF-DNM1L interaction [32]. Presumably, downregulated PRKAA activity in the muscles of HFD-fed MBKO mice or Bdnf knocked-down myotubes prevents mitofission and mitophagy, leading to the accumulation of mitochondria that cannot effectively oxidize FA (Figures 4 and 6). In parallel with the emergence of deformed mitochondria, PPARGC1A-mediated transcription of the fatty acid oxidation (FAO) genes Acad, Cpt, and Hadha [50] is compromised in Bdnf-ablated muscle (Figure 2), which further contributes to the impaired lipid metabolism. In association with mitochondrial defects, MBKO mice had lower energy metabolism (Figure 3), gained more bodyweight (Figure 2), and developed more severe insulin resistance when fed with the HFD (Figure 5). In contrast, the restoration of BDNF signaling by consuming 7,8-DHF increased mitochondrial content, enhanced mitophagy, and promoted mitofission in the muscles of obese mice (Figure 8). All these results highlight the essential role of BDNF in metabolic stress-related mitostasis.
Longer mitochondria are formed through fusion when more ATP production is required during nutrient shortage and exercise, which comprises a protective mechanism against metabolic stress [51]. Given that Bdnf expression in muscle is provoked by nutrient deprivation and exercise [20,52], its mitofission- and mitophagy-inducing functions seem to contradict the metabolic demand under these conditions. However, optimal mitofusion and mitofission activities are needed to balance ATP production and mitochondrial material recycling when cells are under metabolic stress. In fact, inhibiting mitofission might not always be favorable for coping with energy scarcity because forced ablation of Dnm1l in cells triggers apoptosis during glucose deprivation [53]. Moreover, the half-life of mitochondria is shortened during fasting, suggesting that both mitofusion and mitophagy are elevated, although more mitochondrial fusion is preferred in terms of bioenergetics [54]. Together with our previous finding that BDNF signaling enhances mitochondrial biogenesis [20,41], we propose that the major physiological function of BDNF in muscle is to alleviate energy stress via promoting mitochondrial turnover.
It has been well established that BDNF expression, signaling, and responses are sex dimorphic in both human beings and laboratory animals. For instance, Bdnf knockout in the mouse forebrain resulted in sex-specific behavioral defects that only female knockout mice displayed anxiety and depression [55]. Similarly, the BDNFV66M variation exclusively affects the impulsivity and addition behavior only in female mice [56]. In human studies, the concentration of BDNF in blood is associated with the severity of depression in women [57]. A recent study also showed that decreased BDNF levels are closely associated with females in Parkinson disease patients with depression [58]. We have shown that fasting induces a female-specific increase in muscle Bdnf expression [20]. This study further demonstrated that obesity-inhibited Bdnf expression is tissue- and sex-specific as it is reduced in the gastrocnemius muscles but increased in the livers of female mice fed with the HFD (Figure 1). The mechanism of sex-specific action of BDNF in energy homeostasis has not been clearly defined but a recent study suggested that the muscular ESR1/ER-alpha (estrogen receptor 1 [alpha]) was a downstream mediator of BDNF signaling to improve the metabolic health of mice under HFD feeding [59]. Because estrogen (E2) is an inducer of Bdnf expression in neurons [60], it is tempting to propose that E2 and BDNF might form a positive feedback network in regulating muscle metabolism. Presumably, the low circulating E2 level in HFD-fed female mice [61], together with the ectopic accumulation of FA (Figure 1D), reduces the Bdnf expression in muscle. The low BDNF production further weakens the ESR signaling, forming a vicious cycle that leads to aberrant metabolism. The overlapping metabolic phenotypes (obesity-prone, impaired glucose homeostasis, diminished oxidative metabolism, accumulation of lipid in muscle, aberrant mitochondrial morphology, and abnormal mitofission dynamics) between MBKO and the muscle-specific ESR1 knockout mice [62] indirectly supports the significance of the BDNF-ESR crosstalk. When compared with female mice, male mice have a lower level of E2 [63], which aligns with our observation that Bdnf expression is lower in male mouse muscle [20]. Interestingly, HFD feeding increased the circulating E2 in male mice [64], which might offset the decremental effect of FA on Bdnf expression in their skeletal muscle. As such, a significant decrease of Bdnf expression is only seen in the muscle of female but not male mice. Because the role of E2 in Bdnf expression has not been empirically verified in skeletal muscle, further studies are warranted to verified the hypothesis.
In cultured hepatocytes, BDNF enhances FAO but suppresses gluconeogenesis via PRKAA activation [65]. Studies in liver-specific Bdnf knockout mice, however, demonstrated that hepatic Bdnf expression under HFD feeding is detrimental to systemic glucose homeostasis [66]. How hepatic BDNF contributes to metabolic disorders is unknown, but the consequence of a change in Bdnf expression induced by obesity would probably be harmful to overall health. For instance, HFD feeding might impair hippocampal neurogenesis and promote memory defects via decreasing Bdnf expression in the brain [67]. Outcomes of the present study showed that ectopic FA deposition represses Bdnf expression in muscle (Figure 1), which might jeopardize the defense system against FA overload (Figure 6). The mechanism of FA-suppressed Bdnf expression in mouse muscle remains unclear, but CREB seems to play a pivotal role. This notion is supported by the following evidence: CREB downregulation is associated with reduced Bdnf expression in the CNS of obese mice [68]; FA challenge and obesity suppress CREB activity in various mouse tissues including muscle (Figure 1B) [69], and CREB enhances Bdnf expression in mouse skeletal muscle by tethering directly to the Bdnf promoter [20]. All these findings propose CREB might serve as a metabolic sensor that controls BDNF expression during fasting or overfeeding. Nevertheless, further studies are warranted to empirically determine a causal relationship between CREB activity and Bdnf expression in the muscles of obese individuals.
Production of BDNF in muscle is impaired during overfeeding, which might contribute to the dysregulated clearance of damaged mitochondria in muscles under obesity. Mitochondrial damage, morphological alterations, reduced respiration capacity, and increased oxidative stress are readily detected in the skeletal muscle of obese individuals [70]. Recent findings suggest that an excess FA in muscle increases mitochondrial FAO, which eventually overloads it oxidative capacity, thereby generating a large quantity of ROS that would eventually destroy the organelle [71]. Therefore, efficient mitophagy is necessary to remove nonfunctional mitochondria in obese or FA-challenged tissues. We showed that BDNF functions as a myokine for maintaining this adaptive response to high FA deposition. This notion is further supported by our previous findings that chronic activation of BDNF signaling by the BDNF mimetic 7,8-DHF alleviates the damaging effect of FA on mitochondrial dysfunction and insulin sensitivity in obese mice [41]. The beneficial effects of augmented BDNF signaling have also been demonstrated in other obesity-impaired functions including neuronal damage, liver steatosis, and memory defects [72,73]. The fact that BDNF signaling facilitates mitochondrial remodeling and mitophagy might have implications for other mitochondria-related myopathies such as relieving the mitophagy defects in Duchenne muscular dystrophy [74] and protecting muscle damage from the toxic side effects of statins [75]. Therefore, the potential therapeutic activities of BDNF and 7,8-DHF in these disorders need to be evaluated further.
In summary, BDNF functions as a myokine that optimizes the metabolic properties of skeletal muscle during nutrient stress via maintaining mitochondrial quality in female mice. The enhanced expression of Bdnf in muscles during fasting promotes mitochondrial biogenesis and autophagy for glucose-to-FA transition [20]. On the contrary, an excess of FA in obese muscle represses Bdnf expression, resulting in dysregulated mitophagy and accumulation of defective mitochondria that impairs energy metabolism. More importantly, mitochondrial dynamics in obese muscle could be remedied by supplying exogenous factors that provoke BDNF signaling, which could serve as a potential therapeutic strategy against disorders associated with incompetent mitophagy.
Materials and methods
Chemicals and reagents
Recombinant human BDNF was purchased from Abcam (ab206642). 7,8-DHF was purchased from Tokyo Chemical Industry Co., Ltd (D1916). Human insulin was obtained from Elli Lily and Company (HI0210). PathScan Phospho-PRKAA/AMPKα (Thr172) Sandwich ELISA (7959 C), and antibodies against p-PRKAA/AMPKα T172 (2535), PRKAA/AMPKα (2603), p-ACACA/ACC S79 (3661), ACACA/ACC (3676), p-AKT S473 (9271), p-TBC1D4/AS160 S588 (8730), TBC1D4/AS160 (2670), p-CREB1 S133 (9198), CREB1 (4820), p-DNM1L/DRP1 S616 (4494), p-DNM1L/DRP1 S637 (4867), DNM1L/DRP1 (8570), p-MAPK1/ERK2-MAPK3/ERK1 T202/Y204 (9106), MAPK1/ERK2-MAPK3/ERK1 (9102), p-IGF1R/IRβ Y1146 (3021), LC3 (12,741), p-MFF S146 (49,281), MFF (84,580), MFN2 (11,925), BNIP3L/Nix (12,369), SQSTM1/p62 (5114), CALCOCO2/NDP52, (60,732), PRKN/Parkin (4211), PINK1 (6946), OPA1 (80,471), OPTN (58,981), PDH (3205), TOMM20 (42,406), p-ULK1 S555 (5869), ULK1 (8054), p-Ubiquitin S65 (62,802) and VDAC (68,888) were purchased from Cell Signaling Technology. Anti-AKT (sc-5298) and anti-IGF1R/IRβ (sc-53,742) antibodies were obtained from Santa Cruz Biotechnology. Anti-BDNF (ab108319) antibody, anti-CPT1B (ab134988), anti-PPARGC1A/PGC-1α (ab176328) antibody, anti-ACADVL (ab155138), and antibody cocktail that recognizes total oxidative phosphorylation complexes (ab110413) were obtained from Abcam. Anti-p-Ubiquitin S65 (ABS1513-I) and anti-TUBB/tubulin antibodies (T6074) was obtained from Sigma-Aldrich. Ad-shBdnf were synthesized by Cyagen (USA) based on a previously reported sequence [76]. The siGENOME siRNA pool against mouse Camkk2 was purchased from Horizon Discovery. All other chemicals were purchased from Sigma-Aldrich.
Animal experiments
Muscle-specific bdnf knockout (MBKO) mice were generated by crossing Bdnf Flox/Flox mice (Jackson Laboratory, 004339) with transgenic mice carrying the human ACTA1/α-skeletal actin-promoter-driven Cre (HSA-Cre; Jackson Laboratory, 006149). Genotyping was performed via PCR using genomic DNA extracted from the tail and using primers suggested by the Jackson Laboratory. Mice were housed in environmentally controlled conditions under a 12 h light/dark cycle with ad libitum access to standard rodent pellet food (chow) or high-fat diet (60% kCal; Research Diet Inc, D12492) and water. All in vivo assays were approved by the Committee on the Use of Live Animals in Teaching and Research (CULATR) of the University of Hong Kong. Because of the sex-specific response in obesity development, all in vivo experiments were performed using female mice.
Blood glucose levels were measured using the ACCU-CHEK Advantage Blood Glucose Meter (Roche, Basel, Switzerland). Serum insulin was measured by ELISA (Crystal Chem, 90,800). Serum and tissue triglyceride, and free FA levels were measured using the Triglyceride Quantification Colorimetric Kit and the Free Fatty Acid Quantification Colorimetric Kit, respectively (BioVision, K622 and K612). Serum adipokines were detected using Proteome Profiler Array (R&D Systems Inc, ARY013). The glucose tolerance test and insulin tolerance test were performed after intraperitoneally injecting D-glucose (2 g/kg of body weight; Sigma-Aldrich, 16,325) or humulin (1 U/kg; Elli Lily and company, HI0210) into mice that had fasted overnight fasted (16 h).
Cell culture
C2C12 cells were purchased from the American Type Culture Collection (ATCC, CRL-1772) and cultured in DMEM (Life Technologies Ltd, 12,800,017) supplemented with 5% FBS (Fisher Scientific, 10,309,433), 15% calf serum (Fisher Scientific, 16–010159), 100 IU/mL penicillin, and 100 μg/mL streptomycin (Invitrogen, 15,140,122). Differentiation of myoblasts into myotubes was performed by incubating 100% confluent myoblast with differentiating medium (2% horse serum [Life Technologies Ltd, 16,050,130], 100 IU/mL penicillin, and 100 μg/mL streptomycin) for 4 days. In the cell culture experiment, 7,8-DHF was dissolved in DMSO (Sigma-Aldrich, D8418) to make a 1 M stock solution. The final concentration of DMSO in the culture medium was less than 0.1%.
7,8-DHF treatment
Obesity was first induced in 3-month-old female C57BL/6 mice by feeding HFD (60% kcal; Research Diet Inc, D12492) for 3 months. The animals were then randomized assigned to one of the two treatment groups. 7,8-DHF powder was dissolved directly in the drinking water to make a final concentration of 0.16 mg/ml. No organic solvent was used to enhance the solubility of the chemical. After 8 weeks of treatment, the mice were euthanized and their tissues were collected.
Autophagy flux analysis
Autophagy flux in the skeletal muscle of HFD-fed Fl/Fl, MBKO, and H2O- or 7,8-DHF-treated obese C57BL/6 mice was determined as previously reported [77]. Briefly, the mice were intraperitoneally injected with H2O or 0.4 mg/kg/day colchicine (Cayman Chemical, 9,000,760) for 2 days. Gastrocnemius muscles of the mice were then collected and used to examine LC3-II accumulation by immunoblotting.
Immunoblotting
Tissue or cell extracts were prepared by homogenizing tissues in lysis buffer (50 mM Tris, pH 7.4 [Bio-Rad Laboratories, 161–0719], 40 mM NaCl [BDH Laboratory Supplies, 10241AP], 1 mM EDTA [Affymetrix, 15,699], 0.5% Triton X-100 [Bio-Rad Laboratories, 161–0407], 1.5 mM Na3VO4 [ACROS Organics, 13,721–396], 50 mM NaF [Sigma-Aldrich, 201,154], 10 mM Na4P2O7 [Santa Cruz Biotechnology, sc236921] 10 mM sodium β-glycerol phosphate [Affymetrix, Thermo Fischer Scientific, 21,655], and protease inhibitor cocktail [Sigma-Aldrich, P8340]). Cell debris was removed by centrifugation at 20,000 x g for 10 min, and the supernatants were collected for further analysis. Protein concentration of the lysates was determined by the Bio-Rad Protein Assay (Bio-Rad Laboratories, 5,000,006), after which an equal amount of protein lysate from each sample was loaded for SDS-PAGE. SDS-PAGE and blotting were performed using the mini-PROTEAN Tetra (Bio-Rad Laboratories, USA) and protein transfer was performed using the Trans-Blot Turbo Transfer System (Bio-Rad Laboratories, USA). Immunoblotting signals within the linear detection range were detected with a G:Box Chemi XRQ imager (Syngene, UK) and analyzed using ImageJ (NIH, USA). Representative results from two or more independent experiments are shown.
Real-time PCR and PCR array
Total RNA was extracted by Trizol Isolation Reagent (Invitrogen, 10,296,028). First-strand cDNA from total RNA was synthesized using Superscript III reverse transcriptase (Invitrogen, 11,904,018) and Oligo-dT17 as the primer. Lipid metabolism gene expression was determined using the Mouse Fatty Acid Metabolism RT2 Profiler PCR Array (Qiagen, 330,231). Real-time PCR was performed using Sybr green reagent (Bio-Rad Laboratories, 172,524) and detected by the LightCycler (Roche Diagnostics, USA).
Metabolomics analysis
Determination and profiling of various lipid metabolites were performed at the West Coast Metabolomics Center at the University of California Davis Genome Center (USA) using liquid chromatography-mass spectrometry (LC/MS) as previously reported [20].
Subcellular fractionation
Skeletal muscle was homogenized in mitochondrial isolation buffer (250 mM sucrose [BDH Laboratory Supplies, 102747E], 50 mM Tris [Bio-Rad Laboratories, 161–0719], 5 mM MgCl2 [Fischer Scientific, AC197530010] 50 mM NaF Sigma-Aldrich, 201,154], 1.5 mM Na3VO4 [ACROS Organics, 13,721–396], and 1X proteinase inhibitor cocktail [Sigma-Aldrich, P8340], pH 7.4) using a glass dounce homogenizer (DWK Life Sciences, USA, 357,542). After centrifugation at 800 x g for 15 min, the supernatant was further centrifuged at 11,000 x g for 10 min at 4°C. The pellet was then suspended in lysis buffer and used for immunoblotting.
Bioenergetics analysis using extracellular flux analysis
Mitochondrial respiration in C2C12 myotubes was determined by XFe 24 Extracellular Flux Analyzer using the XF Mito Stress Test Kit (Agilent, 103,015–100) as previously reported [41].
Skeletal muscle mitochondria were isolated by differential centrifugation and their activities were determined as reported [78]. Briefly, 16 µg isolated mitochondrial were incubated in an assay buffer containing 10 mM glutamate (Sigma-Aldrich, G1626) and 5 mM malate (Sigma-Aldrich, M6773) to determine the coupling respiration. ADP (10 mM; Sigma-Aldrich, A2754), oligomycin (2.5 µg/ml; Sigma-Aldrich, O4876), carbonyl cyanide-4-(trifluoromethoxy)phenylhydrazone (FCCP, 12 µM; Cayman Chemical, 15,218), and rotenone (2 µM; Cayman Chemical, 13,995) were sequentially added to determine state III and state IV respiration.
Palmitoyl carnitine-induced mitochondrial respiration was assessed as previously reported [79]. Briefly, 5 µg of isolated mitochondria were incubated in an assay buffer containing 40 µM palmitoyl carnitine (Sigma-Aldrich, 91,503) and 1 mM malate. ADP (50 mM), oligomycin (20 µM), FCCP (40 µM), and antimycin A (40 µM; Sigma-Aldrich, A8674) were sequentially added to determine the respiration rate.
Immunofluorescence staining
Gastrocnemius muscles of HFD-fed Fl/Fl and MBKO mice were collected, embedded in Tissue-Tek O.C.T compound (Sakura Finetek USA Inc, OCT-4583) and frozen sectioned. After fixed in 4% paraformaldehyde, the tissues were blocked with BSA (ExCell Bio, BSA00500) and co-stained with anti-TOMM20 (42,406) and anti-LC3 (83,506) antibodies (Cell Signaling Technology). Alexa Fluor 488- or Alexa Fluor 555-conjugated secondary antibodies (Thermo Fisher Scientific, A11029 and A21426) were used to recognize the primary antibodies. The image was then visualized using LSM 780 confocal microscopy (Carl Zeiss, Germany). Mitochondria morphology and size were determined by the computer program MicroP [80].
Intracellular Ca2+ concentration determination
C2C12 myotubes were washed with Hanks’ balanced salt solution (HBSS; Sigma-Aldrich, H2387) before being incubated in the staining solution (2.5 µM Fluo-4 AM [Biotium, 50,018] and 2.5 mM probenecid [Sigma-Aldrich, P8761] in HBSS) for 20 min at 37°C. After being washed with HBSS 2 times, the cells were imaged under an inverted fluorescence microscope (Nikon Instrument Inc, USA). Basal fluorescence intensity was determined by capturing images at 10 s intervals for 1 min before the addition of BDNF. Images were captured for an additional 5 min at 10 s intervals. Intensity of signals was measured by the software ImageJ (NIH, USA).
Electron microscopy
Gastrocnemius muscle isolated from Fl/Fl or MBKO mice were immersed in a fixative solution (2.5% glutaraldehyde [Sigma-Aldrich, G5882] and 0.5% osmium tetroxide [Sigma-Aldrich, 201,030]) and cut longitudinally. Intramyocellular mitochondrial morphology was visualized by Philips CM100 transmission electron microscope.
Indirect calorimetry
Whole-body fat and lean mass of the animals were determined by 1H-MRS (Echo Medical Systems, Oceanside, New York). Computerized metabolic cages (TSE Systems, Germany) were used to simultaneously measure VO2 consumption, VCO2 production, energy expenditure rates, respiratory quotient, physical activity, and food/water intake in awake mice over 3 days. Labmaster cages that were the most similar to facility home cages were used, thereby allowing the use of bedding in the cage and minimizing any animal anxiety during the experimental period. Energy expenditure rates were normalized to the lean mass of the animals.
Hyperinsulinemic-euglycemic clamp
Insulin sensitivity and glucose metabolism, including glucose infusion rate, whole body glucose turnover, tissue-specific glucose uptake, and hepatic glucose production, were measured in partially restrained, awake mice using a 2-h hyperinsulinemic-euglycemic clamp as previously reported [81].
Statistical analysis
Results are expressed as the mean ± SEM and were considered significant when P < 0.05. Statistical tests performed were Student’s t-test, one-way ANOVA, or two-way ANOVA followed by Tukey’s multiple comparison test or Bonferroni posttests. Analyses were performed using GraphPad Prism (GraphPad Software, USA).
Supplementary Material
Acknowledgments
We would like to thank the National Mouse Metabolic Phenotyping Center (MMPC) at the University of Massachusetts Medical School for their assistance in performing metabolic studies including hyperinsulinemic-euglycemic clamp, metabolic cages, 1H-MRS body composition analysis; and the West Coast Metabolomics Center at UC Davis for tissue metabolites analysis.
Funding Statement
This work is supported by the Hong Kong Government Research Grant Council to CBC (GRF17113817) and CWL (GRF106190036); Hong Kong Medical Research Fund (HMRF6171836) to CBC; the CAMS Initiative for Innovative Medicine (CAMS-I2M 2016-I2M-3007) and National Major Science and Technology Projects of China (2018ZX09711001012, 2018ZX09711001003-005) to XY. Part of this study (indirect calorimetry and hyperinsulinemic-euglycemic clamp) was conducted at the National Mouse Metabolic Phenotyping Center (MMPC) at UMass Medical School supported by an NIH grant (5U2C-DK093000) to JKK
Disclosure statement
The authors declare that they have no competing interests.
Data and materials availability
All data needed to evaluate the conclusion in the paper are present in the paper and/or the Supplementary Materials. Additional information related to this paper may be requested from the corresponding author.
Supplementary material
Supplemental data for this article can be accessed here
References
- [1].Mishra P, Chan DC.. Metabolic regulation of mitochondrial dynamics. J Cell Biol. 2016;212(4):379–387. [DOI] [PMC free article] [PubMed] [Google Scholar]
- [2].Bhatti JS, Bhatti GK, Reddy PH. Mitochondrial dysfunction and oxidative stress in metabolic disorders - A step towards mitochondria based therapeutic strategies. Biochim Biophys Acta Mol Basis Dis. 2017;1863:1066–1077. [DOI] [PMC free article] [PubMed] [Google Scholar]
- [3].Palikaras K, Lionaki E, Tavernarakis N. Mechanisms of mitophagy in cellular homeostasis, physiology and pathology. Nat Cell Biol. 2018;20(9):1013–1022. [DOI] [PubMed] [Google Scholar]
- [4].Narendra DP, Jin SM, Tanaka A, et al. PINK1 is selectively stabilized on impaired mitochondria to activate Parkin. PLoS Biol. 2010;8(1):e1000298. [DOI] [PMC free article] [PubMed] [Google Scholar]
- [5].Kondapalli C, Kazlauskaite A, Zhang N, et al. PINK1 is activated by mitochondrial membrane potential depolarization and stimulates Parkin E3 ligase activity by phosphorylating Serine 65. Open Biol. 2012;2(5):120080. [DOI] [PMC free article] [PubMed] [Google Scholar]
- [6].Shiba-Fukushima K, Imai Y, Yoshida S, et al. PINK1-mediated phosphorylation of the Parkin ubiquitin-like domain primes mitochondrial translocation of Parkin and regulates mitophagy. Sci Rep. 2012;2(1):1002. [DOI] [PMC free article] [PubMed] [Google Scholar]
- [7].Kane LA, Lazarou M, Fogel AI, et al. PINK1 phosphorylates ubiquitin to activate Parkin E3 ubiquitin ligase activity. J Cell Biol. 2014;205(2):143–153. [DOI] [PMC free article] [PubMed] [Google Scholar]
- [8].Geisler S, Holmstrom KM, Skujat D, et al. PINK1/Parkin-mediated mitophagy is dependent on VDAC1 and p62/SQSTM1. Nat Cell Biol. 2010;12(2):119–131. [DOI] [PubMed] [Google Scholar]
- [9].Yamaguchi O, Murakawa T, Nishida K, et al. Receptor-mediated mitophagy. J Mol Cell Cardiol. 2016;95:50–56. [DOI] [PubMed] [Google Scholar]
- [10].Fischer F, Hamann A, Osiewacz HD. Mitochondrial quality control: an integrated network of pathways. Trends Biochem Sci. 2012;37(7):284–292. [DOI] [PubMed] [Google Scholar]
- [11].Rovira-Llopis S, Banuls C, Diaz-Morales N, et al. Mitochondrial dynamics in type 2 diabetes: pathophysiological implications. Redox Biol. 2017;11:637–645. [DOI] [PMC free article] [PubMed] [Google Scholar]
- [12].Potes Y, Perez-Martinez Z, Bermejo-Millo JC, et al. Overweight in the elderly induces a switch in energy metabolism that undermines muscle integrity. Aging Dis. 2019;10(2):217–230. [DOI] [PMC free article] [PubMed] [Google Scholar]
- [13].Gundersen AE, Kugler BA, McDonald PM, et al. Altered mitochondrial network morphology and regulatory proteins in mitochondrial quality control in myotubes from severely obese humans with or without type 2 diabetes. Appl Physiol Nutr Metab. 2020;45(3):283–293. [DOI] [PMC free article] [PubMed] [Google Scholar]
- [14].Kowianski P, Lietzau G, Czuba E, et al. BDNF: a key factor with multipotent impact on brain signaling and synaptic plasticity. Cell Mol Neurobiol. 2018;38(3):579–593. [DOI] [PMC free article] [PubMed] [Google Scholar]
- [15].An JJ, Liao GY, Kinney CE, et al. Discrete BDNF neurons in the paraventricular hypothalamus control feeding and energy expenditure. Cell Metab. 2015;22(1):175–188. [DOI] [PMC free article] [PubMed] [Google Scholar]
- [16].Camerino C, Conte E, Cannone M, et al. Nerve growth factor, brain-derived neurotrophic factor and osteocalcin gene relationship in energy regulation, bone homeostasis and reproductive organs analyzed by mRNA quantitative evaluation and linear correlation analysis. Front Physiol. 2016;7:456. [DOI] [PMC free article] [PubMed] [Google Scholar]
- [17].Clow C, Jasmin BJ. Brain-derived neurotrophic factor regulates satellite cell differentiation and skeltal muscle regeneration. Mol Biol Cell. 2010;21(13):2182–2190. [DOI] [PMC free article] [PubMed] [Google Scholar]
- [18].Delezie J, Weihrauch M, Maier G, et al. BDNF is a mediator of glycolytic fiber-type specification in mouse skeletal muscle. Proc Natl Acad Sci U S A. 2019;116(32):16111–16120. [DOI] [PMC free article] [PubMed] [Google Scholar]
- [19].Matthews VB, Astrom MB, Chan MH, et al. Brain-derived neurotrophic factor is produced by skeletal muscle cells in response to contraction and enhances fat oxidation via activation of AMP-activated protein kinase. Diabetologia. 2009;52(7):1409–1418. [DOI] [PubMed] [Google Scholar]
- [20].Yang X, Brobst D, Chan WS, et al. Muscle-generated BDNF is a sexually dimorphic myokine that controls metabolic flexibility. Sci Signal. 2019;12. [DOI] [PMC free article] [PubMed] [Google Scholar]
- [21].Fulgenzi G, Hong Z, Tomassoni-Ardori F, et al. Novel metabolic role for BDNF in pancreatic beta-cell insulin secretion. Nat Commun. 2020;11(1):1950. [DOI] [PMC free article] [PubMed] [Google Scholar]
- [22].Suomalainen A, Elo JM, Pietilainen KH, et al. FGF-21 as a biomarker for muscle-manifesting mitochondrial respiratory chain deficiencies: a diagnostic study. Lancet Neurol. 2011;10(9):806–818. [DOI] [PMC free article] [PubMed] [Google Scholar]
- [23].Wu Z, Puigserver P, Andersson U, et al. Mechanisms controlling mitochondrial biogenesis and respiration through the thermogenic coactivator PGC-1. Cell. 1999;98(1):115–124. [DOI] [PubMed] [Google Scholar]
- [24].Zong H, Ren JM, Young LH, et al. AMP kinase is required for mitochondrial biogenesis in skeletal muscle in response to chronic energy deprivation. Proc Natl Acad Sci U S A. 2002;99(25):15983–15987. [DOI] [PMC free article] [PubMed] [Google Scholar]
- [25].Jin SM, Lazarou M, Wang C, et al. Mitochondrial membrane potential regulates PINK1 import and proteolytic destabilization by PARL. J Cell Biol. 2010;191(5):933–942. [DOI] [PMC free article] [PubMed] [Google Scholar]
- [26].Harper JW, Ordureau A, Heo JM. Building and decoding ubiquitin chains for mitophagy. Nat Rev Mol Cell Biol. 2018;19(2):93–108. [DOI] [PubMed] [Google Scholar]
- [27].Seabright AP, Fine NHF, Barlow JP, et al. AMPK activation induces mitophagy and promotes mitochondrial fission while activating TBK1 in a PINK1-Parkin independent manner. FASEB J. 2020;34(5):6284–6301. [DOI] [PMC free article] [PubMed] [Google Scholar]
- [28].Herhaus L. TBK1 (TANK-binding kinase 1)-mediated regulation of autophagy in health and disease. Matrix Biol. 2021;100101:84–98. [DOI] [PubMed] [Google Scholar]
- [29].Gabhann JN, Higgs R, Brennan K, et al. Absence of SHIP-1 results in constitutive phosphorylation of tank-binding kinase 1 and enhanced TLR3-dependent IFN-beta production. J Immunol. 2010;184(5):2314–2320. [DOI] [PubMed] [Google Scholar]
- [30].McCoy CE, Carpenter S, Palsson-McDermott EM, et al. Glucocorticoids inhibit IRF3 phosphorylation in response to toll-like receptor-3 and −4 by targeting TBK1 activation. J Biol Chem. 2008;283(21):14277–14285. [DOI] [PubMed] [Google Scholar]
- [31].Twig G, Shirihai OS. The interplay between mitochondrial dynamics and mitophagy. Antioxid Redox Signal. 2011;14(10):1939–1951. [DOI] [PMC free article] [PubMed] [Google Scholar]
- [32].Toyama EQ, Herzig S, Courchet J, et al. AMP-activated protein kinase mediates mitochondrial fission in response to energy stress. Science. 2016;351(6270):275–281. [DOI] [PMC free article] [PubMed] [Google Scholar]
- [33].Chang CR, Blackstone C. Cyclic AMP-dependent protein kinase phosphorylation of Drp1 regulates its GTPase activity and mitochondrial morphology. J Biol Chem. 2007;282(30):21583–21587. [DOI] [PubMed] [Google Scholar]
- [34].Cipolat S, Martins de Brito O, Dal ZB, et al. OPA1 requires mitofusin 1 to promote mitochondrial fusion. Proc Natl Acad Sci U S A. 2004;101(45):15927–15932. [DOI] [PMC free article] [PubMed] [Google Scholar]
- [35].Jheng HF, Tsai PJ, Guo SM, et al. Mitochondrial fission contributes to mitochondrial dysfunction and insulin resistance in skeletal muscle. Mol Cell Biol. 2012;32(2):309–319. [DOI] [PMC free article] [PubMed] [Google Scholar]
- [36].Hawley SA, Pan DA, Mustard KJ, et al. Calmodulin-dependent protein kinase kinase-beta is an alternative upstream kinase for AMP-activated protein kinase. Cell Metab. 2005;2(1):9–19. [DOI] [PubMed] [Google Scholar]
- [37].Woods A, Johnstone SR, Dickerson K, et al. LKB1 is the upstream kinase in the AMP-activated protein kinase cascade. Curr Biol. 2003;13(22):2004–2008. [DOI] [PubMed] [Google Scholar]
- [38].Fortin DA, Srivastava T, Dwarakanath D, et al. Brain-derived neurotrophic factor activation of CaM-kinase kinase via transient receptor potential canonical channels induces the translation and synaptic incorporation of GluA1-containing calcium-permeable AMPA receptors. J Neurosci. 2012;32(24):8127–8137. [DOI] [PMC free article] [PubMed] [Google Scholar]
- [39].Su B, Ji YS, Sun XL, et al. Brain-derived neurotrophic factor (BDNF)-induced mitochondrial motility arrest and presynaptic docking contribute to BDNF-enhanced synaptic transmission. J Biol Chem. 2014;289(3):1213–1226. [DOI] [PMC free article] [PubMed] [Google Scholar]
- [40].Wu W, Xu H, Wang Z, et al. PINK1-Parkin-mediated mitophagy protects mitochondrial integrity and prevents metabolic stress-induced endothelial injury. PLoS One. 2015;10(7):e0132499. [DOI] [PMC free article] [PubMed] [Google Scholar]
- [41].Wood J, Tse MCL, Yang X, et al. BDNF mimetic alleviates body weight gain in obese mice by enhancing mitochondrial biogenesis in skeletal muscle. Metabolism. 2018;87:113–122. [DOI] [PubMed] [Google Scholar]
- [42].Gustafsson AB, Dorn GW 2nd. Evolving and expanding the roles of mitophagy as a homeostatic and pathogenic process. Physiol Rev. 2019;99(1):853–892. [DOI] [PMC free article] [PubMed] [Google Scholar]
- [43].Eisner V, Picard M, Hajnoczky G. Mitochondrial dynamics in adaptive and maladaptive cellular stress responses. Nat Cell Biol. 2018;20(7):755–765. [DOI] [PMC free article] [PubMed] [Google Scholar]
- [44].Marin TL, Gongol B, Zhang F, et al. AMPK promotes mitochondrial biogenesis and function by phosphorylating the epigenetic factors DNMT1, RBBP7, and HAT1. Sci Signal. 2017;10. [DOI] [PMC free article] [PubMed] [Google Scholar]
- [45].Egan DF, Shackelford DB, Mihaylova MM, et al. Phosphorylation of ULK1 (hATG1) by AMP-activated protein kinase connects energy sensing to mitophagy. Science. 2011;331(6016):456–461. [DOI] [PMC free article] [PubMed] [Google Scholar]
- [46].Hung CM, Lombardo PS, Malik N, et al. AMPK/ULK1-mediated phosphorylation of Parkin ACT domain mediates an early step in mitophagy. Sci Adv. 2021;7. [DOI] [PMC free article] [PubMed] [Google Scholar]
- [47].Wang T, Zhu Q, Cao B, et al. Cadmium induces mitophagy via AMP-activated protein kinases activation in a PINK1/Parkin-dependent manner in PC12 cells. Cell Prolif. 2020;53(6):e12817. [DOI] [PMC free article] [PubMed] [Google Scholar]
- [48].Wang B, Nie J, Wu L, et al. AMPKalpha2 protects against the development of heart failure by enhancing mitophagy via PINK1 phosphorylation. Circ Res. 2018;122(5):712–729. [DOI] [PMC free article] [PubMed] [Google Scholar]
- [49].Wang S, Kandadi MR, Ren J. Double knockout of Akt2 and AMPK predisposes cardiac aging without affecting lifespan: role of autophagy and mitophagy. Biochim Biophys Acta Mol Basis Dis. 2019;1865(7):1865–1875. [DOI] [PMC free article] [PubMed] [Google Scholar]
- [50].Li S, Liu C, Li N, et al. Genome-wide coactivation analysis of PGC-1alpha identifies BAF60a as a regulator of hepatic lipid metabolism. Cell Metab. 2008;8(2):105–117. [DOI] [PMC free article] [PubMed] [Google Scholar]
- [51].Axelrod CL, Fealy CE, Mulya A, et al. Exercise training remodels human skeletal muscle mitochondrial fission and fusion machinery towards a pro-elongation phenotype. Acta Physiol (Oxf). 2019;225(4):e13216. [DOI] [PMC free article] [PubMed] [Google Scholar]
- [52].Cuppini R, Sartini S, Agostini D, et al. Bdnf expression in rat skeletal muscle after acute or repeated exercise. Arch Ital Biol. 2007;145:99–110. [PubMed] [Google Scholar]
- [53].Ikeda Y, Shirakabe A, Maejima Y, et al. Endogenous Drp1 mediates mitochondrial autophagy and protects the heart against energy stress. Circ Res. 2015;116(2):264–278. [DOI] [PubMed] [Google Scholar]
- [54].Miwa S, Lawless C, von Zglinicki T. Mitochondrial turnover in liver is fast in vivo and is accelerated by dietary restriction: application of a simple dynamic model. Aging Cell. 2008;7(6):920–923. [DOI] [PMC free article] [PubMed] [Google Scholar]
- [55].Monteggia LM, Luikart B, Barrot M, et al. Brain-derived neurotrophic factor conditional knockouts show gender differences in depression-related behaviors. Biol Psychiatry. 2007;61(2):187–197. [DOI] [PubMed] [Google Scholar]
- [56].Hogan NL, Jaehne EJ, Bak S, et al. van den Buuse M. Brain-derived neurotrophic factor Val66Met induces female-specific changes in impulsive behaviour and alcohol self-administration in mice. Behav Brain Res. 2021;401:113090. [DOI] [PubMed] [Google Scholar]
- [57].Kreinin A, Lisson S, Nesher E, et al. Blood BDNF level is gender specific in severe depression. PLoS One. 2015;10(5):e0127643. [DOI] [PMC free article] [PubMed] [Google Scholar]
- [58].Huang Y, Huang C, Zhang Q, et al. Serum BDNF discriminates Parkinson’s disease patients with depression from without depression and reflect motor severity and gender differences. J Neurol. 2021;268(4):1411–1418. [DOI] [PubMed] [Google Scholar]
- [59].Zhao Z, Xue F, Gu Y, et al. Crosstalk between the muscular estrogen receptor alpha and BDNF/TrkB signaling alleviates metabolic syndrome via 7,8-dihydroxyflavone in female mice. Mol Metab. 2021;45:101149. [DOI] [PMC free article] [PubMed] [Google Scholar]
- [60].Gibbs RB. Treatment with estrogen and progesterone affects relative levels of brain-derived neurotrophic factor mRNA and protein in different regions of the adult rat brain. Brain Res. 1999;844(12):20–27. [DOI] [PubMed] [Google Scholar]
- [61].Zhang Y, Zhang SW, Khandekar N, et al. Reduced serum levels of oestradiol and brain derived neurotrophic factor in both diabetic women and HFD-feeding female mice. Endocrine. 2017;56(1):65–72. [DOI] [PubMed] [Google Scholar]
- [62].Ribas V, Drew BG, Zhou Z, et al. Skeletal muscle action of estrogen receptor alpha is critical for the maintenance of mitochondrial function and metabolic homeostasis in females. Sci Transl Med. 2016;8:334ra54. [DOI] [PMC free article] [PubMed] [Google Scholar]
- [63].Nilsson ME, Vandenput L, Tivesten A, et al. Measurement of a comprehensive sex steroid profile in rodent serum by high-sensitive gas chromatography-tandem mass spectrometry. Endocrinology. 2015;156(7):2492–2502. [DOI] [PubMed] [Google Scholar]
- [64].Fan Y, Liu Y, Xue K, et al. Diet-induced obesity in male C57BL/6 mice decreases fertility as a consequence of disrupted blood-testis barrier. PLoS One. 2015;10(4):e0120775. [DOI] [PMC free article] [PubMed] [Google Scholar]
- [65].Genzer Y, Chapnik N, Froy O. Effect of brain-derived neurotrophic factor (BDNF) on hepatocyte metabolism. Int J Biochem Cell Biol. 2017;88:69–74. [DOI] [PubMed] [Google Scholar]
- [66].Teillon S, Calderon GA, Rios M. Diminished diet-induced hyperglycemia and dyslipidemia and enhanced expression of PPARalpha and FGF21 in mice with hepatic ablation of brain-derived neurotropic factor. J Endocrinol. 2010;205(1):37–47. [DOI] [PubMed] [Google Scholar]
- [67].Park HR, Park M, Choi J, et al. A high-fat diet impairs neurogenesis: involvement of lipid peroxidation and brain-derived neurotrophic factor. Neurosci Lett. 2010;482(3):235–239. [DOI] [PubMed] [Google Scholar]
- [68].Liu Z, Patil IY, Jiang T, et al. High-fat diet induces hepatic insulin resistance and impairment of synaptic plasticity. PLoS One. 2015;10(5):e0128274. [DOI] [PMC free article] [PubMed] [Google Scholar]
- [69].Teodoro BG, Baraldi FG, Sampaio IH, et al. Melatonin prevents mitochondrial dysfunction and insulin resistance in rat skeletal muscle. J Pineal Res. 2014;57(2):155–167. [DOI] [PubMed] [Google Scholar]
- [70].Wahwah N, Kras KA, Roust LR, et al. Subpopulation-specific differences in skeletal muscle mitochondria in humans with obesity: insights from studies employing acute nutritional and exercise stimuli. Am J Physiol Endocrinol Metab. 2020;318(4):E538–E53. [DOI] [PubMed] [Google Scholar]
- [71].Koves TR, Ussher JR, Noland RC, et al. Mitochondrial overload and incomplete fatty acid oxidation contribute to skeletal muscle insulin resistance. Cell Metab. 2008;7(1):45–56. [DOI] [PubMed] [Google Scholar]
- [72].Pandey SN, Kwatra M, Dwivedi DK, et al. 7,8-Dihydroxyflavone alleviated the high-fat diet and alcohol-induced memory impairment: behavioral, biochemical and molecular evidence. Psychopharmacology (Berl). 2020;237(6):1827–1840. [DOI] [PubMed] [Google Scholar]
- [73].Kumar D, Dwivedi DK, Lahkar M, et al. Hepatoprotective potential of 7,8-Dihydroxyflavone against alcohol and high-fat diet induced liver toxicity via attenuation of oxido-nitrosative stress and NF-kappaB activation. Pharmacol Rep. 2019;71(6):1235–1243. [DOI] [PubMed] [Google Scholar]
- [74].Sebori R, Kuno A, Hosoda R, et al. Resveratrol decreases oxidative stress by restoring mitophagy and improves the pathophysiology of dystrophin-deficient mdx mice. Oxid Med Cell Longev. 2018;2018:9179270. [DOI] [PMC free article] [PubMed] [Google Scholar]
- [75].Ramesh M, Campos JC, Lee P, et al. Mitophagy protects against statin-mediated skeletal muscle toxicity. FASEB J. 2019;33(11):11857–11869. [DOI] [PMC free article] [PubMed] [Google Scholar]
- [76].Jeanblanc J, Logrip ML, Janak PH, et al. BDNF-mediated regulation of ethanol consumption requires the activation of the MAP kinase pathway and protein synthesis. Eur J Neurosci. 2013;37(4):607–612. [DOI] [PMC free article] [PubMed] [Google Scholar]
- [77].Ju JS, Varadhachary AS, Miller SE, et al. Quantitation of “autophagic flux” in mature skeletal muscle. Autophagy. 2010;6:929–935. [DOI] [PMC free article] [PubMed] [Google Scholar]
- [78].Iuso A, Repp B, Biagosch C, et al. Assessing mitochondrial bioenergetics in isolated mitochondria from various mouse tissues using seahorse XF96 analyzer. Methods Mol Biol. 2017;1567:217–230. [DOI] [PubMed] [Google Scholar]
- [79].Boutagy NE, Rogers GW, Pyne ES, et al. Using isolated mitochondria from minimal quantities of mouse skeletal muscle for high throughput microplate respiratory measurements. J Vis Exp. 2015;e53216. [DOI] [PMC free article] [PubMed] [Google Scholar]
- [80].Peng JY, Lin CC, Chen YJ, et al. Automatic morphological subtyping reveals new roles of caspases in mitochondrial dynamics. PLoS Comput Biol. 2011;7(10):e1002212. [DOI] [PMC free article] [PubMed] [Google Scholar]
- [81].Kim JK. Hyperinsulinemic-euglycemic clamp to assess insulin sensitivity in vivo. Methods Mol Biol. 2009;560:221–238. [DOI] [PubMed] [Google Scholar]
Associated Data
This section collects any data citations, data availability statements, or supplementary materials included in this article.