Abstract
The neurological basis of affective behaviors in everyday life is not well understood. We obtained continuous intracranial electroencephalography (iEEG) recordings from the human mesolimbic network in 11 participants with epilepsy and hand-annotated spontaneous behaviors from 116 hours of multiday video recordings. In individual participants, binary random forest models decoded affective behaviors from neutral behaviors with up to 93% accuracy. Both positive and negative affective behaviors were associated with increased high-frequency and decreased low-frequency activity across the mesolimbic network. Insula, amygdala, hippocampus, and anterior cingulate cortex (ACC) made stronger contributions to affective behaviors than the orbitofrontal cortex, but the insula and ACC were most critical for differentiating behaviors with observable affect from those without. In a subset of participants(N=3), multiclass decoders distinguished among the positive, negative, and neutral behaviors. These results suggest that spectro-spatial features of brain activity in the mesolimbic network are associated with affective behaviors of everyday life.
Introduction
The outward expression of internal feeling states in affective behaviors play an integral role in everyday human life. Functional magnetic resonance imaging (fMRI) and scalp-based electroencephalography (EEG) studies have used task-based paradigms to reveal a distributed neural network that supports the generation of emotions and their accompanying affective behaviors. The insula and anterior cingulate cortex (ACC) are tightly connected structures within a mesolimbic network that are critical for producing and sensing the motor and autonomic changes that arise during emotions. Activity in the mesolimbic network increases as affective experience intensifies but decreases with engagement of emotion regulation systems anchored by orbitofrontal cortex (OFC)1–3. Engagement of emotion regulation systems allows individuals to control their feelings and reduces activity in emotion generating structures such as the amygdala1,4,5. While some previous neuroimaging studies have indicated that certain regions in the mesolimbic network play predominant roles in specific emotions (e.g., insula in disgust6–10, subgenual ACC in sadness, amygdala in fear11,12, and ventral striatum in joy13), there is also evidence that the insula and ACC, together with the mesolimbic network, coactivate during a wide range of affective states14. Electrical stimulation of these structures offers convergent evidence that activation or deactivation of distinct mesolimbic network nodes.
EEG provides additional insights into mesolimbic network functioning in affective contexts. EEG studies, which quantify neural activity on faster timescales than fMRI and in different frequency bands, have demonstrated that mesolimbic structures exhibit rapid responses (<300 ms) in local field potentials to emotional faces11,15–19 and evocative images20. These studies offer some evidence that different affective reactions are accompanied by distinct patterns of spatial activity in the mesolimbic network, with certain structures playing more prominent roles in some affective states than in others. Images that elicit negative emotions, for example, increase high gamma band activity in the amygdala more than in other mesolimbic regions11. There is mixed evidence, however, as to whether different spectral patterns across the mesolimbic network differentiate among affective states. While some studies have found that increased high gamma band activity in mesolimbic structures characterizes both positive21–23 and negative emotions11,22,24–26, others have found that increased activity in lower frequency bands (e.g., theta and alpha) may be a distinguishing feature of positive emotions27.
Although prior fMRI and EEG studies have helped to elucidate the role of the mesolimbic network during emotion-relevant, task-based paradigms, methodological constraints have limited investigations in more ecologically valid contexts. Little is known, therefore, about how the brain produces the affective behaviors that arise amidst the ups and downs of everyday life. Here, we obtained multiday video recordings of participants undergoing surgery for intractable epilepsy who had intracranial EEG (iEEG) electrodes28,29 implanted in the mesolimbic network. Participants’ spontaneous affective behaviors (herein, “naturalistic affective behaviors”) were hand-annotated from the video recordings of their hospital stay and used to probe attendant neural activity patterns. We tested whether binary models could decode positive and negative affective behaviors from those lacking clear affect (“neutral behaviors”) from the iEEG recordings, and we then examined which mesolimbic features influenced the decoders’ performance. In a subset of participants (N=3), we also tested whether multiclass decoders could distinguish among all three behavior types.
Our central hypothesis was that power changes in specific frequency bands (i.e., spectral features) in specific network hubs (i.e., spatial features) would together create “spectro-spatial” patterns across the mesolimbic network that distinguish among different types of naturalistic behavior. Positive and negative affective behaviors, by definition, differ in valence, but they can also have similar qualities such as comparable levels of arousal (i.e., intensity), which may be represented by shared network changes. Thus, we expected that, though common spectral changes in mesolimbic structures might characterize both positive and negative affective behaviors, each behavioral class would also have spectro-spatial features that make it unique. As gamma band activity is thought to reflect neuronal activity in humans43, we hypothesized that both positive and negative affective behaviors would be characterized by increased gamma activity. We further hypothesized that gamma activity in the insula and ACC, regions that facilitate emotions13,44, would contribute more strongly to the production of affective behaviors than gamma activity in the OFC, a region that often inhibits emotions19,45–47. We anticipated that, whereas distributed network-level spectral changes may characterize affective behaviors in general, spatial differences may serve to differentiate among positive and negative affective behaviors given that some regions play prominent roles in certain emotions. Given that stimulation of the ventral ACC can induce positive behaviors and feelings such as laughter and mirth10,12,49, and stimulation of the dorsal ACC and amygdala can produce feelings of fear and doom50, we expected that the ventral ACC might contribute more to positive affective behaviors whereas the dorsal ACC and amygdala might participate more in negative affective behaviors24,27,30.
Results
We obtained 24-hour bedside audiovisual recordings and continuous iEEG data in participants with intractable epilepsy. Participants were hospitalized for clinical seizure monitoring and had temporary implanted subdural electrodes (Figure 1-A, Supplementary Information, Supplementary Table 1). To examine the neural mechanisms underlying naturalistic affective behaviors, we analyzed a total of 116 hours (mean = 10.5 hour, SD = 5.48) of behavioral (Figure 1-B) and neural data (Figure 1-C) in 11 participants with electrodes placed in at least three mesolimbic structures, which here included the insula, ACC, OFC, amygdala, and hippocampus (Supplementary Table 1). Although participants had extensive coverage across the mesolimbic network, electrode placement was based on each participant’s clinical needs and, thus, varied somewhat across individuals.
Figure 1. Collection and processing pipelines for the behavioral and neural data streams.
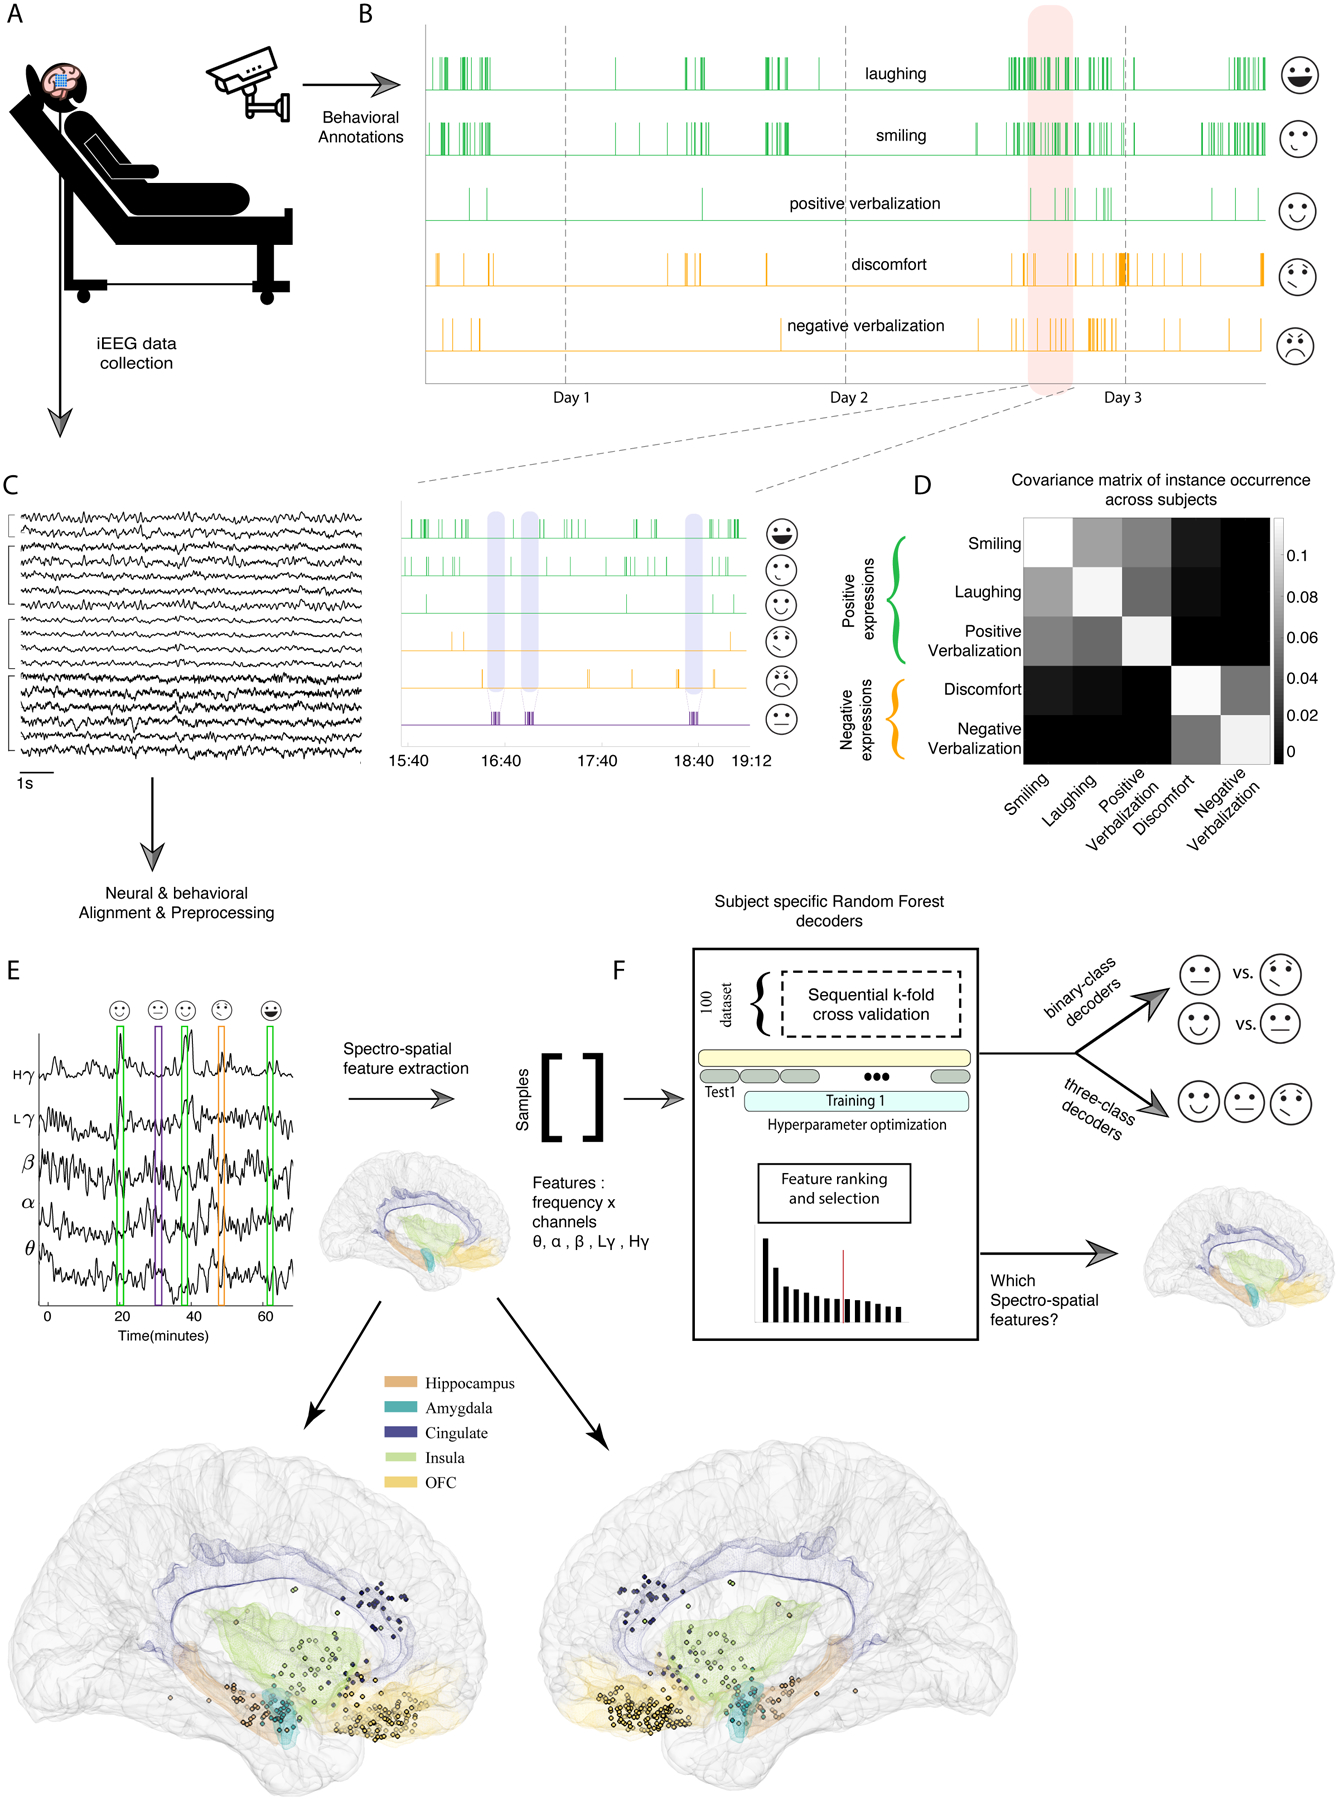
A) Schematic of an example participant who underwent continuous neural and video recordings during the multiday hospital stay. B) Video recordings were hand-annotated to identify instances of positive affective behaviors (green), negative affective behaviors (orange), and neutral behaviors. In the inset, we zoom in on a three-hour period (orange shading) to illustrate examples of neutral behaviors (purple shading). C) 10 seconds of raw iEEG data traces from four regions are provided as examples. D) Covariance matrix of occurrences of affective behaviors across participants are shown. E) Magnitude of Hilbert transform in five frequency bands from an insula channel across 60 minutes are overlaid on instances of affective behaviors. E) bottom panels: Right- and left-hemisphere views of the Montreal Neurological Institute (MNI) template brain are provided to show the verified electrode coverage of mesolimbic structures across the sample. F) The pipeline for training the random forest decoder models is shown.
Eleven human raters annotated participants’ spontaneous behaviors in the video recordings (Figure 1-B & Supplementary Information, Supplementary Tables 2 and 3, Extended Data Figure 1-A). As there was a positive correlation among the total number of smiling, laughing, and positive verbalization instances in each participant, these behaviors were aggregated as “positive affective behaviors.” There was also a positive correlation between the total number of pain-discomfort and negative verbalization instances, and these behaviors were therefore aggregated as “negative affective behaviors” (Figure 1-D). We defined “neutral behaviors” as periods in which there were neither positive nor negative affective behaviors for at least 10 minutes (purple shading in Figure 1-B, bottom panel). These periods were often characterized by other behaviors lacking clear affect such as eating, sleeping, or conversing (Supplementary Table 3). Although it can be argued that no activities are truly affectively neutral30, these behaviors offered a rigorous control condition with which to compare the affective behaviors because, unlike moments of rest, they included behaviors of varying levels of engagement and movement.
After aligning the neural and behavioral data (Figure 1-E & Extended Data Figure 2), we extracted the spectral power in conventional EEG frequency bands (see Methods) from electrodes in mesolimbic structures. We computed the average power in each frequency band (i.e., the spectral features) for each electrode (i.e., the spatial features, Figure 1-E bottom), using 10-second non-overlapping windows centered on each positive, negative, or neutral behavior. Together, we refer to these as the “spectro-spatial features.”
Personalized random forest models decoded affective behaviors
We first trained binary decoders (Figure 1 F) to determine whether we could distinguish affective behaviors from neutral behaviors in each participant. The goal of the positive decoder was to distinguish positive affective behaviors from neutral behaviors (n = 10 participants), and the goal of the negative decoder was to distinguish negative affective behaviors from neutral behaviors (n = 5 participants). For each participant, we constructed random forest (RF) models and trained them on the spectro-spatial features for the positive, negative, and neutral behaviors (Figure 2 A–B).
Figure 2. Within-subject random forest models decoded positive and negative affective behaviors from neutral behaviors.
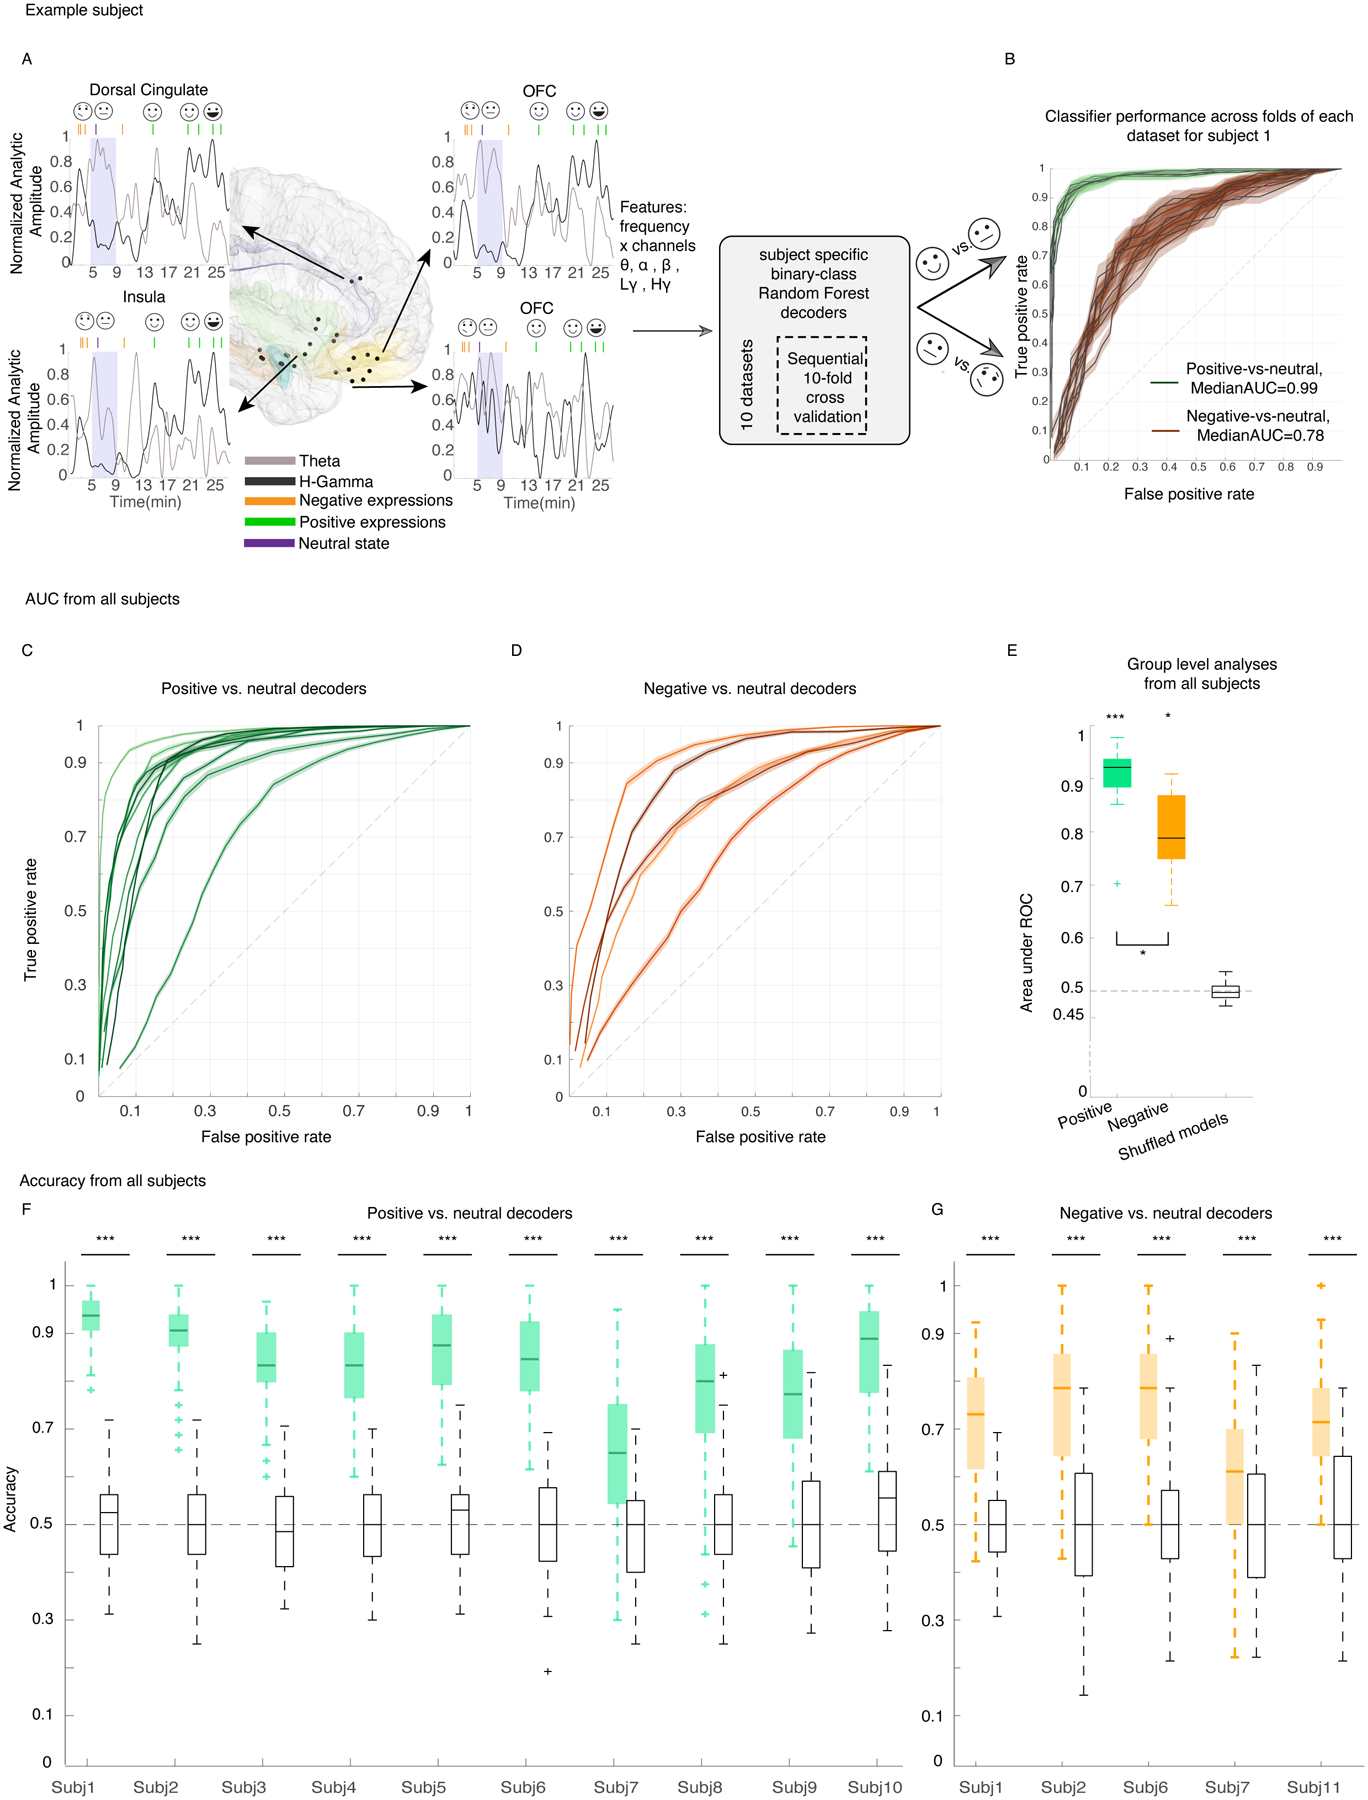
A) Locations of the leads (black dots) and spectral features used in the decoder models for an example participant is illustrated using the MNI template brain (Methods, section “Electrode localization”). Insets indicate 27 minutes of high gamma (black) and theta (gray) analytic amplitudes for four example channels, aligned with the affective behaviors in green and orange for the example subject; purple shadings show neutral periods. The analytic amplitudes were averaged using a 10-second non-overlapping window and then convolved by a gaussian with a standard deviation of 20 seconds. B) receiver operating characteristic (ROC) curve for the example participant across 10 datasets (neutral behaviors were selected from different recording times to reduce selection bias) for positive decoders (green) and negative decoders (orange). The shadings represent the SEM across 10 folds. C & D) Area under ROC curve (AUC) for all 10 and five participants on which the positive and negative decoders were trained, respectively. Each solid line represents one participant. The shadings are SEM across all 100 datasets. E) Distribution of average AUC for positive (green, n= 10 participants), negative (orange, n = 5 participants), and permuted models (black, n= 15 from both positive and negative) that were trained the same way using the shuffled labels across all participants, significance level = 0.05 since the average of 100 runs from each participant is included. AUC of positive and negative decoders were significantly different from the shuffled models with p = 0.00003 & p = 0.0012, respectively. Positive decoders reached larger AUC than the negative decoders with p = 0.04. F&G) Accuracies of the same models as in C and D. Accuracy of all n=100 RF models are significantly different from 100 permuted models for all participants, p<0.0001 (Supplementary Tables 10 & 11). In the box plots(E-G) central lines represent the median and the two edges represent 25 and 75 percentiles, whiskers show the most extreme datapoints and outliers are shown individually (see MATLAB boxplot function). All reported statistics in E-G are from two-sided pairwise ranksum test.
At the individual level, the spectro-spatial features of the mesolimbic network discriminated positive affective behaviors (10/10 participants; Figure 2-C) and negative affective behaviors (5/5 participants; Figure 2-D) from neutral behaviors significantly better than chance. The group-level results replicated the successful performance of the positive and negative decoders at the individual level (Mean ± sem, area under the curve [AUC] = 0.90 ± 0.02, n= 10, Wilcoxon ranksum test, p < 0.001 & 0.80 ± 0.04, n= 5, p = 0.0012, Figure 2-E). Similar findings were also obtained using accuracy measures (number of true predicted samples / all samples) across all participants (Figure 2 F–G). A comparison of decoding performance revealed that the positive decoders performed significantly better than the negative decoders (Wilcoxon ranksum test, p = 0.04, Figure 2-E).
As the periods of neutral behavior included activities of varying levels of arousal, engagement, and movement, we conducted two additional analyses to investigate whether these factors influenced our results. First, we removed periods in which participants engaged in miscellaneous activities (e.g., sleep/eye-closure, conversation, eating, drinking, etc.) and selected a subset of moments in which no behaviors were annotated (see Supplementary Table 3). These periods represented a quiet yet alert resting state (here, referred as “rest”) that was presumably characterized by lower arousal and lower movement than the broader neutral behavior category. Binary RF decoders, trained as above in each participant, successfully decoded positive affective behaviors (n = 9 participants) and negative affective behaviors (n = 5 participants) from rest using the spectro-spatial features (Extended Data Figure 3). Despite some participant-level variability, when examined across the sample there was no significant difference between the mean AUC from the binary decoders comparing affective behaviors to neutral behaviors and the mean AUC from the binary decoders comparing affective behaviors to rest. Next, we limited our analyses to examine whether the decoders could distinguish between affective and neutral behaviors only during conversations. As most affective behaviors arose during periods of conversation (mean across all participants = 75%, SD=19%, n = 11 participants, Supplementary Table 4), comparing affective and neutral behaviors in this context was a rigorous test of our results because participants’ engagement and movement (i.e., speech, gesture, etc.) were likely comparable between the affective and neutral moments of the conversations. The binary decoders again successfully distinguished positive and negative affective behaviors from neutral behaviors during the conversations (Extended Data Figure 4). Taken together, these additional analyses suggest our primary results withstood additional behavioral contrasts and, thus, were unlikely to be explained solely by variability in arousal, engagement, or movement across the behavioral classes.
Shared spectral changes discriminated affective behaviors
To identify the features that enabled the RF decoders to discriminate affective behaviors from neutral behaviors in each participant, we used the trained decoder models to rank the spectro-spatial features that best discriminated positive and negative affective behaviors from neutral behaviors at the individual level. This unbiased feature selection approach (see “Feature Selection” in Methods section and Supplementary Information) revealed that high gamma activity and low-frequency activity across multiple mesolimbic structures contributed to the successful decoding of positive affective behaviors from neutral behaviors (Figure 3 A–B). A similar spectral pattern emerged when we examined the features that decoded negative affective behaviors from neutral behaviors (Supplementary Figure 1). These findings confirmed that a data-driven approach could uncover personalized biomarkers that distinguished both positive and negative affective from neutral behaviors.
Figure 3. There was increased gamma band (low and high) activity during affective behaviors compared to neutral behaviors.
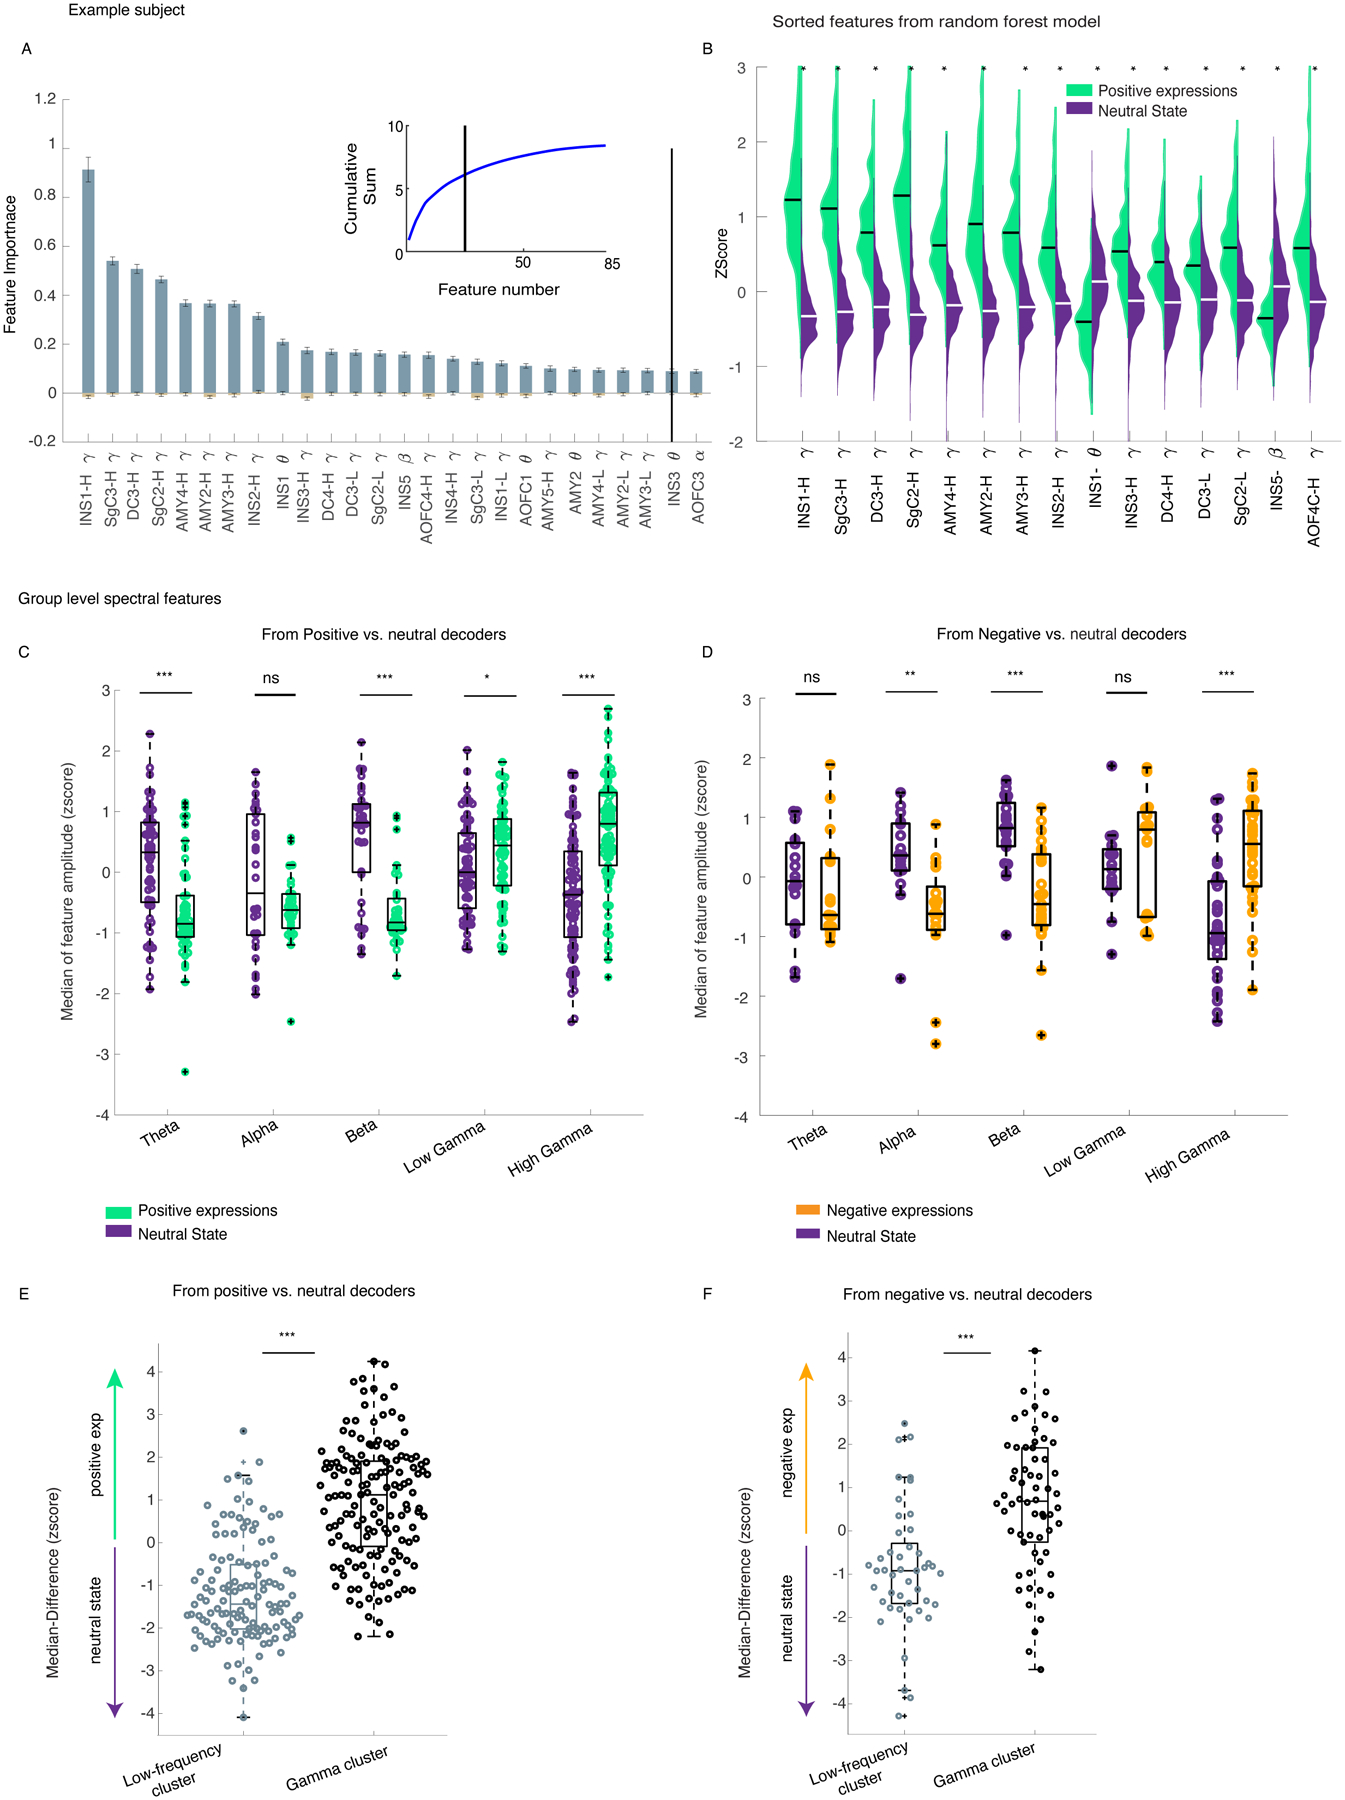
A) The feature importance across n=100 dataset/runs from the positive decoders is shown for the example participant (Subject 1); Data are presented as mean values +/− SEM. The inset shows the cumulative summation curve of the average feature importance value across the runs; the black vertical lines are the objective threshold that was used to select the top features. B) The sample distributions of the top 15 selected features for the positive affective behaviors (green) and neutral behaviors (purple) are provided. All sample distributions were significantly different from each other(p<0.0001). C) The normalized median distributions of the positive affective behaviors and the neutral behaviors are shown for selected features across the sample. The median values from the positive decoders were first normalized to the maximum absolute spectral amplitude across selected features at a within-subject level and then pooled across all participants (n = 10). The median values from the positive affective behaviors were significantly different from the neutral behaviors within theta (n=55, p=9 * 10−6), beta (n=37, p=10−6), low gamma (n= 65, p= 0.043), and high gamma bands (n=86, p=10−9). D) The normalized median distributions of negative affective behaviors and neutral behaviors are shown for selected features (from five participants). The median values were significantly different within alpha (n=17, p=0.0004), beta (n=23, p=6 * 10−5), and high gamma (n= 33, p=10−5). E) The median difference score of the gamma cluster was selective to positive(n=149) and F) negative affective(n=62) behaviors. The low-frequency cluster (n=124 for positive, n=45 for negative decoders) is significantly different from the gamma cluster for both positive (panel E, p= 10−26) and negative decoders (panel F, p=3 * 10−6). All pairwise statistical comparisons are based on non-parametric two-sided ranksum test (B-F). In the box plots(C-F) central lines represent the median and the two edges represent 25 and 75 percentiles, whiskers show the most extreme datapoints and outliers are shown individually (see MATLAB boxplot function). INS: insula, SgC = Subgenual cingulate, DC = dorsal cingulate, AMY: amygdala. H = high, L = low.
Next, we selected the personalized spectro-spatial features from each decoder type (Supplementary Figures 2 & 3) and investigated the preference of these features for the positive and negative affective behaviors. Additional evidence for the robustness of the selected neural features came from the three other statistical methods (Supplementary Figures 4–7) that we used to replicate our results. Across the sample, positive affective behaviors were again characterized by increased power in the high and low gamma bands and decreased power in the low-frequency bands (e.g., theta and beta) (Figure 3-C, Supplementary Table 5). Negative affective behaviors were also characterized by increased high gamma band activity and decreased low-frequency band activity (alpha and beta, Figure 3-D). To map the features in two affective spaces (i.e., positive, or negative affective behaviors versus neutral behaviors), we conducted hierarchical clustering in each participant (see “Clustering” in Methods and Supplementary Figure 8). These analyses also uncovered “gamma” and “low-frequency” clusters that distinguished positive and negative affective behaviors from neutral behaviors; we found similar results within each participant and across the sample (Figure 3E–F, Supplementary Information “Clustering Analyses”).
Distinct spatial patterns characterized affective behaviors
Our results revealed a common spectral pattern—increased gamma activity and decreased low-frequency activity—across the mesolimbic network during affective behaviors (Supplementary Figures 9 & 10) within each participant. We next asked whether, despite this distributed spectral pattern, certain brain regions within the mesolimbic network were more important than others to affective behaviors, in general, and to positive or negative affective behaviors, in particular. Consistent with our prior results that emerged when the data were analyzed across the network at the individual level (Supplementary Figures 9 & 10), changes in both the low-frequency and gamma clusters also characterized both types of affective behavior when examined across the group (Figure 4). These results again suggested that each region within the network participated in positive and negative affective behaviors.
Figure 4. “Gamma” and “low-frequency” clusters belonged to a distributed network.
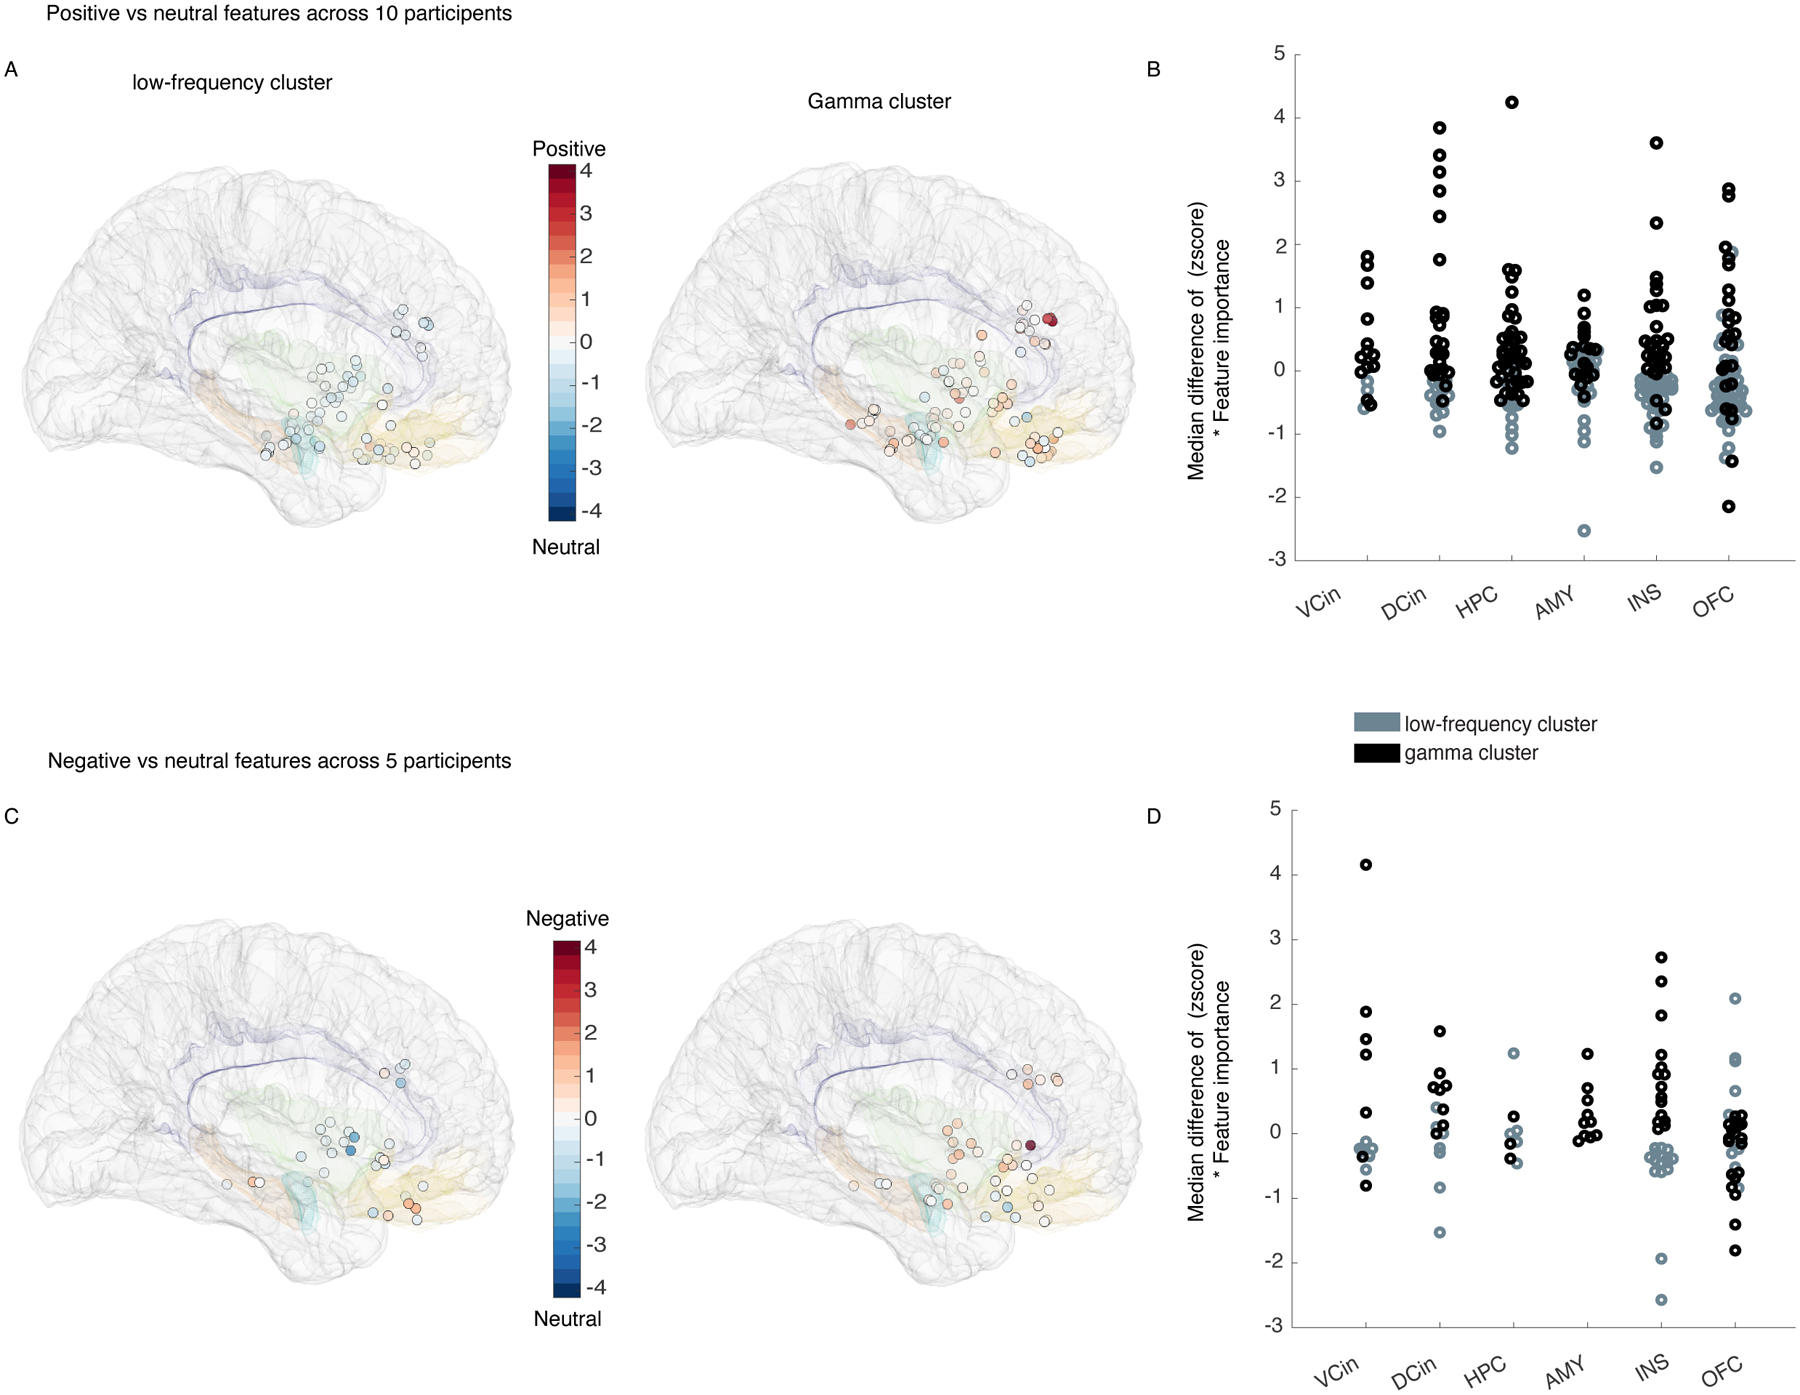
Each of the electrodes are illustrated on the MNI template brain (Methods, section “Electrode localization”) with their corresponding contribution to the “low-frequency” (left) and “gamma” (right) clusters from the positive decoders in all 10 participants. White circles on the MNI brain indicate that the low-frequency cluster, which is scaled close to 0, was less important than the gamma cluster. B) The median difference scores (see Figure 3 for details) from the gamma and low-frequency clusters from the positive decoders are shown grouped by location. C & D) As in A & B, pooled data from the negative decoders are shown in five participants. INS: insula, VCin = Ventral cingulate, DCin = dorsal cingulate, AMY: amygdala, OFC = orbitofrontal cortex, HPC = hippocampus.
We next conducted a more in-depth analysis to investigate whether certain regions made stronger contributions to the cluster-level results. Visualization of the median difference scores for the gamma and low-frequency clusters in each region indicated that spectral changes in some structures were more frequently selected than others for affective behaviors. Compared to neutral behaviors, positive affective behaviors (Figure 4-B) were more often characterized by increased gamma activity than decreased low-frequency activity in certain regions (i.e., ventral ACC, hippocampus, and dorsal ACC, Extended Data Figure 5-E). The spectral pattern in other regions (such as OFC) during positive affective behaviors was more complex, however, as changes in both clusters contributed to these behaviors (Figure 4A–B & Extended Data Figure 5-E). When we compared negative affective behaviors to neutral behaviors, increased gamma activity in the amygdala was the most notable distinguishing feature (Figure 4-C&D), but low-frequency activity in the amygdala did not contribute to negative affective behaviors. The spectral changes in other regions (i.e., hippocampus, insula, ventral ACC, and dorsal ACC) showed a preference for the low-frequency cluster during negative affective behaviors (Extended Data Figure 5-F). These results indicated that certain regions within the mesolimbic network contributed more strongly to different types of affective behavior when neural activity was quantified within specific frequency bands.
As a more rigorous test of these results, we re-trained the within-subject positive (Extended Data Figure 6 & Supplementary Table 6) and negative (Extended Data Figure 7 & Supplementary Table 7) decoders in each region, one at a time, leveraging all of its spectral features. Across the sample, widespread spectral changes in the insula (7/9 participants), amygdala (5/5 participants), hippocampus (6/7 participants), and ventral ACC (4/4 participants) were more likely (>50% of participants) to discriminate positive affective behaviors from neutral behaviors than spectral changes in the OFC (4/9 participants) or dorsal ACC (4/10 participants, Extended Data Figure 6). Spectral changes in the insula (4/4 participants), amygdala (1/1 participant), hippocampus (2/2 participants), and dorsal ACC (3/5 participants) were more likely than spectral changes in the ventral ACC (1/2 participants) or OFC (1/5 participants) to distinguish negative affective behaviors from neutral behaviors (Extended Data Figure 7).
Insula and ACC are the most generalizable spatial features
To examine the generalizability of our within-subject results, we performed cross-subject decoding using a subset of the sample with iEEG electrodes implanted in the insula, OFC, and dorsal ACC, the three most commonly sampled regions for the positive and negative decoders (see Methods).
The positive decoders discriminated positive affective behaviors from neutral behaviors in 5/6 participants with a generalizability score (see Methods) of 0.73 ± 0.13 where chance is 0.50 (Figure 5-A). We then used five spectral bands within each region and trained the decoders in the same way for each region, one at a time. These analyses revealed that spectral features from the dorsal ACC (0.71 ±0.12) and insula (0.70 ±0.12) led to greater generalizability score for the positive decoder than the spectral features from the OFC (0.60 ±0.09, Figure 5-B). To investigate the role of the ACC further, we used another subset of participants with electrode coverage in the ventral ACC and trained the decoder in the same way, which resulted in a generalizability score of 0.76 ±0.07 (Figure 5-C).
Figure 5. Cross-subject decoding shows the spectral features from OFC, dorsal cingulate, and insula were generalizable across participants with implanted leads in these regions.
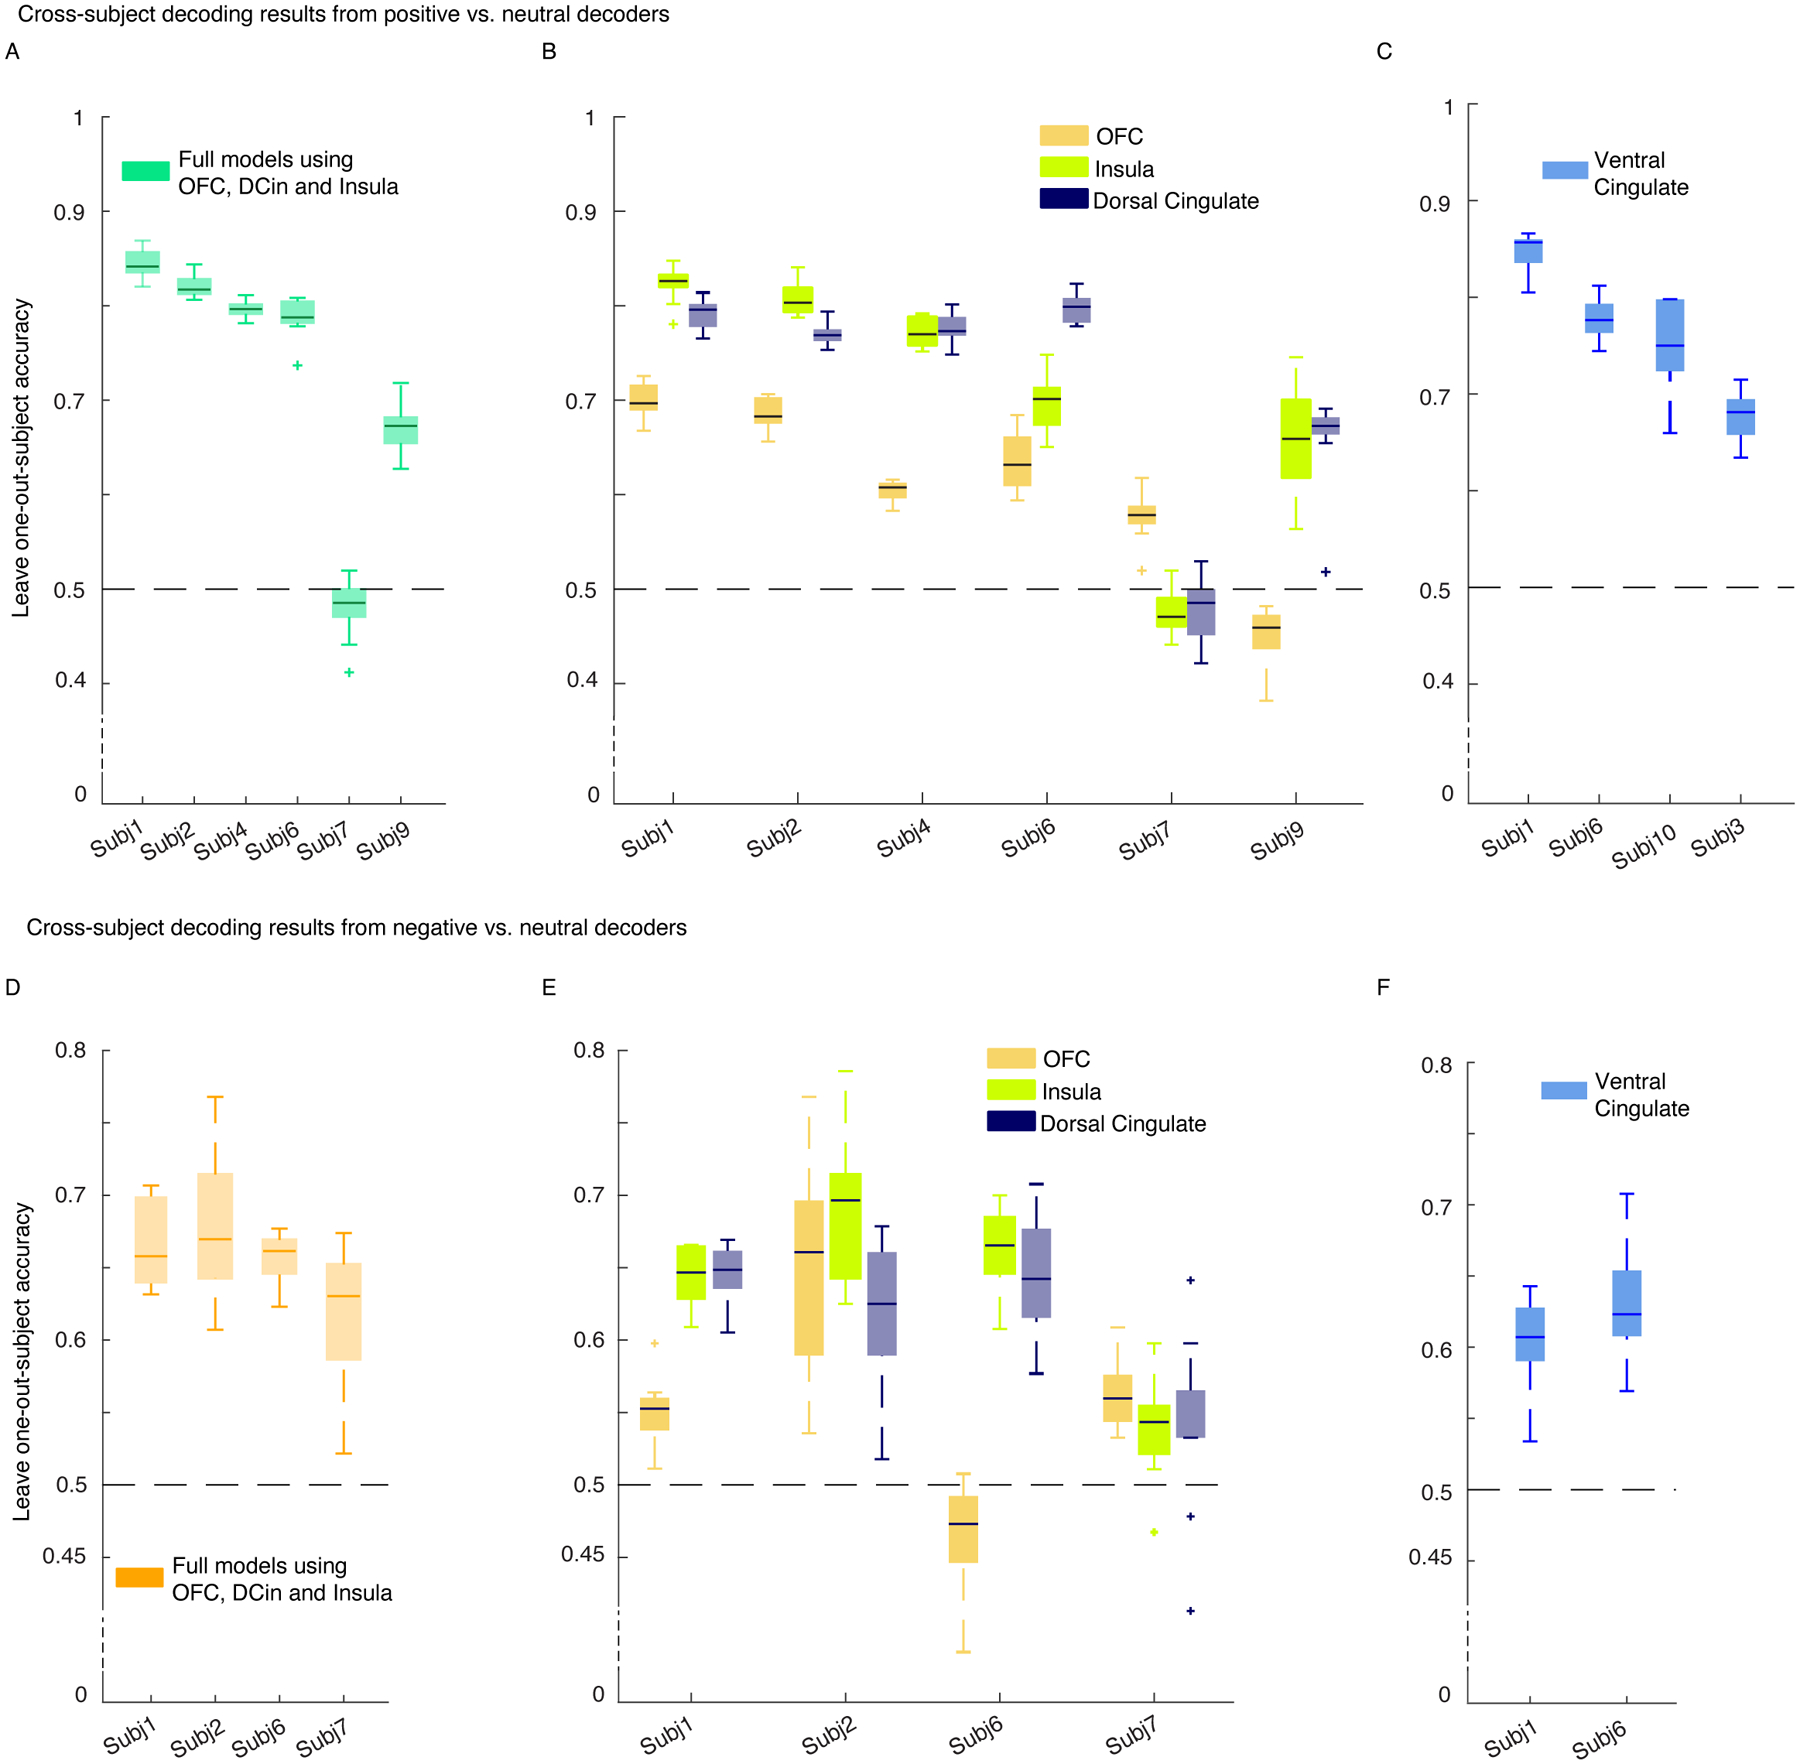
For both positive and negative affective behaviors, the insula, DCin, and VCin were generalizable features compared to the OFC. A) The leave-one-out-subject accuracy for the positive decoders is provided across n=100 datasets. Spectral features from all five frequency bands were averaged across contacts within each region for each participant, and then each participant was omitted for training the model. The reported accuracies are test accuracies on each leave-one-out subject. All accuracy metrics are above 50% chance level except for Subject 7. The average leave-one-out accuracy (which is referred to as the “generalizability score”) is 0.73 with std = 0.13, n = 6 participants. B) The leave-one-out accuracies of the decoders trained on the spectral features of each region (n=5 features), one at a time, are shown. Generalizability scores for OFC, insula, and DCin are as follows: (n= 6 partcipants, mean ± sem: 0.60 ± 0.09, 0.70 ± 0.12, 0.71 ± 0.12. C) We trained the cross-subject postive decoders in four participants with electrodes implanted in VCin. The generalizabaility score for this region was (n=4) 0.76 ±0.07. D) The leave-one-out accuracies for four participants included in training cross-subject models for negative versus neutral behaviors are shown. The generalizability score was 0.65 ± 0.02. E) Similar as in B, but for the negative decoders. The generalizability scores for OFC, insula, and DCin were as follows (n=4 participants): 0.55 ± 0.07, 0.63 ± 0.06, 0.61 ± 0.04. F) Similar as in C, two participants out of five had implanted electrodes in VCin. The generalizability score was 0.61 ± 0.02. VCin = Ventral cingulate, DCin = dorsal cingulate. In the box plots(A-F) central lines represent the median and the two edges represent 25 and 75 percentiles, whiskers show the most extreme datapoints and outliers are shown individually (see MATLAB boxplot function).
We next trained the negative decoders using spectral features from 4/5 participants with electrodes in the insula, OFC, and dorsal ACC, and this resulted in a generalizability score of 0.65 ± 0.02 (Figure 5-D). Similar to the positive decoders, the dorsal ACC (0.61 ± 0.04) and insula (0.63 ± 0.06) both had a larger generalizability score than the OFC (0.55 ± 0.07, Figure 5-E). Decoders that were trained using spectral features from the ventral ACC in two participants had an average generalizability score of 0.61 ± 0.02.
Consistent with our within-subject results, the cross-subject decoding results demonstrated that the insula and ACC were important contributors to affective behaviors in general, but the role of OFC was less consistent. Although the ventral and dorsal ACC had similar generalizability scores when classifying negative from neutral behaviors, the ventral ACC was more important for discriminating positive affective behaviors (Figure 5-F). These results suggest that spectral features from the dorsal and ventral ACC made similar contributions to discriminating negative from neutral behaviors. The ventral ACC, however, may be more important for distinguishing positive affective behavior from neutral behaviors than the dorsal ACC.
Multiclass decoders classified three types of affective behavior
We next trained within-subject multiclass RF decoders to distinguish among positive, negative, and neutral behaviors in three participants with sufficient instances of each behavioral class (i.e., >=15 samples within each fold of the dataset). Using all of the spectro-spatial features from the mesolimbic network, the multiclass decoder distinguished among all three types of behavior with an average accuracy of 0.68 ± 0.016, which was significantly above chance level (33%) in each of the participants (Figure 6-A, Supplementary Figure 12 & Supplementary Table 8).
Figure 6. The multiclass decoder distinguished among positive, negative, and neutral behaviors using the spectro-spatial features of the mesolimbic network.
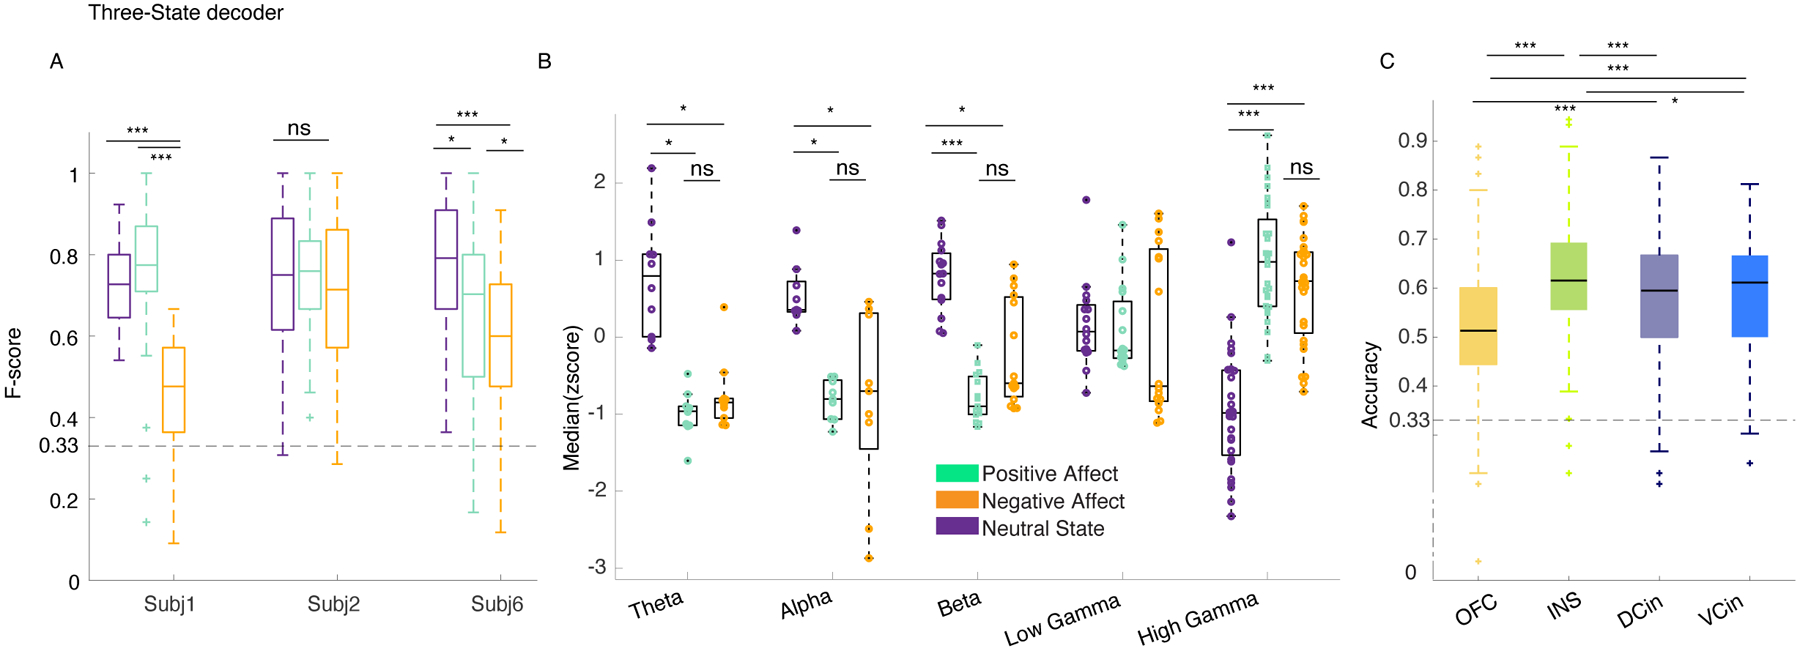
A) F1-scores for the three-class RF models from the three participants are shown. All F1-Scores were significantly above chance level (33%, dashed lines) and different from the shuffled models (p<0.0001 all participants, two- sided pairwise ranksum test, Supplementary table 8). Asterisks represent one-way multiple comparison Kruskal-wallis tests corrected with the Bonferroni method across the F1-scores of each affective behavior within each participant; in participants 1 & 6, both positive (p=1.75 * 10−35, p=0.043), and neutral (p=4.4 * 10−24, p=10−10) behaviors had significantly larger performance than negative behaviors. in subject 6 positive is significantly different from the negative class (p=0.0001). *** signifies p < 0.0001, ** p<0.001, * p <0.05. B) The median distribution of the selected features across the three participants are shown. The krusksal-wallis multiple comparison test between the three behavioral classes showed the following results: Theta (n=10 for each behavior): positive and negative affective behaviors differed from neutral behavior, p=0.0001 and p=0.0053, respectively. Alpha (n=9): positive and negative affective behaviors differed from neutral behavior, p=0.0026 and p=0.014, respectively. Beta (n=15): positive and negative affective behaviors differed from neutral behavior, p=9.4 * 10−7 and p = 0.006, respectively. Low gamma (n=16): no significant difference was observed. High gamma (n=28): positive and negative affective behaviors differed from neutral behavior with p=1.36 * 10−9 and p=6.4 * 10−7, respectively. C) The multiclass decoder models were trained using the spectral features from each region and then pooled across the three participants abbreviations as in Figure 4. OFC is from four probes implanted in three participants (n=400, i.e., 4*100 total datasets), INS(n=300) and DCin(n=300) are from three probes from three participants, and VCin(n=200) two probes from two participants. Using Bonferroni corrected Kruskal-wallis multiple comparisons test, the insula was significantly different from dorsal ACC (p=6.16 * 10−6), and OFC (p=6.7 * 10−29), and from ventral ACC (p=0.01). VCin(p=1.7 * 10−10) and DCin(p=6.7 * 10−9) were both different from OFC. In the box plots(A-C) central lines represent the median and the two edges represent 25 and 75 percentiles, whiskers show the most extreme datapoints and outliers are shown individually (see MATLAB boxplot function).
The multiclass decoder performance (F1-score) was better for positive than negative affective behaviors in each of the three participants (Supplementary Table 8; see Methods, “Random forest classification”). This result was consistent with our prior finding with the binary decoders, which distinguished positive from neutral behaviors more effectively than negative from neutral behaviors (Figure 2-E). The decoding performance of positive versus negative affective behaviors was consistent across participants, suggesting these results were robust and not due to a larger number of positive than negative affective behaviors in each analysis (Supplementary Figure 13).
We next looked across the group to examine which features were most important for the performance of the multiclass decoder across the participants. Group-level analyses of selected spectro-spatial features from the three participants (grouped by spectral band) demonstrated that high gamma activity was greater during positive and negative affective behaviors than during neutral behaviors and discriminated affective behaviors from neutral behaviors (Figure 6-B). Low-frequency activity in the theta, alpha, and beta frequency bands, in contrast, was decreased during both positive and negative affective behaviors compared to neutral behaviors but did not significantly differ between affective behaviors of differing valence. These findings suggested that increased high gamma and decreased lower frequency activity across the mesolimbic network characterized affective behaviors in general.
To investigate whether spatially localized activity within the mesolimbic network differentiated among the three types of behavior, we concatenated the decoder accuracies from each participant in regions that were sampled in at least two people (i.e., the amygdala and hippocampus were not included here because they were each sampled in one participant), which included the insula (3/3 participants), dorsal ACC (3/3 participants), OFC (3/3 participants), and ventral ACC (2/3 participants). Non-parametric tests found that the accuracy of the insula was the highest followed by the ventral and dorsal ACC, and, lastly, the OFC in distinguishing among behaviors with the multiclass decoder (Figure 6-C & Supplementary Table 9). Moreover, after training the multiclass decoders in each participant using the spectral features from each region, one at a time, we found that multiple regions successfully decoded the affective behaviors in each participant with accuracy significantly above chance (33%; Extended Data Figure 8). Regions with large generalizability scores from the binary decoders such as insula (3/3 participants) and dorsal ACC (2/3 participants), in particular, were most important for distinguishing among the positive, negative, and neutral behaviors.
Discussion
We found evidence that direct neural recordings of the human mesolimbic network discriminated naturalistic affective behaviors from neutral behaviors with high accuracy. We trained decision tree-based models on the spectro-spatial mesolimbic features and successfully decoded positive (with up to 93% accuracy) and negative affective behaviors (with up to 78% accuracy) from neutral behaviors using binary decoders in individual participants. In general, affective behaviors were associated with coordinated changes across the mesolimbic network including increased activity in high frequency bands (i.e., gamma) and decreased activity in low-frequency bands (i.e., theta, alpha, and beta). By examining the contributions of different mesolimbic structures to decoding performance, certain regions emerged as playing more central and consistent roles in affective behaviors. While the insula and ACC (both dorsal and ventral subregions) were the most generalizable spatial features across the sample, there was more person-specific variability in OFC. Although there were some spectro-spatial similarities between the positive and negative affective behaviors, each behavior type had a different spatial topography within the network. In a subset of participants(N=3), multiclass decoders highlighted the importance of increased high gamma activity during affective behaviors and emphasized the central role of the insula and ACC relative to other regions, such as OFC.
Our results indicate that distributed spectral changes across the mesolimbic network characterize naturalistic affective behaviors. Noninvasive EEG studies, which typically use task-based paradigms, have found consistent evidence that gamma band activity in the mesolimbic network increases in response to affective stimuli11,22,31. Despite numerous methodological differences between prior experimental studies and the approach we took here, we also found that, compared to neutral behaviors, positive and negative affective behaviors displayed in everyday life were also characterized by increased gamma band activity—as well as decreased low-frequency band activity—across the mesolimbic network32. Although many unanswered questions remain regarding the role of lower frequency bands in emotions and affect, our results suggest affective behaviors that arise in more ecologically valid contexts may engage similar neural mechanisms—particularly when measured in high frequency bands—as those observed in more controlled settings.
Despite some common spectral patterns, an examination of the mesolimbic network activity’s spatial topography revealed that some regions contributed more strongly to affective behaviors than others. The insula and ACC, tightly connected structures with established roles in emotions and affect, also emerged as central regions for naturalistic affective behaviors. In the insula, simultaneous increases in gamma activity and decreases in low-frequency activity characterized both8,17 positive and negative affective behaviors33,34. Prior studies have shown that stimulating the insula, an interoceptive relay station that is critical for experience7,13, causes subjective visceral sensations and cardiovascular changes48. Insula engagement, therefore, may reflect its role in representing the bodily changes and feelings that accompany positive and negative affective behaviors. In the ACC, increased gamma activity characterized both positive and negative affective behaviors, but differences emerged in the degree to which the ACC subregions participated in behaviors of differing valence. Our results suggest that, whereas ventral ACC played a more generalized role during positive affective behaviors, both ventral and dorsal ACC may be important in negative affective behaviors. These findings are largely consistent with neuromodulation studies that have shown that while stimulation of ventral ACC can cause laughter and mirth12,58, stimulation of dorsal ACC can cause feelings of doom and fear35. The dorsal and ventral ACC have different anatomical projections to autonomic and motor centers that are critical for emotions59, and our results suggest ACC subregions may engage these distinct pathways to produce positive and negative affective behaviors.
The amygdala and hippocampus were also important structures for decoding positive and negative affective behaviors from neutral behaviors. The amygdala, though often associated with negative emotions11,15,18,21,36, activates during negative and positive states of sufficient intensity and supports affiliative behavior as well as threat responding24,37. Stimulation studies have also found that brief perturbation of amygdala subnuclei can induce rapid negative21 as well as positive affective reactions (ERP at ~200–400 ms)18. In one participant with amygdala coverage, we found gamma activity in the amygdala played a prominent role in negative affective behaviors, but more evidence is needed to corroborate this result. With dense reciprocal connections, the amygdala38,39 and hippocampus are essential for emotional memories, which participants may have recalled and relived during spontaneous moments of affect. Although the role of the hippocampus in mood and emotion is still debated, recent iEEG studies have found that lower mood is associated with greater beta coherence between the amygdala and hippocampus40, which suggests that both structures, and their interaction, may be critical for positive and negative affective behaviors.
Compared to other regions in the mesolimbic network, the OFC played a less consistent role in affective behaviors. The OFC, especially in lateral areas, is critical for emotion regulation, cognitive control, and behavioral inhibition41–43. Longitudinal measures of spontaneous OFC activity predicted variations in mood44, and a neuromodulation study found that stimulation of lateral OFC decreased theta activity across the mesolimbic network and improved mood45, which suggested that suppression of low-frequency activity yielded affective benefits. Although our results indicated that activity in low-frequency bands across the mesolimbic network decreased during both positive and negative affective behaviors, the OFC was not a robust correlate of either behavior. Unlike prior studies, which relate measures of self-reported mood to neural activity over minutes40 to hours44, our study investigated neural changes during much briefer periods, a difference in timescale that may help to explain the heterogeneous results. Our findings suggest the OFC may be engaged in different ways depending on the emotional context, thus making its contribution to affective behaviors more variable across instances and participants.
Our results offer a comprehensive window into the neural mechanisms of the mesolimbic network. Although there is ongoing debate regarding the degree to which different affective states have unique or shared representations in the brain, the present study helps to elucidate how a distributed network is associated with different affective states via spectro-spatial patterning. Although positive and negative affective behaviors differ in valence, both can vary in arousal or intensity levels. Some of our results suggested that common changes in mesolimbic network activity is associated with affective behaviors in general, regardless of whether the behaviors were positive or negative, and it is possible that these common increases reflected heightened arousal. In particular, increased gamma activity and decreased low-frequency activity characterized both positive and negative affective behaviors. There were also regions (i.e., insula, ACC, hippocampus, and amygdala) that contributed more strongly than other regions (i.e., OFC) to both types of behavior. We speculate that the shared gamma activity in these regions during both positive and negative affective behaviors may represent arousal or intensity of emotional experience, a dimension of affect that may have been on a comparable scale during both types of behavior. Our results also indicated, however, that different structures within the mesolimbic network made distinct contributions to positive and negative affective behaviors and may have helped to shape these distinct affective states. Whereas increased gamma activity in the ventral ACC, hippocampus, and dorsal ACC contributed more to positive affective behaviors, increased gamma activity in the amygdala (in one participant) played a prominent role in negative affective behaviors. A distributed network that activates through a combination of spectral changes and spatial changes would be a flexible system that is prepared to produce a variety of affective states.
The present study has limitations to consider. First, we analyzed neural activity in participants undergoing seizure monitoring for epilepsy during a multiday hospital stay. Thus, there was variability in both electrode placement, which was based on clinical needs, and in the affective behaviors demonstrated across participants. Although there was overlapping electrode coverage in multiple mesolimbic structures across participants, even electrodes in a single region may have sampled distinct subregions in different people, which may have increased variability across the sample. As the naturalistic affective behaviors were spontaneous actions exhibited throughout their hospitalization, there was also variability in the number and types of affect participants displayed. Whereas the positive affective behaviors were fairly uniform (mostly smiling and laughing), the negative affective behaviors were more heterogeneous and included a range of expressions including pain and frustration. Additional studies are needed to determine how the mesolimbic network produces each of these specific affective behaviors.
Second, due to the unconstrained nature of our study, we did not have measures of self-reported experience, arousal, engagement, or movement that aligned with the continuous neural recordings. We conducted several follow-up analyses, however, to confirm that the associations that we found between the spectro-spatial changes and the affective behaviors were robust. We found similar neural activity patterns when, instead of contrasting positive and negative affective behaviors to neutral behaviors, we compared them to rest (i.e., presumably low-arousal moments during which no behaviors were annotated). When we constrained our analyses to examine positive and negative affective behaviors during conversations (i.e., where affective and neutral moments presumably had comparable levels of engagement and movement), our results also remained unchanged. These analyses offered additional evidence that the spectro-spatial patterns we found for positive and negative affective behaviors were not accounted for by variations in arousal or movement.
In summary, we used statistical and machine learning approaches46 to decode naturalistic affective behaviors from direct recordings of the human mesolimbic network. Complex, real-time decoding models trained on neural activity in sensorimotor and language cortices have made it possible to design brain-computer interfaces for those who suffer from limb47 or speech disability48. Similar advances are lacking in neuropsychiatry, however, and it remains difficult to relate neural signals to complex emotions and mood49. More sophisticated neuroanatomical models of affective behaviors and symptoms will help to inform personalized treatments for mental health disorders and to identify biomarkers that can be monitored in treatments such as closed-loop neurostimulation.
Methods
Participants & Inclusion Criteria
Participants were 11 patients (6 females, 5 males, ages: 20–43, Supplementary Table 1) with treatment-resistant epilepsy who underwent (iEEG) implantation for seizure localization. Participants were included in the study if they had electrodes in at least three mesolimbic regions and displayed a sufficient number of affective behaviors to train the RF classifiers (Supplementary Table 1 and Supplementary Table 4). No statistical methods were used to pre-determine the sample size, but our sample size is similar to those in previous iEEG publications40,44. All procedures were approved by the University of California, San Francisco Institutional Review Board. Participants provided written informed consent to participate prior to surgery. Data collection and analysis were not performed blind to the conditions of the experiments. Further information can be found in the Nature Research Reporting Summary.
On post-op day two, when the behavioral annotations for our study began, all participants had a normal mental status, which was determined by assessing alertness, orientation (person, place, time, situation), interaction with clinical staff, ability to follow verbal commands, and ability to participate in experimental tasks without difficulty. In all participants, antiepileptic medications were stopped by post-op day two. Post-op pain was in the mild range for all participants after post-op day two, except for one participant who reported borderline moderate pain. Pain and emesis were treated with standing and as-needed medications. Antiepileptic medications that were administered included Clobazam, Oxcarbazepine, Levetiracetam, Zonisamide, Topiramate, Lamotrigine, Lacosamide, Carbamazepine, Phenytoin, and Topamax. Pain medications included Acetaminophen, Hydrocodone/Acetaminophen, Oxycodone, Hydromorphene, and Ondansetron.
iEEG and Behavioral Data Acquisition
Over a multiday hospitalization, participants underwent continuous 24-hour audiovisual recording and iEEG monitoring through the Natus clinical recording system as a part of routine clinical care. Electrophysiological data were collected at sampling rates at either 512 Hz or 1024 Hz. All mesolimbic structures were sampled by subdural grid, Ad-Tech 4-contact strip, and Ad-Tech 4/10-contact depth electrodes (10 mm or 6 mm center to center spacing). Two participants had mini grids implanted on OFC.
Electrode Localization
For electrode localization, pre-operative 3 Tesla brain magnetic resonance imaging (MRI) and post-operative computed tomography (CT) scans were obtained for all participants. Statistical Parametric Mapping software SPM1250 and Freesurfer51 were used to reconstruct and visualize the pial surface electrodes. Electrode locations were validated by an expert’s visual examinations of the co-registered CT and MRI. Montreal Neurological Institute (MNI) template brain was used for brain visualization. The MNI coordinates of the electrodes in all participants, a spherical, sulcal-based alignment was used to nonlinearly register the surface using Freesurfer (cvs_avg35_inMNI152 template)52. Participants had electrodes in at least three mesolimbic regions, which included the insula (most electrodes were in anterior or mid-insula but some in posterior insula), ACC (dorsal and ventral subregions), OFC, amygdala, and hippocampus.
Behavioral Annotations
Eleven human raters, blind to the study’s goals and hypotheses, manually annotated the video recordings using ELAN software53, a linguistic ethnographic software. Spontaneous affective behaviors including smiling, laughing, positive verbalizations, pain-discomfort, and negative verbalizations were annotated and coded on a millisecond basis as a tick at the behavior onset (Figure1-B, Supplementary Table 2). Raters marked the onset of each behavioral instance with “ON” and the offset with “OFF,” an annotation system that allowed the raters to code the videos with high efficiency. To minimize potential bias, the raters were assigned to randomized 10-minute segments of continuous video recordings. To minimize the effects of electrode implant surgery on behavior and mood, only annotations occurring two or more days post-surgery were included in our analyses.
A subset of videos was annotated by two raters and, overall, there was high inter-rater agreement: 82% of the total instances of affective behavior that were logged by one rater were also logged by the other. The instances were highly overlapping in time, with the onset of each instance having a median difference of 0.87 seconds (mean = 7.4 sec, Extended Data Figure 1-C) between any two raters. In cases where there was a disagreement between coders, there was a consensus meeting with a third member who served as the “tie-breaker.” The ratings from the third coder were used in these cases. Moreover, there was somewhat lower reliability for the annotations of the negative affective behaviors (79% agreement) compared to the positive affective behaviors (89% agreement).
In addition to affective behaviors, we also considered behaviors without an observable affective component, such as eating, drinking, sleeping, etc. Raters marked the onset of the given activity with “ON” and the offset when the behavior was finished with “OFF.” These continuous behaviors were used to define “rest” (during which no activity of interest including affective and non-affective was observed, see Supplementary Information “Behavioral Annotations”, Supplementary Tables 2 and 3) and neutral behaviors with conversation.
iEEG Preprocessing
We appended and aligned the raw iEEG recordings and the annotations of the affective behaviors (Extended Data Figure 2). All channels were demeaned, notch filtered (2nd order butterworth filter) at 60 Hz and its harmonics, and decimated (zero-phase 30th order FIR filter) to 512 Hz. We visualized the preprocessed signals using EEG Lab54 to remove noisy electrodes and to mark epochs in which there were motion or interictal artifacts54. After excluding noisy channels, we re-referenced the recordings to the common average signal across the electrodes localized to the same depth/strip leads. Next, we appended the cleaned data to form “chunks,” which ranged from 40 minutes to 4 hours of continuous data. All analyses were programmed in MATLAB.
Time-Frequency Analyses and Feature Extraction
We applied time-frequency decomposition to each electrode located in the gray matter of the mesolimbic regions. To extract the neural features, we applied the Hilbert transform (MATLAB Hilbert function) to band-pass filtered signals using 2nd order butterworth filters specific to the following five frequency bands: 4–8 Hz (theta), 8–12 Hz (alpha), 12–30 Hz (beta), 30–55 Hz (low gamma), and 70–150 Hz (high gamma). These frequency bands are thought to correlate with cognitive functions55. The resulting time-frequency signals for each channel (i.e., five different bands) were z-scored within each chunk of data and averaged using 10-second, non-overlapping bins centered about the occurrence of each affective behavior. This averaging window allowed us to control for inter-rater variability underlying the true occurrence of the behavior. We aggregated the affective behavior data into an input matrix—with dimensions of channel numbers from various brain regions times frequency for each behavioral class—for the decoder. The 10-second averaging bins were also applied to the binary time-domain trace of the affective behavior.
Power Spectral Density Analyses
We computed power spectral density of each channel within a one-second window using the welch method (Matlab pwelch function) and hanning window of length (fs/5) with 50% overlap, with 256 non-uniform fast Fourier transform or next power of two.
Random Forest (RF) Classification
Data Preparation:
We compared neural signals underlying affective and neutral behaviors using a RF classifier. First, instances of neutral behavior were extracted from 10-minute periods (or more) during which there were no annotated behaviors. Specifically, these neutral states were sampled from different periods of annotations (i.e., some from the first two hours and some from the fourth period of two-hour continuous data). As the number of neutral samples exceeded the number of affective behaviors, we next used a bootstrap procedure to construct multiple balanced datasets with equal labels such that the number of neutral labels were equal to the number of labels for each affective category (positive or negative). We applied this procedure 100/k (fold number) times for each subject to make 100 datasets (See Extended Data Figure 2).
Model training:
As behavioral instances could have occurred close in time, which could artificially inflate correlations between neural features and lead to model overfitting, we used a conservative sequential k-fold cross-validation classifier to train the RF models in each participant56. To evaluate the decoding performance of our models, we constructed surrogate permutation models by shuffling the behavioral class labels. To avoid any information-overlap between training and test sets, we selected folds such that the training and test divisions of the observations were non-adjacent in time (i.e., sequential cross validation). The number of folds, K, was chosen to be 5 or 10 for each participant such that a minimum of 10 observations were included in each fold. The number of samples varied between 28 and 164 within each class across participants (i.e., positive, negative, or neutral behaviors, Supplementary Table 4). The RF classifiers were trained with 300 trees and were optimized for two hyper parameters: (1) each tree was grown such that the maximum number of samples per leaf was varied in the range of 1 and 20, (2) number of features at each node varied in the range of 1 to maximum number of features minus 1.
Likewise, multiclass decoders were trained in the same way as the binary decoders, with equal number of samples for each class. To train and optimize the RF models, we used the “TreeBagger” and “bayesopt” MATLAB functions. We measured decoding performance for binary and multiclass decoders using Area under ROC curve and F1-Score (as below), respectively. We also measured decoding accuracy, which is the total number of true predicted samples divided by total sample number, as a general metric of performance.
Feature Selection
Using out of bag error estimate from RF models, we were able to select the importance of each tree node (i.e., feature). Briefly, each tree is built using bootstrap samples from the original samples after holding out one-third of the original samples to form a test set. Once the tree is built, the left-out samples are classified, and the average number of times that the predicted class is not equal to the true class that is called “prediction error.” This is a standard practice in defining feature importance in RF classification57. We refer to the model prediction error for each feature as “feature importance.” Subsequently, we ranked the average feature importance from all 100 runs and found the knee point of its cumulative summation curve for each participant using an algorithm called “kneedle,” which estimates the knee point based on maximum curvature for a discrete set of points58. The cumulative set of features leading up to the knee point were selected as the important features for each decoder type. This method served as an objective threshold to select the neural features that were the dominant contributors to the positive or negative decoders. Lastly, we compared the distribution of the feature importance across all 100 RF models with permuted models and kept those features with significant difference between the main RF and permuted models (see Supplementary Figures 2 & 3)
Feature Normalization for Group-Level Analyses
Proceeding to feature extraction for each participant, we extracted the sample distributions of the important features for each behavior type. Second, we extracted median amplitude of each feature for each behavior type. To avoid undue influence of participants with stronger neural activity, we z-scored the median values across all the selected features in each behavior type, separately. The normalization procedure is also depicted in Supplementary Figure 11. We next performed group-level analyses using the z-scored median of selected spectro-spatial features to examine the extent to which the spectral patterns in each participant held across individuals and then grouped these values by their frequency bands.
Also, to account for within- and between-subject variability in the feature importance values from the RF models, we normalized these values to the maximum value within each participant because the feature importance has a positive value when the model does not overfit due to noise.
Clustering
To assess collinearity between selected features (e.g., correlations between high gamma band activity in different regions) and to map the spectro-spatial features of each behavioral class, we computed the correlation matrix across samples for the positive, negative and neutral behaviors used in the binary decoders. Next, we applied hierarchical clustering to the correlation matrix (Supplementary Figure 8) to group the features into two main groups for each participant with an objective approach. This clustering analysis identified two clusters from the positive and negative decoders that separated affective from neutral behaviors based on spectral bands rather than regions in most of the participants.
We then populated the spectro-spatial features across participants (n = 10) from the positive decoders and observed that 56% of features consisted of low and high gamma power, and 44% of features consisted of theta, alpha, and beta band power (Extended Data Figure 5-A, pie chart). When we investigated the contribution of each frequency band to each cluster from the positive decoders, however, 80.7% of the features in cluster 1 were in theta, beta, and alpha bands, and 19.3 % were in low and high gamma bands; thus, we named cluster 1 the “low-frequency cluster.” Similarly, 85.2% of the features in cluster 2 were in the low and high gamma bands (Extended Data Figure 5-A, histogram). We observed qualitatively similar results with the negative decoders (n= 5 participants, Extended Data Figure 5-B); 98% of features in the low-frequency cluster were in theta, beta, and alpha bands, and 78% of features in the gamma cluster were in low and high gamma bands.
Then the z-scored median of the selected spectro-spatial features (see “Feature Normalization” above) for each cluster was extracted at the individual level and populated across the sample. Next, we computed a difference score for the selected spectro-spatial feature within each cluster by subtracting the z-scored median activity in that cluster during neutral behaviors from the z-scored median activity during the positive or negative affective behaviors (see Supplementary Figure 11)
To examine the contribution of gamma and low-frequency cluster activity in certain regions, we scaled the z-scored median differences for each cluster by their normalized feature importance from the RF decoder models (Supplementary Figures 9 & 10).
Binary Decoders from Each Mesolimbic Region
To assess contribution of the mesolimbic regions regardless of the spectral bands, we re-trained the within-subject positive (Extended Data Figure 6) and negative (Extended Data Figure 7) decoders in each region, one at a time. For each region, we included all spectral features from all electrodes implanted in that structure (and discarded the spectral information from all other regions across the network) and identified the top regions in each participant that distinguished positive or negative affective behaviors from neutral behaviors significantly better than other regions (Supplementary Tables 6 & 7) using Kruskal-Wallis multiple comparison test, corrected with Bonferroni.
Generalizability Score
We averaged the z-scored value of each frequency band from all contacts on a given electrode, which resulted in five spectral features for each region and a total of 15 features per participant. To train the cross-subject positive decoders, all 15 features for the positive and neutral behaviors from six participants were stacked to form the feature matrix. We used leave-one-out subject cross-validation to train the decoders and calculated a generalizability score as the mean leave-one-out accuracy across all participants (i.e., larger leave-one-out accuracy implied greater generalizability of the decoder). To train the cross-subject negative decoders, all 15 features for the negative and neutral behaviors from four participants were stacked to form the feature matrix.
Support Vector Machine (SVM) Model Classification
Linear SVM:
Linear SVMs were trained using all spectro-spatial features, as were the full RF models. We have optimized hyperparameters on 80% of the training set and then the model was trained by the optimized parameters using the 20% held out of the training dataset. Supplementary Figures 5 and 6 demonstrates the performance of these models in comparison with the RF models, as well as the absolute values of the top 15 features sorted by SVM weights and RF models prediction error. The similarity index shows the percentage of the common features by the RF and SVM models (See Supplementary information, section “Additional tests for the feature selection).
Non-linear SVM:
To assess the robustness of the selected features by the RF models, we trained non-linear SVM classifiers using “rbf” kernels on the same samples used in RF but using the selected features from the RF models (Supplementary Figure 7). 10-fold cross validation was used in the training set to optimize nonlinear SVM parameters (i.e., γ and C by 10-division grid search in the range of −1000 to 1000). γ is the inverse of the standard deviation of the rbf kernel, a type of Gaussian function (intuitively, it is a similarity measure between two datapoints and sets the decision boundary), and C is the regularization or penalizing parameter. All custom scripts are written in MATLAB. The “fitcsvm” function in MATLAB was used to train and optimize the SVM models.
Statistical Analyses
We assessed the statistical significance of all models by training surrogate RF models after shuffling the categorical labels within each fold of each dataset (to keep the balance between behavioral classes). All p-values were computed using two sided non-parametric ranksum tests between pairs of distributions. For group level statistical tests, on-way Kruksal-wallis multiple comparison tests were conducted followed by Bonferroni-adjusted tests to correct for multiple comparisons. For comparing the decoder performances and feature importance between the main and surrogate(permuted) models, in which they have similar features but with shuffled labels, the significance level is corrected to 0.0005 (0.05/100) since there has been 100 trained models.
Extended Data
Extended Data Figure 1. Behavioral annotations.
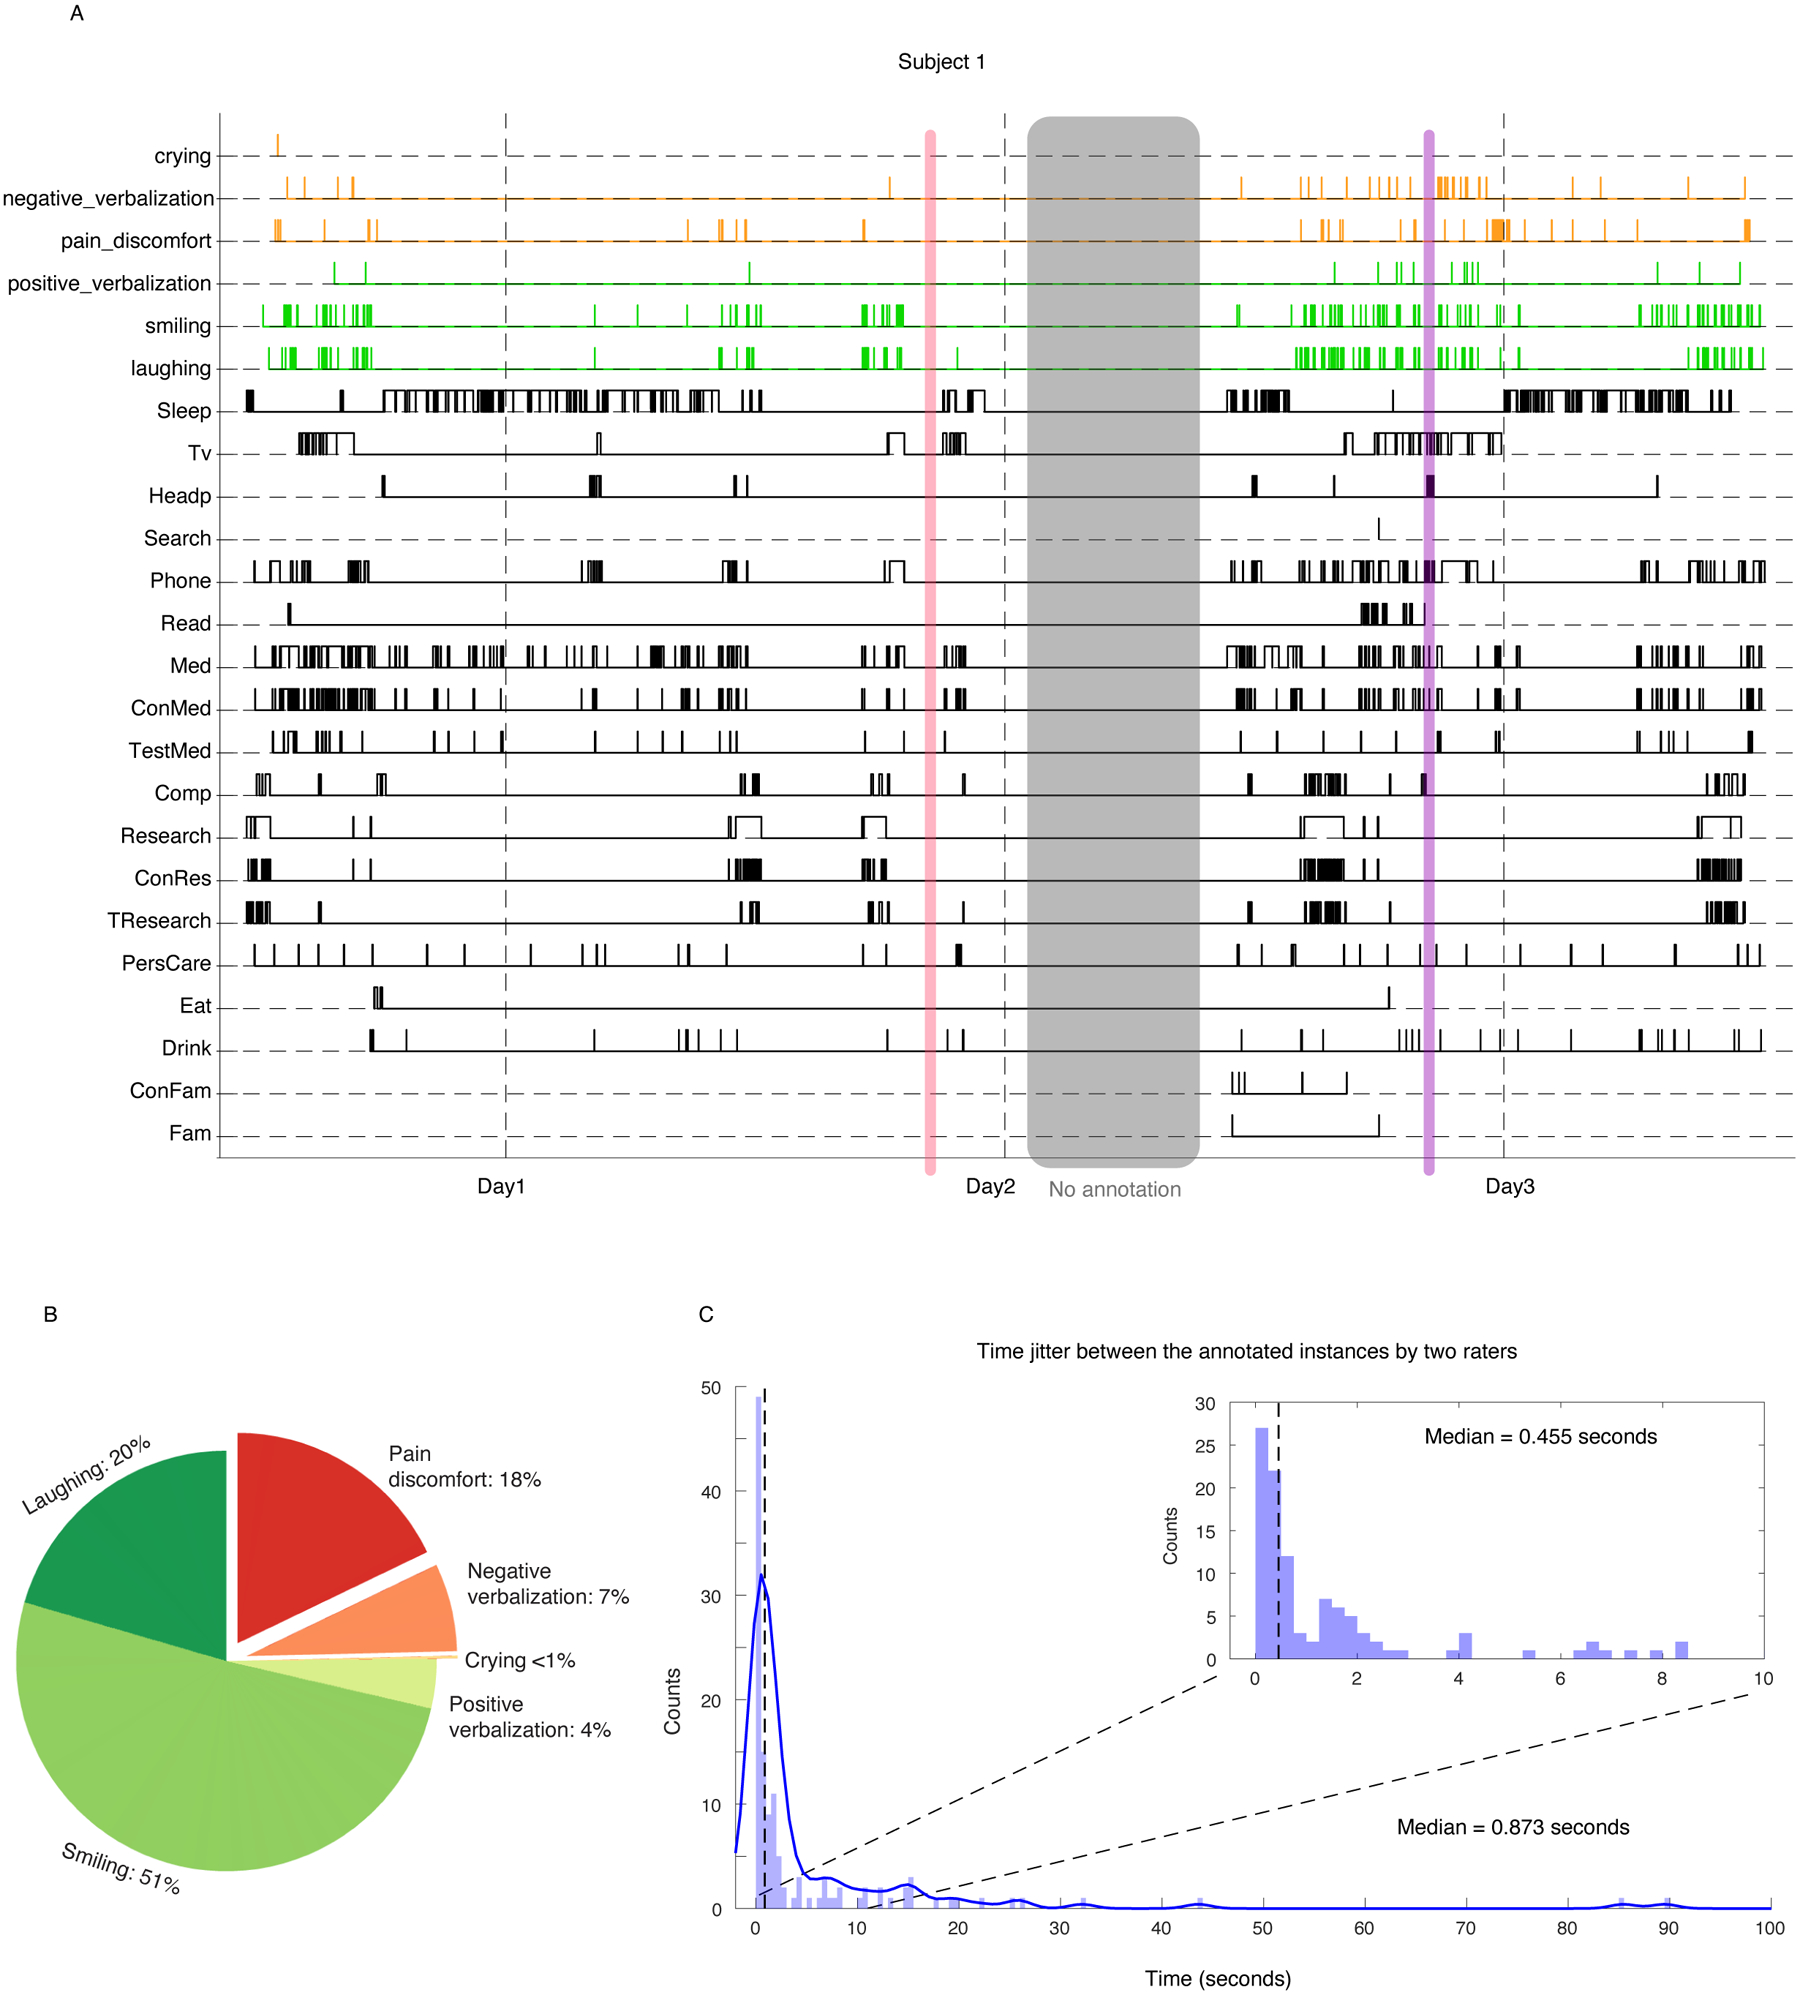
A) Example of annotated behaviors for an example subject through 3 days of hospital stay. Behaviors in black are marked using onset and offset of the activity, while the affective behaviors are marked as instances. Purple shading represents neutral moment where there is no expression of affective behaviors, but patient may be engaged in other tasks (here, using phone). The red shading displays where there is no activity (called “rest”, per supplementary tables 1 and 2). B) Percentage of emotional expressions across 11 subjects used in this study. C) distribution of time jitter between different rater pairs for positive expressions and negative ones.
Extended Data Figure 2.
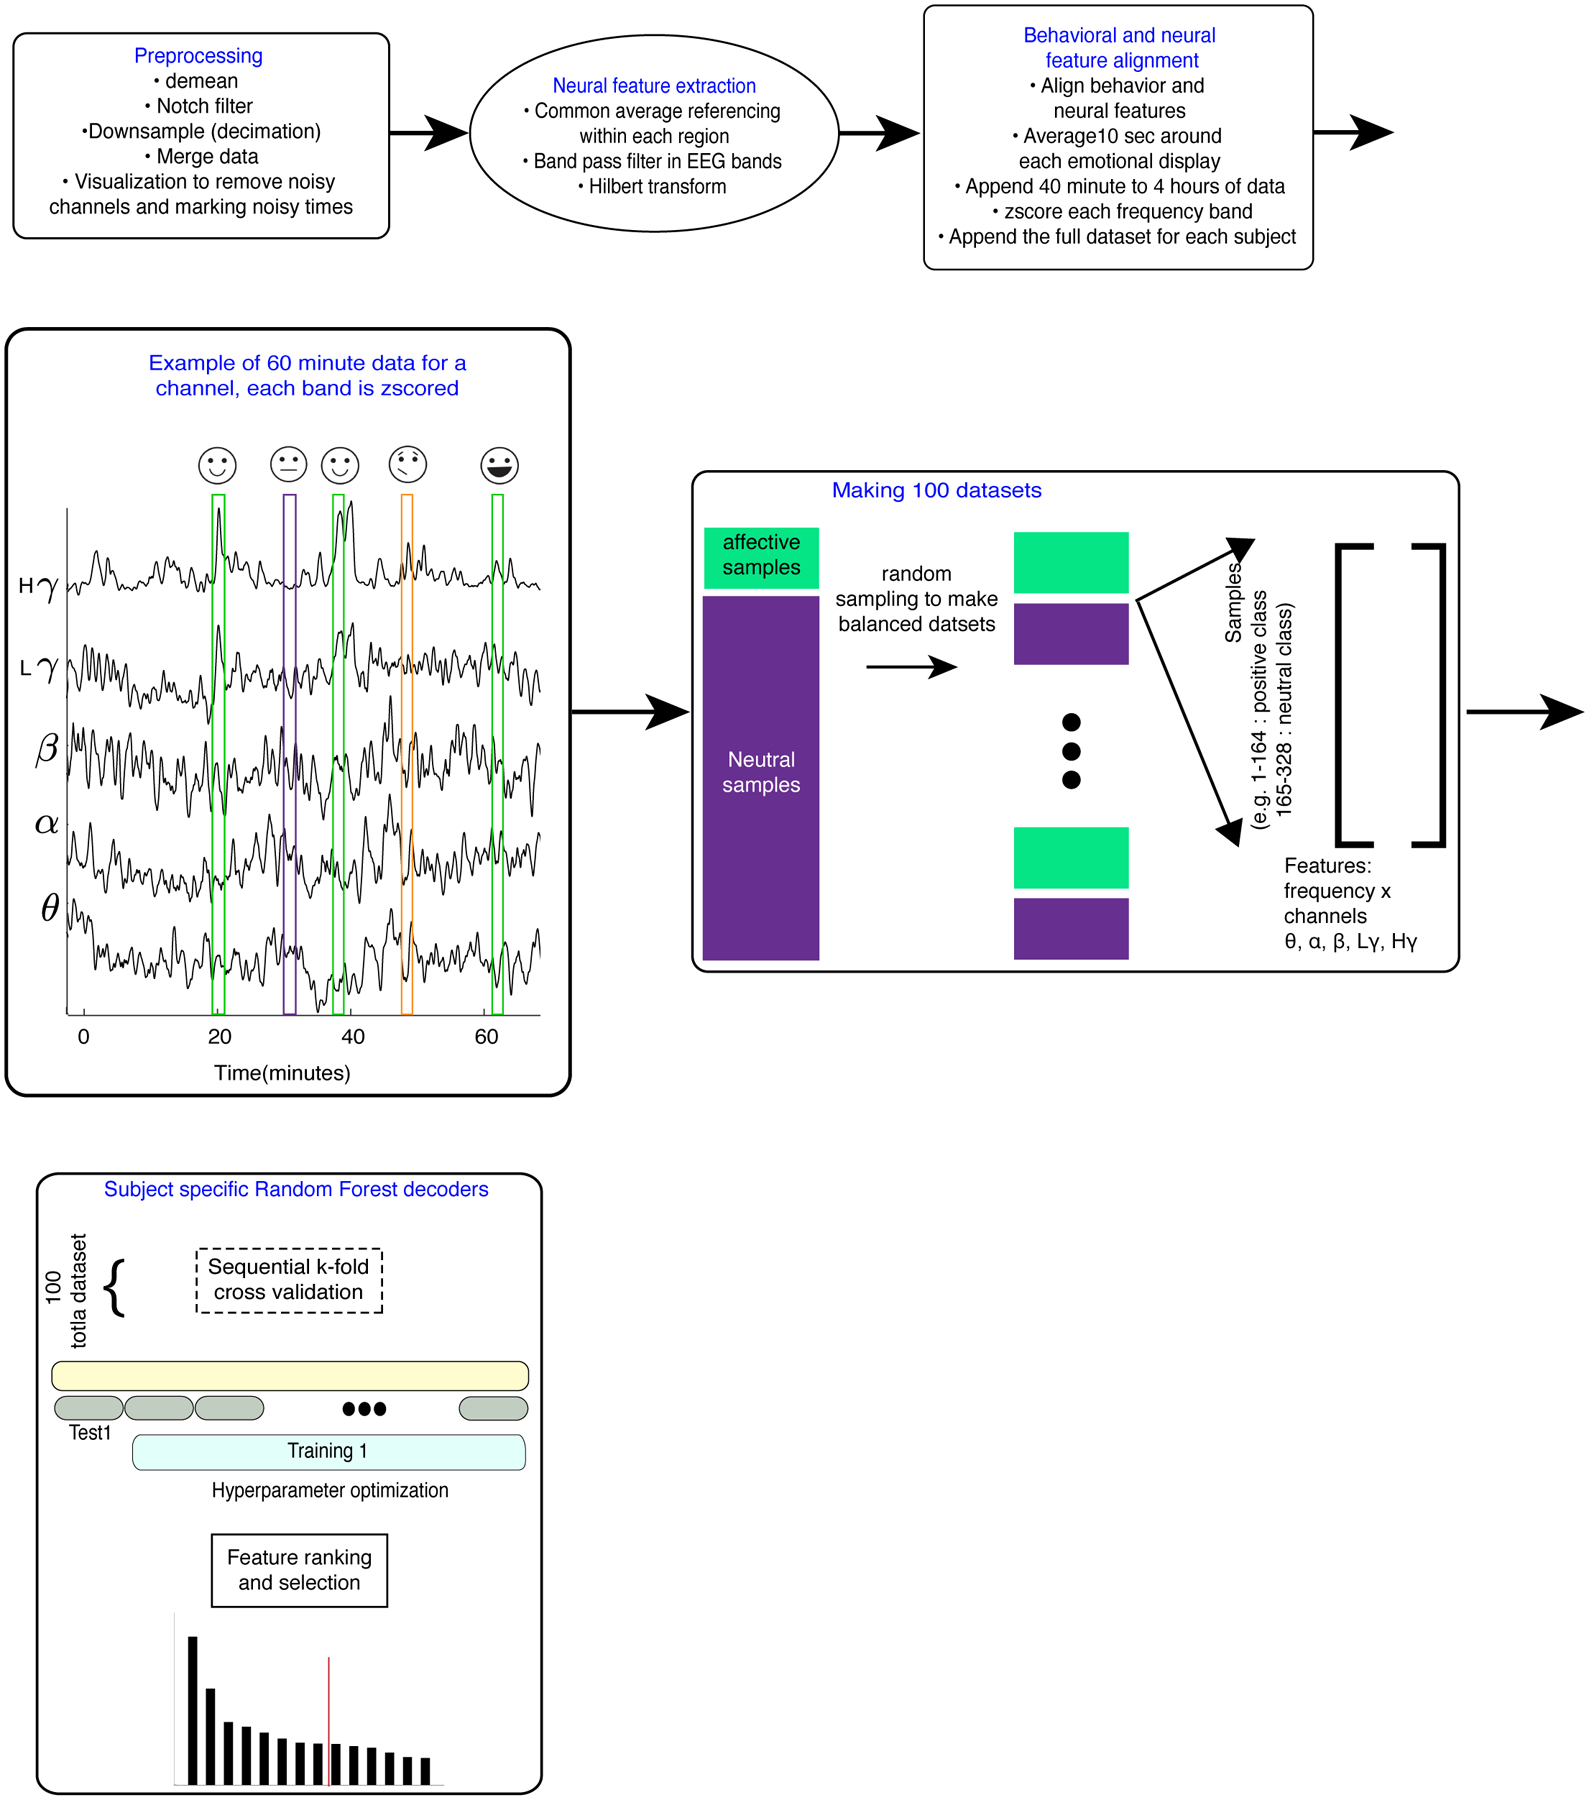
Preprocessing and decoding pipeline.
Extended Data Figure 3. Comparison of decoder performance using rest vs neutral moments.
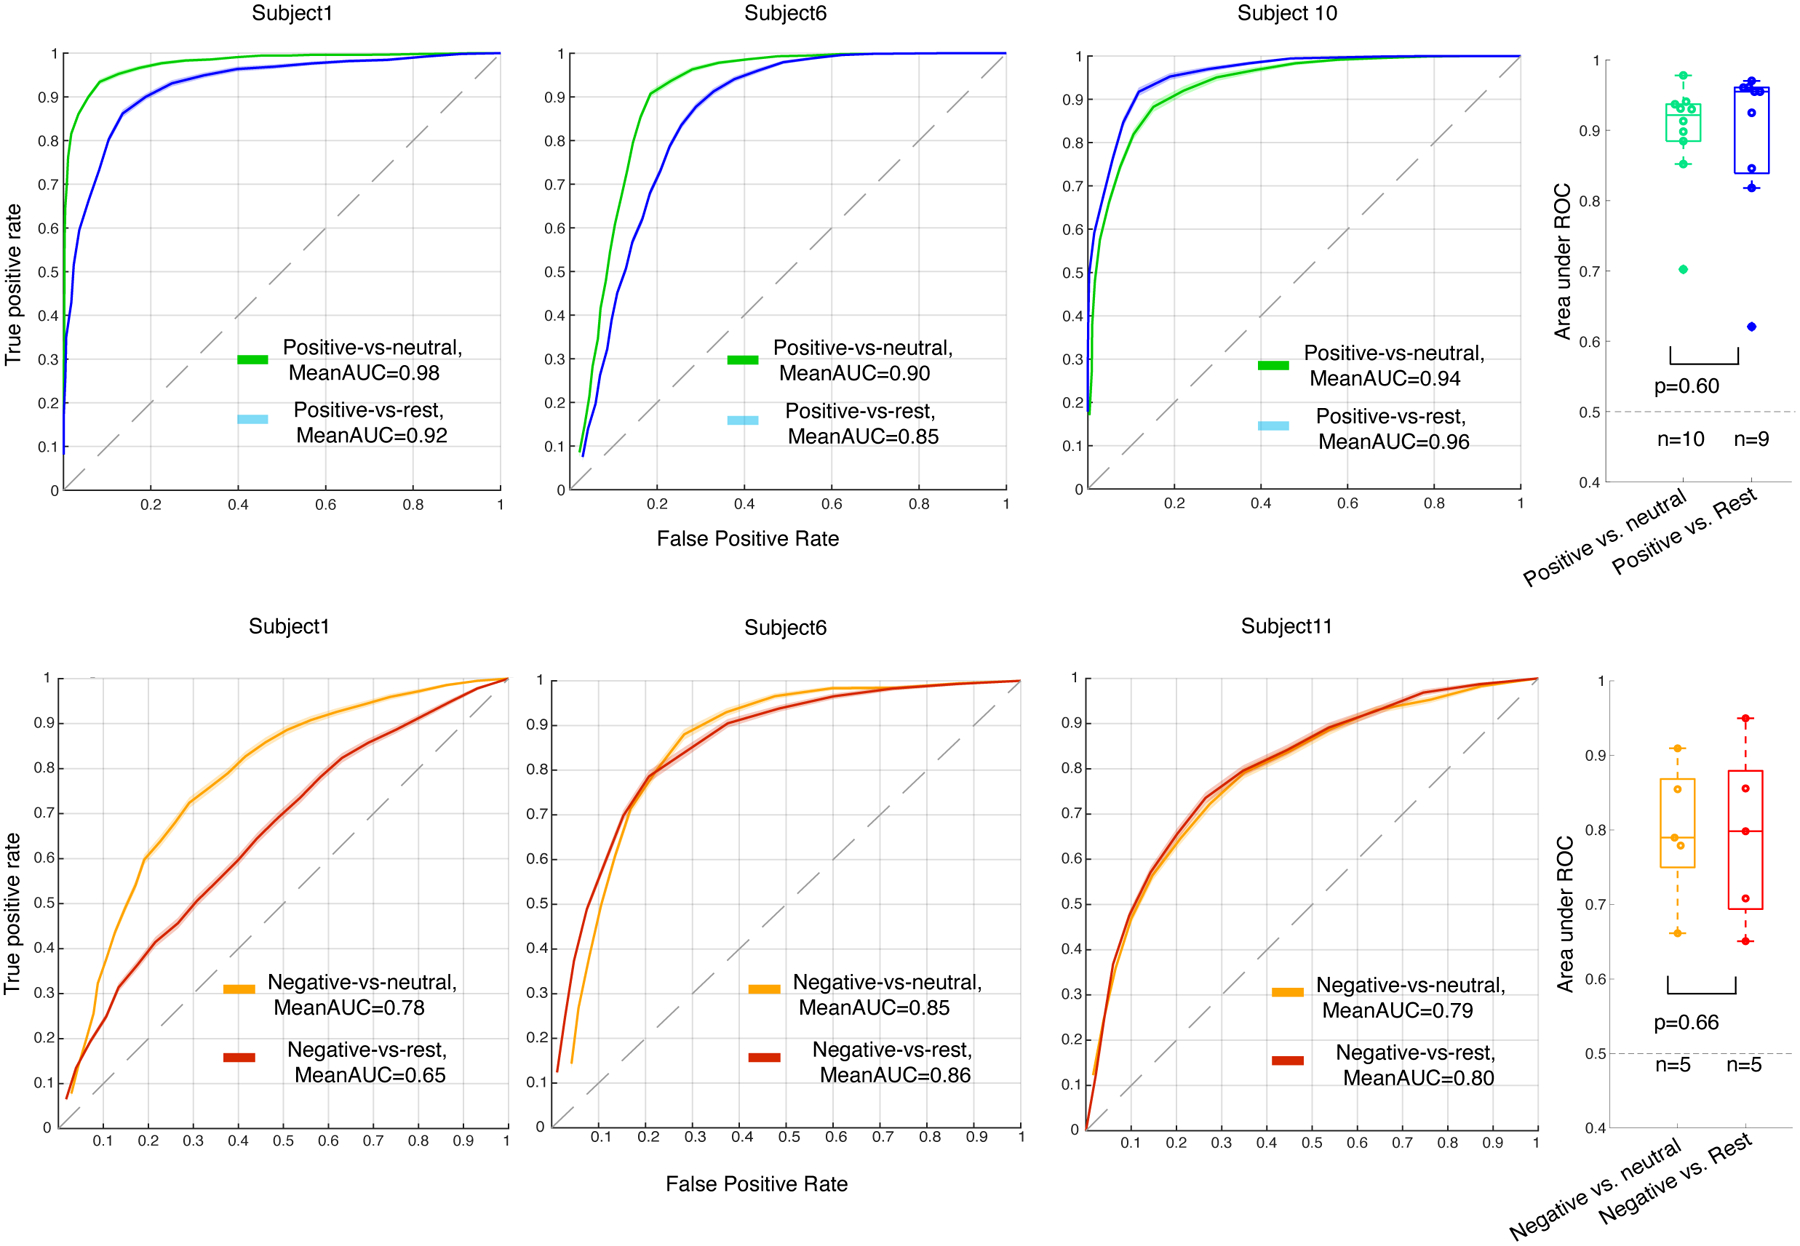
Decoders are trained using rest instances vs positive(blue) and negative(red) instances. All panels are comparing these decoders with the neutral vs. affective behaviors as shown in figure 2. Green and orange curves show the original model AUCs for positive and negative decoders, respectively. The boxplots show sample distribution of average AUC for positive vs. neutral (green, n= 10 participants), and positive vs. rest (blue, n = 9 participants) in the top row and negative vs. neutral (orange, n= 5 participants) as well as negative vs. rest (red, n=5 participants) in the bottom row. There was no significance difference between the positive (p = 0.6, two-sided non-parametric pairwise ranskum test) and negative decoders (p = 0.66, two-sided pairwise ranksum test). In the box plots central lines represent the median and the two edges represent 25 and 75 percentiles, whiskers show the most extreme datapoints and outliers are shown individually (see MATLAB boxplot function).
Extended Data Figure 4. Decoding results using neutral instances with conversation vs affective instances that include conversational moments.
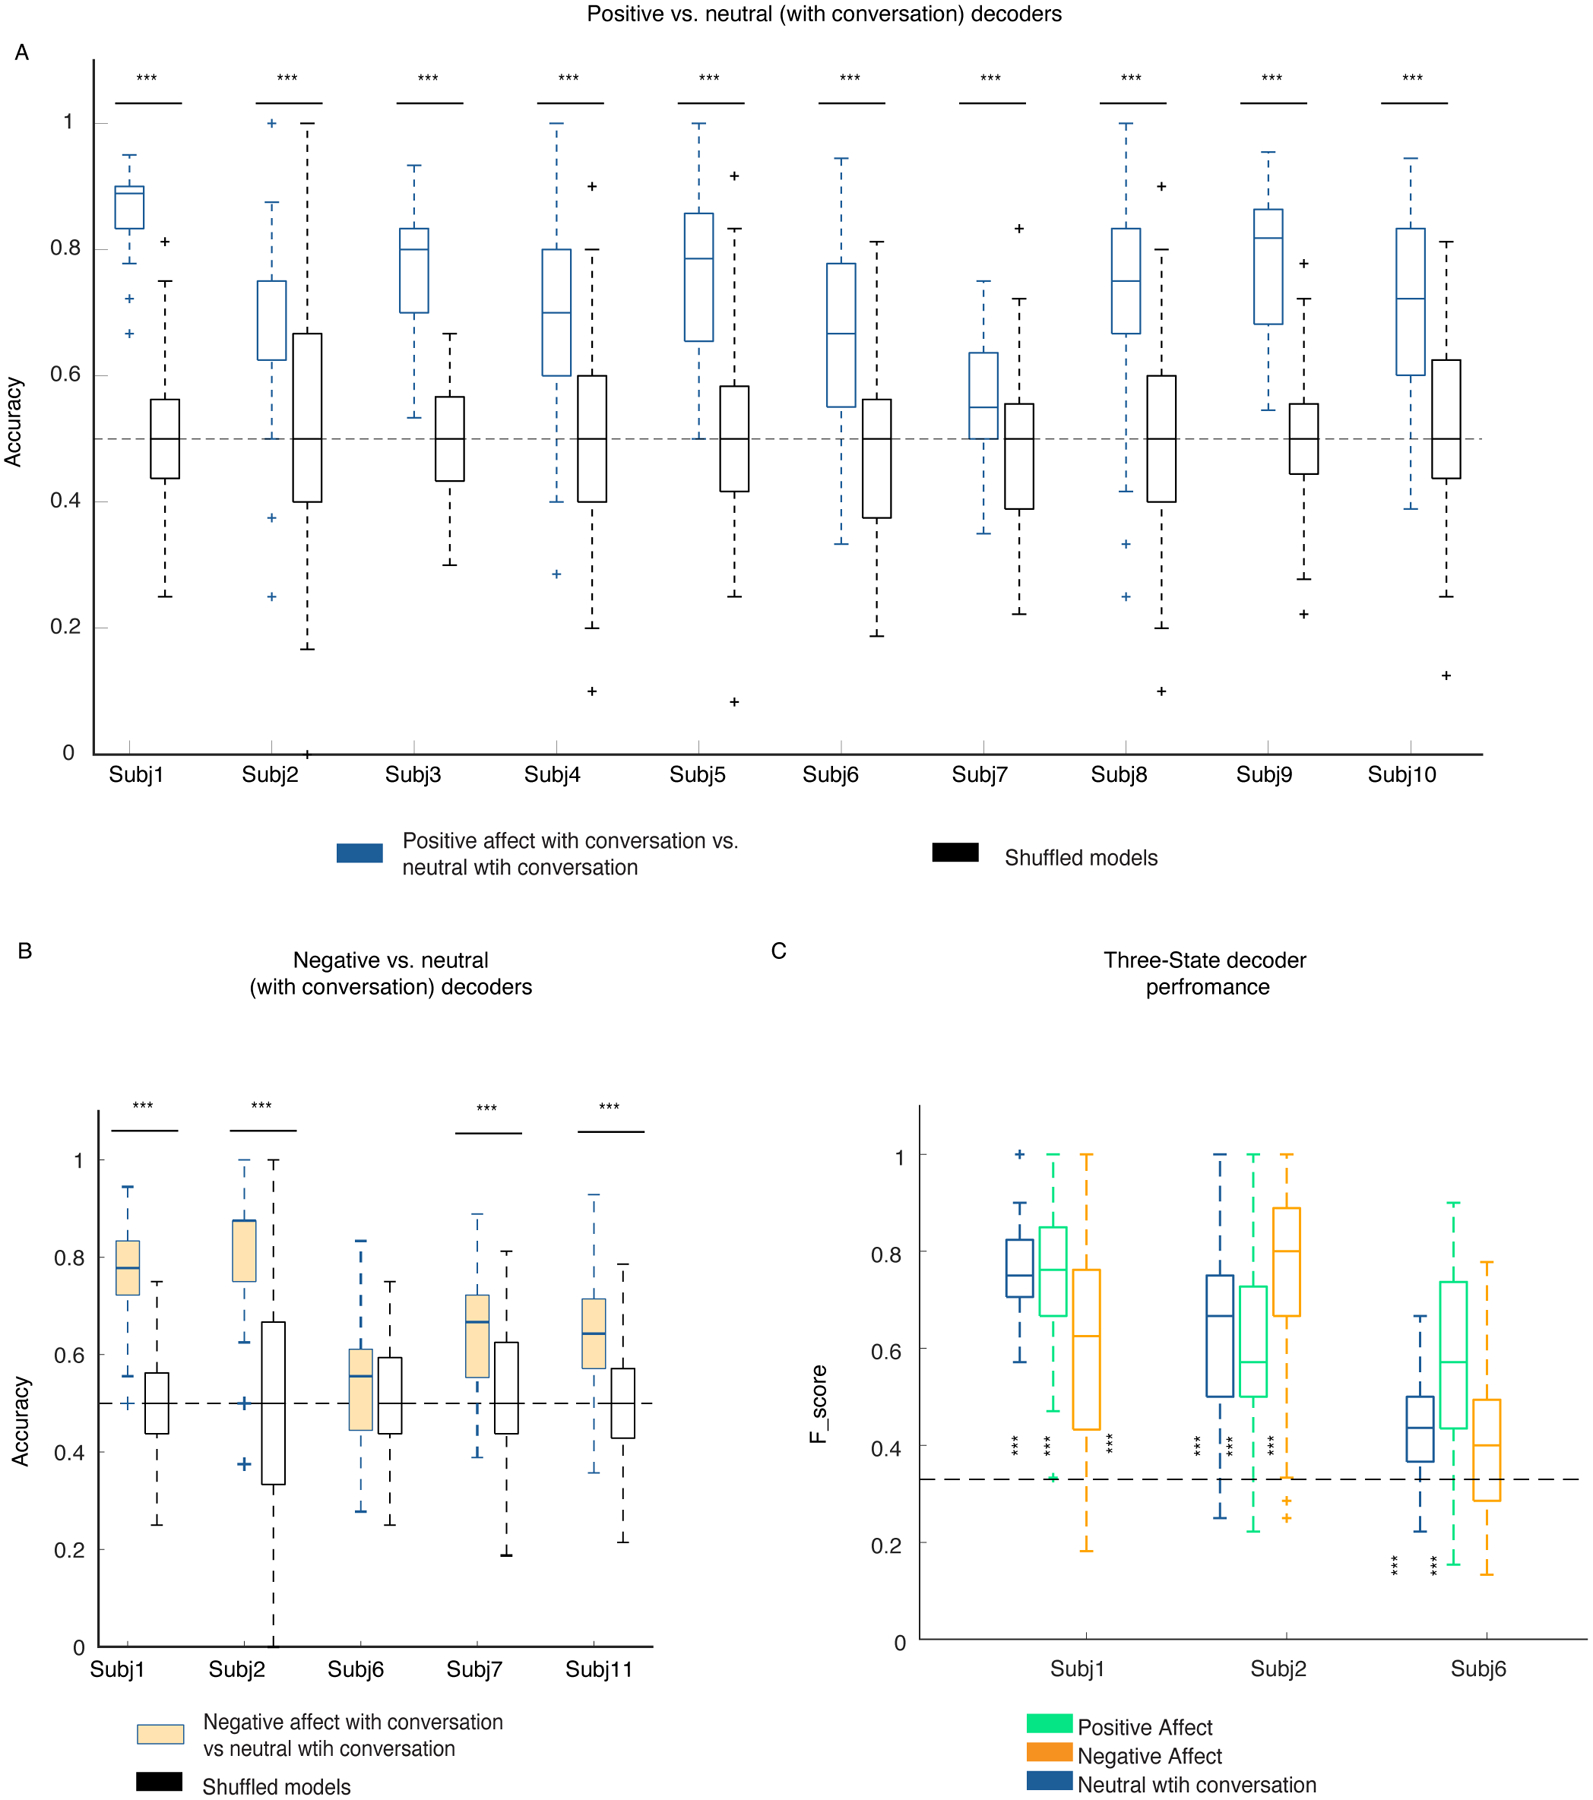
A & B) Accuracy for all 10 and 5 subjects on which the positive and negative decoders were trained, respectively. Permuted models (black) that were trained the same way using the shuffled labels across all subjects. Significance level was assumed as 0.0005 to correct for n= 100 runs (refer to the Methods section “Statistical Analyses”). P values regarding panel A are as following for all participants: 1.4 * 10−33, 5.9 * 10−7, 5.1 * 10−29, 3.3 * 10−16, 6.8 * 10−26, 1.6 * 10−13, 6.35 * 10−5, 2.3 * 10−15, 1 * 10−32, 2.1 * 10−14, respectively. P values regarding panel B are as following: 9.25 * 10−30, 9.13 * 10−27, 0.0031, 1.8 * 10−10, 2.7 * 10−11. C) F1-scores for the three-class RF models from the three subjects. All F1-Scores are significantly above chance level (33%, dashed lines) and different from the shuffled models (p values are in the order of neutral, positive and negative behavior for each participant: Subj1: 2.9 * 10−32, 7.1 * 10−32, 1.4 * 10−18; Subj2 : 2.7 * 10−15, : 6.9 * 10−11, 7.7 * 10−22; Subj6: 1.3 * 10−7, 2.1 * 10−18, 0.025, two-sided pairwise ranksum test). In the box plots(A-C) central lines represent the median and the two edges represent 25 and 75 percentiles, whiskers show the most extreme datapoints and outliers are shown individually (see MATLAB boxplot function). *** signifies p < 0.0001.
Extended Data Figure 5. Clustering analyses populated across all subjects for binary classifiers.
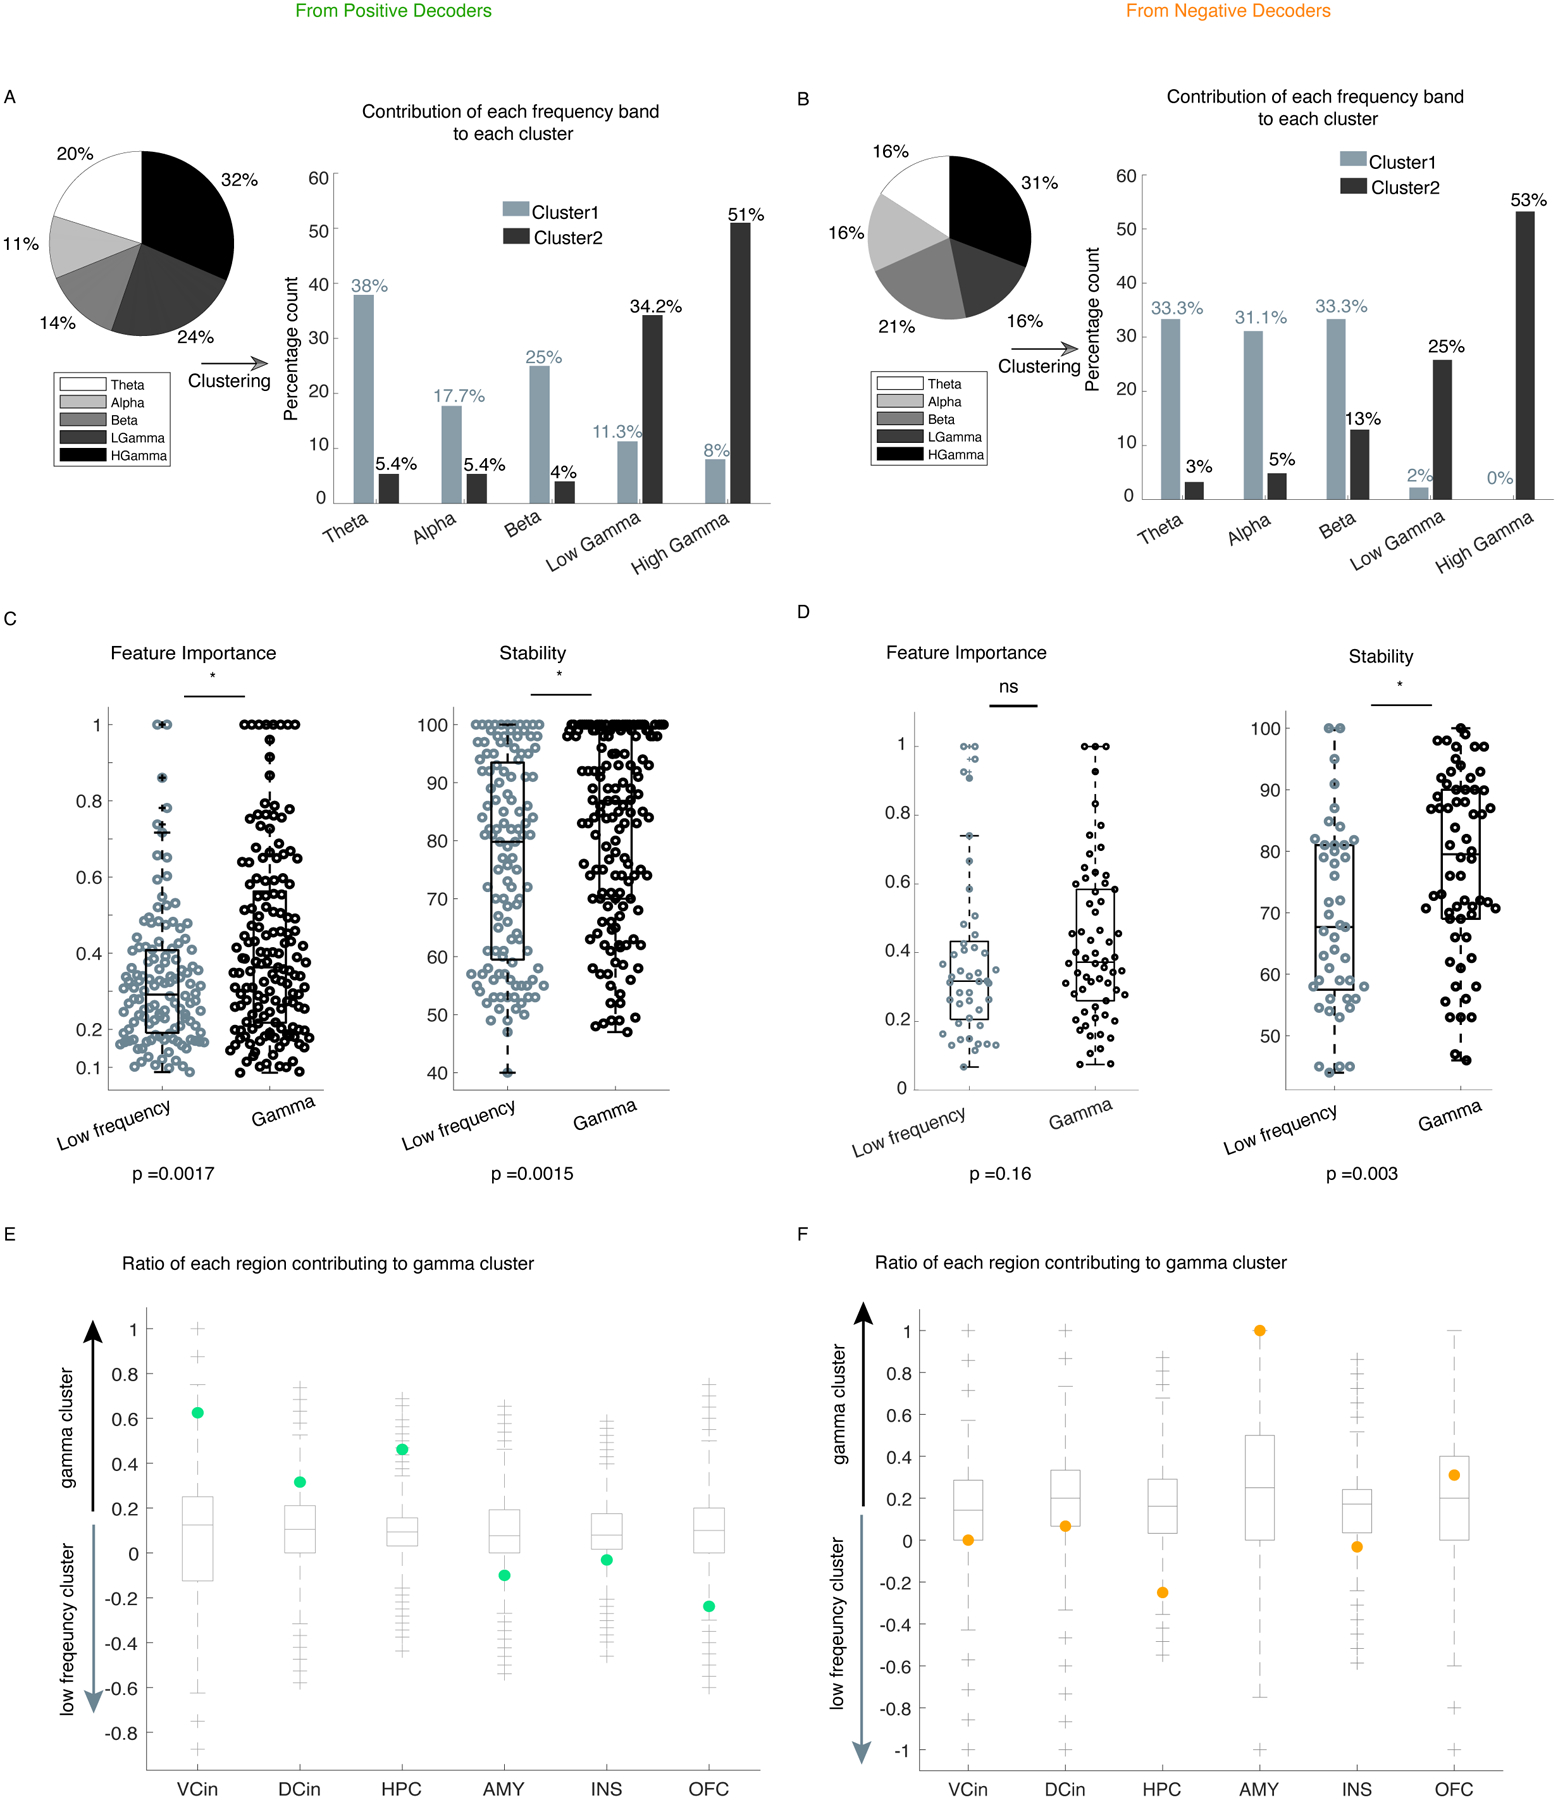
A & B) Pie charts show the percentage of frequency bands that were selected across all patients for positive and negative decoders, respectively. The histograms show the percentage count of each frequency band within each cluster, implying that low frequency cluster is mainly made of theta, alpha and beta bands. The gamma cluster is mainly made of high and low gamma for both decoder types. C) left and right panels show the populated normalized feature importance and the stability across all 10 subjects for positive decoders (n=149 and n=124 for gamma and low-frequency clusters, respectively), with p values obtained by two-sided pairwise ranksum tests at the bottom of each panel. D) represents similar panels as in C for negative decoders (n=62 and n=45 for gamma and low-frequency clusters, respectively). E & F) ratio is defined as (number of features in gamma cluster – number of feature in low frequency clyster) /total number of features contributing to both gamma and low frequency clusters (from figure 4B and 4D), positive ratio means the region have more selected features in gamma cluster and negative ratio means the region has more selected features in low-frequency cluster across subjects. INS: insula, VCin = Ventral cingulate, DCin = dorsal cingulate, AMY: amygdala, OFC = orbitofrontal cortex, HPC = hippocampus. We have generated permuted distributions (i.e., null distributions) by shuffling (1000000 times) the region label of each feature and recomputing the ratio (gray boxplots). Confidence intervals are based on the t-statistics since the permuted distribution are normally distributed. All real values of the ratio shown in green(E) and orange(F) circles are outside the confidence interval of the permuted distributions. Confidence intervals in panel E are as following: VCin=[0.0908, 0.0917], DCin=[0.0914, 0.092], HPC=[0.0913, 0.0918], AMY=[0.0913, 0.0919], INS & OFC=[0.0914, 0.0919]. Confidence intervals in panel F for VCin=[0.1584, 0.1594], DCin=[0.1584, 0.1593], HPC=[0.1580, 0.1593], AMY=[0.1582, 0.1594], INS & OFC=[0.1586, 0.1592]. In the box plots(C-F) central lines represent the median and the two edges represent 25 and 75 percentiles, whiskers show the most extreme datapoints and outliers are shown individually (see MATLAB boxplot function).
Extended Data Figure 6. Decoding AUC for all participants using spectral features from those contacts that are on same lead for positive vs. neutral expressions.
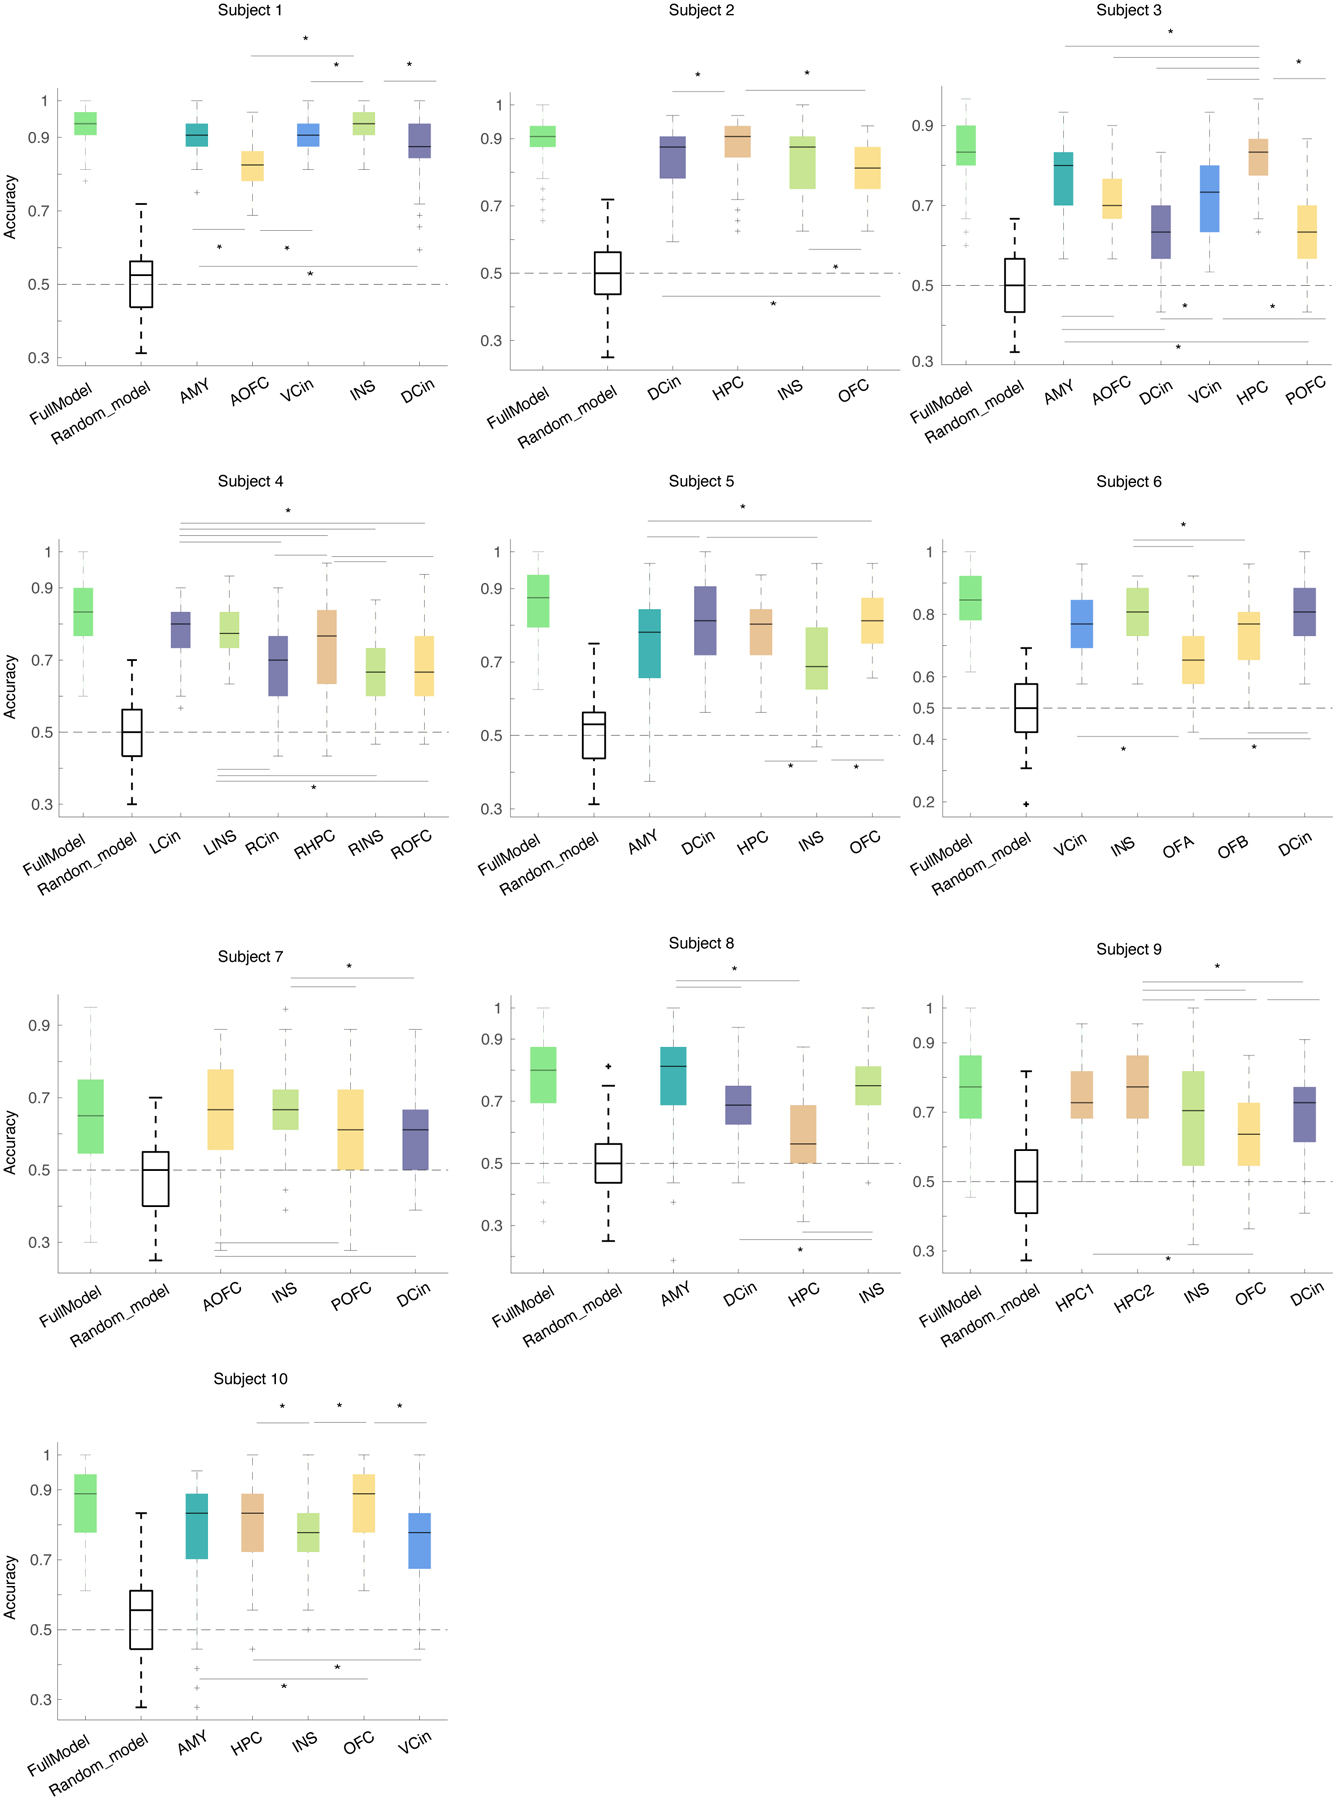
The green and black box plots are from the full and shuffled models across n= 100 runs as in figure 2-F. Other boxplots show trained model across n=100 datasets in which spectral features from each brain region is only used. One-way Krusksal-wallis multi-comparison tests with Bonferroni corrections are used to examine which regions reach the high performance (refer to supplementary table 6). OFC = orbitofrontal cortex, INS = insula, DCin = dorsal cingulate, VCin = ventral cingulate, HPC = hippocampus, AMY = amygdala. POFC = posterior OFC and AOFC = anterior OFC. In the box plots central lines represent the median and the two edges represent 25 and 75 percentiles, whiskers show the most extreme datapoints and outliers are shown individually (see MATLAB boxplot function). *** signifies p < 0.0001, ** signifies p < 0.01 and * signifies p <0.05.
Extended Data Figure 7. Decoding AUC for all participants using spectral features from those contacts that are on same lead for negative vs. neutral expressions.
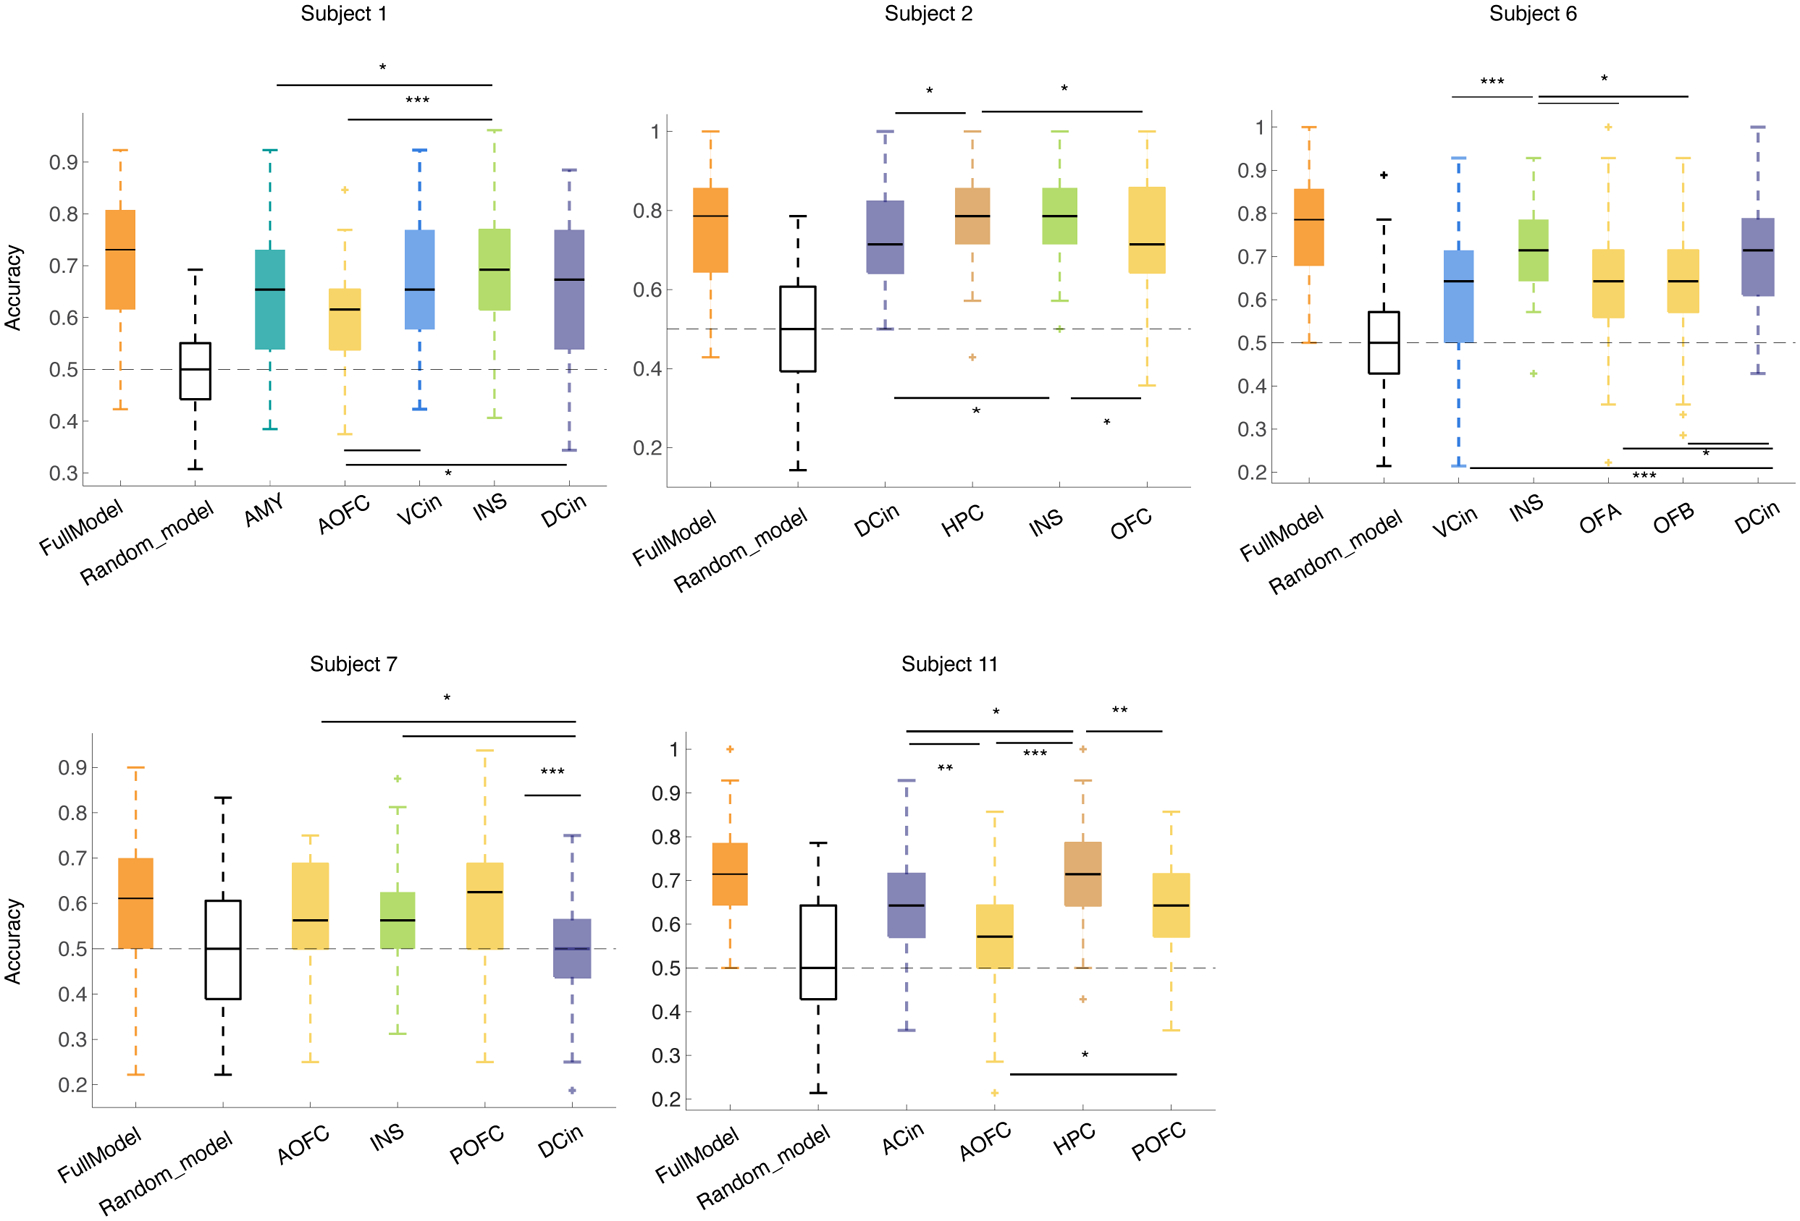
The orange and black box plots are from the full and shuffled models across n= 100 runs as in figure 2-G. Other boxplots show trained model across n=100 datasets in which spectral features from each brain region is only used. One-way Krusksal-wallis multi-comparison tests with Bonferroni corrections are used to examine which regions reach the high performance (refer to supplementary table 7). OFC = orbitofrontal cortex, INS = insula, DCin = dorsal cingulate, VCin = ventral cingulate, HPC = hippocampus, AMY = amygdala. In the box plots, central lines represent the median and the two edges represent 25 and 75 percentiles, whiskers show the most extreme datapoints and outliers are shown individually (see MATLAB boxplot function). *** signifies p < 0.0001, ** signifies p < 0.01 and * signifies p <0.05.
Extended Data Figure 8. Decoder performance of multiclass RF models run using features from each lead within a given region.
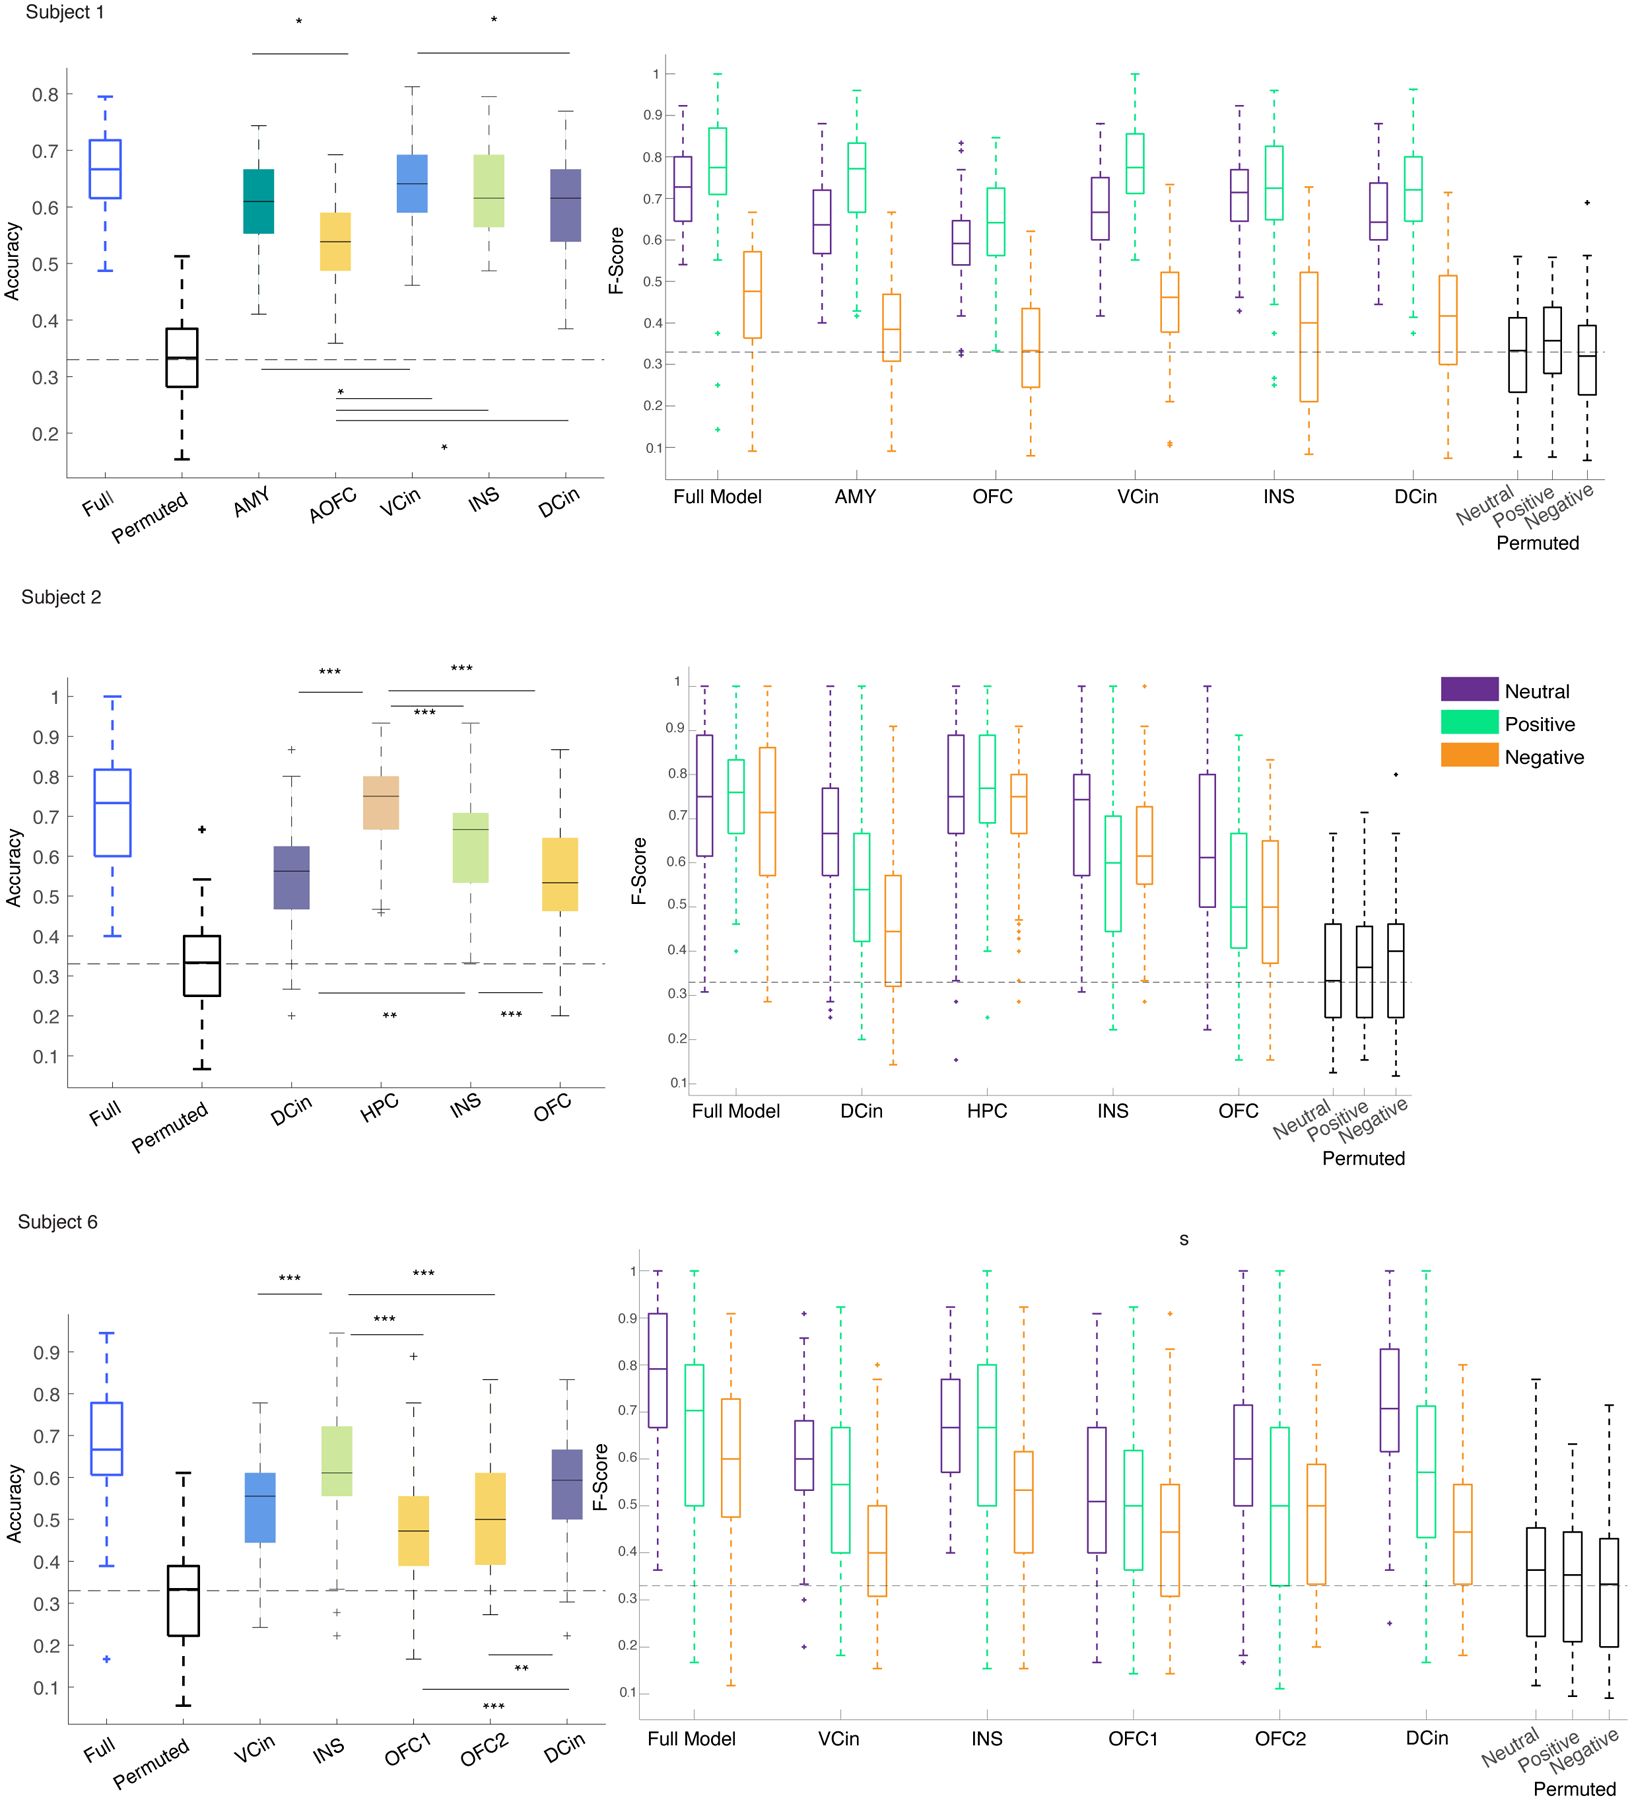
Explanation of the trained models is similar as in Extended Data Figure 7. Accuracy = number of true predicted samples / all samples. F-Score = 2*(precision*recall)/(precision+recall)). In the box plot, central lines represent the median and the two edges represent 25 and 75 percentiles, whiskers show the most extreme datapoints and outliers are shown individually (see MATLAB boxplot function). *** signifies p < 0.0001, ** signifies p < 0.01 and * signifies p <0.05.
Supplementary Material
Acknowledgments
Authors would like to acknowledge Chang lab members, Ben Speidel, Dharshan Chandramohan, Kristin Sellers, Lowry Kirkby, Patrick Hullet, and raters Nicole Goldberg-Boltz, Lucia Bederson, Muriel Solberg, Claire Eun, Joe Gordon, Dale Tager, Vivian Cheng, Nikhita Mummaneni, Nikhita Kunwar. This research was funded by the NIMH (R01MH122431) and the Defense Advanced Research Projects Agency (DARPA) under Cooperative Agreement Number W911NF-14-2-0043. The views, opinions, and/or findings contained in this material are those of the authors and should not be interpreted as representing the official views or policies of the Department of Defense or the U.S. Government. The funders had no role in study design, data collection and analysis, decision to publish or preparation of the manuscript.
Footnotes
Code Availability Statement
The code written to train the classifiers is available at: https://github.com/MBijanzadeh/DecodingAffect. The code to generate the figures will be available upon request. please contact M.B. via e-mail with any inquiries.
Competing Interest Statement
The authors report no conflict of interest.
Data Availability Statement
The collected neural and behavioral data is a modified version of clinical recordings for purpose of seizure localization and clinical decisions. Thus, the minimum deidentified dataset used to generate the findings of this study will be available upon reasonable request to the Corresponding author. Source data for the figures are available upon reasonable request; please contact M.B. via e-mail with inquiries.
References
- 1.Ochsner K & Gross J The cognitive control of emotion. Trends Cogn. Sci 9, 242–249 (2005). [DOI] [PubMed] [Google Scholar]
- 2.Barrett LF, Mesquita B, Ochsner KN & Gross JJ The Experience of Emotion. Annu. Rev. Psychol 58, 373–403 (2007). [DOI] [PMC free article] [PubMed] [Google Scholar]
- 3.Ochsner KN, Silvers JA & Buhle JT Functional imaging studies of emotion regulation: a synthetic review and evolving model of the cognitive control of emotion: Functional imaging studies of emotion regulation. Ann. N. Y. Acad. Sci 1251, E1–E24 (2012). [DOI] [PMC free article] [PubMed] [Google Scholar]
- 4.Lieberman MD et al. Affect labeling disrupts amygdala activity in response to affective stimuli. Psychol. Sci 18, 421–428 (2007). [DOI] [PubMed] [Google Scholar]
- 5.Lieberman MD Social Cognitive Neuroscience: A Review of Core Processes. Annu. Rev. Psychol 58, 259–289 (2007). [DOI] [PubMed] [Google Scholar]
- 6.Touroutoglou A, Hollenbeck M, Dickerson BC & Feldman Barrett L Dissociable large-scale networks anchored in the right anterior insula subserve affective experience and attention. NeuroImage 60, 1947–1958 (2012). [DOI] [PMC free article] [PubMed] [Google Scholar]
- 7.Uddin LQ Salience processing and insular cortical function and dysfunction. Nat. Rev. Neurosci 16, 55–61 (2015). [DOI] [PubMed] [Google Scholar]
- 8.Zhang Y et al. The Roles of Subdivisions of Human Insula in Emotion Perception and Auditory Processing. Cereb. Cortex 29, 517–528 (2019). [DOI] [PubMed] [Google Scholar]
- 9.Seeley WW et al. Dissociable Intrinsic Connectivity Networks for Salience Processing and Executive Control. J. Neurosci 27, 2349–2356 (2007). [DOI] [PMC free article] [PubMed] [Google Scholar]
- 10.Chouchou F et al. How the insula speaks to the heart: Cardiac responses to insular stimulation in humans. Hum. Brain Mapp 40, 2611–2622 (2019). [DOI] [PMC free article] [PubMed] [Google Scholar]
- 11.Oya H, Kawasaki H, Howard MA & Adolphs R Electrophysiological Responses in the Human Amygdala Discriminate Emotion Categories of Complex Visual Stimuli. J. Neurosci 22, 9502–9512 (2002). [DOI] [PMC free article] [PubMed] [Google Scholar]
- 12.Adolphs R, Tranel D, Damasio H & Damasio A Fear and the human amygdala. J. Neurosci 15, 5879 (1995). [DOI] [PMC free article] [PubMed] [Google Scholar]
- 13.Takahashi H et al. Brain Activations during Judgments of Positive Self-conscious Emotion and Positive Basic Emotion: Pride and Joy. Cereb. Cortex 18, 898–903 (2008). [DOI] [PubMed] [Google Scholar]
- 14.Lindquist KA, Satpute AB, Wager TD, Weber J & Barrett LF The Brain Basis of Positive and Negative Affect: Evidence from a Meta-Analysis of the Human Neuroimaging Literature. Cereb. Cortex 26, 1910–1922 (2016). [DOI] [PMC free article] [PubMed] [Google Scholar]
- 15.Phelps EA & LeDoux JE Contributions of the amygdala to emotion processing: From animal models to human behavior. Neuron 48, 175–187 (2005). [DOI] [PubMed] [Google Scholar]
- 16.Strange BA & Dolan RJ Adrenergic modulation of emotional memory-evoked human amygdala and hippocampal responses. Proc. Natl. Acad. Sci 101, 11454–11458 (2004). [DOI] [PMC free article] [PubMed] [Google Scholar]
- 17.Krolak-Salmon P et al. An attention modulated response to disgust in human ventral anterior insula: Disgust in Ventral Insula. Ann. Neurol 53, 446–453 (2003). [DOI] [PubMed] [Google Scholar]
- 18.Meletti S et al. Fear and happiness in the eyes: An intra-cerebral event-related potential study from the human amygdala. Neuropsychologia 50, 44–54 (2012). [DOI] [PubMed] [Google Scholar]
- 19.Omigie D et al. Intracranial markers of emotional valence processing and judgments in music. Cogn. Neurosci 6, 16–23 (2015). [DOI] [PubMed] [Google Scholar]
- 20.Hajcak G & Nieuwenhuis S Reappraisal modulates the electrocortical response to unpleasant pictures. Cogn. Affect. Behav. Neurosci 6, 291–297 (2006). [DOI] [PubMed] [Google Scholar]
- 21.Oya H, Kawasaki H, Howard M. a, Adolphs R & Howard MA III Electrophysiological responses in the human amygdala discriminate emotion categories of complex visual stimuli. J.Neurosci 22, 9502–9512 (2002). [DOI] [PMC free article] [PubMed] [Google Scholar]
- 22.Jung J et al. Intracerebral gamma modulations reveal interaction between emotional processing and action outcome evaluation in the human orbitofrontal cortex. Int. J. Psychophysiol 79, 64–72 (2011). [DOI] [PubMed] [Google Scholar]
- 23.Wang X-W, Nie D & Lu B-L Emotional state classification from EEG data using machine learning approach. Neurocomputing 129, 94–106 (2014). [Google Scholar]
- 24.Phelps EA & LeDoux JE Contributions of the Amygdala to Emotion Processing: From Animal Models to Human Behavior. Neuron 48, 175–187 (2005). [DOI] [PubMed] [Google Scholar]
- 25.Merkl A et al. Modulation of Beta-Band Activity in the Subgenual Anterior Cingulate Cortex during Emotional Empathy in Treatment-Resistant Depression. Cereb. Cortex 26, 2626–2638 (2016). [DOI] [PubMed] [Google Scholar]
- 26.Zheng J et al. Multiplexing of Theta and Alpha Rhythms in the Amygdala-Hippocampal Circuit Supports Pattern Separation of Emotional Information. Neuron 102, 887–898.e5 (2019). [DOI] [PMC free article] [PubMed] [Google Scholar]
- 27.Hu X et al. EEG Correlates of Ten Positive Emotions. Front. Hum. Neurosci 11, (2017). [DOI] [PMC free article] [PubMed] [Google Scholar]
- 28.Guillory SA & Bujarski KA Exploring emotions using invasive methods: review of 60 years of human intracranial electrophysiology. Soc. Cogn. Affect. Neurosci 9, 1880–1889 (2014). [DOI] [PMC free article] [PubMed] [Google Scholar]
- 29.Mukamel R & Fried I Human Intracranial Recordings and Cognitive Neuroscience. Annu. Rev. Psychol 63, 511–537 (2012). [DOI] [PubMed] [Google Scholar]
- 30.Zajonc RB Preferences Need No Inferences. Am. Psychol 25 (1980). [Google Scholar]
- 31.Popov T, Steffen A, Weisz N, Miller GA & Rockstroh B Cross-frequency dynamics of neuromagnetic oscillatory activity: Two mechanisms of emotion regulation: Oscillatory activity during emotion regulation. Psychophysiology 49, 1545–1557 (2012). [DOI] [PubMed] [Google Scholar]
- 32.Ezzyat Y et al. Direct Brain Stimulation Modulates Encoding States and Memory Performance in Humans. Curr. Biol 27, 1251–1258 (2017). [DOI] [PMC free article] [PubMed] [Google Scholar]
- 33.Seeley WW The Salience Network: A Neural System for Perceiving and Responding to Homeostatic Demands. J. Neurosci 39, 9878–9882 (2019). [DOI] [PMC free article] [PubMed] [Google Scholar]
- 34.Craig AD How do you feel? Interoception: the sense of the physiological condition of the body. Nat. Rev. Neurosci 3, 655–666 (2002). [DOI] [PubMed] [Google Scholar]
- 35.Inman CS et al. Human amygdala stimulation effects on emotion physiology and emotional experience. Neuropsychologia 145, 106722 (2020). [DOI] [PMC free article] [PubMed] [Google Scholar]
- 36.Phelps EA Human emotion and memory: interactions of the amygdala and hippocampal complex. Curr. Opin. Neurobiol 14, 198–202 (2004). [DOI] [PubMed] [Google Scholar]
- 37.Bickart KC, Dickerson BC & Feldman Barrett L The amygdala as a hub in brain networks that support social life. Neuropsychologia 63, 235–248 (2014). [DOI] [PMC free article] [PubMed] [Google Scholar]
- 38.Zheng J et al. Amygdala-hippocampal dynamics during salient information processing. Nat. Commun 8, 14413 (2017). [DOI] [PMC free article] [PubMed] [Google Scholar]
- 39.Fournier NM & Duman RS Illuminating Hippocampal Control of Fear Memory and Anxiety. Neuron 77, 803–806 (2013). [DOI] [PubMed] [Google Scholar]
- 40.Kirkby LA et al. An Amygdala-Hippocampus Subnetwork that Encodes Variation in Human Mood. Cell 175, 1688–1700. e14 (2018). [DOI] [PubMed] [Google Scholar]
- 41.Gross JJ & Feldman Barrett L Emotion Generation and Emotion Regulation: One or Two Depends on Your Point of View. Emot. Rev 3, 8–16 (2011). [DOI] [PMC free article] [PubMed] [Google Scholar]
- 42.Kragel PA, Knodt AR, Hariri AR & LaBar KS Decoding Spontaneous Emotional States in the Human Brain. PLOS Biol. 14, e2000106 (2016). [DOI] [PMC free article] [PubMed] [Google Scholar]
- 43.Kragel PA & LaBar KS Multivariate pattern classification reveals autonomic and experiential representations of discrete emotions. Emotion 13, 681–690 (2013). [DOI] [PMC free article] [PubMed] [Google Scholar]
- 44.Sani OG et al. Mood variations decoded from multi-site intracranial human brain activity. Nat. Biotechnol 36, 954–961 (2018). [DOI] [PubMed] [Google Scholar]
- 45.Rao VR et al. Direct Electrical Stimulation of Lateral Orbitofrontal Cortex Acutely Improves Mood in Individuals with Symptoms of Depression. Curr. Biol 28, 3893–3902.e4 (2018). [DOI] [PubMed] [Google Scholar]
- 46.LeCun Y, Bengio Y & Hinton G Deep learning. Nature 521, 436–444 (2015). [DOI] [PubMed] [Google Scholar]
- 47.Nuyujukian P et al. Cortical control of a tablet computer by people with paralysis. PLOS ONE 13, e0204566 (2018). [DOI] [PMC free article] [PubMed] [Google Scholar]
- 48.Anumanchipalli GK, Chartier J & Chang EF Speech synthesis from neural decoding of spoken sentences. Nature 568, 493–498 (2019). [DOI] [PMC free article] [PubMed] [Google Scholar]
- 49.Kashihara K A brain-computer interface for potential non-verbal facial communication based on EEG signals related to specific emotions. Front. Neurosci 8, (2014). [DOI] [PMC free article] [PubMed] [Google Scholar]
- 50.Ashburner J & Friston K Multimodal Image Coregistration and Partitioning—A Unified Framework. NeuroImage 6, 209–217 (1997). [DOI] [PubMed] [Google Scholar]
- 51.Fischl B FreeSurfer. NeuroImage 62, 774–781 (2012). [DOI] [PMC free article] [PubMed] [Google Scholar]
- 52.Fischl B, Sereno MI, Tootell RBH & Dale AM High-resolution intersubject averaging and a coordinate system for the cortical surface. Hum. Brain Mapp 8, 272–284 (1999). [DOI] [PMC free article] [PubMed] [Google Scholar]
- 53.Sloetjes H & Wittenburg P Annotation by category - ELAN and ISO DCR. 5. [Google Scholar]
- 54.Delorme A & Makeig S EEGLAB: an open source toolbox for analysis of single-trial EEG dynamics including independent component analysis. 134, 9–21 (2004). [DOI] [PubMed] [Google Scholar]
- 55.Schnitzler A & Gross J Normal and pathological oscillatory communication in the brain. Nat. Rev. Neurosci 6, 285–296 (2005). [DOI] [PubMed] [Google Scholar]
- 56.Breiman L Random Forests. Mach. Learn 45, 5_32 (2001). [Google Scholar]
- 57.James Gareth Hastie Trevor, Tibshirani Robert, W. D An introduction to statistical learning: with applications in R. (New York: Springer, [2013] ©2013). [Google Scholar]
- 58.Satopää V, Albrecht J, Irwin D & Raghavan B Finding a ‘kneedle’ in a haystack: Detecting knee points in system behavior. Proc. - Int. Conf. Distrib. Comput. Syst 166–171 (2011) doi: 10.1109/ICDCSW.2011.20. [DOI] [Google Scholar]
Associated Data
This section collects any data citations, data availability statements, or supplementary materials included in this article.
Supplementary Materials
Data Availability Statement
The collected neural and behavioral data is a modified version of clinical recordings for purpose of seizure localization and clinical decisions. Thus, the minimum deidentified dataset used to generate the findings of this study will be available upon reasonable request to the Corresponding author. Source data for the figures are available upon reasonable request; please contact M.B. via e-mail with inquiries.


