

19.1. Introduction
Redox (portmanteau of reduction-oxidation) reactions involve the transfer of electrons between chemical species in biological processes fundamental to life. It is of outmost importance that cells maintain a healthy redox state by balancing the action of oxidants and antioxidants; failure to do so leads to a multitude of diseases including cancer, diabetes, fibrosis, autoimmune diseases, and cardiovascular and neurodegenerative diseases. From the perspective of precision medicine, it is therefore beneficial to interrogate the redox phenotype of the individual—similar to the use of genomic sequencing—in order to design tailored strategies for disease prevention and treatment. This chapter provides an overview of redox metabolism and focuses on how mass spectrometry (MS) can be applied to advance our knowledge in redox biology and precision medicine.
19.1.1. Genesis and Pathophysiological Function of Reactive Oxidants
Since the atmosphere of Earth became aerobic around 600 million years ago as a result of photosynthetic activities [1], oxygen-related redox reactions took center stage and inevitably a collection of chemical species called reactive oxygen species (ROS) arose as byproducts of aerobic metabolism. ROS can be both radical and non-radical; the most known examples include superoxide anion (O2·−), hydroxyl radical (·OH), and hydrogen peroxide (H2O2). Mitochondria, specifically the respiratory chain (complexes I and III) located on the inner membrane, are the primary cellular source of ROS generation, producing O2·− by the one-electron reduction of O2. O2·− can quickly be dismutated to H2O2 through the activity of superoxide dismutases (SODs; SOD2 isoform in mitochondria). In the presence of ferrous iron (Fe2+), ·OH can be generated from H2O2 through Fenton reaction (Fig. 19.1). Other sources of ROS include peroxisomes (acyl-CoA oxidases, xanthine oxidase), endoplasmic reticulum (cytochrome P450), and plasma membrane (NADPH oxidases, lipoxygenases). Besides, many exogenous sources can drive ROS production as well, such as environmental stressors (e.g., UV light, air pollutants, toxins), pathogens, and certain therapies (e.g., cancer chemoradiation therapies). Although the following discussion focuses on the metabolism and function of ROS, one should also be aware that ROS serves to generate other groups of reactive species: reactive nitrogen species (RNS; e.g., peroxynitrite (ONOO−)), reactive sulfur species (RSS; e.g., persulfides (-SSH), polysulfides (-S(S)nSH)), and others.
Fig. 19.1.

Major pathways of ROS metabolism and impact of ROS on biomolecules. O2 −, H2O2, and OH are the major forms of ROS. O2 − can be dismutated to H2O2 by SOD. H2O2 can be dismutated to water by CAT, PRX/TRX/TR, or GPX/GSH/GR systems using in the case of PRX and GPX systems the reducing power of NADPH. ROS can oxidize small molecules, DNA, lipids, and proteins, producing a wide range of oxidation products. 4-HNE, 4-hydroxy-2-nonenal; 8-oxo-dA, 8-oxo-2′-deoxyadenosine; 8-oxo-dG, 8-oxo-2′-deoxyguanosine; CAT, catalase; Cys, cysteine; CySS, cystine; E+, ethidium; GPX, glutathione peroxidase; GR, glutathione reductase; GSH, glutathione; GSSG, oxidized glutathione; Pro, proline; M1dG, 3-(2-deoxy-β-d-erythropentafuranosyl)pyrimido[1,2-α]purin-10(3H)-one deoxyguanosine; MDA, malondialdehyde; Met, methionine; NADP+, nicotinamide adenine dinucleotide phosphate; PRX, peroxiredoxin; ROS, reactive oxygen species; SOD, superoxide dismutase; TR, thioredoxin reductase; TRX, thioredoxin; Tyr, tyrosine
The role of ROS is dichotomous and complex. On the one hand, ROS have been regarded traditionally as unavoidable malign agents that can damage essential cellular macromolecules like DNA, lipids, and proteins (Fig. 19.1). ROS can react with both the bases and deoxyribose backbone of DNA, leading to base loss, single- and double-strand breaks, DNA-DNA crosslinking, and DNA-protein crosslinking. Among all the oxidative DNA modifications, 8-oxo-2′-deoxyguanosine (8-oxo-dG) is the most common and best-studied lesion and is considered a biomarker of oxidative DNA damage. In addition, ROS can also induce lipid peroxidation, which disrupts membrane lipid bilayer structure and inactivates membrane-bound enzymes and receptors. Products of lipid peroxidation, such as malondialdehyde (MDA), 4-hydroxy-2-nonenal (4-HNE), and isoprostanes, have been used for decades as biomarkers of oxidative stress. Finally, ROS can directly damage proteins causing cleavage of peptide bonds via the diamide pathway or α-amidation pathway [2]. ROS can also attack amino acid side chains, primarily sulfur-containing residues cysteine (Cys) and methionine (Met), and aromatic residues tryptophan, phenylalanine, and tyrosine (Tyr) resulting in protein crosslinking, denaturing, degradation, and ultimately dysfunction [3, 4].
On the other hand, increasing evidence points to a beneficial function of ROS, the production and elimination of which is tightly regulated (Fig. 19.1). Maintaining a physiological level of oxidative state, recently termed oxidative eustress [5, 6], is essential for supporting normal cellular processes through redox signaling, in which ROS (especially H2O2) serve as important signaling molecules participating in cellular proliferation, differentiation, survival, circadian rhythm, and immune response, just to list a few. One well-established mechanism of redox signaling involves H2O2-mediated oxidation of protein Cys thiols [7]. Certain Cys-SH often residing in the deprotonated form thiolate anion (Cys-S−) can be oxidized by H2O2 and other oxidants to sulfenic acid (Cys-SOH). This oxidation event leads to inhibition of enzymatic activity when the thiol serves a catalytic function, or structural changes and regulation of protein function, affecting cellular epigenetics, signaling, and metabolism [8, 9]. Structural changes are induced, in particular, when a neighboring thiol or amine reacts with Cys-SOH to form an intramolecular or intermolecular disulfide or sulfenyl amide species [10–13] (Fig. 19.2). These reaction products are reversible and represent a mechanism of posttranslational modification analogous to protein phosphorylation. Other oxidized protein species involving Cys residues are formed as well including some that are irreversible. In general, further oxidation of Cys-SOH by H2O2 produces Cys oxoforms sulfinic (Cy-SO2H) or sulfonic acid (Cys-SO3H) and breaks the redox switch [14]. However, specialized enzymatic systems exist to reverse these oxidative modifications such as in the case of peroxiredoxins (PRXs) and a selected number of other proteins, which are repaired by sulfiredoxin [15–17].
Fig. 19.2.

Protein oxidation involving reactive cysteine residues. Specific protein cysteine residues can be oxidized to a variety of oxidized species through the sulfenic acid state
19.1.2. Key Antioxidant Systems
From bacteria, archaea to eukaryotes, organisms have evolved batteries of antioxidant systems to combat the deleterious effects of oxidants. These antioxidants can be divided into two categories based on their activity: enzymatic and non-enzymatic, with the former providing the major defense against oxidants in mammalian systems [18]. As mentioned before, O2·− elimination is primarily provided by SODs, which convert O2·− to H2O2 and O2. Decomposition of H2O2 is accomplished by catalase (CAT), PRXs, and glutathione peroxidases (GPXs), each with different catalytic mechanism of action. CAT contains a heme group in its active site which serves as an electron donor and acceptor in a two-step process of converting H2O2 to H2O and O2 [19, 20]. PRXs are a family of thiol-dependent peroxidases and are considered the ideal H2O2 scavengers given their abundant expression, broad subcellular localization, and fast rate constants towards H2O2 [21, 22]. PRXs reduce H2O2, peroxynitrite, and lipid peroxides at the expense of oxidizing their active site Cys residue, which is subsequently reduced by various systems depending on the specific class of PRXs. For example, PRX1–4 isoforms (typical 2-Cys class) and PRX5 (atypical 2-Cys class) utilize thioredoxins (TRXs) to complete the catalytic cycle. Oxidized TRXs are then restored to their reduced form by thioredoxin reductase (TR) in an NADPH-dependent reaction [23]. Analogous to PRXs, GPXs can also convert H2O2 to H2O in a redox cycle, in which the active site selenocysteine is first oxidized by H2O2 and then reduced by glutathione (GSH). Oxidized GSH (GSSG) is reversed back to GSH by glutathione reductase (GR) using reducing equivalents from NADPH [24]. In addition to GSH, non-enzymatic low molecular weight antioxidants include several vitamins such as ascorbic acid (vitamin C) and tocopherols (vitamin E), and plant flavonoids. They are particularly important for removing oxidants like singlet oxygen (1O2) and ·OH, for which there are no enzymatic mechanisms of elimination.
19.2. Mass Spectrometry Analysis of Small Molecule Redox Biomarkers
19.2.1. Biological and Clinical Significance
Given the critical function and potential detrimental effect of ROS, it is not surprising that many diseases have roots in oxidative stress [25]. However, despite abundant evidence implicating ROS in pathogenesis, most clinical trials have failed to demonstrate health benefits of antioxidant supplements [26–33]. While many argue that better antioxidants, biomarkers, or analytical methodologies are needed [34], this conundrum underscores that oxidative stress-induced damage is not limited to macromolecular damage, but is mediated through disruption of redox signaling, which can occur without impacting the global balance of oxidants and antioxidants. Another explanation could be that, just as genomic sequencing in precision medicine is used to better inform selection of therapies and predict outcomes, redox profiling is needed to identify individuals who may benefit from antioxidant interventions and to aid in the selection of the antioxidants to best compensate for the specific redox deficiency. There is no shortage of research on a wide variety of assays to characterize oxidative stress, and yet consensus is not reached as to which is the most suitable for routine clinical assessment. Of note, most of these assays focus on the end products of oxidation, rather than probing the mechanisms leading to the imbalance of oxidants and antioxidants. The following sections discuss how MS is being applied to measure several redox-relevant small molecules and their value as biomarkers of oxidative stress.
19.2.2. GSH/GSSG and Cys/CySS Redox Couples
19.2.2.1. GSH/GSSG
GSH, a tripeptide consisting of Cys, glutamic acid, and glycine, is the major low molecular weight antioxidant in cells, cycling between the reduced and oxidized forms to donate reducing equivalents for cellular defense against oxidants. Other important physiological functions of GSH include cell signaling, cell cycle control, detoxification of xenobiotics, regulation of metal homeostasis, and participation as a coenzyme in metabolic reactions. A low GSH level, high GSSG level, or a low GSH/GSSG ratio are often indicative of oxidative stress and found in a variety of diseases. For example, GSH/GSSG ratio becomes progressively lower in association with age and diabetes [35, 36] and is an independent predictor for the presence of early atherosclerosis [37]. Many analytical methods to detect GSH and GSSG rely on spectrophotometry utilizing the GSH cycling assay [38], imaging using genetically encoded probes like roGFP2-Grx1 [39], or high-performance liquid chromatography (HPLC) followed by UV, fluorescence, or electrochemical detection. In recent years, MS coupled with either gas chromatography (GC) or liquid chromatography (LC) has become increasingly popular for the analysis of GSH and GSSG, with the advantage of superior sensitivity and selectivity.
Regardless of the method used, substantial differences exist in the reported values of GSH and GSSG, even in control groups of healthy participants [34, 40]. The cause of this problem can be at least threefold. First, most GSH is present intracellularly (e.g., erythrocytes) in the range of 1–10 mM; only a small fraction ranging from 2 to 20 μM is in extracellular matrices (e.g., plasma, serum) [41]. Therefore, it is highly critical to avoid hemolysis during processing of blood specimens; even minor hemolysis can result in a dramatic increase in GSH and GSSG plasma values [42, 43]. If measurements are performed in whole blood, hematocrit levels should be taken into account as this may change dramatically with diseases, which many studies fail to do. There is, in fact, no agreement on which biological matrix should be assayed to best connect GSH and GSSG changes to disease. For humans, blood is one of the better choices because of its less invasive nature. By narrowing GSH measurements specifically to erythrocytes, it was possible to decrease deviation between samples while still showing a change in levels correlated to age [36]. On the other hand, because plasma interacts with the whole body, plasma measurement represents a systemic oxidative stress indicator and may not reflect local effects in specific tissues [44].
Second, since most GSH present in tissues is in the reduced form (i.e., the ratio of GSH/GSSG is high (~400) [38]), artifactual GSH oxidation during sample processing can lead to marked overestimation of GSSG. Thiol alkylating agents such as N-ethylmaleimide (NEM), iodoacetic acid (IAA), 2-vinylpyridine, and monobromobimane (mBB) have been used to prevent artifactual GSH oxidation. Derivatization with alkylating agents not only stabilizes GSH and prevents its oxidation to GSSG or reaction with cystine (CySS), albumin-S-S-Cys, or other disulfides [45], but in some cases (e.g., mBB) also forms a fluorescent product and improves the sensitivity of detection. Among different thiol alkylating agents NEM has been proven the best so far because of its fast reaction and cell permeability, the latter important for measurements in intact cells [40, 41, 46, 47]. The rapid reaction of NEM with –SH also means that NEM is a potent inhibitor of GR. While this is problematic for GSH cycling assays, which rely on GR activity, it is advantageous to use NEM to mask GSH for HPLC-based methods because it inhibits GR catalyzing GSSG conversion back to GSH [47]. In addition, reaction with NEM improves ionization efficiency of GSH for MS detection [48]. Alternatively, artifactual GSH oxidation can also be prevented by acidification, based on the notion that the –SH group is less reactive than its ionized thiolate form –S−. Acidification also serves to precipitate proteins before HPLC analysis. Typical acids used for deproteinization include 5-sulfosalicylic (SSA), perchloric acid (PCA), and trichloroacetic acid (TCA). Unfortunately, no consensus has been reached as to the optimal way to prevent artifactual GSH oxidation. Some argue that derivatization with NEM should be performed immediately after blood collection, followed by a separate acid deproteinization step; addition of NEM together with acid or after acid deproteinization is erroneous because NEM is less reactive with GSH at acidic pH and GSH can be oxidized by acidification if not alkylated [41, 47, 49]. Others argue that acidification does not induce GSH oxidation but rather stabilizes it, or NEM reacts with GSH better at acidic pH, and therefore derivatization is not needed or can be combined with acidification to simplify sample processing [50–53].
Third, the deproteinization step for HPLC analysis can introduce errors, and there is no agreement on the best way to remove proteins. Among commonly used acids for deproteinization, SSA does not achieve acceptable sample stability, TCA interferes with the chromatographic separation of species of interest, and there are concerns of poor reproducibility and sensitivity with PCA methods [54, 55]. Organic solvents such as methanol and acetonitrile have also been used for protein removal [54]. However, the use of either acid or organic methods could also deplete glutathione species by co-precipitation with proteins leading to underestimation of GSH and GSSG. Ultrafiltration was proposed as an alternative method of deproteinization, in particular for matrices such as plasma [46].
Table 19.1 summarizes studies using LC-MS to quantify GSH and GSSG in biological matrices from human, mouse, or rat since 2000. It highlights that, as mentioned above, different methodologies regarding derivatization and deproteinization of samples have been applied for GSH and GSSG quantification, and as a result, the reported values, even for untreated healthy samples, are widely variable and likely plagued by artifacts. The Human Metabolome Database (HMDB) should be utilized as a point of reference for the typical values of GSH in human biospecimens under normal and pathological states [56].
Table 19.1.
Determination of GSH and GSSG by LC-MS
| Matrix | Derivatization | Deproteinization | Detection | GSH | GSSG | Reference |
|---|---|---|---|---|---|---|
| Human blood | NEM | SSA, together with derivatization | LC-MS | 1310 μM | 0.62 μM | Steghens et al. [51] |
| Human blood | None | TCA | LC-MS/MS | 865.5 μM | 80.7 μM | Squellerio et al. [52] |
| Human blood | NEM | SSA, together with derivatization | LC-MS/MS | 900 μM | 1.17 μM | Moore et al. [66] |
| Human erythrocytes, plasma | IAM, IPCF | PCA, after derivatization | LC-MS/MS | Erythrocytes, 9.51 μmol/g Hb; plasma, 3.35 μM | Erythrocytes, 0.014 μmol/g Hb; plasma, 0.05 μM | Suh et al. [67] |
| Human erythrocytes | IAA | PCA, before derivatization | LC-MS/MS | 1.33–2.21 mM | 0.168–0.313 mM | Reinbold et al. [68] |
| Human blood, erythrocytes, saliva | NEM | Acetonitrile, after derivatization | LC-MS/MS | Blood, 1.46 μmol/g; erythrocytes, 1.69 μmol/g; saliva, 0.78 nmol/g | Blood, 2.4 nmol/g; erythrocytes, 6.1 nmol/g; saliva, 0.34 nmol/g | Fahrenholz et al. [69] |
| Human neutrophils, erythrocytes, HUVEC | NEM | Ethanol, after derivatization | LC-MS/MS | Neutrophils, 1569 pmol/106 cells; erythrocytes, 1549 pmol/107 cells; HUVEC, 1687 pmol/1.2 × 105 cells | Neutrophils, 1.1 pmol/106 cells; erythrocytes 0.8 pmol/107 cells; HUVEC, 1.9 pmol/1.2 × 105 cells | Harwood et al. [70] |
| Human plasma | NEM | Ultrafiltration with a 10 kDa cut-off, after derivatization | LC-MS/MS | 3.89 μM | 7.09 nM | Sutton et al. [46] |
| Human plasma | None | Methanol | LC-MS/MS | 2.94 μM | ND | Jiang et al. [71] |
| Human PBMC | NEM | Acetonitrile, after derivatization | LC-MS | 74.4 nmol/mg protein | 0.9 nmol/mg protein | Camera et al. [72] |
| Human urine | BQB, acidified | Acetonitrile, before derivatization | LC-MS/MS | 0.0566 mmol/mol creatine | 0.102 mmol/mol creatine | Huang et al. [53] |
| Human urine | FEMA, FEM, acidified | None | LC-MS/MS | 0.0175 mmol/mol | 0.184 mmol/mol creatine | Seiwert et al. [73] |
| Human dermis | None | Microdialysis | LC-MS | 50–60 ng/mL | 3.2–3.4 ng/mL | Robin et al. [74] |
| Mouse blood | NEM | SSA, after derivatization | LC-MS/MS | 805.5 μM | 4.8 μM | Lee et al. [49] |
| Mouse serum | NBenzM, NCycloM | SSA, after derivatization | LC-MS | 241.7 μM | 43.1 μM | Iwasaki et al. [75] |
| Mouse liver | IAA | SSA, after derivatization | LC-MS/MS | 53 nmol/mg protein | 3.7 nmol/mg protein | Bouligand et al. [76] |
| Mouse liver | None | Methanol | LC-MS/MS | 2.17 μmol/g tissue | ND | Norris et al. [77] |
| Rat liver, mouse lymphoma cells | None | TCA | LC-MS/MS | Rat liver, 1.51 mg/g tissue; mouse lymphoma cells, 13,273 ng/107 cells | ND | Zhang et al. [78] |
| Rat hepatocytes | IAA | Acetonitrile, after derivatization | LC-MS/MS | 50–60 μM | 0.6 μM | Loughlin et al. [79] |
| Rat plasma, erythrocytes, lung, liver, heart, kidney, brain | Ellman’s reagent | SSA, after derivatization | LC-MS | Brain, 950; plasma, 20; heart, 1346; lung, 1388; liver 7940; erythrocytes, 2338; kidney, 110 nmol/g or mL tissue | Brain, 11; plasma, 8; heart, 34; lung, 31; liver 348; erythrocytes, 18; kidney, 12 nmol/g or mL tissue | Guan et al. [80] |
BQB bromoacetonylquinolinium bromide, FEM N-(2-ferroceneethyl)maleimide, FMEA ferrocenecarboxylic acid (2-maleimidoyl)ethylamide, HUVEC human umbilical vein endothelial cells, IAA iodoacetic acid, IAM iodoacetamide, IPCF isopropylchlroformate, Hb hemoglobin, LC liquid chromatography, MS mass spectrometry, NBenzM N-benzylmaleimide, NCycloM N-cyclohexylmaleimide, ND not determined, NEM N-ethylmaleimide, PBMC peripheral blood mononuclear cells, PCA perchloric acid, SSA 5-sulfosalicylic acid, TCA trichloroacetic acid
The use of MS in measuring GSH and GSSG is not limited to LC-MS techniques. Although less common, MS has also been coupled with GC [57–62] and capillary electrophoresis [48, 63] to measure GSH. In particular, GSH determination by GC is challenging due to the lack of volatility and thermal stability. Early attempts involved derivatizing GSH or isotopically labeled GSH to generate an N,S-ethoxycarbonylmethyl ester, which was then used to quantify the concentration of GSH and to measure the synthesis rate, respectively, by GC-MS [59–62]. More recently, GSH was also measured as the dimethyl ester-N-pentafluoropropionyl derivative using the electron-capture negative-ion chemical ionization mode in GC-MS [57]. Furthermore, MS/MS without any chromatographic separation was applied to diagnose glucose-6-phosphate dehydrogenase deficiency (manifested by lower blood levels of GSH and lower GSH/GSSG) in newborns using dry-blood-spot samples [64]. Quantitative MS imaging has also been used to obtain absolute concentrations of GSH in healthy and cancerous hen ovarian tissues. The results were compared with LC-MS/MS quantification of GSH from the same tissues. While the absolute values differed between these two techniques, there was a consistent approximately twofold increase in GSH concentration in the cancerous tissue [65].
19.2.2.2. Cys/CySS
Cys/CySS is another redox couple commonly measured to assess oxidative stress. Cys-SH is present at low micromolar levels in cells and approximately tenfold higher concentrations in blood (~200 μM) [56]. A nonessential amino acid, Cys is synthesized from homocysteine (Hcy), an intermediate in the Met cycle, via the transsulfuration pathway catalyzed by cystathionine-β-synthase and cystathionine-γ-lyase. The main fate of Cys is incorporation into either proteins or GSH, but it also serves as a source of H2S in cells [81]. H2S reaction with protein Cys-SOH or disulfides leads to the formation of protein Cys-S(S)nH per-/polysulfides [82]. Cys is found in most proteins and often positioned in the functional sites of proteins subject to redox regulation [83, 84]. Cys is the rate-limiting substrate for de novo GSH synthesis, which relies on the enzymatic activity of glutamate cysteine ligase and GSH synthase. When free Cys is oxidized, it forms CySS. While plasma total Cys is a risk factor for atherosclerosis [85, 86], increased CySS in plasma is associated with age, obesity, smoking, alcohol abuse, and multiple disease processes [87, 88]. Cys/CySS is the most abundant low molecular weight thiol/disulfide couple in human plasma, both present in ~10–100-fold higher concentrations than GSH and GSSG [87]. There is a lack of thermodynamic equilibrium between the GSH/GSSG and Cys/CySS redox couples, both intracellularly and extracellularly [88]. In both compartments, the Cys/CySS redox couple is maintained at a more oxidized state than GSH/GSSG [44]. Similar to GSH/GSSG, the Cys/CySS redox couple is oxidized in association with age, albeit with a different rate [35]. A novel plasma CySS/GSH ratio can predict death as an outcome in coronary artery disease patients [89]. In this interpretation, CySS provides a surrogate for overall oxidative burden and GSH provides a surrogate for the NADPH-dependent reductive capacity.
Determination of Cys and CySS suffers from the same issues as mentioned before for GSH and GSSG. Although the differences between intracellular and extracellular Cys levels as well as between Cys and CySS are less dramatic than for the GSH/GSSG redox couple, stabilizing the –SH group with a derivatizing agent remains necessary to avoid artifacts. After derivatization, Cys and CySS can be measured by LC-MS [46, 67, 75, 76, 80, 90, 91]. Alternatively, total Cys (Cys-SH + CysSS) can be measured by LC-MS [71, 92, 93] or GC-MS [59, 60, 94] after reducing the samples with dithiothreitol (DTT) or tris(2-carboxyethyl)phosphine hydrochloride (TCEP). Because MS can potentially differentiate a multitude of analytes, measurement of Cys and CySS is often accomplished simultaneously with other thiol metabolites (e.g., GSH, GSSG, Hcy, homocystine, etc.), or sometimes even in a broader metabolomics setting though most often without the necessary precautions to avoid artifacts [46, 48, 95, 96].
19.2.3. NAD(P)H and NAD(P)+Redox Cofactors
Nicotinamide adenine dinucleotide (NAD+), nicotinamide adenine dinucleotide phosphate (NADP+), and their reduced forms (NADH and NADPH) are essential redox cofactors. Although structurally identical except for the additional 2′ phosphate on the adenosine ribose moieties of NADP+ and NADPH, the functions of NAD+/NADH and NADP+/NADPH are not redundant. While NAD+/NADH participates in catabolic reactions (e.g., glycolysis, citric acid cycle, fatty acid oxidation), NADP+/NADPH supports reductive biosynthesis. In addition to its redox functions, NAD+ is also substrate for poly ADP-ribose polymerases, cyclic ADP-ribose synthases, mono ADP-ribose transferases, and sirtuins [97–100]. Over a century of comprehensive research has expanded the functions of NAD(P)+/NAD(P)H from energy metabolism to calcium homeostasis, gene expression, immune response, cell death, detoxification, and so forth [100]. Of particular interest, NADPH has opposing functions with regard to ROS generation and elimination. On the one hand, NADPH provides the reducing equivalents to regenerate reduced TRXs and GSH via the TR and GR systems, respectively [23, 24], and reactivate CAT [101], all of which are essential for degradation of H2O2 and reduction of many oxidized species. On the other hand, NADPH contributes to ROS generation through the activity of NADPH oxidases in phagocytes and various tissues and cell types [102, 103]. The ratio of NAD(P)+/NAD(P)H determines the redox potential that can affect the activities of numerous metabolic pathways. Consequently, altered levels and ratios of NAD(P)+/NAD(P)H are implicated in disease conditions such as diabetes, neurodegenerative diseases, and cancers, and these redox couples have been intensively investigated as therapeutic targets for these diseases [99, 100, 104–106]. Therefore, determining the levels and ratios of NAD(P)+/NAD(P)H serves as a powerful tool to assess cellular metabolic and redox state.
Measurement of NAD(P)H and NAD(P)+ has been achieved by autofluorescence [107], genetically encoded fluorescent sensors [108, 109], nuclear magnetic resonance spectroscopy [110, 111], HPLC with UV or fluorescence detection [112–116], and enzymatic cycling assays with colorimetric, fluorescent, or luminescent detection [117–120] offered by many commercially available kits. Since LC-MS has become the leading analytical technology in untargeted metabolomics and targeted analysis, this technology has been increasingly applied for quantitation of NAD(P)H and NAD(P)+. Typically, the measurement starts with quick quenching of metabolism to avoid artifacts caused by residual enzymatic activities, which can be done by freezing in liquid nitrogen or mixing with cold organic solvents [121]. Metabolites are then extracted, usually in some mixture of water, ethanol, methanol, or acetonitrile, but typically for cells and tissues 40:40:20 acetonitrile:methanol:water with 0.1 M formic acid [122]. Next, ion pair reversed-phase LC (IP-RP-LC) or hydrophilic interaction chromatography (HILIC) is used for separation followed by electrospray ionization (ESI)-MS or -MS/MS usually operating in negative ion mode. Because NAD(P)H and NAD(P)+ are often measured in metabolomics studies, different LC conditions have been tested to achieve the best resolution and data quality. The consensus has been that IP-RP-LC provides superior retention and separation of the targeted compounds, compared to HILIC or other chromatography methods [123, 124].
Accurate measurement of NAD(P)H and NAD(P)+ is still challenging, as manifested by large discrepancies between reported values. Such difficulties can be attributed mainly to the labile nature of these chemicals, especially for NADH and NADPH, which are not stable at low pH and high temperature [125, 126]. Similar to the measurements of cysteine and glutathione redox couples, it would be recommended to have dedicated methods for NAD(P)H and NAD(P)+ quantitation, instead of just extracting the data from broad metabolomics studies. Moreover, most MS studies to analyze NAD(P)H and NAD(P)+ used bacteria [123, 124, 127–133], yeasts [130, 132, 134–137], mammalian cultured cells [122, 124, 129, 132, 135, 138–142], rat kidney [143], mouse liver [122, 130], heart [144], pancreas [124], erythrocytes [140], and brain [141] samples, and only a few studies report measurements in human blood and urine [124, 141, 144, 145]. It is desirable to develop methods using matrices that are applicable to routine clinical assessment. Indeed, new promising approaches are emerging such as using magnetic resonance to monitor NAD+/NADH redox state live in the human brain, providing innovative means to examine this redox couple non-invasively [146].
19.2.4. 8-Isoprostane
Isoprostanes are a large family of prostaglandin-like compounds generated by free radical-mediated oxidation of arachidonic acid (AA) and other polyunsaturated fatty acids (PUFAs) without the direct action of cyclooxygenases [147, 148]. 8-isoprostane (also known as 15-F2t-isoprostane or 8-iso-PGF2α) has been widely used as a proxy for all general isoprostanes. Historically this is due to the availability of an authentic standard, but subsequent extensive research has established its value as a biomarker of oxidative stress in a wide variety of disease conditions [149–154]. Esterified isoprostanes compromise membrane integrity and fluidity, and cleaved free 8-isoprostane, and some other isoprostanes can exert robust biological activities by acting as ligands for prostaglandin receptors, extending their function as signaling mediators in oxidative stress-related diseases [155, 156]. As a biomarker of oxidative stress, 8-isoprostane has several advantages: 1) it is chemically stable, 2) it is present in a detectable amount, 3) it is produced specifically by free radical-mediated oxidation, and 4) it is not affected by lipid content of a diet [153]. 8-isoprostane has been measured in various bodily fluids including serum, plasma, urine, bile, exhaled breath condensate, amniotic fluid, bronchioalveolar lavage fluid, cerebral spinal fluid, and sputum where is generally found at sub-nanomolar concentrations [56]. Among these, urine is the preferable biospecimen for 8-isoprostane detection because it is non-invasive and there is no artifactual generation of 8-isoprostane by oxidation as found in serum or plasma [153, 157].
It should be noted that although 8-isoprostane was thought to be generated solely by free radical-mediated AA peroxidation, this idea has been challenged by identification of an alternative reaction catalyzed by prostaglandin endoperoxide synthase (PTGS) [158–160]. This means that an increase in 8-isoprostane level does not necessarily indicate oxidative stress, especially during inflammation when PTGS is known to be induced. However, because esterified AA, the predominant form of AA, is not a substrate for PTSG, esterified or total 8-isoprostane should not be significantly impacted by PTGS-mediated 8-isoprostane formation and therefore represent oxidative stress [151]. In addition, one can also measure the 8-isoprostane/prostaglandin F2α ratio to distinguish chemical from enzymatic lipid peroxidation [161].
Typically, 8-isoprostane quantitation is performed by immunoassays or MS-based assays with GC or LC. Immunoassays include enzyme-linked immunosorbent assay (ELISA) [162] and radioimmunoassay [163]. These are easy to perform and do not require expensive instrumentation but often suffer from cross-reactivity with related compounds, leading to overestimation of 8-isoprostane [164–166]. GC-MS methods offer excellent sensitivity and specificity, but laborious sample preparation including derivatization is needed. A typical procedure requires solid-phase extraction (SPE) using a C18 column, thin-layer chromatography (TLC) purification, and chemical derivatization with pentafluorobenzyl bromide. Quantitation is achieved by using GC-negative ion chemical ionization-MS and employing stable isotope dilution [167–169]. Many variations have been made to improve the assay by simplifying the sample purification steps [170–175] and by using MS/MS for more specific detection [173, 176–178]. LC-MS is an attractive alternative to GC-MS because LC resolves more of the isoprostane isomers than GC [179–181] and does not need derivatization. A typical procedure employs SPE for sample preparation followed by LC-MS with ESI [179, 182–190]. Immunoaffinity chromatography purification has been shown to help distinguish 8-isoprostane from its three isomers for both GC and LC, thus allowing more specific measurements [178, 191–193].
19.2.5. ROS Measurement with 2-Hydroethidium
ROS are highly reactive and short-lived (e.g., O2·− has a half-life of 1–4 μs, ·OH 1 ns, and H2O2 has the longest half-life of the three - more than 1 ms [194]). Thus, ROS exist in vivo at very low concentrations (picomolar to low nanomolar) [195], and direct measurement of ROS is virtually impossible. This has led to the development of many ROS probes, which react with these species and form relatively stable products that are easily detectable (reviewed in [196]). However, many commonly used ROS probes suffer from nonspecific reactions with multiple species, making results difficult to interpret. For instance, hydroethidine (HE; or dihydroethidium) and its mitochondria-targeted analog mito-HE (commercially known as MitoSOX) have been widely used as intracellular and mitochondrial O2 ·− probes, respectively. Although O2·− can oxidize HE or mito-HE to specific products 2-hydroxyethidium (2-OH-E+) or 2-OH-mito-E+, other oxidants lead to ethidium (E+) or mito-E+ species [197]. Because the fluorescent spectra of these products overlap, it is not advisable to use simple fluorescence detection to accurately measure O2·− [197]. On the contrary, HPLC with UV, fluorescence, electrochemical, or MS detection offers great selectivity in detecting and quantifying 2-OH-E+, E+, and their mitochondrial analogs [197, 198]. Recently, by using multiple reaction monitoring (MRM) with LC-MS/MS, simultaneous monitoring of HE, mito-HE, and hydropropidine (HPr+, a newly developed extracellular O2·− probe), and their oxidation products was achieved in a cell system [199].
19.3. Mass Spectrometry Analysis of Proteins Oxidation
19.3.1. Biological and Clinical Significance
Collectively, there are >35 oxidative posttranslational modifications in proteins, all of which can be distinguished by MS [200]. The most redox susceptible amino acid in proteins is the sulfur-containing Cys, which can be oxidized to a variety of products as shown in Fig. 19.2. Other amino acids can also be oxidized including Met (Met-O, Met-O2), Tyr (Tyr-OH, Tyr-NO2), and proline (Pro-OH) impacting protein stability and function [201] and leading to disease [202–205]. This section summarizes modern proteomics approaches, especially MS-based proteomics, for detection and quantification of reversible oxidative modifications at protein cysteine sites.
19.3.2. Analysis of Redox Modifications in Intact Proteins by Mass Spectrometry
Intact protein analysis by MS is used for studies of enzyme kinetics, to monitor the formation of various oxoforms, structural investigations, and many other applications. While both matrix-assisted laser desorption/ionization mass spectrometry (MALDI-MS) and ESI-MS have been used for this purpose (most frequently with time-of-flight (TOF) analyzers), ESI-MS is the more common method. For kinetic studies, an online or offline reaction quenching step is required as it has been shown in several studies [206–208]. Monitoring thiol oxoforms such as -SOH, nitrosylation (-SNO), glutathionylation (-SSG) and others is of high interest in the field of redox biology. Numerous studies have used ESI-MS with online and offline quenching to monitor thiolbased enzyme kinetics in PRXs and other enzymes [15, 209]. Other studies have used proteins containing reactive Cys in investigations aimed at gaining knowledge of the mechanisms of oxidation and relay of oxidative signals, and for development of chemical reagents with selective reactivity towards a specific thiol oxoform. While these studies often used wild-type enzymes, in several cases mutagenesis was applied to stabilize or enrich in certain oxidative modifications (e.g., AhpC (alkyl hydroperoxide reductase subunit C) [210, 211], bovine seminal ribonuclease [212], and OhrR repressor [213]). For example, the bacterial S. typhimurium PRX AhpC was used in several studies either as the wild-type (-SH and disulfide-linked dimer) or with the resolving Cys165 mutated to alanine or serine to stabilize the -SH and generate -SOH, -SSH, -SNO, -SSG and other oxidative species. These were then employed : 1) to discover the cross-reactivity of commonly used thiol-blocking reagents such as IAM, NEM, and methyl ethanethiosulfonate (MMTS) with protein Cys-SOH [214]; 2) to screen for and identify a new class of biologically compatible thiol-selective reagents, leading to the discovery of MSTP (4-(5-methanesulfonyl-[1,2,3,4]tetrazol-1-yl)-phenol) as a thiol-selective, highly reactive, cell membrane permeable and MS-compatible thiol blocker [215]; and, 3) to characterize the kinetics and selectivity of new chemical probes with a given oxidative modification (e.g., protein sulfenylation probes DCP-Bio1, BP1, Alk-β-KE, and mitochondria-targeted DCP-NEt2C [216–220], and protein sulfenylation and persulfidation probe BCN/BCN-Bio1 [221]). Direct analysis of persulfides (-SSH) and other thiol modifications using ESI-MS was also performed with other intact proteins [222].
19.3.3. Top-Down and Bottom-Up Approaches for Identification of Protein Oxidation at Cys Residues
In general, the MS analysis of proteins and posttranslational modifications can essentially be divided into “top-down” and “bottom-up” approaches. For top-down proteomics, fragmentation of intact proteins occurs within the mass spectrometer. For bottom-up analysis, proteins are proteolytically digested to peptides before being introduced into the MS.
Most top-down studies are performed using recombinant low molecular weight proteins. However, this approach can also be applied to investigate redox modifications of abundant proteins in a biological matrix of interest [223]. Examples of top-down studies of protein oxidation include identification and quantification of blood cysteinylated human serum albumin (-SSCys), nitrosylated hemoglobin A (-SNO), and Met-oxidized apolipoprotein A-I (apoA-I) for assessment of redox state linked to the risk of cardiovascular diseases [224], identification and monitoring of reactive Cys residues in the tumor suppressor protein p53 [225], and characterization of oxidized calmodulin in activated macrophages [223]. However, despite these reports, the methodology has limitations for the broad detection of protein oxidation in biological systems.
Over the years, a number of bottom-up methods were developed to enable broad scale identification and quantification of protein oxidative modifications. Though typically the proteolytic digestion is performed with trypsin, alternative proteases with orthogonal activities to trypsin have been successfully applied, including chymotrypsin, Asp-N, and Glu-C [201]. These are in particular valuable as oxidative modifications may interfere with the binding and enzymatic activity of any single protease. Bottom-up proteomics analysis is most commonly conducted by LC-MS/MS using either untargeted approaches or targeted analysis. Because the level of oxidative modifications in complex samples is relatively low (<5%), special methods for labeling of oxidized proteins and enrichment strategies are employed, as described below. A key aspect of the analysis is also the handling of biological or clinical specimens to limit protein oxidation artifacts during processing, which will be discussed in Sect. 19.3.4.
19.3.3.1. Indirect Tag-Switch Methods
The biotin-switch is the most commonly used tag-switch method in redox proteomics. Since its introduction, many modifications have been made that allow for more efficient sample enrichment and interface with MS analysis [226]. This method relies on selective blocking of free thiols, selective or non-selective reduction of particular oxidative modification(s), and labeling of nascent reduced thiols with a biotin-tagged thiol alkylating compound followed by enrichment with streptavidin beads, or direct enrichment of nascent thiol proteins by binding to thiol sepharose or comparable resins. Using this general workflow, the oxidation state of a specific protein can be detected, proteins of a particular oxidation state can be enriched, and changes in protein oxidation can be quantitatively analyzed with MS and further validated with Western blot analysis [214].
Protein Sulfenylation (-SOH).
Figure 19.3 shows the indirect tag-switch method for analysis of protein sulfenylation by MS. Traditionally, IAM, NEM, or MMTS are used for the initial alkylation of reduced thiols; however, these react with both –SH and –SOH cysteine species in proteins and are therefore unsuitable for –SOH determination with this method. Moving forward, it is recommended that reduced thiols are blocked by MSTP, a selective reagent mentioned earlier [215]. Subsequently, –SOH is reduced back to –SH selectively with sodium arsenite [227], followed by labeling of newly generated reduced thiols with biotin-IAM and streptavidin-based enrichment. Alternatively, direct enrichment of newly reduced proteins with thiopropyl sepharose 6B resin [228] could be used to bypass biotin labeling. After the enrichment, proteolytic digestion is performed to generate peptides, followed by the release of tagged or bound Cyscontaining peptides. LC-MS/MS analysis can be used to identify the site of modification, to quantify the site occupancy, and to perform relative quantification of changes in oxidation levels between conditions. This workflow can be adapted to identify and quantify other oxidative modifications by simply switching the conditions for selective reduction of oxidized species as described below.
Fig. 19.3.
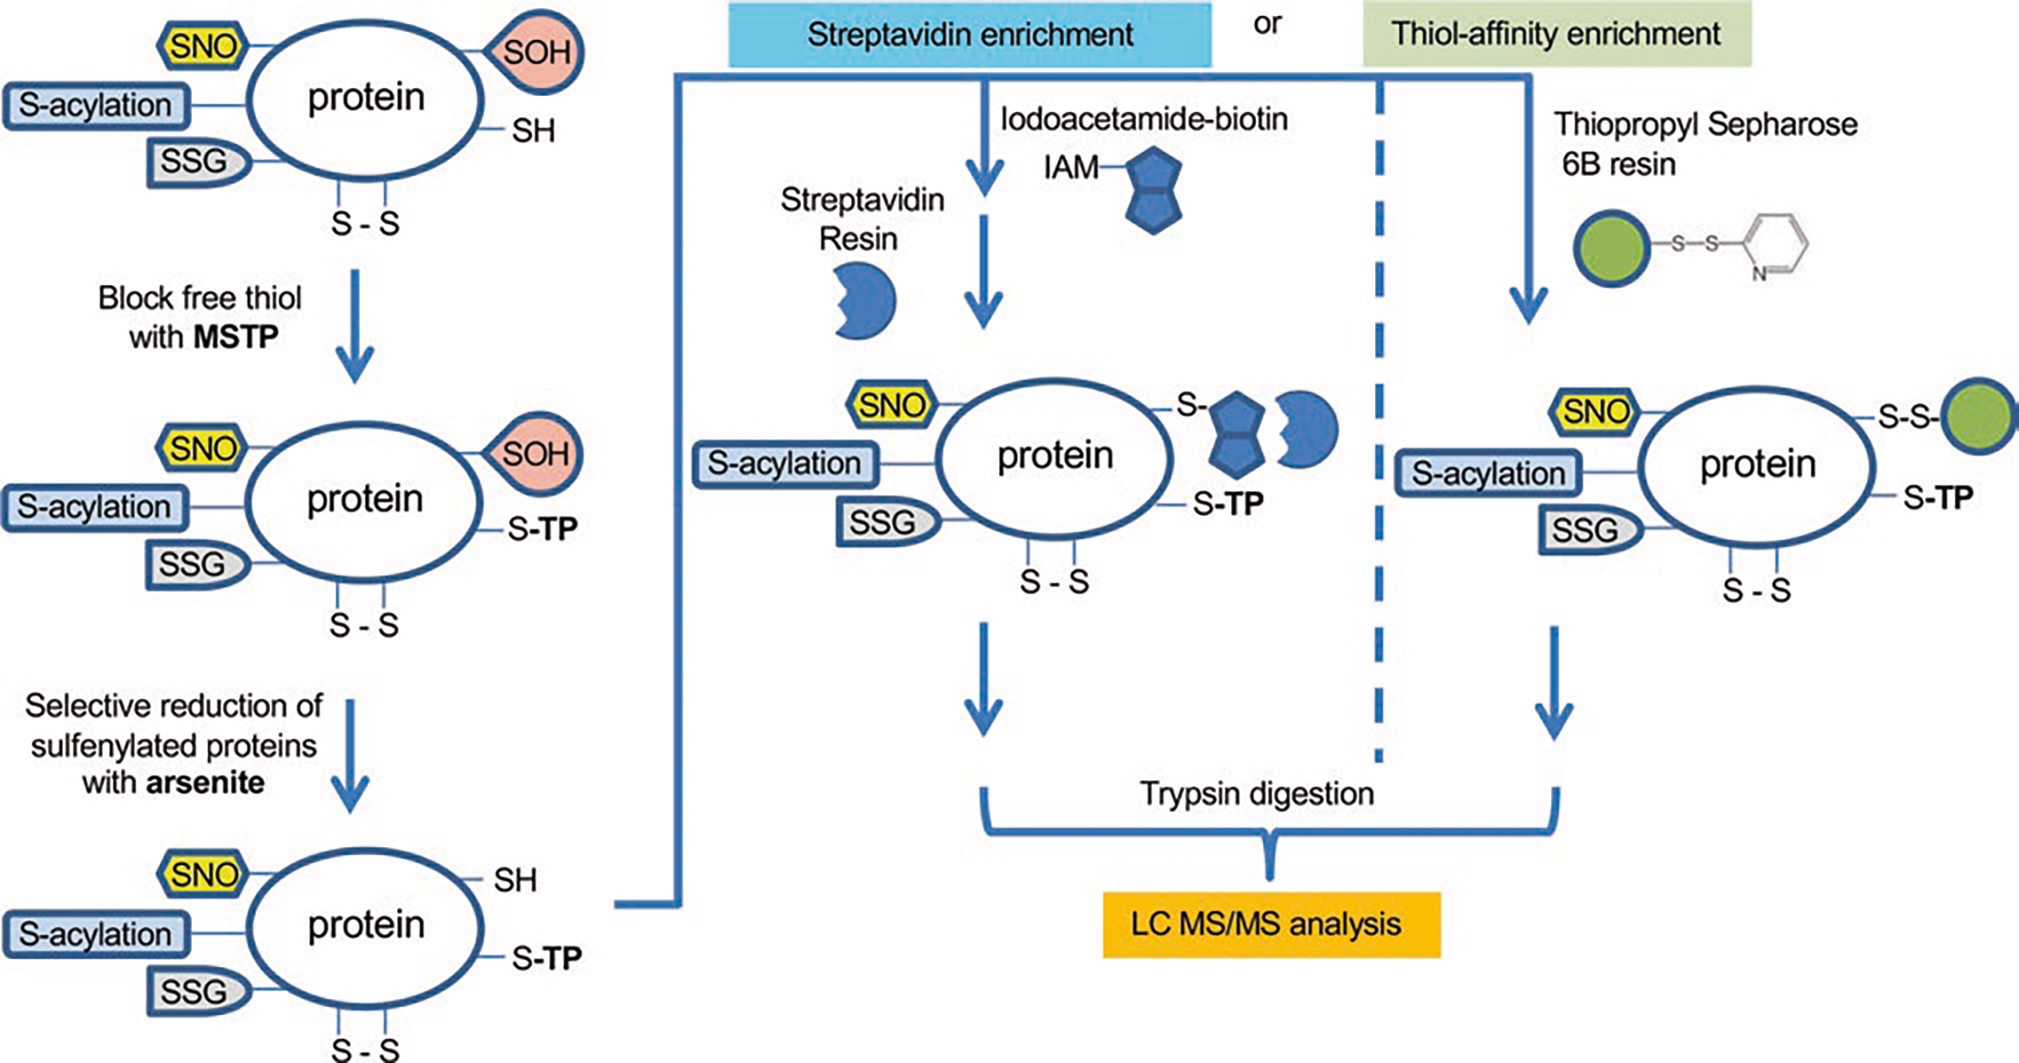
Indirect tag-switch method for analysis of protein sulfenylation by MS
Protein Nitrosylation (-SNO).
Ascorbate is widely used to selectively reduce –SNO in the indirect tag-switch method [229, 230]. However, this method is questionable as ascorbate is also known to reduce disulfide bonds and –SOH, thus generating false-positive identifications of –SNO species. The choice of thiol blockers and reductant, as well as other workflow parameters, need to be carefully considered for analysis of this oxidative modification [214].
Protein Glutathionylation (-SSG).
Indirect techniques for analysis of this modification involve the enzymatic and selective release of GSH from glutathionylated proteins with GRX. Several concerns have been raised with this approach as well, such as incomplete reduction and alkylation impacting quantification, issues related to the specificity of bacterial GRX for human glutathionylated proteins, and possible oxidation of newly generated protein thiols during processing. To limit these caveats, alternative methods using biotinylated GSH have been developed, but the concern here is that the bulky biotin tag on the GSH molecule might disturb the function of proteins interacting with GSH and overall redox state of the cell [231]. Nevertheless, identification and quantification of protein –SSG was performed in various biological contexts, including in mouse macrophages treated with diamide (tetramethylazodicarboxamide), a reagent inducing disulfide bond formation in proteins [232].
Global Reversible Oxidation.
Thiol affinity resin-assisted enrichment methods have become standard for profiling total reversible oxidative modifications at protein Cys residues. In general, DTT is applied as a strong reductant to switch all reversible oxidation states back to reduced thiols, followed by enrichment with either biotin-labeling/streptavidin or directly thiol affinity resins like the thiopropyl sepharose described above. A variety of quantitative approaches can be incorporated into the workflows for analysis of oxidative modifications as described in Sect. 19.3.3.4.
19.3.3.2. Direct Methods Using Selective Labeling of Oxidative Modifications
Direct methods rely on the selective reaction of a chemical probe (often biotin-tagged or containing click-ready alkyne or azide tags) with a particular oxidative modification. Compared with the indirect biotin-switch methods, this approach has fewer processing steps, leading to shorter processing time and limited sample loss. Selective chemical probes compatible with MS analysis for labeling of protein –SO2H [233], –SNO [234], and –SOH [216, 218, 219, 235] species have been reported. Another chemical probe BCN-Bio1 can be used to identify and quantify selectively –SOH and –SSH species in the same analysis based on the mass difference in the products of BCN-Bio1 reaction with these species (+16 mass units; –S-BCN-Bio1 for the reaction with protein –SSH versus –S(O)-BCN-Bio1 for the reaction with protein –SOH). Further development of DCP-NEt2C, a fluorescent probe targeting mitochondrial sulfenylated proteins, with biotin or other enrichment tags is expected to enable both imaging and MS analysis of protein sulfenylation [220]. Alternatively, isolation of mitochondria fraction either pre- or post-labeling with chemical probes and other indirect workflows could be used to monitor protein oxidation in this key subcellular organelle [236].
19.3.3.3. Analysis of Redox Interactome
Comprehensive analysis of protein-protein interactions (interactome) is becoming increasingly critical in biological and clinical studies. Redox-based interactions, such as through covalent disulfides, are critical to the assembly of both transient and stable protein complexes. High-resolution MS combined with sophisticated analysis software is needed to identify intermolecular as well as intramolecular disulfide bonds. Key to sample processing is again blocking of free and protein thiols with alkylating agents to prevent artifacts of thiol-disulfide exchange reactions and scrambling of disulfides. This approach was applied to identify intramolecular disulfides in a number of signaling proteins (e.g., Akt isoforms [237], ERK2 [238], and JNK2 [239]). In a particular study, a mechanism-based kinetic trapping technique was used to identify thiol-disulfide exchange interactions on the surface of lymphocytes [240]. The study discovered a redoxcontrolled interaction of TRX1 with the tumor necrosis factor receptor superfamily member 8 (TNFRSF8/CD30). Novel interaction partners of FOXO4 were also identified using a proteome-wide screen of ROS-induced disulfide-bound protein complexes [241]. One of these proteins was the nuclear import receptor transportin-1, and the study showed that disulfide formation between FOXO4 and transportin-1 is required for nuclear localization and the activation of FOXO4/DAF-16 under conditions of increased ROS.
19.3.3.4. Quantitative Methods of Analysis
Accurate quantitative information of oxidative modifications and their relative abundance is critical in redox proteomics analysis of both biological and clinical specimens. Quantitative proteomics strategies can be divided into absolute and relative methods, and the relative methods can be further subdivided into label-free or label-based methods [242]. Label-free analysis of total reversible oxidation in red blood cell membranes found increased binding of oxidized hemoglobin and decreased binding of PRX2 to membranes [243]. Label-based approaches include isotope-coded affinity tag (ICAT), isobaric tags for relative and absolute quantitation (iTRAQ), tandem mass tag (TMT), stable isotope labeling with amino acids in cell culture (SILAC), or the use of isotope labeled chemical probes (e.g., protein sulfenylation [244]). For example, ICAT was used to investigate the redox mechanisms of RyR1 regulation and the dynamics of disulfide bonds formation [245]. The majority of redox proteomics studies rely on iTRAQ [246–248] or TMT [249, 250] labeling for relative quantification. Though limited to cell culture studies, SILAC has the advantages of straightforward implementation, quantitative accuracy, and reproducibility for redox proteomics research [251, 252].
19.3.4. Prevention of Artifacts in Analysis of Protein Oxidation
Giving the high reactivity of ROS with protein amino acids (e.g., Cys, Met, tryptophan), and the possibility of multiple reactions between reduced and oxidized thiol species scrambling the endogenous redox state of proteins, it is critical that sample processing is performed under conditions that limit these events. For example, processing of biological or clinical specimens typically requires the breakdown of natural barriers that restrict endogenous ROS to certain subcellular compartments leading to artifactual oxidation when these ROS or other reactive species are released and come in contact with proteins that would not otherwise be exposed to these species. This situation is similar in a way to the errors introduced in the analysis of plasma GSH when erythrocytes are accidentally lysed during blood processing (discussed in Sect. 19.2.2.1). As mentioned above, another major source of errors in redox proteomics is the possibility of reactions between reduced and oxidized thiol species including thiol-disulfide exchange reactions, the reaction of sulfenylated species with reduced protein or free thiols to produce disulfides or the reaction of H2S with sulfenylated proteins and disulfides to generate persulfides, and others. Thus, the following considerations are key to preventing or at minimum limiting these artifacts: 1) processing of samples on ice and when available in an anaerobic chamber; 2) supplementing lysis buffers with metal chelators, CAT, SOD, selective chemical reagents to block reduced thiols (e.g., MSTP) and sulfenylated states (e.g., BCN or BCN-Bio1) [Note: non-selective blocking of –SH and –SOH species with IAM, NEM, or MMTS may also be used depending on the scope of the study; e.g., if the study focuses on protein glutathionylation]; and, 3) precipitating proteins as quickly as possible after labeling to prevent further reactions of proteins with either small molecule endogenous species (e.g., GSH or GSSG) or with chemical reagents in lysis buffer.
19.4. Mass Spectrometry Analysis of Lipid Oxidation
19.4.1. Biological and Clinical Significance
In general, lipid oxidation is a process in which the double bonds in PUFAs and other unsaturated lipids react with oxidants such as free radical or non-radical oxidative species produced as a consequence of redox imbalance in biological systems. The process consists of three steps: initiation, propagation, and termination [253] (Fig. 19.4). Once lipid peroxidation is initiated, subsequent propagation steps occur as chain reactions until non-radical compounds are produced at the termination step. During the initiation step, a carboncentered lipid radical is produced by hydrogen abstraction, which can be induced by exogenous physical and chemical reagents or endogenous enzymatic systems including NADPH oxidase, xanthine oxidase, nitric oxide synthase, and cytochrome P450. In the case of lipid peroxidation, a peroxyl radical is produced next by the propagation step in which molecular oxygen reacts with a lipid radical in many lipid oxidation events. Sometimes a hydrogen atom is transferred to form a peroxyl radical. Also, propagation can be achieved by other mechanisms including direct peroxyl radical addition, intramolecular radical substitution on peroxide, and peroxyl radical cyclization. In the termination step, a hydrogen atom is donated from antioxidants to form non-radical products.
Fig. 19.4.

General mechanism of lipid peroxidation
Lipid oxidation and peroxidation has been implicated in the etiology of various diseases including a wide range of metabolic diseases, cardiovascular disorders, and neurodegenerative diseases (Fig. 19.5). Diabetes mellitus is a metabolic disease with underlying redox mechanisms of pathogenesis [254]. ROS-induced changes in redox state activate stress-sensitive intracellular signaling pathways which mediate insulin resistance and impair insulin secretion. The role of ROS and RNS in cardiovascular diseases is similarly well-established [255–259]. Low-density lipoprotein (LDL) is a major target of these reactive species (e.g., ONOO−) generating isoprostanes, oxysterols, lipid peroxides, and aldehydes upon oxidation. LDL oxidation is a crucial mechanism of atherosclerosis causing significant complications in the cardiovascular system [260]. There is also increasing clinical evidence that lipid peroxidation impacts neurodegenerative diseases such as Alzheimer’s disease (AD). Lipid peroxidation products such as MDA, acrolein, 4-HNE, and 4-hydroxy-2-hexenal (4-HHE) were shown to be elevated in diseased brain regions in both early and late stages of AD. Furthermore, higher levels of important lipid peroxidation markers, including F2-isoprostanes, MDA, and protein-bound acrolein adducts, were found in plasma and urine of AD patients [261, 262].
Fig. 19.5.

Lipid peroxidation and human diseases. ROS attack membrane lipids, producing various lipid peroxidation products, which can lead to DNA damage/mutation, protein adduct formation/alteration, and/or initiation of further lipid peroxidation, ultimately resulting in neurodegenerative, cardiovascular, and metabolic diseases
This chapter presents a brief overview of key products of lipid peroxidation and describes current MS-based analytical strategies for selective and sensitive identification and quantification of these species.
19.4.2. Primary and Secondary Lipid Peroxidation Products
19.4.2.1. Primary Lipid Peroxidation Products
The reaction of ROS and other reactive species with lipids can produce a variety of compounds due to the inherent structural diversity of lipids. However, the main primary products of lipid peroxidation are defined in general as lipid hydroperoxides (LOOH). LOOH are generated during the propagation step in which the hydroperoxide moiety is attached to various lipid species including free fatty acids, triacylglycerols, phospholipids, and sterols [263].
Primary peroxidation products are more stable than free radicals which are usually unstable and highly reactive [264]. In moderate conditions such as lower temperature and absence of metal ions, intact LOOH can be measured and used as biomarkers of oxidative stress in blood and tissues [263, 264]. On the other hand, decomposed products from one-electron reduction induce oxidative damage by mediating lipid oxidation to form new sets of LOOH [264, 265]. The lipid peroxyl radical (LOO·) generated from the propagation step can attack other lipids, promoting further peroxidation events. These species target mostly PUFAs such as AA. AA is one of the representative omega-6 PUFAs formed primarily by enzymatic cleavage of membrane phospholipids. Many eicosanoids such as prostaglandins, thromboxanes, and leukotrienes are produced from enzymatic oxidation of AA; cyclooxygenases, lipoxygenases, and cytochrome P450 enzymes are responsible for these reactions [263]. Isoprostanes and other end products such as MDA and 4-HNE are generated by non-enzymatic processes catalyzed by free radicals (Fig. 19.6).
Fig. 19.6.

Lipid peroxidation products. Different classes of PUFAs can undergo non-enzymatic or enzymatic oxidation, producing primary and secondary lipid peroxidation products. COX, cyclooxygenase; CYP450, cytochrome p450; EET, epoxyeicosatrienoic acid; HETE, hydroxyeicosatetraenoic acid; 4-HHE, 4-hydroxy-2-hexenal; 4-HNE, 4-hydroxy-2-nonenal; HODE, hydroxyoctadecadienoic acid; LOX, lipoxygenase; MDA, malondialdehyde; PUFA, polyunsaturated fatty acid; ROS, reactive oxygen species
19.4.2.2. Secondary Lipid Peroxidation Products
Secondary lipid peroxidation is generally defined as peroxidation processes of AA and other PUFAs that lead to the generation of end products such as MDA and 4-HNE [266]. At high levels, MDA is known to be the most mutagenic lipid peroxidation product whereas 4-HNE is the most cytotoxic product [267]. MDA is produced mainly by non-enzymatic processes and is highly reactive towards proteins and DNA [268, 269]. MDA modifies a wide range of proteins including enzymatic proteins, carrier proteins, cytoskeletal proteins, and mitochondrial and antioxidant proteins. It is suggested that DNA alteration by MDA may play critical roles in the initiation of cancer or other genetic diseases and many efforts are given to define the underlying mechanisms [270]. MDA adducts were also shown to accumulate during aging and in other chronic diseases [271, 272].
Another major secondary lipid peroxidation product is 4-HNE. 4-HNE is an interesting molecule because of its dual functions as a cytoprotective signaling molecule regulating gene expression, and as a cytotoxic molecule inducing pathological abnormalities [266]. During the past decades, 4-HNE and its role as a signaling molecule have been studied in relation to many diseases. 4-HNE is derived from either enzymatic transformation of omega-6 PUFAs by 15-lipoxygenase or several non-enzymatic oxygen radical-dependent routes involving the formation of hydroperoxides, alkoxyl radicals, epoxides, and fatty acyl crosslinking reactions. Once formed 4-HNE plays pivotal roles to promote cell survival or cause cell death depending on the cell type and cellular circumstances. When the level of 4-HNE is low, cellular protective genes such as Nrf2 are expressed which enhances antioxidant capacity. Medium levels of 4-HNE induce autophagy and cellular senescence, while high levels of 4-HNE induce apoptosis and necrosis. These actions are mediated by the reaction of 4-HNE with proteins or DNA [263].
19.4.3. Targeted Analysis of Primary and Secondary Products of Lipid Peroxidation
The major limiting factor for assessment of lipid peroxidation has been the low stability of endoperoxides which decompose in milliseconds to form downstream metabolites. Furthermore, many peroxidation products (e.g., MDA and 4-HNE described above) bind to macromolecules to form various adducts, which becomes a barrier in the quantitative analysis of these species. Over the past decades, the biological function of lipid peroxidation was broadly investigated with a significant effort being placed into the development of analytical methods to measure the levels of key products of lipid peroxidation.
One of the classical methods for analysis of lipid peroxidation is measuring the optical density of a color pigment formed by oxidation of metal or thiobarbituric acid (TBA) using UV-Vis spectroscopy. Among others, thiobarbituric acid reactive substance (TBARS) assay is employed to measure hydroperoxides which generate a red pigment (λmax 562 nm) with TBA in acidic conditions [273, 274]. This method is widely used for measurement of MDA and 4-HNE originated from the oxidation of cholesteryl ester and phospholipids in biological specimens such as plasma. Another technique is the ferrous oxidation of xylenol (FOX) assay which detects hydroperoxides from peroxidized lipids. Hydroperoxides oxidize Fe2+ to ferric iron (Fe3+) which binds to xylenol orange to form a red colored complex (λmax 560 nm) [275]. Because of the simplicity and low cost of analysis, these colorimetric methods are still widely accepted. They have often been combined with a chromatography system to enhance selectivity and thus to avoid false positive results from interfering substances. It is, however, still challenging to distinguish lipid hydroperoxides selectively from other oxidized biomolecules using TBARS and FOX assays.
A number of analytical methods for the determination of conjugated dienes of lipid hydroperoxides such as hydroxyoctadecadienoic acids (HODEs) and hydroxyeicosatetraenoic acids (HETEs) have been reported since the 1990s [276]. Those intermediate products are detectable due to their relatively high stability and UV absorbance (λmax 234 nm), which is often limited by interferences with the UV absorbance of other molecules, in particular when biological samples such as plasma are tested.
MS is one of the fastest evolving analytical platforms in this field with many breakthrough technologies in ionization, mass separation, and detection, which ultimately enable high-throughput analyses. Figure 19.6 shows the main products from enzymatic and non-enzymatic oxidation of PUFAs as well as their peroxidation end products, which can be measured by a variety of MS-based analytical methods.
GC separation has been widely used for analyses of isoprostanes and other end products because of its high chromatographic resolution and sensitivity, although the sample preparation process is time-consuming involving both specialized derivatization and extraction steps. Oxidation products originated from phospholipid membranes such as hydroxylated derivatives of linoleic acid (LA), AA, and docosahexaenoic acid (DHA) were identified in animal models using GC-MS [277, 278]. Various modified techniques have been developed to measure peroxidation end products [279]. GC-MS is also routinely used for analyses of a variety of lipid molecules including PUFAs, cholesterol, and oxysterols due to its robustness, which in some cases outweighs some of the disadvantages.
LC-MS has become in recent years the most popular platform for analysis of virtually all analytes. LC-MS is widely applied for analysis of proteins, metabolites, pharmaceuticals, and other small molecules including lipids and lipid mediators, which were previously analyzed with GC-MS. This evolution was facilitated by improvements in separation techniques and increased availability of a wide variety of stationary phases with unique chemistry for separation of complex biological extracts. Unlike GC-MS, analysis by LC-MS does not require chemical derivatization to increase volatility. Although many lipid species such as oxysterols and some peroxidation products remain difficult to detect with LC-MS, LC-MS allows for analysis of thousands of lipid molecules from a single chromatographic separation. During the past decade, numerous research papers reported the application of LC-MS for analysis of lipids and lipid oxidation products including saturated fatty acids and PUFAs, 4-HNE and its adducts, glycerolipids, cholesteryl esters, cholesterol, oxysterols, HETEs, isoprostanes, and MDA employing various data acquisition strategies (Fig. 19.7).
Fig. 19.7.

Overview of MS-based lipidomics strategies
In the following sections, we describe several MS methods for analysis of lipid oxidation by focusing on specific classes of compounds.
19.4.3.1. Unsaturated Aldehydes
GC-MS was applied to quantify 4-HNE after chemical derivatization using O-pentafluorobenzyl and trimethylsilyl [280, 281]. This method enhanced the stability and volatility of intact 4-HNE allowing for its measurement in the low ng/mL range in negative ion mode with selected ion monitoring (SIM). This method was applied with slight modifications for quantification of MDA and other 4-hydroxyalkenal species [282, 283].
An LC-MS/MS method was also developed for analysis of HNE enantiomers [284]. This study was a valuable attempt to profile enantiomers because the targets of HNE and the pathways of HNE metabolism are known to be influenced by its stereochemistry [285, 286]. HNE and its metabolites, (S)-HNE-(S)-carbidopa, (R)-HNE-(S)-carbidopa, HNEAcid, GSHNE (GSH adduct), and GSHNEDiol were separated and quantified, which could constitute useful biomarkers of lipid peroxidation in disease.
The cytotoxic effect of 4-HNE is based on its ability to form adducts with essential cellular biomolecules such as GSH, proteins, and DNA. For example, DNA-HNE adducts (Fig. 19.8) are well known to cause mutagenesis and are implicated in cancer development [287]. Michael adducts of 4-HNE with GSH and the endogenous histidine-containing dipeptides carnosine (CAR) and anserine (ANS) were identified in skeletal muscle using IP-LC-ESI-MS/MS with MRM [288]. The limitation of this method is the requirement for a relatively high amount of biological specimens and the need to protect from oxidation artifacts during sample processing.
Fig. 19.8.

Representative DNA oxidation products and adducts with secondary lipid peroxidation metabolites
The reaction of 4-HNE with proteins is also critical to disease development and progression [287, 289–292]. Because of relatively low abundance of protein 4-HNE adducts, various enrichment strategies are used to measure these species by MS. Recently, a large-scale proteomics approach in 4-HNE treated MCF-7 cells was reported to detect broad protein modifications using derivatization and fluorous solid-phase extraction [289]. With this method, 673 4-HNE modification sites (607 histidine sites, 60 Cys sites, five lysine sites, and one arginine site) were mapped to 432 proteins. While other methods have been reported as well (e.g., 2D SDS-PAGE separation and MALDI-TOF analysis [292]), a bottom-up proteomics approach with enrichment in modified proteins or peptides and LC-ESI-MS/MS analysis produces the most comprehensive results.
19.4.3.2. Eicosanoids
For many years, eicosanoids were used as biomarkers of lipid peroxidation induced by enzymatic and non-enzymatic processes. Primary peroxidation products such as HODEs, HETEs, F2-isoprostanes (pro-inflammatory prostaglandins F2-like compounds such as 8-isoprostane), and some oxysterols are known to be relatively stable in biological systems, allowing quantification with various MS-based methods of analysis.
Reversed phase LC-MS/MS analysis was used to simultaneously measure various glycerophospholipids and sterol oxidation products present in inflammatory and vascular disorders [293]. The study reported high yields of sterol oxidation products and active lipid mediators in the vascular region, such as 1-hexadecanoyl-2-oxovalaryl-sn-glycero-3-phosphocholine, which induced upregulation of endothelial cell adhesion and chemoattractant proteins, and 5-cholesten-3a-ol 7a-hydroperoxide, a potent cytotoxic oxysterol. The results suggested that the formation of oxidized phosphatidylcholines (PCs) and oxysterols is related to ·NO metabolism where neutrophils and myeloperoxidase play important roles as catalysts in lipid peroxidation.
The level of F2-isoprostanes derived from peroxidation of AA was reported to be reduced by dietary omega-3 PUFAs [294]. Omega-3 PUFAs are more susceptible to oxidation compared with omega-6 PUFAs competing for the propagation and termination steps in the peroxidation process, ultimately resulting in decreased levels of F2-isoprostanes. In this study, the levels of 9-HODEs, 5-HEDE, and F2-isoprostanes in mouse liver tissue were successfully measured by LC-MS/MS with MRM. The method was optimized to increase sensitivity allowing trace analysis of omega-3 PUFAs autoxidation products in various biological specimens and this MRM based LC-MS/MS method has become the gold standard for targeted analysis of these species [295–297].
GC-MS methods were also applied to investigate lipid oxidation and the role of eicosanoids related to various pathological conditions [298, 299]. In these analyses, cellular lipids were typically extracted and trans-esterified, and then the hydroperoxides were reduced followed by SPE and derivatization. Electron impact ionization was applied to quantify 12-HETE, 11-HETE, 9-HETE, and 8-HETE by monitoring ions at m/z 301, 287, 259, and 271, respectively.
Since F2-isoprostanes were first reported as non-enzymatic products of AA peroxidation in the 1990s, this class of compounds has been one of the primary targets for assessment of oxidative stress. GC-MS methods for analysis of F2-isoprostanes and particularly 8-isoprostane were developed [300–302], and these methods are still being used as a complementary platform to LC-MS methods (described in Sect. 19.2.4).
19.4.3.3. Phospholipids
Traditionally, phospholipid species were analyzed using ESI-MS/MS analysis [303]. In the particular study referenced here, glycerophospholipids were separated on a preparative-scale TLC followed by derivatization with 2,4-dinitrophenylhydrazine. Samples were directly injected into a quadrupole mass spectrometer that provided phospholipid profiles including various phosphatidylcholines (PCs), phosphatidylserines (PSs), and phosphatidylethanolamines (PEs). The analysis identified phospholipid peaks with intensities representing relative abundance of each species. Interestingly, the experiment identified primarily oxidized PCs as the unoxidized PCs were not separated on the TLC. Despite the narrow concentration range of linearity, ESI-MS/MS with direct injection provided unbiased compositions of PCs and PEs as also supported by follow-up studies [304].
Nevertheless, measuring phospholipids with this approach yields limited information about oxidation events; however, the method can provide information on the overall degree of unsaturation and therefore susceptibility to peroxidation. Studies using naked mole rats showed that indeed phospholipids containing high PUFAs are particularly prone to peroxidation and the membrane composition may, therefore, influence longevity [305]. Phospholipids analysis using shotgun lipidomics with GC-ESI-MS/MS showed that these animals had low levels of DHA in PCs, PEs, and PSs, which may contribute to the exceptional longevity of these animals. DHA is more susceptible to peroxidation due to a higher degree of unsaturation relative to other PUFAs, and consequently, the phospholipid membrane with higher DHA contents may experience increased oxidative damage.
19.4.3.4. Oxysterols
Oxysterols are oxidation products derived from enzymatic oxidation of cholesterol and its precursors [306]. Oxysterols are considered plasma biomarkers of disorders such as atherosclerosis, neurodegeneration, and inflammation. These species include 24-, 25-, 27-hydroxycholesterol; 7-ketocholesterol; lanosterol; lathosterol; 7-dehydrocholesterol; desmosterol; stigmasterol; sitosterol; and, campesterol. Simultaneous analysis of oxysterols to profile oxidized LDL in plasma samples was performed using GC-MS with SIM [307] while MRM was used in other studies [308].
Although the use of atmospheric-pressure chemical ionization (APCI) is not as widespread as ESI, APCI-MS has shown value for the analysis of lipids and other biological compounds because of its capability to ionize nonpolar compounds. Pentafluorobenzylation can be employed to provide electron-capturing moiety to target molecules and increase compatibility with electron capture detectors [309]. APCI-MS coupled with normal or reverse phase LC was used to determine sterols and oxysterols [310–315], triacylglycerols [316–319], and isoprostanes [320]. An extensive review of the methods for oxysterol analysis [321], points to the need for derivatization methods to enhance ionization efficiency for both APCI and ESI and to improve separation of isomeric peaks. A new derivatization method to convert hydroxyl into N,N-dimethylglycine ester was developed recently [322]. This method was utilized to measure oxysterols in human plasma using LC-APCI-MS/MS [323]. The experiment successfully determined 3β,5α,6β-triol, and 7-ketocholesterol with derivatization enhancing the ionization and fragmentation with APCI-MS. This method provided a rapid and non-invasive assay to detect Niemann-Pick C1 disease with high sensitivity and specificity [324].
19.4.4. Lipidomics Analysis
19.4.4.1. Targeted Lipidomics
While the MS methods described above for analysis of lipid peroxidation products target a select low number of species, advancements in MS instrumentation and chromatographic systems allow for simultaneous determination of tens to hundreds of lipid compounds in a single injection.
LC-MS/MS-based targeted lipidomics was applied to assess plasma lipid profile in high-fat diet-induced obesity in mice. The study analyzed >100 bioactive lipid mediators produced by cyclooxygenase, lipoxygenase, and cytochrome P450 enzymes [325]. This approach determined changes of various lipid species and provided a clear profile of metabolic changes resulting from lipid oxidation events in obesity. Another study reported an LC-MS/MS method with MRM for quantification of isoprostanes in blood and tissue specimens [326]. Sample clean-up using SPE with mixed mode polymeric sorbents provided sensitive detection of various isomeric autoxidized products from AA, adrenic acid, eicosapentaenoic acid (EPA), and DHA.
Selective and sensitive LC-MS/MS methods have also been developed to quantitate 57 oxylipins [327]. This method covered oxygenated lipids derived from five major omega-6 and omega-3 PUFAs, LA, AA, alpha-linolenic acid (ALA), EPA, and DHA. Extraction and enrichment methods are critical for analysis of oxylipins since the hydrophilicity of these species varies widely, and sensitivity of detection is directly related to the rate of recovery from a biological matrix. For example, most PUFAs and their hydroperoxides are hydrophobic and can be efficiently extracted by liquid-liquid extraction (LLE) using a chloroform (or other hydrophobic solvents)/methanol/water system, while F2-isoprostanes are hydrophilic and remain in the polar matrix during LLE. In this case, SPE can be used at acidic pH to include most of the hydrophilic lipid mediators. Most commonly used sample preparation methods were compared [328], and SPE on reverse phase materials (C18) with the removal of the matrix by water and n-hexane before elution with methyl formate showed the best performance for the analysis of a broad spectrum of oxylipins in plasma. Unfortunately, none of the methods guarantee the best recovery of all oxylipin classes, and it is, therefore, important to select the method which best fits the class of compounds targeted by the analysis.
19.4.4.2. Bottom-up Lipidomics
A comprehensive review on shotgun lipidomics [329] describes various quantitative methods to detect intermediate or end products of lipid peroxidation. A select number of studies are highlighted here.
As described in the previous sections, PUFAs are a major target of ROS leading to the production of 4-hydroxyalkenal species. The most common 4-hydroxyalkenal species include 4-HNE and 4-HHE, derived from the oxidative reaction of omega-6 PUFAs and omega-3 PUFAs, respectively. Other 4-hydroxyalkenal species (e.g., 4-hydroxynondienal (4-HNDE) and 4-hydroxydodecatrienal (4-HDTE)) can also be produced through peroxidation of PUFAs. Various methods targeting individual 4-hydroxyalkenal species and their protein adducts were described earlier in this article. A new multi-dimensional MS-based shotgun lipidomics (MDMS-SL) method for quantitative analysis of 4-hydroxyalkenals [330] uses the direct infusion of the aqueous phase from Bligh-Dyer extraction along with isotopically labeled d3–4-HNE to relatively quantitate new 4-hydroxyalkenal species, 4-HNDE and 4-HDTE, in addition to 4-HNE. Carnosine was used as an additive to enhance ionization in positive ion mode, and in-source collision-induced dissociation (CID) was employed to obtain structural information. This method was applied to profile α,β-unsaturated aldehydes in various biological samples [330–332]. Oxidized fatty acids were also analyzed with a modified MDMS-SL [333]. In this approach, the ionization efficiency of oxidized FAs was increased by derivatization with 1-ethyl-3-(3-dimethylaminopropyl)carbiodiimide enabling analysis of a broad range of oxidized FAs, including HETEs, diHETEs, epoxyeicosatrienoic acids (EETs), nitrosylated FAs, and others.
High-energy collision-induced dissociation (HCD) is known to aid fragmentation of glycerophospholipid species [334]. An LC-MS-based untargeted lipidomics method was developed using high-resolution mass spectrometry with HCD fragmentation to yield both quantitative and structural information of hundreds of lipid molecules in rat liver mitochondria [335]. This general approach relies on the availability of accurate masses of compounds and fragmentation patterns in annotation systems such as the Metlin database [336], HMDB [56], and the LIPID MAPS database [337] for molecular identification. Phospholipid profiling using untargeted lipidomics can be an orthogonal validation tool for targeted lipid peroxidation studies given the fact that the degree of unsaturation in the fatty acyl group represents susceptibility to ROS attack.
19.5. Mass Spectrometry Analysis of DNA Oxidation
DNA oxidation is an inevitable consequence of cellular metabolism, and the endogenous level of most common DNA oxidation products in mammalian cells was estimated to at least 50,000 lesions [338].
The broad relevance of oxidative DNA damage in disease development remains to be elucidated, but it is clear that one of the consequences of DNA oxidation is mutagenesis [339]. This is supported by clinical evidence of increased oxidative DNA lesions in tumors. DNA mutations and genomic instability are crucial to carcinogenesis [340], and oxidative DNA damage is implicated in the etiology of cancer.
The process of DNA oxidation is triggered mainly by ROS such as 1O2,·OH, hypochlorous acid, and ten-eleven translocation (TET) oxygenases involved in epigenetic regulation [341]. Although a large number of oxidatively damaged base lesions were identified in experimental models (~100) [342], the number of lesions detected in clinical specimens is much lower. This is likely due to both their low natural abundance as well as limitations of current analytical platforms. Also, the measurement of these species is often limited by the instability of certain oxidation products such as hydroperoxides and is overwhelmed by nucleic acids undergoing artefactual oxidation during the course of extraction.
Recent advances in LC-MS/MS technology allow identification and quantification of a significantly large number of oxidation products within a reasonable amount of analytical time. MS-based assays have replaced now many conventional assays including immunoassays and are considered the industrial gold standard for compound analysis, especially at very low levels. This section presents the most frequently used MS-based analytical strategies for the determination of DNA oxidation in various biological specimens.
Guanine is known to be readily oxidized due to its lowest redox potential of the four DNA bases. 8-oxo-dG is the most abundant oxidized DNA lesion and a representative DNA oxidation marker (Fig. 19.8). Early measurements for oxidized DNA bases employed SPE enrichment and GC separation with single MS detection. 8-oxo-dG was measured in human urine by GC-MS with a limit-of-detection of 2.5 pmol/mL [343]. 8-oxo-dG was also measured by LC-MS with SIM, and the result was compared with GC-MS analysis [344]. In this study, LC-MS with SIM was superior to GC-MS and well suited for sensitive and accurate measurement of 8-oxo-dG. Five lesions per million DNA bases were identified with as low as 2 μg of DNA. Thus, LC-ESI-MS can provide the throughput and sensitivity needed for analysis of clinical samples and limits artefactual oxidation associated with prolonged sample preparation for GC-MS analysis.
Along with 8-oxo-dG, adenosine oxidation product 8-oxo-2′-deoxyadenosine (8-oxo-dA) was also measured by LC-MS with MRM [345]. Observation of both precursor ions and their specific product ions enabled highly selective and sensitive quantification separating the signals of the two oxidation products. An LC-ESI-MS method has also been reported to quantify the nucleoside forms resulting from deamination and oxidation [346]. This assay targets 2′-deoxyuridine, 2′-deoxyxanthosine, and 2′-deoxyinosine resulting from nitrosative deamination, 8-oxo-dG from oxidation, in addition to 1,N2-etheno-2′-deoxyguanosine, 1,N6-etheno-2′-deoxyadenosine, and 3,N4-etheno-2′-deoxycytidine arising from reactions of DNA with lipid peroxidation products. The purpose of this study was to better understand inflammation-induced DNA damage by measuring a series of DNA damage products reflecting the range of chemistries associated with inflammation.
Tremendous efforts have been given to developing analytical methods to selectively detect oxidation products in clinical specimens. However, the sensitivity of MS remains to be improved to measure clinical samples directly. Many studies reporting new methods were performed using commercially available calf-DNA with chemically induced oxidation to mimic certain redox states, but when it comes to analysis of actual clinical specimens, only a minimal amount of DNA may be available. Thus, technologies need to be improved and workflows optimized for these cases as described below.
One example is the successful quantification of 8-oxo-dG and 8-oxo-dA from human retinal DNA [347]. Mitochondrial DNA damage in retinal pigment epithelium is thought to play a crucial role in age-related macular degeneration. This attempt was challenging because of the very small amount of DNA extracted from the mitochondrial fraction of a tiny tissue. To overcome this limitation, a nanoLC coupled with ESI-MS was employed which was advantageous because it reduced the background signal, thus enhancing the sensitivity.
Oxidation of cytosine derivatives produces various oxidation products (Fig. 19.8), and this event is responsible for the CG to TA transition mutation [348]. To profile cytosine oxidation products, ten oxidized nucleobases including five oxidation products of cytosine were generated by irradiation and Fenton-like reaction of calf thymus DNA. 5-Hydroxyhydantoin, 5-hydroxyuracil, 5-hydroxycytosine, 5,6-dihydroxy-5,6-dihydrouracil, 1-carbamoyl-4,5-dihydroxy-2-oxoimidazolidine were targeted as cytosine modifications. Comparable levels of thymine oxidation products including 5,6-dihydroxy-5,6-dihydrothymine, 5-hydroxy-5-methylhydantotin, 5-(hydroxymethyl)uracil, and 5-formyluracil were also measured along with 8-oxo-dG.
Oxidative DNA damage can also occur as a consequence of PUFAs peroxidation, resulting in α,β-unsaturated aldehyde formation [349]. These secondary lipid peroxidation products are highly reactive to a variety of biomolecules including DNA bases due to their bifunctional electrophilic nature [350]. Urinary heptanone-etheno-dAdo, heptanoneetheno-dCyd, and heptanone-etheno-dGuo secreted after excision repair were measured by LC-ESI-MS [351]. The result suggests that these compounds can be useful urinary biomarkers to identify potential risks for cancer through lipid peroxidation-mediated DNA damage based on the finding that heptanone-etheno-dCyd is highly mutagenic in human cell lines [352].
The lipid peroxidation aldehyde product, MDA, predominantly binds to DNA to form a stable adduct, 3-(2-deoxy-β-d-erythro-pentafuranosyl)pyrimido[1,2-α]purin-10(3H)-one deoxyguanosine (M1dG) [353]. These adducts may contribute to the development of inflammation-mediated diseases such as cancer, cardiovascular and neurodegenerative diseases. An analytical method using nanoLC high-resolution mass spectrometer was developed for measuring M1dG in human leukocytes and was capable of quantifying as little as 0.125 fmol/mg DNA [354].
Validated and accurate methods for the detection and quantitation of DNA oxidation and DNA adducts mediated by lipid peroxidation products in human samples is instrumental in the diagnosis of diseases associated with inflammation and oxidative stress. In this regard, MS-based assays are capable of analyzing various oxidative markers, which helps to elucidate biological processes in the circumstance of redox imbalance.
19.6. Concluding Remarks
Oxidative stress is reflected in DNA damage, lipid peroxidation, protein oxidation, and small molecule redox biomarkers, and in this chapter, we discussed how MS could be applied to measure these oxidative processes. MS has been playing a dominant role as an indispensable analytical tool in elucidating redox biology and paving the way to redox precision medicine. Research using MS has provided insight into the pathogenesis of many redox-related diseases and helped identify biomarkers for early disease detection, therapy prognosis, and treatment monitoring. Due to the high cost of instrumentation and often time-consuming sample preparation of MS-based assays, alternative assays are commonly used with compromised sensitivity and specificity. Nevertheless, we foresee that continued improvements in MS-based technology and methodology will advance this critically important field of research with broad implications in biology and medicine.
Acknowledgments
The authors of this review article are supported by the National Cancer Institute and National Institute of Environmental Health Sciences under award numbers R33 ES025645 (C.M.F., H.W., A.W.T), U01 CA215848 (C.M.F, X.C., A.W.T.), and P30 CA012197 Comprehensive Cancer Center of Wake Forest University NCI CCSG (C.M.F., J.L.).
Abbreviations
- 4-HDTE
4-hydroxydodecatrienal
- 4-HHE
4-hydroxy-2-hexenal
- 4-HNE
4-hydroxy-2-nonenal
- 4-HNDE
4-hydroxynondienal
- 8-oxo-dA
8-oxo-2′-deoxyadenosine
- 8-oxo-dG
8-oxo-2′-deoxyguanosine
- AA
Arachidonic acid
- AhpC
Alkyl hydroperoxide reductase subunit C
- ALA
Alpha-linolenic acid
- APCI
Atmospheric-pressure chemical ionization
- BQB
Bromoacetonylquinolinium bromide
- CAT
Catalase
- CID
Collision-induced dissociation
- COX
Cyclooxygenase
- CYP450
Cytochrome p450
- Cys
Cysteine
- CySS
Cystine
- DCP-NEt2C
DCP-NEt2-Coumarin
- DHA
Docosahexaenoic acid
- DTT
Dithiothreitol
- E+
Ethidium
- EET
Epoxyeicosatrienoic acid
- ELISA
Enzyme-linked immunosorbent assay
- EPA
Eicosapentaenoic acid
- ESI
Electrospray ionization
- FEM
N-(2-ferroceneethyl)maleimide
- FMEA
Ferrocenecarboxylic acid (2-maleimidoyl) ethylamide
- FOX
Ferrous oxidation of xylenol assay
- GC
Gas chromatography
- GPX
Glutathione peroxidase
- GR
Glutathione reductase
- GSH
Glutathione
- GSSG
Oxidized glutathione
- Hb
Hemoglobin
- HCD
High-energy collision-induced dissociation
- Hcy
Homocysteine
- HE
Hydroethidine
- HETE
Hydroxyeicosatetraenoic acid
- HILIC
Hydrophilic interaction chromatography
- HMDB
The Human Metabolome Database
- HODE
Hydroxyoctadecadienoic acid
- HPLC
High-performance liquid chromatography
- HUVEC
Human umbilical vein endothelial cells
- IAA
Iodoacetic acid
- IAM
Iodoacetamide
- ICAT
Isotope-coded affinity tag
- IP
Ion pair
- IPCF
Isopropylchlroformate
- iTRAQ
Isobaric tags for relative and absolute quantitation
- LA
Linoleic acid
- LC
Liquid chromatography
- LDL
Low-density lipoprotein
- LLE
Liquid-liquid extraction
- LOOH
Lipid hydroperoxide
- LOX
Lipoxygenase
- M1dG
3-(2-Deoxy-β-d-erythro-pentafuranosyl) pyrimido[1,2-α]purin-10(3H)-one deoxyguanosine
- MALDI
Matrix assisted laser desorption/ionization
- mBB
Monobromobimane
- MDA
Malondialdehyde
- MDMS-SL
Multi-dimensional MS-based shotgun lipidomics
- Met
Methionine
- MMTS
Methyl ethanethiosulfonate
- MRM
Multiple reaction monitoring
- MS
Mass spectrometry
- MSTP
4-(5-Methanesulfonyl-[1,2,3,4]tetrazol-1-yl)-phenol
- NAD+
Nicotinamide adenine dinucleotide
- NADP+
Nicotinamide adenine dinucleotide phosphate
- NBenzM
N-benzylmaleimide
- NCycloM
N-cyclohexylmaleimide
- ND
Not determined
- NEM
N-ethylmaleimide
- PBMC
Peripheral blood mononuclear cells
- PC
Phosphatidylcholine
- PCA
Perchloric acid
- PE
Phosphatidylethanolamine
- Pro
Proline
- PRX
Peroxiredoxin
- PS
Phosphatidylserine
- PTGS
Prostaglandin endoperoxide synthase
- PUFA
Polyunsaturated fatty acid
- RNS
Reactive nitrogen species
- ROS
Reactive oxygen species
- RP
Reversed-phase
- SIM
Selected ion monitoring
- SOD
Superoxide dismutase
- SPE
Solid-phase extraction
- SSA
5-Sulfosalicylic acid
- TBA
Thiobarbituric acid
- TBARS
Thiobarbituric acid reactive substance
- TCA
Trichloroacetic acid
- TCEP
Tris(2-carboxyethyl)phosphine hydrochloride
- TLC
Thin-layer chromatography
- TMT
Tandem mass tag
- TOF
Time-of-flight
- TRX
Thioredoxin
- Tyr
Tyrosine
Contributor Information
Xiaofei Chen, Department of Internal Medicine, Section on Molecular Medicine, Wake Forest School of Medicine, Winston-Salem, NC, USA.
Jingyun Lee, Department of Internal Medicine, Section on Molecular Medicine, Wake Forest School of Medicine, Winston-Salem, NC, USA; Wake Forest Baptist Comprehensive Cancer Center, Winston-Salem, NC, USA.
Hanzhi Wu, Department of Internal Medicine, Section on Molecular Medicine, Wake Forest School of Medicine, Winston-Salem, NC, USA.
Allen W. Tsang, Department of Internal Medicine, Section on Molecular Medicine, Wake Forest School of Medicine, Winston-Salem, NC, USA Wake Forest Baptist Comprehensive Cancer Center, Winston-Salem, NC, USA; Center for Redox Biology and Medicine, Wake Forest School of Medicine, Winston-Salem, NC, USA.
Cristina M. Furdui, Department of Internal Medicine, Section on Molecular Medicine, Wake Forest School of Medicine, Winston-Salem, NC, USA Wake Forest Baptist Comprehensive Cancer Center, Winston-Salem, NC, USA; Center for Redox Biology and Medicine, Wake Forest School of Medicine, Winston-Salem, NC, USA.
References
- 1.Lyons TW, Reinhard CT, & Planavsky NJ (2014). The rise of oxygen in Earth’s early ocean and atmosphere. Nature, 506(7488), 307–315. [DOI] [PubMed] [Google Scholar]
- 2.Berlett BS, & Stadtman ER (1997). Protein oxidation in aging, disease, and oxidative stress. The Journal of Biological Chemistry, 272(33), 20313–20316. [DOI] [PubMed] [Google Scholar]
- 3.Ahmad S, Khan H, Shahab U, Rehman S, Rafi Z, Khan MY, et al. (2017). Protein oxidation: An overview of metabolism of sulphur containing amino acid, cysteine. Frontiers in Bioscience (Scholar Edition), 9, 71–87. [DOI] [PubMed] [Google Scholar]
- 4.Cecarini V, Gee J, Fioretti E, Amici M, Angeletti M, Eleuteri AM, et al. (2007). Protein oxidation and cellular homeostasis: Emphasis on metabolism. Biochimica et Biophysica Acta, 1773(2), 93–104. [DOI] [PubMed] [Google Scholar]
- 5.Niki E (2016). Oxidative stress and antioxidants: Distress or eustress? Archives of Biochemistry and Biophysics, 595, 19–24. [DOI] [PubMed] [Google Scholar]
- 6.Sies H (2017). Hydrogen peroxide as a central redox signaling molecule in physiological oxidative stress: Oxidative eustress. Redox Biology, 11, 613–619. [DOI] [PMC free article] [PubMed] [Google Scholar]
- 7.Rhee SG (2006). H2O2, a necessary evil for cell signaling. Science, 312(5782), 1882–1883. [DOI] [PubMed] [Google Scholar]
- 8.Reczek CR, & Chandel NS (2015). ROS-dependent signal transduction. Current Opinion in Cell Biology, 33, 8–13. [DOI] [PMC free article] [PubMed] [Google Scholar]
- 9.Schieber M, & Chandel NS (2014). ROS function in redox signaling and oxidative stress. Current Biology, 24(10), R453–R462. [DOI] [PMC free article] [PubMed] [Google Scholar]
- 10.Devarie-Baez NO, Silva Lopez EI, & Furdui CM (2016). Biological chemistry and functionality of protein sulfenic acids and related thiol modifications. Free Radical Research, 50(2), 172–194. [DOI] [PMC free article] [PubMed] [Google Scholar]
- 11.Gupta V, Paritala H, & Carroll KS (2016). Reactivity, selectivity, and stability in sulfenic acid detection: A comparative study of nucleophilic and electrophilic probes. Bioconjugate Chemistry, 27(5), 1411–1418. [DOI] [PMC free article] [PubMed] [Google Scholar]
- 12.Gupta V, & Carroll KS (2016). Profiling the reactivity of cyclic C-nucleophiles towards electrophilic sulfur in cysteine sulfenic acid. Chemical Science, 7(1), 400–415. [DOI] [PMC free article] [PubMed] [Google Scholar]
- 13.Winterbourn CC, & Hampton MB (2008). Thiol chemistry and specificity in redox signaling. Free Radical Biology & Medicine, 45(5), 549–561. [DOI] [PubMed] [Google Scholar]
- 14.Poole LB, Karplus PA, & Claiborne A (2004). Protein sulfenic acids in redox signaling. Annual Review of Pharmacology and Toxicology, 44, 325–347. [DOI] [PubMed] [Google Scholar]
- 15.Jonsson TJ, Tsang AW, Lowther WT, & Furdui CM (2008). Identification of intact protein thiosulfinate intermediate in the reduction of cysteine sulfinic acid in peroxiredoxin by human sulfiredoxin. The Journal of Biological Chemistry, 283(34), 22890–22894. [DOI] [PMC free article] [PubMed] [Google Scholar]
- 16.Biteau B, Labarre J, & Toledano MB (2003). ATP-dependent reduction of cysteine-sulphinic acid by S. cerevisiae sulphiredoxin. Nature, 425(6961), 980–984. [DOI] [PubMed] [Google Scholar]
- 17.Akter S, Fu L, Jung Y, Conte ML, Lawson JR, Lowther WT, et al. (2018). Chemical proteomics reveals new targets of cysteine sulfinic acid reductase. Nature Chemical Biology, 14(11), 995–1004. [DOI] [PMC free article] [PubMed] [Google Scholar]
- 18.Berndt C, Lillig CH, & Flohe L (2014). Redox regulation by glutathione needs enzymes. Frontiers in Pharmacology, 5, 168. [DOI] [PMC free article] [PubMed] [Google Scholar]
- 19.Diaz A, Loewen PC, Fita I, & Carpena X (2012). Thirty years of heme catalases structural biology. Archives of Biochemistry and Biophysics, 525(2), 102–110. [DOI] [PubMed] [Google Scholar]
- 20.Alfonso-Prieto M, Vidossich P, & Rovira C (2012). The reaction mechanisms of heme catalases: An atomistic view by ab initio molecular dynamics. Archives of Biochemistry and Biophysics, 525(2), 121–130. [DOI] [PubMed] [Google Scholar]
- 21.Peskin AV, Low FM, Paton LN, Maghzal GJ, Hampton MB, & Winterbourn CC (2007). The high reactivity of peroxiredoxin 2 with H2O2 is not reflected in its reaction with other oxidants and thiol reagents. The Journal of Biological Chemistry, 282(16), 11885–11892. [DOI] [PubMed] [Google Scholar]
- 22.Perkins A, Nelson KJ, Parsonage D, Poole LB, & Karplus PA (2015). Peroxiredoxins: Guardians against oxidative stress and modulators of peroxide signaling. Trends in Biochemical Sciences, 40(8), 435–445. [DOI] [PMC free article] [PubMed] [Google Scholar]
- 23.Berndt C, Lillig CH, & Holmgren A (2007). Thiol-based mechanisms of the thioredoxin and glutaredoxin systems: Implications for diseases in the cardiovascular system. American Journal of Physiology. Heart and Circulatory Physiology, 292(3), H1227–H1236. [DOI] [PubMed] [Google Scholar]
- 24.Couto N, Wood J, & Barber J (2016). The role of glutathione reductase and related enzymes on cellular redox homoeostasis network. Free Radical Biology & Medicine, 95, 27–42. [DOI] [PubMed] [Google Scholar]
- 25.Jones DP (2006). Redefining oxidative stress. Antioxidants & Redox Signaling, 8(9–10), 1865–1879. [DOI] [PubMed] [Google Scholar]
- 26.Brion LP, Bell EF, & Raghuveer TS (2003). Vitamin E supplementation for prevention of morbidity and mortality in preterm infants. Cochrane Database of Systematic Reviews, (4), CD003665. [DOI] [PMC free article] [PubMed] [Google Scholar]
- 27.Fishbane S, Durham JH, Marzo K, & Rudnick M (2004). N-acetylcysteine in the prevention of radiocontrast-induced nephropathy. Journal of the American Society of Nephrology, 15(2), 251–260. [DOI] [PubMed] [Google Scholar]
- 28.Goodman GE, Thornquist MD, Balmes J, Cullen MR, Meyskens FL Jr., Omenn GS, et al. (2004). The beta-carotene and retinol efficacy trial: Incidence of lung cancer and cardiovascular disease mortality during 6-year follow-up after stopping beta-carotene and retinol supplements. Journal of the National Cancer Institute, 96(23), 1743–1750. [DOI] [PubMed] [Google Scholar]
- 29.Lonn E, Bosch J, Yusuf S, Sheridan P, Pogue J, Arnold JM, et al. (2005). Effects of long-term vitamin E supplementation on cardiovascular events and cancer: A randomized controlled trial. JAMA, 293(11), 1338–1347. [DOI] [PubMed] [Google Scholar]
- 30.Omenn GS, Goodman GE, Thornquist MD, Balmes J, Cullen MR, Glass A, et al. (1996). Risk factors for lung cancer and for intervention effects in CARET, the beta-carotene and retinol efficacy trial. Journal of the National Cancer Institute, 88(21), 1550–1559. [DOI] [PubMed] [Google Scholar]
- 31.Khaw KT, Bingham S, Welch A, Luben R, Wareham N, Oakes S, et al. (2001). Relation between plasma ascorbic acid and mortality in men and women in EPIC-Norfolk prospective study: A prospective population study. European Prospective Investigation into Cancer and Nutrition. Lancet, 357(9257), 657–663. [DOI] [PubMed] [Google Scholar]
- 32.Burr M, Appleby P, Key T, & Thorogood M (2001). Plasma ascorbic acid and risk of heart disease and cancer. Lancet, 357(9274), 2135–2136. [DOI] [PubMed] [Google Scholar]
- 33.Klein EA, Thompson IM Jr., Tangen CM, Crowley JJ, Lucia MS, Goodman PJ, et al. (2011). Vitamin E and the risk of prostate cancer: The Selenium and Vitamin E Cancer Prevention Trial (SELECT). JAMA, 306(14), 1549–1556. [DOI] [PMC free article] [PubMed] [Google Scholar]
- 34.Giustarini D, Dalle-Donne I, Tsikas D, & Rossi R (2009). Oxidative stress and human diseases: Origin, link, measurement, mechanisms, and biomarkers. Critical Reviews in Clinical Laboratory Sciences, 46(5–6), 241–281. [DOI] [PubMed] [Google Scholar]
- 35.Jones DP, Mody VC Jr., Carlson JL, Lynn MJ, & Sternberg P Jr. (2002). Redox analysis of human plasma allows separation of pro-oxidant events of aging from decline in antioxidant defenses. Free Radical Biology & Medicine, 33(9), 1290–1300. [DOI] [PubMed] [Google Scholar]
- 36.Samiec PS, Drews-Botsch C, Flagg EW, Kurtz JC, Sternberg P Jr., Reed RL, et al. (1998). Glutathione in human plasma: Decline in association with aging, age-related macular degeneration, and diabetes. Free Radical Biology & Medicine, 24(5), 699–704. [DOI] [PubMed] [Google Scholar]
- 37.Ashfaq S, Abramson JL, Jones DP, Rhodes SD, Weintraub WS, Hooper WC, et al. (2006). The relationship between plasma levels of oxidized and reduced thiols and early atherosclerosis in healthy adults. Journal of the American College of Cardiology, 47(5), 1005–1011. [DOI] [PubMed] [Google Scholar]
- 38.Tietze F (1969). Enzymic method for quantitative determination of nanogram amounts of total and oxidized glutathione: Applications to mammalian blood and other tissues. Analytical Biochemistry, 27(3), 502–522. [DOI] [PubMed] [Google Scholar]
- 39.Gutscher M, Pauleau AL, Marty L, Brach T, Wabnitz GH, Samstag Y, et al. (2008). Real-time imaging of the intracellular glutathione redox potential. Nature Methods, 5(6), 553–559. [DOI] [PubMed] [Google Scholar]
- 40.Rossi R, Milzani A, Dalle-Donne I, Giustarini D, Lusini L, Colombo R, et al. (2002). Blood glutathione disulfide: In vivo factor or in vitro artifact? Clinical Chemistry, 48(5), 742–753. [PubMed] [Google Scholar]
- 41.Giustarini D, Tsikas D, Colombo G, Milzani A, Dalle-Donne I, Fanti P, et al. (2016). Pitfalls in the analysis of the physiological antioxidant glutathione (GSH) and its disulfide (GSSG) in biological samples: An elephant in the room. Journal of Chromatography. B, Analytical Technologies in the Biomedical and Life Sciences, 1019, 21–28. [DOI] [PMC free article] [PubMed] [Google Scholar]
- 42.Giustarini D, Dalle-Donne I, Colombo R, Milzani A, & Rossi R (2004). Interference of plasmatic reduced glutathione and hemolysis on glutathione disulfide levels in human blood. Free Radical Research, 38(10), 1101–1106. [DOI] [PubMed] [Google Scholar]
- 43.Jones DP, Carlson JL, Samiec PS, Sternberg P Jr., Mody VC Jr., Reed RL, et al. (1998). Glutathione measurement in human plasma. Evaluation of sample collection, storage and derivatization conditions for analysis of dansyl derivatives by HPLC. Clinica Chimica Acta, 275(2), 175–184. [DOI] [PubMed] [Google Scholar]
- 44.Jones DP, & Liang Y (2009). Measuring the poise of thiol/disulfide couples in vivo. Free Radical Biology & Medicine, 47(10), 1329–1338. [DOI] [PMC free article] [PubMed] [Google Scholar]
- 45.Lash LH, & Jones DP (1985). Distribution of oxidized and reduced forms of glutathione and cysteine in rat plasma. Archives of Biochemistry and Biophysics, 240(2), 583–592. [DOI] [PubMed] [Google Scholar]
- 46.Sutton TR, Minnion M, Barbarino F, Koster G, Fernandez BO, Cumpstey AF, et al. (2018). A robust and versatile mass spectrometry platform for comprehensive assessment of the thiol redox metabolome. Redox Biology, 16, 359–380. [DOI] [PMC free article] [PubMed] [Google Scholar]
- 47.Giustarini D, Dalle-Donne I, Milzani A, Fanti P, & Rossi R (2013). Analysis of GSH and GSSG after derivatization with N-ethylmaleimide. Nature Protocols, 8(9), 1660–1669. [DOI] [PubMed] [Google Scholar]
- 48.D’Agostino LA, Lam KP, Lee R, & Britz-McKibbin P (2011). Comprehensive plasma thiol redox status determination for metabolomics. Journal of Proteome Research, 10(2), 592–603. [DOI] [PubMed] [Google Scholar]
- 49.Lee SG, Yim J, Lim Y, & Kim JH (2016). Validation of a liquid chromatography tandem mass spectrometry method to measure oxidized and reduced forms of glutathione in whole blood and verification in a mouse model as an indicator of oxidative stress. Journal of Chromatography. B, Analytical Technologies in the Biomedical and Life Sciences, 1019, 45–50. [DOI] [PubMed] [Google Scholar]
- 50.Cao L, Waldon D, Teffera Y, Roberts J, Wells M, Langley M, et al. (2013). Ratios of biliary glutathione disulfide (GSSG) to glutathione (GSH): A potential index to screen drug-induced hepatic oxidative stress in rats and mice. Analytical and Bioanalytical Chemistry, 405(8), 2635–2642. [DOI] [PubMed] [Google Scholar]
- 51.Steghens JP, Flourie F, Arab K, & Collombel C (2003). Fast liquid chromatography-mass spectrometry glutathione measurement in whole blood: Micromolar GSSG is a sample preparation artifact. Journal of Chromatography. B, Analytical Technologies in the Biomedical and Life Sciences, 798(2), 343–349. [DOI] [PubMed] [Google Scholar]
- 52.Squellerio I, Caruso D, Porro B, Veglia F, Tremoli E, & Cavalca V (2012). Direct glutathione quantification in human blood by LC-MS/MS: Comparison with HPLC with electrochemical detection. Journal of Pharmaceutical and Biomedical Analysis, 71, 111–118. [DOI] [PubMed] [Google Scholar]
- 53.Huang YQ, Ruan GD, Liu JQ, Gao Q, & Feng YQ (2011). Use of isotope differential derivatization for simultaneous determination of thiols and oxidized thiols by liquid chromatography tandem mass spectrometry. Analytical Biochemistry, 416(2), 159–166. [DOI] [PubMed] [Google Scholar]
- 54.Norris RL, Paul M, George R, Moore A, Pinkerton R, Haywood A, et al. (2012). A stable-isotope HPLC-MS/MS method to simplify storage of human whole blood samples for glutathione assay. Journal of Chromatography. B, Analytical Technologies in the Biomedical and Life Sciences, 898, 136–140. [DOI] [PubMed] [Google Scholar]
- 55.Stempak D, Dallas S, Klein J, Bendayan R, Koren G, & Baruchel S (2001). Glutathione stability in whole blood: Effects of various deproteinizing acids. Therapeutic Drug Monitoring, 23(5), 542–549. [DOI] [PubMed] [Google Scholar]
- 56.Wishart DS, Feunang YD, Marcu A, Guo AC, Liang K, Vazquez-Fresno R, et al. (2018). HMDB 4.0: The human metabolome database for 2018. Nucleic Acids Research, 46(D1), D608–DD17. [DOI] [PMC free article] [PubMed] [Google Scholar]
- 57.Tsikas D, Hanff E, Kayacelebi AA, & Bohmer A (2016). Gas chromatographic-mass spectrometric analysis of the tripeptide glutathione in the electron-capture negative-ion chemical ionization mode. Amino Acids, 48(2), 593–598. [DOI] [PubMed] [Google Scholar]
- 58.Lyons J, Rauh-Pfeiffer A, Yu YM, Lu XM, Zurakowski D, Tompkins RG, et al. (2000). Blood glutathione synthesis rates in healthy adults receiving a sulfur amino acid-free diet. Proceedings of the National Academy of Sciences of the United States of America, 97(10), 5071–5076. [DOI] [PMC free article] [PubMed] [Google Scholar]
- 59.Capitan P, Malmezat T, Breuille D, & Obled C (1999). Gas chromatographic-mass spectrometric analysis of stable isotopes of cysteine and glutathione in biological samples. Journal of Chromatography. B, Biomedical Sciences and Applications, 732(1), 127–135. [DOI] [PubMed] [Google Scholar]
- 60.Kuster A, Tea I, Sweeten S, Roze JC, Robins RJ, & Darmaun D (2008). Simultaneous determination of glutathione and cysteine concentrations and 2H enrichments in microvolumes of neonatal blood using gas chromatography-mass spectrometry. Analytical and Bioanalytical Chemistry, 390(5), 1403–1412. [DOI] [PubMed] [Google Scholar]
- 61.Humbert B, Nguyen P, Obled C, Bobin C, Vaslin A, Sweeten S, et al. (2001). Use of L-15N glutamic acid and homoglutathione to determine both glutathione synthesis and concentration by gas chromatography-mass spectrometry (GCMS). Journal of Mass Spectrometry, 36(7), 726–735. [DOI] [PubMed] [Google Scholar]
- 62.Tea I, Ferchaud-Roucher V, Kuster A, Darmaun D, & Robins RJ (2007). Determination of 13C isotopic enrichment of glutathione and glycine by gas chromatography/combustion/isotope ratio mass spectrometry after formation of the N- or N,S-ethoxycarbonyl methyl ester derivatives. Rapid Communications in Mass Spectrometry, 21(20), 3245–3252. [DOI] [PubMed] [Google Scholar]
- 63.He T, Quinn D, Fu E, & Wang YK (1999). Analysis of diagnostic metabolites by capillary electrophoresis-mass spectrometry. Journal of Chromatography. B, Biomedical Sciences and Applications, 727(1–2), 43–52. [DOI] [PubMed] [Google Scholar]
- 64.Gong ZH, Tian GL, Huang QW, Wang YM, & Xu HP (2017). Reduced glutathione and glutathione disulfide in the blood of glucose-6-phosphate dehydrogenase-deficient newborns. BMC Pediatrics, 17(1), 172. [DOI] [PMC free article] [PubMed] [Google Scholar]
- 65.Nazari M, Bokhart MT, Loziuk PL, & Muddiman DC (2018). Quantitative mass spectrometry imaging of glutathione in healthy and cancerous hen ovarian tissue sections by infrared matrix-assisted laser desorption electrospray ionization (IR-MALDESI). Analyst, 143(3), 654–661. [DOI] [PMC free article] [PubMed] [Google Scholar]
- 66.Moore T, Le A, Niemi AK, Kwan T, Cusmano-Ozog K, Enns GM, et al. (2013). A new LC-MS/MS method for the clinical determination of reduced and oxidized glutathione from whole blood. Journal of Chromatography. B, Analytical Technologies in the Biomedical and Life Sciences, 929, 51–55. [DOI] [PubMed] [Google Scholar]
- 67.Suh JH, Kim R, Yavuz B, Lee D, Lal A, Ames BN, et al. (2009). Clinical assay of four thiol amino acid redox couples by LC-MS/MS: Utility in thalassemia. Journal of Chromatography. B, Analytical Technologies in the Biomedical and Life Sciences, 877(28), 3418–3427. [DOI] [PMC free article] [PubMed] [Google Scholar]
- 68.Reinbold J, Koehler P, & Rychlik M (2014). Quantitation of glutathione and its oxidation products in erythrocytes by multiple-label stable-isotope dilution. Analytical Biochemistry, 445, 41–48. [DOI] [PubMed] [Google Scholar]
- 69.Fahrenholz T, Wolle MM, Kingston HM, Faber S, Kern JC II, Pamuku M, et al. (2015). Molecular speciated isotope dilution mass spectrometric methods for accurate, reproducible and direct quantification of reduced, oxidized and total glutathione in biological samples. Analytical Chemistry, 87(2), 1232–1240. [DOI] [PubMed] [Google Scholar]
- 70.Harwood DT, Kettle AJ, Brennan S, & Winterbourn CC (2009). Simultaneous determination of reduced glutathione, glutathione disulphide and glutathione sulphonamide in cells and physiological fluids by isotope dilution liquid chromatography-tandem mass spectrometry. Journal of Chromatography. B, Analytical Technologies in the Biomedical and Life Sciences, 877(28), 3393–3399. [DOI] [PubMed] [Google Scholar]
- 71.Jiang Z, Liang Q, Luo G, Hu P, Li P, & Wang Y (2009). HPLC-electrospray tandem mass spectrometry for simultaneous quantitation of eight plasma aminothiols: Application to studies of diabetic nephropathy. Talanta, 77(4), 1279–1284. [DOI] [PubMed] [Google Scholar]
- 72.Camera E, Rinaldi M, Briganti S, Picardo M, & Fanali S (2001). Simultaneous determination of reduced and oxidized glutathione in peripheral blood mononuclear cells by liquid chromatography-electrospray mass spectrometry. Journal of Chromatography. B, Biomedical Sciences and Applications, 757(1), 69–78. [DOI] [PubMed] [Google Scholar]
- 73.Seiwert B, & Karst U (2007). Simultaneous LC/MS/MS determination of thiols and disulfides in urine samples based on differential labeling with ferrocene-based maleimides. Analytical Chemistry, 79(18), 7131–7138. [DOI] [PubMed] [Google Scholar]
- 74.Robin S, Leveque N, Courderot-Masuyer C, & Humbert P (2011). LC-MS determination of oxidized and reduced glutathione in human dermis: A microdialysis study. Journal of Chromatography. B, Analytical Technologies in the Biomedical and Life Sciences, 879(30), 3599–3606. [DOI] [PubMed] [Google Scholar]
- 75.Iwasaki Y, Nakano Y, Mochizuki K, Ogawa T, Oda M, Ito R, et al. (2011). Quantification of reduced and oxidized thiols in mouse serum by column-switching hydrophilic interaction chromatography coupled with mass spectrometry. Journal of Pharmaceutical and Biomedical Analysis, 56(1), 103–113. [DOI] [PubMed] [Google Scholar]
- 76.Bouligand J, Deroussent A, Paci A, Morizet J, & Vassal G (2006). Liquid chromatography-tandem mass spectrometry assay of reduced and oxidized glutathione and main precursors in mice liver. Journal of Chromatography. B, Analytical Technologies in the Biomedical and Life Sciences, 832(1), 67–74. [DOI] [PubMed] [Google Scholar]
- 77.Norris RL, Eaglesham GK, Shaw GR, Smith MJ, Chiswell RK, Seawright AA, et al. (2001). A sensitive and specific assay for glutathione with potential application to glutathione disulphide, using high-performance liquid chromatography-tandem mass spectrometry. Journal of Chromatography. B, Biomedical Sciences and Applications, 762(1), 17–23. [DOI] [PubMed] [Google Scholar]
- 78.Zhang F, Bartels MJ, Geter DR, Jeong YC, Schisler MR, Wood AJ, et al. (2008). Quantitation of glutathione by liquid chromatography/positive electrospray ionization tandem mass spectrometry. Rapid Communications in Mass Spectrometry, 22(22), 3608–3614. [DOI] [PubMed] [Google Scholar]
- 79.Loughlin AF, Skiles GL, Alberts DW, & Schaefer WH (2001). An ion exchange liquid chromatography/mass spectrometry method for the determination of reduced and oxidized glutathione and glutathione conjugates in hepatocytes. Journal of Pharmaceutical and Biomedical Analysis, 26(1), 131–142. [DOI] [PubMed] [Google Scholar]
- 80.Guan X, Hoffman B, Dwivedi C, & Matthees DP (2003). A simultaneous liquid chromatography/mass spectrometric assay of glutathione, cysteine, homocysteine and their disulfides in biological samples. Journal of Pharmaceutical and Biomedical Analysis, 31(2), 251–261. [DOI] [PubMed] [Google Scholar]
- 81.Banerjee R (2017). Catalytic promiscuity and heme-dependent redox regulation of H2S synthesis. Current Opinion in Chemical Biology, 37, 115–121. [DOI] [PMC free article] [PubMed] [Google Scholar]
- 82.Cuevasanta E, Moller MN, & Alvarez B (2017). Biological chemistry of hydrogen sulfide and persulfides. Archives of Biochemistry and Biophysics, 617, 9–25. [DOI] [PubMed] [Google Scholar]
- 83.Klomsiri C, Karplus PA, & Poole LB (2011). Cysteine-based redox switches in enzymes. Antioxidants & Redox Signaling, 14(6), 1065–1077. [DOI] [PMC free article] [PubMed] [Google Scholar]
- 84.Poole LB (2015). The basics of thiols and cysteines in redox biology and chemistry. Free Radical Biology & Medicine, 80, 148–157. [DOI] [PMC free article] [PubMed] [Google Scholar]
- 85.Jacob N, Bruckert E, Giral P, Foglietti MJ, & Turpin G (1999). Cysteine is a cardiovascular risk factor in hyperlipidemic patients. Atherosclerosis, 146(1), 53–59. [DOI] [PubMed] [Google Scholar]
- 86.Ozkan Y, Ozkan E, & Simsek B (2002). Plasma total homocysteine and cysteine levels as cardiovascular risk factors in coronary heart disease. International Journal of Cardiology, 82(3), 269–277. [DOI] [PubMed] [Google Scholar]
- 87.Go YM, & Jones DP (2017). Redox theory of aging: Implications for health and disease. Clinical Science (London, England), 131(14), 1669–1688. [DOI] [PMC free article] [PubMed] [Google Scholar]
- 88.Go YM, & Jones DP (2011). Cysteine/cystine redox signaling in cardiovascular disease. Free Radical Biology & Medicine, 50(4), 495–509. [DOI] [PMC free article] [PubMed] [Google Scholar]
- 89.Patel RS, Ghasemzadeh N, Eapen DJ, Sher S, Arshad S, Ko YA, et al. (2016). Novel biomarker of oxidative stress is associated with risk of death in patients with coronary artery disease. Circulation, 133(4), 361–369. [DOI] [PMC free article] [PubMed] [Google Scholar]
- 90.Wear JE, & Keevil BG (2005). Measurement of cystine in urine by liquid chromatography-tandem mass spectrometry. Clinical Chemistry, 51(4), 787–789. [DOI] [PubMed] [Google Scholar]
- 91.Johnson JM, Strobel FH, Reed M, Pohl J, & Jones DP (2008). A rapid LC-FTMS method for the analysis of cysteine, cystine and cysteine/cystine steady-state redox potential in human plasma. Clinica Chimica Acta, 396(1–2), 43–48. [DOI] [PMC free article] [PubMed] [Google Scholar]
- 92.Rafii M, Elango R, Courtney-Martin G, House JD, Fisher L, & Pencharz PB (2007). High-throughput and simultaneous measurement of homocysteine and cysteine in human plasma and urine by liquid chromatography-electrospray tandem mass spectrometry. Analytical Biochemistry, 371(1), 71–81. [DOI] [PubMed] [Google Scholar]
- 93.Weaving G, Rocks BF, Iversen SA, & Titheradge MA (2006). Simultaneous quantitation of homocysteine, cysteine and methionine in plasma and urine by liquid chromatography-tandem mass spectrometry. Annals of Clinical Biochemistry, 43(Pt 6), 474–480. [DOI] [PubMed] [Google Scholar]
- 94.Myung SW, Kim M, Min HK, Yoo EA, & Kim KR (1999). Determination of homocysteine and its related compounds by solid-phase microextraction-gas chromatography-mass spectrometry. Journal of Chromatography. B, Biomedical Sciences and Applications, 727(1–2), 1–8. [DOI] [PubMed] [Google Scholar]
- 95.Lafaye A, Labarre J, Tabet JC, Ezan E, & Junot C (2005). Liquid chromatography-mass spectrometry and 15N metabolic labeling for quantitative metabolic profiling. Analytical Chemistry, 77(7), 2026–2033. [DOI] [PubMed] [Google Scholar]
- 96.Ortmayr K, Schwaiger M, Hann S, & Koellensperger G (2015). An integrated metabolomics workflow for the quantification of sulfur pathway intermediates employing thiol protection with N-ethyl maleimide and hydrophilic interaction liquid chromatography tandem mass spectrometry. Analyst, 140(22), 7687–7695. [DOI] [PubMed] [Google Scholar]
- 97.Berger F, Ramirez-Hernandez MH, & Ziegler M (2004). The new life of a centenarian: Signalling functions of NAD(P). Trends in Biochemical Sciences, 29(3), 111–118. [DOI] [PubMed] [Google Scholar]
- 98.Belenky P, Bogan KL, & Brenner C (2007). NAD+ metabolism in health and disease. Trends in Biochemical Sciences, 32(1), 12–19. [DOI] [PubMed] [Google Scholar]
- 99.Houtkooper RH, Canto C, Wanders RJ, & Auwerx J (2010). The secret life of NAD+: An old metabolite controlling new metabolic signaling pathways. Endocrine Reviews, 31(2), 194–223. [DOI] [PMC free article] [PubMed] [Google Scholar]
- 100.Ying W (2008). NAD+/NADH and NADP+/NADPH in cellular functions and cell death: Regulation and biological consequences. Antioxidants & Redox Signaling, 10(2), 179–206. [DOI] [PubMed] [Google Scholar]
- 101.Kirkman HN, Rolfo M, Ferraris AM, & Gaetani GF (1999). Mechanisms of protection of catalase by NADPH. Kinetics and stoichiometry. The Journal of Biological Chemistry, 274(20), 13908–13914. [DOI] [PubMed] [Google Scholar]
- 102.Bedard K, & Krause KH (2007). The NOX family of ROS-generating NADPH oxidases: Physiology and pathophysiology. Physiological Reviews, 87(1), 245–313. [DOI] [PubMed] [Google Scholar]
- 103.Ushio-Fukai M (2006). Localizing NADPH oxidase-derived ROS. Science’s STKE, 2006(349), re8. [DOI] [PubMed] [Google Scholar]
- 104.Ido Y (2007). Pyridine nucleotide redox abnormalities in diabetes. Antioxidants & Redox Signaling, 9(7), 931–942. [DOI] [PubMed] [Google Scholar]
- 105.Verdin E (2015). NAD+ in aging, metabolism, and neurodegeneration. Science, 350(6265), 1208–1213. [DOI] [PubMed] [Google Scholar]
- 106.Lin SJ, & Guarente L (2003). Nicotinamide adenine dinucleotide, a metabolic regulator of transcription, longevity and disease. Current Opinion in Cell Biology, 15(2), 241–246. [DOI] [PubMed] [Google Scholar]
- 107.Blacker TS, & Duchen MR (2016). Investigating mitochondrial redox state using NADH and NADPH autofluorescence. Free Radical Biology & Medicine, 100, 53–65. [DOI] [PMC free article] [PubMed] [Google Scholar]
- 108.Zhao Y, Jin J, Hu Q, Zhou HM, Yi J, Yu Z, et al. (2011). Genetically encoded fluorescent sensors for intracellular NADH detection. Cell Metabolism, 14(4), 555–566. [DOI] [PMC free article] [PubMed] [Google Scholar]
- 109.Hung YP, Albeck JG, Tantama M, & Yellen G (2011). Imaging cytosolic NADH-NAD+ redox state with a genetically encoded fluorescent biosensor. Cell Metabolism, 14(4), 545–554. [DOI] [PMC free article] [PubMed] [Google Scholar]
- 110.Gowda GAN (2018). Profiling redox and energy coenzymes in whole blood, tissue and cells using NMR spectroscopy. Metabolites, 8(2). [DOI] [PMC free article] [PubMed] [Google Scholar]
- 111.Nagana Gowda GA, Abell L, Lee CF, Tian R, & Raftery D (2016). Simultaneous analysis of major coenzymes of cellular redox reactions and energy using ex vivo 1H NMR spectroscopy. Analytical Chemistry, 88(9), 4817–4824. [DOI] [PMC free article] [PubMed] [Google Scholar]
- 112.Ogasawara Y, Funakoshi M, & Ishii K (2009). Determination of reduced nicotinamide adenine dinucleotide phosphate concentration using high-performance liquid chromatography with fluorescence detection: Ratio of the reduced form as a biomarker of oxidative stress. Biological & Pharmaceutical Bulletin, 32(11), 1819–1823. [DOI] [PubMed] [Google Scholar]
- 113.Sporty JL, Kabir MM, Turteltaub KW, Ognibene T, Lin SJ, & Bench G (2008). Single sample extraction protocol for the quantification of NAD and NADH redox states in Saccharomyces cerevisiae. Journal of Separation Science, 31(18), 3202–3211. [DOI] [PMC free article] [PubMed] [Google Scholar]
- 114.Yoshino J, & Imai S (2013). Accurate measurement of nicotinamide adenine dinucleotide (NAD+) with high-performance liquid chromatography. Methods in Molecular Biology, 1077, 203–215. [DOI] [PMC free article] [PubMed] [Google Scholar]
- 115.Caruso R, Campolo J, Dellanoce C, Mariele R, Parodi O, & Accinni R (2004). Critical study of preanalytical and analytical phases of adenine and pyridine nucleotide assay in human whole blood. Analytical Biochemistry, 330(1), 43–51. [DOI] [PubMed] [Google Scholar]
- 116.Palfi M, Halasz AS, Tabi T, Magyar K, & Szoko E (2004). Application of the measurement of oxidized pyridine dinucleotides with high-performance liquid chromatography-fluorescence detection to assay the uncoupled oxidation of NADPH by neuronal nitric oxide synthase. Analytical Biochemistry, 326(1), 69–77. [DOI] [PubMed] [Google Scholar]
- 117.Lowry OH, Passonneau JV, Schulz DW, & Rock MK (1961). The measurement of pyridine nucleotides by enzymatic cycling. The Journal of Biological Chemistry, 236, 2746–2755. [PubMed] [Google Scholar]
- 118.Graeff R, Lee HC. A novel cycling assay for cellular cADP-ribose with nanomolar sensitivity. The Biochemical Journal 2002;361(Pt 2):379–384. [DOI] [PMC free article] [PubMed] [Google Scholar]
- 119.Vidugiriene J, Leippe D, Sobol M, Vidugiris G, Zhou W, Meisenheimer P, et al. (2014). Bioluminescent cell-based NAD(P)/NAD(P)H assays for rapid dinucleotide measurement and inhibitor screening. Assay and Drug Development Technologies, 12(9–10), 514–526. [DOI] [PMC free article] [PubMed] [Google Scholar]
- 120.Wagner TC, Scott MD. Single extraction method for the spectrophotometric quantification of oxidized and reduced pyridine nucleotides in erythrocytes. Analytical Biochemistry 1994;222(2):417–426. [DOI] [PubMed] [Google Scholar]
- 121.Somogyi AHG, Csala M, & Tóth B (2016). Analytical approaches for the quantitation of redox-active pyridine dinucleotides in biological matrices. Periodica Polytechnica, Chemical Engineering, 60(4), 218–230. [Google Scholar]
- 122.Lu W, Wang L, Chen L, Hui S, & Rabinowitz JD (2018). Extraction and quantitation of nicotinamide adenine dinucleotide redox cofactors. Antioxidants & Redox Signaling, 28(3), 167–179. [DOI] [PMC free article] [PubMed] [Google Scholar]
- 123.Bennette NB, Eng JF, & Dismukes GC (2011). An LC-MS-based chemical and analytical method for targeted metabolite quantification in the model cyanobacterium Synechococcus sp. PCC 7002. Analytical Chemistry, 83(10), 3808–3816. [DOI] [PubMed] [Google Scholar]
- 124.Michopoulos F, Whalley N, Theodoridis G, Wilson ID, Dunkley TP, & Critchlow SE (2014). Targeted profiling of polar intracellular metabolites using ion-pair-high performance liquid chromatography and -ultra high performance liquid chromatography coupled to tandem mass spectrometry: Applications to serum, urine and tissue extracts. Journal of Chromatography. A, 1349, 60–68. [DOI] [PubMed] [Google Scholar]
- 125.Hofmann D, Wirtz A, Santiago-Schubel B, Disko U, & Pohl M (2010). Structure elucidation of the thermal degradation products of the nucleotide cofactors NADH and NADPH by nanoESI-FTICR-MS and HPLC-MS. Analytical and Bioanalytical Chemistry, 398(7–8), 2803–2811. [DOI] [PubMed] [Google Scholar]
- 126.Wu JT, Wu LH, & Knight JA (1986). Stability of NADPH: Effect of various factors on the kinetics of degradation. Clinical Chemistry, 32(2), 314–319. [PubMed] [Google Scholar]
- 127.Luo B, Groenke K, Takors R, Wandrey C, & Oldiges M (2007). Simultaneous determination of multiple intracellular metabolites in glycolysis, pentose phosphate pathway and tricarboxylic acid cycle by liquid chromatography-mass spectrometry. Journal of Chromatography. A, 1147(2), 153–164. [DOI] [PubMed] [Google Scholar]
- 128.Bajad SU, Lu W, Kimball EH, Yuan J, Peterson C, & Rabinowitz JD (2006). Separation and quantitation of water soluble cellular metabolites by hydrophilic interaction chromatography-tandem mass spectrometry. Journal of Chromatography. A, 1125(1), 76–88. [DOI] [PubMed] [Google Scholar]
- 129.Uehara T, Yokoi A, Aoshima K, Tanaka S, Kadowaki T, Tanaka M, et al. (2009). Quantitative phosphorus metabolomics using nanoflow liquid chromatography-tandem mass spectrometry and culture-derived comprehensive global internal standards. Analytical Chemistry, 81(10), 3836–3842. [DOI] [PubMed] [Google Scholar]
- 130.Buescher JM, Moco S, Sauer U, & Zamboni N (2010). Ultrahigh performance liquid chromatography-tandem mass spectrometry method for fast and robust quantification of anionic and aromatic metabolites. Analytical Chemistry, 82(11), 4403–4412. [DOI] [PubMed] [Google Scholar]
- 131.Yang S, Sadilek M, & Lidstrom ME (2010). Streamlined pentafluorophenylpropyl column liquid chromatography-tandem quadrupole mass spectrometry and global 13C-labeled internal standards improve performance for quantitative metabolomics in bacteria. Journal of Chromatography. A, 1217(47), 7401–7410. [DOI] [PMC free article] [PubMed] [Google Scholar]
- 132.Park JO, Rubin SA, Xu YF, Amador-Noguez D, Fan J, Shlomi T, et al. (2016). Metabolite concentrations, fluxes and free energies imply efficient enzyme usage. Nature Chemical Biology, 12(7), 482–489. [DOI] [PMC free article] [PubMed] [Google Scholar]
- 133.Bennett BD, Kimball EH, Gao M, Osterhout R, Van Dien SJ, & Rabinowitz JD (2009). Absolute metabolite concentrations and implied enzyme active site occupancy in Escherichia coli. Nature Chemical Biology, 5(8), 593–599. [DOI] [PMC free article] [PubMed] [Google Scholar]
- 134.Seifar RM, Ras C, Deshmukh AT, Bekers KM, Suarez-Mendez CA, da Cruz AL, et al. (2013). Quantitative analysis of intracellular coenzymes in Saccharomyces cerevisiae using ion pair reversed phase ultra high performance liquid chromatography tandem mass spectrometry. Journal of Chromatography. A, 1311, 115–120. [DOI] [PubMed] [Google Scholar]
- 135.Trammell SA, & Brenner C (2013). Targeted, LCMS-based metabolomics for quantitative measurement of NAD+ metabolites. Computational and Structural Biotechnology Journal, 4, e201301012. [DOI] [PMC free article] [PubMed] [Google Scholar]
- 136.Evans C, Bogan KL, Song P, Burant CF, Kennedy RT, & Brenner C (2010). NAD+ metabolite levels as a function of vitamins and calorie restriction: Evidence for different mechanisms of longevity. BMC Chemical Biology, 10, 2. [DOI] [PMC free article] [PubMed] [Google Scholar]
- 137.Ortmayr K, Nocon J, Gasser B, Mattanovich D, Hann S, & Koellensperger G (2014). Sample preparation workflow for the liquid chromatography tandem mass spectrometry based analysis of nicotinamide adenine dinucleotide phosphate cofactors in yeast. Journal of Separation Science, 37(16), 2185–2191. [DOI] [PubMed] [Google Scholar]
- 138.Fan J, Ye J, Kamphorst JJ, Shlomi T, Thompson CB, & Rabinowitz JD (2014). Quantitative flux analysis reveals folatedependent NADPH production. Nature, 510(7504), 298–302. [DOI] [PMC free article] [PubMed] [Google Scholar]
- 139.Lewis CA, Parker SJ, Fiske BP, McCloskey D, Gui DY, Green CR, et al. (2014). Tracing compartmentalized NADPH metabolism in the cytosol and mitochondria of mammalian cells. Molecular Cell, 55(2), 253–263. [DOI] [PMC free article] [PubMed] [Google Scholar]
- 140.Yamada K, Hara N, Shibata T, Osago H, & Tsuchiya M (2006). The simultaneous measurement of nicotinamide adenine dinucleotide and related compounds by liquid chromatography/electrospray ionization tandem mass spectrometry. Analytical Biochemistry, 352(2), 282–285. [DOI] [PubMed] [Google Scholar]
- 141.Myint KT, Uehara T, Aoshima K, & Oda Y (2009). Polar anionic metabolome analysis by nano-LC/MS with a metal chelating agent. Analytical Chemistry, 81(18), 7766–7772. [DOI] [PubMed] [Google Scholar]
- 142.Cordell RL, Hill SJ, Ortori CA, & Barrett DA (2008). Quantitative profiling of nucleotides and related phosphate-containing metabolites in cultured mammalian cells by liquid chromatography tandem electrospray mass spectrometry. Journal of Chromatography. B, Analytical Technologies in the Biomedical and Life Sciences, 871(1), 115–124. [DOI] [PubMed] [Google Scholar]
- 143.Klawitter J, Schmitz V, Klawitter J, Leibfritz D, & Christians U (2007). Development and validation of an assay for the quantification of 11 nucleotides using LC/LC-electrospray ionization-MS. Analytical Biochemistry, 365(2), 230–239. [DOI] [PubMed] [Google Scholar]
- 144.Trammell SA, Schmidt MS, Weidemann BJ, Redpath P, Jaksch F, Dellinger RW, et al. (2016). Nicotinamide riboside is uniquely and orally bioavailable in mice and humans. Nature Communications, 7, 12948. [DOI] [PMC free article] [PubMed] [Google Scholar]
- 145.Liu L, Cui Z, Deng Y, Dean B, Hop CE, & Liang X (2016). Surrogate analyte approach for quantitation of endogenous NAD+ in human acidified blood samples using liquid chromatography coupled with electrospray ionization tandem mass spectrometry. Journal of Chromatography. B, Analytical Technologies in the Biomedical and Life Sciences, 1011, 69–76. [DOI] [PubMed] [Google Scholar]
- 146.Zhu XH, Lu M, Lee BY, Ugurbil K, & Chen W (2015). In vivo NAD assay reveals the intracellular NAD contents and redox state in healthy human brain and their age dependences. Proceedings of the National Academy of Sciences of the United States of America, 112(9), 2876–2881. [DOI] [PMC free article] [PubMed] [Google Scholar]
- 147.Milne GL, Dai Q, & Roberts LJ II. (2015). The isoprostanes—25 years later. Biochimica et Biophysica Acta, 1851(4), 433–445. [DOI] [PMC free article] [PubMed] [Google Scholar]
- 148.Milne GL, Yin H, Hardy KD, Davies SS, & Roberts LJ II. (2011). Isoprostane generation and function. Chemical Reviews, 111(10), 5973–5996. [DOI] [PMC free article] [PubMed] [Google Scholar]
- 149.Roberts LJ, & Morrow JD (2000). Measurement of F2-isoprostanes as an index of oxidative stress in vivo. Free Radical Biology & Medicine, 28(4), 505–513. [DOI] [PubMed] [Google Scholar]
- 150.Lawson JA, Rokach J, & FitzGerald GA (1999). Isoprostanes: Formation, analysis and use as indices of lipid peroxidation in vivo. The Journal of Biological Chemistry, 274(35), 24441–24444. [DOI] [PubMed] [Google Scholar]
- 151.van’t Erve TJ, Kadiiska MB, London SJ, & Mason RP (2017). Classifying oxidative stress by F2-isoprostane levels across human diseases: A meta-analysis. Redox Biology, 12, 582–599. [DOI] [PMC free article] [PubMed] [Google Scholar]
- 152.Czerska M, Zielinski M, & Gromadzinska J (2016). Isoprostanes - a novel major group of oxidative stress markers. International Journal of Occupational Medicine and Environmental Health, 29(2), 179–190. [DOI] [PubMed] [Google Scholar]
- 153.Cracowski JL, Durand T, & Bessard G (2002). Isoprostanes as a biomarker of lipid peroxidation in humans: Physiology, pharmacology and clinical implications. Trends in Pharmacological Sciences, 23(8), 360–366. [DOI] [PubMed] [Google Scholar]
- 154.Kadiiska MB, Gladen BC, Baird DD, Germolec D, Graham LB, Parker CE, et al. (2005). Biomarkers of oxidative stress study II: Are oxidation products of lipids, proteins, and DNA markers of CCl4 poisoning? Free Radical Biology & Medicine, 38(6), 698–710. [DOI] [PubMed] [Google Scholar]
- 155.Ting HJ, & Khasawneh FT (2010). Platelet function and Isoprostane biology. Should isoprostanes be the newest member of the orphan-ligand family? Journal of Biomedical Science, 17(1), 24. [DOI] [PMC free article] [PubMed] [Google Scholar]
- 156.Longmire AW, Roberts LJ, & Morrow JD (1994). Actions of the E2-isoprostane, 8-ISO-PGE2, on the platelet thromboxane/endoperoxide receptor in humans and rats: Additional evidence for the existence of a unique isoprostane receptor. Prostaglandins, 48(4), 247–256. [DOI] [PubMed] [Google Scholar]
- 157.Morrow JD, Harris TM, & Roberts LJ II. (1990). Noncyclooxygenase oxidative formation of a series of novel prostaglandins: Analytical ramifications for measurement of eicosanoids. Analytical Biochemistry, 184(1), 1–10. [DOI] [PubMed] [Google Scholar]
- 158.Klein T, Reutter F, Schweer H, Seyberth HW, & Nusing RM (1997). Generation of the isoprostane 8-epi-prostaglandin F2alpha in vitro and in vivo via the cyclooxygenases. The Journal of Pharmacology and Experimental Therapeutics, 282(3), 1658–1665. [PubMed] [Google Scholar]
- 159.Pratico D, & FitzGerald GA (1996). Generation of 8-epipros-taglandin F2alpha by human monocytes. Discriminate production by reactive oxygen species and prostaglandin endoperoxide synthase-2. The Journal of Biological Chemistry, 271(15), 8919–8924. [DOI] [PubMed] [Google Scholar]
- 160.Pratico D, Lawson JA, & FitzGerald GA (1995). Cyclooxygenase-dependent formation of the isoprostane, 8-epi prostaglandin F2 alpha. The Journal of Biological Chemistry, 270(17), 9800–9808. [DOI] [PubMed] [Google Scholar]
- 161.van’t Erve TJ, Lih FB, Kadiiska MB, Deterding LJ, Eling TE, & Mason RP (2015). Reinterpreting the best biomarker of oxidative stress: The 8-iso-PGF(2alpha)/PGF(2alpha) ratio distinguishes chemical from enzymatic lipid peroxidation. Free Radical Biology & Medicine, 83, 245–251. [DOI] [PMC free article] [PubMed] [Google Scholar]
- 162.Sasaki DM, Yuan Y, Gikas K, Kanai K, Taber D, Morrow JD, et al. (2002). Enzyme immunoassays for 15-F2T isoprostane-M, an urinary biomarker for oxidant stress. Advances in Experimental Medicine and Biology, 507, 537–541. [DOI] [PubMed] [Google Scholar]
- 163.Basu S (1998). Radioimmunoassay of 8-iso-prostaglandin F2alpha: An index for oxidative injury via free radical catalysed lipid peroxidation. Prostaglandins, Leukotrienes, and Essential Fatty Acids, 58(4), 319–325. [DOI] [PubMed] [Google Scholar]
- 164.Klawitter J, Haschke M, Shokati T, Klawitter J, & Christians U (2011). Quantification of 15-F2t-isoprostane in human plasma and urine: Results from enzyme-linked immunoassay and liquid chromatography/tandem mass spectrometry cannot be compared. Rapid Communications in Mass Spectrometry, 25(4), 463–468. [DOI] [PubMed] [Google Scholar]
- 165.Il’yasova D, Morrow JD, Ivanova A, & Wagenknecht LE (2004). Epidemiological marker for oxidant status: Comparison of the ELISA and the gas chromatography/mass spectrometry assay for urine 2,3-dinor-5,6-dihydro-15-F2t-isoprostane. Annals of Epidemiology, 14(10), 793–797. [DOI] [PubMed] [Google Scholar]
- 166.Bessard J, Cracowski JL, Stanke-Labesque F, & Bessard G (2001). Determination of isoprostaglandin F2alpha type III in human urine by gas chromatography-electronic impact mass spectrometry. Comparison with enzyme immunoassay. Journal of Chromatography. B, Biomedical Sciences and Applications, 754(2), 333–343. [DOI] [PubMed] [Google Scholar]
- 167.Milne GL, Sanchez SC, Musiek ES, & Morrow JD (2007). Quantification of F2-isoprostanes as a biomarker of oxidative stress. Nature Protocols, 2(1), 221–226. [DOI] [PubMed] [Google Scholar]
- 168.Milne GL, Gao B, Terry ES, Zackert WE, & Sanchez SC (2013). Measurement of F2-isoprostanes and isofurans using gas chromatography-mass spectrometry. Free Radical Biology & Medicine, 59, 36–44. [DOI] [PMC free article] [PubMed] [Google Scholar]
- 169.Liu W, Morrow JD, & Yin H (2009). Quantification of F2-isoprostanes as a reliable index of oxidative stress in vivo using gas chromatography-mass spectrometry (GC-MS) method. Free Radical Biology & Medicine, 47(8), 1101–1107. [DOI] [PMC free article] [PubMed] [Google Scholar]
- 170.Chu KO, Wang CC, Rogers MS, & Pang CP (2003). Quantifying F2-isoprostanes in umbilical cord blood of newborn by gas chromatography-mass spectrometry. Analytical Biochemistry, 316(1), 111–117. [DOI] [PubMed] [Google Scholar]
- 171.Ferretti A, & Flanagan VP (1997). Isolation and measurement of urinary 8-iso-prostaglandin F2alpha by high-performance liquid chromatography and gas chromatography-mass spectrometry. Journal of Chromatography. B, Biomedical Sciences and Applications, 694(2), 271–276. [DOI] [PubMed] [Google Scholar]
- 172.Mori TA, Croft KD, Puddey IB, & Beilin LJ (1999). An improved method for the measurement of urinary and plasma F2-isoprostanes using gas chromatography-mass spectrometry. Analytical Biochemistry, 268(1), 117–125. [DOI] [PubMed] [Google Scholar]
- 173.Tsikas D, Schwedhelm E, Fauler J, Gutzki FM, Mayatepek E, & Frolich JC (1998). Specific and rapid quantification of 8-iso-prostaglandin F2alpha in urine of healthy humans and patients with Zellweger syndrome by gas chromatography-tandem mass spectrometry. Journal of Chromatography. B, Biomedical Sciences and Applications, 716(1–2), 7–17. [DOI] [PubMed] [Google Scholar]
- 174.Lee CY, Jenner AM, & Halliwell B (2004). Rapid preparation of human urine and plasma samples for analysis of F2-isoprostanes by gas chromatography-mass spectrometry. Biochemical and Biophysical Research Communications, 320(3), 696–702. [DOI] [PubMed] [Google Scholar]
- 175.Walter MF, Blumberg JB, Dolnikowski GG, & Handelman GJ (2000). Streamlined F2-isoprostane analysis in plasma and urine with high-performance liquid chromatography and gas chromatography/mass spectroscopy. Analytical Biochemistry, 280(1), 73–79. [DOI] [PubMed] [Google Scholar]
- 176.Schwedhelm E, Tsikas D, Durand T, Gutzki FM, Guy A, Rossi JC, et al. (2000). Tandem mass spectrometric quantification of 8-iso-prostaglandin F2alpha and its metabolite 2,3-dinor-5,6-dihydro-8-iso-prostaglandin F2alpha in human urine. Journal of Chromatography. B, Biomedical Sciences and Applications, 744(1), 99–112. [DOI] [PubMed] [Google Scholar]
- 177.Tsikas D (1998). Application of gas chromatography-mass spectrometry and gas chromatography-tandem mass spectrometry to assess in vivo synthesis of prostaglandins, thromboxane, leukotrienes, isoprostanes and related compounds in humans. Journal of Chromatography. B, Biomedical Sciences and Applications, 717(1–2), 201–245. [DOI] [PubMed] [Google Scholar]
- 178.Tsikas D, Schwedhelm E, Suchy MT, Niemann J, Gutzki FM, Erpenbeck VJ, et al. (2003). Divergence in urinary 8-iso-PGF(2alpha) (iPF(2alpha)-III, 15-F(2t)-IsoP) levels from gas chromatography-tandem mass spectrometry quantification after thin-layer chromatography and immunoaffinity column chromatography reveals heterogeneity of 8-iso-PGF(2alpha). Possible methodological, mechanistic and clinical implications. Journal of Chromatography. B, Analytical Technologies in the Biomedical and Life Sciences, 794(2), 237–255. [DOI] [PubMed] [Google Scholar]
- 179.Li H, Lawson JA, Reilly M, Adiyaman M, Hwang SW, Rokach J, et al. (1999). Quantitative high performance liquid chromatography/tandem mass spectrometric analysis of the four classes of F2-isoprostanes in human urine. Proceedings of the National Academy of Sciences of the United States of America, 96(23), 13381–13386. [DOI] [PMC free article] [PubMed] [Google Scholar]
- 180.Yin H, Porter NA, & Morrow JD (2005). Separation and identification of F2-isoprostane regioisomers and diastereomers by novel liquid chromatographic/mass spectrometric methods. Journal of Chromatography. B, Analytical Technologies in the Biomedical and Life Sciences, 827(1), 157–164. [DOI] [PubMed] [Google Scholar]
- 181.Waugh RJ, Morrow JD, Roberts LJ II, & Murphy RC (1997). Identification and relative quantitation of F2-isoprostane regioisomers formed in vivo in the rat. Free Radical Biology & Medicine, 23(6), 943–954. [DOI] [PubMed] [Google Scholar]
- 182.Zhang H, Il’yasova D, Sztaray J, Young SP, Wang F, & Millington DS (2010). Quantification of the oxidative damage biomarker 2,3-dinor-8-isoprostaglandin-F(2alpha) in human urine using liquid chromatography-tandem mass spectrometry. Analytical Biochemistry, 399(2), 302–304. [DOI] [PMC free article] [PubMed] [Google Scholar]
- 183.Liang Y, Wei P, Duke RW, Reaven PD, Harman SM, Cutler RG, et al. (2003). Quantification of 8-iso-prostaglandinF(2alpha) and 2,3-dinor-8-iso-prostaglandin-F(2alpha) in human urine using liquid chromatography-tandem mass spectrometry. Free Radical Biology & Medicine, 34(4), 409–418. [DOI] [PubMed] [Google Scholar]
- 184.Dahl JH, & van Breemen RB (2010). Rapid quantitative analysis of 8-iso-prostaglandin-F(2alpha) using liquid chromatography-tandem mass spectrometry and comparison with an enzyme immunoassay method. Analytical Biochemistry, 404(2), 211–216. [DOI] [PMC free article] [PubMed] [Google Scholar]
- 185.Taylor AW, Bruno RS, Frei B, & Traber MG (2006). Benefits of prolonged gradient separation for high-performance liquid chromatography-tandem mass spectrometry quantitation of plasma total 15-series F-isoprostanes. Analytical Biochemistry, 350(1), 41–51. [DOI] [PubMed] [Google Scholar]
- 186.Bastani NE, Gundersen TE, & Blomhoff R (2009). Determination of 8-epi PGF(2alpha) concentrations as a biomarker of oxidative stress using triple-stage liquid chromatography/tandem mass spectrometry. Rapid Communications in Mass Spectrometry, 23(18), 2885–2890. [DOI] [PubMed] [Google Scholar]
- 187.Song WL, Lawson JA, Wang M, Zou H, & FitzGerald GA (2007). Noninvasive assessment of the role of cyclooxygenases in cardiovascular health: A detailed HPLC/MS/MS method. Methods in Enzymology, 433, 51–72. [DOI] [PubMed] [Google Scholar]
- 188.Yan W, Byrd GD, & Ogden MW (2007). Quantitation of isoprostane isomers in human urine from smokers and nonsmokers by LC-MS/MS. Journal of Lipid Research, 48(7), 1607–1617. [DOI] [PubMed] [Google Scholar]
- 189.Mizuno K, & Kataoka H (2015). Analysis of urinary 8-isoprostane as an oxidative stress biomarker by stable isotope dilution using automated online in-tube solid-phase microextraction coupled with liquid chromatography-tandem mass spectrometry. Journal of Pharmaceutical and Biomedical Analysis, 112, 36–42. [DOI] [PubMed] [Google Scholar]
- 190.Ohashi N, & Yoshikawa M (2000). Rapid and sensitive quantification of 8-isoprostaglandin F2alpha in human plasma and urine by liquid chromatography-electrospray ionization mass spectrometry. Journal of Chromatography. B, Biomedical Sciences and Applications, 746(1), 17–24. [DOI] [PubMed] [Google Scholar]
- 191.Sircar D, & Subbaiah PV (2007). Isoprostane measurement in plasma and urine by liquid chromatography-mass spectrometry with one-step sample preparation. Clinical Chemistry, 53(2), 251–258. [DOI] [PubMed] [Google Scholar]
- 192.Tsikas D, & Suchy MT (2016). Protocols for the measurement of the F2-isoprostane, 15(S)-8-iso-prostaglandin F2alpha, in biological samples by GC-MS or GC-MS/MS coupled with immunoaffinity column chromatography. Journal of Chromatography. B, Analytical Technologies in the Biomedical and Life Sciences, 1019, 191–201. [DOI] [PubMed] [Google Scholar]
- 193.Smith KA, Shepherd J, Wakil A, & Kilpatrick ES (2011). A comparison of methods for the measurement of 8-isoPGF(2alpha): A marker of oxidative stress. Annals of Clinical Biochemistry, 48(Pt 2), 147–154. [DOI] [PubMed] [Google Scholar]
- 194.Mittler R (2017). ROS Are Good. Trends in Plant Science, 22(1), 11–19. [DOI] [PubMed] [Google Scholar]
- 195.Cadenas E, & Davies KJ (2000). Mitochondrial free radical generation, oxidative stress, and aging. Free Radical Biology & Medicine, 29(3–4), 222–230. [DOI] [PubMed] [Google Scholar]
- 196.Dikalov SI, & Harrison DG (2014). Methods for detection of mitochondrial and cellular reactive oxygen species. Antioxidants & Redox Signaling, 20(2), 372–382. [DOI] [PMC free article] [PubMed] [Google Scholar]
- 197.Zielonka J, & Kalyanaraman B (2010). Hydroethidine- and MitoSOX-derived red fluorescence is not a reliable indicator of intracellular superoxide formation: Another inconvenient truth. Free Radical Biology & Medicine, 48(8), 983–1001. [DOI] [PMC free article] [PubMed] [Google Scholar]
- 198.Kalyanaraman B, Dranka BP, Hardy M, Michalski R, & Zielonka J (2014). HPLC-based monitoring of products formed from hydroethidine-based fluorogenic probes--the ultimate approach for intra- and extracellular superoxide detection. Biochimica et Biophysica Acta, 1840(2), 739–744. [DOI] [PMC free article] [PubMed] [Google Scholar]
- 199.Xiao Y, & Meierhofer D (2018). Are hydroethidine-based probes reliable for reactive oxygen species detection? Antioxidants & Redox Signaling. [DOI] [PMC free article] [PubMed] [Google Scholar]
- 200.Madian AG, & Regnier FE (2010). Proteomic identification of carbonylated proteins and their oxidation sites. Journal of Proteome Research, 9(8), 3766–3780. [DOI] [PMC free article] [PubMed] [Google Scholar]
- 201.Verrastro I, Pasha S, Jensen KT, Pitt AR, & Spickett CM (2015). Mass spectrometry-based methods for identifying oxidized proteins in disease: Advances and challenges. Biomolecules, 5(2), 378–411. [DOI] [PMC free article] [PubMed] [Google Scholar]
- 202.Ebadi M, Brown-Borg H, El Refaey H, Singh BB, Garrett S, Shavali S, et al. (2005). Metallothionein-mediated neuroprotection in genetically engineered mouse models of Parkinson’s disease. Brain Research. Molecular Brain Research, 134(1), 67–75. [DOI] [PMC free article] [PubMed] [Google Scholar]
- 203.El Hindy M, Hezwani M, Corry D, Hull J, El Amraoui F, Harris M, et al. (2014). The branched-chain aminotransferase proteins: Novel redox chaperones for protein disulfide isomerase—implications in Alzheimer’s disease. Antioxidants & Redox Signaling, 20(16), 2497–2513. [DOI] [PMC free article] [PubMed] [Google Scholar]
- 204.Su H, Velly AM, Salah MH, Benarroch M, Trifiro M, Schipper HM, et al. (2012). Altered redox homeostasis in human diabetes saliva. Journal of Oral Pathology & Medicine, 41(3), 235–241. [DOI] [PubMed] [Google Scholar]
- 205.Gally F, Kosmider B, Weaver MR, Pate KM, Hartshorn KL, & Oberley-Deegan RE (2013). FABP5 deficiency enhances susceptibility to H1N1 influenza A virus-induced lung inflammation. American Journal of Physiology. Lung Cellular and Molecular Physiology, 305(1), L64–L72. [DOI] [PMC free article] [PubMed] [Google Scholar]
- 206.Wilson DJ, & Konermann L (2003). A capillary mixer with adjustable reaction chamber volume for millisecond time-resolved studies by electrospray mass spectrometry. Analytical Chemistry, 75(23), 6408–6414. [DOI] [PubMed] [Google Scholar]
- 207.Wilson DJ, & Konermann L (2004). Mechanistic studies on enzymatic reactions by electrospray ionization MS using a capillary mixer with adjustable reaction chamber volume for time-resolved measurements. Analytical Chemistry, 76(9), 2537–2543. [DOI] [PubMed] [Google Scholar]
- 208.Wilson DJ, & Konermann L (2005). Ultrarapid desalting of protein solutions for electrospray mass spectrometry in a microchannel laminar flow device. Analytical Chemistry, 77(21), 6887–6894. [DOI] [PubMed] [Google Scholar]
- 209.Haynes AC, Qian J, Reisz JA, Furdui CM, & Lowther WT (2013). Molecular basis for the resistance of human mitochondrial 2-Cys peroxiredoxin 3 to hyperoxidation. The Journal of Biological Chemistry, 288(41), 29714–29723. [DOI] [PMC free article] [PubMed] [Google Scholar]
- 210.Ellis HR, & Poole LB (1997). Roles for the two cysteine residues of AhpC in catalysis of peroxide reduction by alkyl hydroperoxide reductase from Salmonella typhimurium. Biochemistry, 36(43), 13349–13356. [DOI] [PubMed] [Google Scholar]
- 211.Poole LB, & Ellis HR (2002). Identification of cysteine sulfenic acid in AhpC of alkyl hydroperoxide reductase. Methods in Enzymology, 348, 122–136. [DOI] [PubMed] [Google Scholar]
- 212.Kim JS, & Raines RT (1994). A misfolded but active dimer of bovine seminal ribonuclease. European Journal of Biochemistry, 224(1), 109–114. [DOI] [PubMed] [Google Scholar]
- 213.Fuangthong M, & Helmann JD (2002). The OhrR repressor senses organic hydroperoxides by reversible formation of a cysteine-sulfenic acid derivative. Proceedings of the National Academy of Sciences of the United States of America, 99(10), 6690–6695. [DOI] [PMC free article] [PubMed] [Google Scholar]
- 214.Reisz JA, Bechtold E, King SB, Poole LB, & Furdui CM (2013). Thiol-blocking electrophiles interfere with labeling and detection of protein sulfenic acids. The FEBS Journal, 280(23), 6150–6161. [DOI] [PMC free article] [PubMed] [Google Scholar]
- 215.Chen X, Wu H, Park CM, Poole TH, Keceli G, Devarie-Baez NO, et al. (2017). Discovery of heteroaromatic sulfones as a new class of biologically compatible thiol-selective reagents. ACS Chemical Biology, 12(8), 2201–2208. [DOI] [PMC free article] [PubMed] [Google Scholar]
- 216.Poole LB, Klomsiri C, Knaggs SA, Furdui CM, Nelson KJ, Thomas MJ, et al. (2007). Fluorescent and affinitybased tools to detect cysteine sulfenic acid formation in proteins. Bioconjugate Chemistry, 18(6), 2004–2017. [DOI] [PMC free article] [PubMed] [Google Scholar]
- 217.Klomsiri C, Nelson KJ, Bechtold E, Soito L, Johnson LC, Lowther WT, et al. (2010). Use of dimedone-based chemical probes for sulfenic acid detection evaluation of conditions affecting probe incorporation into redox-sensitive proteins. Methods in Enzymology, 473, 77–94. [DOI] [PMC free article] [PubMed] [Google Scholar]
- 218.Qian J, Klomsiri C, Wright MW, King SB, Tsang AW, Poole LB, et al. (2011). Simple synthesis of 1,3-cyclopentanedione derived probes for labeling sulfenic acid proteins. Chemical communications (Cambridge, England), 47(32), 9203–9205. [DOI] [PMC free article] [PubMed] [Google Scholar]
- 219.Qian J, Wani R, Klomsiri C, Poole LB, Tsang AW, & Furdui CM (2012). A simple and effective strategy for labeling cysteine sulfenic acid in proteins by utilization of beta-ketoesters as cleavable probes. Chemical communications (Cambridge, England), 48(34), 4091–4093. [DOI] [PMC free article] [PubMed] [Google Scholar]
- 220.Holmila RJ, Vance SA, Chen X, Wu H, Shukla K, Bharadwaj MS, et al. (2018). Mitochondria-targeted probes for imaging protein sulfenylation. Scientific Reports, 8(1), 6635. [DOI] [PMC free article] [PubMed] [Google Scholar]
- 221.Poole TH, Reisz JA, Zhao W, Poole LB, Furdui CM, & King SB (2014). Strained cycloalkynes as new protein sulfenic acid traps. Journal of the American Chemical Society, 136(17), 6167–6170. [DOI] [PMC free article] [PubMed] [Google Scholar]
- 222.Pan J, & Carroll KS (2013). Persulfide reactivity in the detection of protein s-sulfhydration. ACS Chemical Biology, 8(6), 1110–1116. [DOI] [PMC free article] [PubMed] [Google Scholar]
- 223.Lourette N, Smallwood H, Wu S, Robinson EW, Squier TC, Smith RD, et al. (2010). A top-down LC-FTICR MS-based strategy for characterizing oxidized calmodulin in activated macrophages. Journal of the American Society for Mass Spectrometry, 21(6), 930–939. [DOI] [PubMed] [Google Scholar]
- 224.Mao P, & Wang D (2014). Top-down proteomics of a drop of blood for diabetes monitoring. Journal of Proteome Research, 13(3), 1560–1569. [DOI] [PMC free article] [PubMed] [Google Scholar]
- 225.Scotcher J, Clarke DJ, Weidt SK, Mackay CL, Hupp TR, Sadler PJ, et al. (2011). Identification of two reactive cysteine residues in the tumor suppressor protein p53 using top-down FTICR mass spectrometry. Journal of the American Society for Mass Spectrometry, 22(5), 888–897. [DOI] [PubMed] [Google Scholar]
- 226.Torta F, Elviri L, & Bachi A (2010). Direct and indirect detection methods for the analysis of S-nitrosylated peptides and proteins. Methods in Enzymology, 473, 265–280. [DOI] [PubMed] [Google Scholar]
- 227.Reddie KG, Seo YH, Muse Iii WB, Leonard SE, & Carroll KS (2008). A chemical approach for detecting sulfenic acid-modified proteins in living cells. Molecular BioSystems, 4(6), 521–531. [DOI] [PMC free article] [PubMed] [Google Scholar]
- 228.Guo J, Gaffrey MJ, Su D, Liu T, Camp DG II, Smith RD, et al. (2014). Resin-assisted enrichment of thiols as a general strategy for proteomic profiling of cysteine-based reversible modifications. Nature Protocols, 9(1), 64–75. [DOI] [PMC free article] [PubMed] [Google Scholar]
- 229.Jaffrey SR, & Snyder SH (2001). The biotin switch method for the detection of S-nitrosylated proteins. Science’s STKE, 2001(86), pl1. [DOI] [PubMed] [Google Scholar]
- 230.Forrester MT, Foster MW, & Stamler JS (2007). Assessment and application of the biotin switch technique for examining protein S-nitrosylation under conditions of pharmacologically induced oxidative stress. The Journal of Biological Chemistry, 282(19), 13977–13983. [DOI] [PubMed] [Google Scholar]
- 231.Pastore A, & Piemonte F (2013). Protein glutathionylation in cardiovascular diseases. International Journal of Molecular Sciences, 14(10), 20845–20876. [DOI] [PMC free article] [PubMed] [Google Scholar]
- 232.Su D, Gaffrey MJ, Guo J, Hatchell KE, Chu RK, Clauss TR, et al. (2014). Proteomic identification and quantification of S-glutathionylation in mouse macrophages using resin-assisted enrichment and isobaric labeling. Free Radical Biology & Medicine, 67, 460–470. [DOI] [PMC free article] [PubMed] [Google Scholar]
- 233.Lo Conte M, Lin J, Wilson MA, & Carroll KS (2015). A chemical approach for the detection of protein sulfinylation. ACS Chemical Biology, 10(8), 1825–1830. [DOI] [PMC free article] [PubMed] [Google Scholar]
- 234.Majmudar JD, Konopko AM, Labby KJ, Tom CT, Crellin JE, Prakash A, et al. (2016). Harnessing redox cross-reactivity to profile distinct cysteine modifications. Journal of the American Chemical Society, 138(6), 1852–1859. [DOI] [PMC free article] [PubMed] [Google Scholar]
- 235.Truong TH, Garcia FJ, Seo YH, & Carroll KS (2011). Isotope-coded chemical reporter and acid-cleavable affinity reagents for monitoring protein sulfenic acids. Bioorganic & Medicinal Chemistry Letters, 21(17), 5015–5020. [DOI] [PubMed] [Google Scholar]
- 236.Bak DW, Pizzagalli MD, & Weerapana E (2017). Identifying functional cysteine residues in the mitochondria. ACS Chemical Biology, 12(4), 947–957. [DOI] [PMC free article] [PubMed] [Google Scholar]
- 237.Wani R, Qian J, Yin L, Bechtold E, King SB, Poole LB, et al. (2011). Isoform-specific regulation of Akt by PDGF-induced reactive oxygen species. Proceedings of the National Academy of Sciences of the United States of America, 108(26), 10550–10555. [DOI] [PMC free article] [PubMed] [Google Scholar]
- 238.Keyes JD, Parsonage D, Yammani RD, Rogers LC, Kesty C, Furdui CM, et al. (2017). Endogenous, regulatory cysteine sulfenylation of ERK kinases in response to proliferative signals. Free Radical Biology & Medicine, 112, 534–543. [DOI] [PMC free article] [PubMed] [Google Scholar]
- 239.Nelson KJ, Bolduc JA, Wu H, Collins JA, Burke EA, Reisz JA, et al. (2018). H2O2 oxidation of cysteine residues in c-Jun N-terminal kinase 2 (JNK2) contributes to redox regulation in human articular chondrocytes. The Journal of Biological Chemistry. [DOI] [PMC free article] [PubMed] [Google Scholar]
- 240.Schwertassek U, Balmer Y, Gutscher M, Weingarten L, Preuss M, Engelhard J, et al. (2007). Selective redox regulation of cytokine receptor signaling by extracellular thioredoxin-1. The EMBO Journal, 26(13), 3086–3097. [DOI] [PMC free article] [PubMed] [Google Scholar]
- 241.Putker M, Madl T, Vos HR, de Ruiter H, Visscher M, van den Berg MC, et al. (2013). Redox-dependent control of FOXO/DAF-16 by transportin-1. Molecular Cell, 49(4), 730–742. [DOI] [PubMed] [Google Scholar]
- 242.Anand S, Samuel M, Ang CS, Keerthikumar S, & Mathivanan S (2017). Label-based and label-free strategies for protein quantitation. Methods in Molecular Biology, 1549, 31–43. [DOI] [PubMed] [Google Scholar]
- 243.Zaccarin M, Falda M, Roveri A, Bosello-Travain V, Bordin L, Maiorino M, et al. (2014). Quantitative label-free redox proteomics of reversible cysteine oxidation in red blood cell membranes. Free Radical Biology & Medicine, 71, 90–98. [DOI] [PubMed] [Google Scholar]
- 244.Seo YH, & Carroll KS (2011). Quantification of protein sulfenic acid modifications using isotope-coded dimedone and iododimedone. Angewandte Chemie (International Ed. in English), 50(6), 1342–1345. [DOI] [PubMed] [Google Scholar]
- 245.Sun QA, Wang B, Miyagi M, Hess DT, & Stamler JS (2013). Oxygen-coupled redox regulation of the skeletal muscle ryanodine receptor/Ca2+ release channel (RyR1): Sites and nature of oxidative modification. The Journal of Biological Chemistry, 288(32), 22961–22971. [DOI] [PMC free article] [PubMed] [Google Scholar]
- 246.Yuan J, Gao H, Sui J, Duan H, Chen WN, & Ching CB (2012). Cytotoxicity evaluation of oxidized single-walled carbon nanotubes and graphene oxide on human hepatoma HepG2 cells: An iTRAQ-coupled 2D LC-MS/MS proteome analysis. Toxicological Sciences, 126(1), 149–161. [DOI] [PubMed] [Google Scholar]
- 247.Yuan J, Gao H, & Ching CB (2011). Comparative protein profile of human hepatoma HepG2 cells treated with graphene and single-walled carbon nanotubes: An iTRAQ-coupled 2D LC-MS/MS proteome analysis. Toxicology Letters, 207(3), 213–221. [DOI] [PubMed] [Google Scholar]
- 248.Shi M, Hwang H, & Zhang J (2013). Quantitative characterization of glycoproteins in neurodegenerative disorders using iTRAQ. Methods in Molecular Biology, 951, 279–296. [DOI] [PubMed] [Google Scholar]
- 249.Wojdyla K, Williamson J, Roepstorff P, & Rogowska-Wrzesinska A (2015). The SNO/SOH TMT strategy for combinatorial analysis of reversible cysteine oxidations. Journal of Proteomics, 113, 415–434. [DOI] [PubMed] [Google Scholar]
- 250.Kim CR, Choi SJ, Kim JK, Park CK, Gim MC, Kim YJ, et al. (2017). 2,4-bis(1,1-dimethylethyl)phenol from Cinnamomum loureirii improves cognitive deficit, cholinergic dysfunction, and oxidative damage in TMT-treated mice. Biological & Pharmaceutical Bulletin, 40(6), 932–935. [DOI] [PubMed] [Google Scholar]
- 251.Li ZL, & Zhou SF (2016). A SILAC-based approach elicits the proteomic responses to vancomycin-associated nephrotoxicity in human proximal tubule epithelial HK-2 cells. Molecules, 21(2), 148. [DOI] [PMC free article] [PubMed] [Google Scholar]
- 252.Pan ST, Zhou ZW, He ZX, Zhang X, Yang T, Yang YX, et al. (2015). Proteomic response to 5,6-dimethylxanthenone 4-acetic acid (DMXAA, vadimezan) in human non-small cell lung cancer A549 cells determined by the stable-isotope labeling by amino acids in cell culture (SILAC) approach. Drug Design, Development and Therapy, 9, 937–968. [DOI] [PMC free article] [PubMed] [Google Scholar]
- 253.Yin H, Xu L, & Porter NA (2011). Free radical lipid peroxidation: Mechanisms and analysis. Chemical Reviews, 111(10), 5944–5972. [DOI] [PubMed] [Google Scholar]
- 254.Davi G, Falco A, & Patrono C (2005). Lipid peroxidation in diabetes mellitus. Antioxidants & Redox Signaling, 7(1–2), 256–268. [DOI] [PubMed] [Google Scholar]
- 255.Sugamura K, & Keaney JF Jr. (2011). Reactive oxygen species in cardiovascular disease. Free Radical Biology & Medicine, 51(5), 978–992. [DOI] [PMC free article] [PubMed] [Google Scholar]
- 256.Panth N, Paudel KR, & Parajuli K (2016). Reactive oxygen species: A key hallmark of cardiovascular disease. Advances in Medicine, 2016, 9152732. [DOI] [PMC free article] [PubMed] [Google Scholar]
- 257.He F, & Zuo L (2015). Redox roles of reactive oxygen species in cardiovascular diseases. International Journal of Molecular Sciences, 16(11), 27770–27780. [DOI] [PMC free article] [PubMed] [Google Scholar]
- 258.Cervantes Gracia K, Llanas-Cornejo D, & Husi H (2017). CVD and oxidative stress. Journal of Clinical Medicine, 6(2). [DOI] [PMC free article] [PubMed] [Google Scholar]
- 259.Afanas’ev I (2011). ROS and RNS signaling in heart disorders: Could antioxidant treatment be successful? Oxidative Medicine and Cellular Longevity, 2011, 293769. [DOI] [PMC free article] [PubMed] [Google Scholar]
- 260.Halliwell B (2000). Lipid peroxidation, antioxidants and cardiovascular disease: How should we move forward? Cardiovascular Research, 47(3), 410–418. [DOI] [PubMed] [Google Scholar]
- 261.Bradley-Whitman MA, & Lovell MA (2015). Biomarkers of lipid peroxidation in Alzheimer disease (AD): An update. Archives of Toxicology, 89(7), 1035–1044. [DOI] [PMC free article] [PubMed] [Google Scholar]
- 262.Sultana R, Perluigi M, & Butterfield DA (2013). Lipid peroxidation triggers neurodegeneration: A redox proteomics view into the Alzheimer disease brain. Free Radical Biology & Medicine, 62, 157–169. [DOI] [PMC free article] [PubMed] [Google Scholar]
- 263.Ayala A, Munoz MF, & Arguelles S (2014). Lipid peroxidation: Production, metabolism, and signaling mechanisms of malondialdehyde and 4-hydroxy-2-nonenal. Oxidative Medicine and Cellular Longevity, 2014, 360438. [DOI] [PMC free article] [PubMed] [Google Scholar]
- 264.Girotti AW (1998). Lipid hydroperoxide generation, turn-over, and effector action in biological systems. Journal of Lipid Research, 39(8), 1529–1542. [PubMed] [Google Scholar]
- 265.Kanner J, German JB, & Kinsella JE (1987). Initiation of lipid peroxidation in biological systems. Critical Reviews in Food Science and Nutrition, 25(4), 317–364. [DOI] [PubMed] [Google Scholar]
- 266.Esterbauer H, Schaur RJ, & Zollner H (1991). Chemistry and biochemistry of 4-hydroxynonenal, malonaldehyde and related aldehydes. Free Radical Biology & Medicine, 11(1), 81–128. [DOI] [PubMed] [Google Scholar]
- 267.Esterbauer H, Eckl P, & Ortner A (1990). Possible mutagens derived from lipids and lipid precursors. Mutation Research, 238(3), 223–233. [DOI] [PubMed] [Google Scholar]
- 268.Pizzimenti S, Ciamporcero E, Daga M, Pettazzoni P, Arcaro A, Cetrangolo G, et al. (2013). Interaction of aldehydes derived from lipid peroxidation and membrane proteins. Frontiers in Physiology, 4, 242. [DOI] [PMC free article] [PubMed] [Google Scholar]
- 269.Negre-Salvayre A, Coatrieux C, Ingueneau C, & Salvayre R (2008). Advanced lipid peroxidation end products in oxidative damage to proteins. Potential role in diseases and therapeutic prospects for the inhibitors. British Journal of Pharmacology, 153(1), 6–20. [DOI] [PMC free article] [PubMed] [Google Scholar]
- 270.Marnett LJ (2002). Oxy radicals, lipid peroxidation and DNA damage. Toxicology, 181–182, 219–222. [DOI] [PubMed] [Google Scholar]
- 271.Cheng J, Wang F, Yu DF, Wu PF, & Chen JG (2011). The cytotoxic mechanism of malondialdehyde and protective effect of carnosine via protein cross-linking/mitochondrial dysfunction/reactive oxygen species/MAPK pathway in neurons. European Journal of Pharmacology, 650(1), 184–194. [DOI] [PubMed] [Google Scholar]
- 272.Slatter DA, Avery NC, & Bailey AJ (2004). Identification of a new cross-link and unique histidine adduct from bovine serum albumin incubated with malondialdehyde. The Journal of Biological Chemistry, 279(1), 61–69. [DOI] [PubMed] [Google Scholar]
- 273.Esterbauer H, & Cheeseman KH (1990). Determination of aldehydic lipid peroxidation products: Malonaldehyde and 4-hydroxynonenal. Methods in Enzymology, 186, 407–421. [DOI] [PubMed] [Google Scholar]
- 274.Pryor WA (1989). On the detection of lipid hydroperoxides in biological samples. Free Radical Biology & Medicine, 7(2), 177–178. [DOI] [PubMed] [Google Scholar]
- 275.Jiang ZY, Hunt JV, & Wolff SP (1992). Ferrous ion oxidation in the presence of xylenol orange for detection of lipid hydroperoxide in low density lipoprotein. Analytical Biochemistry, 202(2), 384–389. [DOI] [PubMed] [Google Scholar]
- 276.Puppolo M, Varma D, & Jansen SA (2014). A review of analytical methods for eicosanoids in brain tissue. Journal of Chromatography. B, Analytical Technologies in the Biomedical and Life Sciences, 964, 50–64. [DOI] [PubMed] [Google Scholar]
- 277.Hughes H, Smith CV, Tsokos-Kuhn JO, & Mitchell JR (1986). Quantitation of lipid peroxidation products by gas chromatography-mass spectrometry. Analytical Biochemistry, 152(1), 107–112. [DOI] [PubMed] [Google Scholar]
- 278.Hughes H, Smith CV, Horning EC, & Mitchell JR (1983). High-performance liquid chromatography and gas chromatography-mass spectrometry determination of specific lipid peroxidation products in vivo. Analytical Biochemistry, 130(2), 431–436. [DOI] [PubMed] [Google Scholar]
- 279.Frankel EN, Hu ML, & Tappel AL (1989). Rapid headspace gas chromatography of hexanal as a measure of lipid peroxidation in biological samples. Lipids, 24(11), 976–981. [DOI] [PubMed] [Google Scholar]
- 280.Selley ML, Bartlett MR, McGuiness JA, Hapel AJ, & Ardlie NG (1989). Determination of the lipid peroxidation product trans-4-hydroxy-2-nonenal in biological samples by high-performance liquid chromatography and combined capillary column gas chromatography-negative-ion chemical ionisation mass spectrometry. Journal of Chromatography, 488(2), 329–340. [DOI] [PubMed] [Google Scholar]
- 281.Norsten-Hoog C, & Cronholm T (1990). Analysis of aldehydic lipid peroxidation products in rat liver and hepatocytes by gas chromatography and mass spectrometry of the oxime-tert-butyldimethylsilyl derivatives. Analytical Biochemistry, 189(1), 131–137. [DOI] [PubMed] [Google Scholar]
- 282.Luo XP, Yazdanpanah M, Bhooi N, & Lehotay DC (1995). Determination of aldehydes and other lipid peroxidation products in biological samples by gas chromatography-mass spectrometry. Analytical Biochemistry, 228(2), 294–298. [DOI] [PubMed] [Google Scholar]
- 283.Bringmann G, Gassen M, & Schneider S (1994). Toxic aldehydes formed by lipid peroxidation. I. Sensitive, gas chromatography-based stereoanalysis of 4-hydroxyalkenals, toxic products of lipid peroxidation. Journal of Chromatography. A, 670(1–2), 153–160. [DOI] [PubMed] [Google Scholar]
- 284.Honzatko A, Brichac J, & Picklo MJ (2007). Quantification of trans-4-hydroxy-2-nonenal enantiomers and metabolites by LC-ESI-MS/MS. Journal of Chromatography. B, Analytical Technologies in the Biomedical and Life Sciences, 857(1), 115–122. [DOI] [PubMed] [Google Scholar]
- 285.Hiratsuka A, Tobita K, Saito H, Sakamoto Y, Nakano H, Ogura K, et al. (2001). (S)-preferential detoxification of 4-hydroxy-2(E)-nonenal enantiomers by hepatic glutathione S-transferase isoforms in guinea-pigs and rats. The Biochemical Journal, 355(Pt 1), 237–244. [DOI] [PMC free article] [PubMed] [Google Scholar]
- 286.Hiratsuka A, Hirose K, Saito H, & Watabe T (2000). 4-Hydroxy-2(E)-nonenal enantiomers: (S)-selective inactivation of glyceraldehyde-3-phosphate dehydrogenase and detoxification by rat glutathione S-transferase A4–4. The Biochemical Journal, 349(Pt 3), 729–735. [DOI] [PMC free article] [PubMed] [Google Scholar]
- 287.Barrera G, Pizzimenti S, Ciamporcero ES, Daga M, Ullio C, Arcaro A, et al. (2015). Role of 4-hydroxynonenal-protein adducts in human diseases. Antioxidants & Redox Signaling, 22(18), 1681–1702. [DOI] [PubMed] [Google Scholar]
- 288.Orioli M, Aldini G, Beretta G, Facino RM, & Carini M (2005). LC-ESI-MS/MS determination of 4-hydroxy-trans-2-nonenal Michael adducts with cysteine and histidine-containing peptides as early markers of oxidative stress in excitable tissues. Journal of Chromatography. B, Analytical Technologies in the Biomedical and Life Sciences, 827(1), 109–118. [DOI] [PubMed] [Google Scholar]
- 289.Yuan W, Zhang Y, Xiong Y, Tao T, Wang Y, Yao J, et al. (2017). Highly selective and large scale mass spectrometric analysis of 4-hydroxynonenal modification via fluorous derivatization and fluorous solid-phase extraction. Analytical Chemistry, 89(5), 3093–3100. [DOI] [PubMed] [Google Scholar]
- 290.Pecorelli A, Cervellati C, Cortelazzo A, Cervellati F, Sticozzi C, Mirasole C, et al. (2016). Proteomic analysis of 4-hydroxynonenal and nitrotyrosine modified proteins in RTT fibroblasts. The International Journal of Biochemistry & Cell Biology, 81(Pt B), 236–245. [DOI] [PubMed] [Google Scholar]
- 291.Gurbuz G, & Heinonen M (2015). LC-MS investigations on interactions between isolated beta-lactoglobulin peptides and lipid oxidation product malondialdehyde. Food Chemistry, 175, 300–305. [DOI] [PubMed] [Google Scholar]
- 292.Andringa KK, Udoh US, Landar A, & Bailey SM (2014). Proteomic analysis of 4-hydroxynonenal (4-HNE) modified proteins in liver mitochondria from chronic ethanol-fed rats. Redox Biology, 2, 1038–1047. [DOI] [PMC free article] [PubMed] [Google Scholar]
- 293.Schmitt D, Shen Z, Zhang R, Colles SM, Wu W, Salomon RG, et al. (1999). Leukocytes utilize myeloperoxidase-generated nitrating intermediates as physiological catalysts for the generation of biologically active oxidized lipids and sterols in serum. Biochemistry, 38(51), 16904–16915. [DOI] [PubMed] [Google Scholar]
- 294.Davis TA, Gao L, Yin H, Morrow JD, & Porter NA (2006). In vivo and in vitro lipid peroxidation of arachidonate esters: The effect of fish oil omega-3 lipids on product distribution. Journal of the American Chemical Society, 128(46), 14897–14904. [DOI] [PubMed] [Google Scholar]
- 295.Lawson JA, Kim S, Powell WS, FitzGerald GA, & Rokach J (2006). Oxidized derivatives of omega-3 fatty acids: Identification of IPF3 alpha-VI in human urine. Journal of Lipid Research, 47(11), 2515–2524. [DOI] [PubMed] [Google Scholar]
- 296.Yoshida Y, Kodai S, Takemura S, Minamiyama Y, & Niki E (2008). Simultaneous measurement of F2-isoprostane, hydroxyoctadecadienoic acid, hydroxyeicosatetraenoic acid, and hydroxycholesterols from physiological samples. Analytical Biochemistry, 379(1), 105–115. [DOI] [PubMed] [Google Scholar]
- 297.Fu J, Schoeman JC, Harms AC, van Wietmarschen HA, Vreeken RJ, Berger R, et al. (2016). Metabolomics profiling of the free and total oxidised lipids in urine by LC-MS/MS: Application in patients with rheumatoid arthritis. Analytical and Bioanalytical Chemistry, 408(23), 6307–6319. [DOI] [PMC free article] [PubMed] [Google Scholar]
- 298.Guido DM, McKenna R, & Mathews WR (1993). Quantitation of hydroperoxy-eicosatetraenoic acids and hydroxyeicosatetraenoic acids as indicators of lipid peroxidation using gas chromatography-mass spectrometry. Analytical Biochemistry, 209(1), 123–129. [DOI] [PubMed] [Google Scholar]
- 299.Hill E, & Murphy RC (1992). Quantitation of 20-hydroxy-5,8,11,14-eicosatetraenoic acid (20-HETE) produced by human polymorphonuclear leukocytes using electron capture ionization gas chromatography/mass spectrometry. Biological Mass Spectrometry, 21(5), 249–253. [DOI] [PubMed] [Google Scholar]
- 300.Proudfoot J, Barden A, Mori TA, Burke V, Croft KD, Beilin LJ, et al. (1999). Measurement of urinary F2-isoprostanes as markers of in vivo lipid peroxidation-a comparison of enzyme immunoassay with gas chromatography/mass spectrometry. Analytical Biochemistry, 272(2), 209–215. [DOI] [PubMed] [Google Scholar]
- 301.Bachi A, Zuccato E, Baraldi M, Fanelli R, & Chiabrando C (1996). Measurement of urinary 8-Epi-prostaglandin F2alpha, a novel index of lipid peroxidation in vivo, by immunoaffinity extraction/gas chromatography-mass spectrometry. Basal levels in smokers and nonsmokers. Free Radical Biology & Medicine, 20(4), 619–624. [DOI] [PubMed] [Google Scholar]
- 302.Nourooz-Zadeh J, Gopaul NK, Barrow S, Mallet AI, & Anggard EE (1995). Analysis of F2-isoprostanes as indicators of non-enzymatic lipid peroxidation in vivo by gas chromatography-mass spectrometry: Development of a solid-phase extraction procedure. Journal of Chromatography. B, Biomedical Applications, 667(2), 199–208. [DOI] [PubMed] [Google Scholar]
- 303.DeLong CJ, Baker PR, Samuel M, Cui Z, & Thomas MJ (2001). Molecular species composition of rat liver phospholipids by ESI-MS/MS: The effect of chromatography. Journal of Lipid Research, 42(12), 1959–1968. [PubMed] [Google Scholar]
- 304.Brugger B, Erben G, Sandhoff R, Wieland FT, & Lehmann WD (1997). Quantitative analysis of biological membrane lipids at the low picomole level by nano-electrospray ionization tandem mass spectrometry. Proceedings of the National Academy of Sciences of the United States of America, 94(6), 2339–2344. [DOI] [PMC free article] [PubMed] [Google Scholar]
- 305.Mitchell TW, Buffenstein R, & Hulbert AJ (2007). Membrane phospholipid composition may contribute to exceptional longevity of the naked mole-rat (Heterocephalus glaber): A comparative study using shotgun lipidomics. Experimental Gerontology, 42(11), 1053–1062. [DOI] [PubMed] [Google Scholar]
- 306.Kulig W, Olzynska A, Jurkiewicz P, Kantola AM, Komulainen S, Manna M, et al. (2015). Cholesterol under oxidative stress-how lipid membranes sense oxidation as cholesterol is being replaced by oxysterols. Free Radical Biology & Medicine, 84, 30–41. [DOI] [PubMed] [Google Scholar]
- 307.Mori TA, Croft KD, Puddey IB, & Beilin LJ (1996). Analysis of native and oxidized low-density lipoprotein oxysterols using gas chromatography-mass spectrometry with selective ion monitoring. Redox Report, 2(1), 25–34. [DOI] [PubMed] [Google Scholar]
- 308.Matysik S, Klunemann HH, & Schmitz G (2012). Gas chromatography-tandem mass spectrometry method for the simultaneous determination of oxysterols, plant sterols, and cholesterol precursors. Clinical Chemistry, 58(11), 1557–1564. [DOI] [PubMed] [Google Scholar]
- 309.Singh G, Gutierrez A, Xu K, & Blair IA (2000). Liquid chromatography/electron capture atmospheric pressure chemical ionization/mass spectrometry: Analysis of pentafluorobenzyl derivatives of biomolecules and drugs in the attomole range. Analytical Chemistry, 72(14), 3007–3013. [DOI] [PubMed] [Google Scholar]
- 310.Matos Cordeiro Borges M, Leijoto de Oliveira H, & Bastos Borges K (2017). Molecularly imprinted solid-phase extraction coupled with LC-APCI-MS-MS for the selective determination of serum cholesterol. Electrophoresis, 38(17), 2150–2159. [DOI] [PubMed] [Google Scholar]
- 311.Kim D, Park JB, Choi WK, Lee SJ, Lim I, & Bae SK (2016). Simultaneous determination of beta-sitosterol, campesterol, and stigmasterol in rat plasma by using LC-APCI-MS/MS: Application in a pharmacokinetic study of a titrated extract of the unsaponifiable fraction of Zea mays L. Journal of Separation Science, 39(21), 4060–4070. [DOI] [PubMed] [Google Scholar]
- 312.Fong BM, Tam S, & Leung KS (2013). Determination of plasma cholesterol sulfate by LC-APCI-MS/MS in the context of pediatric autism. Talanta, 116, 115–121. [DOI] [PubMed] [Google Scholar]
- 313.Khajuria RK, Bhardwaj V, Gupta RK, Sharma P, Somal P, Mehta P, et al. (2007). Development of a rapid normal-phase LC-positive ion APCI-MS method for simultaneous detection and quantitation of cholesterol, androst-4-ene-3,1 7-dione, and androsta-1,4-diene-3,17-dione. Journal of Chromatographic Science, 45(8), 519–523. [DOI] [PubMed] [Google Scholar]
- 314.Saldanha T, Sawaya AC, Eberlin MN, & Bragagnolo N (2006). HPLC separation and determination of 12 cholesterol oxidation products in fish: Comparative study of RI, UV, and APCI-MS detectors. Journal of Agricultural and Food Chemistry, 54(12), 4107–4113. [DOI] [PubMed] [Google Scholar]
- 315.Raith K, Brenner C, Farwanah H, Muller G, Eder K, & Neubert RH (2005). A new LC/APCI-MS method for the determination of cholesterol oxidation products in food. Journal of Chromatography. A, 1067(1–2), 207–211. [DOI] [PubMed] [Google Scholar]
- 316.Saliu F, Modugno F, Orlandi M, & Colombini MP (2011). HPLC-APCI-MS analysis of triacylglycerols (TAGs) in historical pharmaceutical ointments from the eighteenth century. Analytical and Bioanalytical Chemistry, 401(6), 1785–1800. [DOI] [PubMed] [Google Scholar]
- 317.Rezanka T, Schreiberova O, Krulikovska T, Masak J, & Sigler K (2010). RP-HPLC/MS-APCI analysis of odd-chain TAGs from Rhodococcus erythropolis including some regioisomers. Chemistry and Physics of Lipids, 163(4–5), 373–380. [DOI] [PubMed] [Google Scholar]
- 318.Fasciotti M, & Pereira Netto AD (2010). Optimization and application of methods of triacylglycerol evaluation for characterization of olive oil adulteration by soybean oil with HPLC-APCI-MS-MS. Talanta, 81(3), 1116–1125. [DOI] [PubMed] [Google Scholar]
- 319.Beermann C, Winterling N, Green A, Mobius M, Schmitt JJ, & Boehm G (2007). Comparison of the structures of triacylglycerols from native and transgenic medium-chain fatty acid-enriched rape seed oil by liquid chromatography—atmospheric pressure chemical ionization ion-trap mass spectrometry (LC-APCI-ITMS). Lipids, 42(4), 383–394. [DOI] [PubMed] [Google Scholar]
- 320.Haschke M, Zhang YL, Kahle C, Klawitter J, Korecka M, Shaw LM, et al. (2007). HPLC-atmospheric pressure chemical ionization MS/MS for quantification of 15-F2t-isoprostane in human urine and plasma. Clinical Chemistry, 53(3), 489–497. [DOI] [PubMed] [Google Scholar]
- 321.Griffiths WJ, Crick PJ, & Wang Y (2013). Methods for oxysterol analysis: Past, present and future. Biochemical Pharmacology, 86(1), 3–14. [DOI] [PubMed] [Google Scholar]
- 322.Jiang X, Ory DS, & Han X (2007). Characterization of oxysterols by electrospray ionization tandem mass spectrometry after one-step derivatization with dimethylglycine. Rapid Communications in Mass Spectrometry, 21(2), 141–152. [DOI] [PMC free article] [PubMed] [Google Scholar]
- 323.Jiang X, Sidhu R, Porter FD, Yanjanin NM, Speak AO, te Vruchte DT, et al. (2011). A sensitive and specific LC-MS/MS method for rapid diagnosis of Niemann-Pick C1 disease from human plasma. Journal of Lipid Research, 52(7), 1435–1445. [DOI] [PMC free article] [PubMed] [Google Scholar]
- 324.Porter FD, Scherrer DE, Lanier MH, Langmade SJ, Molugu V, Gale SE, et al. (2010). Cholesterol oxidation products are sensitive and specific blood-based biomarkers for Niemann-Pick C1 disease. Science Translational Medicine, 2(56), 56ra81. [DOI] [PMC free article] [PubMed] [Google Scholar]
- 325.Wang W, Yang J, Yang H, Sanidad KZ, Hammock BD, Kim D, et al. (2016). Effects of high-fat diet on plasma profiles of eicosanoid metabolites in mice. Prostaglandins & Other Lipid Mediators, 127, 9–13. [DOI] [PMC free article] [PubMed] [Google Scholar]
- 326.Lee YY, & Lee JC (2018). LC-MS/MS Analysis of Lipid Oxidation Products in Blood and Tissue Samples. Methods in Molecular Biology, 1730, 83–92. [DOI] [PubMed] [Google Scholar]
- 327.Yuan ZX, Majchrzak-Hong S, Keyes GS, Iadarola MJ, Mannes AJ, & Ramsden CE (2018). Lipidomic profiling of targeted oxylipins with ultra-performance liquid chromatography-tandem mass spectrometry. Analytical and Bioanalytical Chemistry, 410(23), 6009–6029. [DOI] [PMC free article] [PubMed] [Google Scholar]
- 328.Ostermann AI, Willenberg I, & Schebb NH (2015). Comparison of sample preparation methods for the quantitative analysis of eicosanoids and other oxylipins in plasma by means of LC-MS/MS. Analytical and Bioanalytical Chemistry, 407(5), 1403–1414. [DOI] [PubMed] [Google Scholar]
- 329.Hu C, Wang M, & Han X (2017). Shotgun lipidomics in substantiating lipid peroxidation in redox biology: Methods and applications. Redox Biology, 12, 946–955. [DOI] [PMC free article] [PubMed] [Google Scholar]
- 330.Wang M, Fang H, & Han X (2012). Shotgun lipidomics analysis of 4-hydroxyalkenal species directly from lipid extracts after one-step in situ derivatization. Analytical Chemistry, 84(10), 4580–4586. [DOI] [PMC free article] [PubMed] [Google Scholar]
- 331.He Q, Wang M, Harris N, & Han X (2013). Tafazzin knock-down interrupts cell cycle progression in cultured neonatal ventricular fibroblasts. American Journal of Physiology. Heart and Circulatory Physiology, 305(9), H1332–H1343. [DOI] [PubMed] [Google Scholar]
- 332.Lai L, Wang M, Martin OJ, Leone TC, Vega RB, Han X, et al. (2014). A role for peroxisome proliferator-activated receptor gamma coactivator 1 (PGC-1) in the regulation of cardiac mitochondrial phospholipid biosynthesis. The Journal of Biological Chemistry, 289(4), 2250–2259. [DOI] [PMC free article] [PubMed] [Google Scholar]
- 333.Wang M, Han RH, & Han X (2013). Fatty acidomics: Global analysis of lipid species containing a carboxyl group with a charge-remote fragmentation-assisted approach. Analytical Chemistry, 85(19), 9312–9320. [DOI] [PMC free article] [PubMed] [Google Scholar]
- 334.Schuhmann K, Herzog R, Schwudke D, Metelmann-Strupat W, Bornstein SR, & Shevchenko A (2011). Bottom-up shotgun lipidomics by higher energy collisional dissociation on LTQ Orbitrap mass spectrometers. Analytical Chemistry, 83(14), 5480–5487. [DOI] [PubMed] [Google Scholar]
- 335.Bird SS, Marur VR, Stavrovskaya IG, & Kristal BS (2013). Qualitative characterization of the rat liver mitochondrial lipidome using LC-MS profiling and high energy collisional dissociation (HCD) all ion fragmentation. Metabolomics, 9(1 Suppl), 67–83. [DOI] [PMC free article] [PubMed] [Google Scholar]
- 336.Smith CA, O’Maille G, Want EJ, Qin C, Trauger SA, Brandon TR, et al. (2005). METLIN: A metabolite mass spectral database. Therapeutic Drug Monitoring, 27(6), 747–751. [DOI] [PubMed] [Google Scholar]
- 337.Fahy E, Sud M, Cotter D, & Subramaniam S (2007). LIPID MAPS online tools for lipid research. Nucleic Acids Research, 35(Web Server), W606–W612. [DOI] [PMC free article] [PubMed] [Google Scholar]
- 338.Swenberg JA, Lu K, Moeller BC, Gao L, Upton PB, Nakamura J, et al. (2011). Endogenous versus exogenous DNA adducts: Their role in carcinogenesis, epidemiology, and risk assessment. Toxicological Sciences, 120(Suppl 1), S130–S145. [DOI] [PMC free article] [PubMed] [Google Scholar]
- 339.Cooke MS, Evans MD, Dizdaroglu M, & Lunec J (2003). Oxidative DNA damage: Mechanisms, mutation, and disease. The FASEB Journal, 17(10), 1195–1214. [DOI] [PubMed] [Google Scholar]
- 340.Kryston TB, Georgiev AB, Pissis P, & Georgakilas AG (2011). Role of oxidative stress and DNA damage in human carcinogenesis. Mutation Research, 711(1–2), 193–201. [DOI] [PubMed] [Google Scholar]
- 341.Cadet J, & Wagner JR (2013). DNA base damage by reactive oxygen species, oxidizing agents, and UV radiation. Cold Spring Harbor Perspectives in Biology, 5(2). [DOI] [PMC free article] [PubMed] [Google Scholar]
- 342.Cadet J, & Poulsen H (2010). Measurement of oxidatively generated base damage in cellular DNA and urine. Free Radical Biology & Medicine, 48(11), 1457–1459. [DOI] [PubMed] [Google Scholar]
- 343.Lin HS, Jenner AM, Ong CN, Huang SH, Whiteman M, & Halliwell B (2004). A high-throughput and sensitive methodology for the quantification of urinary 8-hydroxy-2′-deoxyguanosine: Measurement with gas chromatography-mass spectrometry after single solid-phase extraction. The Biochemical Journal, 380(Pt 2), 541–548. [DOI] [PMC free article] [PubMed] [Google Scholar]
- 344.Dizdaroglu M, Jaruga P, & Rodriguez H (2001). Measurement of 8-hydroxy-2′-deoxyguanosine in DNA by high-performance liquid chromatography-mass spectrometry: Comparison with measurement by gas chromatography-mass spectrometry. Nucleic Acids Research, 29(3), E12. [DOI] [PMC free article] [PubMed] [Google Scholar]
- 345.Podmore ID, Cooper D, Evans MD, Wood M, & Lunec J (2000). Simultaneous measurement of 8-oxo-2′-deoxyguanosine and 8-oxo-2′-deoxyadenosine by HPLC-MS/MS. Biochemical and Biophysical Research Communications, 277(3), 764–770. [DOI] [PubMed] [Google Scholar]
- 346.Taghizadeh K, McFaline JL, Pang B, Sullivan M, Dong M, Plummer E, et al. (2008). Quantification of DNA damage products resulting from deamination, oxidation and reaction with products of lipid peroxidation by liquid chromatography isotope dilution tandem mass spectrometry. Nature Protocols, 3(8), 1287–1298. [DOI] [PMC free article] [PubMed] [Google Scholar]
- 347.Ma B, Jing M, Villalta PW, Kapphahn RJ, Montezuma SR, Ferrington DA, et al. (2016). Simultaneous determination of 8-oxo-2′-deoxyguanosine and 8-oxo-2′-deoxyadenosine in human retinal DNA by liquid chromatography nanoelectrospraytandem mass spectrometry. Scientific Reports, 6, 22375. [DOI] [PMC free article] [PubMed] [Google Scholar]
- 348.Kreutzer DA, & Essigmann JM (1998). Oxidized, deaminated cytosines are a source of C --> T transitions in vivo. Proceedings of the National Academy of Sciences of the United States of America, 95(7), 3578–3582. [DOI] [PMC free article] [PubMed] [Google Scholar]
- 349.Li D, Wang M, Liehr JG, & Randerath K (1995). DNA adducts induced by lipids and lipid peroxidation products: Possible relationships to I-compounds. Mutation Research, 344(3–4), 117–126. [DOI] [PubMed] [Google Scholar]
- 350.Blair IA (2001). Lipid hydroperoxide-mediated DNA damage. Experimental Gerontology, 36(9), 1473–1481. [DOI] [PubMed] [Google Scholar]
- 351.Blair IA (2008). DNA adducts with lipid peroxidation products. The Journal of Biological Chemistry, 283(23), 15545–15549. [DOI] [PMC free article] [PubMed] [Google Scholar]
- 352.Pollack M, Yang IY, Kim HY, Blair IA, & Moriya M (2006). Translesion DNA synthesis across the heptanone--etheno-2′-deoxycytidine adduct in cells. Chemical Research in Toxicology, 19(8), 1074–1079. [DOI] [PubMed] [Google Scholar]
- 353.Marnett LJ (1999). Lipid peroxidation-DNA damage by malondialdehyde. Mutation Research, 424(1–2), 83–95. [DOI] [PubMed] [Google Scholar]
- 354.Ma B, Villalta PW, Balbo S, & Stepanov I (2014). Analysis of a malondialdehyde-deoxyguanosine adduct in human leukocyte DNA by liquid chromatography nanoelectrospray-high-resolution tandem mass spectrometry. Chemical Research in Toxicology, 27(10), 1829–1836. [DOI] [PMC free article] [PubMed] [Google Scholar]