Abstract
Petroleum-contaminated groundwater discharged from underground crude oil storage cavities (cavity groundwater) harbored more than 106 microorganisms ml−1, a density 100 times higher than the densities in groundwater around the cavities (control groundwater). To characterize bacterial populations growing in the cavity groundwater, 46 PCR-amplified almost full-length 16S ribosomal DNA (rDNA) fragments were cloned and sequenced, and 28 different sequences were obtained. All of the sequences were affiliated with the Proteobacteria; 25 sequences (43 clones) were affiliated with the epsilon subclass, 2 were affiliated with the beta subclass, and 1 was affiliated with the delta subclass. Two major clusters (designated clusters 1 and 2) were found for the epsilon subclass proteobacterial clones; cluster 1 (25 clones) was most closely related to Thiomicrospira denitrificans (88% identical in nucleotide sequence), while cluster 2 (11 clones) was closely related to Arcobacter spp. Denaturing gradient gel electrophoresis (DGGE) of PCR-amplified partial 16S rDNA fragments showed that one band was detected most strongly in cavity groundwater profiles independent of storage oil type and season. The sequence of this major band was identical to the sequences of most of the cluster 1 clones. Fluorescence in situ hybridization (FISH) indicated that the cluster 1 population accounted for 12 to 24% of the total bacterial population. This phylotype was not detected in the control groundwater by DGGE and FISH analyses. These results indicate that the novel members of the epsilon subclass of the Proteobacteria grow as major populations in the petroleum-contaminated cavity groundwater.
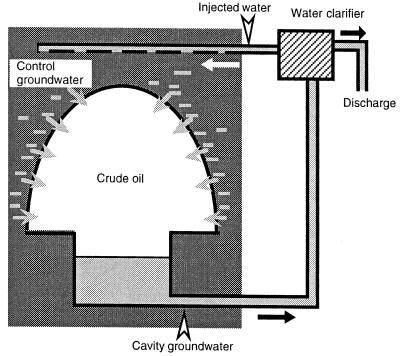
Underground cavities have been used for long-term storage of crude oil in several countries, such as Japan, Korea, and Norway, and are constructed in groundwater-rich rocky strata where high groundwater pressure confines the stored oil in the cavities (Fig. 1). Consequently, groundwater migrates into and accumulates at the bottom of a cavity (cavity groundwater), and this cavity groundwater is discharged to maintain the oil storage capacity of the cavity. The discharged groundwater, which is contaminated with petroleum hydrocarbons, is then purified by using water clarifiers before release into the sea. Some of the purified water is also injected back into the rock surrounding the cavity to maintain the groundwater pressure. This flow of groundwater may establish a continuous culture in which microorganisms grow on petroleum hydrocarbons. The habitat in the cavity groundwater can be characterized by (i) immediate contact with a large quantity of crude oil and (ii) an excess of electron donors (i.e., hydrocarbons) but a shortage of electron acceptors (Table 1). These characteristics may be similar to those of microbial communities in water-injected oil fields at moderate subsurface depths (5, 33). However, the ionic strengths of the water in these two habitats are quite different; in oil fields seawater is injected to enhance oil recovery, while fresh groundwater is the source of water in the oil storage cavities, which results in significant differences in the sulfate concentration. It is thus likely that different microbial populations grow in these two habitats.
FIG. 1.
Diagram of an underground oil storage cavity, showing the groundwater flow (arrows) and sampling points (arrowheads).
TABLE 1.
Characteristics of groundwater samplesa
| Water | Vol (106 liters) | Temp (°C) | pH | ORP (mV)b | Concn (mg liter−1) of:
|
TDC (cells ml−1) | ||||
|---|---|---|---|---|---|---|---|---|---|---|
| SO42− | NO3− | NO2− | Fec | TOCd | ||||||
| Cavity groundwater | ||||||||||
| TK101: Umm shaife | 350 | 16.0 ± 0.2 | 7.8 ± <0.1 | −131 ± 13 | 7.0 ± 2.5 | 0.10 ± 0.05 | 0.010 ± 0.001 | 0.04 ± 0.03 | 36 ± 5.0 | 6.4 × 10⁶ ± 0.7 × 10⁶ |
| TK102: Khafjie | 700 | 15.3 ± 0.1 | 7.7 ± <0.1 | −124 ± 18 | 4.8 ± 1.5 | 0.03 ± 0.03 | 0.009 ± 0.006 | 0.01 ± <0.01 | 32 ± 3.3 | 4.1 × 10⁶ ± 0.4 × 10⁶ |
| TK103: Houte | 700 | 15.7 ± 0.3 | 7.7 ± <0.1 | −113 ± 2 | 4.1 ± 0.1 | 0.07 ± 0.02 | 0.012 ± 0.004 | 0.02 ± <0.01 | 30 ± 4.1 | 3.8 × 10⁶ ± 0.5 × 10⁶ |
| Injected water | 14.4 ± 1.2 | 8.8 ± <0.1 | 67 ± 13 | 8.8 ± 1.8 | 0.22 ± <0.01 | 0.004 ± 0.002 | <0.01 | 6.8 ± 1.4 | 2.7 × 10⁵ ± 0.4 × 10⁵ | |
| Control groundwater 1 | 15.4 ± 3.3 | 7.6 ± <0.1 | 40 ± 6 | 3.9 ± 0.8 | 30 ± 0.4 | 0.005 ± <0.001 | 0.02 ± <0.01 | 2.5 ± 0.7 | 3.1 × 10⁴ ± 1.1 × 10⁴ | |
| Control groundwater 2 | 16.7 ± 2.6 | 7.6 ± 0.2 | −24 ± 11 | 8.2 ± 0.1 | 7.8 ± 0.5 | 0.006 ± 0.003 | <0.01 | 1.9 ± 1.0 | 2.3 × 10⁴ ± 0.4 × 10⁴ | |
The values are means ± standard errors based on values measured at four different times (July 1998, November 1998, March 1999, and May 1999).
ORP, oxidation-reduction potential.
Total iron concentration.
TOC, total organic carbon concentration.
Places at which stored crude oil was produced.
Biodegradation of petroleum hydrocarbons in subsurface environments has attracted much attention, because these compounds may persist for a long time under anaerobic conditions. Bacteria capable of anaerobically transforming alkanes (12) and aromatic compounds (15, 25, 28, 38) have been isolated and studied in the laboratory. These bacteria comprise sulfate reducers, nitrate reducers, and Fe(III) reducers, and they may be distributed according to the redox states and available electron acceptors in the habitat. However, there have been few studies on in situ degradation of contaminating hydrocarbons in subsurface environments. Anderson et al. found that members of the family Geobacteraceae were major benzene-oxidizing organisms in Fe(III)-reducing zones by combining data from in situ benzene mineralization experiments and data from molecular detection of indigenous bacteria (3).
The aim of the present study was to characterize bacterial populations growing in cavity groundwater. As described above, an underground oil storage cavity provides a unique groundwater habitat, and it was hypothesized that cavity groundwater might harbor unique microbial populations.
MATERIALS AND METHODS
Sampling.
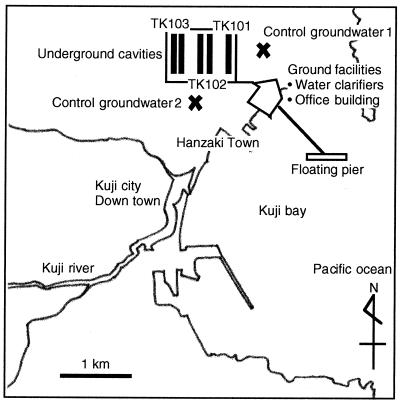
Samples were obtained at the crude oil storage facilities in Kuji, Iwate, Japan, in 1998 and 1999. The Kuji facilities consist of three oil storage cavities, named TK101, TK102, and TK103, in which three different crude oil types are stored (Table 1). Figures 1 and 2 show the sampling sites. The facilities shown in Fig. 2 include office buildings and water clarifiers. Control groundwater samples were obtained from wells around the cavities (Fig. 2). Cavity groundwater and injected water were obtained from sampling facilities at the sites indicated in Fig. 1. The mean hydraulic residence time of groundwater in the cavities was approximately 7 days. The cavity groundwater samples were obtained from drain pipelines just outside the cavities. The temperatures, pHs, and oxidation-reduction potentials of samples were measured with Water Tester (HANNA Instruments Japan) immediately after sampling. Total direct counts (TDC) of microorganisms were determined within 5 h after sampling by using fluorescence microscopy after microorganisms were stained with 4′,6′-diamidino-2-phenylindole (DAPI) (36). Water samples were stored at 4°C before ion concentrations and total organic carbon concentrations were measured. Sulfate, nitrate, and nitrite concentrations were measured with an ion chromatograph (model LA-100 ion analyzer; Toa Electronics Ltd.) used according to the manufacturer's instructions. Total (ferric and ferrous) iron was measured by the phenanthroline method after the sample was chemically reduced in 1% hydroxylamine (8). Total organic carbon concentrations were measured with a total organic carbon analyzer (model TOC-5000A; Shimadzu) used according to the manufacturer's instructions.
FIG. 2.
Map of sampling sites.
DNA extraction.
Microorganisms in 2 liters of groundwater were collected on a 0.22-μm-pore-size membrane filter (type GV; Millipore) by filtration within 5 h after sampling. The membrane filter was soaked in 0.5 ml of a cell suspension buffer (10 mM Tris-HCl [pH 8.0], 1 mM EDTA, 0.35 M sucrose, 20 mg of lysozyme me ml−1) (34). After incubation for 10 min at 37°C, 0.75 ml of a lysing solution (100 mM Tris-HCl [pH 8.0], 0.3 M NaCl, 20 mM EDTA, 2% [wt/vol] sodium dodecyl sulfate, 2% [wt/vol] 2-mercaptoethanol) was added, and the suspension was incubated at 70°C for 30 min. The membrane filter was then removed, and the solution was extracted twice with phenol-chloroform (29). Two volumes of ethanol was added, and the sample was incubated at −20°C for 2 h. Nucleic acids were precipitated by centrifugation at 20,000 × g for 10 min, washed with 1 ml of a 70% (vol/vol) ethanol solution, and then dissolved in 0.5 ml of TE buffer (29) containing 100 μg of RNase A. The solution was incubated at 37°C for 1 h, and DNA was precipitated by adding 2 volumes of ethanol, followed by washing with 1 ml of a 70% ethanol solution. Finally, the DNA was dissolved in 0.2 ml of TE buffer. The extracted DNA was quantified by measuring the UV absorption spectrum (29).
Cloning and sequencing of 16S rDNA.
Almost full-length 16S ribosomal DNA (rDNA) was PCR amplified with the following primers: 5′-AGAGTTTGATYMTGGCTCAG-3′ (corresponding to Escherichia coli 16S rDNA positions 8 to 27 [4]) and 5′-CAKAAAGGAGGTGATCC-3′ (corresponding to E. coli 16S rDNA positions 1529 to 1546 [4]). Amplification was performed with a Progene thermal cycler (Techne) by using a 50-μl mixture containing 1.25 U of Taq DNA polymerase (Amplitaq Gold; Perkin-Elmer), 10 mM Tris-HCl (pH 8.3), 50 mM KCl, 1.5 mM MgCl2, 0.001% (wt/vol) gelatin, each deoxynucleoside triphosphate at a concentration of 200 μM, 50 pmol of each primer, and 10 ng of DNA. The PCR conditions used were as follows: 10 min of activation of the polymerase at 94°C, followed by 40 cycles consisting of 1 min at 94°C, 1 min at 50°C, and 2 min at 72°C, and finally 10 min of extension at 72°C. PCR products were electrophoresed through a 0.8% (wt/vol) low-melting-point agarose gel in TBE buffer (29) and then purified with a QIAquick gel extraction kit (QIAGEN). The purified PCR products were ligated into the pGEM-T vector (Promega) as described in the manufacturer's instructions, and the ligation product was introduced into E. coli competent cells supplied in the pGEM-T vector cloning kit. White colonies on Luria-Bertani plates (29) supplemented with ampicillin (50 μg ml−1), isopropyl-β-d-thiogalactopyranoside, and 5-bromo-4-chloro-3-indolyl-β-d-galactoside (29) were selected and were subjected to PCR with primers T7W (5′-TAATACGACTCACTATAGGGC-3′) and SP6W (5′-ATTTAGGTGACACTATAGAATACTC-3′). The primers targeted the pGEM-T vector sequences flanking the insertion. This amplification was performed with a Progene thermal cycler by using a 50-μl mixture as described above, except that a small amount of E. coli cells picked from a colony with a needle was added instead of DNA. The PCR conditions were same with those described above. The nucleotide sequences of the PCR products were determined as described previously (36).
DGGE.
The variable V3 region of bacterial 16S rDNA (corresponding to positions 341 to 534 in the E. coli sequence) was analyzed by denaturing gradient gel electrophoresis (DGGE) after PCR amplification with primers P2 and P3 (18). The PCR conditions used have been described previously (35). DGGE was performed with a D-Code system (Bio-Rad Laboratories) used according to the manufacturer's instructions. Ten percent (wt/vol) polyacrylamide gels with a 40 to 55% denaturant gradient (18) were used, and electrophoresis was performed for 3.5 h at 200 V at 58°C. Subsequently, the gels were stained with SYBR Gold (FMC Bioproducts) used according to the manufacturer's instructions, and gel images were obtained by using the Gel Doc 2000 system (Bio-Rad Laboratories). Densitometry of DGGE profiles was conducted by using the Multianalyst Software supplied with Gel Doc 2000. Nucleotide sequences of DGGE bands were determined by using previously described methods (35).
Nucleotide sequence analysis.
Database searches with 16S rDNA sequences determined in this study were conducted by using the BLAST program (13) and the GenBank database. The profile alignment technique of ClustalW, version 1.7 (32), was used to align the sequences, and the alignments were refined by visual inspection; secondary structures were considered for the refinement analysis (10). Phylogenetic analyses were performed by applying the DNAML program in PHYLIP, version 3.5c (9), and the tree structure was evaluated by the global rearrangement method (9). Nucleotide positions at which any sequence had an ambiguous base were not included in the phylogenetic calculations. Checks for chimeric sequences were conducted by using the chimera check in the RDP database (16).
In situ hybridization.
A rhodamine-labeled oligonucleotide probe, EPS710 (5′-CAGTATCATCCCAGCAGA-3′), was used for fluorescence in situ hybridization (FISH) to specifically detect the cluster 1 bacteria (see Results for the definition of cluster 1 bacteria). This probe was designed by comparing the 16S rDNA sequences shown in Fig. 3 and 4. Only the 16S rDNA sequences of the cluster 1 bacteria completely matched the probe sequence. Bacterial cells in groundwater were collected by centrifugation at 10,000 × g for 10 min, suspended in phosphate-buffered saline (1), and fixed in a 4% (wt/vol) paraformaldehyde solution for 5 h at 0°C. The cells were attached to gelatin-coated slides (1) and dehydrated by sequential washes in 50, 80, and 98% (vol/vol) ethanol (3 min each). Subsequently, 8 μl of hybridization solution (0.9 M NaCl, 20 mM Tris-HCl [pH 7.2], 0.01% [wt/vol] sodium dodecyl sulfate, 20% [wt/vol] formamide) containing 50 ng of probe was added to each hybridization well and was incubated at 40°C for 3 h in a humid chamber. Slides were washed in the hybridization solution at 42°C for 20 min before all cells on the slide were stained with DAPI (1). More than 1,000 DAPI-stained cells were counted to determine the ratio of probe-labeled cells to DAPI-stained cells.
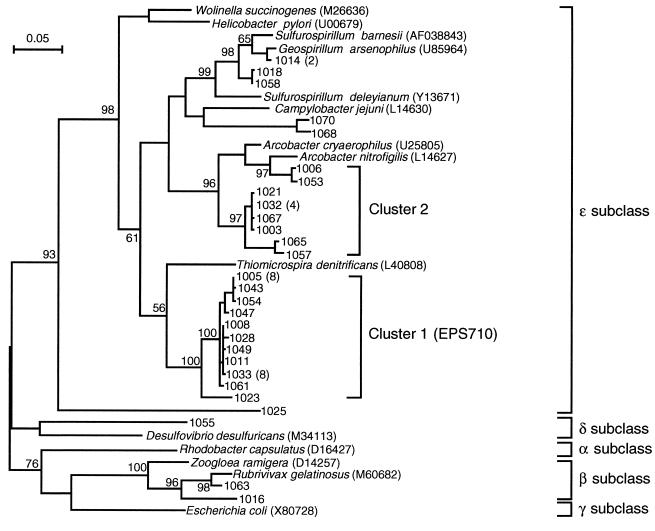
FIG. 3.
Unrooted maximum-likelihood tree showing the phylogenetic positions of 16S rDNA sequences cloned from the cavity groundwater. Sequences corresponding to nucleotide positions 50 to 1407 of the E. coli sequence were used for calculations. A number in parentheses indicates the number of clones obtained for each sequence. Accession numbers of the sequences retrieved from the databases are also indicated in parentheses. The numbers at the branch nodes are bootstrap values (per 100 trials); only values greater than 50 are shown. This tree also includes a cluster of 16S rDNAs having a sequence identical to that of probe EPS710. The scale bar indicates 0.05 substitution per site.
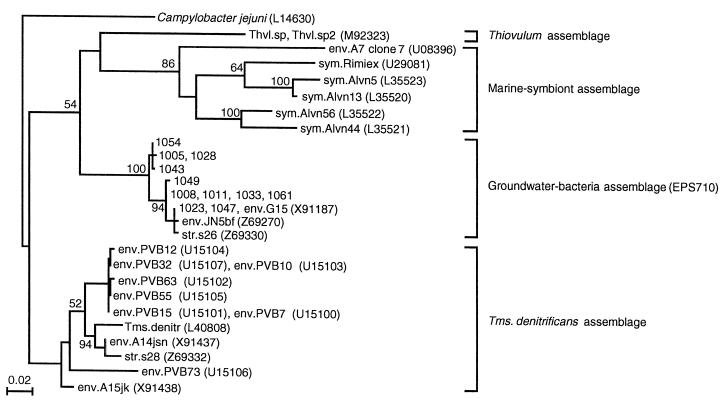
FIG. 4.
Maximum-likelihood tree based on partial 16S rDNA sequences (nucleotide positions 538 to 898 of the E. coli sequence) and showing the relationships among the cluster 1 clones and Thiovulum subgroup sequences found in the database. Campylobacter jejuni is used as the outgroup. The scale bar indicates 0.02 substitution per site. For more details see the legend to Fig. 3. Thvl., Thiovulum; Tms. denitr. Thiomicrospira denitrificans.
Nucleotide sequence accession numbers.
The nucleotide sequences reported in this paper have been deposited in the GSDB, DDBJ, EMBL, and NCBI nucleotide sequence databases under accession no. AB030587 to AB030614 (cloned 16S rDNA) and AB030629 to AB030635 (DGGE bands).
RESULTS
Groundwater samples.
Table 1 shows physical and chemical characteristics and TDC values of the groundwater samples. The oxidation-reduction potential values indicate that the cavity groundwater was anaerobic. The data also show that the nitrate concentrations in the cavity groundwater were significantly lower than the concentrations in the control groundwater (P < 0.01, evaluated by the t test). The TDC values of the cavity groundwater were more than 100 times higher than the values of the control groundwater and 10 times higher than the value of the injected water.
Cloning and sequencing.
To characterize bacterial populations in the cavity groundwater, 46 almost full-length 16S rDNA fragments cloned from TK101 groundwater obtained in July 1998 were sequenced. The sequenced clones were designated with four numbers (e.g., 1003 to 1070), as shown in Fig. 3. A total of 28 different sequences were found. None of the sequences were judged to be a chimera. A maximum-likelihood tree was constructed with these sequences and related sequences in the databases (Fig. 3). All the sequences determined were affiliated with the class Proteobacteria; 25 sequences (43 clones) were affiliated with the epsilon subclass, 1 sequence was affiliated with the delta subclass, and 2 sequences were affiliated with the beta subclass. Two major clusters of sequences were found. The largest cluster (cluster 1) was most closely related to Thiomicrospira denitrificans (88% identical in nucleotide sequence), while the second-largest cluster (cluster 2) was closely related to Arcobacter spp. The cluster 1 clones were considered to belong to the Thiovulum subgroup (16), as shown in Fig. 4. We found that Thiovulum subgroup sequences were divided into four assemblages; the cluster 1 sequences grouped in the groundwater bacterial assemblage together with three other sequences. Interestingly, these three sequences, str.s26, env.G15, and env.JN5bf, were also cloned from groundwater.
DGGE.
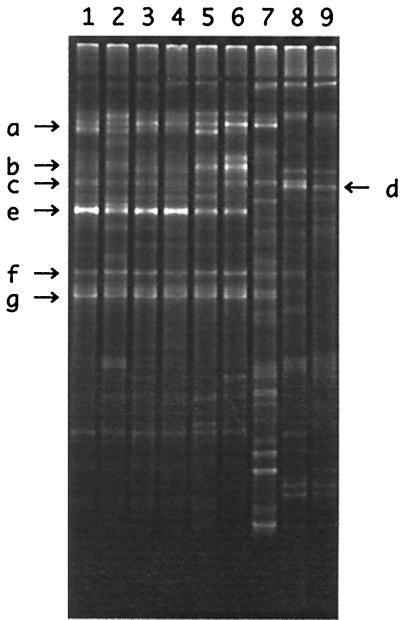
To compare bacterial population structures in different groundwater samples obtained from either different oil storage cavities or control groundwater wells and to investigate seasonal fluctuation in the population structure, DGGE analyses with partial 16S rDNA fragments were conducted (Fig. 5). The sequences of some of the major bands indicated on Fig. 5 were then determined (Table 2). The sequence of the most intense band (band e), which was found in all cavity groundwater profiles, was identical to the sequence of most of the cluster 1 clones. Band e did not appear in the profiles of the control groundwater or the injected water. Figure 5 also shows that the seasonal fluctuation in the population structure in TK101 groundwater was not great. A densitometry analysis of the DGGE profiles (Fig. 5) indicated that the intensity of band e in the cavity groundwater profiles shared 12% (lane 6) to 37% (lane 4) of the total band intensities.
FIG. 5.
DGGE profiles of the partial 16S rDNA fragments, showing similarities and differences in the bacterial population structures in groundwater samples. Lane 1, TK101 cavity groundwater obtained in May 1998; lane 2, TK101 cavity groundwater obtained in July 1998; lane 3, TK101 cavity groundwater obtained in November 1998; lane 4, TK101 cavity groundwater obtained in March 1999; lane 5, TK102 cavity groundwater obtained in July 1998; lane 6, TK103 cavity groundwater obtained in July 1998, lane 7, injected water obtained in July 1998; lane 8, control groundwater 1 obtained in July 1998; lane 9, control groundwater 2 obtained in July 1998.
TABLE 2.
Sequence analysis of major DGGE bands
| DGGE banda | Length (bases) | Database search
|
Identical clone(s) | |
|---|---|---|---|---|
| Phylogenetically related organism (accession no.) | % Identity | |||
| a | 189 | Flavobacterium ferrugineum (M62798) | 93 | |
| b | 169 | Arcobacter nitrofigilis (L14627) | 100 | 1006 |
| c | 173 | Meiothermus ruber (Y13594) | 83 | |
| d | 194 | Pseudomonas sp. (D37925) | 100 | |
| e | 169 | Thiomicrospira denitrificans (L40808) | 97 | 1005, 1008, 1011, 1028, 1043, 1047, 1051, 1054, 1061 |
| f | 194 | Hydrogenophaga taeniospiralis (AF078768) | 90 | |
| g | 194 | Burkholderia phenazinium (U96936) | 95 | |
DGGE bands marked in Fig. 5 were sequenced.
FISH.
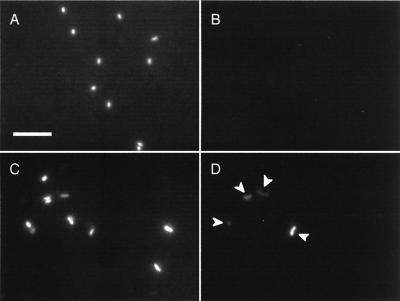
FISH is another valuable means for identifying and monitoring specific organisms in the natural environment (2). To analyze the cluster 1 population in groundwater samples, FISH was performed with probe EPS710. Typical examples of the FISH images are presented in Fig. 6. As shown in this figure, positive FISH signals appeared only in the cavity groundwater samples, although most of the signals were weak. It was also found that the labeled cells were curved rods. They occurred singly, while some cells appeared as pairs attached at their poles. The ratios of the number of probe-labeled cells (the cluster 1 bacteria) to the number of DAPI-stained cells were determined for the TK101 groundwater samples obtained in July 1998 and March 1999 (Table 3). Cells labeled with EPS710 were not found in the control groundwater and injected water samples, suggesting that the population densities were less than 0.1% of the TDC values.
FIG. 6.
Epifluorescence micrographs of DAPI-stained cells (A and C) and EPS710-labeled cells (B and D), showing typical examples of the results of FISH analysis of control groundwater 1 (A and B; same image field) and TK101 cavity groundwater obtained in July 1998 (C and D; same image field). Signals counted as EPS710-labeled cells are indicated by arrowheads. The size bar (5 μm) in panel A applies to all panels.
TABLE 3.
Comparison of the ratios of the cluster 1 population to the total population as determined by three different methods
| Groundwater | Cluster 1 population/total population (%)
|
||
|---|---|---|---|
| Cloning | DGGEa | FISHb | |
| TK101, July 1998 | 54 (50)c | 21 ± 2 | 12 ± 1 |
| TK101, March 1999 | NDd | 37 ± 4 | 24 ± 1 |
Mean ± standard error (n = 3).
Mean ± standard error (n = 4).
The number in parentheses is the ratio obtained after elimination of two cluster 1 sequences which are not identical to the sequence of band e in the DGGE gel.
ND, not determined.
DISCUSSION
This study employed three 16S rRNA approaches, cloning and sequencing, DGGE, and FISH, to characterize bacterial populations in petroleum-contaminated cavity groundwater. Although there were some quantitative variations (see below), all three approaches revealed that the cluster 1 bacteria affiliated with the epsilon subclass of the Proteobacteria were a dominant population in the cavity groundwater. The observations that this population was detected in the TK101 groundwater throughout a year (Fig. 5) and could not be detected in the control groundwater (Fig. 5), combined with the low TDC values of the control groundwater (Table 1), indicate that this novel epsilon-proteobacterial population grows in the groundwater pool in the oil storage cavity.
The cluster 1 bacteria were affiliated with the Thiovulum subgroup (Fig. 3 and 4) and formed a peculiar assemblage together with three sequences in the nucleotide databases (Fig. 4). Interestingly, all of the sequences in this assemblage were cloned from groundwater, although these sequences were obtained from geologically distant sites; str.s26 was obtained in Sweden (22), env.G15 was obtained in Gabon (20), env.JN5bf was obtained in Jordan (23), and the cluster 1 clones were obtained in Japan. This finding suggests that bacteria belonging to the groundwater assemblage are widely distributed in subterranean environments. The three sequences other than the cluster 1 sequences were obtained as minor clones from the environment at three sites (20, 22, 23), and it would be interesting to examine if the populations at these sites are also enriched after contact with petroleum.
The Thiovulum subgroup includes two isolated bacteria, Thiovulum sp. and Thiomicrospira denitrificans. Thiovulum sp. has been found in sharply localized white masses where sulfide meets oxygen in marine sediments, saline springs, and freshwater environments (27), and this bacterium is not capable of growing in the presence of elevated oxygen concentrations. T. denitrificans has been isolated from anaerobic marine sediments; this bacterium has been shown to grow autotrophically at the expense of sulfide and thiosulfate as the electron donors and nitrate as the electron acceptor (14). Other members of the Thiovulum subgroup were 16S rDNA sequences directly cloned from anaerobic environments, including marine hyperthermal vents (11, 17, 24), marine sediment (7), and groundwater (20–23). On the basis of the information described above, the physiology of Thiovulum subgroup bacteria could be assumed; these organisms thrive autotrophically at the expense of reduced sulfur as the electron donor and nitrate or oxygen as the electron acceptor in oxygen-limited environments. The chemical analyses of the cavity groundwater samples (Table 1) also suggested that nitrate was a possible electron acceptor for anaerobic growth of the cluster 1 population in the cavity groundwater. For a more complete understanding of the physiology of the cluster 1 bacteria, pure-culture experiments are needed. The phylogenetic information obtained in this study would be useful for isolating the cluster 1 bacteria.
This study compared results of the three molecular methods, cloning, DGGE, and FISH, to gain insight into the abundance of the cluster 1 bacteria in TK101 groundwater (Table 3). We found differences in the ratios of the cluster 1 population to the total population estimated by the three methods. A number of reports have suggested the limitations of PCR-mediated methods (e.g., cloning and DGGE) in quantitative analyses; possible biases are known to be associated with the DNA extraction (37) and PCR amplification steps (26, 31, 37). When the three ratios for the July 1998 sample were compared, it was apparent that the ratio obtained by the cloning method was very different from the ratios obtained by the DGGE and FISH methods. Since the same DNA preparation was used in the cloning and DGGE analyses and similar DGGE profiles were obtained by directly amplifying 16S rDNAs from boiled cavity groundwater without DNA purification (data not shown), the difference in the ratios obtained with these two methods resulted from biases associated with the PCR amplification and/or cloning steps.
Table 3 also shows that the cluster 1 population was more abundantly detected by DGGE than by FISH (P < 0.05), although the difference was rather small compared to the differences reported in previous studies. Nielsen et al. (19) estimated the abundance of a beta-proteobacterial population in sludge from a deteriorated biological phosphate removal reactor by densitometry of DGGE profiles (75% of the total PCR-amplified sequences) and by FISH (35% of the total number of cells). It has been suggested that PCR-mediated methods tend to overestimate the abundance of detected populations, since these methods fail to detect some populations whose DNA fragments are difficult to amplify.
In this study, there was also possible bias in the FISH analysis. As shown in Fig. 6, most of the labeled cells exhibited weak signals. Since the mean residence time of groundwater in the cavity was approximately 7 days and the electron acceptors were limited, cluster 1 bacteria may have been under starvation conditions, resulting in low rRNA contents (6) and weak FISH signals. The weak signals must not have been due to nonspecific binding of the probe, because (i) the non-cluster 1 sequences cloned from the cavity groundwater had three or more mismatches compared to the probe sequence and (ii) no weak signals were observed in control groundwater images. We also found that the intensities of FISH signals were not constant, suggesting that cluster 1 bacteria in the cavity groundwater were physiologically heterogeneous. This implies that there may have been very weakly labeled cells that could not be visualized in the image analysis. Thus, we believe that FISH analysis tends to underestimate the abundance of slowly growing bacteria with low rRNA contents.
As suggested previously (30, 37), this study demonstrated the importance of cross-checking the results of different approaches used for quantitative analysis of microbial populations. Understanding inherent biases in each method is also important.
ACKNOWLEDGMENTS
We thank Robert Kanaly for critical reading of the manuscript. We also thank Koichi Nakagaki and Yoichi Matsumura (Japan Underground Oil Storage Co.) for their kind help in the sampling of groundwater and Ikuko Hiramatsu for technical assistance.
This work was performed as a part of the Industrial Science and Technology Project, Technological Development of Biological Resources in Bioconsortia, supported by the New Energy and Industrial Technology Development Organization (NEDO).
REFERENCES
- 1.Amann R I. In situ identification of microorganisms by whole cell hybridization with rRNA-targeted nucleic acid probes. In: Akkermans A D L, van Elsas J D, de Bruijn F J, editors. Molecular microbial ecology manual. Dordrecht, The Netherlands: Kluwer Academic Publishers; 1995. pp. 3.3.6:1–3.3.6:15. [Google Scholar]
- 2.Amann R I, Ludwig W, Schleifer K H. Phylogenetic identification and in situ detection of individual microbial cells without cultivation. Microbiol Rev. 1995;59:143–169. doi: 10.1128/mr.59.1.143-169.1995. [DOI] [PMC free article] [PubMed] [Google Scholar]
- 3.Anderson R T, Rooney-Varge J N, Gaw C V, Lovley D R. Anaerobic benzene oxidation in the Fe(III) reduction zone of petroleum-contaminated aquifers. Environ Sci Technol. 1998;32:1222–1229. [Google Scholar]
- 4.Brosius J, Dull T J, Sleeter D D, Noller H F. Gene organization and primary structure of a ribosomal RNA operon from Escherichia coli. J Mol Biol. 1981;148:107–127. doi: 10.1016/0022-2836(81)90508-8. [DOI] [PubMed] [Google Scholar]
- 5.Cold-Ruwisch R, Kleinitz W, Widdel F. Sulfate-reducing bacteria and their activities in oil production. J Petrol Technol. 1987;39:97–106. [Google Scholar]
- 6.DeLong E F, Wickham G S, Pace N R. Phylogenetic stains: ribosomal RNA-based probes for the identification of single cells. Science. 1989;243:1360–1363. doi: 10.1126/science.2466341. [DOI] [PubMed] [Google Scholar]
- 7.Devereux R, Mundfrom G W. A phylogenetic tree of 16S rRNA sequences from sulfate-reducing bacteria in a sandy marine sediment. Appl Environ Microbiol. 1994;60:3437–3439. doi: 10.1128/aem.60.9.3437-3439.1994. [DOI] [PMC free article] [PubMed] [Google Scholar]
- 8.Eaton A D, Clesceri L S, Greenberg A E, editors. Standard methods for the examination of water and wastewater. Washington, D.C.: American Public Health Association; 1995. pp. 3.68–3.70. [Google Scholar]
- 9.Felsenstein J. PHYLIP, phylogeny inference package (version 3.2) Cladistics. 1989;5:164–166. [Google Scholar]
- 10.Gutell R R. Collection of small subunit (16S and 16S-like) ribosomal RNA structures. Nucleic Acids Res. 1994;22:3502–3507. doi: 10.1093/nar/22.17.3502. [DOI] [PMC free article] [PubMed] [Google Scholar]
- 11.Haddad A, Camacho F, Durand P, Cary S C. Phylogenetic characterization of the epibiotic bacteria associated with the hydrothermal vent polychaete Alvinella pompejana. Appl Environ Microbiol. 1995;61:1679–1687. doi: 10.1128/aem.61.5.1679-1687.1995. [DOI] [PMC free article] [PubMed] [Google Scholar]
- 12.Heider J, Spormann A M, Beller H R, Widdel F. Anaerobic bacterial metabolism of hydrocarbons. FEMS Microbiol Rev. 1999;22:459–473. [Google Scholar]
- 13.Karlin S, Altschul S F. Methods for assessing the statistical significance of molecular sequence features by using general scoring schemes. Proc Natl Acad Sci USA. 1990;87:2264–2268. doi: 10.1073/pnas.87.6.2264. [DOI] [PMC free article] [PubMed] [Google Scholar]
- 14.Kuenen J G, Robertson L A, Tuovinen O H. The genus Thiomicrospira. In: Balows A, Trüper H G, Dworkin M, Harder W, Schleifer K H, editors. The prokaryotes. New York, N.Y: Springer-Verlag; 1992. pp. 2652–2657. [Google Scholar]
- 15.Lovley D R, Lonergan D J. Anaerobic oxidation of toluene, phenol and p-cresol by the dissimilatory iron-reducing organism GS-15. Appl Environ Microbiol. 1990;56:1858–1864. doi: 10.1128/aem.56.6.1858-1864.1990. [DOI] [PMC free article] [PubMed] [Google Scholar]
- 16.Maidak B L, Cole J R, Parker C T, Jr, Garrity G M, Larsen N, Li B, Lilburn T G, McCaughey M J, Olsen G J, Overbeek R, Pramanik S, Schmidt T M, Tiedje J M, Woese C R. A new version of the RDP (Ribosomal Database Project) Nucleic Acids Res. 1999;27:171–173. doi: 10.1093/nar/27.1.171. [DOI] [PMC free article] [PubMed] [Google Scholar]
- 17.Moyer C L, Dobbs F C, Karl D K. Phylogenetic diversity of the bacterial community from a microbial mat at an active, hydrothermal vent system, Loihi seamount, Hawaii. Appl Environ Microbiol. 1995;61:1555–1562. doi: 10.1128/aem.61.4.1555-1562.1995. [DOI] [PMC free article] [PubMed] [Google Scholar]
- 18.Muyzer G, de Waal E C, Uitterlinden A G. Profiling of complex microbial populations by denaturing gradient gel electrophoresis analysis of polymerase chain reaction-amplified genes coding for 16S rRNA. Appl Environ Microbiol. 1993;59:695–700. doi: 10.1128/aem.59.3.695-700.1993. [DOI] [PMC free article] [PubMed] [Google Scholar]
- 19.Nielsen A T, Liu W, Filipe C, Grady L, Jr, Molin S, Stahl D A. Identification of a novel group of bacteria in sludge from a deteriorated biological phosphorus removal reactor. Appl Environ Microbiol. 1999;65:1251–1258. doi: 10.1128/aem.65.3.1251-1258.1999. [DOI] [PMC free article] [PubMed] [Google Scholar]
- 20.Pedersen K, Arlinger J, Hallbeck L, Pettersson C. Diversity and distribution of subterranean bacteria in groundwater at Oklo in Gabon, Africa, as determined by 16S rRNA gene sequencing. Mol Ecol. 1996;5:427–436. doi: 10.1111/j.1365-294x.1996.tb00332.x. [DOI] [PubMed] [Google Scholar]
- 21.Pedersen K, Arlinger J, Ekendahl S, Hallbeck L. 16S rRNA gene diversity of attached and unattached bacteria in boreholes along the access tunnel to the AEspoe hard rock laboratory, Sweden. FEMS Microbiol Ecol. 1996;19:249–262. [Google Scholar]
- 22.Pedersen K, Hallbeck L, Arlinger J, Erlandson A C, Jahromi N. Investigation of the potential for microbial contamination of deep granitic aquifers during drilling using 16S rRNA gene sequencing and culturing methods. J Microbiol Methods. 1997;30:179–192. [Google Scholar]
- 23.Pedersen K, Arlinger J, Erlandson A C, Hallbeck L. Culturability and 16S rRNA gene diversity of microorganisms in the hyperalkaline groundwater of Maqarin, Jordan. In: Pederson K, editor. SKB technical report 97-22. Stockholm, Sweden: Swedish Nuclear Fuel and Waste Management Co; 1997. pp. 239–261. [Google Scholar]
- 24.Polz M F, Cavanaugh C M. Dominance of one bacterial phylotype at a mid-Atlantic ridge hydrothermal vent site. Proc Natl Acad Sci USA. 1995;92:7232–7236. doi: 10.1073/pnas.92.16.7232. [DOI] [PMC free article] [PubMed] [Google Scholar]
- 25.Rabus R, Nordhaus R, Ludwig W, Widdel F. Complete oxidation of toluene under strictly anoxic conditions by a new sulfate-reducing bacterium. Appl Environ Microbiol. 1993;59:1444–1451. doi: 10.1128/aem.59.5.1444-1451.1993. [DOI] [PMC free article] [PubMed] [Google Scholar]
- 26.Reysenbach A-L, Giver L J, Wickham G S, Pace N R. Differential amplification of rRNA genes by polymerase chain reaction. Appl Environ Microbiol. 1992;58:3417–3418. doi: 10.1128/aem.58.10.3417-3418.1992. [DOI] [PMC free article] [PubMed] [Google Scholar]
- 27.Riviere J W M, Schmidt K. The genus Thiovulum. In: Balows A, Trüper H G, Dworkin M, Harder W, Schleifer K H, editors. The prokaryotes. New York, N.Y: Springer-Verlag; 1992. pp. 3942–3947. [Google Scholar]
- 28.Rueter P, Rabus R, Wilkes H, Aeckersberg F, Rainey F A, Jannasch H W, Widdel F. Anaerobic oxidation of hydrocarbons in crude oil by new types of sulphate-reducing bacteria. Nature. 1994;372:455–458. doi: 10.1038/372455a0. [DOI] [PubMed] [Google Scholar]
- 29.Sambrook J, Fritsch E F, Maniatis T. Molecular cloning: a laboratory manual. 2nd ed. Cold Spring Harbor, N.Y: Cold Spring Harbor Laboratory; 1989. [Google Scholar]
- 30.Santegoeds C M, Ferdelman T G, Muyzer G, de Beer D. Structural and functional dynamics of sulfate-reducing populations in bacterial biofilms. Appl Environ Microbiol. 1998;64:3731–3739. doi: 10.1128/aem.64.10.3731-3739.1998. [DOI] [PMC free article] [PubMed] [Google Scholar]
- 31.Suzuki M T, Giovannoni S J. Bias caused by template annealing in the amplification of mixtures of 16S rRNA genes by PCR. Appl Environ Microbiol. 1996;62:625–630. doi: 10.1128/aem.62.2.625-630.1996. [DOI] [PMC free article] [PubMed] [Google Scholar]
- 32.Thompson J D, Higgins D G, Gibson T J. CLUSTAL W: improving the sensitivity of progressive multiple sequence alignment through sequence weighting, position-specific gap penalties and weight matrix choice. Nucleic Acids Res. 1994;22:4673–4680. doi: 10.1093/nar/22.22.4673. [DOI] [PMC free article] [PubMed] [Google Scholar]
- 33.Voordouw G, Armstrong S M, Reimer M F, Fouts B, Telang A J, Shen Y, Gevertz D. Characterization of 16S rRNA genes from oil field microbial communities indicates the presence of a variety of sulfate-reducing, fermentative, and sulfide-oxidizing bacteria. Appl Environ Microbiol. 1996;62:1623–1629. doi: 10.1128/aem.62.5.1623-1629.1996. [DOI] [PMC free article] [PubMed] [Google Scholar]
- 34.Watanabe K, Yamamoto S, Hino S, Harayama S. Population dynamics of phenol-degrading bacteria in activated sludge determined by gyrB-targeted quantitative PCR. Appl Environ Microbiol. 1998;64:1203–1209. doi: 10.1128/aem.64.4.1203-1209.1998. [DOI] [PMC free article] [PubMed] [Google Scholar]
- 35.Watanabe K, Teramoto M, Futamata H, Harayama S. Molecular detection, isolation, and physiological characterization of functionally dominant phenol-degrading bacteria in activated sludge. Appl Environ Microbiol. 1998;64:4396–4402. doi: 10.1128/aem.64.11.4396-4402.1998. [DOI] [PMC free article] [PubMed] [Google Scholar]
- 36.Watanabe K, Teramoto M, Harayama S. An outbreak of nonflocculating catabolic populations caused the breakdown of a phenol-digesting activated-sludge process. Appl Environ Microbiol. 1999;65:2813–2819. doi: 10.1128/aem.65.7.2813-2819.1999. [DOI] [PMC free article] [PubMed] [Google Scholar]
- 37.Wintzingerode F, Göbel U B, Stackebrandt E. Determination of microbial diversity in environmental samples: pitfalls of PCR-based rRNA analysis. FEMS Microbiol Rev. 1997;21:213–229. doi: 10.1111/j.1574-6976.1997.tb00351.x. [DOI] [PubMed] [Google Scholar]
- 38.Zhou J, Fries M R, Chee-Sanford J C, Tiedje J M. Phylogenetic analyses of a new group of denitrifiers capable of anaerobic growth on toluene and description of Azoarcus tolulyticus sp. nov. Int J Syst Bacteriol. 1995;45:500–506. doi: 10.1099/00207713-45-3-500. [DOI] [PubMed] [Google Scholar]


