Abstract
Homeostasis maintains serum metabolites within physiological ranges. For glucose, this requires insulin, which suppresses glucose production while accelerating its consumption. For other circulating metabolites, a comparable master regulator has yet to be discovered. Here we show that, in mice, many circulating metabolites are cleared via the tricarboxylic acid cycle (TCA) cycle in linear proportionality to their circulating concentration. Abundant circulating metabolites (essential amino acids, serine, alanine, citrate, 3-hydroxybutyrate) were administered intravenously in perturbative amounts and their fluxes were measured using isotope labelling. The increased circulating concentrations induced by the perturbative infusions hardly altered production fluxes while linearly enhancing consumption fluxes and TCA contributions. The same mass action relationship between concentration and consumption flux largely held across feeding, fasting and high- and low-protein diets, with amino acid homeostasis during fasting further supported by enhanced endogenous protein catabolism. Thus, despite the copious regulatory machinery in mammals, circulating metabolite homeostasis is achieved substantially through mass action-driven oxidation.
Circulating metabolites feed bodily organs a continuous supply of essential nutrients and building blocks1. Failure to maintain these circulating levels can cause disease2. For example, high blood glucose leads to diabetes and associated complications, including vascular damage and organ failure3,4. Abnormally elevated circulating branched-chain amino acids (BCAAs) (leucine, isoleucine and valine) predict insulin resistance5. Accumulation of phenylalanine due to inborn errors of metabolism results in seizures and mental disorders6.
To ensure metabolic homeostasis, mammals have evolved a varied hormonal and enzymatic regulatory machinery7–11. Insulin and glucagon are master hormonal regulators that control blood glucose and amino acids12–15. Branched-chain alpha-ketoacid dehydrogenase kinase (BCKDK) suppresses tissue BCAA catabolism via enzyme phosphorylation, favouring higher circulating BCAA levels16. While insulin is essential for glucose homeostasis, BCKDK is not essential for BCAA homeostasis, raising the question of which mechanisms prevent unacceptable BCAA excursions. Indeed, for most circulating metabolites except glucose, the primary mechanisms through which their levels are maintained within a physiological range are unclear. To investigate these, in this study we employed perturbative infusions of isotope-labelled metabolites. In contrast to minimally perturbative infusions, where the goal is to infuse just enough isotope-labelled metabolite to detect without altering endogenous concentrations or fluxes (Fig. 1a and Extended Data Fig. 1a), in this study we aimed to increase the overall metabolite concentration substantially (for example, 1.5–fivefold). As the infused metabolite’s level rises due to the perturbative infusion, endogenous metabolism may respond in various ways: increased consumption in proportion to the elevated levels (Fig. 1b, mass action); increased consumption greater than the concentration increase (Extended Data Fig. 1b, active consumption induction); increased consumption less than the concentration increase (Extended Data Fig. 1c, consumption saturation); and/or suppression of endogenous production (Extended Data Fig. 1d). These can be differentiated based on the extent of the labelled metabolite accumulation, as well as changes in the unlabelled metabolite’s level. For example, suppression of endogenous production results in decreased levels of unlabelled metabolite, while consumption saturation results in total metabolite levels increasing more than linearly relative to the infusion rate.
Fig. 1 |. Serum concentration increases linearly with metabolite infusion rate.
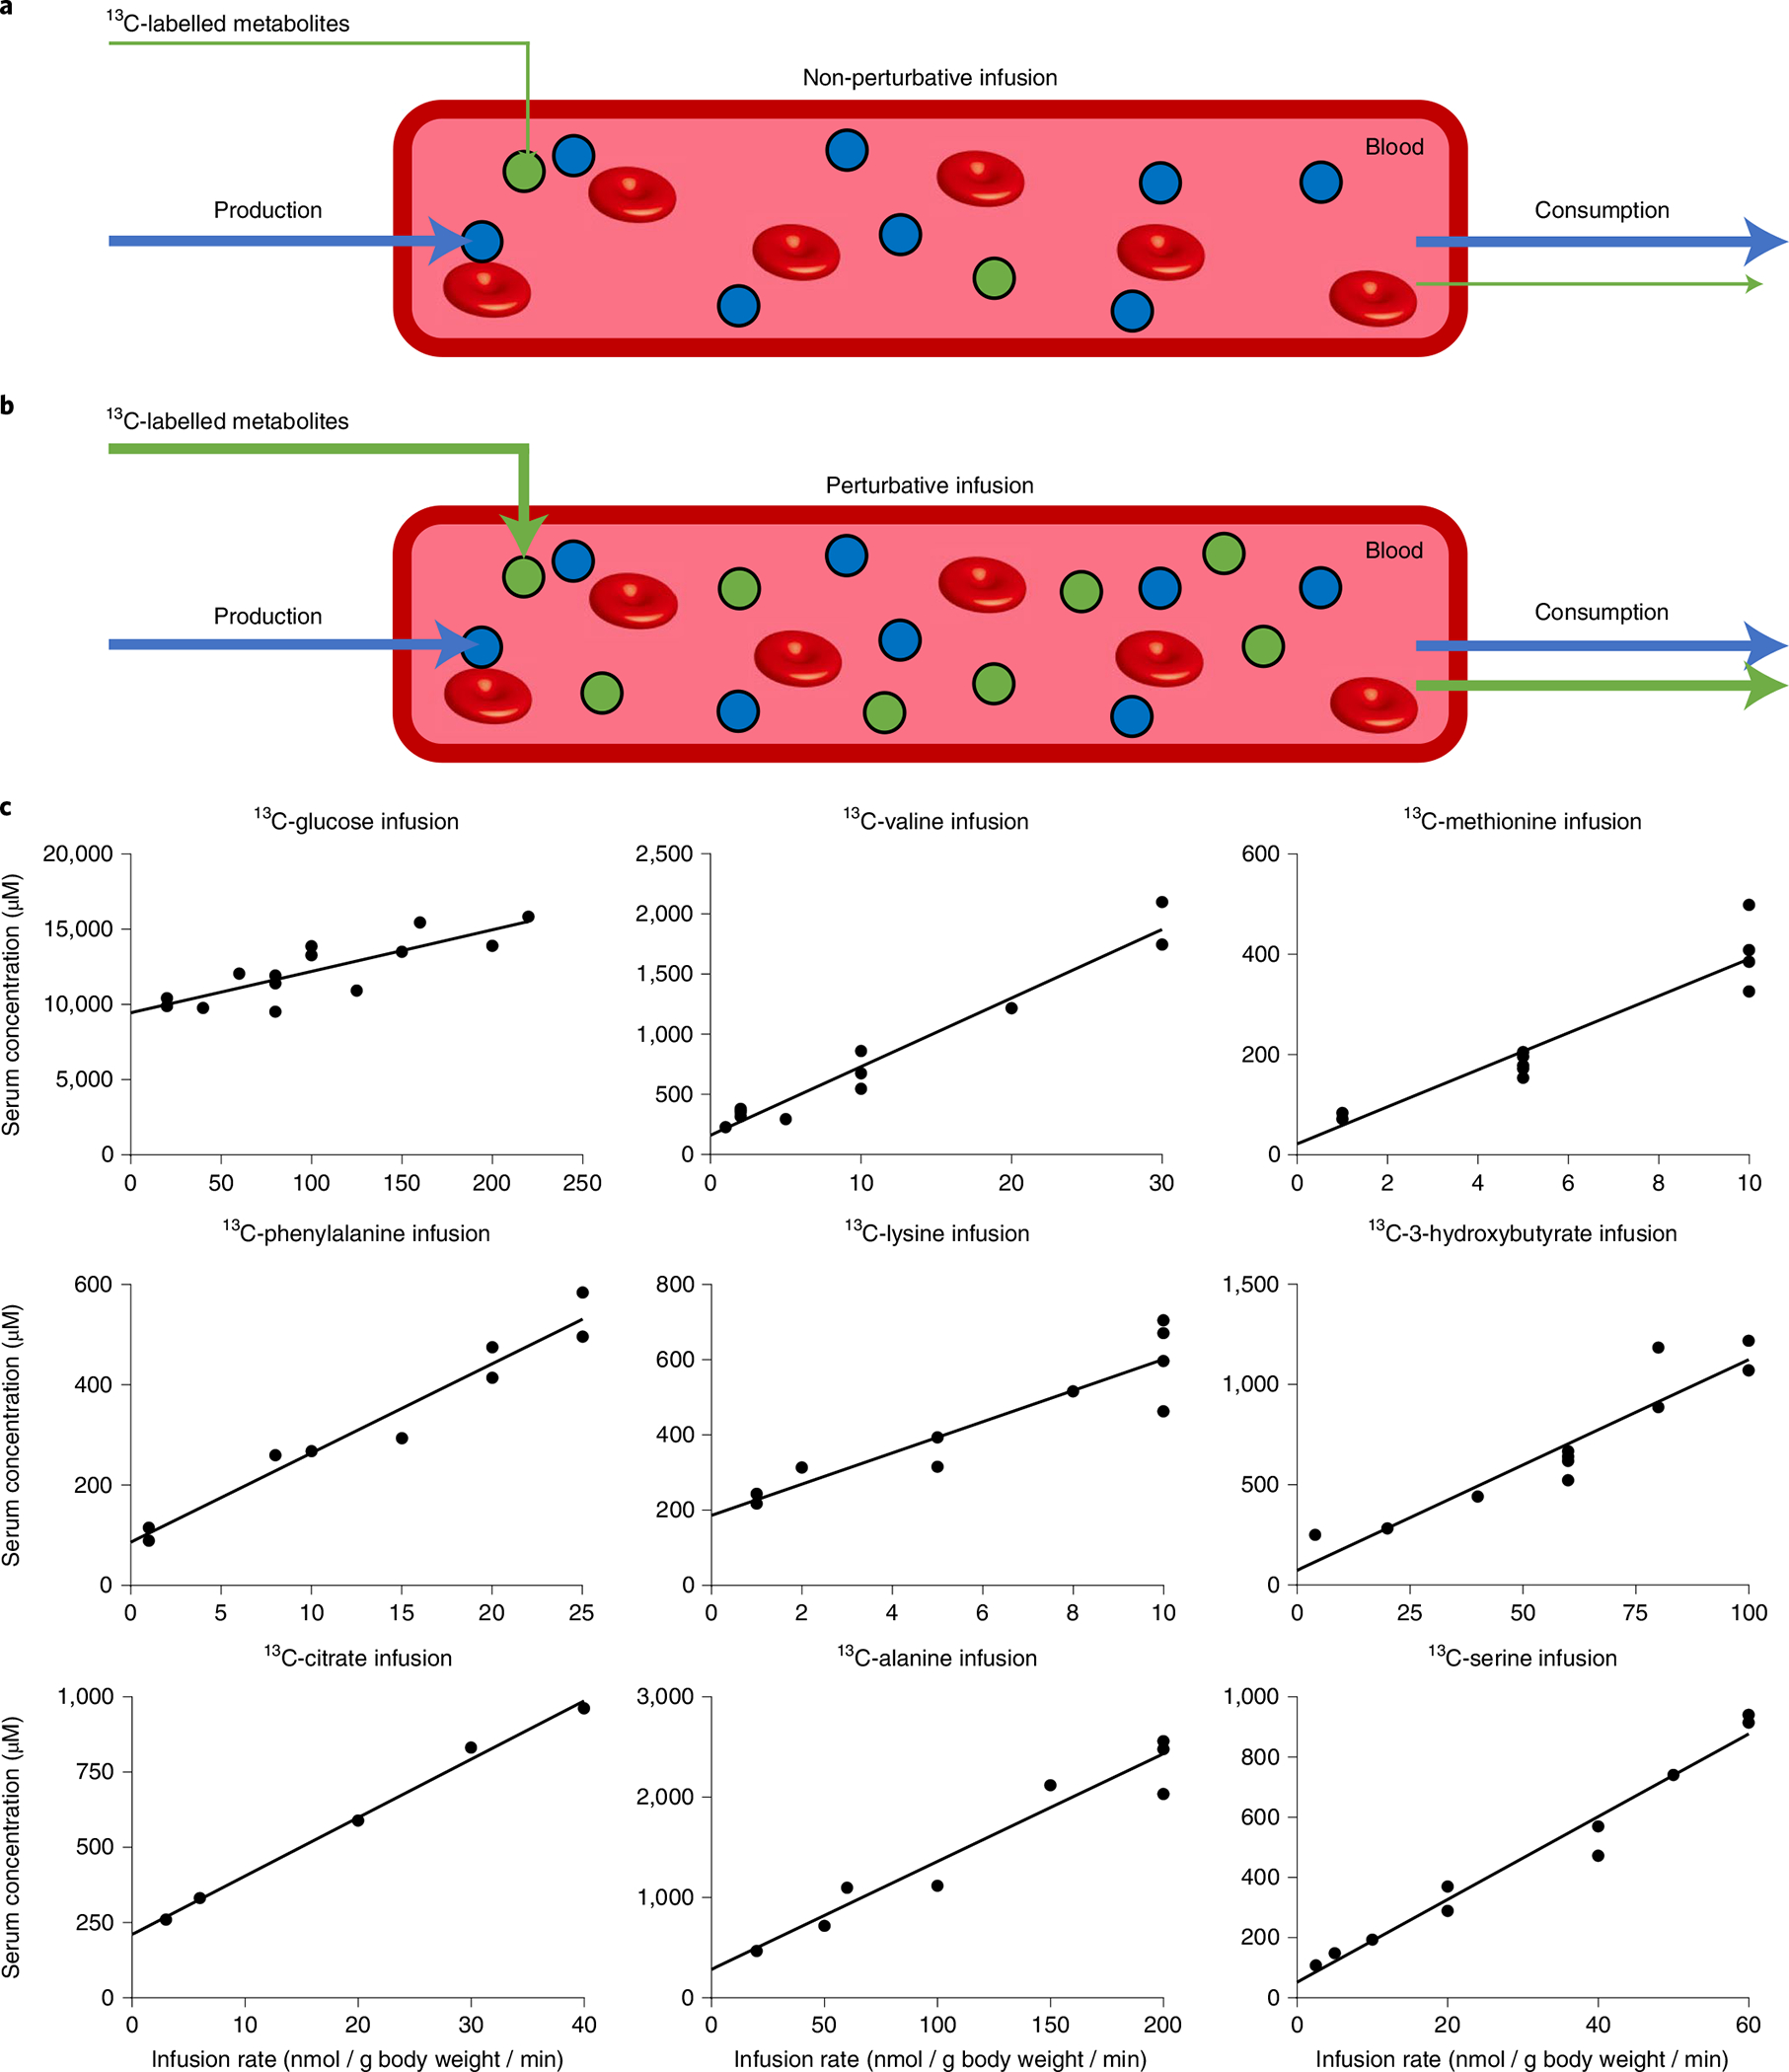
a,b, Schematic of the non-perturbative (a) and perturbative (b) infusion experiments. 13C-labelled metabolites (green circles) were infused into the circulation at different rates. The circulating concentration and consumption flux were measured to determine their relationship. c, Concentration-infusion rate relationship for fasted perturbative infusions. Mice (fasted from 9:00 to 18:00) were infused for 2.5 h with the indicated [U-13C]metabolite at different rates starting at 15:00. Blood was sampled at 17:30 and the total concentration of the infused metabolite (sum of labelled and unlabelled) in serum was measured by LC–MS. Throughout the manuscript, for the BCAA infusions, mice were infused with [U-13C]valine with unlabelled leucine and isoleucine at a fixed ratio that was reflective of their abundance in protein (5:6:3). Lines are linear fits to the data.
Through such studies, we show that, for a diversity of circulating metabolites, elevated concentrations only minimally impact production flux while inducing consumption flux and TCA contributions in a linear manner. These data support a model where metabolic homeostasis is achieved substantially by mass action-driven consumption: when levels of individual circulating metabolites rise, the catabolic rate rises in parallel tending to limit concentration deviations.
Results
Metabolite consumption flux is proportional to concentration.
We carried out pseudo-steady state perturbative infusions (2.5 h) of a diversity of major circulating metabolites in the uniformly 13C-labelled form: glucose, 3-hydroxybutyrate, citrate, alanine, serine, methionine, phenylalanine, lysine and valine. These infusions increased the circulating metabolite’s concentration up to about fivefold the basal circulating level (Fig. 1c). Because valine is typically consumed in parallel with the other BCAAs leucine and isoleucine, which may work in concert to activate the BCAA homeostatic machinery, 13C-valine was infused together with unlabelled leucine and isoleucine17. Other important circulating metabolites, including lactate, glutamine and free fatty acids, were omitted due to technical limitations: the infusion rates required to achieve comparable circulating perturbations were sufficiently high as to disturb water or ion homeostasis. As the infusions progressed, both the concentration and labelling of the infused metabolite approached steady state18. In every case, we observed an approximately linear relationship between infusion rate and steady state serum metabolite concentration (sum of labelled and unlabelled) (Fig. 1c).
Because the infused metabolite was isotope-labelled, the observed circulatory labelling (L) determines each metabolite’s whole-body consumption flux (rate of disappearance, Rd):18–20
| (1) |
where L is the fraction of circulating metabolite in the infused uniformly 13C- labelled form and Rinf is the infusion rate. For each metabolite, we observed a linear relationship between consumption flux and circulating concentration over at least a twofold range of circulating concentrations (Fig. 2). Yet higher levels of circulating metabolite, induced by a greater perturbative infusion rate, did not always produce a corresponding increase in consumption flux, suggesting partial saturation of the consumption machinery. Saturation was assessed quantitatively by evaluating whether the Michaelis–Menten fit was significantly better than the linear fit based on the Akaike information criterion (AIC) (Supplementary Table 1). Such saturation was observed for serine and methionine but not the other metabolites. In these cases, the highest data points were removed from the fitting as required to resolve the non-linearity, thereby obtaining a first-order rate constant (clearance constant) that reflects the linear consumption-concentration relationship within each metabolite’s physiological concentration range:
| (2) |
where α is the clearance constant and [M] is metabolite concentration.
Fig. 2 |. Metabolic consumption flux is linearly proportional to circulating concentration.

Consumption flux-concentration relationship for fasted perturbative infusions. Fasted mice were infused with the indicated [U-13C]metabolite at different infusion rates as in Fig. 1. Consumption flux (Rd) was plotted against the serum metabolite concentrations (sum of labelled + unlabelled). Lines are linear fits to the data, with data points in red excluded due to evidence of consumption saturation (Michaelis–Menten fit significantly better than linear fit). For the essential amino acids, rather than being a free parameter, the y intercept was fixed to match that amino acid’s consumption by protein synthesis, which was measured separately (Fig. 6).
Mass action predominates for metabolites other than glucose.
The linear relationship between consumption flux and circulating concentration suggests the possibility that metabolite consumption is dictated substantially by mass action, without active regulation of consumption (Rd) or endogenous production (rate of appearance, Ra). In this scenario, endogenous production is constant and insensitive to the metabolite’s concentration:
| (3) |
where β is the constant production flux. With balanced production and consumption (Ra = Rd), such mass action kinetics predict, from equations (2) and (3), that unlabelled metabolite levels (MU) will be invariant upon perturbative labelled metabolite infusion:
| (4) |
In contrast, if increasing circulating levels either suppress endogenous production or accelerate consumption via active regulation, then unlabelled concentrations should decrease with infusion rate. Conversely, if consumption is saturated, unlabelled levels should increase.
For glucose, we observed a steep decrease in unlabelled levels, consistent with insulin-mediated active regulation (suppression of endogenous production and acceleration of consumption via insulin-responsive translocation of glucose transporter type 4). For all other tested metabolites, plots of unlabelled concentration versus infusion rate either showed no significant slope (consistent with mass action-driven consumption) or modest upward slope (consistent with mass action dampened by saturated consumption) (Fig. 3).
Fig. 3 |. Only for glucose, unlabelled levels fall on perturbative 13C-labelled infusion, indicating active homeostatic regulation.
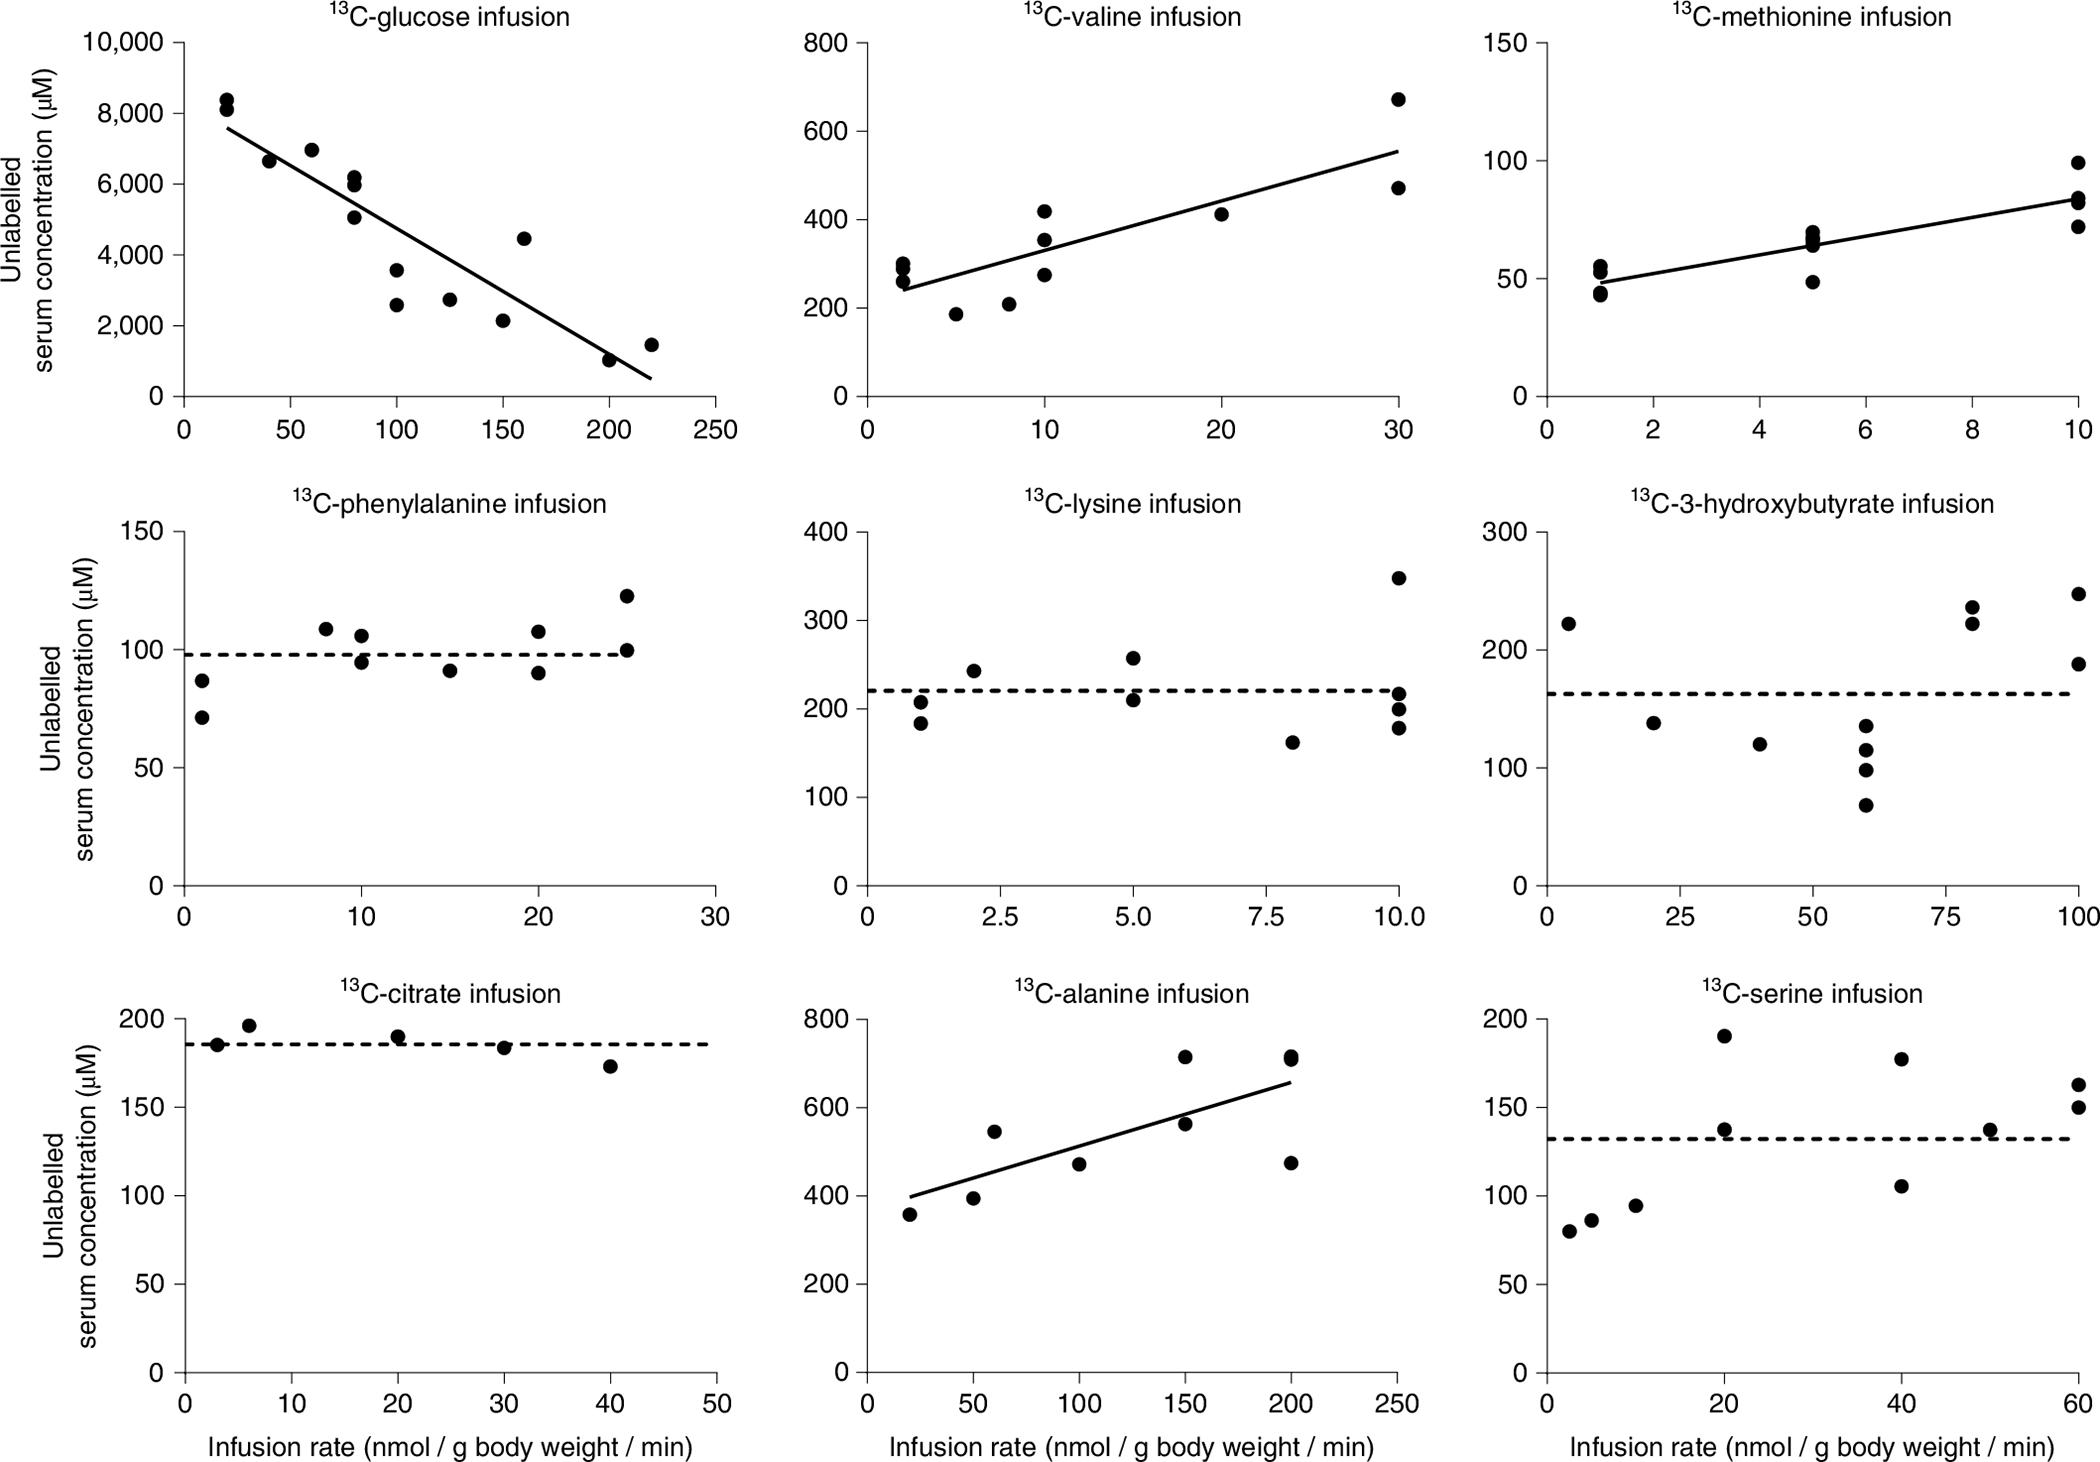
Unlabelled concentration-infusion rate relationship for fasted perturbative infusions. Fasted mice were infused with the indicated [U-13C]metabolite at different infusion rates as in Fig. 1. The serum concentration of the corresponding unlabelled metabolite was measured by LC–MS and plotted against the infusion rate. Decreasing unlabelled levels reflect suppression of endogenous production and/or acceleration of consumption by more than just mass action (Extended Data Fig. 1). Increasing unlabelled levels reflect partial consumption saturation. Lines are linear fits to the data, with flat dashed lines used in cases where the slope is not significant.
Clearance of metabolite boluses follows mass action kinetics.
Mass action-mediated consumption predicts exponential decay of transiently increased circulating metabolites over time. For example, after a transient perturbative bolus injection of isotope-labelled metabolite, it should be cleared from the bloodstream in a non-linear, first-order manner:
| (5) |
or
| (6) |
where γ is the elimination constant and [ML] is the labelled metabolite’s concentration. We tested whether this was the case for major circulating metabolites by giving them individually as an intravenous bolus in labeled form, each at three different concentrations. For every tested metabolite, we observed a single exponential decay of its labelled concentration (Extended Data Fig. 2a). Consistent with first-order clearance, for each metabolite, the elimination constant (γ) was consistent across the different bolus doses (Supplementary Table 2). Moreover, across metabolites, the elimination constant γ calculated from these bolus experiments correlated well with the clearance constant α (in Eq. 2) calculated from the perturbative steady state infusions (Extended Data Fig. 2b).
Mass action drives metabolite consumption after feeding.
A breadth of metabolic and hormonal responses, including insulin release, are trigged by feeding21. Accordingly, we were curious if, in response to feeding, consumption of circulating metabolites would be controlled by more complex mechanisms than mass action. To explore this, we compared how consumption of six abundant circulating metabolites was affected by perturbative infusions (2.5 h) in fasted versus refed mice. Circulating amino acid concentrations were generally higher in the refed mice, which is consistent with the amino acid influx from eating; citrate was unaltered and 3-hydroxybutyrate was lower, which is consistent with insulin suppressing hepatic ketone body synthesis (Extended Data Fig. 3a)22. Regardless of feeding, the consumption fluxes of all tested metabolites were related linearly to the circulating concentration in both fasted and refed states (Fig. 4a). For citrate, 3-hydroxybutyrate, serine, valine and lysine, the same concentration-flux relationship determined in the fasted state largely explained, without any free parameters, the concentration-flux relationship in the refed state (Fig. 4a and Supplementary Table 1).
Fig. 4 |. The same mass action relationship largely holds across fasting and feeding.
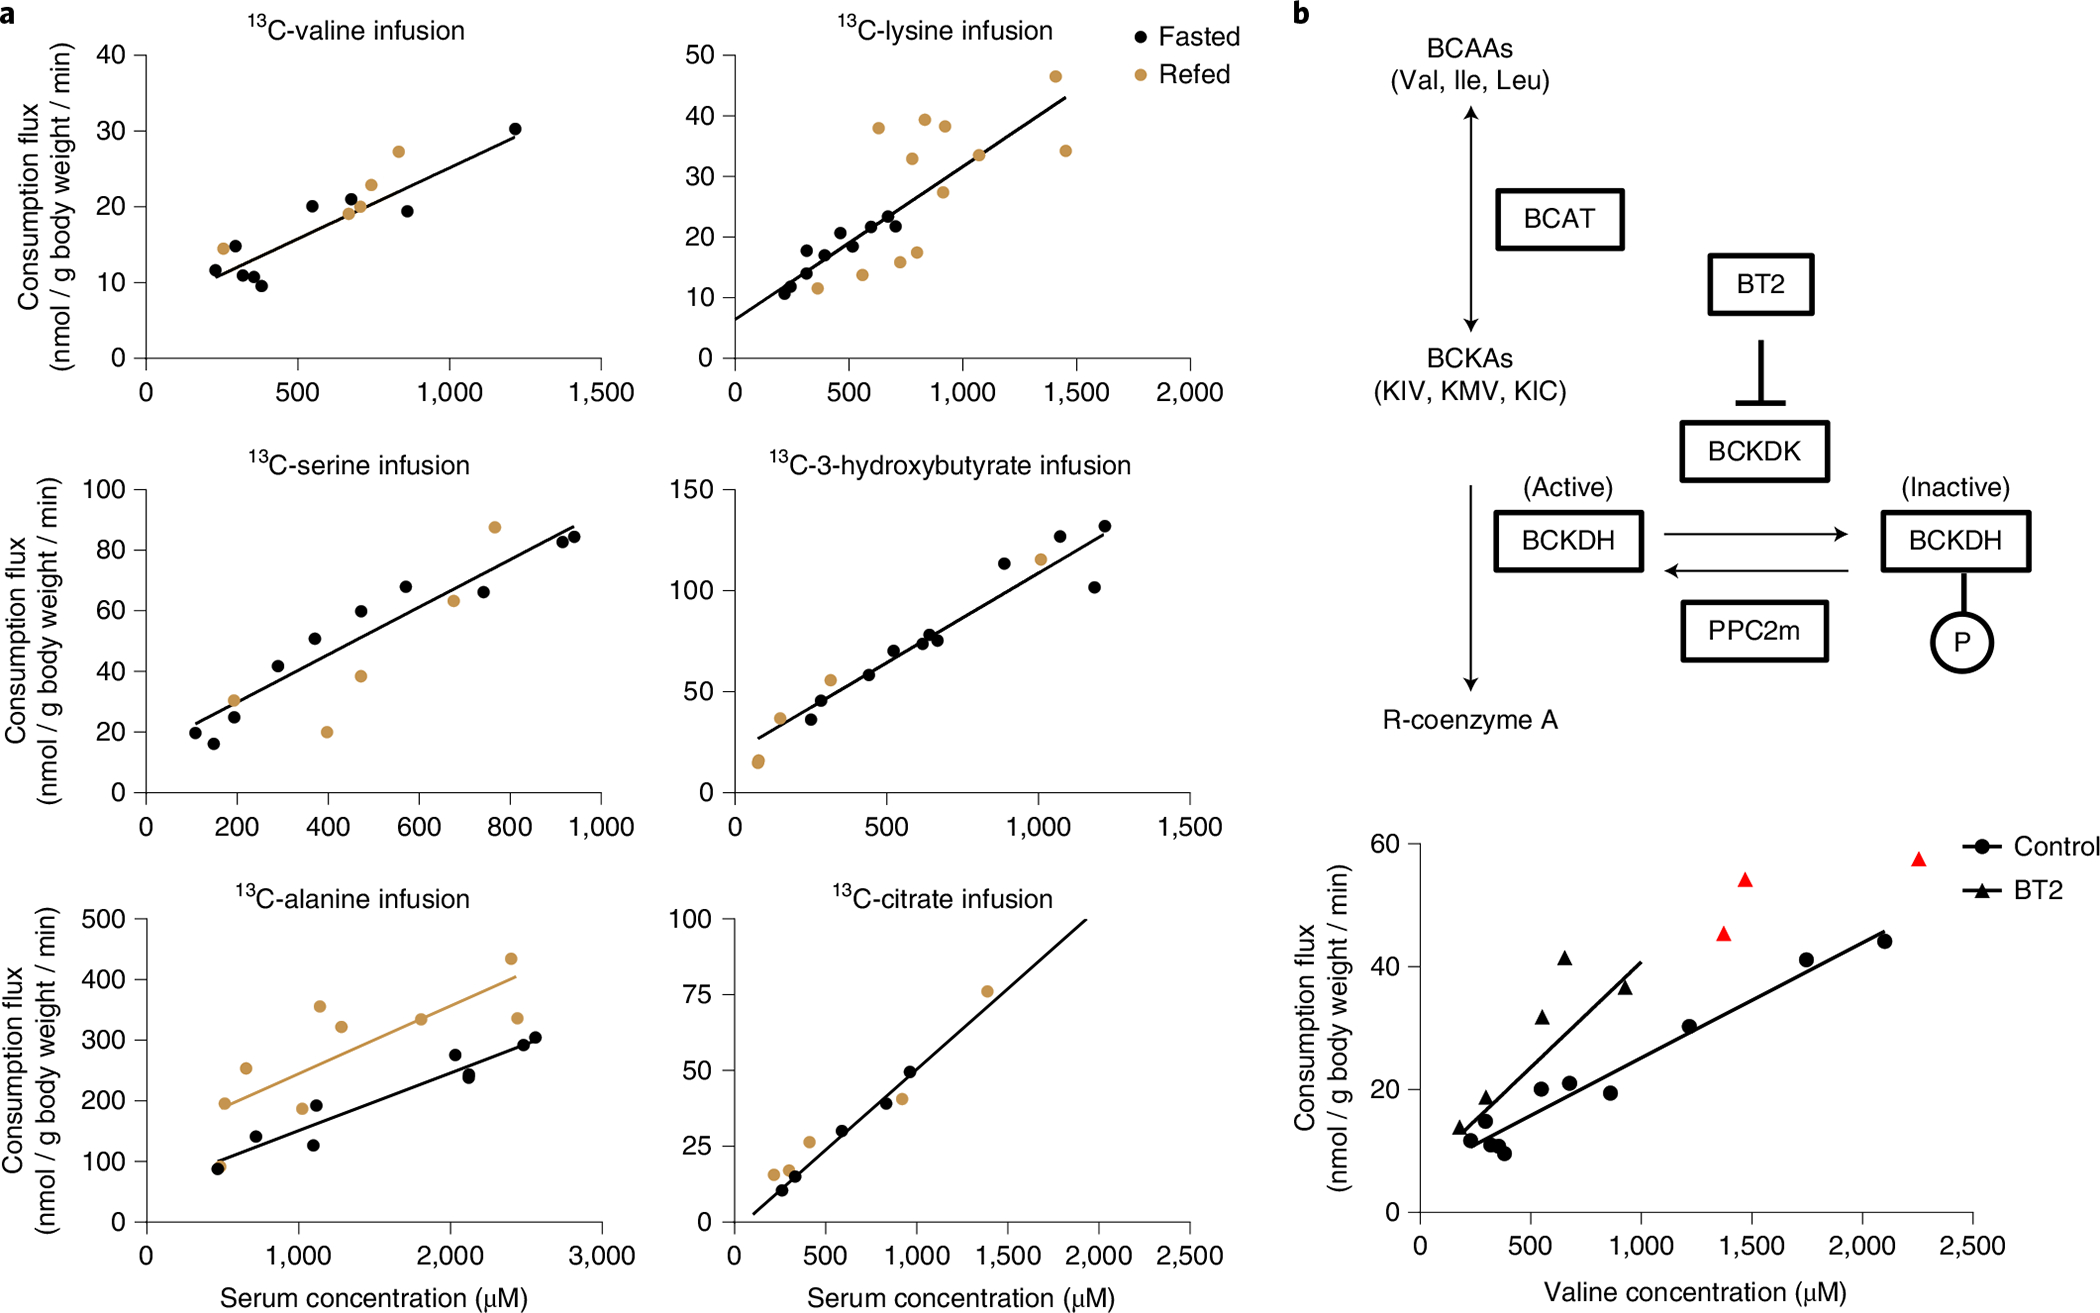
a, Consumption flux-concentration relationship for fasted and refed perturbative infusions. Refed mice were fasted during the daytime for 8 h (noon to 20:00). At the time of lights off (20:00), food was provided and [U-13C] metabolite perturbative infusions were performed for 2.5 h. Blood was collected at 22:30 and the consumption flux and total concentration of the infused metabolite were measured. The fasted mice data and black line are copied from Fig. 2. Fitting to this predetermined line was superior based on the AIC to a linear fit with free parameters, except for the alanine refed data. In that case, the linear fit with free parameters is shown in beige. b, Impact of inhibiting the regulatory enzyme BCKDK on valine consumption flux. As shown in the schematic, BCKDK phosphorylates and thereby inactivates the key BCAA catabolic enzyme BCKDH. A small-molecule tool compound, BT2, inhibits BCKDK and thereby activates BCKDH. BCKA, branched-chain ketoacid; KIC, α-ketoisocaproate; KIV, α-ketoisovalerate; KMV, α-keto-β-methylvalerate. Data show the valine consumption flux-concentration relationship determined based on perturbative 13C-valine infusion in both the presence and absence of BT2. For the BT2 group, infusion conditions were exactly as in Fig. 2 except that 100 mg kg−1 BT2 was injected intraperitoneally an hour before starting the 13C-valine infusions. The control group data are copied from Fig. 2. Lines are linear fits to the data with fixed y intercept as in Fig. 2, with red data points excluded due to evidence of consumption saturation (Michaelis–Menten fit significantly better than linear fit).
For alanine, while the clearance constant (α, slope of flux-concentration plot) was not substantially changed by feeding, basal consumption (y intercept of flux-concentration plot) increased. To explore whether this might be due to insulin, we examined basal alanine consumption (as well as valine and lysine consumption) during hyperinsulinaemic–euglycaemic clamp but did not observe any flux increases; the flux of each of the tested amino acids trended slightly down (Extended Data Fig. 3b,c). Another potential cause of increased alanine flux in the fed state is elevated portal vein concentrations, resulting from food absorption. Such portal concentration increases could then enhance hepatic alanine consumption via mass action. Consistent with this, alanine stood out among the examined metabolites in showing substantially higher portal than tail vein concentrations; moreover, the extent of alanine’s portal vein enrichment increased with feeding (Extended Data Fig. 3d). Using the alanine portal vein concentration, instead of tail vein concentration, quantitatively corrects the fed–fasted discrepancy (Extended Data Fig. 3e). Thus, including for alanine, the same mass action relationship between concentration and flux substantially explains circulating metabolite consumption across fasting and feeding.
BCAA oxidation rate is tuned by BCKDK.
The observed mass action-driven consumption of circulating metabolites suggests unregulated catabolic enzyme activity. Yet, consumption of BCAAs is regulated by BCKDK, a protein kinase that inhibits branched-chain α-ketoacid dehydrogenase complex (BCKDH), the committed enzyme of BCAA catabolism (Fig. 4b)16,23. BT2 is a small-molecule inhibitor of BCKDK24. To examine the relationship between BCKDK and BCAA consumption, we conducted 13C-valine perturbative infusions after acute BT2 administration (Fig. 4b). As expected, BT2 accelerated valine consumption flux and enhanced the valine clearance constant. At high valine concentrations (>1 mM), animals treated with BT2 showed saturation of valine consumption, with consumption flux trending towards a similar maximum value, presumably determined by maximum valine catabolic enzyme capacity, irrespective of BT2 treatment.
Accelerated valine consumption, relative to circulating levels, was also observed in BCKDK whole-body knockout mice (Extended Data Fig. 4a). On a regular diet, such mice were generally healthy and had roughly 30% lower circulating BCAA concentrations than wild-type (WT) mice. However, when fed a low-protein diet (5% protein), their circulating BCAA levels fell below standard healthy ranges, to levels almost threefold lower than their WT littermates (Extended Data Fig. 4b). In parallel, mice became lethargic (Extended Data Fig. 4c). Thus, the active regulation of BCAA catabolism by BCKDK works in combination with mass action, both to expand the physiological concentration range over which concentration and consumption flux linearly correlate and to avoid pathological BCAA depletion when protein is scarce.
Mass action drives TCA cycle oxidation.
Terminal oxidation of circulating metabolites occurs via the TCA cycle. Thus, we quantified the relationship between the infused circulating metabolite’s concentration and its steady state contribution to TCA cycle intermediates. TCA contribution is defined by normalized TCA intermediate labelling: the tissue TCA intermediate labelling fraction is divided by the infused metabolite’s labelling fraction in the circulation. Different tissues have intrinsic preferences for burning different circulating metabolites in their TCA cycle (Fig. 5 and Extended Data Fig. 5a,b). However, irrespective of these intrinsic preferences, across both different tissues and different circulating metabolites, TCA contributions generally correlated linearly with circulating metabolite levels.
Fig. 5 |. TCA oxidation mediates mass action consumption.
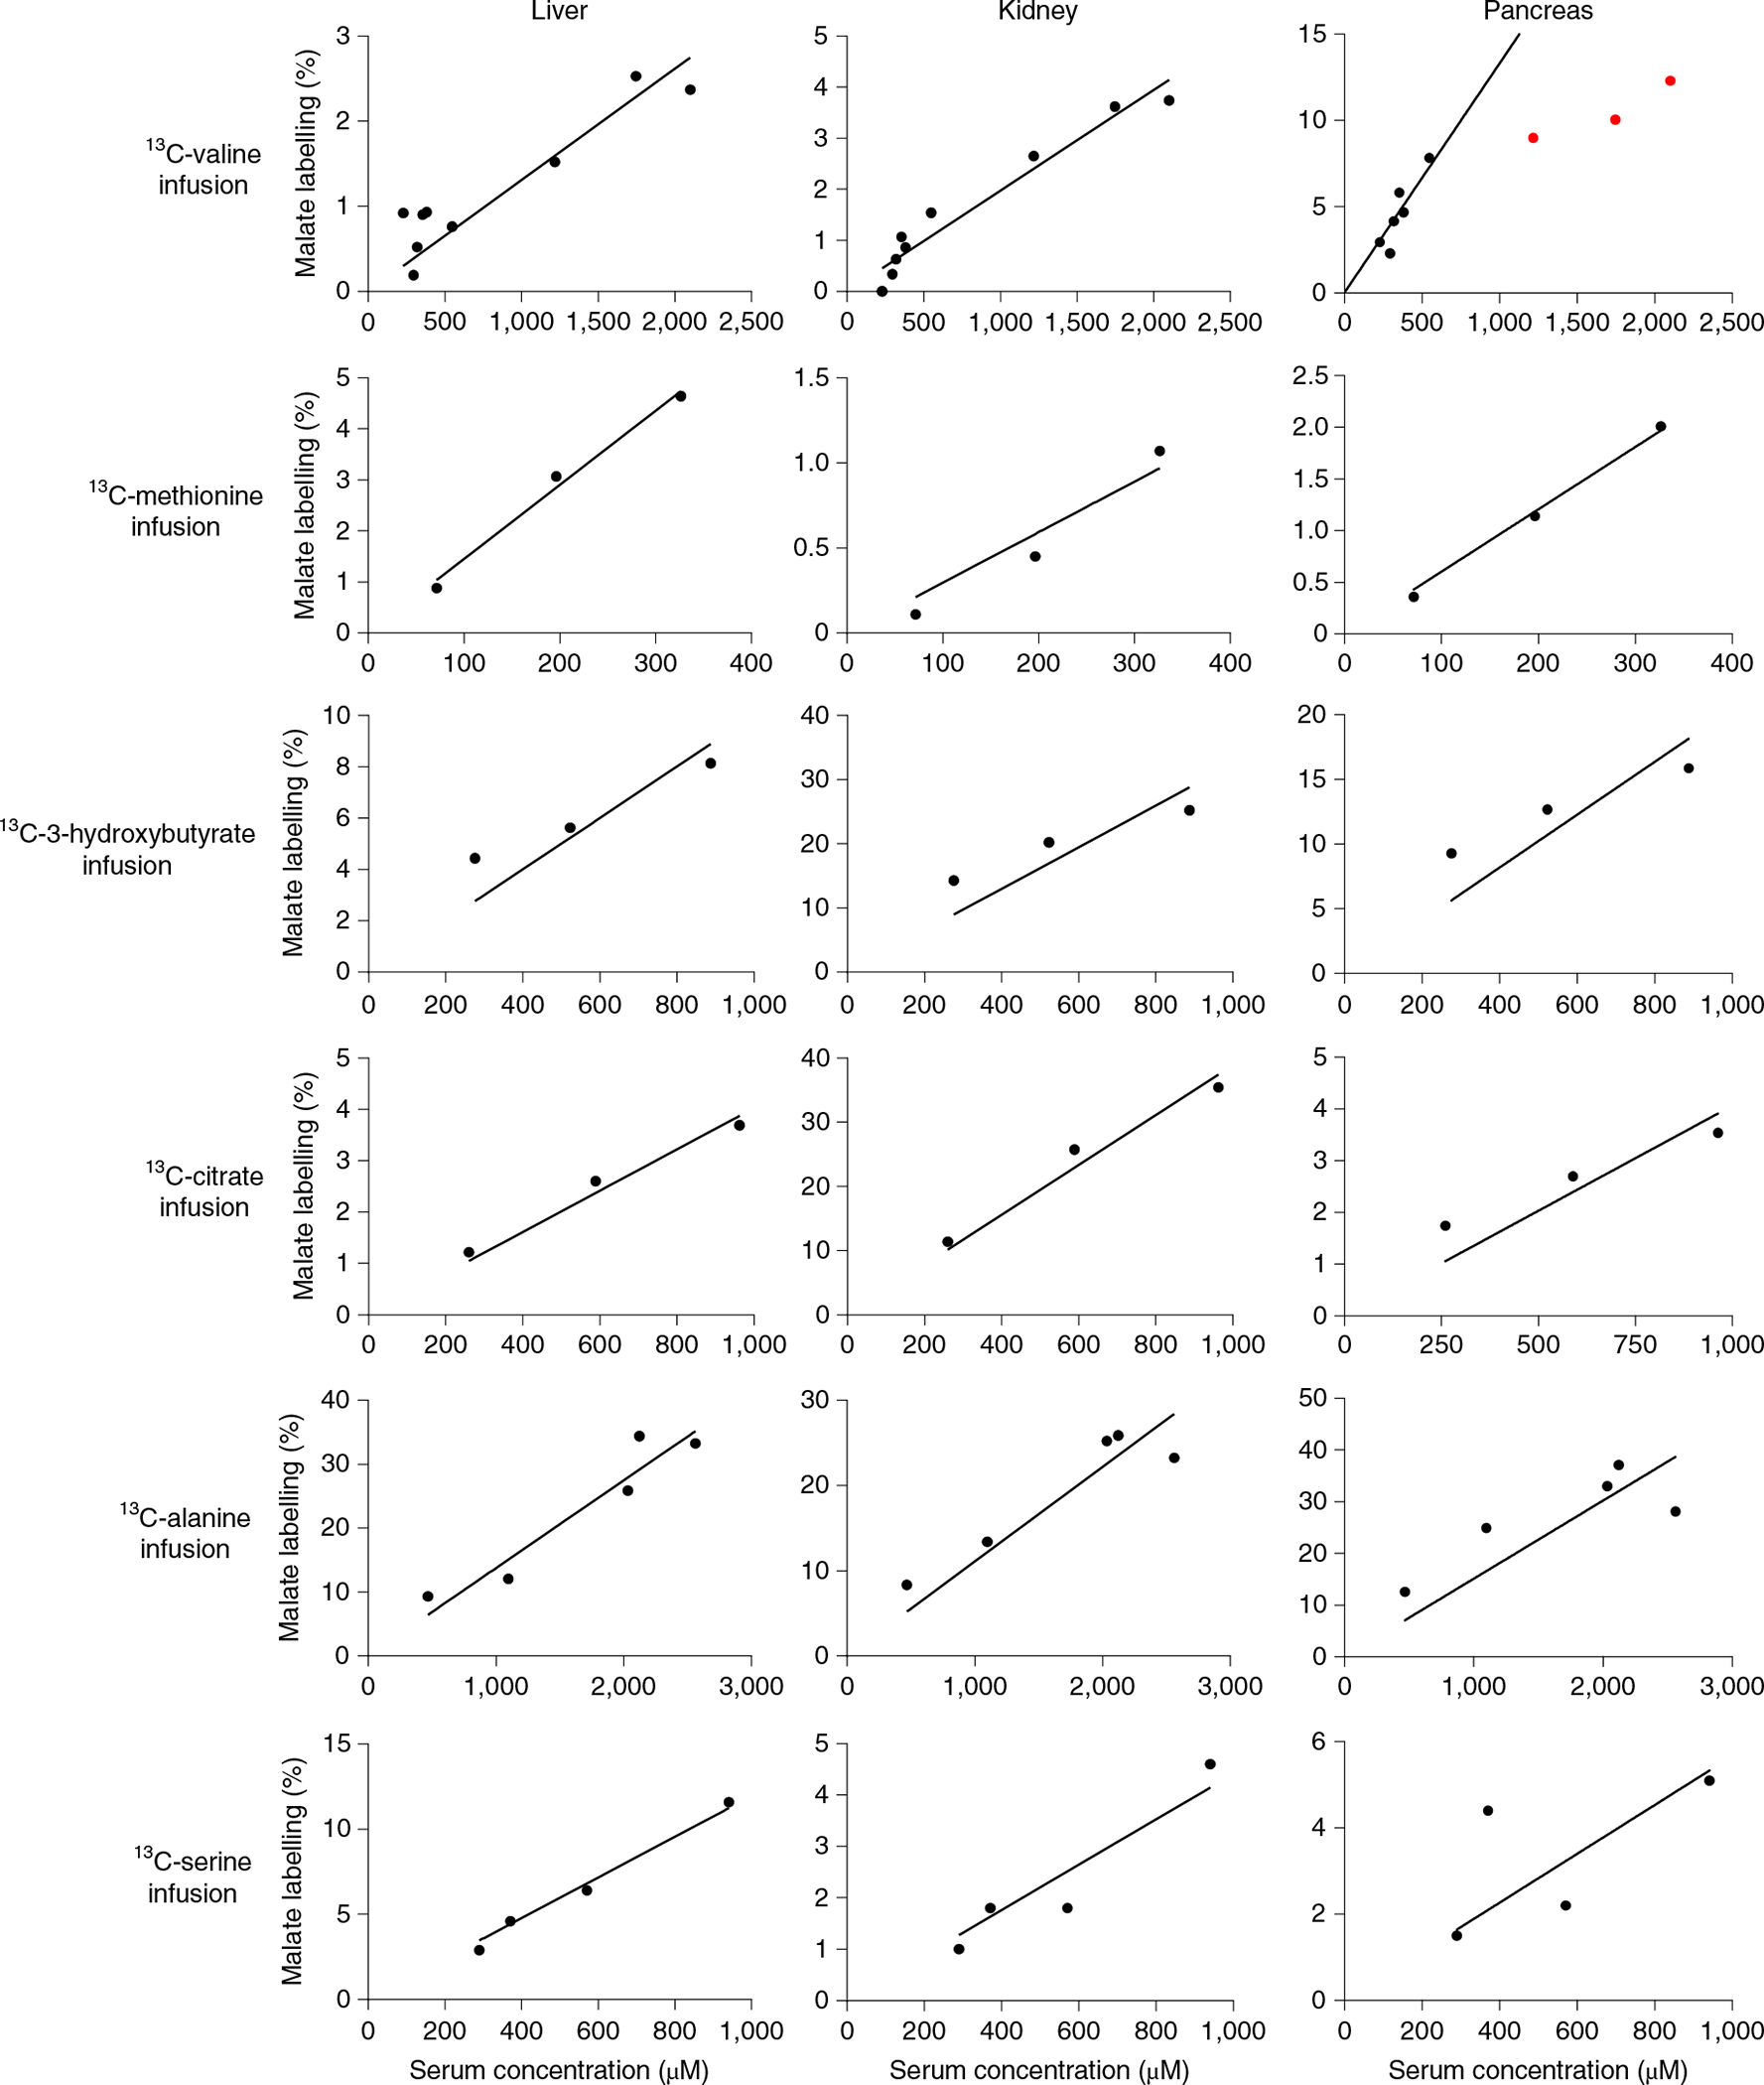
Tissue TCA labelling-concentration relationship for fasted perturbative infusions. Infusions were carried out exactly as in Fig. 2, with terminal tissue sampling. The y axis shows the labelling fraction of a representative TCA intermediate (malate) relative to the serum labelling fraction of the infused 13C-metabolite, whose total concentration (sum of labelled and unlabelled) is plotted on the x axis. Lines are linear fits to the data with the intercept set to zero, with the red data points excluded due to evidence of consumption saturation (Michaelis–Menten fit significantly better than linear fit). Similar results were obtained using succinate rather than malate to report tissue TCA labelling (Extended Data Fig. 5a).
An informative exception involved valine in the pancreas. The pancreas catabolizes valine far more avidly than does any other organ. When valine levels rise to about four times normal, pancreatic valine catabolism saturates, presumably reflecting saturation of one or more flux-limiting catabolic pathway enzymes. Such saturation was only observed with this particular tissue–substrate pair and only at concentrations exceeding the physiological valine range. In all other cases, TCA contributions were directly proportional to circulating metabolite levels, which is consistent with mass action-driven oxidation.
Protein synthesis is insensitive to elevated amino acids.
We next focused on understanding in greater depth homeostasis specifically of essential amino acids. These have only two sources—diet and protein degradation—and two sinks—oxidation and protein synthesis, simplifying quantitative analysis. We first assessed whether protein synthesis varies in response to perturbative BCAA infusions. To quantify the protein synthesis rate, we collected tissues at different time points after perturbative infusions of varying concentrations of 13C-valine (with unlabelled leucine and isoleucine) (Fig. 6a). We then washed out free amino acids and hydrolysed proteins to measure the labelled amino acid incorporation rate. Using the measured labelling fraction and published values of tissue dry weight, protein content and valine percentage in protein25, we calculated the absolute protein synthesis rate for each tissue (Extended Data Fig. 6a). In contrast to TCA oxidation, the protein synthesis rate did not change with the BCAA infusion rate, demonstrating that protein synthesis does not contribute to mass action-driven clearance of elevated BCAA levels (Extended Data Fig. 6b,c). Results were consistent across the three BCAA tracers (Extended Data Fig. 6d). Moreover, fasted state BCAA Ra, which reflects the protein degradation rate, as this is the only source of essential amino acids in the fasted state, was also insensitive to BCAA infusions (Extended Data Fig. 7).
Fig. 6 |. Mass action-driven oxidation clears amino acid influx from food.
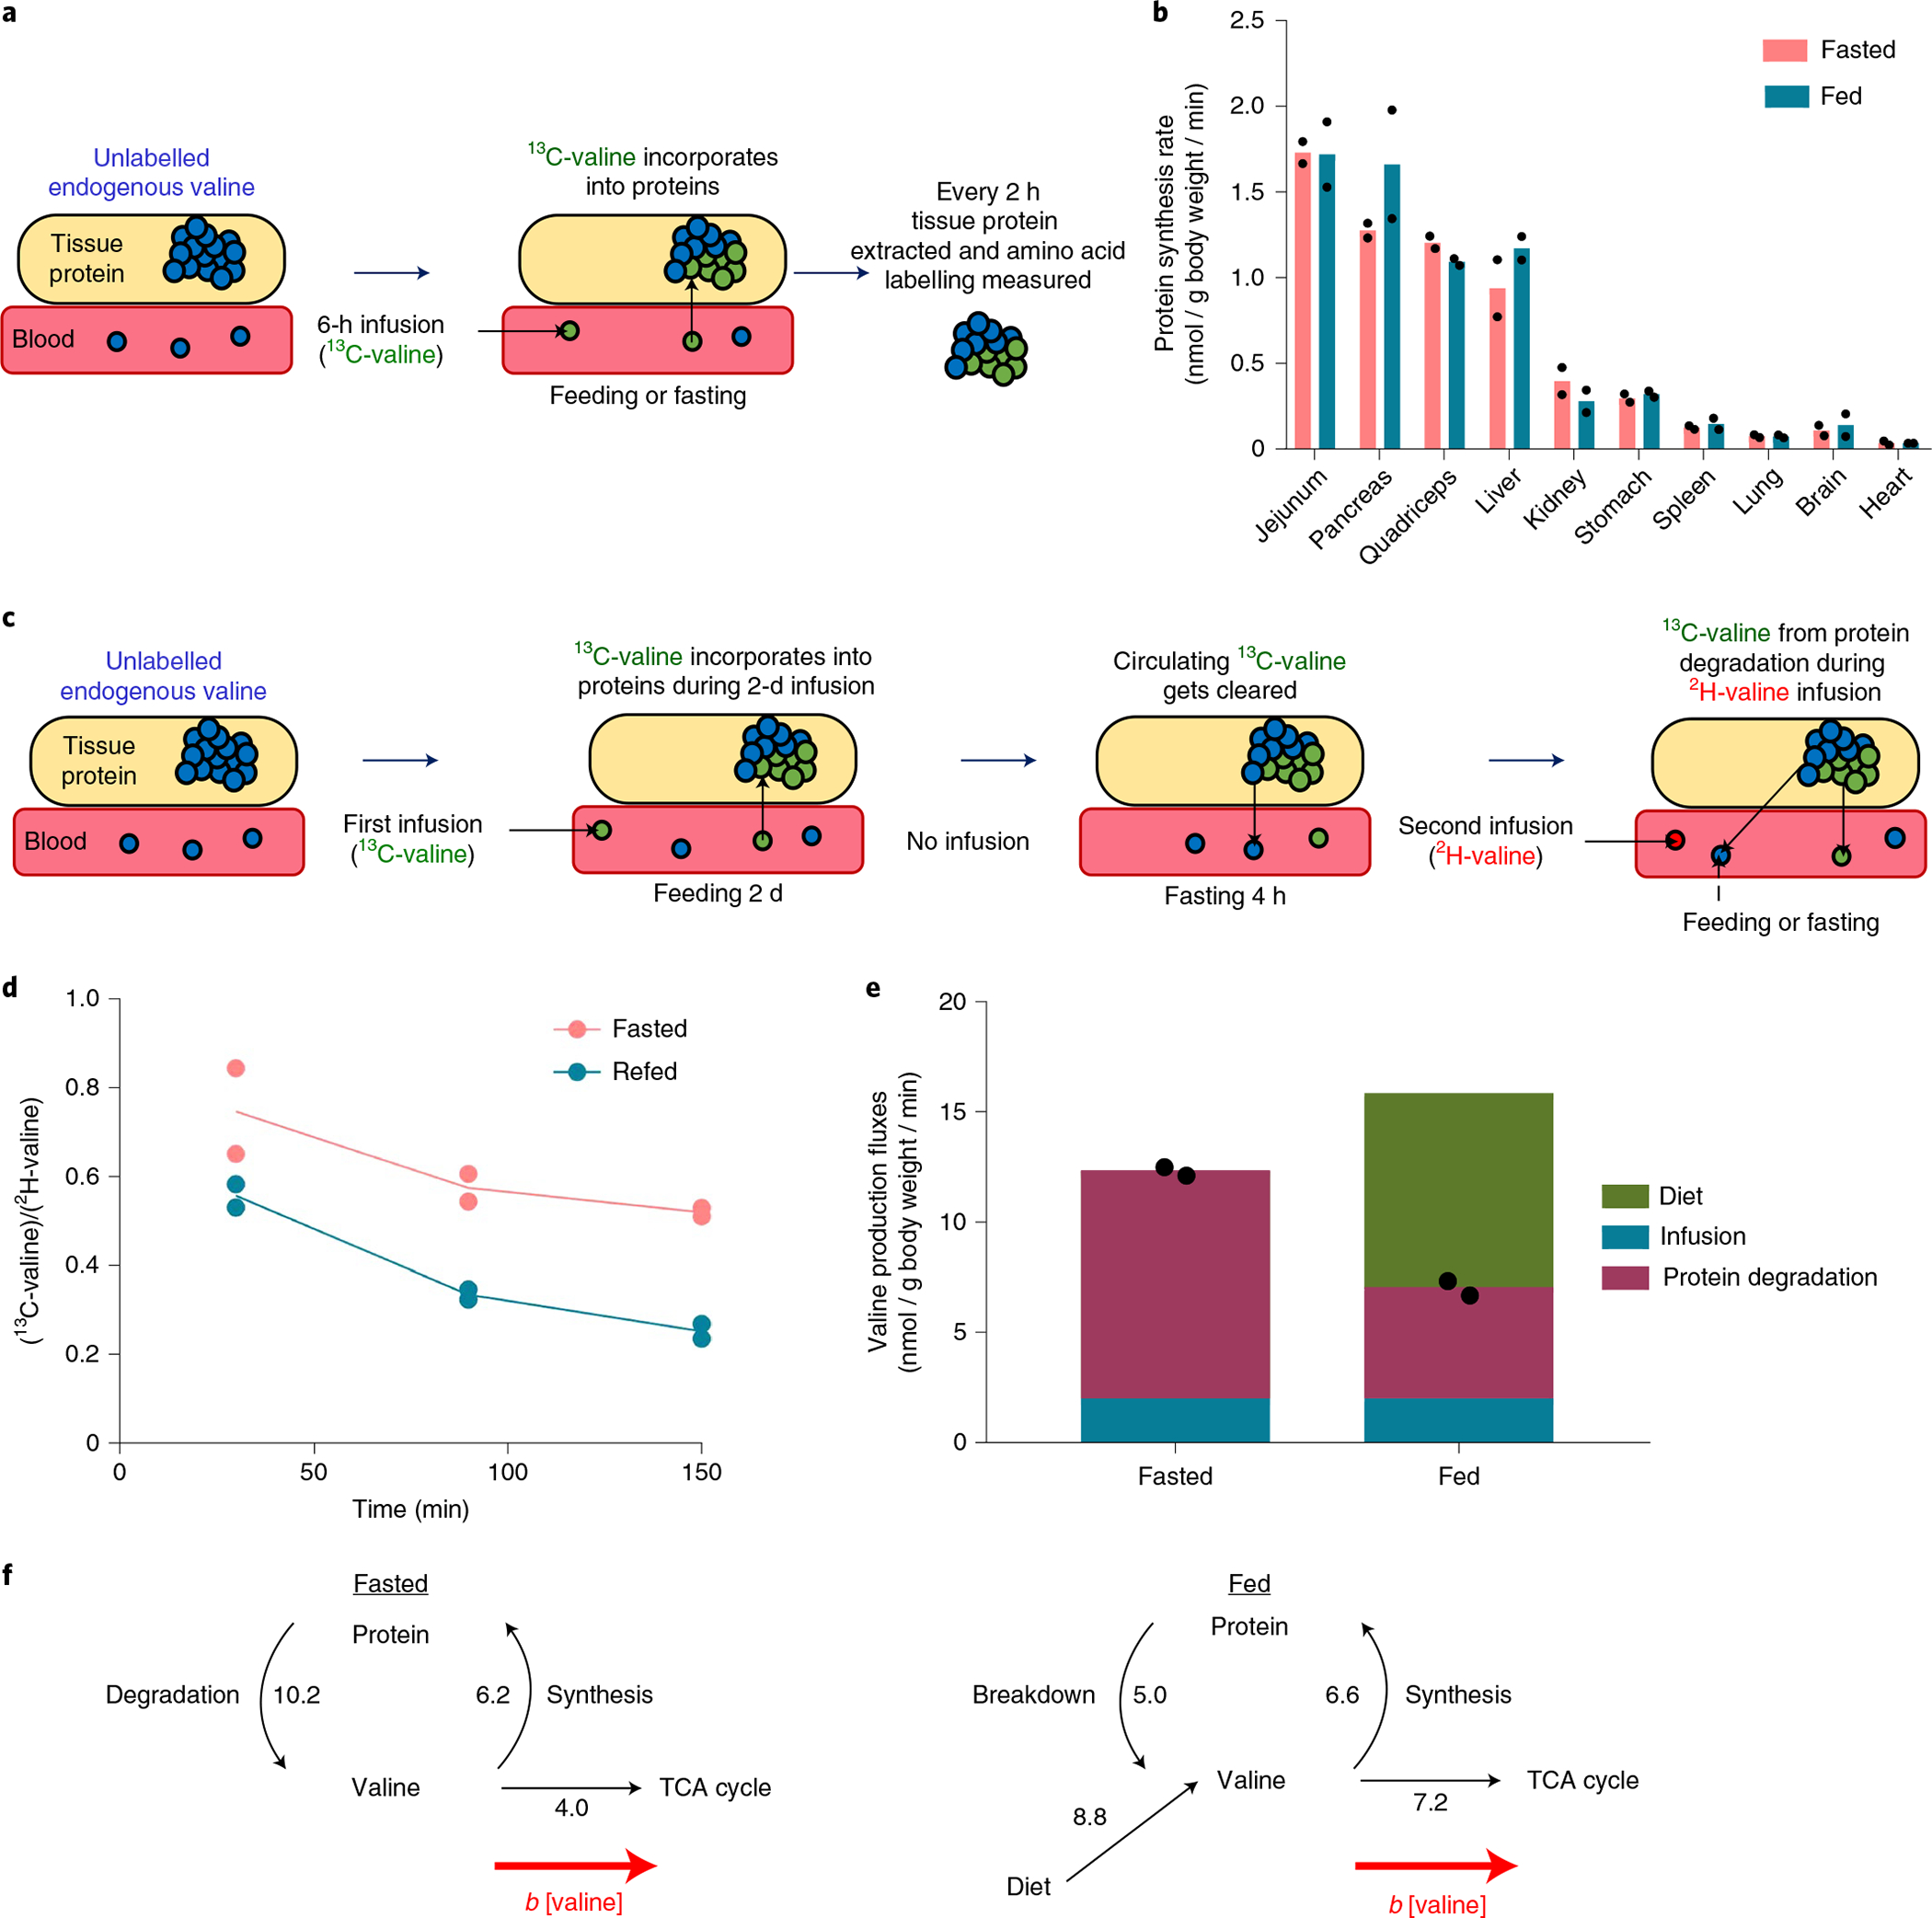
a, Experimental design for measuring tissue-specific protein synthesis rate in fed and fasted mice using 13C-valine non-perturbative infusion. For the fasted group, mice were fasted from 9:00 to 18:00 and [U-13C]valine infusions were performed from 12:00 to 18:00. For the fed group, mice were fasted from noon to 20:00. At the time of lights off (20:00), food was provided and [U-13C] valine infusions were performed from 20:00 to 2:00. During the [U-13C]valine infusions, tissues were collected every 2 h and proteins were hydrolysed to measure valine labelling. b, Feeding does not impact protein synthesis rate. For calculations, see Extended Data Fig. 6. n = 6 mice in total per group with n = 2 mice per time point. c, Experimental design for measuring whole-body endogenous protein degradation rate in fed and fasted mice via pulse-chase. Mice were fed ad libitum and received a non-perturbative infusion of [U-13C]valine (green circles) for 48 h to label tissue proteins. The infusion was stopped at 16:00 on the third day for 4 h to clear circulating [U-13C]valine while mice were fasted. At 20:00, when the lights were turned off, mice received a non-perturbative infusion of the second tracer, [U-2H]valine (red circles) for 2.5 h while one group of mice was kept fasted and another was provided with food. d, Feeding suppresses protein degradation as measured by the serum ratio of [U-13C]valine (coming from protein degradation) to [U-2H]valine (infused at a constant rate). n = 2 mice. e, Valine production fluxes calculated from d. Diet flux is calculated by . n = 2 mice. Raw data are shown as black dots. f, Valine fluxes during fasting and feeding. The numbers indicate fluxes in units of nmol g body weight min−1.
These findings suggest that the essential amino acid consumption can be described as the sum of protein synthesis (S), which is invariant with respect to individual amino acid concentration and TCA oxidation, which increases linearly with circulating concentration [M].
| (7) |
where b is a first-order constant similar to the clearance constant α (in equation (2)) but reflecting specifically terminal catabolism mainly via TCA oxidation (T) (Supplementary Table 3)
| (8) |
The value of S (zero-order amino acid consumption flux by protein synthesis) can be determined by two independent ways: (1) the measured protein synthesis rate (summed across tissues) multiplied by the relevant amino acid’s fractional abundance in protein (Extended Data Fig. 6); or (2) y intercept of plots of consumption flux versus essential amino acid concentration (Fig. 2). Notably, the experimentally measured intercepts conform well to those calculated based on whole-body protein synthesis flux; for most of the tested essential amino acids, linear regression with this fixed y intercept is superior to standard linear fitting (Supplementary Tables 1 and 3).
In contrast, TCA oxidation is strictly proportional to circulating concentrations. For most amino acids, linear regression of TCA contribution versus circulating concentration gave a y intercept of zero (Fig. 5 and Extended Data Fig. 5). Thus, elevated levels of individual essential amino acids are insufficient to alter the protein synthesis rate. Instead, they are cleared by TCA oxidation.
TCA oxidation propensity sets essential amino acid levels.
For essential amino acids, terminal oxidation is a means of balancing excess production from protein (either endogenous or dietary) relative to consumption by protein synthesis. At steady state, in the absence of perturbative infusion:
| (9) |
Using minimally perturbative infusions, including direct measurements of protein synthesis as described above, Ra and S can be independently measured. Their difference gives T, the terminal first-order essential amino acid consumption flux. Rearranging equation (8) gives:
| (10) |
where Tss and Mss refer to unperturbed physiological steady state conditions. Experimentally measured fasted essential amino acid concentrations generally agree with those predicted by equation (10), with no free parameters (Supplementary Table 3).
Therefore, the above analysis reveals that circulating essential amino acids are generally maintained at concentrations sufficient to saturate protein synthesis but not the TCA oxidation machinery. Linear increases in TCA oxidation with rising concentrations maintain homeostasis. Amino acids with a strong propensity for TCA-mediated oxidation (large b; for example, phenylalanine, methionine) are less abundant in the circulation than those with less such propensity (for example, valine, lysine).
Feeding suppresses protein degradation.
High-rate infusions of insulin and amino acids increase muscle protein synthesis in humans, especially in aged individuals with low basal protein synthesis rates26–28. We examined whether physiological feeding similarly increases protein synthesis in young mice using non-perturbative BCAA infusion. Across organs, we observed little change in protein synthesis flux after refeeding (Fig. 6b and Extended Data Fig. 8).
Despite the similar rate of protein synthesis across feeding and fasting, protein pools in the liver (and likely also other organs) oscillate diurnally in response to eating29,30. We hypothesized that this reflects suppression of endogenous protein degradation in response to food intake31. To explore this possibility, we undertook pulse-chase experiments where protein was loaded with infused isotope tracer (13C-valine) during the pulse (2 d) followed by the chase during which the appearance of 13C-valine in the bloodstream reflects endogenous protein degradation (Fig. 6c). To render this approach quantitative, we made two important methodological additions: (1) waiting 4 h after the end of the 13C-valine infusion to clear residual circulating 13C-valine (leftover from the infusion); and (2) during the time interval for protein degradation measurement, infusing non-perturbative quantities of the second tracer (2H-valine), to measure the overall valine circulatory flux. The use of this second isotope tracer is critical to enabling the comparison of protein degradation between fasting and feeding, where overall valine circulating flux rises due to influx from food. Because the infused 2H-valine infusion rate is constant, the ratio of 13C-valine to 2H-valine in the bloodstream reliably reports the internal protein degradation flux, irrespective of any other inputs like dietary protein. Feeding markedly decreases the 13C-valine to 2H-valine ratio, indicating slower protein degradation (Fig. 6d).
Combining these data with mouse chow amino acid composition data, we quantified the sources of circulating valine during fasting and feeding (Fig. 6e). During fasting, endogenous protein degradation maintains the circulating valine pool, which is mainly consumed by protein synthesis, with a minority of valine oxidized via the TCA cycle (Fig. 6f and Supplementary Table 4). After feeding, degradation of internal protein is suppressed but overall amino acid production nevertheless increases due to dietary influx. This raises circulating levels, which by mass action increases TCA oxidation, thereby maintaining homeostasis.
Mass action enables homeostasis to varying dietary protein.
Up to now, we examined short-term amino acid homeostasis in response to an amino acid infusion, bolus or a meal. In these contexts, mass action substantially explains homeostasis. Over the longer term, however, we anticipated that more complex regulatory mechanisms would predominate. To investigate this possibility, we fed mice high- (40% caloric intake from protein), normal- (20%) or low- (10%) protein diets for 2 weeks. Other dietary components were kept the same, except for corn starch, which was adjusted to keep the diets isocaloric (Supplementary Table 5). Dietary protein abundance did not impact food intake or body weight (Extended Data Fig. 9a,b). Metabolomics revealed little impact of dietary protein on fasting serum amino acid levels (Fig. 7a and Supplementary Table 6). In the fed state, however, circulating amino acid levels reflected dietary protein content, especially the essential amino acids. The strongest impact of diet was found in fed-state BCAAs.
Fig. 7 |. Mass action explains amino acid homeostasis across high- and low-protein diets.
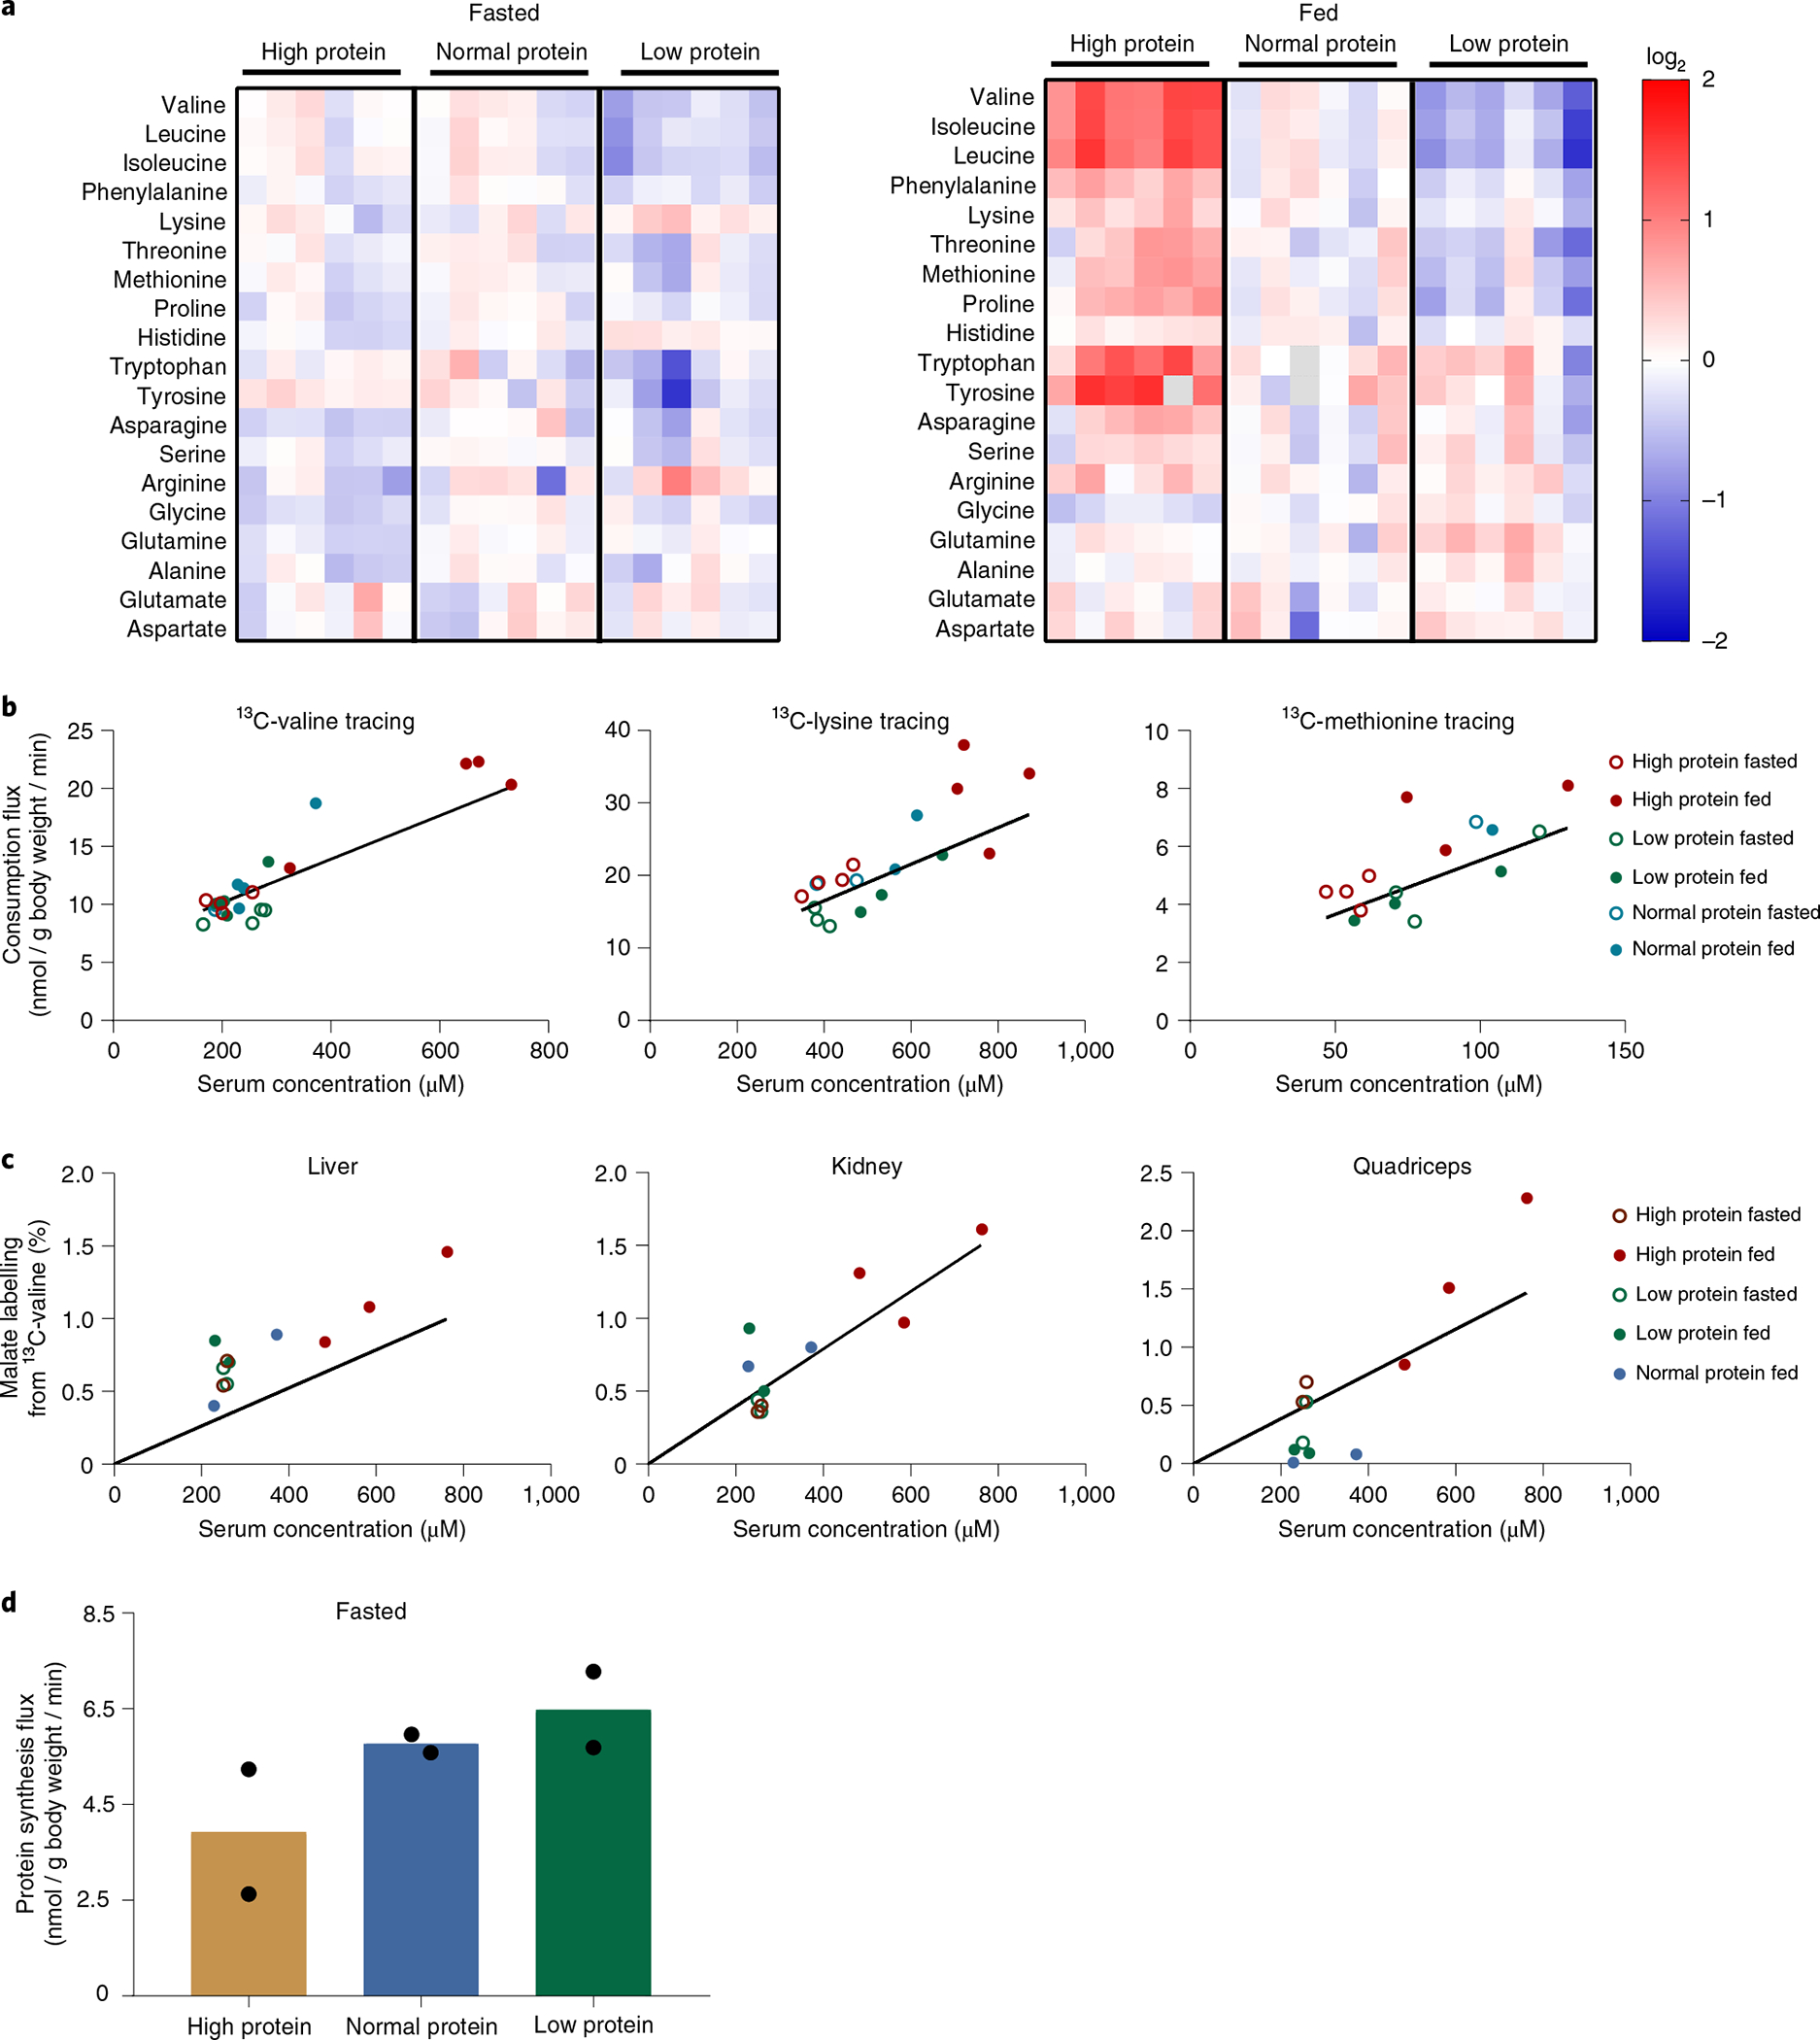
a, Serum amino acid levels in fasted and fed mice after two weeks on a high-protein, normal-protein or low-protein diet. Heatmaps are normalized to the row mean in the fasted or fed state. b, Consumption flux-concentration relationship across different dietary conditions based on non-perturbative infusions. After two weeks on the different protein diets, mice received a non-perturbative infusion of [U-13C]valine, [U-13C]lysine or [U-13C]methionine. Infusions for fasted groups were carried out exactly as in Fig. 2, except for the infusion rate being minimally perturbative. Infusions for the fed groups were carried out exactly as in Fig. 4a (food provided contained high, normal or low protein as per their diet), except for the infusion rate being minimally perturbative. The lines represent the consumption flux-concentration relationship determined based on fasted perturbative infusions from Fig. 2. c, Tissue TCA labelling-concentration relationship across different dietary conditions based on non-perturbative infusions. Mice were handled as in b, with terminal tissue sampling. The y axis shows the labelling fraction of a representative TCA intermediate (malate) relative to the serum labelling fraction of the infused 13C-valine, whose total concentration (sum of labelled and unlabelled) is plotted on the x axis. The lines represent the TCA labelling-concentration relationship determined based on fasted perturbative infusions from Fig. 5 and Extended Data Fig. 5b. d, Protein synthesis rate across dietary conditions based on non-perturbative 13C-valine infusions. The whole-body protein synthesis rate was estimated by the sum of the tissue protein synthesis rate multiplied by tissue weight. n = 6 mice in total per group with n = 2 mice per time point.
We next investigated the consumption mechanisms enabling essential amino acid homeostasis across high-, normal- and low-protein diets. Since fed-state circulating essential amino acid concentrations correlate with dietary protein content, we conducted tracer studies of essential amino acids (with a non-perturbative, low-infusion rate) to measure endogenous consumption flux. Across fed and fasted mice on different protein diets, essential amino acid consumption fluxes varied in proportion to circulating levels (Fig. 7b). In response to concentration elevations triggered by diet, the consumption fluxes still followed approximately the same linear pattern as defined by perturbative fasted state infusions in Fig. 2 (replotted without any modification or free parameters). TCA oxidation of valine was also roughly proportional to circulating concentration across all three dietary conditions regardless of fasting or feeding, following approximately the same quantitative relationship as defined by perturbative fasted state infusions in Fig. 5 (replotted without any modification or free parameters) (Fig. 7c and Extended Data Fig. 10). Protein synthesis was constant among the different diets (Fig. 7d). Thus, first-order consumption via TCA oxidation substantially explains essential amino acid homeostasis across high- and low-protein diets.
Discussion
In this study, we identified mass action-driven oxidation via the TCA cycle as a primary route for clearing excess circulating metabolites. Mass action is a simple, delay-free and robust homeostatic mechanism. Our results suggest that, across feeding and fasting, mass action suffices to maintain many metabolites within a healthy physiological regime. For essential amino acids, relatively tight control of circulating levels is facilitated by tuning endogenous protein degradation rates to counterbalance dietary influx from eating.
In chemistry, mass action kinetics are so fundamental as to be considered a law of nature. While biology never breaks the laws of chemistry, biochemical reactions often follow more complex rate equations like co-operative Michaelis–Menten kinetics32. Multistep pathways can give rise to even more complicated rate equations. Yet, for the consumption of many circulating metabolites, in vivo physiology reverts to simple mass action behaviour. At the molecular level, this reflects sufficient capacity to transport and catabolize additional substrates without any step becoming saturated. Saturation of course occurs at sufficiently high circulating concentrations, in our experiments often at about fourfold normal physiological circulating concentrations and fluxes.
Besides mass action, an additional regulatory machinery is also important for ensuring circulating metabolite homeostasis. Insulin plays an essential role in preventing pathological glucose and ketone body accumulation. Glucagon prevents pathological hypoglycaemia and likely represents just one of many regulatory mechanisms, both hormonal and enzymatic, that promotes survival by preventing catastrophic metabolite depletion. For example, the main physiological role of BCKDK may be to conserve BCAAs during prolonged dietary protein deficiency.
Indeed, mass action is better suited to dealing with metabolite excesses than shortages. In response to the elevated influx, the main downside of mass action, relative to more complex regulation, is less tight control of metabolite levels. However, to deal with metabolite shortages, mass action has a more serious flaw: it is insufficient to prevent a constant leakage of precious metabolites, especially ones that need to be maintained at substantial concentrations to support essential processes like protein synthesis. This requires more active regulation, such as hormonal signalling or co-operative enzymes33. Such regulatory capacity is relatively ancient. For example, on glucose removal, both Escherichia coli and yeast paradoxically build up lower glycolytic intermediates, an adaptive response that is only feasible due to ultrasensitive allosteric enzyme regulation34, https://pubmed.ncbi.nlm.nih.gov/22902555/, https://pubmed.ncbi.nlm.nih.gov/22522319/. By allowing enzymes to respond to more than substrate and product, allostery also enables distant regulatory connections (for example, citrate suppression of phosphofructokinase)35 including crosstalk between pathways36.
In humans, our roughly 30,000 genes and a myriad of nucleic acid and protein covalent modifications provide even greater regulatory flexibility37–39. Not all of these are necessarily recapitulated in mice, which have a much higher surface-area-to-volume ratio and basal metabolic rate than humans. Validating our findings in larger mammals including humans is an important future objective. Nevertheless, at least in mice, circulating metabolite homeostasis provides a striking example where many genes work in concert to produce quantitatively simple systems-level behaviour.
These linear metabolic responses are evocative of other linear relationships in biology. For example, ribosome abundance in bacteria increases linearly with growth rate40,41 and decreases linearly with increasing medium osmolarity42. Such linear relationships help make biology predictable and controllable. The sufficiency of mass action to maintain metabolic homeostasis also likely played a critical role throughout evolution, allowing organisms to function before overt regulation evolved43–45. Its continued primacy in mammals—at least for many metabolites and circumstances—should facilitate the quantitative understanding and control of metabolism going forward.
Methods
Ethical compliance.
Animal studies followed protocols approved by the Princeton University or Rutgers University Institutional Animal Care and Use Committee.
Animals, reagents and blood collection.
Infusions and injections were performed, unless otherwise indicated, on precatheterized 8–12-week-old C57BL/6J male mice into the right jugular vein. For BCKDK whole-body knockout mice and littermate controls, jugular vein catheterization was performed on 6–8-week-old male mice. Catheterization was performed either by the authors or Charles River Laboratories. Catheterized mice were single-housed to prevent catheter detachment. The mice holding room followed a normal light cycle (lights on/off 8:00–20:00). Temperature and humidity were maintained at 22 °C and 30–70%. Animals were fed with PicoLab Rodent Diet 20 unless otherwise specified. The diets with different protein contents were formulated by Research Diet (nos. D11112201, D18031205 and D18031206). On the experiment day, mice were transferred to new cages without food at 9:00. Drinking water was provided as a hydrogel. After fasting with or without refeeding, isotope-labelled metabolites (Cambridge Isotope Laboratories) were injected or infused in sterile saline. All three BCAAs were always delivered together, in a ratio of 5:6:3 valine:leucine:isoleucine, with the indicated metabolite in labelled form and the others unlabelled. Other metabolites were delivered individually. Blood samples were collected by tail bleed, incubated on ice for 20 min and centrifuged at 16,000g for 10 min at 4 °C to obtain serum. Serum samples were kept at −80 °C until liquid chromatography–mass spectrometry (LC–MS) analysis.
Intravenous bolus injections.
Bolus injections were carried out in 7–8 h fasted mice at 16:00–17:00. The injection volume was 10 μl g−1 body weight, with the concentration chosen to achieve the desired dose. An individual mouse was briefly placed in a restrainer during the injection and delivery was via the catheter within 30 s. The mouse was then moved back to the cage and blood was taken by tail snipping at 5, 15, 30 and 60 min after the injection. Injection doses are shown in Supplementary Table 7a.
Intravenous infusions.
Infusions were carried out in both fasted and refed mice. For the fasted condition, mice were transferred to new cages without food at 9:00, followed by infusion at 15:00 for 2.5 h when mice were physiologically fasted. Drinking water was provided continuously as a hydrogel. This infusion duration has previously been shown to achieve pseudo-steady state circulating and tissue TCA cycle labelling18. For the fed condition, mice were transferred to new cages without food at 9:00. Drinking water was provided as a hydrogel. Food was provided at 20:00 when mice normally started to eat, simultaneously with lights off and the start of the infusion for 2.5 h. The infusion rate was 0.1 μl g body weight min−1, with the concentration chosen to achieve the desired influx. Tail blood was taken by tail snipping at the end of the infusion. Mice were euthanized by cervical dislocation and tissues were collected immediately and snap-frozen with a liquid nitrogen cold Wollenberg clamp and stored at −80 °C. Serum and tissue samples were kept at −80 °C until LC–MS analysis. The infusion rates used are shown in Supplementary Table 7b.
Metabolite extraction.
Serum metabolites were extracted from 5 μl samples using 100 μl 40:40:20 methanol:acetonitrile:water mixture (extraction solvent). Known concentrations of 15N and/or 13C positionally labelled metabolite standards were spiked into the extraction solvent to measure absolute circulating metabolite concentrations. Samples were vortexed for 5 s and centrifuged at 16,000g for 20 min at 4 °C. The supernatant was loaded on LC–MS for analysis. For tissue metabolite extraction, frozen tissues were ground with a cryomill for 60 s and metabolites were extracted from approximately 15 mg tissue powder using the above extraction solvent. The amount of solvent added was 40× the weight of tissue in milligrams. The samples were vortexed for 30 s and centrifuged at 16,000g for 30 min at 4 °C. The supernatant was loaded on LC–MS for analysis.
Tissue protein extraction.
Tissue proteins were hydrolysed to measure protein amino acids. A total of 5 mg frozen tissue powder was dissolved in 300 μl water, followed by 200 μl chloroform and 400 μl methanol. The mixture was vortexed and centrifuged at 16,000g for 10 min at 4 °C. The upper layer was discarded and the remaining sample was washed twice by adding 600 μl methanol. The supernatant was removed after centrifuging at 16,000g for 10 min at 4 °C. The precipitated proteins were incubated with 250 μl of 6 M HCl at 110 °C overnight. Then, 5 μl of the solution was dried with blowing nitrogen gas. Finally, 2 ml methanol was added to redissolve the sample before loading on LC–MS.
Metabolite measurement by LC–MS.
A quadrupole-orbitrap mass spectrometer (Q Exactive; Thermo Fisher Scientific) operating in negative ion mode was coupled to hydrophilic interaction chromatography via electrospray ionization and used to scan from m/z 70 to 1,000 at 1 Hz and 140,000 resolution. LC separation was on an XBridge BEH amide column (2.1 × 150 mm, 2.5 μm particle size, 130 Å pore size; Waters) using a gradient of solvent A (20 mM ammonium acetate, 20 mM ammonium hydroxide in 95:5 water:acetonitrile, pH 9.45) and solvent B (acetonitrile). The flow rate was 150 μl min−1. The LC gradient was: 0 min, 85% B; 2 min, 85% B; 3 min, 80% B; 5 min, 80% B; 6 min, 75% B; 7 min, 75% B; 8 min, 70% B; 9 min, 70% B; 10 min, 50% B; 12 min, 50% B; 13 min, 25% B; 16 min, 25% B; 18 min, 0% B; 23 min, 0% B; 24 min, 85% B; and 30 min, 85% B. The autosampler temperature was 5 °C and the injection volume was 3 μl. Data were analysed using the EI-MAVEN software (v 0.2.4, Elucidata) with natural isotope correction46,47.
Hyperinsulinaemic–euglycaemic clamp.
Eight-to-12-week-old C57BL/6J male mice were implanted with both carotid artery and jugular vein catheters. The arterial catheter was used for blood sampling and the venous catheter was used for infusion. Mice were fasted at 8:00. The infusion started at noon and arterial blood samples (approximately 20 μl) were collected after 2.5 h as baseline samples. After blood collection, insulin was infused at 2.5 mU kg body weight min−1. Glucose was coinfused to maintain its circulating level. Arterial blood samples were collected after 2 h as clamp samples.
Protein degradation rate measurement.
Precatheterized 8–12-week-old C57BL/6J male mice were infused (0.1 μl g body weight min−1) with 20 mM [U-13C]valine starting from 16:00 to label tissue proteins with regular light–dark cycle and ad libitum feeding. The infusion was stopped at 16:00 on the third day for 4 h to clear the residual circulating [U-13C]valine while mice were fasted. At 20:00, mice were infused (0.1 μl g body weight min−1) with 20 mM [U-2H]valine for 2.5 h in the dark while one group was kept fasted and the other group was provided with food. Tail blood was collected by tail snipping at 30, 60 and 150 min after infusion. The protein degradation rate (P) was calculated by the infusion rate (Rinf) of [U-2H]valine times the ratio of enrichment (E) of [U-13C]valine to [U-2H]valine (P/Rinf = E[U-13C]-valine/ E[U-2H]-valine).
Protein synthesis rate measurement.
Precatheterized 8–12-week-old C57BL/6J male mice were infused (0.1 μl g body weight min−1) with 20 mM [U-13C]valine with unlabelled leucine and isoleucine (or, when indicated, with all three labelled) for 2, 4 or 6 h. Tail blood was taken by tail snipping at the end of the infusion. Mice were euthanized by cervical dislocation and tissues were collected immediately. Tissues were snap-frozen with a liquid nitrogen cold Wollenberg clamp and stored in liquid nitrogen. Proteins were extracted and hydrolysed to yield protein-derived amino acids as above. The resulting samples were kept at −80 °C until LC–MS analysis. The protein synthesis rate for each tissue was calculated with the equations shown in Extended Data Fig. 6a. The whole-body protein synthesis rate was calculated as the sum of the synthesis rate multiplied by tissue weight for all tissues collected.
Statistics.
No statistical methods were used to predetermine sample sizes. Sample sizes are similar to those reported in previous publications17,18. No data point was excluded unless specified in the figure legends for fitting reasons.
Reporting Summary.
Further information on research design is available in the Nature Research Reporting Summary linked to this article.
Data availability
All data and materials will be provided on reasonable request to the lead corresponding author (joshr@princeton.edu). Source data are provided with this paper.
Extended Data
Extended Data Fig. 1 |. Perturbative infusion outcomes for different regulatory mechanisms.
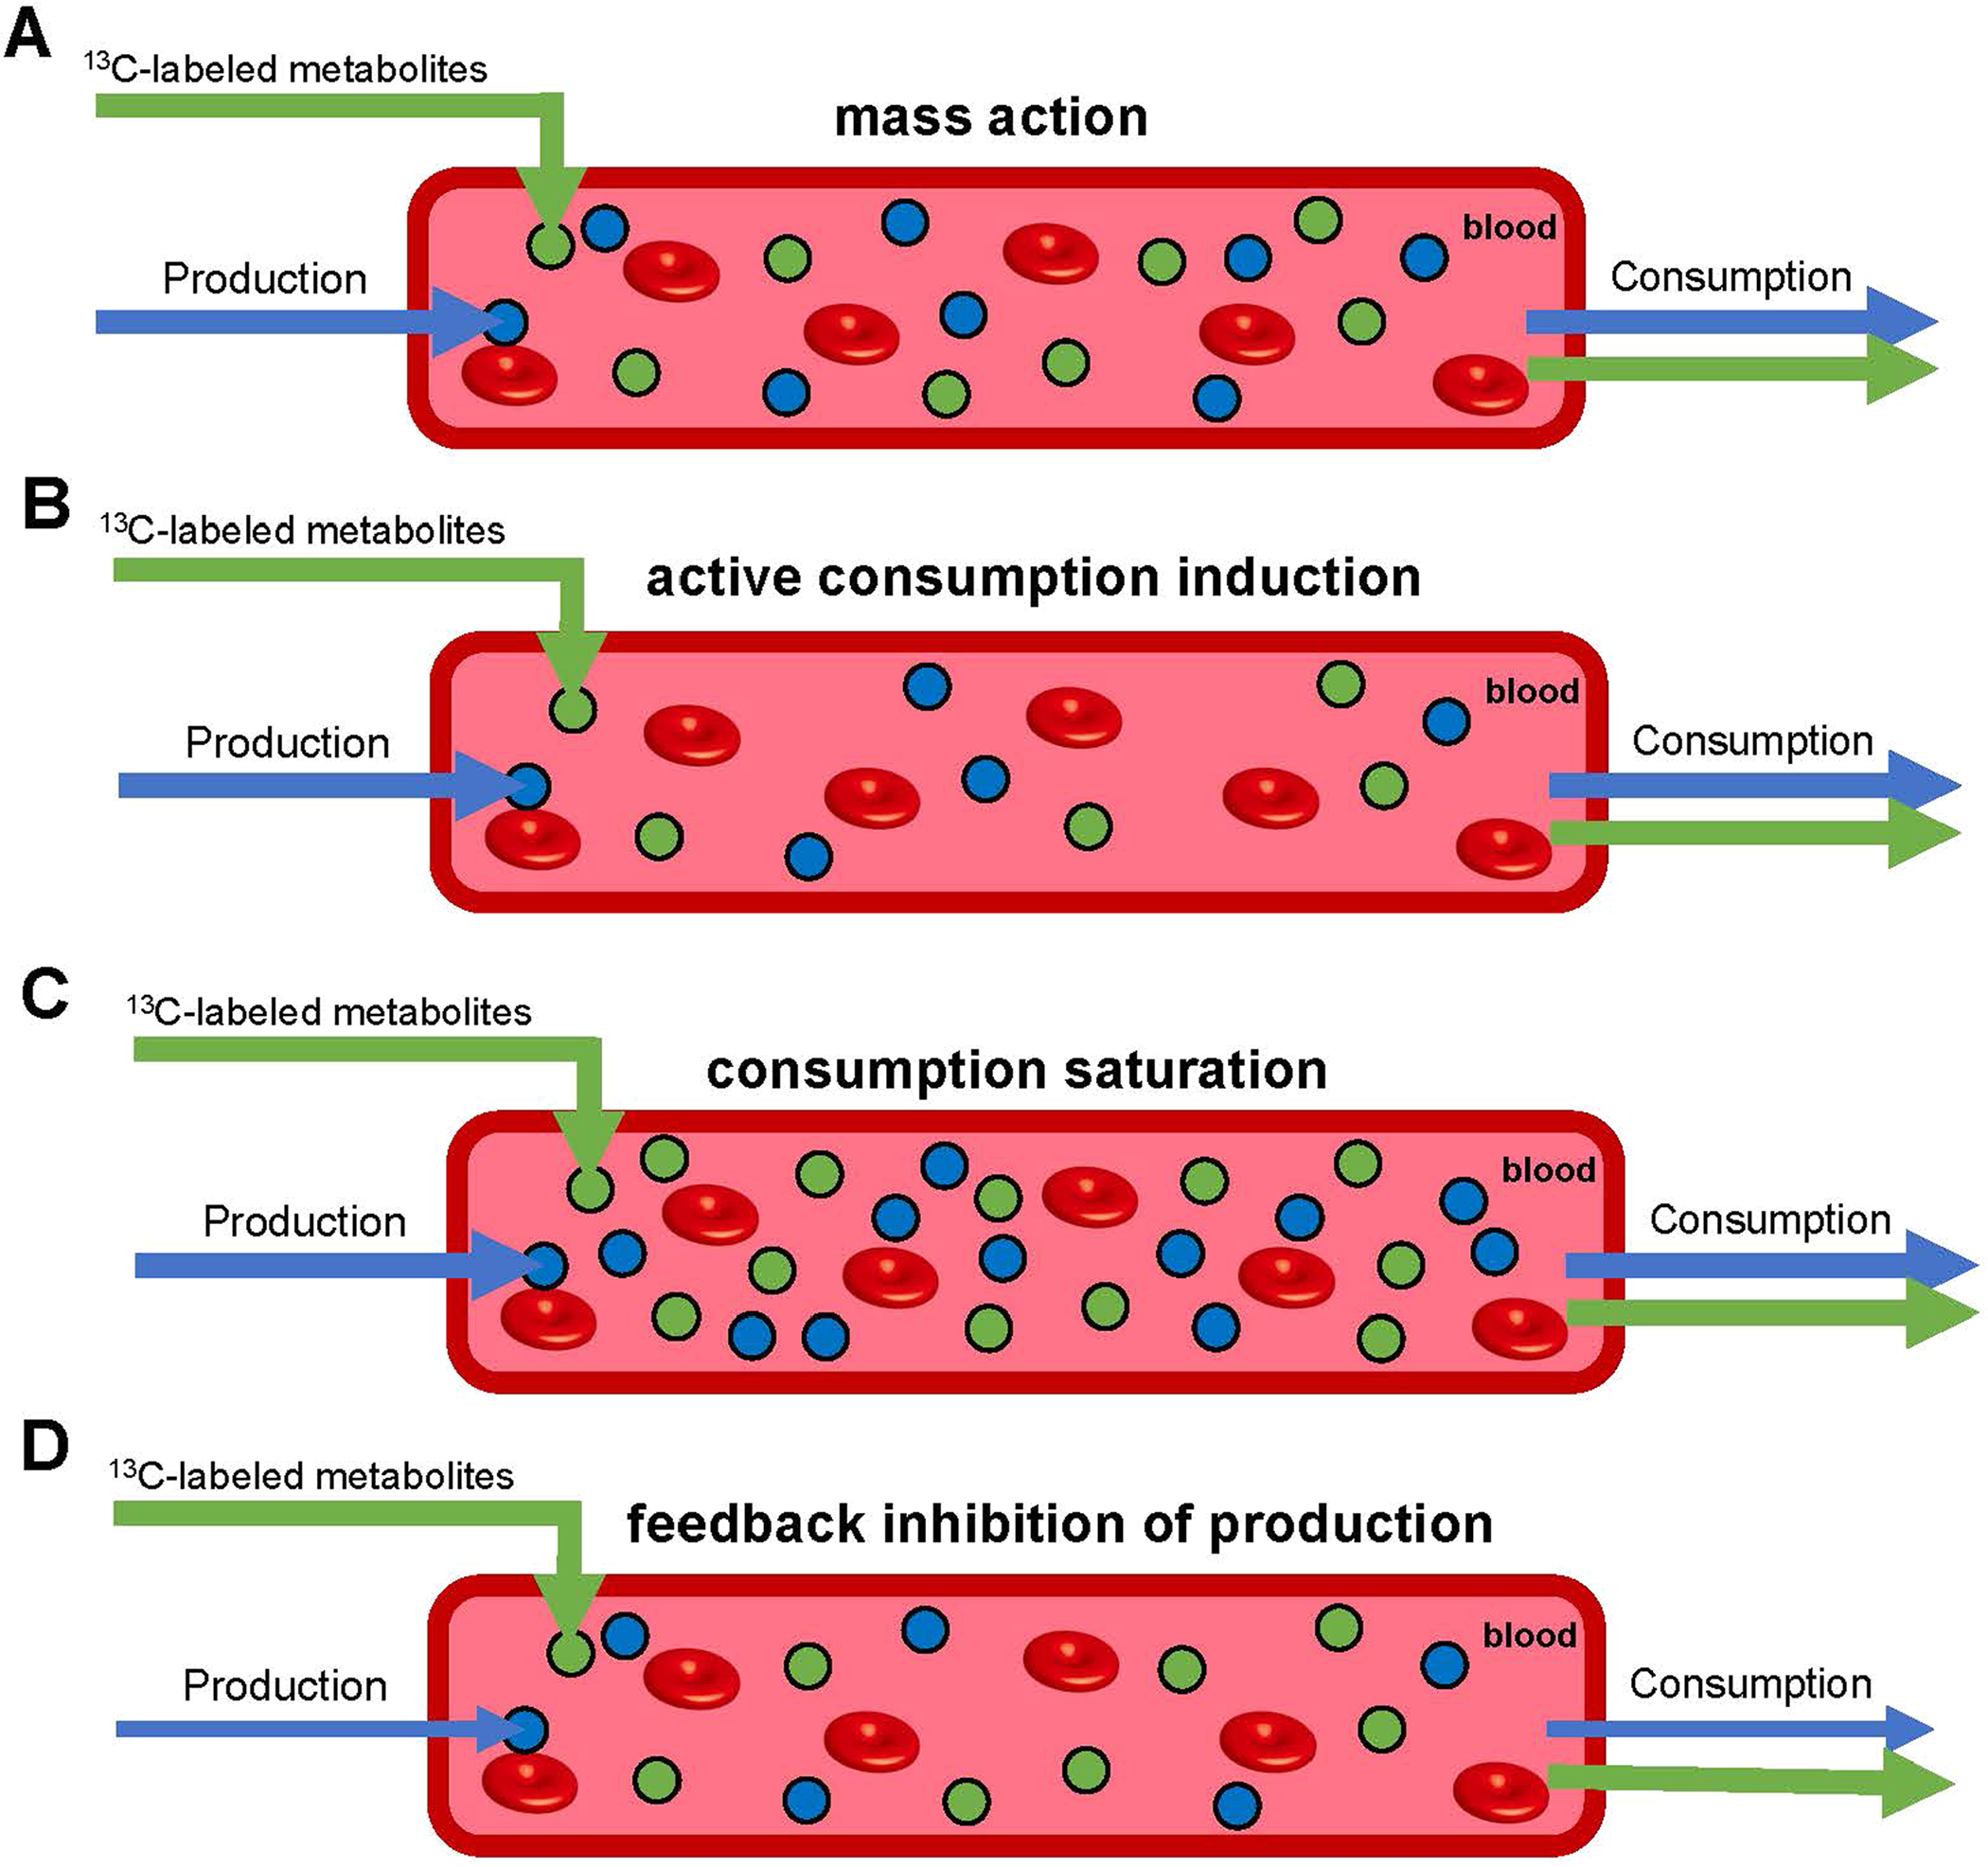
Green arrows reflect labeled metabolite fluxes including the experimenter-controlled influx from infusion. Blue arrows reflect unlabeled metabolite fluxes, including endogenous production. Green and blue circles are labeled and unlabeled metabolites, respectively. Red circles represent red blood cells. (a) Mass action. Labeled metabolites accumulate linearly with infusion rate, with unlabeled metabolite concentrations and fluxes not altered. (b) Active consumption induction. Labeled metabolites accumulate less than linearly with infusion rate, with unlabeled metabolite levels decreased but fluxes unaltered. (c) Consumption saturation. Labeled metabolites accumulate more than linearly with infusion rate, with unlabeled metabolites levels increased but fluxes unaltered. (d) Feedback inhibition of production. Unlabeled metabolite levels and fluxes are decreased.
Extended Data Fig. 2 |. Clearance of metabolite boluses is consistent with mass action kinetics.
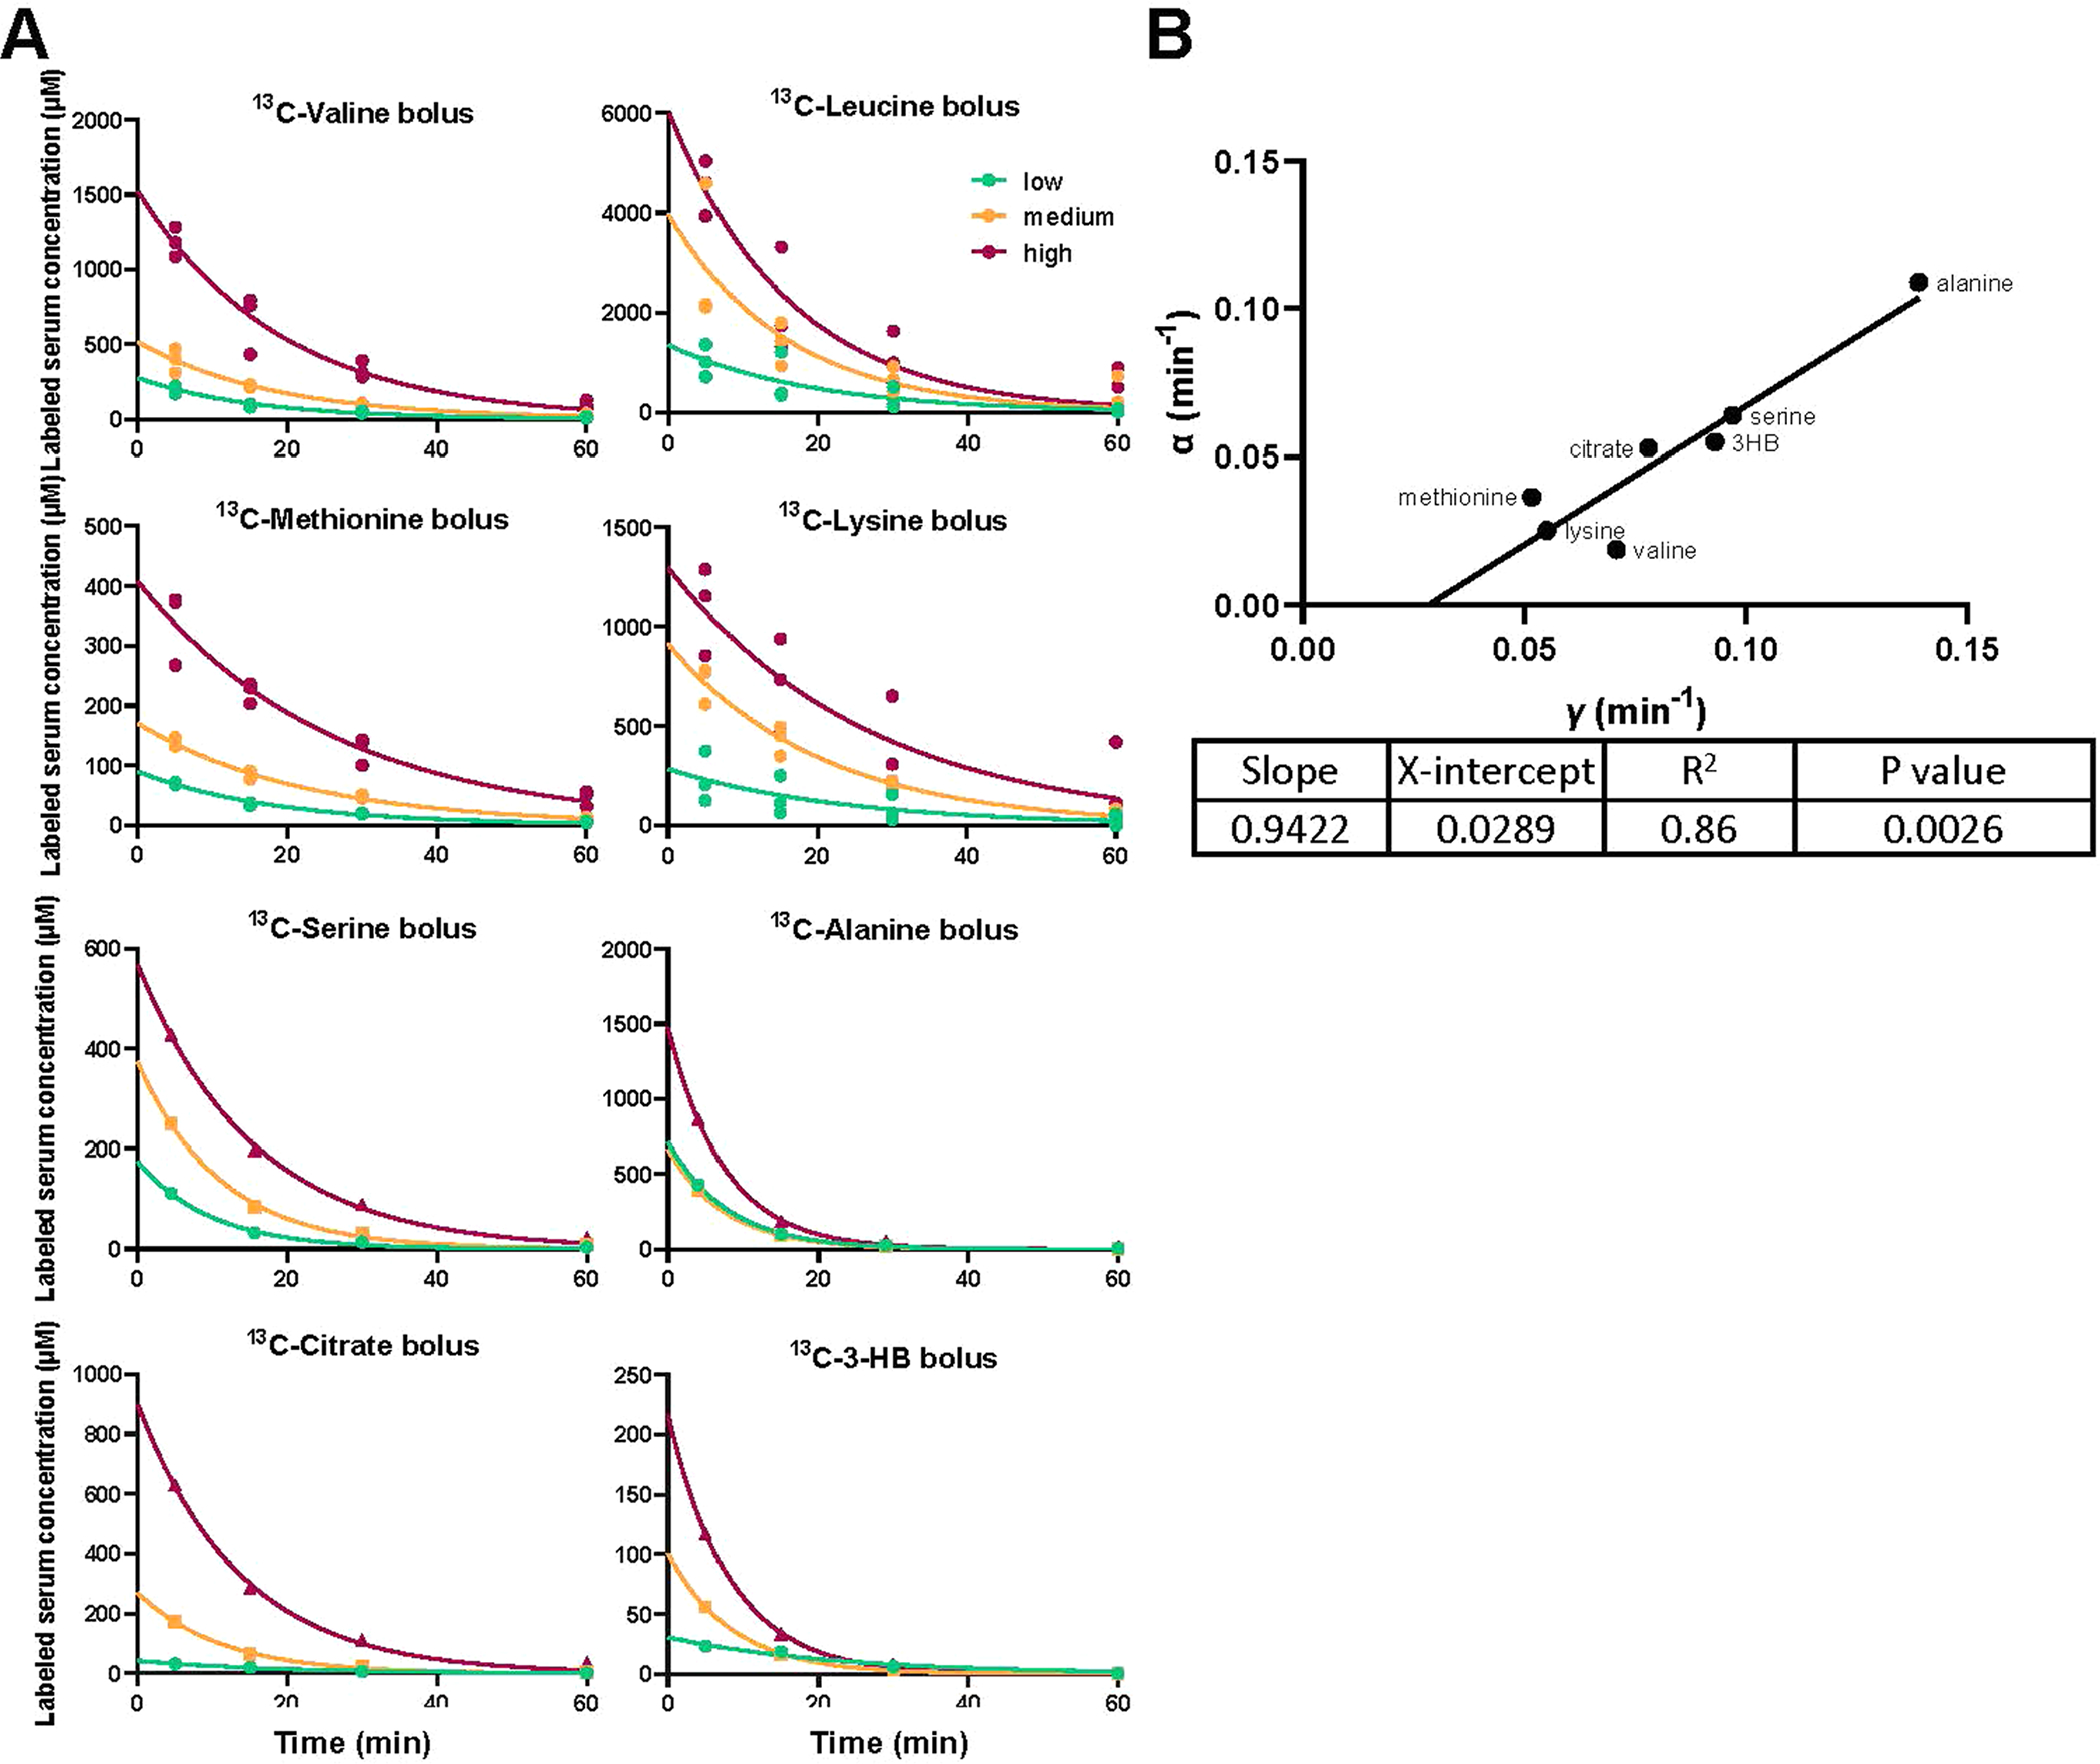
(a) Mice were fasted from 9 AM to 5 PM (8 h fasting). At 5 PM, mice were injected with an intravenous bolus of the indicated [U-13C] metabolite at a low, medium, or high dose (as specified in the methods). Blood was taken 5, 15, 30, and 60 min after the injection, and the concentration of labeled metabolite in serum was measured by LC-MS. For experiments involving branched-chain amino acids, all three were given together, with only the indicated amino acid in labeled form. Labeled metabolite concentration was plotted against time post bolus. Lines are exponential decay curves fitted with mean value of each group. (b) Pseudo-first-order consumption rate constants from bolus and perturbative infusions. The slopes (α) calculated from the infusion experiments were plotted against the elimination constants (γ) calculated from the bolus experiments for each circulating metabolite. Line is linear regression fit.
Extended Data Fig. 3 |. Elevated portal vein alanine in fed mice.
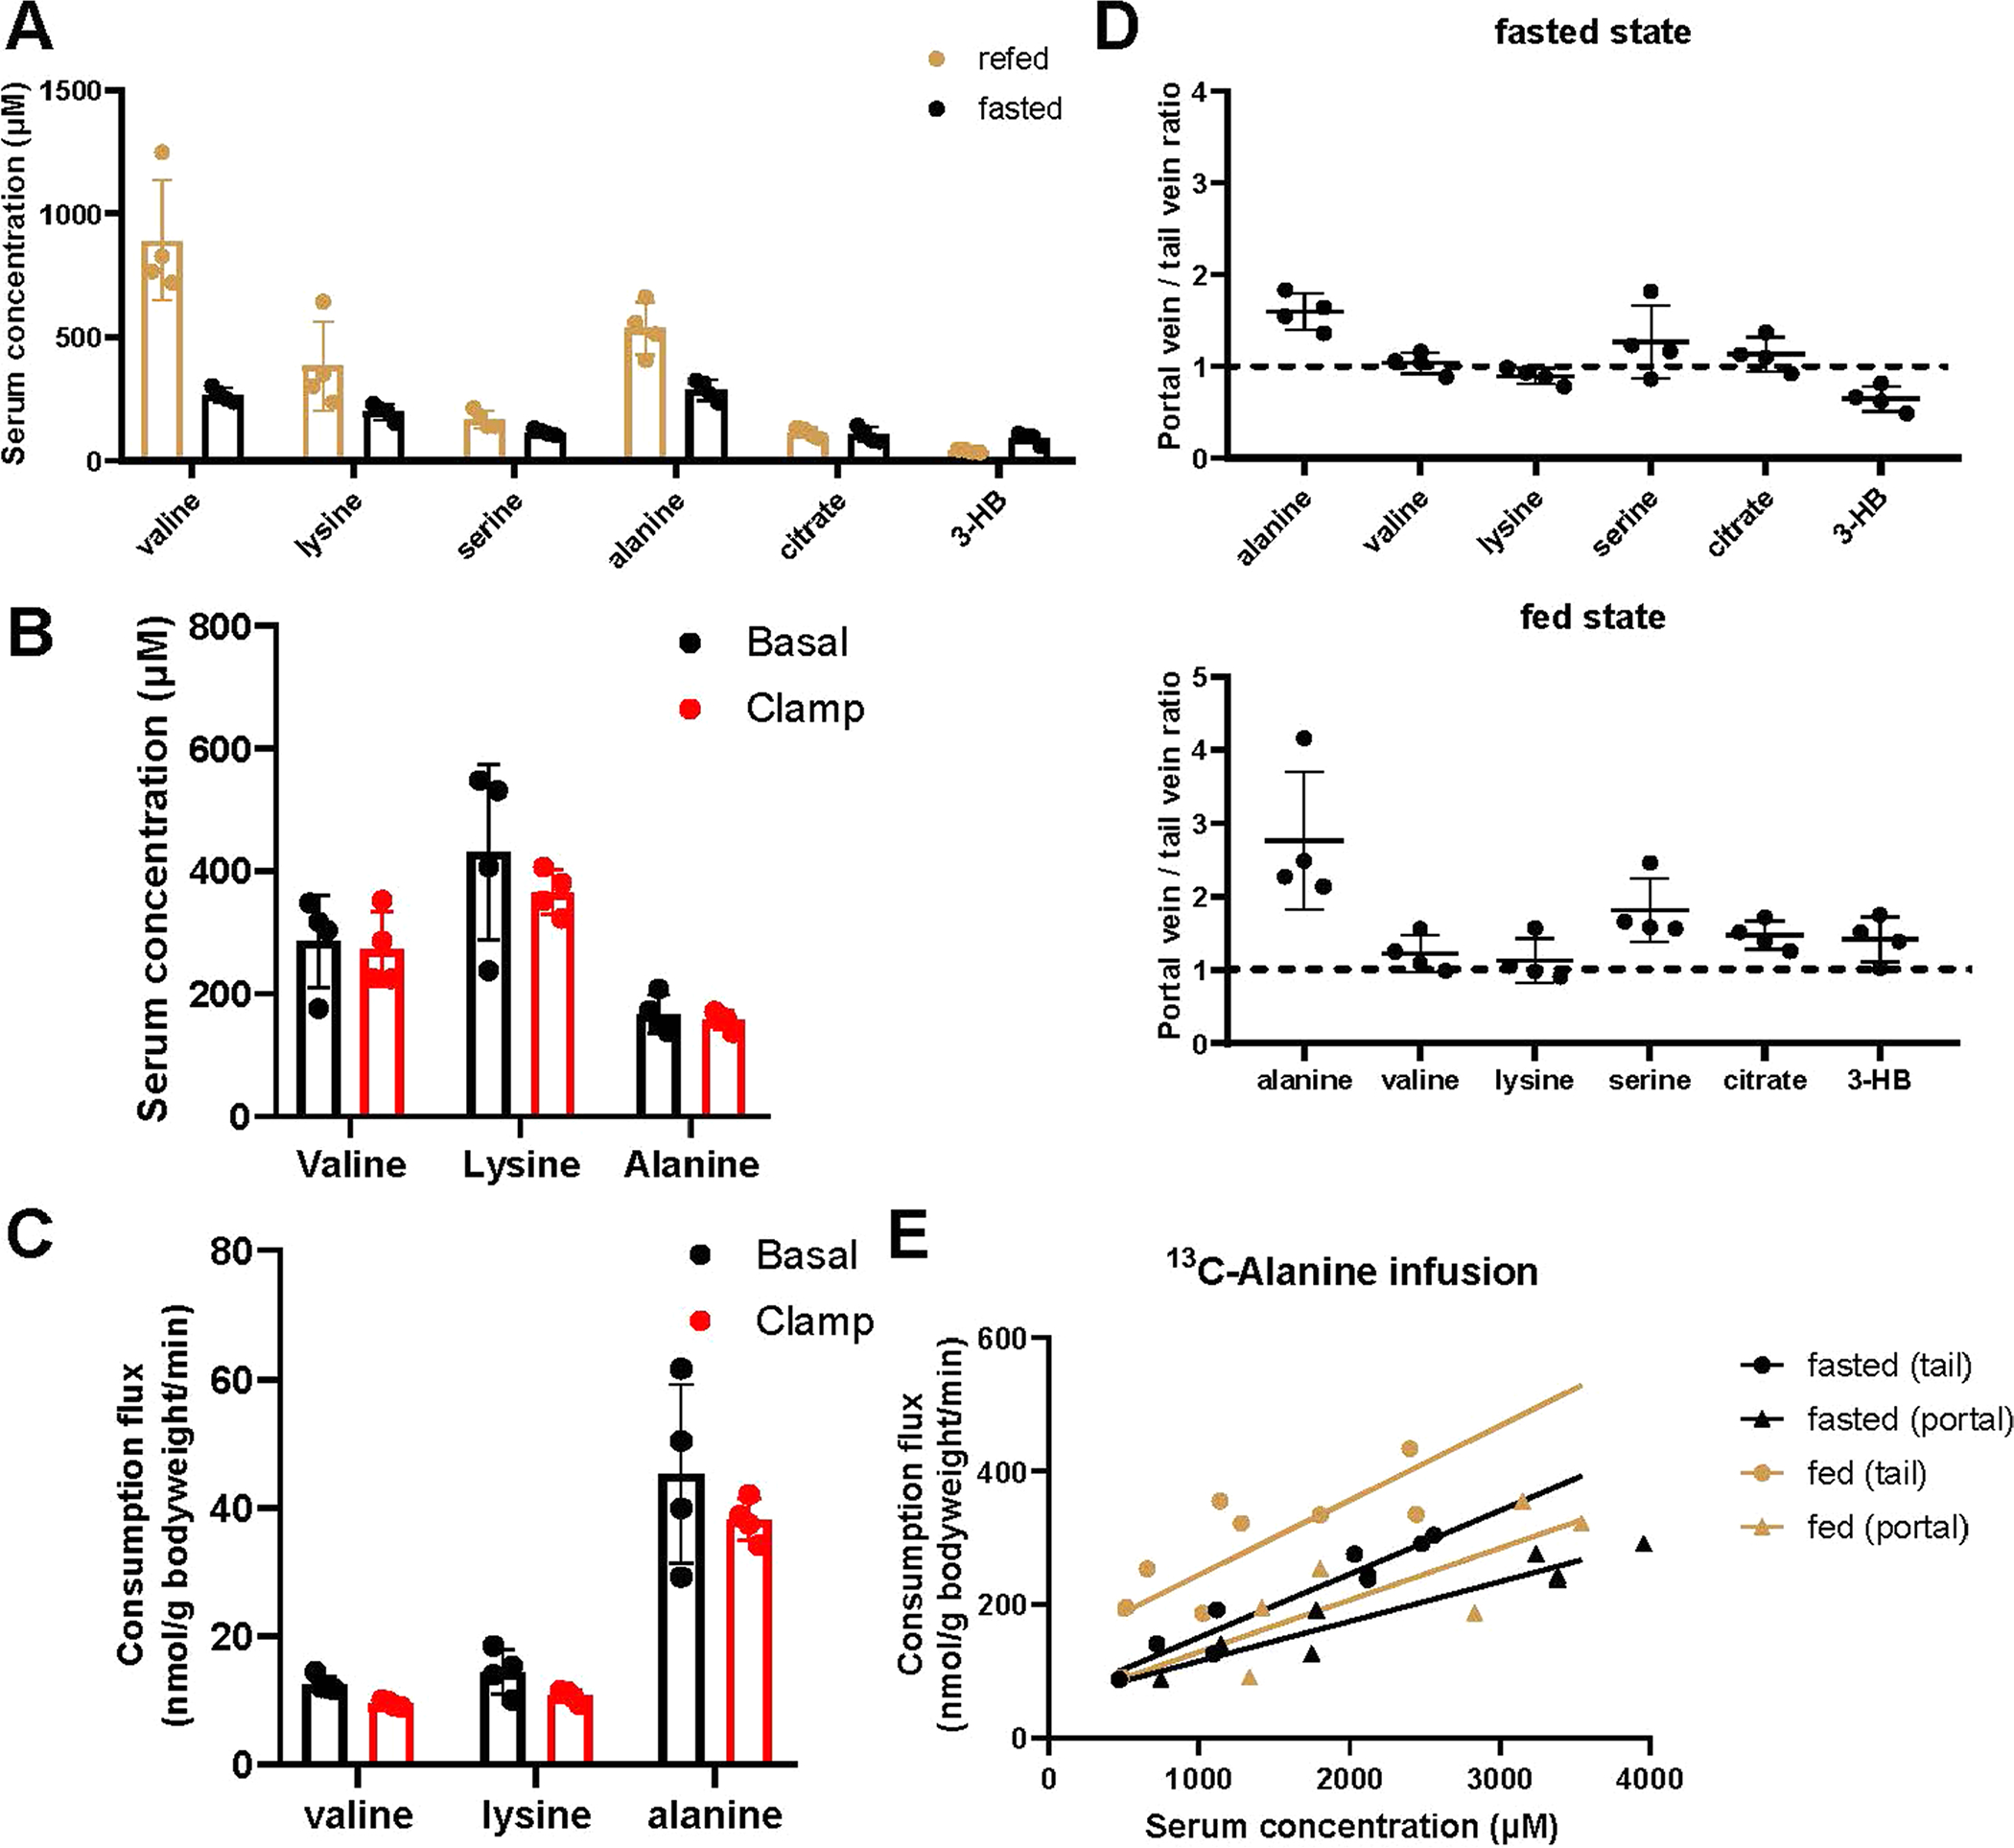
(a) Circulating metabolite concentrations in the fasted and refed state. Fasting and feeding schedules were the same as Fig. 4a. Blood was taken at 5 PM for the fasted group and 11 PM for the refed group. Mean±SD. n = 4 mice. (b, c) Insulin does not alter concentrations or consumption fluxes of valine, lysine, and alanine. (b) Serum metabolite levels from hyperinsulinemic-euglycemic clamp (2.5 mU/kg/min insulin) and control (saline) experiments. Mice were fasted from 10 AM to 5 PM. The clamp was performed from 3 PM to 5 PM and blood was collected at 5 PM. Mean±s.d. n = 4 mice. (c) Consumption fluxes in the above clamp condition based on non-perturbative infusion of a mixture of 13C-valine, 13C-lysine, and 13C-alanine. The 13C-infusion was initiated 2.5 h prior to starting insulin to induce the hyperinsulinemic clamp and continued throughout the clamp experiment. Blood samples were taken immediately prior to or 120-min after initiation of the clamp. Mean±s.d. n = 4 mice. (d) Metabolite concentration ratios between the portal vein and tail vein of fasted (7.5 h fast starting at 9:30 AM, with sampling at 5 PM) or ad lib fed mice (with sampling at 11 PM). Mean±s.d. n = 4 mice. (e) Calculation of alanine consumption flux-concentration relationship using tail or portal vein data. Portal vein concentrations were calculated by multiplying alanine data from Fig. 4a by the portal/tail vein TIC ratio from (d). Lines are linear fits to each dataset.
Extended Data Fig. 4 |. BCKDK whole-body KO mice are lethargic when fed low protein diet.
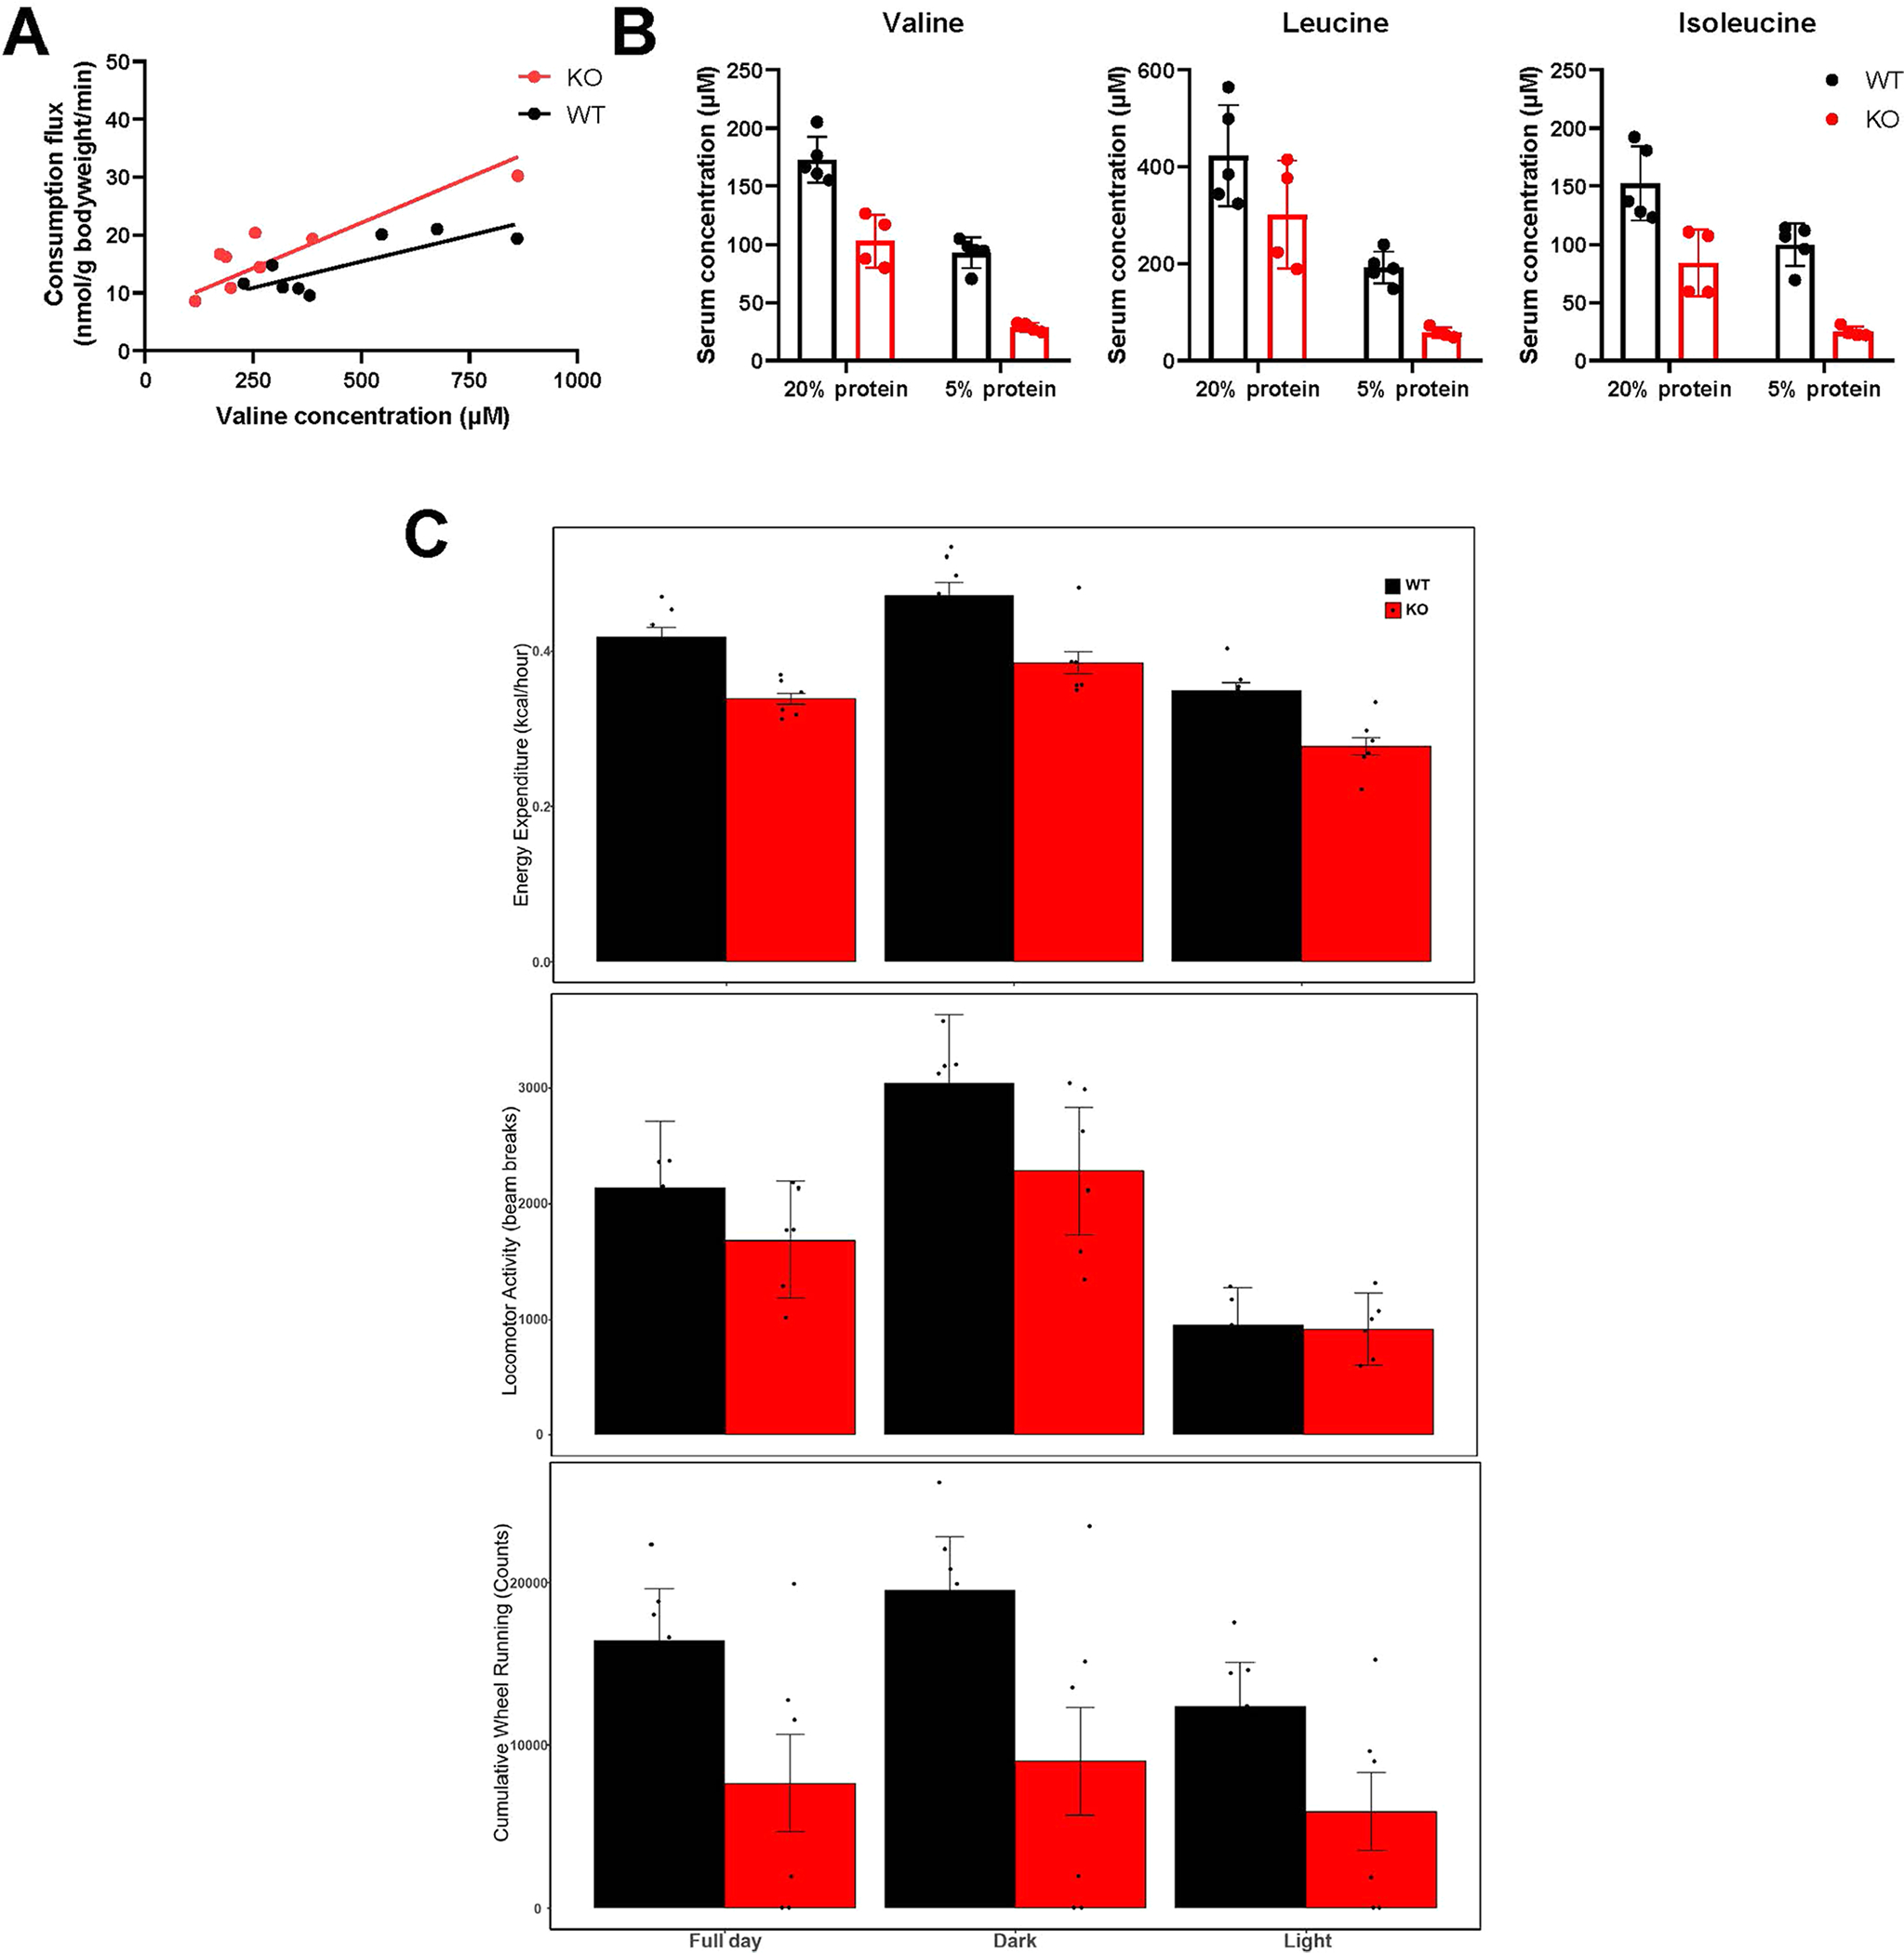
(a) Valine consumption flux versus circulating concentration in whole-body BCKDK knockout (KO) mice and littermate control mice (WT). Both groups were infused with [U-13C]valine as in Fig. 2. Lines are linear fits to each dataset. (b) KO and WT mice were fed either 20% or 5% protein diet for 7 days and blood was taken at 5 PM on the last day. Mean±SD. n = 5 WT and 4 KO mice. (c) Activity of KO and WT mice fed 5% protein diet as measured using metabolic chambers. Mean±SD. n = 6 mice.
Extended Data Fig. 5 |. TCA oxidation mediates mass action-driven consumption.
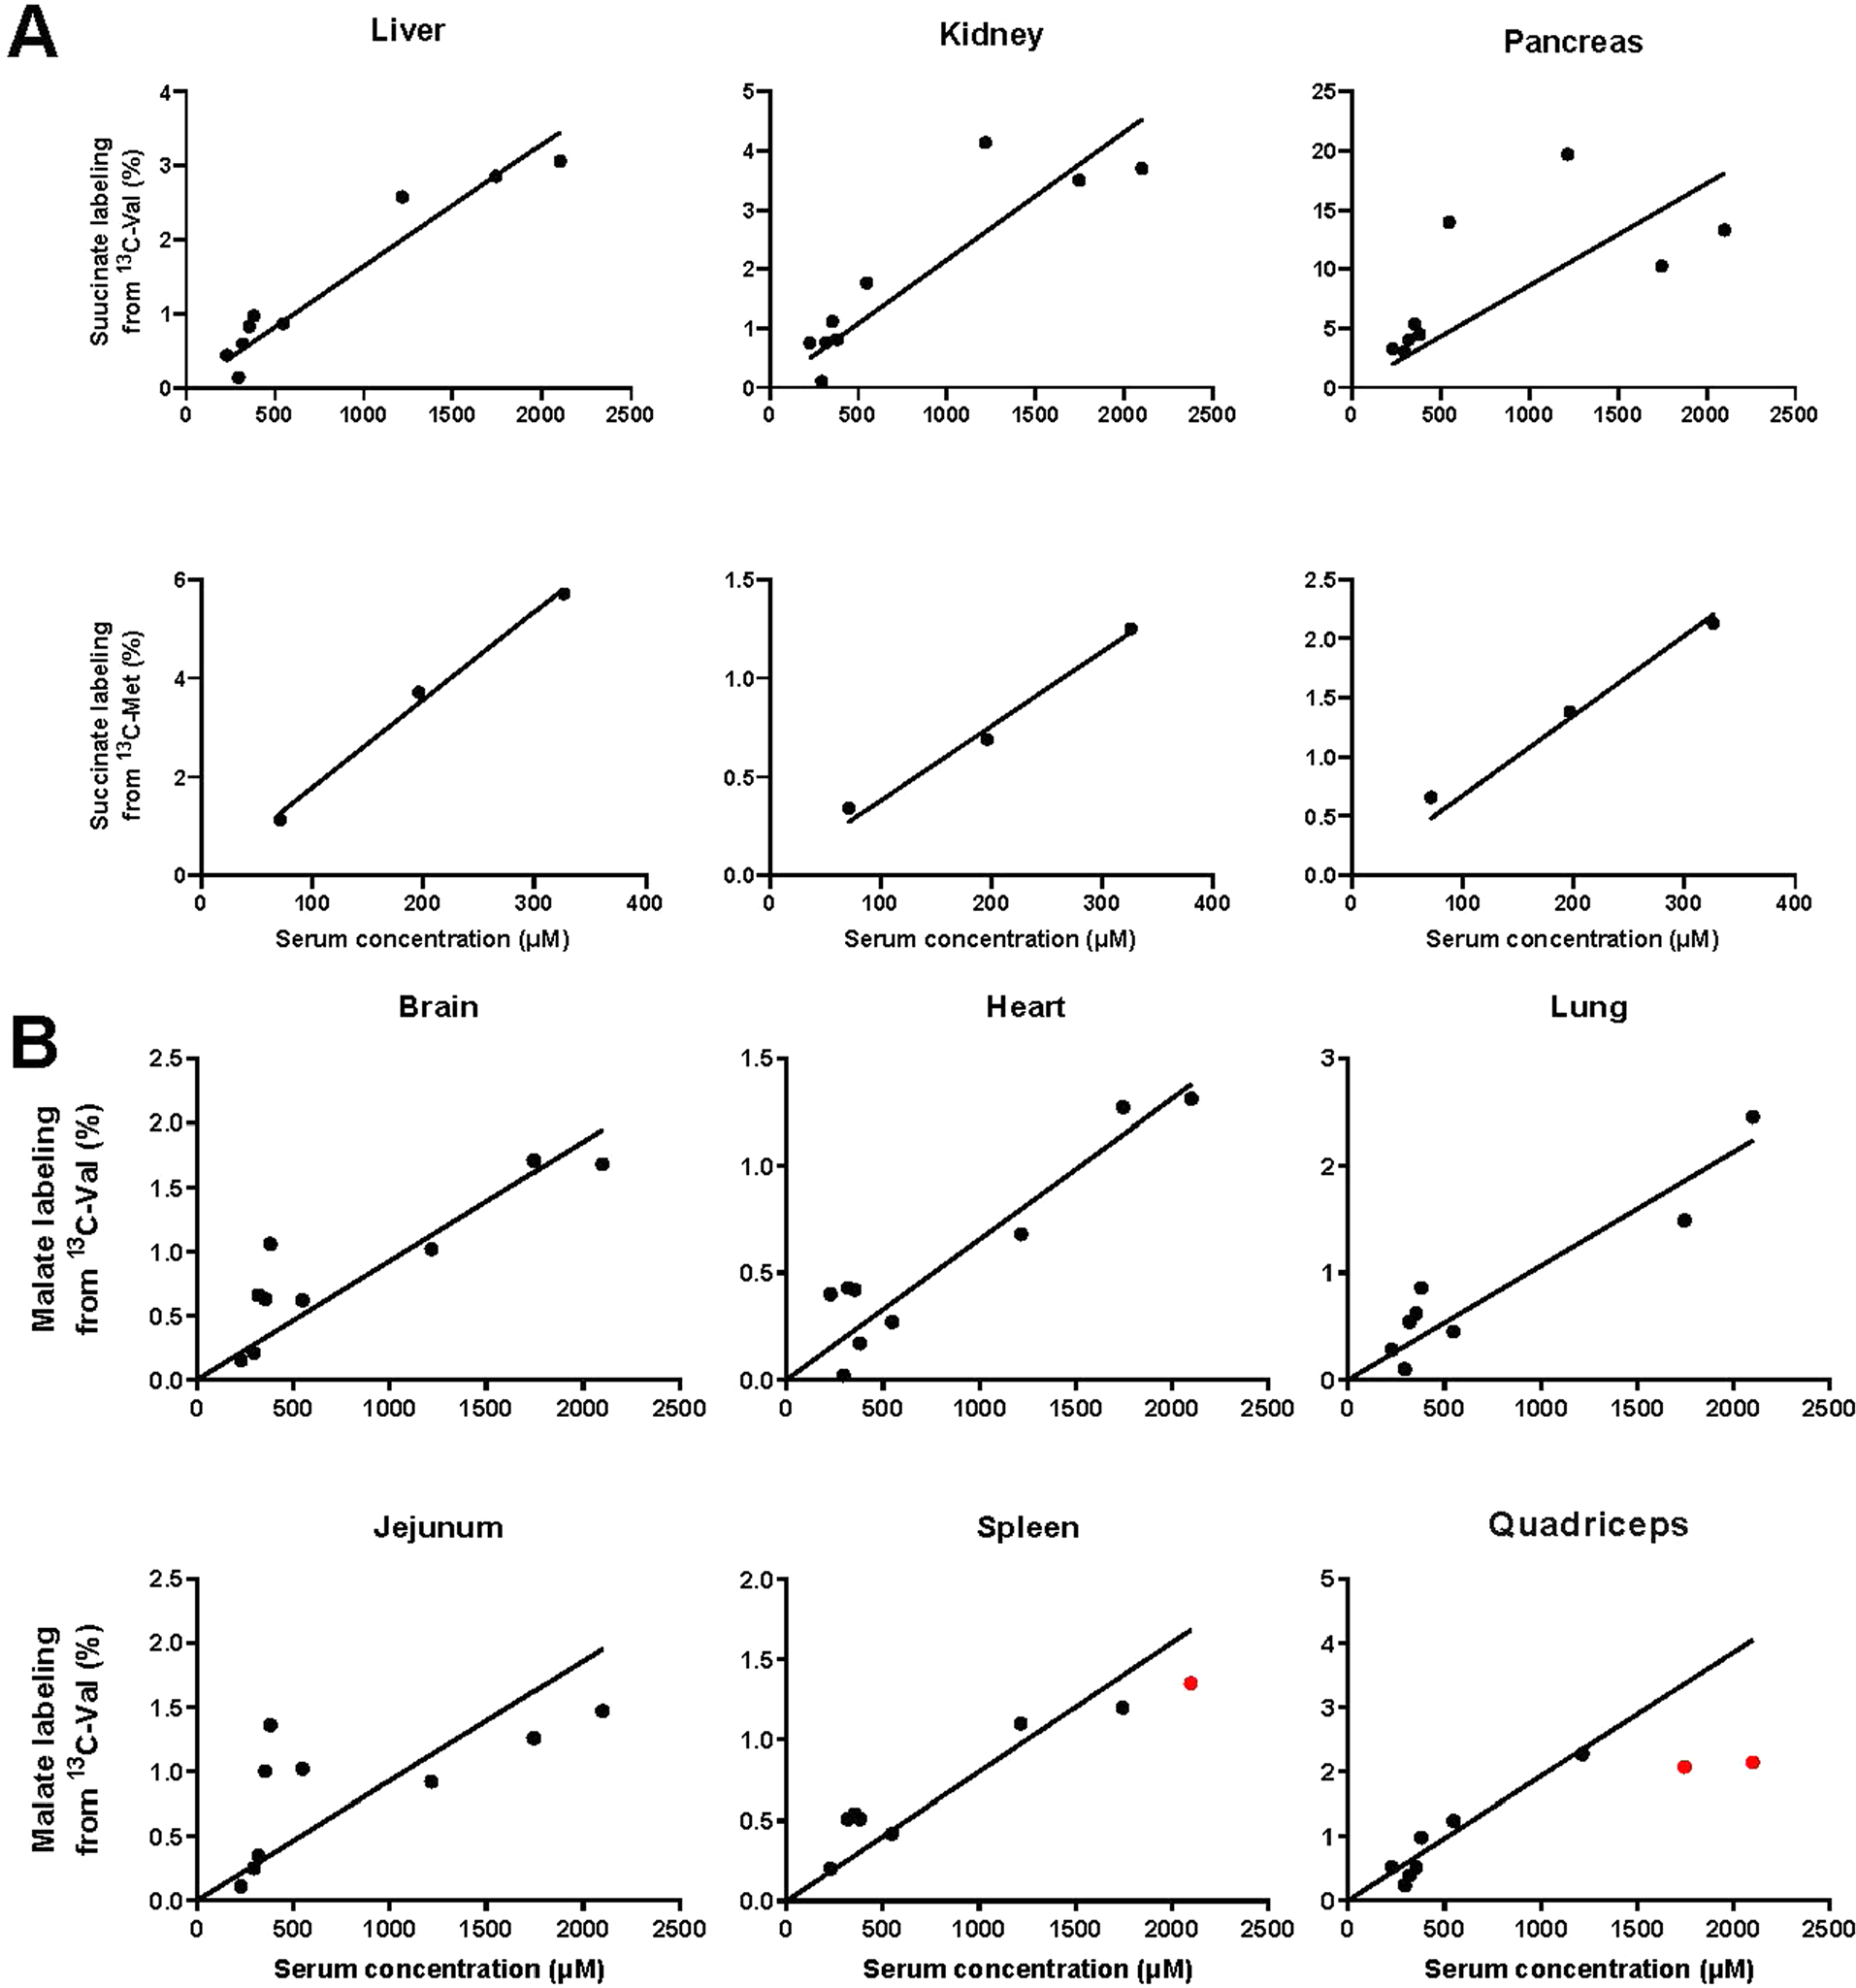
Tissue TCA labeling-concentration relationship for fasted perturbative infusions. Data are as in Fig. 5, except for (a) Use of succinate rather than malate to read out tissue TCA labeling or (b) Measurement of malate labeling across additional organs. Lines are linear fits to the data with intercept set to zero.
Extended Data Fig. 6 |. Protein synthesis rates are insensitive to branched-chain amino acid infusion.
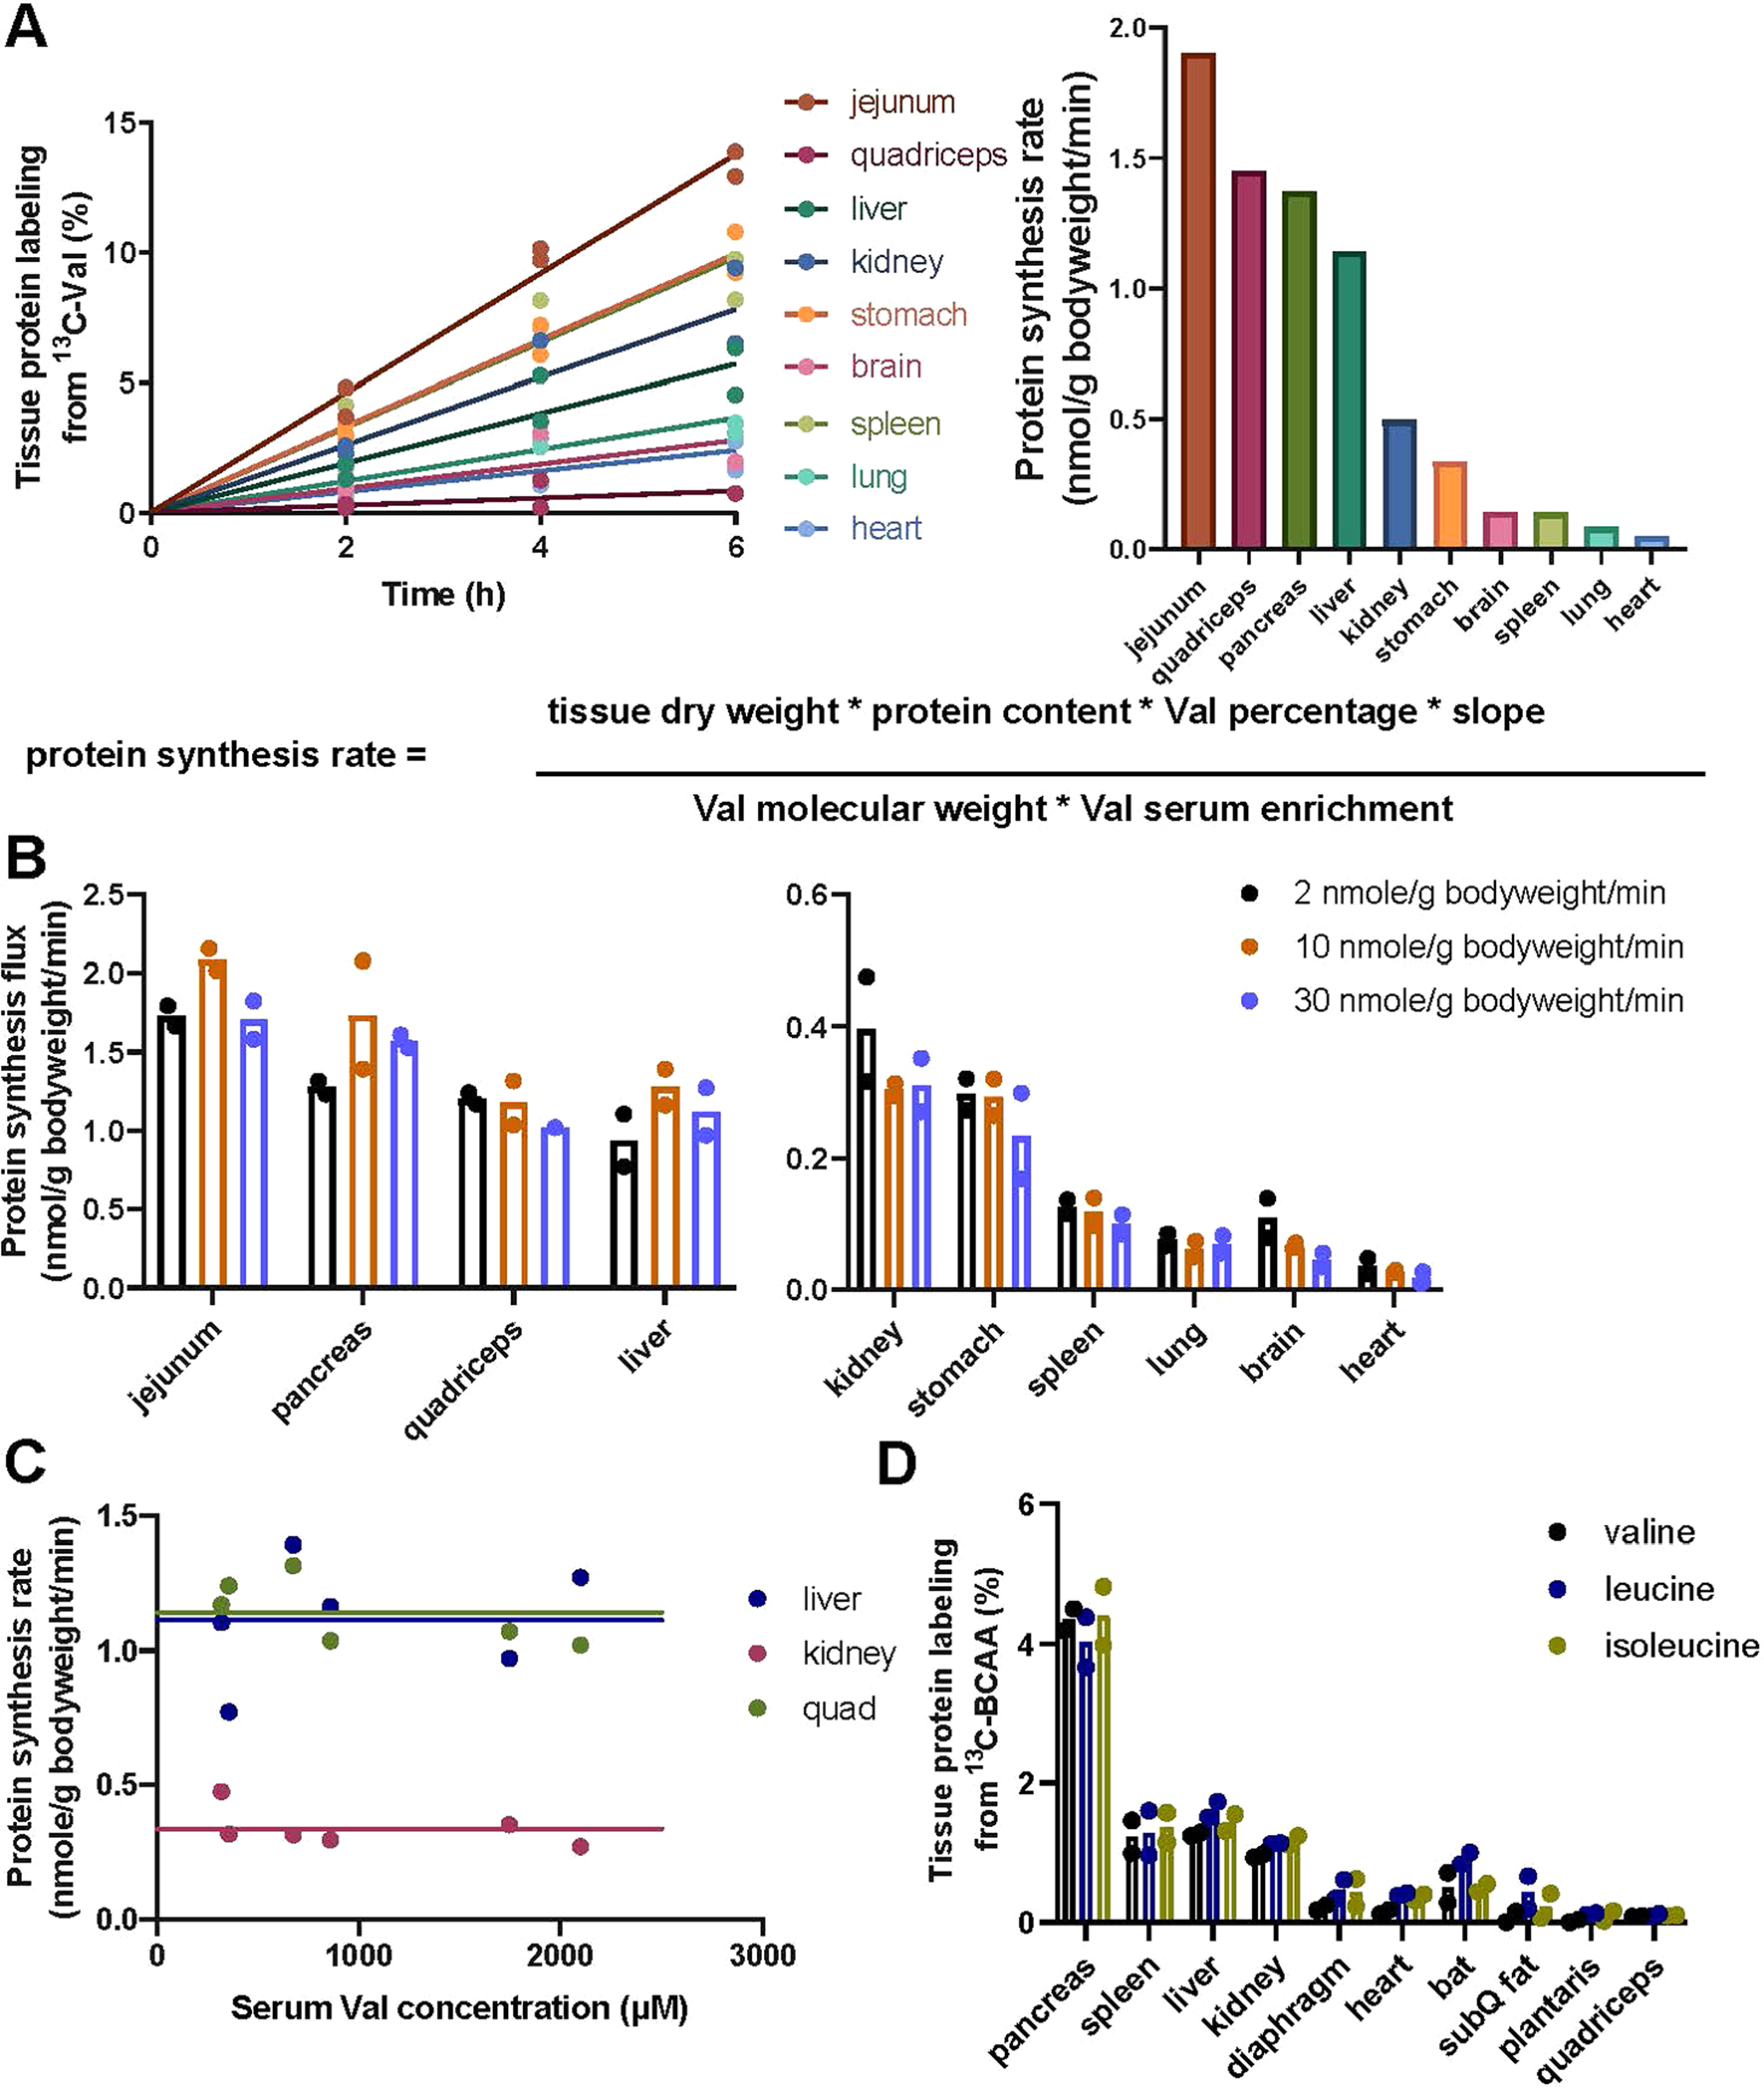
(a) Calculation of protein synthesis rate. Mice were infused with [U-13C]valine as described in Fig. 6a (fasted group). Tissues were harvested and valine labeling fraction in hydrolyzed tissue proteins were plotted against time (left). Protein synthesis rate was then calculated based on the slopes (right) using the equation shown (below). Lines are linear fitting with mean values of each tissue. n = 2 mice per time point for each condition. (b) Tissue protein synthesis rates do not increase with infusion rate. n = 2 mice per time point for each condition. (c) Tissue protein synthesis rate does not change in response to perturbative valine infusion. Line is mean of the data as the slope is not significant. (d) Tissue protein labeling was consistent from different BCAAs. Mice were infused with [U-13C]valine, [U-13C]leucine, or [U-13C]isoleucine as in (a). n = 2 mice per time point for each condition.
Extended Data Fig. 7 |. Protein degradation rate does not change in response to perturbative valine infusion.
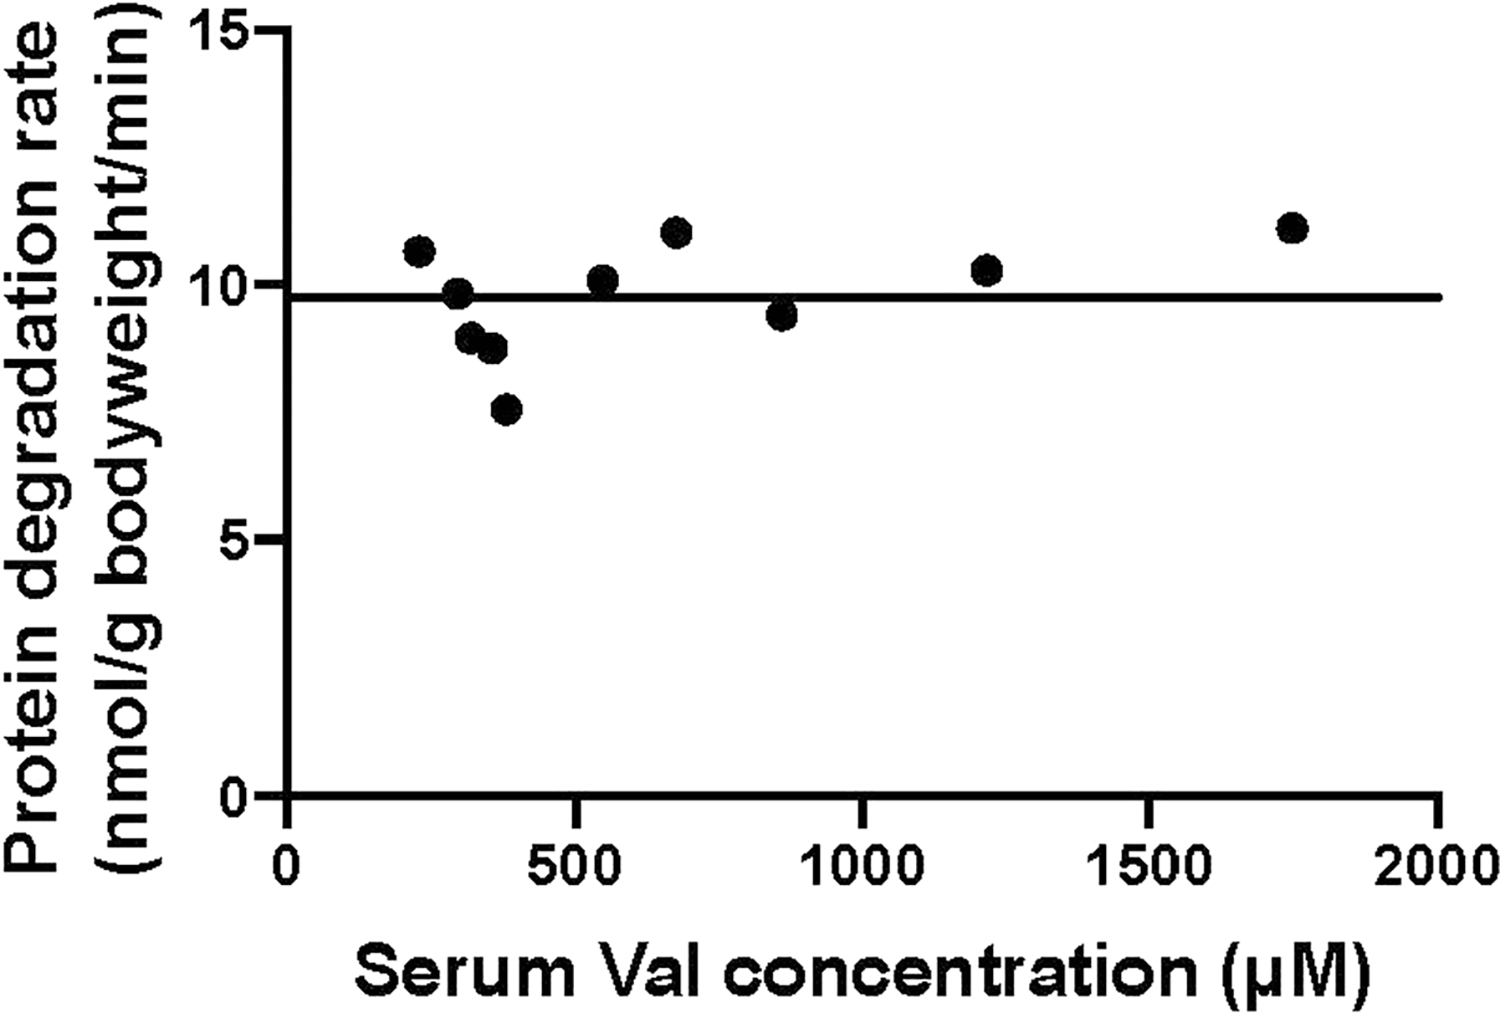
Data were from the experiments in Fig. 2 (valine panel). Line is mean of the data as the slope is not significant.
Extended Data Fig. 8 |. Raw data supporting the determination of protein synthesis rates after feeding.
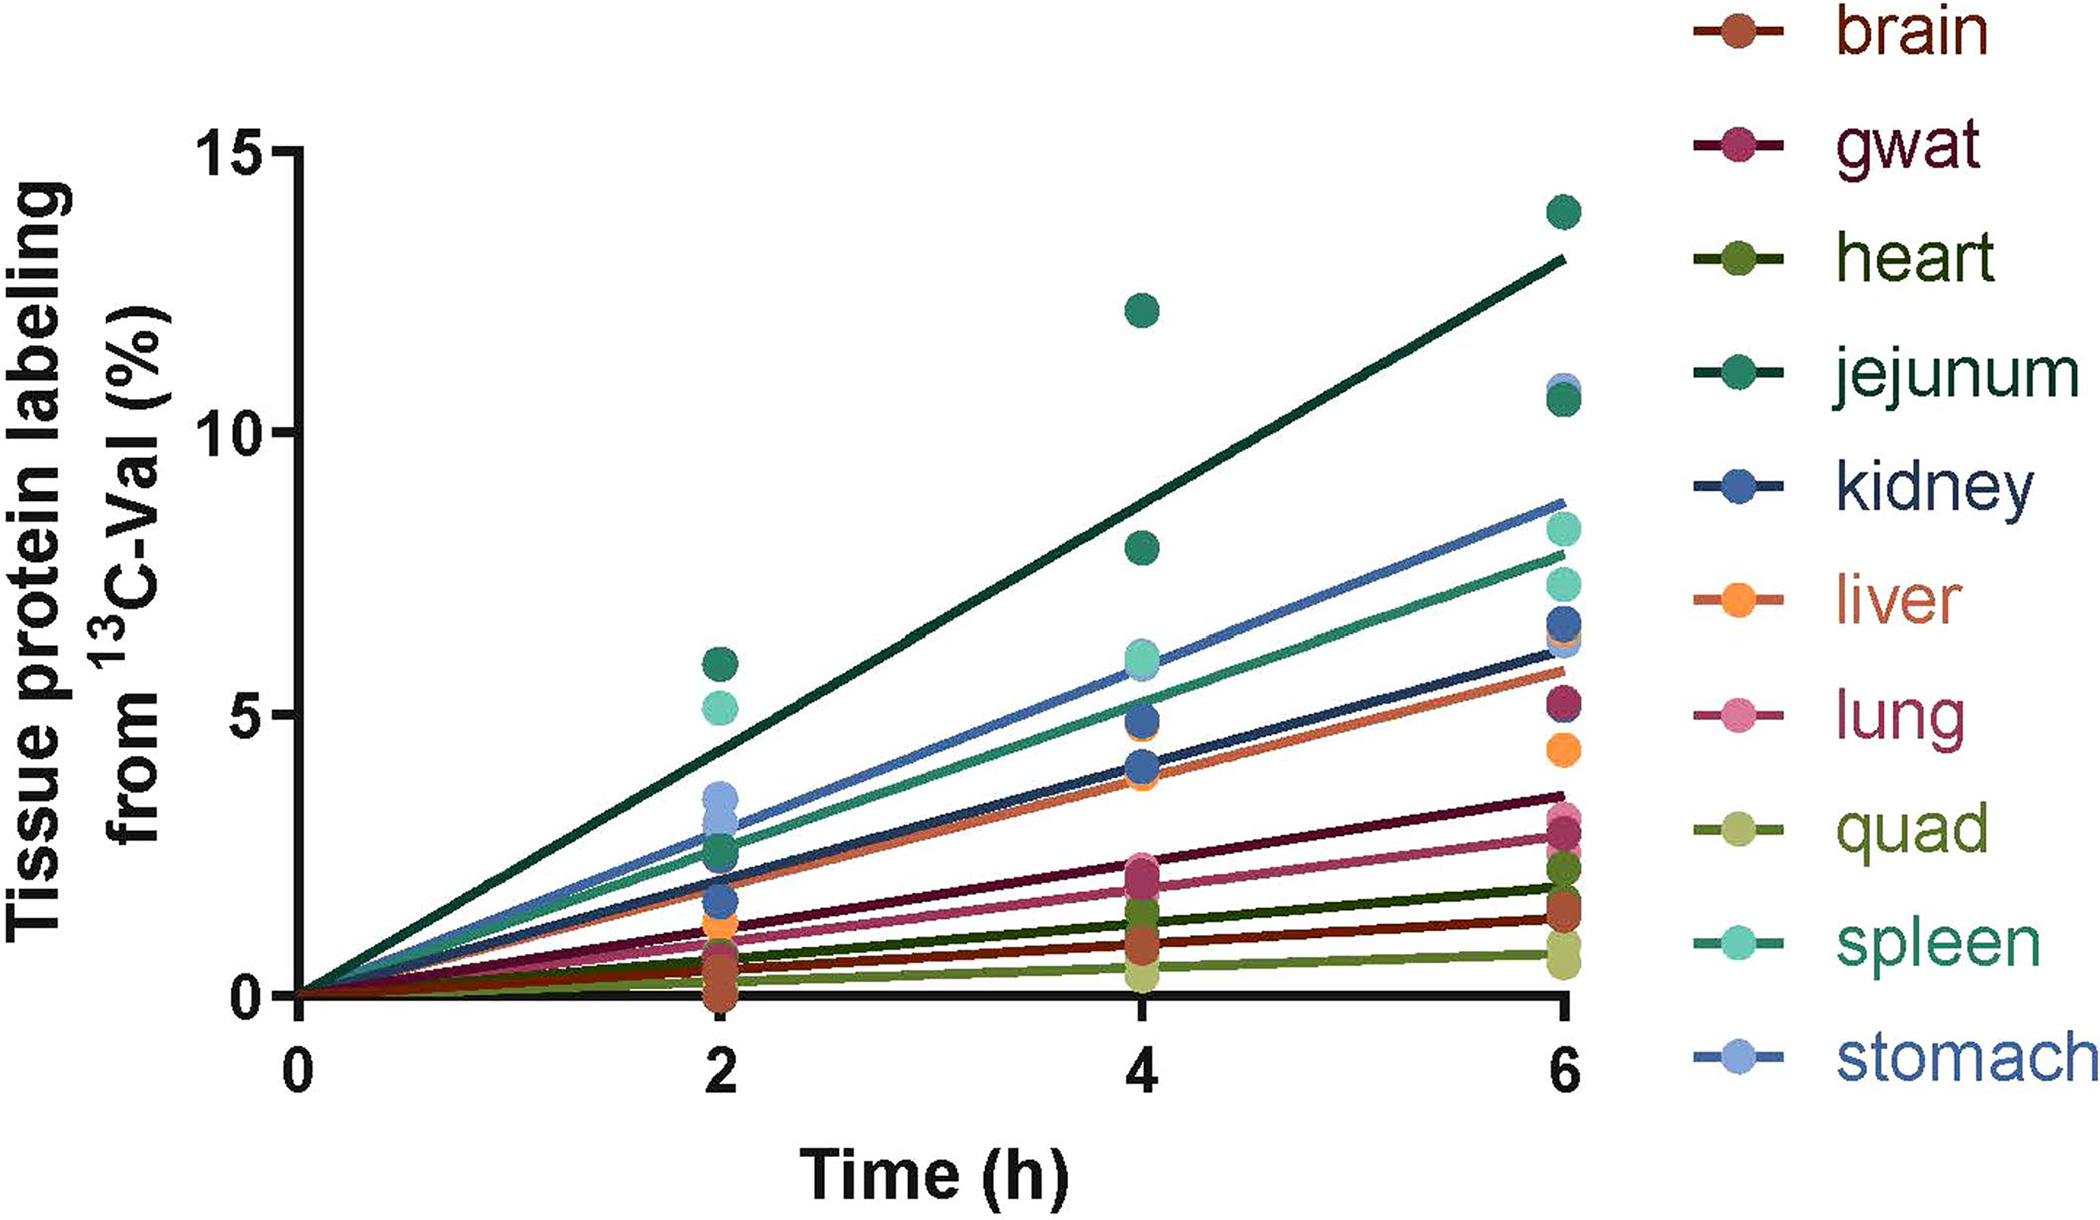
Mice were infused with [U-13C]valine at the same condition as described in Fig. 6a (refed group). Lines are linear fitting with mean values of each tissue. n = 2 mice per timepoint.
Extended Data Fig. 9 |. Over 2 weeks, dietary protein fraction has little effect on body weight or food intake.
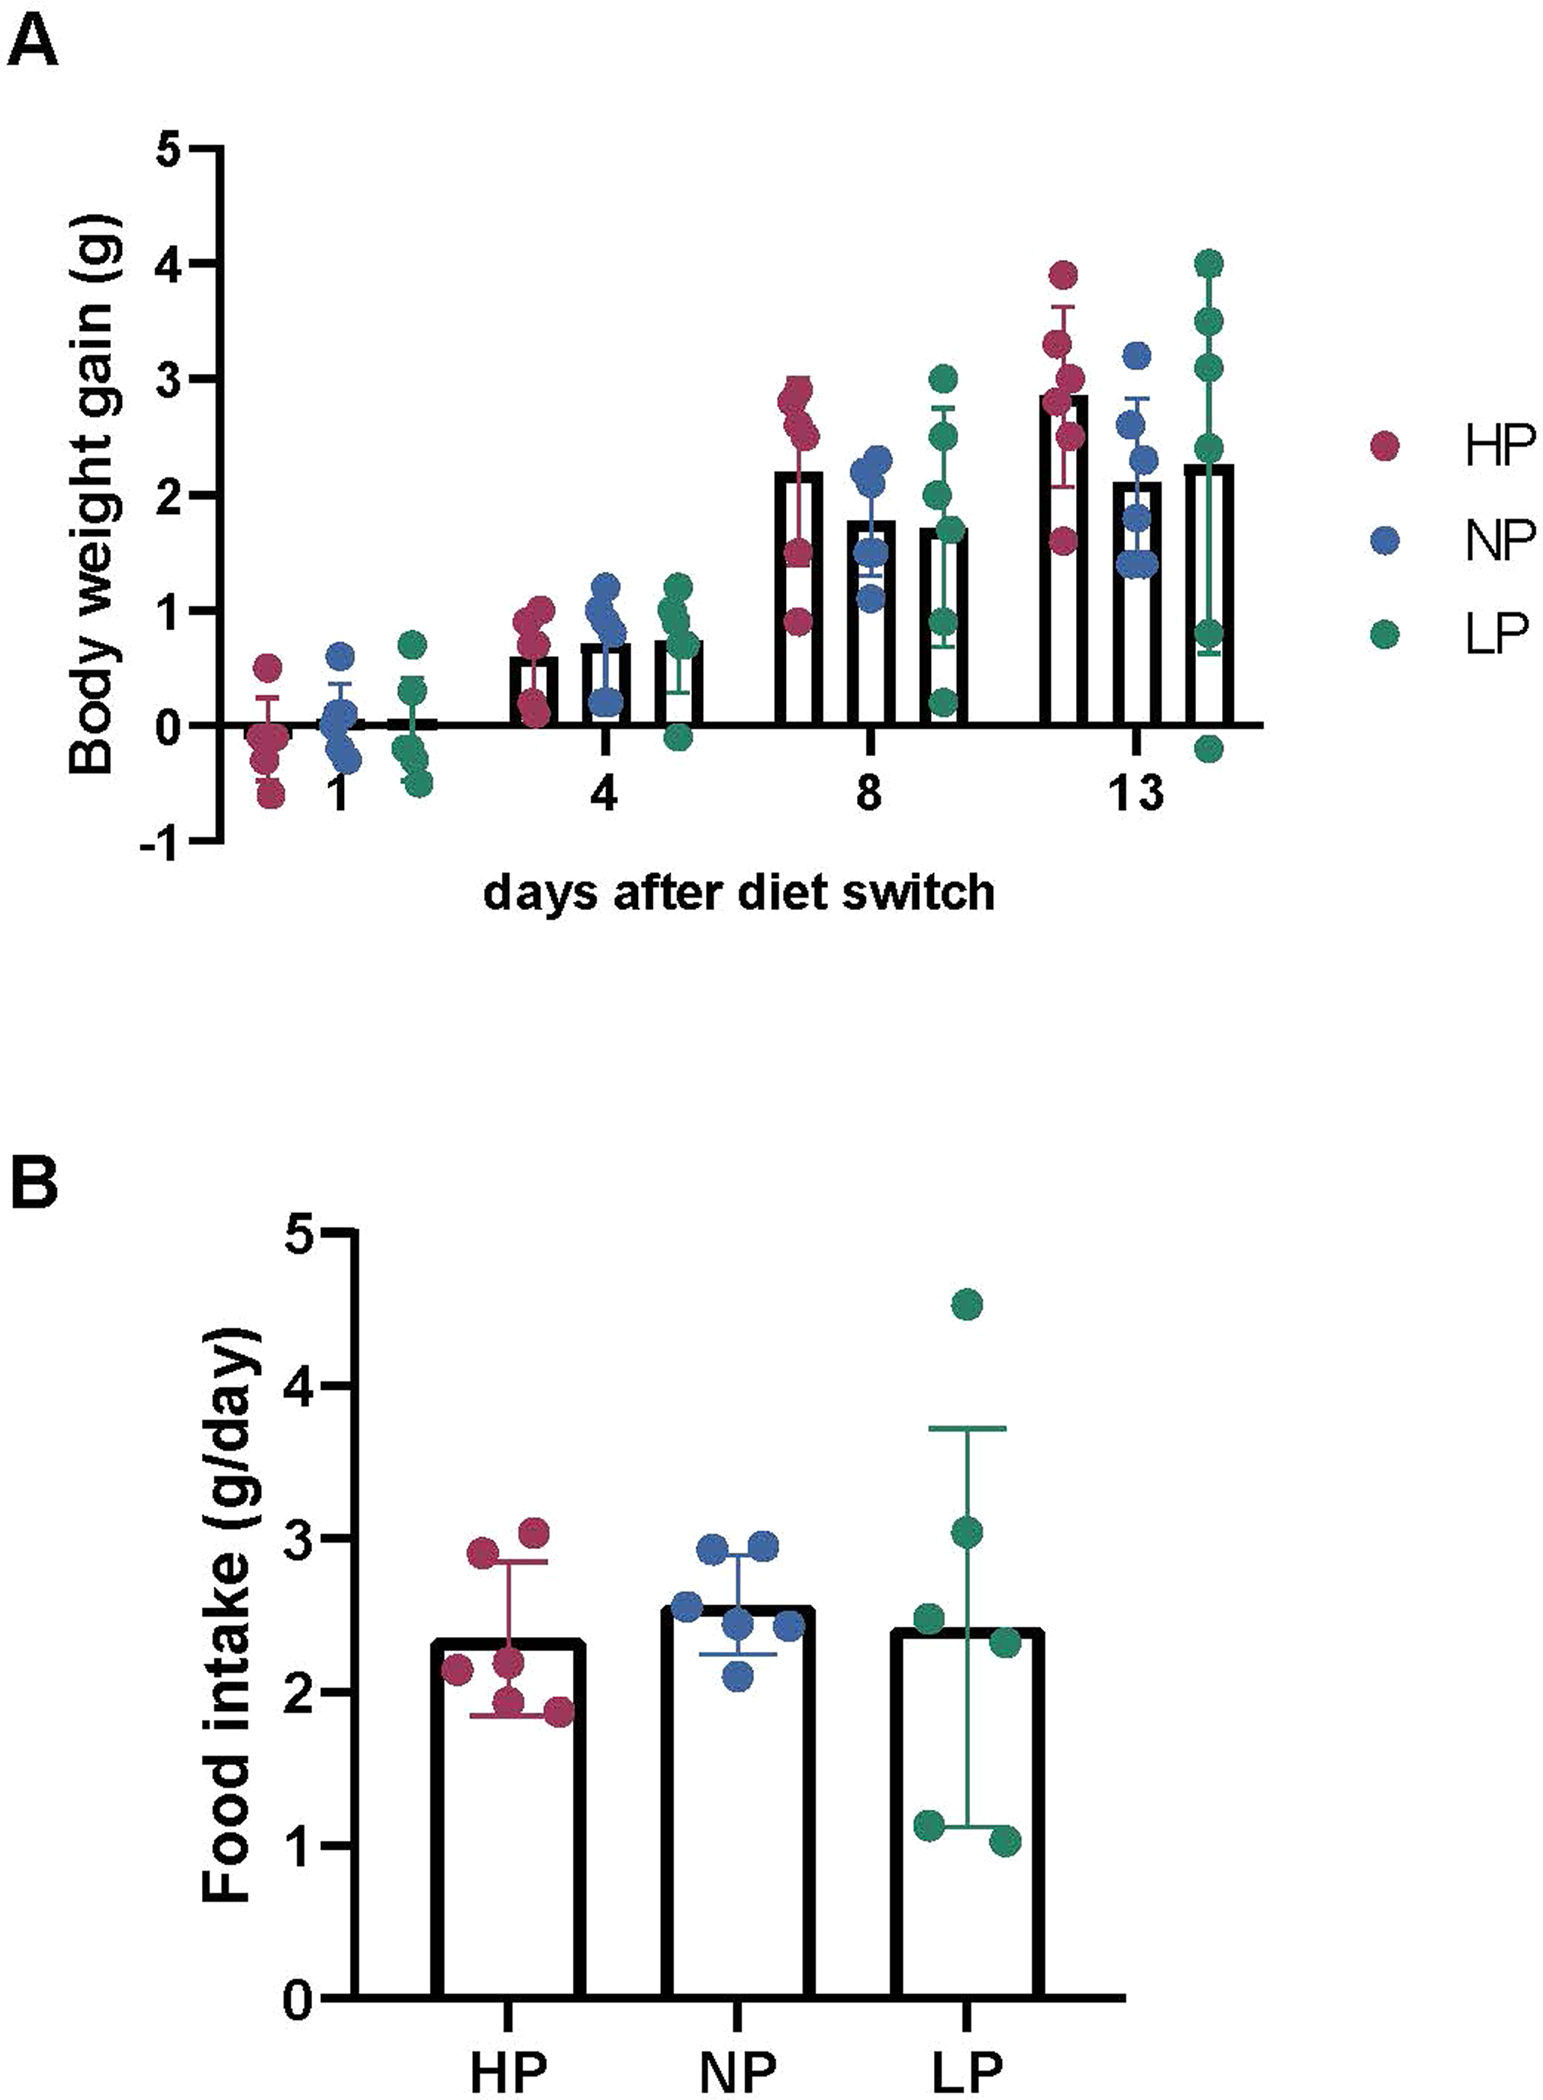
Mice were fed high- (HP), normal- (NP), and low-protein (LP) diets ad lib for 2 weeks. (a) Body weight gain. (b) Food intake. Mean ± SD, n = 6 mice.
Extended Data Fig. 10 |. TCA oxidation mediates mass action-driven valine consumption under high-, medium-, and low-protein diet.
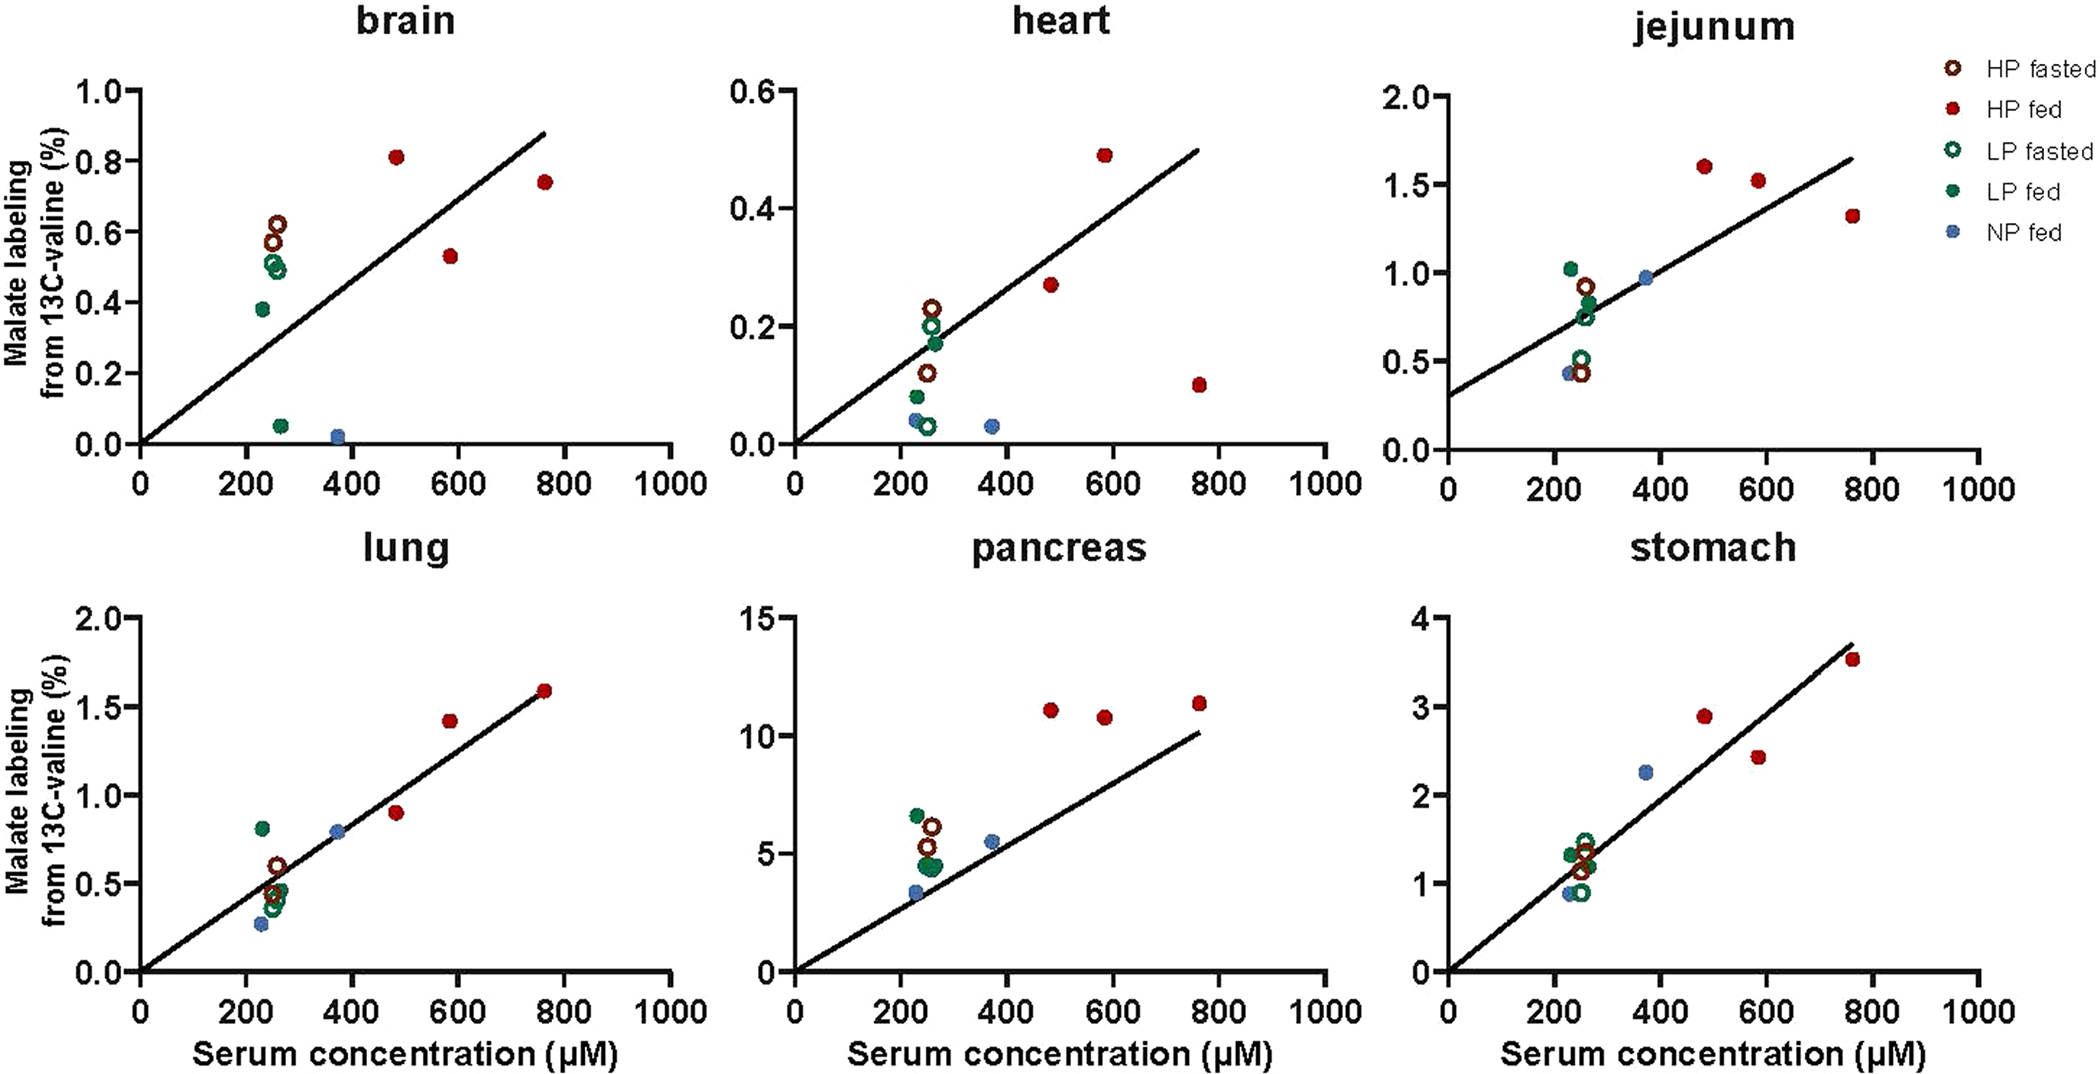
Tissue malate labeling relative to serum valine labeling from non-perturbative infusion of [U-13C]valine, as in Fig. 7c. Lines are linear fits to the data with intercept set to zero.
Supplementary Material
Acknowledgements
S.H. was supported by a National Institutes of Health (NIH) grant (no. 4R00DK117066). T.G.A. was supported by NIH grant no. DK109714 and a U.S. Department of Agriculture National Institute of Food and Agriculture grant no. NC1184-NJ14240. C.J. was supported by NIH grant no. 1R01AA02912. This work was supported by the NIH Pioneer (no. 1DP1DK113643) and Paul G. Allen Family Foundation grants (no. 0034665) and Ludwig Cancer Research.
Footnotes
Competing interests
J.D.R. is a cofounder and stockholder in Toran and Serien Therapeutics and advisor to and stockholder in Agios Pharmaceuticals, Kadmon, Bantam Pharmaceutical, Colorado Research Partners, Rafael Pharmaceuticals, Barer Institute and L.E.A.F. Pharmaceuticals. The other authors declare no competing interests.
Extended data is available for this paper at https://doi.org/10.1038/s42255-021-00517-1.
Supplementary information The online version contains supplementary material available at https://doi.org/10.1038/s42255-021-00517-1.
Nature Metabolism thanks Adam Rose and the other, anonymous, reviewers for their contribution to the peer review of this work. Alfredo Gimenez-Cassina and George Caputa were the primary handling editors.
Reprints and permissions information is available at www.nature.com/reprints.
References
- 1.Smith DA & Dalvie D Why do metabolites circulate? Xenobiotica 42, 107–126 (2012). [DOI] [PubMed] [Google Scholar]
- 2.Green CL & Lamming DW Regulation of metabolic health by essential dietary amino acids. Mech. Ageing Dev. 177, 186–200 (2019). [DOI] [PMC free article] [PubMed] [Google Scholar]
- 3.Balkau B et al. High blood glucose concentration is a risk factor for mortality in middle-aged nondiabetic men: 20-year follow-up in the Whitehall Study, the Paris Prospective Study, and the Helsinki Policemen Study. Diabetes Care 21, 360–367 (1998). [DOI] [PubMed] [Google Scholar]
- 4.Bjørnholt JV et al. Fasting blood glucose: an underestimated risk factor for cardiovascular death. Results from a 22-year follow-up of healthy nondiabetic men. Diabetes Care 22, 45–49 (1999). [DOI] [PubMed] [Google Scholar]
- 5.Newgard CB et al. A branched-chain amino acid-related metabolic signature that differentiates obese and lean humans and contributes to insulin resistance. Cell Metab. 9, 311–326 (2009). [DOI] [PMC free article] [PubMed] [Google Scholar]
- 6.Jervis GA Studies on phenylpyruvic oligophrenia; the position of the metabolic error. J. Biol. Chem. 169, 651–656 (1947). [PubMed] [Google Scholar]
- 7.Gietzen DW & Rogers QR Nutritional homeostasis and indispensable amino acid sensing: a new solution to an old puzzle. Trends Neurosci. 29, 91–99 (2006). [DOI] [PubMed] [Google Scholar]
- 8.Bröer S & Bröer A Amino acid homeostasis and signalling in mammalian cells and organisms. Biochem. J. 474, 1935–1963 (2017). [DOI] [PMC free article] [PubMed] [Google Scholar]
- 9.McAninch EA & Bianco AC Thyroid hormone signaling in energy homeostasis and energy metabolism. Ann. N. Y. Acad. Sci. 1311, 77–87 (2014). [DOI] [PMC free article] [PubMed] [Google Scholar]
- 10.Mullur R, Liu Y-Y & Brent GA Thyroid hormone regulation of metabolism. Physiol. Rev. 94, 355–382 (2014). [DOI] [PMC free article] [PubMed] [Google Scholar]
- 11.Kalra S & Gupta Y The insulin:glucagon ratio and the choice of glucose-lowering drugs. Diabetes Ther. 7, 1–9 (2016). [DOI] [PMC free article] [PubMed] [Google Scholar]
- 12.Aronoff SL, Berkowitz K, Shreiner B & Want L Glucose metabolism and regulation: beyond insulin and glucagon. Diabetes Spectr. 17, 183–190 (2004). [Google Scholar]
- 13.Breckenridge SM, Cooperberg BA, Arbelaez AM, Patterson BW & Cryer PE Glucagon, in concert with insulin, supports the postabsorptive plasma glucose concentration in humans. Diabetes 56, 2442–2448 (2007). [DOI] [PubMed] [Google Scholar]
- 14.Hayashi Y & Yusuke S Regulation of amino acid metabolism and α-cell proliferation by glucagon. J. Diabetes Investig. 9, 464–472 (2018). [DOI] [PMC free article] [PubMed] [Google Scholar]
- 15.Galsgaard KD et al. Glucose and amino acid metabolism in mice depend mutually on glucagon and insulin receptor signaling. Am. J. Physiol. Endocrinol. Metab. 316, E660–E673 (2019). [DOI] [PubMed] [Google Scholar]
- 16.Joshi MA et al. Impaired growth and neurological abnormalities in branched-chain α-keto acid dehydrogenase kinase-deficient mice. Biochem. J. 400, 153–162 (2006). [DOI] [PMC free article] [PubMed] [Google Scholar]
- 17.Neinast MD et al. Quantitative analysis of the whole-body metabolic fate of branched-chain amino acids. Cell Metab. 29, 417–429.e4 (2019). [DOI] [PMC free article] [PubMed] [Google Scholar]
- 18.Hui S et al. Glucose feeds the TCA cycle via circulating lactate. Nature 551, 115–118 (2017). [DOI] [PMC free article] [PubMed] [Google Scholar]
- 19.Donner CC, Fraze E, Chen YD & Reaven GM Quantitation of insulin-stimulated glucose disposal in patients with non-insulin-dependent diabetes mellitus. Diabetes 34, 831–835 (1985). [DOI] [PubMed] [Google Scholar]
- 20.Chen YD, Jeng CY, Hollenbeck CB, Wu MS & Reaven GM Relationship between plasma glucose and insulin concentration, glucose production, and glucose disposal in normal subjects and patients with non-insulin-dependent diabetes. J. Clin. Invest. 82, 21–25 (1988). [DOI] [PMC free article] [PubMed] [Google Scholar]
- 21.Begg DP & Woods SC The endocrinology of food intake. Nat. Rev. Endocrinol. 9, 584 (2013). [DOI] [PubMed] [Google Scholar]
- 22.Alberti KG, Johnston DG, Gill A, Barnes AJ & Orskov H Hormonal regulation of ketone-body metabolism in man. Biochem. Soc. Symp. 43, 163–182 (1978). [PubMed] [Google Scholar]
- 23.Brosnan JT & Brosnan ME Branched-chain amino acids: enzyme and substrate regulation. J. Nutr. 136, 207S–211S (2006). [DOI] [PubMed] [Google Scholar]
- 24.Tso S-C et al. Benzothiophene carboxylate derivatives as novel allosteric inhibitors of branched-chain α-ketoacid dehydrogenase kinase. J. Biol. Chem. 289, 20583–20593 (2014). [DOI] [PMC free article] [PubMed] [Google Scholar]
- 25.Brown RP, Delp MD, Lindstedt SL, Rhomberg LR & Beliles RP Physiological parameter values for physiologically based pharmacokinetic models. Toxicol. Ind. Health 13, 407–484 (1997). [DOI] [PubMed] [Google Scholar]
- 26.Chaix A, Lin T, Le HD, Chang MW & Panda S Time-restricted feeding prevents obesity and metabolic syndrome in mice lacking a circadian clock. Cell Metab. 29, 303–319.e4 (2019). [DOI] [PMC free article] [PubMed] [Google Scholar]
- 27.Adamovich Y, Ladeuix B, Golik M, Koeners MP & Asher G Rhythmic oxygen levels reset circadian clocks through HIF1α. Cell Metab. 25, 93–101 (2017). [DOI] [PubMed] [Google Scholar]
- 28.Chevalier S, Gougeon R, Kreisman SH, Cassis C & Morais JA The hyperinsulinemic amino acid clamp increases whole-body protein synthesis in young subjects. Metabolism 53, 388–396 (2004). [DOI] [PubMed] [Google Scholar]
- 29.Davis TA et al. Stimulation of protein synthesis by both insulin and amino acids is unique to skeletal muscle in neonatal pigs. Am. J. Physiol. Endocrinol. Metab. 282, E880–E890 (2002). [DOI] [PubMed] [Google Scholar]
- 30.Caso G et al. The increase in human muscle protein synthesis induced by food intake is similar when assessed with the constant infusion and flooding techniques. J. Nutr. 136, 1504–1510 (2006). [DOI] [PubMed] [Google Scholar]
- 31.Sinturel F et al. Diurnal oscillations in liver mass and cell size accompany ribosome assembly cycles. Cell 169, 651–663.e14 (2017). [DOI] [PMC free article] [PubMed] [Google Scholar]
- 32.Hackett SR et al. Systems-level analysis of mechanisms regulating yeast metabolic flux. Science 354, aaf2786 (2016). [DOI] [PMC free article] [PubMed] [Google Scholar]
- 33.Cornish-Bowden A & Cárdenas ML Glucokinase: a monomeric enzyme with positive cooperativity. Front. Diabetes 16, 125–134 (2004). [Google Scholar]
- 34.Lowry OH, Carter J, Ward JB & Glaser L The effect of carbon and nitrogen sources on the level of metabolic intermediates in Escherichia coli. J. Biol. Chem. 246, 6511–6521 (1971). [PubMed] [Google Scholar]
- 35.Garland PB, Randle PJ & Newsholme EA Citrate as an intermediary in the inhibition of phosphofructokinase in rat heart muscle by fatty acids, ketone bodies, pyruvate, diabetes and starvation. Nature 200, 169–170 (1963). [DOI] [PubMed] [Google Scholar]
- 36.Balestri F, Barsotti C, Lutzemberger L, Camici M & Ipata PL Key role of uridine kinase and uridine phosphorylase in the homeostatic regulation of purine and pyrimidine salvage in brain. Neurochem. Int. 51, 517–523 (2007). [DOI] [PubMed] [Google Scholar]
- 37.Egger G, Liang G, Aparicio A & Jones PA Epigenetics in human disease and prospects for epigenetic therapy. Nature 429, 457–463 (2004). [DOI] [PubMed] [Google Scholar]
- 38.Kerscher O, Felberbaum R & Hochstrasser M Modification of proteins by ubiquitin and ubiquitin-like proteins. Annu. Rev. Cell Dev. Biol. 22, 159–180 (2006). [DOI] [PubMed] [Google Scholar]
- 39.Dohmen RJ SUMO protein modification. Biochim. Biophys. Acta 1695, 113–131 (2004). [DOI] [PubMed] [Google Scholar]
- 40.Scott M, Gunderson CW, Mateescu EM, Zhang Z & Hwa T Interdependence of cell growth and gene expression: origins and consequences. Science 330, 1099–1102 (2010). [DOI] [PubMed] [Google Scholar]
- 41.Schaechter M, Maaløe O & Kjeldgaard NO Dependency on medium and temperature of cell size and chemical composition during balanced grown of Salmonella typhimurium. Microbiology 19, 592–606 (1958). [DOI] [PubMed] [Google Scholar]
- 42.Cayley S, Lewis BA, Guttman HJ & Record MT Jr Characterization of the cytoplasm of Escherichia coli K-12 as a function of external osmolarity: implications for protein–DNA interactions in vivo. J. Mol. Biol. 222, 281–300 (1991). [DOI] [PubMed] [Google Scholar]
- 43.McGarry JD, Mannaerts GP & Foster DW A possible role for malonyl-CoA in the regulation of hepatic fatty acid oxidation and ketogenesis. J. Clin. Invest. 60, 265–270 (1977). [DOI] [PMC free article] [PubMed] [Google Scholar]
- 44.Rubio V, Britton HG & Grisolia S Mitochondrial carbamoyl phosphate synthetase activity in the absence of N-acetyl-L-glutamate. Mechanism of activation by this cofactor. Eur. J. Biochem. 134, 337–343 (1983). [DOI] [PubMed] [Google Scholar]
- 45.Bouskila M et al. Allosteric regulation of glycogen synthase controls glycogen synthesis in muscle. Cell Metab. 12, 456–466 (2010). [DOI] [PubMed] [Google Scholar]
- 46.Lu W et al. LC–MS and GC–MS based metabolomics platform for cancer research. Cancer Metab. 2, P41 (2014). [Google Scholar]
- 47.Su X, Lu W & Rabinowitz JD Metabolite spectral accuracy on orbitraps. Anal. Chem. 89, 5940–5948 (2017). [DOI] [PMC free article] [PubMed] [Google Scholar]
Associated Data
This section collects any data citations, data availability statements, or supplementary materials included in this article.
Supplementary Materials
Data Availability Statement
All data and materials will be provided on reasonable request to the lead corresponding author (joshr@princeton.edu). Source data are provided with this paper.


