Abstract
With increasingly effective treatments, early death (ED) has become the predominant reason for therapeutic failure in patients with acute promyelocytic leukemia (APL). To better prevent ED, patients with high-risk of ED must be identified. Our aim was to develop a score that predicts the risk of ED in a real-life setting. We used APL patients in the population-based Swedish AML Registry (n=301) and a Portuguese hospital-based registry (n=129) as training and validation cohorts, respectively. The cohorts were comparable with respect to age (median, 54 and 53 years) and ED rate (19.6% and 18.6%). The score was developed by logistic regression analyses, risk-per-quantile assessment and scoring based on ridge regression coefficients from multivariable penalized logistic regression analysis. White blood cell count, platelet count and age were selected by this approach as the most significant variables for predicting ED. The score identified low-, high- and very high-risk patients with ED risks of 4.8%, 20.2% and 50.9% respectively in the training cohort and with 6.7%, 25.0% and 36.0% as corresponding values for the validation cohort. The score identified an increased risk of ED already at sub-normal and normal white blood cell counts and, consequently, it was better at predicting ED risk than the Sanz score (AUROC 0.77 vs. 0.64). In summary, we here present an externally validated and population-based risk score to predict ED risk in a real-world setting, identifying patients with the most urgent need of aggressive ED prevention. The results also suggest that increased vigilance for ED is already necessary at sub-normal/normal white blood cell counts.
Introduction
Acute promyelocytic leukemia (APL) accounts for approximately 5-8% of all cases of acute myeloid leukemia (AML) and is a distinct AML subtype characterized by the balanced reciprocal translocation t(15;17) that results in the fusion oncoprotein PML-RARA (promyelocytic leukemia gene-retinoic acid receptor alpha). APL patients have cure rates of approximately 90% with current treatment regimens.1
Nonetheless, patients with APL are at a high risk of early death (ED) due to a coagulopathy that is characterized especially by a hyperfibrinolytic state.2 This leads to a risk of fatal hemorrhages and thromboses with a reported ED rate within 30 days after diagnosis of up to 30%.3 While clinical trials usually report ED rates of 5-8%,4-8 higher ED rates are found in population-based studies9-13 that do not exclude patients due to age, comorbidities, poor performance status or ongoing hemorrhages and thromboses.1 Due to the effectiveness of the current treatment, with almost no primary treatment resistance and very few relapses, ED has become the main obstacle to long-term survival in APL.13
Approximately two-thirds of all ED occur within 1 week after diagnosis and the median time to onset of bleeding is 5 days.14,15 An early clinical suspicion of APL is necessary for prompt and adequate surveillance as well as prompt pre-emptive measures, even before the diagnosis is established, to decrease the risk of ED. Although risk factors for ED are well known, clinically useful and validated tools for predicting ED are lacking. Such tools could help clinicians to identify APL patients in need of more intensive surveillance and more aggressive ED-preventing interventions. Currently, the Sanz risk model is often used to predict ED although the model was developed to predict relapse after treatment with all-trans retinoic acid (ATRA) and idarubicin.16 Other scores have been proposed17,18 but an externally validated system based on population-based data is still needed.
Importantly, a clinically useful score system should be based on studies using unselected population-based APL cohorts that are not restricted to patients fitting inclusion criteria in clinical trials. In this study, we aimed to develop a prediction model for ED in newly diagnosed APL patients. We used real-world data and an external validation cohort to propose a clinically useful risk score based on age, white blood cell (WBC) count and platelet count at the time of diagnosis.
Methods
Cohorts
All adult patients diagnosed with APL in Sweden from January 1997 to December 2020 (n=301) were included in a training cohort for development of the prediction model. This model was validated against all APL patients (n=129) diagnosed and treated at the University Hospital Center of São João, Porto, Portugal, between January 2005 and April 2019.
Clinical data for the training cohort were retrieved from the Swedish AML Registry (coverage >98%19) with additional data collected from the patients’ records. Data for the validation cohort were retrieved from the patients’ records. The diagnosis of APL was confirmed by cytogenetics, fluorescence in situ hybridization and/or reverse transcriptase polymerase chain reaction analysis for the PML-RARA fusion.
Induction therapies
Patients in the test cohort <70 years received oral ATRA 45 mg/m2 daily until complete remission plus idarubicin 12 mg/m2 on days 1, 3 and 5 plus cytarabine 200 mg/m2 days 1-7 until October 2016. Patients >70 years were given ATRA 45 mg/m2 daily until complete remission plus idarubicin 12 mg/m2 on days 2, 4 and 6. From October 2016, low- and intermediate-risk patients received oral ATRA 45 mg/m2 daily plus arsenic trioxide (ATO) at a dose of 0.3 mg/kg intravenously, given according to the Medical Research Council protocol.8 From 2019, also high-risk patients were treated with ATO and ATRA at the same doses plus idarubicin at a dose of 6-12 mg/m2 (adjusted for age) on days 2, 4, 6 and 8.20
Patients in the validation cohort were given treatment according to the AIDA protocol21 with idarubicin 12 mg/m2 for 4 days plus oral ATRA 45 mg/m2 daily until complete remission until April 2018. From April 2018, low- and intermediate-risk patients were treated according to the PETHEMA LPA 2017 protocol with intravenous ATO at a dose of 0.15 mg/kg and oral ATRA 45 mg/m2 daily until complete remission whereas high-risk patients <70 years were still treated according to the AIDA protocol. Online Supplementary Figure S1 shows an overview of the induction therapies administered and the ED rate observed per group.
Statistical analyses and risk score development
ED was defined as death from any cause within 30 days of diagnosis. Descriptive statistical comparisons were performed using the Fisher exact test for categorical variables and Mann-Whitney U test for continuous variables. Online Supplementary Figure S2 shows how the prediction model was developed and more details on the statistics are presented in the Online Supplementary Material. In short, univariate and multivariate logistic regression analyses were performed with regard to ED using clinical and laboratory variables. Clinically useful cut-offs were determined for the statistically significant variables and multivariable penalized logistic regression analysis was performed to obtain ridge regression coefficients per variable and per level. Points were assigned by dividing each ridge regression coefficient by the lowest coefficient followed by rounding to the nearest integer. The risk score was developed in line with the Transparent Reporting of a multivariable prediction model for Individual Prognosis Or Diagnosis (TRIPOD) statement.22 All statistical analyses were performed using the computing environment R version 4.0.223 with packages described in the Online Supplementary Methods. The regional ethics review board in Stockholm, Sweden, approved the study, which was performed in accordance with the Declaration of Helsinki.
Results
Patients’ characteristics
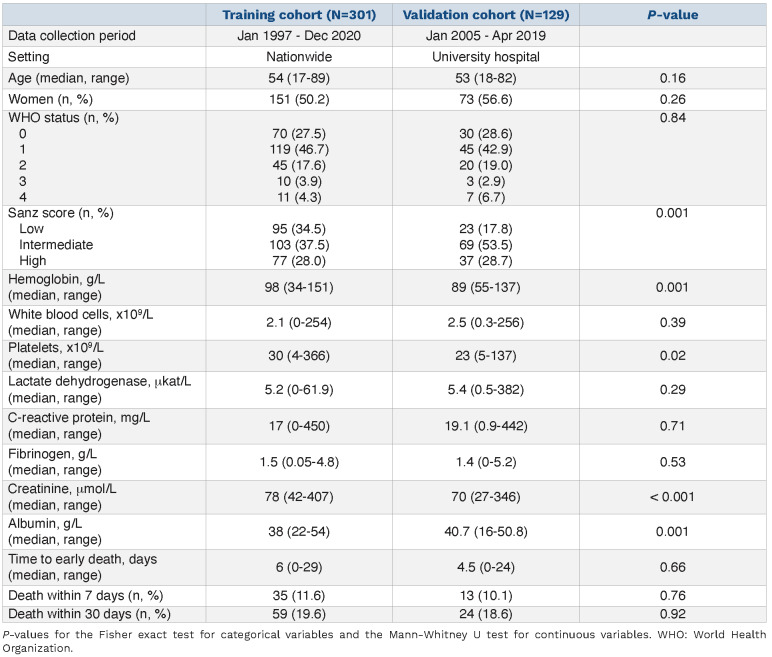
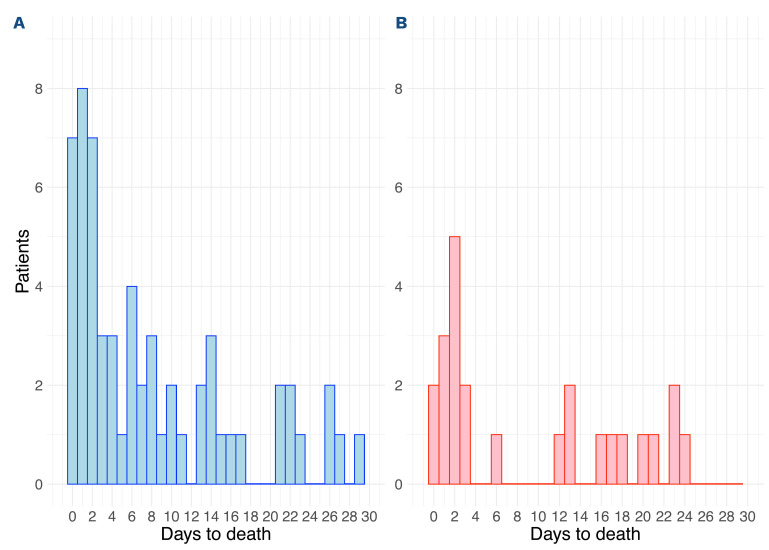
The clinical characteristics of the patients in the two cohorts are described in Table 1. The training cohort included 301 patients of whom 19.6% (n=59) died within 30 days (Figure 1A). The validation cohort included 129 patients of whom 18.6% (n=24) died within 30 days (P=0.92) (Figure 1B). Similarly, 11.6% (n=35) and 10.1% (n=13) died within 7 days of diagnosis, accounting for 59.3% and 54.2% of all ED in the training and validation cohorts, respectively (P=0.76).
The training and validation cohorts were similar with regard to age (median 54 vs. 53 years, P=0.16), gender distribution (50.2% vs. 56.6% women, P=0.26) and median time to ED (6.0 vs. 4.5 days, P=0.66). Approximately one third of the patients in both cohorts were classified as having a high Sanz risk score (28.0% vs. 28.7%). Hemoglobin concentration was lower at the time of diagnosis in the validation cohort (98 g/L vs. 89 g/L, P=0.001) while there were no significant differences between the cohorts with regard to World Health Organization (WHO) performance status, WBC count, platelet count, and lactate dehydrogenase (LDH), C-reactive protein (CRP) and fibrinogen levels.
Table 1.
Characteristics of the training and validation cohorts.
The cause of death was available for 46 and 23 ED patients in the training and validation cohorts, respectively. Of all deaths, 59.4% were due to bleeding or thrombosis with a median time to ED of only 2 days (range, 0-27 days). Other major causes of death were multiorgan failure (including ED due to differentiation syndrome) (18.8%) and infections/sepsis (17.4%). The median time to ED for non-hemorrhagic and non-thrombotic patients was 11 days (range, 1-24 days).
Comparison of early death versus non-early death patients in the training cohort
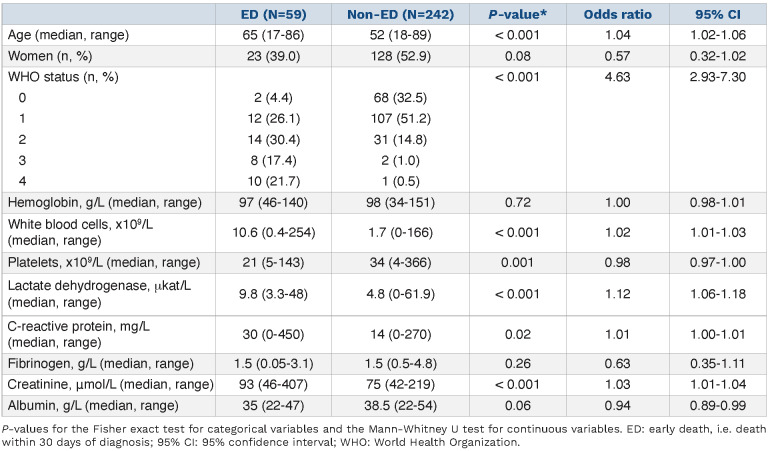
Table 2 shows a comparison between ED and non-ED patients in the training cohort. ED patients were older than non-ED patients (median age: 65 vs. 52 years, P<0.001). Furthermore, 54.2% of ED patients had a WHO performance status of 2-4 at the time of diagnosis compared to 14.0% of non-ED patients (P<0.001). ED patients also had higher levels of WBC, LDH, CRP and creatinine compared to non-ED patients. Platelet counts and albumin levels were significantly lower in ED patients. There were no differences in gender distribution or hemoglobin levels between ED and non-ED patients.
Multivariate logistic regression analyses were performed with regard to ED with the initial inclusion of age, hemoglobin, WBC and platelets in the training cohort. These variables were included as they are readily available at the time of APL diagnosis, had no need for conversion factors (e.g. creatinine and LDH) and to keep the events-per-variable >10 as recommended.22 LDH, which was associated with ED in univariate analysis, was excluded due to a strong correlation with WBC count with a Pearson correlation coefficient of 0.62 (95% confidence interval (95% CI): 0.55-0.69, P<0.001).
Figure 1.
Distribution of early deaths. (A, B) The number and deaths per day from time of diagnosis in the training cohort (A) and the validation cohort (B).
Values for hemoglobin, WBC and/or platelets had to be imputed for 26 (8.6%) patients who lacked these data. There were no differences between patients with complete and incomplete data, suggesting that data were missing at random (Online Supplementary Table S1). Hemoglobin showed no prognostic power and was removed after backward selection (Online Supplementary Table S2). The odds ratio (OR) for age was 1.50 (95% CI: 1.24-1.83) per 10-year increase, 1.10 (95% CI: 1.05-1.16) per 5x10⁹/L increment for WBC and 0.86 (95% CI: 0.77-0.95) per 10x109/L increment for platelets.
Increasing early death is seen with rising white blood cell count already at sub-normal and normal white cell counts
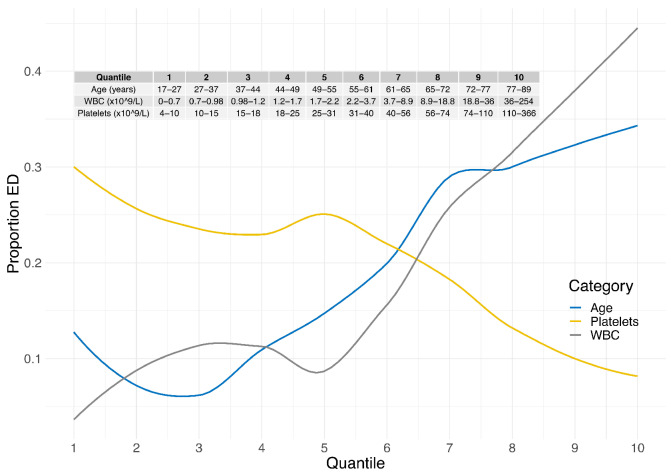
Based on the multivariate logistic regression analysis, we investigated the risk of ED per variable level to obtain clinically useful cut-offs for a predictive risk score. We divided the training cohort into ten quantiles by age, WBC or platelet levels. There was a continuous linear increase in the risk of ED with either age ≥50 years or WBC ≥2.2x10⁹/L (Figure 2). Importantly, the risk of ED increased already at sub-normal WBC levels and with a steep increase in ED risk within the normal WBC range. Contrariwise, the risk of ED steadily declined when platelet levels reached ≥30x109/L.
Based on the observed risks, we divided age, WBC and platelets into subgroups (Table 3). Age was subdivided into four categories: <50 years, 50-59 years, 60-69 years and ≥70 years; WBC into three categories: <3.0x10⁹/L, 3.0-5.0x10⁹/L and >5.0x10⁹/L; and platelets into two categories: ≥30x109/L and <30x109/L. Interestingly and as noted above, already sub-normal WBC levels had a clear association with ED, as shown in Online Supplementary Figure S3.
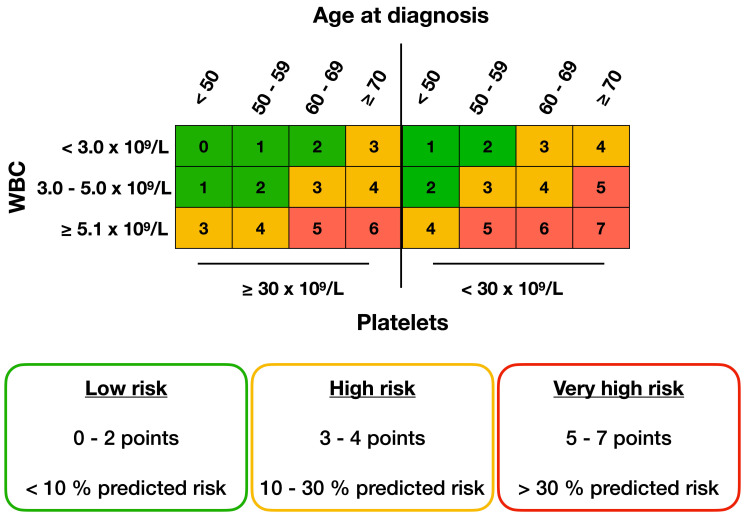
The points per risk group variables were obtained by performing multivariable penalized logistic regression analyses to obtain ridge regression coefficients. We assigned points to each category by dividing each regression coefficient by the lowest regression coefficient and rounding to the nearest integer (Table 3). A total score was assigned to each patient by adding the points for each variable. Zero, 1, 2 or 3 points were assigned based on age, 0, 1 or 3 points based on WBC count and 0 or 1 point based on platelet levels. The risk score sum for each patient ranged from 0 to 7 points with a higher predicted risk of ED as the score sum increased and with ED risks ranging from 2.3% in patients with 0 points to 72.0% in patients with 7 points (Online Supplementary Figure S4).
Table 2.
Characteristics and logistic regression analyses for early death or non-early death patients in the training cohort (n=301).
We further stratified the patients into three risk groups based on assigned points and the predicted risk of ED. Patients with 0-2 points had a predicted risk of ED between 0-10% and constituted a low-risk group whereas patients assigned 3-4 points were classified as a high-risk group with a 10-30% predicted risk of ED. Patients with 5-7 points had >30% predicted risk of ED and were defined as a very high-risk group (Figure 3). An online calculator for the score is provided at: apl-early-death.shinyapps.io/risk-score.
Risk score performance in the training and validation cohorts
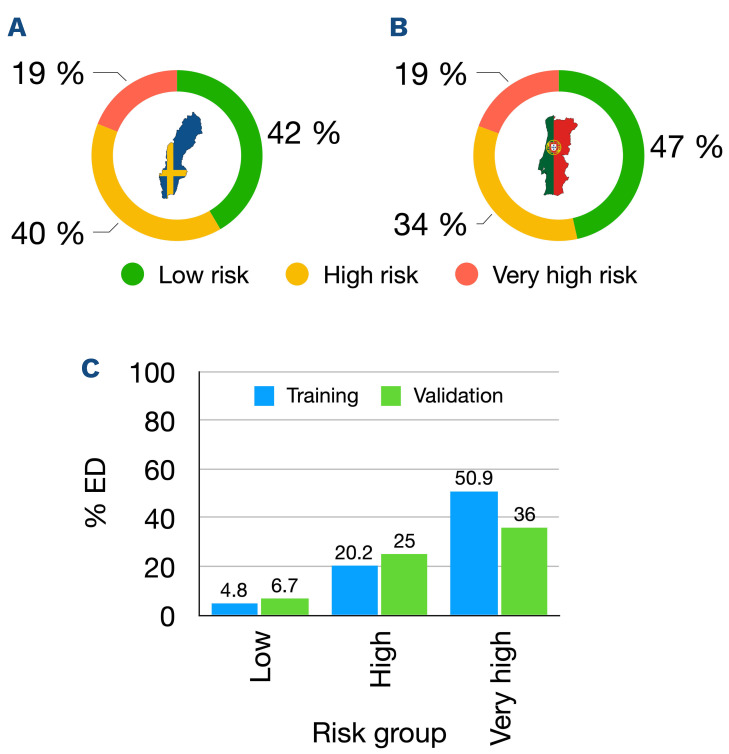
The risk score distribution in the training cohort is shown in Figure 4A and Online Supplementary Table S3. The 125 (41.5%) patients who were categorized as low-risk patients (0-2 score points) had an observed ED rate of 4.8%. The 119 (39.5%) patients who were classified as high-risk (3-4 score points) had an observed ED rate of 20.2% while the remaining 57 (18.9%) patients were categorized as very high-risk (5-7 score points) and had an observed ED rate of 50.9%. The median time to ED in the low-, high- and very high-risk groups was 14 days (range, 1-22 days), 4 days (range, 0-29 days) and 6 days (range, 0-26 days), respectively. The area under the receiver operating characteristic (AUROC) curve for ED in the training cohort was 0.81 (95% CI: 0.75-0.87) indicating good discriminative potential.
We applied the predictive score to all patients in the validation cohort with the same definitions of the score variables and of ED as for the training cohort. The risk score distribution in the external validation cohort is shown in Figure 4B and Online Supplementary Table S3. The proportions of patients per risk group were similar to those of the training cohort with 46.5%, 34.1% and 19.4% in the low-, high- and very high-risk groups, respectively. Importantly, the observed ED rates per risk group were in line with those of the training cohort with 6.7%, 25.0% and 36.0% of patients in the low-, high- and very high-risk groups, respectively (Figure 4C). The AUROC for ED was 0.70 (95% CI: 0.58-0.82) in the validation cohort.
ATRA/ATO induction therapy was introduced late during the study period and was used predominantly in Sanz low- and intermediate-risk patients. In total, 85 patients were treated with ATRA/ATO as induction therapy with only five ED (5.9%) (Online Supplementary Figure S1). These numbers were too low to further validate the score in ATRA/ATO-treated patients specifically.
Figure 2.
Risk of early death per variable and quantile. The training cohort (n=301) was divided into ten quantiles for age, platelets and white blood cell counts, with approximately 30 patients per quantile. Locally estimated scatterplot smoothing curves are shown for each variable with regard to rate of early death on the y-axis. ED: early death; WBC: white blood cell count.
Comparison to other predictive scores
While the Sanz risk score was originally developed as a tool for predicting APL relapse,16 the score has also shown prognostic value for ED.11,17,24 Seventy-seven (28.0%) patients in the training cohort and 37 (28.7%) in the validation cohort were classified as high Sanz risk (Table 1). The observed ED rates in the training cohort were 9.4%, 17.7% and 35.4% for low, intermediate and high Sanz risk groups, respectively. However, in the validation cohort, respective ED rates were 26.1%, 8.7% and 32.4% indicating less accurate ED prediction with a high ED rate in the low Sanz risk group.
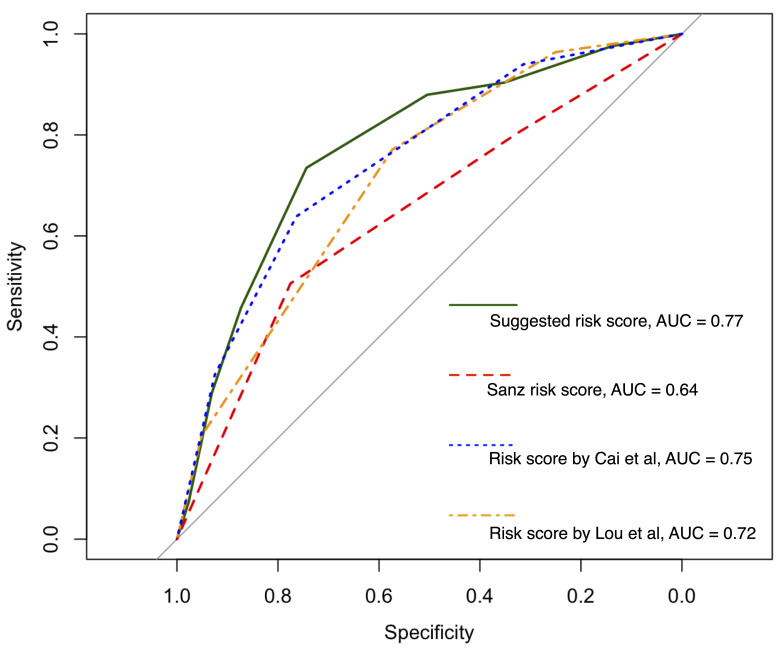
Merging patients in both our cohorts, the net reclassification improvement compared to the Sanz risk was 23.3% with regard to the proposed risk groups (Online Supplementary Table S4, Online Supplementary Figure S5). Sanz risk overestimated the risk of ED in non-ED patients of whom 41.5% could be accurately stratified to a lower risk with our score. The AUROC of our new risk score was 0.77 (95% CI: 0.72-0.83) compared to 0.64 (95% CI: 0.58-0.71) for the Sanz risk score (Figure 5) when merging our cohorts.
We also compared our risk score to two previously published risk scores designed to predict ED in APL but to our knowledge not yet externally validated. The suggested revised Sanz risk score by Lou and colleagues risk stratifies patients into four categories based on age, WBC and platelets.17 The risk score developed by Cai and colleagues assigns points based on age, WBC, platelets and LDH and was internally validated at the time of publication.18 In comparison to an AUROC of 0.77 (95% CI: 0.72-0.83) for our risk score, these models obtained lower AUROC of 0.75 (95% CI: 0.69-0.80) for the score by Cai et al. and 0.72 (95% CI: 0.66-0.77) for the score by Lou et al. (Figure 5).
Table 3.
Multivariable penalized logistic regression for early death in the training cohort.
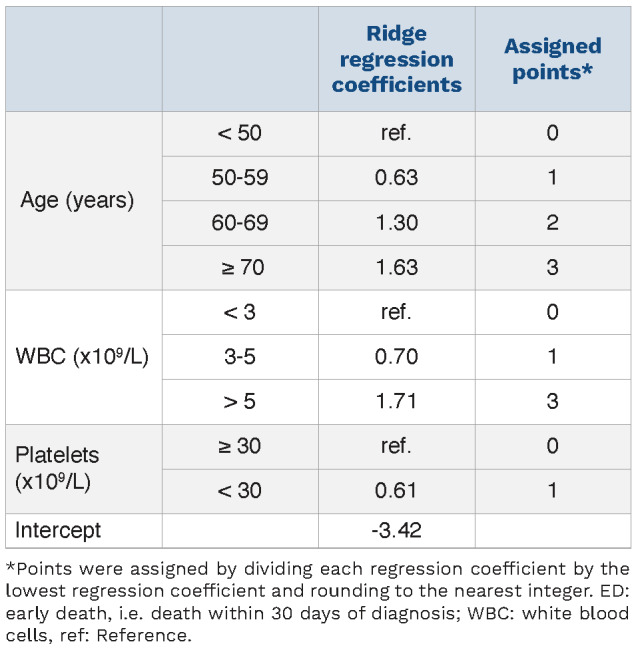
Figure 3.
Risk score algorithm. The total sum of assigned points per variable level can rapidly be found in the tabulated chart above. Higher points indicate a higher risk for early death (ED). Colors indicate the predicted risk of ED as shown in the boxes below.
Discussion
ED emerges as the most important remaining challenge in APL treatment. The assessment of an individual’s risk of ED can have an impact on treatment strategy, medical intervention, level of surveillance and frequency of monitoring. Despite these facts, there are no clinically used and/or validated risk stratification tools to date concerning the risk of ED.
Clinical trials often underestimate the true rate of ED, mainly due to the exclusion of patients presenting with high age, poor performance status, major hemorrhage or life-threatening coagulopathy. This results in differences in ED rates between clinical trials and population-based reports.4-13 A tool to assess the risk of ED, and that is relevant for clinical routine, therefore needs to be based on population-based data without the application of exclusion criteria.
In this study, we used real-world data from the nationwide population-based Swedish AML Registry, one of the few AML registries in the world with close to 100% coverage.19
The Swedish cohort included all patients diagnosed with APL nationwide between 1997 and 2020. To the best of our knowledge, this is the first study to utilize a truly population-based APL cohort to develop a risk score for ED.
Figure 4.
Risk score distribution and calibration plot. (A, B) Distribution of risk score groups in the training (A) and validation (B) cohorts, with green indicating low-risk, yellow indicating high-risk and red indicating very-high risk groups. (C) Calibration plot with the observed proportion of early deaths (ED) per risk group in the training cohort (blue) and validation cohort (green).
Figure 5.
Receiver operating characteristic curves with areas under the curve (AUC) for the risk scores assessed: the score suggested here, the Sanz score, and the scores of. Lou et al.17 and Cai et al.18
Based on uni- and multivariable logistic regression analyses, a risk-per-quantile assessment and multivariable penalized logistic regression analysis to obtain ridge regression coefficients, a model was developed that identified the most significant risk factors and their optimal cut-off values. Patients were divided into three risk groups based on their total score points, identifying low-risk, high-risk and very high-risk patients with ED risks of <10%, 10-30% and >30%, respectively.
The model identified WBC, platelets and age as the most significant risk factors and was, therefore, based on these parameters. Although studies differ somewhat with respect to risk factors for ED, WBC, platelets and age are recurrent in numerous studies.3,11,13,25 However, in contrast to the commonly used 10x109/L cut-off value for WBC, we found the risk of ED increased already at sub-normal WBC levels from approximately 2x10⁹/L, then increased steeply within the normal WBC range. This suggests the need for increased vigilance for ED already at WBC values below or within the normal range. The increase of ED at WBC levels below 10x109/L in part explains why the score showed better discriminative power for ED compared to the Sanz risk score. Moreover, the risk score also performed better than the previously published ED risk scores17,18 which, to our knowledge, also remain externally unvalidated. Nonetheless, the model by Cai and colleagues could be validated in our study and may act as an alternative for assessing ED risk.
For studies that include measurement of the WHO performance status, this is also associated with a higher risk of ED,26 as also in our study. However, the performance status at presentation is a subjective factor and it can also be strongly affected by already manifest intracerebral bleeding or thrombosis which makes it less suitable as a predictive factor for ED prevention (unpublished data). The presence of FLT3-ITD, CD2 expression and bcr3 PML-RARA transcript have also been associated with a higher risk of thrombosis although not uniformly.27-29 Such molecular data were not available for our cohorts but could potentially further improve the risk stratification.
Limitations to our study include the use of retrospective data where the prediction of ED was made with the knowledge of outcome data that could introduce bias. Moreover, both the training and the validation cohorts only span a short time period after the introduction of ATO as a standard induction therapy. Induction treatment with ATO in combination with ATRA was introduced late during the study period and while ATO/ATRA-treated patients are included in this study, the low numbers of patients were not sufficient to accurately validate the score solely for ATO/ATRA-treated patients. This warrants further validation of the proposed risk score, preferably in prospective cohorts, in which patients are treated uniformly with ATRA and ATO. Another factor that is not accounted for in our score, as well as in the other APL scores, is the presence of comorbidities and the risk of ED. Comorbidities likely play a role in the risk of ED but how to include them accurately in a score system remains a challenge.
An obvious question is how a predictive score for ED in APL should be used in clinical routine and what type of measures should be taken in APL patients with a high or very high risk of ED. Current European LeukemiaNet (ELN) guidelines recommend treatment with fibrinogen (and/or cryoprecipitate or fresh-frozen plasma) to keep fibrinogen levels >100-150 mg/dL and platelet transfusions to maintain levels >30-50x109/L in all newly diagnosed APL patients. The score presented here can potentially be used to identify patients who need a more aggressive approach regarding monitoring frequency, level of surveillance and/or more rapid action when levels are below the thresholds. Even higher thresholds for platelet transfusions could potentially be used for patients at the highest risk, but such recommendations need to be further evaluated. Moreover, the need for frequent monitoring and quick action may require surveillance in intensive care units, which could be contacted already when a patient with an especially high ED risk is identified.
We conclude that WBC values already below or within the normal range in APL patients are associated with an increased risk of ED which should be considered when assessing the risk of ED in APL patients. We here propose a risk score for ED in APL designed for the real-life situation and that can be used to risk-stratify patients when deciding upon level of surveillance and transfusion thresholds in order to overcome ED as one of the last standing barriers to successful APL treatment.
An online calculator for the score is provided at: aplearly-death.shinyapps.io/risk-score while Figure 3 could also be used directly to assess the risk for an individual patient.
Supplementary Material
Acknowledgments
The authors would like to thank everyone reporting to the Swedish AML Registry. The authors thank Mattias Mattsson, MD, PhD, at Uppsala University Hospital for valuable input during manuscript writing.
Funding Statement
Funding: The Swedish AML Registry is supported by the Swedish Association of Local Authorities and Regions, Region Skåne, Regionalt Cancercentrum Syd, and the Swedish Cancer Society.
References
- 1.Stahl M, Tallman MS. Acute promyelocytic leukemia (APL): remaining challenges towards a cure for all. Leuk Lymphoma. 2019;60(13):3107-3115. [DOI] [PMC free article] [PubMed] [Google Scholar]
- 2.Mantha S, Tallman MS, Soff GA. Whatʼs new in the pathogenesis of the coagulopathy in acute promyelocytic leukemia? Curr Opin Hematol. 2016;23(2):121-126. [DOI] [PubMed] [Google Scholar]
- 3.Lehmann S. Early death in APL. In: Abla O, Lo Coco F, Sanz MA, editors. Acute Promyelocytic Leukemia: A Clinical Guide. Cham: Springer International Publishing; p71-86. [Google Scholar]
- 4.Sanz MA, Montesinos P, Vellenga E, et al. Risk-adapted treatment of acute promyelocytic leukemia with all-trans retinoic acid and anthracycline monochemotherapy: long-term outcome of the LPA 99 multicenter study by the PETHEMA group. Blood. 2008;112(8):3130-3134. [DOI] [PubMed] [Google Scholar]
- 5.Asou N, Kishimoto Y, Kiyoi H, et al. A randomized study with or without intensified maintenance chemotherapy in patients with acute promyelocytic leukemia who have become negative for PML-RARα transcript after consolidation therapy: the Japan Adult Leukemia Study Group (JALSG) APL97 study. Blood. 2007;110(1):59-66. [DOI] [PubMed] [Google Scholar]
- 6.Lengfelder E, Haferlach C, et al. for the German AML Cooperative Group (AMLCG). High dose ara-C in the treatment of newly diagnosed acute promyelocytic leukemia: long-term results of the German AMLCG. Leukemia. 2009;23(12):2248-2258. [DOI] [PubMed] [Google Scholar]
- 7.Avvisati G, Lo-Coco F, Paoloni FP, et al. AIDA 0493 protocol for newly diagnosed acute promyelocytic leukemia: very long-term results and role of maintenance. Blood. 2011;117(18):4716-4725. [DOI] [PubMed] [Google Scholar]
- 8.Burnett AK, Russell NH, Hills RK, et al. Arsenic trioxide and all-trans retinoic acid treatment for acute promyelocytic leukaemia in all risk groups (AML17): results of a randomised, controlled, phase 3 trial. Lancet Oncol. 2015;16(13):1295-1305. [DOI] [PubMed] [Google Scholar]
- 9.Jeddi R, Kacem K, Ben Neji H, et al. Predictive factors of all-trans-retinoic acid related complications during induction therapy for acute promyelocytic leukemia. Hematology. 2008;13(3):142-146. [DOI] [PubMed] [Google Scholar]
- 10.McClellan JS, Kohrt HE, Coutre S, et al. Treatment advances have not improved the early death rate in acute promyelocytic leukemia. Haematologica. 2012;97(1):133-136. [DOI] [PMC free article] [PubMed] [Google Scholar]
- 11.Park JH, Qiao B, Panageas KS, et al. Early death rate in acute promyelocytic leukemia remains high despite all-trans retinoic acid. Blood. 2011;118(5):1248-1254. [DOI] [PMC free article] [PubMed] [Google Scholar]
- 12.Altman JK, Rademaker A, Cull E, et al. Administration of ATRA to newly diagnosed patients with acute promyelocytic leukemia is delayed contributing to early hemorrhagic death. Leuk Res. 2013;37(9):1004-1009. [DOI] [PubMed] [Google Scholar]
- 13.Lehmann S, Deneberg S, Antunovic P, et al. Early death rates remain high in high-risk APL: update from the Swedish Acute Leukemia Registry 1997–2013. Leukemia. 2017;31(6):1457-1459. [DOI] [PubMed] [Google Scholar]
- 14.Yanada M, Matsushita T, Asou N, et al. Severe hemorrhagic complications during remission induction therapy for acute promyelocytic leukemia: incidence, risk factors, and influence on outcome. Eur J Haematol. 2007;78(3):213-219. [DOI] [PubMed] [Google Scholar]
- 15.Breen KA, Grimwade D, Hunt BJ. The pathogenesis and management of the coagulopathy of acute promyelocytic leukaemia. Br J Haematol. 2012;156(1):24-36. [DOI] [PubMed] [Google Scholar]
- 16.Sanz MA, Lo Coco F, Martín G, et al. Definition of relapse risk and role of nonanthracycline drugs for consolidation in patients with acute promyelocytic leukemia: a joint study of the PETHEMA and GIMEMA cooperative groups. Blood. 2000;96(4):1247-1253. [PubMed] [Google Scholar]
- 17.Lou Y, Ma Y, Sun J, et al. Effectivity of a modified Sanz risk model for early death prediction in patients with newly diagnosed acute promyelocytic leukemia. Ann Hematol. 2017;96(11):1793-1800. [DOI] [PubMed] [Google Scholar]
- 18.Cai P, Wu Q, Wang Y, Yang X, Zhang X, Chen S. An effective early death scoring system for predicting early death risk in de novo acute promyelocytic leukemia. Leuk Lymphoma. 2020;61(8):1989-1995. [DOI] [PubMed] [Google Scholar]
- 19.Juliusson G, Antunovic P, Derolf Å, et al. Age and acute myeloid leukemia: real world data on decision to treat and outcomes from the Swedish Acute Leukemia Registry. Blood. 2009;113(18):4179-4187. [DOI] [PubMed] [Google Scholar]
- 20.Iland HJ, Collins M, Bradstock K, et al. Use of arsenic trioxide in remission induction and consolidation therapy for acute promyelocytic leukaemia in the Australasian Leukaemia and Lymphoma Group (ALLG) APML4 study: a non-randomised phase 2 trial. Lancet Haemat. 2015;2(9):e357-e366. [DOI] [PubMed] [Google Scholar]
- 21.Pavlou M, Ambler G, Seaman SR, et al. How to develop a more accurate risk prediction model when there are few events. BMJ. 2015;351:h3868. [DOI] [PMC free article] [PubMed] [Google Scholar]
- 22.Moons KGM, Altman DG, Reitsma JB, et al. Transparent Reporting of a multivariable prediction model for Individual Prognosis Or Diagnosis (TRIPOD): explanation and elaboration. Ann Intern Med. 2015;162(1):W1-73. [DOI] [PubMed] [Google Scholar]
- 23.R Core Team (2017). R: A language and environment for statistical computing. R Foundation for Statistical Computing, Vienna, Austria. https://www.R-project.org. [Google Scholar]
- 24.Rashidi A, Goudar RK, Sayedian F, et al. All-trans retinoic acid and early mortality in acute promyelocytic leukemia. Leuk Res. 2013;37(10):1391-1392. [DOI] [PubMed] [Google Scholar]
- 25.Song Y-H, Peng P, Qiao C, Zhang R, Li J-Y, Lu H. Low platelet count is potentially the most important contributor to severe bleeding in patients newly diagnosed with acute promyelocytic leukemia. Onco Targets Ther. 2017;10:4917-4924. [DOI] [PMC free article] [PubMed] [Google Scholar]
- 26.Mantha S, Goldman DA, Devlin SM, et al. Determinants of fatal bleeding during induction therapy for acute promyelocytic leukemia in the ATRA era. Blood. 2017;129(13):1763-1767. [DOI] [PMC free article] [PubMed] [Google Scholar]
- 27.Breccia M, Avvisati G, Latagliata R, et al. Occurrence of thrombotic events in acute promyelocytic leukemia correlates with consistent immunophenotypic and molecular features. Leukemia. 2007;21(1):79-83. [DOI] [PubMed] [Google Scholar]
- 28.Chen C, Huang X, Wang K, Chen K, Gao D, Qian S. Early mortality in acute promyelocytic leukemia: potential predictors. Oncol Lett. 2018;15(4):4061-4069. [DOI] [PMC free article] [PubMed] [Google Scholar]
- 29.Montesinos P, de la Serna J, Vellenga E, et al. Incidence and risk factors for thrombosis in patients with acute promyelocytic leukemia. Experience of the PETHEMA LPA96 and LPA99 protocols. Blood. 2006;108(11):1503. [Google Scholar]
Associated Data
This section collects any data citations, data availability statements, or supplementary materials included in this article.


