

Abstract
CoAA is an RRM-containing transcriptional coactivator that stimulates transcriptional activation and regulates alternative splicing. We show that the CoAA gene is amplified at the chromosome 11q13 locus in a subset of primary human cancers including non-small cell lung carcinoma, squamous cell skin carcinoma and lymphoma. Analysis of 42 primary tumors suggests that CoAA amplifies independently from the CCND1 locus. Detailed mapping of three CoAA amplicons reveals that the amplified CoAA gene is consistently located at the 5′ boundaries of the amplicons. The CoAA coding and basal promoter sequences are retained within the amplicons but upstream silencing sequences are lost. CoAA protein is overexpressed in tumors containing the amplified CoAA gene. RNA dot blot analysis of 100 cases of primary tumors suggests elevated CoAA mRNA expression. CoAA positively regulates its own basal promoter in transfection assays. Thus, gene amplification, loss of silencing sequence and positive feedback regulation may lead to drastic upregulation of CoAA protein. CoAA has transforming activities when tested in soft agar assays, and CoAA is homologous to oncoproteins EWS and TLS, which regulate alternative splicing. These data imply that CoAA may share a similar oncogenic mechanism with oncogene EWS and that CoAA deregulation may alter the alternative splicing of target genes.
Keywords: gene amplification, CoAA oncogene, transcriptional coactivator
Introduction
Transcriptional coactivator proteins coordinate gene expression in a large number of biological processes, including cancer development (Aranda and Pascual, 2001; McKenna and O’Malley, 2002). Dysregulated coactivator functions, resulting from chromosomal aberrations, in particular, have been suggested to promote oncogenesis (Anzick et al., 1997; Greaves and Wiemels, 2003; Yang, 2004). Examples include coactivators CBP/p300 and TIF2, which are associated with chromosomal translocations in leukemia as fusion proteins (Yang, 2004), and coactivators AIB1/SRC-3 and AIB3/TRBP, whose genes are amplified in breast cancers (Guan et al., 1996; Torres-Arzayus et al., 2004). Some oncoproteins have also been shown to have overlapping functions with coactivators (Brett et al., 1997), implicating the involvement of transcriptional coactivator actions in cancer development.
Coactivator activator (CoAA) was originally identified as a nuclear receptor coactivator that interacts with coactivator TRBP/NcoA6 (Ko et al., 2000; Iwasaki et al., 2001), the gene that is amplified in breast, colon and lung cancers (Guan et al., 1996). TRBP stimulates nuclear receptor-mediated gene activation and interacts with multiple components of the transcription complex. Genetic deletion of TRBP in mice is embryonically lethal, with severe defects in embryonic development (Kuang et al., 2002; Antonson et al., 2003). CoAA has been shown to synergistically activate transcription with TRBP and participate in the regulation of alternative splicing decisions (Auboeuf et al., 2004, 2005). CoAA, also called PSP2, is a major component of nuclear paraspeckles and colocalizes with p54nrb which regulates pre-mRNA splicing (Fox et al., 2002). CoAA structurally resembles members of the hnRNP family. It contains two RNA recognition motifs (RRM) and an activation domain rich in tyrosine and glutamine repeats. An alternatively spliced variant of CoAA, termed CoAM (coactivator modulator), lacks the activation domain and strongly represses transcription (Iwasaki et al., 2001). We find here that the CoAA activation domain is highly homologous to the N-terminal oncogenic domains of EWS family oncoproteins. The oncogenic domains of EWS fusion proteins are essential for tumorigenesis (Zinszner et al., 1994; Sorensen and Triche, 1996; Kim and Pelletier, 1999) and deregulate cell differentiation through altered alternative splicing (Yang et al., 2000). As aberrant alternative splicing is an intrinsic property for cancer cells (Kalnina et al., 2005), this phenomenon suggests that CoAA and EWS might have overlapping splicing functions in tumorigenesis.
In this report, we show amplification of the CoAA gene in significant numbers of human non-small cell lung cancers, squamous skin cancers and lymphomas. The CoAA gene is consistently found near the 5′ boundaries of the amplicons in three different types of tumors. While the basal promoter of the CoAA gene was retained within the amplicon, the negative regulatory sequences upstream of the CoAA promoter were lost from the amplified CoAA gene. CoAA protein was overexpressed in tumors associated with gene amplification. We suggest that loss of upstream silencing sequences of the CoAA gene in conjunction with gene amplification upregulates CoAA expression. The increased level of CoAA may alter the alternative splicing of downstream target genes, and impact tumor development similarly to EWS oncoproteins. Our study is the first systematic analysis of CoAA in cancer.
Results
CoAA C terminal repeats are shared by multiple oncoproteins
CoAA was previously cloned as a coactivator by our group (Iwasaki et al., 2001). The unique activation domain of CoAA contains 27 copies of repeated tyrosine- and glutamine-rich sequences (termed YxxQ motifs). These sequence motifs possessed robust transcriptional activity. To obtain functional insight into these unique sequence repeats of CoAA, we performed pattern and profile searches with SWISS-PROT/TrEMBL databases to search for additional proteins that might contain similar repeats. Our rationale was that even though a large number of proteins might carry a random YxxQ-like sequence, only a few proteins would have the sequence repeated many times. Surprisingly, 44 out of 52 returned entries within the mammalian protein databases matched to six proteins with multiple copies of repeated tyrosine- and glutamine-rich sequences. These matched proteins are the EWS family members EWS, TLS/FUS and TAFII68; the oncoprotein SYT; the SWI/SNF complex largest subunit BAF250; and CoAA itself (Supplemental Table S1 and Figure S1). All six YxxQ-rich proteins are known to be involved in transcriptional activation or in regulation of alternative splicing, suggesting that these motifs function in gene regulation. In addition, the oncogenic activity of the EWS family and SYT depends upon the presence of their N-terminal YxxQ-rich sequences (Clark et al., 1994; Sorensen and Triche, 1996), implicating the repeating sequences in oncogenesis. These findings led us to search for CoAA gene alterations in human cancers.
CoAA gene amplification in human cancers
The human CoAA gene (gene symbol RBM14) is located at chromosome 11q13, a locus that has been shown to be rearranged and amplified in multiple human cancers (Lammie and Peters, 1991; Koreth et al., 1999). To search for potential aberrations in the CoAA gene, we performed fluorescence in situ hybridization (FISH) on interphase chromosomes of human cancer tissues using the 210Kb BAC clone RP11-527H7 as probe. The probe was verified for the presence of the entire CoAA gene by polymerase chain reaction (PCR). We also performed FISH using normal peripheral lymphocyte metaphase chromosome to verify that the CoAA probe (red) localized to its expected position near the chromosome 11 centromere control probe (green) (Figure 1a). FISH analysis of interphase chromosomes from tumors suggested that gene amplification of CoAA was present in non-small cell lung carcinoma and lymphoma, note increased red signal relative to green signal (Figure 1b and c), but not in a breast cancer (Figure 1d). Figure 1e–h, shows a section of a lung carcinoma at increasing magnifications after hybridization with CoAA probe. Although amplification was found in a large number of cancer cells, significant heterogeneity of cell populations was present (Figure 1e–h). The gene copy number increase varied widely. Using multiple tumor assays, CoAA gene amplification was also detected in squamous cell skin cancer (3/4), pancreatic cancer (3/4) (Figure 1k and 1), ovarian cancer (1/2), and in certain other types of primary cancers (Table 1).
Figure 1.
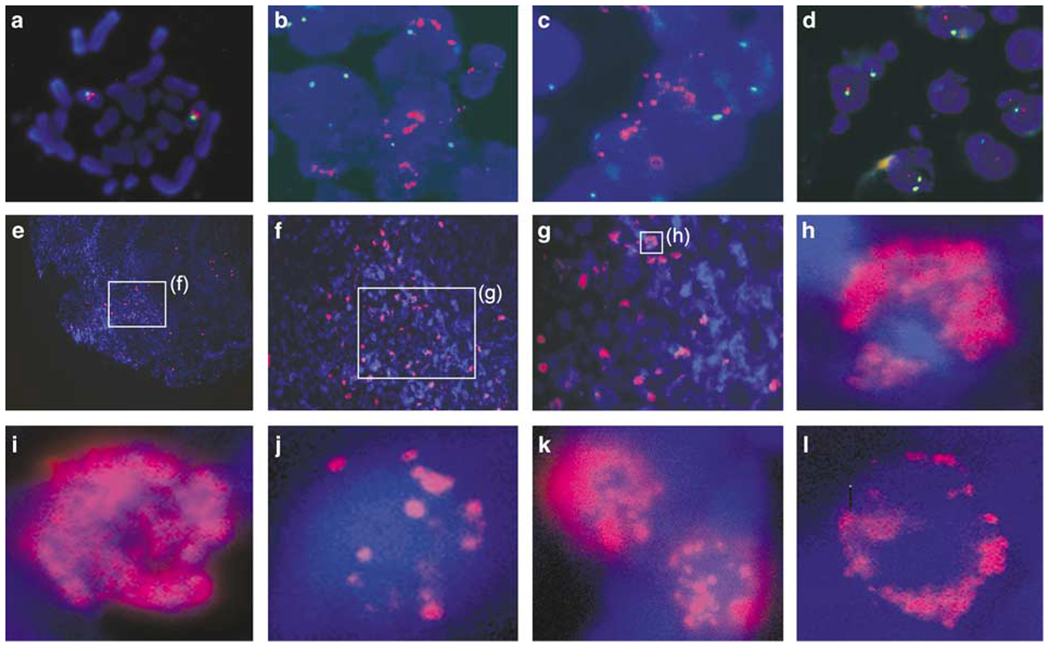
The CoAA gene is amplified in human cancers. FISH analysis using paraffin-embedded tissue sections double-stained with chromosome 11 centromere probe (green) and CoAA BAC probe (red) (a–d), or CoAA probe only (e–l). Slides were counterstained with DAPI. A metaphase FISH of normal peripheral lymphocyte serves as a control (a). The interphase FISH of lung cancer (b), lymphoma (c), and breast cancer (d) (× 600) are shown using double-staining. A lung cancer is shown with increasing magnification (e–h, × 100, × 200, × 400 and × 1000). High magnification view of interphase nuclei of lung cancer (i), lymphoma (j), skin cancer (k), and pancreatic cancer (l) (× 1000).
Table 1.
Gene amplification of CoAA in human cancers as determined by fluorescent in situ hybridization analysis using BAC clone RP11-527H7 as probe
| TMA | Tissue type | Positive/total samples | Intensity a |
|---|---|---|---|
| Multiple tumor array | |||
| Liver | 0/4 | − | |
| Lung | 3/3 | ++++ | |
| Pancreas | 3/4 | +++ | |
| Melanoma | 1/5 | + | |
| Esophageal | 1/2 | + | |
| Gastric | 1/2 | ++ | |
| Colon | 0/3 | − | |
| Breast | 0/4 | − | |
| Kidney | 0/3 | − | |
| Astrocytoma | 0/4 | − | |
| Lymphoma | 3/7 | +++ | |
| Mesothelioma | 0/5 | − | |
| Squamous skin | 3/4 | ++++ | |
| Basal cell | 1/4 | + | |
| Carcinoids | 0/5 | − | |
| Neuroblastoma | 0/1 | − | |
| Undifferentiated | 2/5 | + | |
| Sarcoma | 0/6 | − | |
| Stomach | 1/2 | + | |
| Prostate | 0/4 | − | |
| Thyroid | 0/2 | − | |
| Ovary | 1/2 | + | |
| Breast cancer array | |||
| Normal breast | 0/5 | − | |
| Fibroadenoma | 0/5 | − | |
| Carcinoma in situ | 0/2 | − | |
| Medullary carcinoma | 0/2 | − | |
| Lobular carcinoma | 0/5 | − | |
| Ductal carcinoma | 2/25 | + | |
| Paired metastasis | 0/5 | − | |
| Lung cancer array | |||
| Normal lung | 0/4 | − | |
| Hyperplasia | 2/8 | + | |
| Carcinoma | 5/5 | ++++ | |
| Carcinoma-necrosis | 0/2 | − | |
| Paired adjacent tissue | 6/8 | +++ | |
| Paired carcinoma | 8/8 | ++++ |
The intensity of amplification is scored as completely negative (−), weakly positive (+) with 3–4 copies per interphase, positive (++) with 5–10 copies per interphase, strongly positive (+++) with the presence of over 10 copies per interphase, and very strongly positive (++++), with the presence of over 20 copies per interphase.
There are several noticeable features of CoAA gene amplification. The copy number increase in a single nucleus can be high, ranging from several to possibly over 100 copies, if considering the high probability of double minute chromosomes in primary tumors (Figure 1 and Supplemental Figure S6). Lung cancers have greater signal intensity as well as the highest incidence of CoAA amplification. Examination of the same section using bright-field microscopy suggested that tumor cells with amplified CoAA are very small in size and are less differentiated with high nucleus–cytoplasmic ratio or scant cytoplasm. These cells were frequently found in stromal regions adjacent to the cancer, although they were also present in the tumor mass. Regardless of the tumor origin, significant heterogeneity of the cell population, small and irregular nuclei, and enriched blood vessels are typical morphologies in tumor areas of CoAA amplification. When multiple tumor, non-small cell lung cancer (NSCLC) and breast cancer arrays were compared by FISH analysis, amplification was found only in 4.5% (2/44) of breast cancers, but in 67.7% (21/31) of lung cancers analysed (Table 1), suggesting that CoAA amplification preferentially occurs in a subset of human cancers including lung cancer. CoAA amplification was also present in lymphomas, squamous cell skin cancers, pancreatic cancers and gastric cancers.
Independent CoAA amplification from CCND1
CCND1 is located 3Mb distal to the CoAA gene. CCND1 is known to be amplified in lung and skin cancers and contributes to the amplicon selection at 11q13. To determine if CoAA is amplified individually or coamplifies with CCND1, quantitative real-time PCR analysis was carried out to detect the copy number changes of both CoAA and CCND1 in 20 primary lung cancers, 10 squamous cell skin cancers, 12 lymphomas and six lung cancer cell lines. The data confirmed that the CoAA gene was amplified in the majority of lung cancer and squamous skin cancers, a number of lymphomas, and two lung cancer cell lines NCI-H69 and NCI-H2126 (Figure 2). However, the amplification patterns showed a clear distinction between CoAA and CCND1. In several cases, CoAA was amplified more than six-fold, whereas CCND1 was not amplified (Figure 2). Although in some cases CoAA and CCND1 did coamplify, the copy number increases of the two genes are not correlated. Thus, the data support that CoAA can independently amplify, and might contribute to the amplicon selection at 11q13 in addition to CCND1. In addition, CoAA amplification detected by FISH was detected by quantitative PCR in stomach cancers, melanomas and sarcomas (not shown). As PCR detects the average gene copy changes of an entire sample, the individual positive cells may have a higher copy number increase of CoAA, as suggested by FISH analysis (Figure 1). In summary, amplification of the CoAA gene at least two-fold above normal was detected by PCR in 55% (11/20) of lung cancers, 70% (7/10) of skin cancers and 33% (4/12) of lymphomas.
Figure 2.
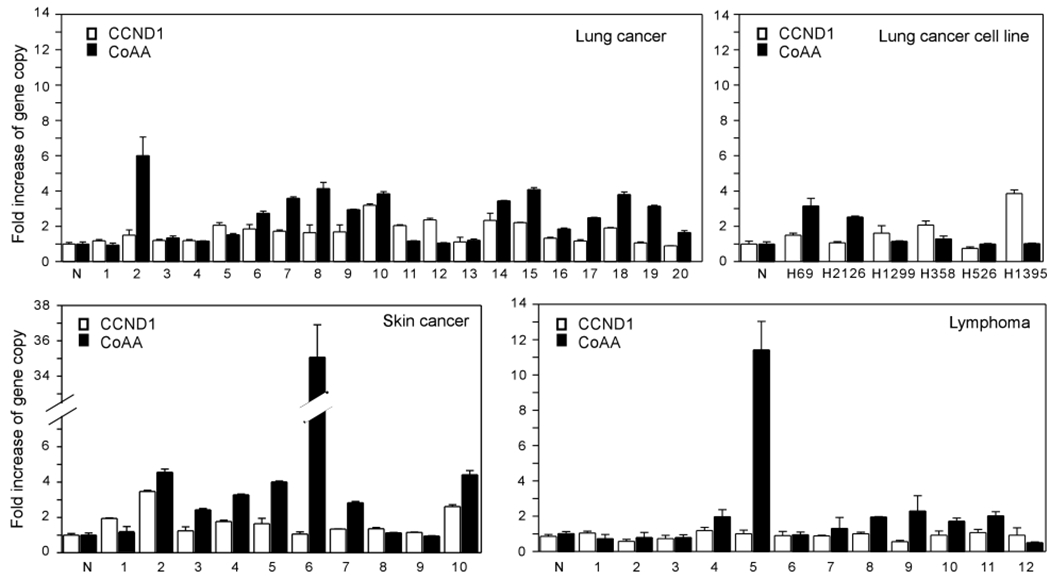
CoAA gene amplification is independent of CCND1. Quantitative real-time PCR analysis of CoAA (primers P6) and CCND1 (primers P14) was performed using genomic DNA from non-small cell lung carcinomas (NSCLC), squamous cell skin cancers, lymphomas, and lung cancer cell lines. Each PCR was normalized by a single copy gene, thyroid hormone receptor alpha (TRa). Serial dilution of normal human genomic DNA was used as standard (Supplemental Figure S4). Data shown represent mean of duplicate PCR as the fold increase of each gene. The experiments were repeated a minimum of twice with representative data shown. Normal genomic DNA control is indicated as N. Lung cancers include squamous cell lung carcinoma (1, 2, 3, 5, 6, 17, 18, 19, 20) and adenocarcinoma (4, 7, 8, 9, 10, 11, 12, 13, 14, 15, 16). Lymphomas include follicular lymphoma (1, 2, 3, 4, 5, 6, 7, 8, 9), and large B cell lymphoma (10, 11, 12).
Loss of 5′ regulatory sequences of the CoAA gene is associated with CoAA amplicons
In order to address the molecular mechanism of CoAA amplification, we mapped the CoAA amplicon using primers spanning approximately 5Mb of sequence surrounding the CoAA gene (Figure 3). We used three tumors identified in Figure 2 with ⩾six-fold of CoAA gene amplification including a skin cancer (Skin-6), a lung cancer (Lung-2) and a lymphoma (Lym-5) for amplicon mapping. Fourteen pairs of primers (P1-P14) were verified for efficiency (Supplemental Figures S2 and S3), and for accurate size of PCR products using normal human control DNA before use. The primer locations are indicated in Figure 3, and quantitative PCR data is shown in Figure 4. The mapped amplicons in the three cancers overlapped and were approximately 300–650 kb in size (Figure 3). These results have been repeated using different control samples including normal genomic DNA and multiple nonamplified tumor DNA. Although the 3′ boundaries of these amplicons were different, the 5′ boundaries were consistently located immediately upstream of the CoAA coding sequence, between primer pairs P4 and P5 (Figure 3). Although six genes are located within the region common to the three amplicons, only the CoAA gene had its upstream regulatory sequences invariably lost from all amplicons. Noticeably, a fragile site, FRA11A, is located immediately upstream of all the amplicons (Figure 3) (Buttel et al., 2004; Zainabadi et al., 2005). Based on the Breakage-Fusion-Bridge theory of gene amplification (Coquelle et al., 1997), FRA11A together with other downstream fragile sequences may contribute to the establishment of the CoAA amplicon boundaries. Together, the data confirm that CoAA has its own amplicon excluding CCND1. Importantly, the loss of the sequence immediately upstream of the CoAA coding region occurs in three different types of tumors analysed. We will later show that loss of these sequences derepresses CoAA gene expression.
Figure 3.
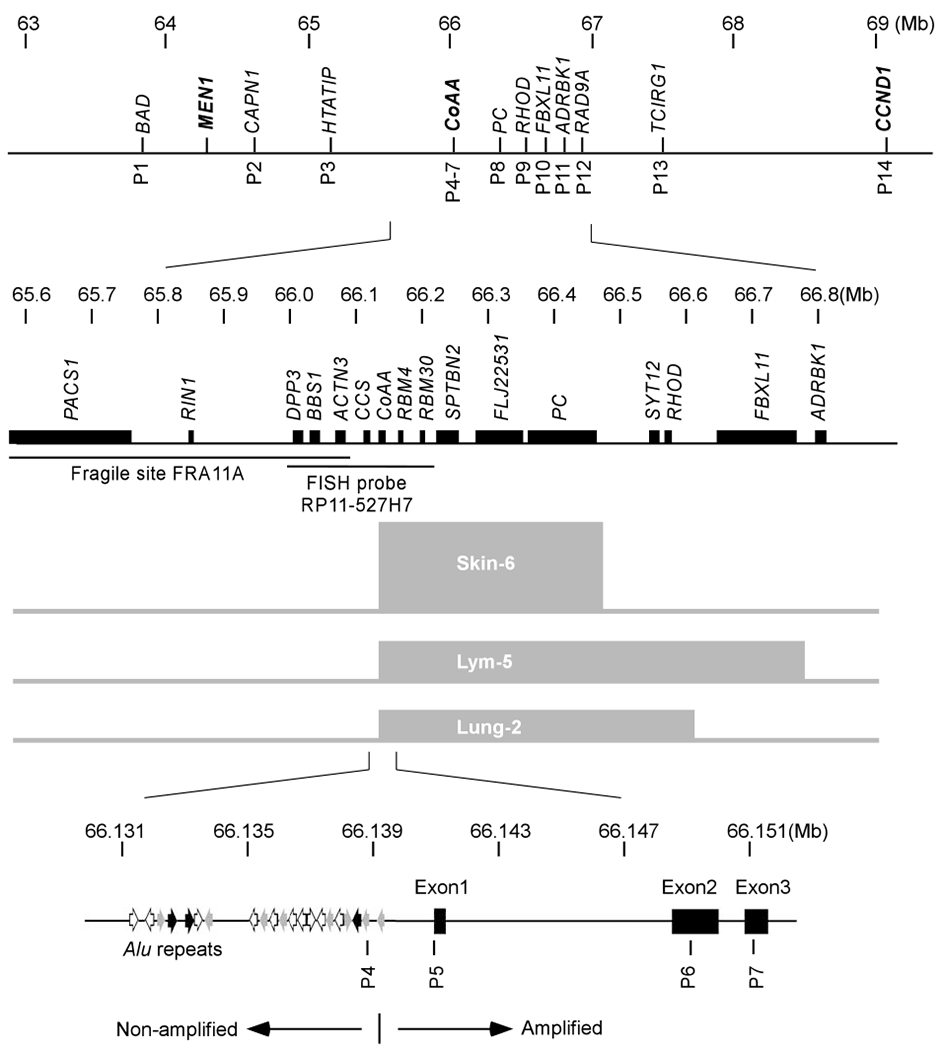
Mapping CoAA amplicons. Diagrams illustrate the human CoAA gene locus at chromosome 11q13 (drawn to three successively larger scales, after NCBI). Genes are shown on the top of each line and labeled in italics. Fourteen pairs of primers used for amplicon mapping are indicated below the lines. The fragile site FRA11A and FISH BAC probe RP11-527H7 are shown with their spanning regions indicated. The locations of the three mapped amplicons (Skin-6, Lym-5 and Lung-2) are depicted as gray boxes. In the enlarged bottom panel, the CoAA gene is shown with three exons and its 5′ regulatory sequence is shown with 21 Alu repeats upstream of the basal promoter. Multiple Alu repeats are shown by orientated arrows (Alu-Y, black; Alu-S, gray; Alu-J, white). The boundary between amplified and non-amplified sequences is indicated with a bar.
Figure 4.
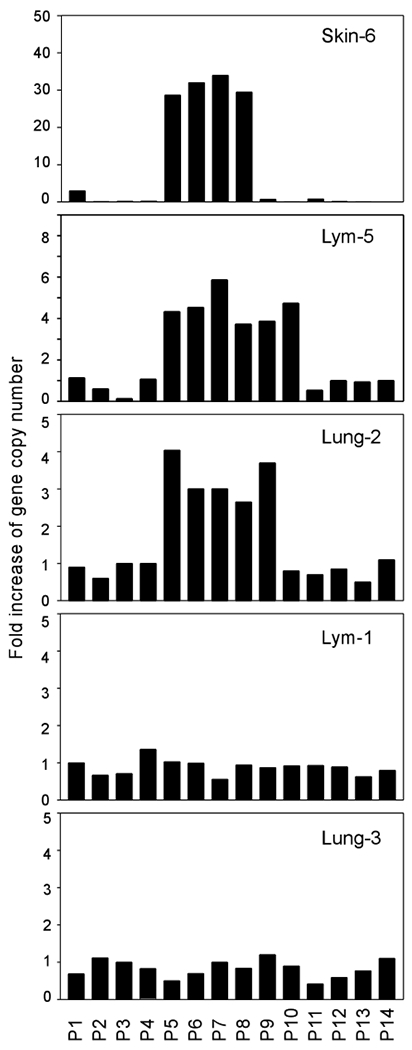
Mapping CoAA amplicons in lung cancer, skin cancer, and lymphoma. Quantitative real-time PCR results are shown using DNA from tumors with identifying numbers corresponding to numbers in Figure 2. The locations of 14 primer pairs (P1-P14) used in the mapping are shown in Figure 3. Two non-amplified tumors, a lymphoma and a squamous cell lung cancer were used as negative controls. Fold increase of gene copy number was determined as in Figure 2.
CoAA protein is overexpressed in CoAA-amplified cancers
To determine if gene amplification leads to altered CoAA protein expression, we generated an affinity-purified polyclonal antibody against CoAA. The antibody recognized a single band of the expected size in Western blot analysis (Figure 5a). In addition, we showed that staining had the expected nuclear distribution in an immunofluorescence analysis (Figure 5b). We then performed immunohistochemical staining on tumors identified by FISH. CoAA overexpression at a high level was detected in amplified lung and skin tumors compared to normal human lung and skin tissue as controls (Figure 5c). In normal tissues, CoAA expression was detected in a subset of cells including the basal layer of skin, and type II alveolar cells of lung. A high level of CoAA protein expression was also detected in amplified lung cancers when adjacent tissue sections were compared by FISH and immunohistochemistry analyses (Figure 5d). Although CoAA protein expression was also present in some nonamplified tumor cells, a high level of CoAA protein expression correlated with the CoAA gene amplification. Notably, an area with high level of CoAA protein expression (Figure 5e) showed CoAA gene amplification (Figure 1e–h) when adjacent sections were analysed. In addition, CoAA protein was significantly expressed in the three tumors for which we have mapped amplicons (Skin-6, Lym-5 and Lung-2) (Figure 5f). Together, these data support the idea that CoAA gene amplification leads to CoAA protein overexpression.
Figure 5.
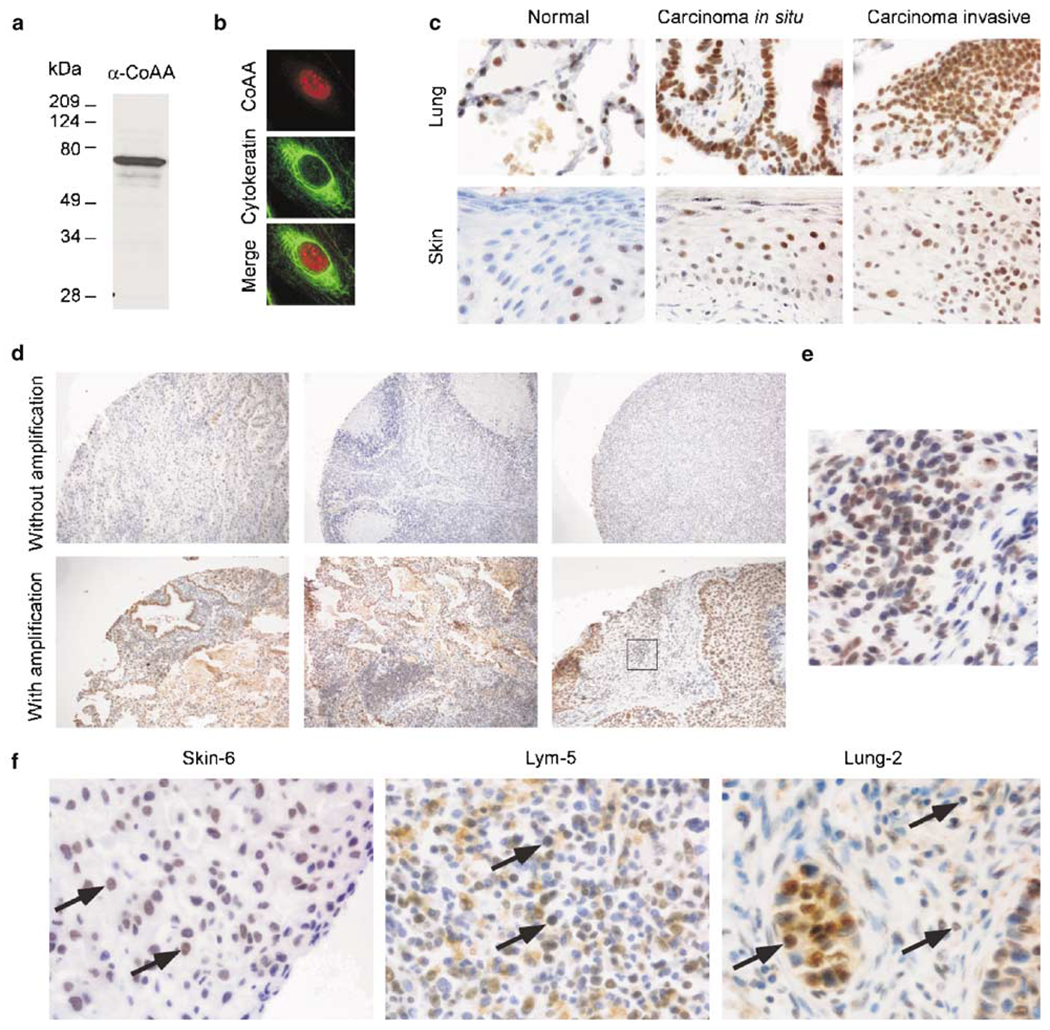
Expression of CoAA protein in cancer. (a) Immunoblotting analysis of endogenous CoAA in cell nuclear extracts using polyclonal anti-CoAA antibody. (b) Immunofluorescence staining of nuclear CoAA using affinity-purified anti-CoAA antibody. Cells were methanol-fixed and double-stained with anti-CoAA (red) and monoclonal anti-cytokeratin (green) as a counterstain. Merge of two images is shown below. (c) Immunohistochemical staining of CoAA in human lung and skin cancers. Normal human lung and skin tissues, carcinoma in situ, and invasive carcinomas are shown (×400). (d) Immunohistochemical staining of lung carcinomas from a lung cancer array with and without CoAA amplification, in which adjacent lung carcinoma slides were compared by FISH (not shown) and immunochemistry analyses (×100). An area identified with gene amplification (Figure 1e–h) is indicated by a box and shown as an enlarged view in (e) (×600). (f) CoAA protein overexpression in the three tumors with mapped amplicons (×600). Red blood cells are visible in Lym-5. Arrows indicate cancer cells with CoAA overexpression.
CoAA mRNA is upregulated in human cancers
In addition to the protein level, we also examined CoAA expression at the mRNA level in human primary tumors. Northern dot blot analysis was performed with 100 paired normal and primary tumor tissues from 10 tumor types. The results suggest that CoAA has elevated mRNA expression in 60–80% of lung, skin, stomach and testicular cancers, and in 30–50% of thyroid, uterus, cervix, breast, ovarian and colon cancers (Figure 6). It is currently unclear how many of these samples with mRNA upregulation contain CoAA gene amplification; however, the relative higher percentage of CoAA mRNA upregulation in lung and skin cancers was consistent with our analyses by FISH and quantitative PCR (Figures 1 and 2). These data nevertheless indicate that CoAA mRNA expression was increased in a large number of primary cancers.
Figure 6.
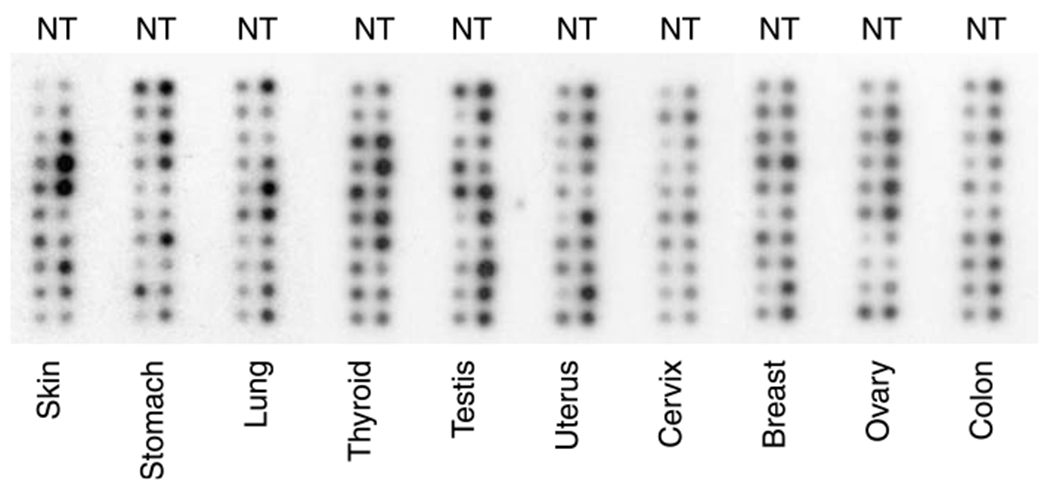
Northern dot analysis of CoAA mRNA expression in 100 human primary tumors representing 10 tumor types. The Northern dot blot contained normalized cDNA from tumor (T) and corresponding normal (N) tissues from each individual cancer patient.
CoAA has transforming activity
To investigate whether increased CoAA expression would directly induce the transformed phenotype, we examined the transforming capability of CoAA protein in NIH3T3 soft agar assays. CoAA contains an activation domain homologous to the EWS N-terminus which is known to have transforming activity (Zinszner et al., 1994). We constructed an expression plasmid containing full-length CoAA cDNA. We also constructed an expression plasmid containing a fusion of the CoAA activation domain to transcription factor Fli-1 (YxxQ-Fli-1), mimicking the EWS-Fli-1 fusion that occurs in Ewing’s sacorma (Sorensen and Triche, 1996). This allows us to determine if the CoAA activation domain has comparable transforming activities. As the CoAA activation domain requires its tyrosine residues for transcriptional activity (not shown), we generated a tyrosine to alanine mutant (AxxQ) in which 27 tyrosines were mutated to alanines. The accuracy of the AxxQ mutant was confirmed through complete nucleotide sequencing. The full-length AxxQ and AxxQ-Fli-1 served as negative controls and EWS-Fli-1 as a positive control in the assays. Stable NIH3T3 cell lines transfected with each expression plasmid were selected. The protein expression level in each stable cell clone was comparable when analysed by immunofluorescence using anti-FLAG tag antibody (Figure 7a bottom panel). The results of transformation assays showed that wild-type CoAA, but not the AxxQ mutant, promoted formation of colonies in soft agar (Figure 7a top panel). The YxxQ-Fli-1 construct showed transformation activity comparable to EWS-Fli-1, suggesting that the activation domain of CoAA can substitute for that of EWS. Quantification of results in Figure 7a is shown in Figure 7b. Consistent with the above observation, the contact inhibition in transformed cells was also reduced, such as in wild-type CoAA-transfected cells but not in its AxxQ mutant-transfected cells (Figure 7c). These data indicate that the overexpression of wild-type CoAA is sufficient for transformation in the soft agar assay, and the CoAA activation domain and EWS oncogenic domain are functional similar. Furthermore, the wild-type CoAA-transfected cells showed a higher proliferation rate than the control NIH3T3 cells as measured by BrdU incorporation assay (P=0.013), when three-to five fold more CoAA protein above the endogenous level was detected by Western blotting (Figure 7d). In addition, knockdown of CoAA with siRNA (Supplemental Figure S5) inhibited proliferation in a dose-dependent manner in the lung cancer cell line H69 that we previously identified with CoAA gene amplification (Figure 7e). Collectively, these results support the conclusion that overexpression of CoAA promotes cell proliferation and induces transformation.
Figure 7.
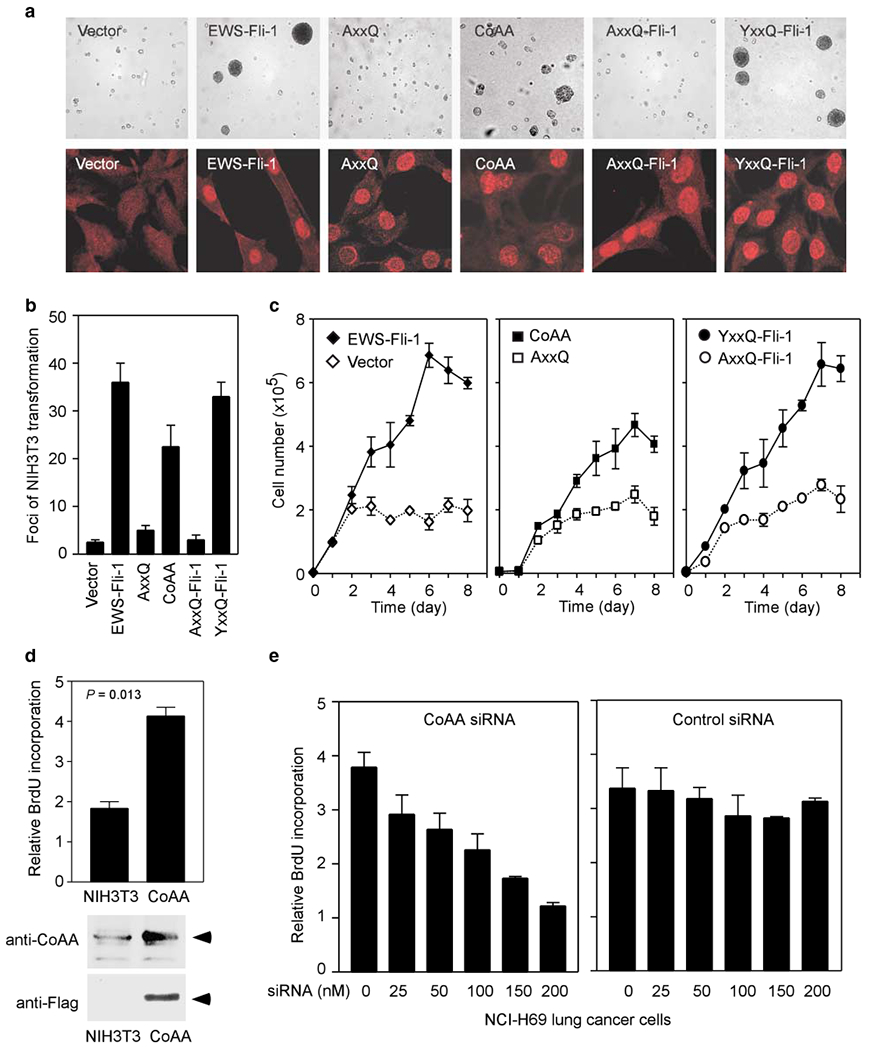
CoAA induces oncogenic transformation. (a) Anchorage-independent growth of NIH3T3 cells in soft agar. Cells were stably transfected with empty vector as control, or with expression plasmids for EWS-Fli-1, wild-type CoAA, AxxQ mutant, YxxQ-Fli-1 and AxxQ-Fli-1 (top panel). The protein expression levels were examined by immunofluorescent staining using an anti-FLAG antibody (lower panel). (b) Quantification results from a. The number of colonies was derived from two independent experiments. (c) Growth curves for stably transfected clones. Cells were plated into a 24-well plate in triplicate to analyse contact inhibition of transformed cells. Cell number was counted after trypsinizing every 24 h for 8 days. Data are shown as means of triplicate ±s.e. (d) Western blot analyses of endogenous CoAA in NIH3T3 cells and overexpressed CoAA in CoAA-transfected stable cells. Arrows indicate CoAA. Increased cell proliferation rate was measured by BrdU incorporation in CoAA-transfected NIH3T3 cells (top panel). (e) Decreased cell proliferation rate was measured by BrdU incorporation in NCI-H69 lung cancer cells treated with siRNA of CoAA. The increasing amounts of CoAA siRNA (left panel) and control siRNA (right panel) used are as indicated.
Gene amplification leads to stimulated CoAA promoter activity
Loss of sequences upstream of the CoAA gene reoccurred in three mapped amplicons. To understand the potential significance of this loss, we characterized the activities of these sequences in transcriptional regulation. The CoAA 5′ region contains 21 tandemly arranged Alu repeats upstream of the basal promoter (Figure 8a). The basal promoter, located immediately upstream of exon 1, is highly GC-rich and contains predicted transcription factor sites for NF-Y and Sp1 (not shown). Further semi-quantitative PCR analysis around the 5′ boundaries of amplicons showed that Alu-rich sequences were invariably lost and the GC-rich basal promoter region coamplified with the coding sequences (Figure 8b). The PCR data indicated a significant unbalance of gene dosage between primers P15 and P16, within a region near the Alu-rich sequences (Figure 8a and b). The PCR products at the upstream position (P15) were detectable by further nested PCR, indicating a lower gene copy number rather than a complete deletion of this DNA in primary tumors (not shown). In summary, the Alu-rich sequence, but not CoAA basal promoter, was lost from the amplicons.
Figure 8.
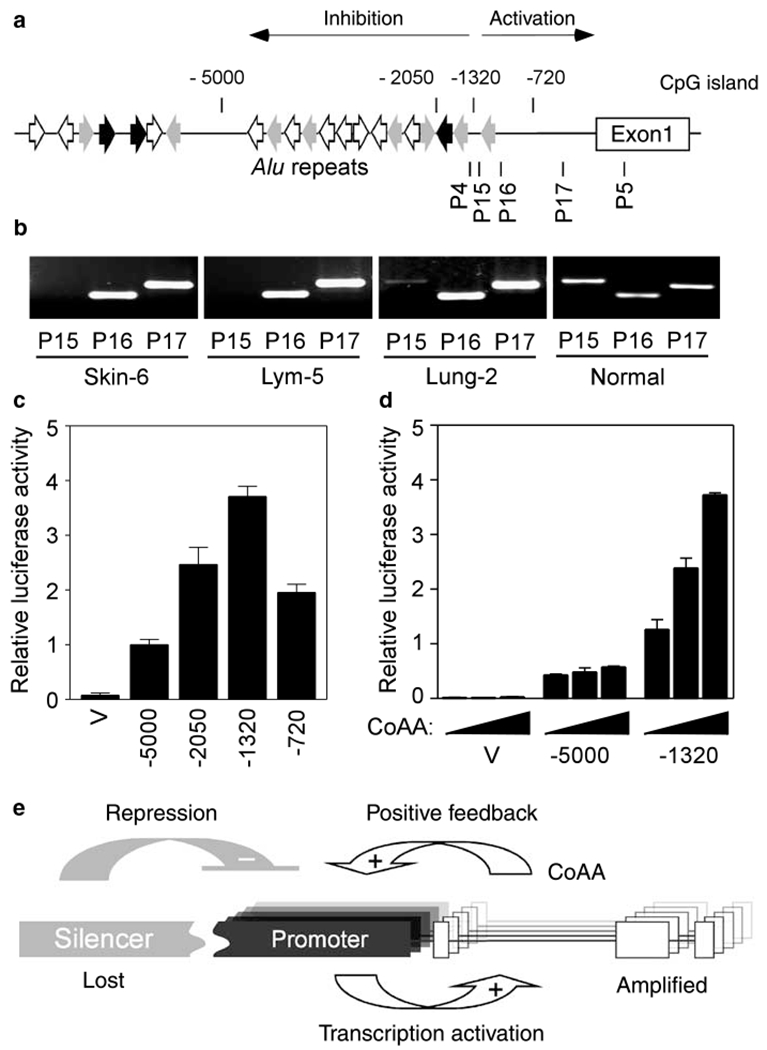
Loss of silencing sequence leads to stimulated CoAA promoter activity. (a) Schematic diagram of the regulatory region of the CoAA gene. Alu repeats are shown by orientated arrows. Numbers above the diagram indicate the promoter fragments used for reporter assays. A potential CpG island predicted by the NCBI is indicated. The positions of primer pairs (P15, P16 and P17) used for PCR in b are indicated. (b) PCR analysis for 5′ ends of the amplicons in three amplified tumors. PCR positions in the sequence are indicated in a. Normal genomic DNA is control. (c) Promoter activities of the CoAA gene were determined using a luciferase reporter system. The length of the promoter fragments are from number as indicated to +1. The positions of these deletions are shown in a. (d) CoAA stimulates its own promoter. Increasing amounts of CoAA expression plasmids (0, 0.2, 0.4 μg) were cotransfected with the luciferase reporters (0.1 μg) containing CoAA promoter sequences as indicated. Relative luciferase activities were measured and shown as means of triplicate transfections ±s. e. (e) Model of CoAA activation in cancer. CoAA gene is activated through its basal promoter (in black) and inhibited by its upstream silencer (in gray). Overexpressed CoAA, produced by the amplified CoAA genes, stimulates its own promoter via a positive feedback loop. Loss of silencer leads to constitutive cycling of CoAA overexpression.
To evaluate the consequence of the sequence loss for transcriptional regulation, we constructed a serial deletion of CoAA upstream sequences. Each fragment was linked to a luciferase reporter. The results showed that the basal promoter region alone (−1320 to + 1) has potent transcriptional activity while the inclusion of upstream Alu-rich sequences (−5000 to + 1) drastically reduced the activity (Figure 8c). The data confirm the positive regulatory role of the basal promoter and also suggest the presence of a silencing or negative regulatory element within the Alu-containing sequences (−5000 to −1320). As CoAA is a potent transcriptional coactivator itself, we also examined if overexpression of CoAA protein would regulate its own regulatory sequences. The data indicated that CoAA significantly stimulated its own basal promoter activity in a dose-dependent manner (Figure 8d). These data collectively point to a potential model for CoAA deregulation in cancer. As shown in Figure 8e, the expression of the CoAA gene is normally activated through its basal promoter and inhibited by the upstream silencing sequences. This balance is disrupted in cancer when the CoAA gene is amplified together with its basal promoter but without its Alu-rich silencer. The overexpressed CoAA gene then further activates its own expression via a positive feedback loop. In the absence of the silencer, continued cycles of CoAA overexpression are established. The model provides a mechanistic explanation for the observed overexpression of CoAA in gene amplified tumors.
Discussion
Oncogene activation through gene aberration is thought to be a consequence of functional selection, especially when it reoccurs in multiple tumors (Rabbitts, 1994, 1999; Sorensen and Triche, 1996; Bystritskiy and Razin, 2004). Previous studies have suggested that in cancer the chromosome 11q13 locus is subject to complex aberrations including deletions, rearrangement and amplifications (Koreth et al., 1999). These aberrations are partially due to the presence of CCND1. However, evidence also supports the existence of potential uncovered cancer genes within this locus. Owing to the complexity of the DNA changes, it is difficult to detect such cancer genes using genetic approaches alone. In the present study, we initially identified a potential oncogenic domain in CoAA homologous to the existing oncoproteins in the EWS family. This result prompted subsequent analysis focusing on the CoAA gene at the 11q13 locus in primary tumors and resulted in the detection of its amplification and recurrent DNA changes.
Gene amplification is proposed to initiate through the Breakage-Fusion-Bridge (BFB) cycle, in which a telomeric fragile site initiates amplification and a centromeric fragile site defines the size of amplicons (Coquelle et al., 1997). Asymmetrical distributions of amplified genes during the cell cycle confer growth advantage and contribute to the establishment of gene amplification. Within the chromosome 11q13 locus, a large gene cluster containing multiple amplicons is flanked by the fragile sites FRA11A and FRA11F (Buttel et al., 2004), which have been previously suggested to be involved in the BFB cycle (Coquelle et al., 1997). Our current results are in agreement, at least in part, with the previous observations, in which FRA11A is immediately centromeric to all mapped CoAA amplicons. The sequences downstream of the CoAA amplicons may also contain fragile sequences, and together with FRA11A, they yield observed amplicons with the CoAA gene consistently located at 5′ end. The reason that this type of CoAA amplicon was previously undetected is possibly due to its smaller size and long distance from the extensively studied CCND1 locus. In addition, sequence loss encompassing FRA11A have also been detected in a large number of primary cervical cancers (Zainabadi et al., 2005), which implicates a potential loss of upstream sequences relative to the CoAA region. The size of the CoAA regulatory sequences is currently unknown since enhancers or silencers can act over a long distance. Thus, the deletion of whole or part of the FRA11A region might lead to similar consequences of CoAA deregulation.
Our data suggest that CoAA gene amplification results in the loss of its silencing sequences and might contribute to oncogenic activation. In the proposed model (Figure 8e), several events concurrently lead to CoAA overexpression: the amplified CoAA coding region and basal promoter, the lost negative regulatory sequence, and a positive feedback activation of CoAA’s own expression. The lost silencing sequences contain densely arranged Alu repeats, which might facilitate DNA rearrangment (Gibbons and Dugaiczyk, 2005), and contribute to CpG methylation-mediated gene silencing (Schmid, 1998; Das and Singal, 2004; Jasinska and Krzyzosiak, 2004; Caiafa and Zampieri, 2005). It would be important in future studies to understand the silencing roles associated with the CoAA regulatory sequence. A better understanding of CoAA may also require the identification of juxtaposed foreign sequences to the CoAA gene. Nevertheless, evidence of the recurring DNA damages at the CoAA gene strongly supports the potential functional role of CoAA in cancer.
CoAA protein functions as a transcriptional coactivator that regulates alternative splicing. The oncogenic domain of EWS that is homologous to CoAA has also been shown to be essential in regulating splicing activities (Yang et al., 2000). In contrast to the difference in expression level, alternative splicing yields functionally distinct protein variants and may drastically alter cellular functions. Increasing evidence suggested that a large number of altered alternatively spliced mRNAs are associated with tumors, and aberrant alternative splicing is a hallmark of cancer cells (Kalnina et al., 2005). A recent report on an RRM-containing splicing regulator HuD showed that amplification of the N-myc oncogene is controlled by HuD expression levels in neuroblastoma cells (Grandinetti et al., 2006). This not only illustrated the importance of splicing regulation in cancer, but also suggested that splicing alteration could be an early hit during mult-step cancer progression. Consistent with this, the EWS family members, which regulate splicing, have been proven to be the primary cause in associated sarcomas. Thus, a functional basis may be present for CoAA acting through alternative splicing in cancer. Alternative splicing regulation has also been shown to be critical for differentiation and early development, and some of its basic patterns are evolutionarily conserved (Smith et al., 1989). In Drosophila melanogaster, splicing regulator sex lethal controls the alternative splicing of a cascade of downstream genes producing additional alternative splicing regulators, which ultimately determines male and female status (Penalva and Sanchez, 2003). CoAA may share similar characteristics with sex lethal. Both genes produce alternative splicing regulators, they utilize a positive feedback loop to enhance their own expression, and their own genes can be alternatively spliced with distinct functional consequences. In the case of CoAA, a dominant negative CoAM that counterregulates CoAA transcriptional activity is produced through alternative splicing of the CoAA gene (Auboeuf et al., 2002). Whether CoAA target genes contain any splicing regulators remains to be determined. However, it is conceivable that overexpression of CoAA could deregulate downstream genes and alter cellular functions, given that CoAA regulates a large amount of nuclear receptor-mediated gene activation.
CoAA amplification is present in cells with an undifferentiated morphology and is frequently located in stromal locations where progenitor cells may reside. CoAA protein is significantly expressed in mouse embryos, embryonic stem cells and all cancer cell lines analysed, but its expression is decreased during normal differentiation (unpublished observation); it thus remains to be studied if deregulation of CoAA might be involved in the differentiation of cancer progenitor cells (Kim et al., 2005). Consistent with this notion, EWS has recently been reported to regulate stem cell differentiation (Lee et al., 2005). Therefore, regulation of alternative splicing might be an important issue in differentiation as well as cancer development.
Materials and methods
FISH analysis
Tumor tissue paraffin sections including tumor arrays (Medical College of Georgia and InnoGenex) were evaluated histologically by study pathologists before FISH analysis. The paraffin-embedded slides were baked, deparaffinized, treated with tissue pretreatment reagents (Insitus Biotechnologies, Albuquerque, NM, USA), and hybridized using Vysis reagents. A bacterial artificial chromosome (BAC) clone (RP11-527H7, 200 kb, Children’s Hospital Oakland Research Institute) containing the CoAA gene, confirmed by PCR, was labeled with SpectrumRed dUTP (Nick Translation Kit, Vysis) according to the manufacturer’s protocol to produce the FISH probe. Chromosome 11 centromeric alpha satellite probe CEP11-D11Z1 (Vysis) was labeled with SpectrumGreen dUTP and applied simultaneously as a control probe for dual-color visualization. Slides were counterstained with DAPI before visualization with fluorescence microscopy.
Quantitative real-time PCR
Genomic DNAs were isolated from cell lines or human tumor tissue sections. Tissue sections were baked at 56°C for 1 h and treated with a xylene and ethanol series. Samples were transferred to tubes and incubated in 50 μl of lysis buffer (25mM Tris-Cl, pH 8.0, 50mM NaCl, 1mM EDTA, 0.1% Triton X-100, 0.1 mg/ml proteinase K) overnight at 50°C, which was then heat-inactivated at 100°C for 10 min. Realtime PCR (Taqman, Applied Biosystems, Foster city, CA, USA) was performed in duplicate in a 25 μl reaction using diluted DNA (0.8–5 ng). Standard curves of each gene, including the control, single-copy gene thyroid hormone receptor α (TRα) for normalization, were generated using a serial dilution of normal human genomic DNA (Clontech, Mountain View, CA, USA). Primers derived from the BAD, CAPN1, HTATIP, PC, RHOD, FBXL11, ADRBK1, RAD9A, TCIRG1, CCND1 and CoAA genes at chromosome 11q13 were designed within their single exons and verified for their efficiency before use (Supplemental Figures S2 and S3).
Immunohistochemistry and immunoblotting
Polyclonal anti-CoAA was prepared in rabbits by immunization with a glutathione S-transferase (GST)-CoAA (307–545) fusion protein (Covance). Affinity resin Affi-gel 10 (Bio-Rad) was covalently cross-linked to His-tagged CoAA (without GST) as antigen. This resin was then used to affinity purify anti-CoAA according to the manufacturer’s protocol (Bio-Rad). Human tumor sections were deparaffinized, treated with xylene and ethanol, and stained with affinity-purified antibody at a dilution of 1:200. Antibody binding was detected using biotinylated anti-rabbit IgG F(ab)2 antibody followed by detecting reagents (DAKO, Carpinteria, CA, USA). Sections were counterstained with hematoxylin. Immunoblots were probed with primary antibodies at a dilution of 1:200 and detected with the ECL system (Amersham Pharmacia, Piscataway, NJ, USA). For immunofluorescence, NIH3T3 cells were methanol-fixed and stained with mouse monoclonal anti-Flag antibody at 1:500 (Sigma, St Louis, MO, USA, M2). Antimouse Cy3-conjugated secondary antibody (Jackson Immuno-Research Lab, West Grove, PA, USA) was applied at a dilution of 1:200.
Northern dot blot analysis
The Northern dot blot containing 100 paired normal and primary tumor cDNAs was obtained from Clontech (Cancer Profiling Array II, #7847-1). The blot contained normalized cDNA isolated from tumor and corresponding normal tissues from individual cancer patients. The CoAA probe was prepared by random-primed 32P-DNA synthesis using human CoAA full-length cDNA as template. Northern hybridization was performed according to manufacturer’s protocol.
Transient transfection and RNA interference
Monkey kidney CV-1 cells (ATCC, CCL-70) were maintained in Dulbecco’s modified Eagle’s medium (DMEM) supplemented with 10% fetal bovine serum and 5 μg/ml penicillin/ streptomycin in 5% CO2 at 37°C. NIH3T3 cells (ATCC, CRL-1658) were maintained under the same conditions except with 10% donor bovine serum. NCI-H69 lung cancer cells (ATCC, HTB-119) were cultured in RPMI 1640 medium supplemented with 2mM L-glutamine, 10mM HEPES, and 10% fetal bovine serum. Cells were transfected in triplicate in 24-well or 96-well plates using Lipofectamine™ (Invitrogen, Carlsbad, CA, USA). The target sequence of CoAA siRNA is 5′-GUAAC CAGCCAUCCUCUUA-3′; the control siRNA is 5′-UAGC GACUAAACACAUCAA-3′ (Dharmacon, Lafayette, CO, USA). H69 cells were transfected with CoAA or control siRNA at indicated concentrations for 16 h before adding 10 μM BrdU (Sigma) for 4 h. Cells were fixed, blocked, treated with monoclonal anti-BrdU antibody (Santa Cruz Biotechnologies, 1:200). The BrdU incorporation was detected with ECL reagents (Amersham Pharmacia) using a Dynex luminometer. Relative light units are shown as means of triplicate ±s.e. For promoter analysis, CoAA promoter fragments were cloned by PCR using BAC clone RP11-527H7 as template. Each promoter fragment was inserted into a promoter-less PXP2 luciferase vector. Full-length human CoAA plasmid was co-transfected with the reporter plasmids, when applicable, for 16 h before harvest. Relative luciferase activities were measured using a Dynex luminometer and shown as means of triplicate transfections ±s.e.
Mutagenesis of the YxxQ domain
Tyrosine to alanine substitutions in each of the 27 copies of the YxxQ motifs of CoAA were generated by gene synthesis (MCLab). The synthetic AxxQ-containing region was subcloned into the wild-type CoAA construct replacing the YxxQ sequences. The accuracy of the AxxQ mutant was confirmed by full-length nucleotide sequencing, restriction mapping, and Western blot analyses before use.
Transformation assay
The CoAA YxxQ domain and the AxxQ domain (aa 307–545) were joined to the Fli-1 DNA-binding domain to create fusion proteins similar to the EWS-Fli-1 fusion protein derived from a sarcoma. Mouse NIH3T3 cells (ATCC, CRL-1658) were stably transfected with Flag-tagged full-length CoAA, full-length AxxQ mutant, YxxQ-Fli-1, AxxQ-Fli-1 or EWS-Fli-1. Empty vector was transfected as control. Stably transfected cells were selected using 400 μg/ml of G418. Positive clones containing stably transfected DNA were identified by PCR with genomic DNA, and the protein expression levels of each transfected clone was monitored by immunofluorescent staining using anti-FLAG antibody. Stable clones were assayed for anchorage-independent growth in soft agar (0.34% low melting point agarose in DMEM containing 15% FCS). The numbers of colonies in duplicated plates were counted. For contact inhibition assay, stably transfected cells were plated onto a 24-well plate with 4 × 10³ cells per well in triplicate, and the cell number was counted after trypsinizing every 24 h for 8 days. Cells were fed twice a week. Data are shown as means of triplicate ±s.e.
Pattern profile and sequence analyses
The protein databases of Swiss-Prot (release 44.3; 156998 entries) and TrEMBL (release 27.3; 1379120 entries) were analysed with ScanProsite program (http://us.expasy.org/tools/scanprosite/). Prosite syntax scanned for the YxxQ motifs: Y-{P}(1,2)-Q(1,2)-X(1,4)-Y-{P}(1,2)-Q(1,2)-X(1,4)-Y-{P}(1,2)-Q(1,2). The taxonomic species filter was set as Homo sapiens, Mus musculus, Rattus norvegicus and Bos taurus. Sequences identified with more than three hits, that is nine copies of the motifs, were selected for analysis. Alu repeats within the regulatory sequences of the CoAA gene were identified using Censor Server at Genetic Information Research Institute (www.girinst.org) and BLAST search at NCBI. Transcription factor binding sites within the CoAA basal promoter were predicted by the TFSEARCH program at Computational Biology Research Center (www.cbrc.jp).
Supplementary Material
Acknowledgements
This work was supported, in part, by the Georgia Cancer Coalition (L Ko). We thank Paul S Meltzer at National Institutes of Health for discussion of the manuscript. We thank Liu Yang at University of Washington for the EWS-Fli plasmids, and Ning Zhu at MCLab for synthesis of the AxxQ mutant. We thank Rhea Markowitz and Diana G Westbrook for manuscript editing. We are grateful for the help of Mei H Lai at Eli Lilly and Company, and Fermina Mazzella, Jin-Xiong She, Zixuan Wang, Kimberly Smith, and Doris Cawley at Medical College of Georgia. Zheqiong Yang is an exchange trainee from Wuhan University, China.
Footnotes
Supplementary Information accompanies the paper on the Oncogene website (http://www.nature.com/onc).
References
- Antonson P, Schuster GU, Wang L, Rozell B, Holter E, Flodby P et al. (2003). Inactivation of the nuclear receptor coactivator RAP250 in mice results in placental vascular dysfunction. Mol Cell Biol 23: 1260–1268. [DOI] [PMC free article] [PubMed] [Google Scholar]
- Anzick SL, Kononen J, Walker RL, Azorsa DO, Tanner MM, Guan XY et al. (1997). AIB1, a steroid receptor coactivator amplified in breast and ovarian cancer. Science 277: 965–968. [DOI] [PubMed] [Google Scholar]
- Aranda A, Pascual A. (2001). Nuclear hormone receptors and gene expression. Physiol Rev 81: 1269–1304. [DOI] [PubMed] [Google Scholar]
- Auboeuf D, Dowhan DH, Dutertre M, Martin N, Berget SM, O’Malley BW. (2005). A subset of nuclear receptor coregulators act as coupling proteins during synthesis and maturation of RNA transcripts. Mol Cell Biol 25: 5307–5316. [DOI] [PMC free article] [PubMed] [Google Scholar]
- Auboeuf D, Dowhan DH, Li X, Larkin K, Ko L, Berget SM et al. (2004). CoAA, a nuclear receptor coactivator protein at the interface of transcriptional coactivation and RNA splicing. Mol Cell Biol 24: 442–453. [DOI] [PMC free article] [PubMed] [Google Scholar]
- Auboeuf D, Honig A, Berget SM, O’Malley BW. (2002). Coordinate regulation of transcription and splicing by steroid receptor coregulators. Science 298: 416–419. [DOI] [PubMed] [Google Scholar]
- Brett D, Whitehouse S, Antonson P, Shipley J, Cooper C, Goodwin G. (1997). The SYT protein involved in the t(X;18) synovial sarcoma translocation is a transcriptional activator localised in nuclear bodies. Hum Mol Genet 6: 1559–1564. [DOI] [PubMed] [Google Scholar]
- Buttel I, Fechter A, Schwab M. (2004). Common fragile sites and cancer: targeted cloning by insertional mutagenesis. Ann NY Acad Sci 1028: 14–27. [DOI] [PubMed] [Google Scholar]
- Bystritskiy AA, Razin SV. (2004). Breakpoint clusters: reason or consequence? Crit Rev Eukaryot Gene Expr 14: 65–77. [PubMed] [Google Scholar]
- Caiafa P, Zampieri M. (2005). DNA methylation and chromatin structure: the puzzling CpG islands. J Cell Biochem 94: 257–265. [DOI] [PubMed] [Google Scholar]
- Clark J, Rocques PJ, Crew AJ, Gill S, Shipley J, Chan AM et al. (1994). Identification of novel genes, SYT and SSX, involved in the t(X;18)(p11.2;q11.2) translocation found in human synovial sarcoma. Nat Genet 7: 502–508. [DOI] [PubMed] [Google Scholar]
- Coquelle A, Pipiras E, Toledo F, Buttin G, Debatisse M. (1997). Expression of fragile sites triggers intrachromosomal mammalian gene amplification and sets boundaries to early amplicons. Cell 89: 215–225. [DOI] [PubMed] [Google Scholar]
- Das PM, Singal R. (2004). DNA methylation and cancer. J Clin Oncol 22: 4632–4642. [DOI] [PubMed] [Google Scholar]
- Fox AH, Lam YW, Leung AK, Lyon CE, Andersen J, Mann M et al. (2002). Paraspeckles: a novel nuclear domain. Curr Biol 12: 13–25. [DOI] [PubMed] [Google Scholar]
- Gibbons R, Dugaiczyk A. (2005). Phylogenetic roots of Alu-mediated rearrangements leading to cancer. Genome 48: 160–167. [DOI] [PubMed] [Google Scholar]
- Grandinetti KB, Spengler BA, Biedler JL, Ross RA. (2006). Loss of one HuD allele on chromosome #1p selects for amplification of the N-myc proto-oncogene in human neuroblastoma cells. Oncogene 25: 706–712. [DOI] [PubMed] [Google Scholar]
- Greaves MF, Wiemels J. (2003). Origins of chromosome translocations in childhood leukaemia. Nat Rev Cancer 3: 639–649. [DOI] [PubMed] [Google Scholar]
- Guan XY, Xu J, Anzick SL, Zhang H, Trent JM, Meltzer PS. (1996). Hybrid selection of transcribed sequences from microdissected DNA: isolation of genes within amplified region at 20q11-q13.2 in breast cancer. Cancer Res 56: 3446–3450. [PubMed] [Google Scholar]
- Iwasaki T, Chin WW, Ko L. (2001). Identification and characterization of RRM-containing coactivator activator (CoAA) as TRBP-interacting protein, and its splice variant as a coactivator modulator (CoAM). J Biol Chem 276: 33375–33383. [DOI] [PubMed] [Google Scholar]
- Jasinska A, Krzyzosiak WJ. (2004). Repetitive sequences that shape the human transcriptome. FEBS Lett 567: 136–141. [DOI] [PubMed] [Google Scholar]
- Kalnina Z, Zayakin P, Silina K, Line A. (2005). Alterations of pre-mRNA splicing in cancer. Genes Chromosomes Cancer 42: 342–357. [DOI] [PubMed] [Google Scholar]
- Kim CF, Jackson EL, Woolfenden AE, Lawrence S, Babar I, Vogel S et al. (2005). Identification of bronchioalveolar stem cells in normal lung and lung cancer. Cell 121: 823–835. [DOI] [PubMed] [Google Scholar]
- Kim J, Pelletier J. (1999). Molecular genetics of chromosome translocations involving EWS and related family members. Physiol Genom. 1: 127–138. [DOI] [PubMed] [Google Scholar]
- Ko L, Cardona GR, Chin WW. (2000). Thyroid hormone receptor-binding protein, an LXXLL motif-containing protein, functions as a general coactivator. Proc Natl Acad Sci USA 97: 6212–6217. [DOI] [PMC free article] [PubMed] [Google Scholar]
- Koreth J, Bakkenist CJ, McGee JO. (1999). Chromosomes, 11Q and cancer: a review. J Pathol 187: 28–38. [DOI] [PubMed] [Google Scholar]
- Kuang SQ, Liao L, Zhang H, Pereira FA, Yuan Y, DeMayo FJ et al. (2002). Deletion of the cancer-amplified coactivator AIB3 results in defective placentation and embryonic lethality. J Biol Chem 277: 45356–45360. [DOI] [PubMed] [Google Scholar]
- Lammie GA, Peters G. (1991). Chromosome 11q13 abnormalities in human cancer. Cancer Cells 3: 413–420. [PubMed] [Google Scholar]
- Lee J, Rhee BK, Bae GY, Han YM, Kim J. (2005). Stimulation of Oct-4 activity by Ewing’s sarcoma protein. Stem Cells 23: 738–751. [DOI] [PubMed] [Google Scholar]
- McKenna NJ, O’Malley BW. (2002). Combinatorial control of gene expression by nuclear receptors and coregulators. Cell 108: 465–474. [DOI] [PubMed] [Google Scholar]
- Penalva LO, Sanchez L. (2003). RNA binding protein sex-lethal (Sxl) and control of Drosophila sex determination and dosage compensation. Microbiol Mol Biol Rev 67: 343–359, table of contents. [DOI] [PMC free article] [PubMed] [Google Scholar]
- Rabbitts TH. (1994). Chromosomal translocations in human cancer. Nature 372: 143–149. [DOI] [PubMed] [Google Scholar]
- Rabbitts TH. (1999). Perspective: chromosomal translocations can affect genes controlling gene expression and differentiation – why are these functions targeted? J Pathol 187: 39–42. [DOI] [PubMed] [Google Scholar]
- Schmid CW. (1998). Does SINE evolution preclude Alu function? Nucleic Acids Res 26: 4541–4550. [DOI] [PMC free article] [PubMed] [Google Scholar]
- Smith CW, Patton JG, Nadal-Ginard B. (1989). Alternative splicing in the control of gene expression. Annu Rev Genet 23: 527–577. [DOI] [PubMed] [Google Scholar]
- Sorensen PH, Triche TJ. (1996). Gene fusions encoding chimaeric transcription factors in solid tumours. Semin Cancer Biol 7: 3–14. [DOI] [PubMed] [Google Scholar]
- Torres-Arzayus MI, Font de Mora J, Yuan J, Vazquez F, Bronson R, Rue M et al. (2004). High tumor incidence and activation of the PI3K/AKT pathway in transgenic mice define AIB1 as an oncogene. Cancer Cell 6: 263–274. [DOI] [PubMed] [Google Scholar]
- Yang L, Chansky HA, Hickstein DD. (2000). EWS.Fli-1 fusion protein interacts with hyperphosphorylated RNA polymerase II and interferes with serine-arginine protein-mediated RNA splicing. J Biol Chem 275: 37612–37618. [DOI] [PubMed] [Google Scholar]
- Yang XJ. (2004). The diverse superfamily of lysine acetyltransferases and their roles in leukemia and other diseases. Nucleic Acids Res 32: 959–976. [DOI] [PMC free article] [PubMed] [Google Scholar]
- Zainabadi K, Benyamini P, Chakrabarti R, Veena MS, Chandrasekharappa SC, Gatti RA et al. (2005). A 700-kb physical and transcription map of the cervical cancer tumor suppressor gene locus on chromosome 11q13. Genomics 85: 704–714. [DOI] [PubMed] [Google Scholar]
- Zinszner H, Albalat R, Ron D. (1994). A novel effector domain from the RNA-binding protein TLS or EWS is required for oncogenic transformation by CHOP. Genes Dev 8: 2513–2526. [DOI] [PubMed] [Google Scholar]
Associated Data
This section collects any data citations, data availability statements, or supplementary materials included in this article.