

Abstract
Volatile chemical products (VCPs) are a significant source of reactive organic carbon emissions in the United States, with a substantial fraction (>20% by mass) serving as secondary organic aerosol (SOA) precursors. Here, we incorporate a new nationwide VCP inventory into the Community Multiscale Air Quality (CMAQ) model, with VCP-specific updates to better model air quality impacts. Model results indicate that VCPs most enhance anthropogenic SOA in densely populated areas, with population-weighted annual average SOA increasing 15 – 30% in Southern California and New York City due to VCP emissions (contribution of 0.2 – 0.5 μg m−3). Annually, VCP emissions enhance total population-weighted PM2.5 by ~5% in California, ~3% in New York, New Jersey, and Connecticut, and 1 – 2% in most other states. While the maximum daily 8-hr ozone enhancements from VCP emissions are more modest, their influence can cause a several ppb increase on select days in major cities. Printing Inks, Cleaning Products, and Paints & Coatings product use categories contribute ~75% to the modeled VCP-derived SOA and Cleaning Products, Paints & Coatings, and Personal Care Products contribute ~81% to the modeled VCP-derived ozone. Overall, VCPs enhance multiple criteria pollutants throughout the United States, with the largest impacts in urban cores.
Keywords: volatile chemical products, reactive organic carbon, secondary organic aerosol, ozone, PM2.5, air quality impacts
Graphical Abstract

INTRODUCTION
Emissions of reactive organic carbon (ROC) are a critical component of atmospheric photochemistry1. These emissions, which include all non-methane gas-phase and aerosol organic compounds (i.e., organic aerosol; OA), regulate the abundance of oxidants and gas-phase reactivity in the atmosphere1, 2. In addition, ROC contributes to the formation of fine particulate matter (PM2.5) and tropospheric ozone (O3). The influence of ROC on PM2.5 can result from primary emission (i.e., primary organic aerosol; POA), secondary production via gas-phase oxidation of organics (i.e., secondary organic aerosol; SOA), or modulation of oxidants, which can influence the formation of inorganic PM2.5 components (e.g., NH4NO3). Since PM2.53, SOA4, and O35 are all associated with adverse impacts to human health and welfare6, 7, understanding the sources and accurately modeling the evolution of ROC emissions in the atmosphere is important.
Volatile chemical products (VCPs) are used in residential, commercial, institutional, and industrial settings and lead to ROC emissions. These sources include, but are not limited to, cleaners, personal care products, adhesives, sealants, paints, coatings, pesticides, and printing inks, all of which partially evaporate on atmospherically relevant timescales. Collectively, VCPs are a major source of anthropogenic ROC emissions throughout the United States8, 9 and the primary source of anthropogenic gas-phase ROC emissions in several urban regions10, 11. In 2016, VCPs contributed ~3.1 Tg of ROC emissions in the United States9, with ~20% of emissions by mass considered intermediate volatility organic compounds (IVOCs), which are efficient SOA precursors12, 13. As such, VCPs represent an emission source with considerable potential to affect urban PM2.5 and O3.
Despite their importance, adequate representation of VCP emissions in photochemical transport modeling is lacking14. This partially stems from the long-term focus on ROC emissions from combustion sources, which are largely non-oxygenated and have decreased dramatically in recent years due to targeted emission control efforts15, 16, as well as the preeminent concern for reducing ozone in urban areas. As a result, the source attribution and chemical composition of ROC emissions has changed in the past few decades11. In addition, modeling urban SOA features continuing challenges17–19 and representation of IVOC emissions and their multigenerational aging within chemical transport models (CTMs) is typically lacking20. Since VCPs have considerable SOA potential from their IVOC components8, 9, representation of the complete volatility spectrum from VCP emissions is necessary to model their potential criteria pollutant impacts. These changes require updates to the chemical mechanisms within CTMs; which are used to predict air quality impacts from emissions.
Here, we incorporate a new VCP inventory9 into the Community Multiscale Air Quality (CMAQ) model, with VCP-specific chemistry updates21, to better represent VCP emissions and subsequent air quality impacts throughout the contiguous United States. These updates include representation of secondary air pollutant formation pathways for alkane-like IVOCs, oxygenated IVOCs, and siloxanes. We then simulate air quality throughout the continental United States and quantify the national-level contributions of VCPs to criteria pollutants (PM2.5 and O3). Contributions from various categorical aggregations are assessed and the relative importance of VCP contributions to PM2.5 and O3 are quantified. We also evaluate the model’s ability to simulate air quality following these updates and assess the potential burden that can result from additional assumptions related to VCP emissions, specifically marginal evaporation of potential semi-volatile organic compound (SVOC) ingredients.
METHODS
Regional Emissions
VCP emissions throughout the United States are estimated using VCPy.v1.19. In VCPy, hundreds of individual VCPs (e.g., shampoo, glass cleaner, paint thinner) are aggregated into Product Use Categories (PUCs), which are split into sub-Product Use Categories (sub-PUCs) based on characteristic usage patterns. The methods of VCPy.v1.1 match the methods of VCPy.v1.0, as described in Seltzer et al.9. However, VCPy.v1.1 includes a substantial update to the organic composition of most sub-Product Use Categories (sub-PUCs), which incorporates the organic profiles reported in the latest California Air Resources Board (CARB) Consumer & Commercial Products survey22 (Table S1). This update results in nearly no change to the estimated magnitude of VCP emissions, but some distinct variations in the volatility distribution and compound class make-up of emissions (Fig. S1). Notably, the proportion of IVOCs (3 × 10² μg m−3 < C* < 3 × 10⁶ μg m−3) and oxygenated compounds increase.
The emissions used here reflect 2016 conditions and yield a VCP national-average emission rate of 9.5 kg person−1 year−1. Prior analysis estimated that the sector-wide emission uncertainty, stemming from variables such as product usage and assigned product use timescale, is ±15%9. Paints & Coatings contribute the largest fraction of ROC emissions and are predicted to be emitted at an average rate of ~3.1 kg person−1 year−1 nationally. Cleaning Products and Personal Care Products each contribute ~2.0 kg person−1 year−1, Adhesives & Sealants and Printing Inks both emit ~0.8 kg person−1 year−1, and pesticides emit ~0.6 kg person−1 year−1. Emissions from all other categories, including dry-cleaning, solvent usage in oil and gas operations, lighter fluids, and other miscellaneous products are estimated to emit ~0.1 kg person−1 year−1. VCPy currently assumes that all emissions occurring indoors are fully transported to the ambient atmosphere. A first-order approximation that includes chemical loss pathways and reduced characteristic timescales of evaporation in indoor environments yields a reduction of ~12% for the complete sector. However, a comprehensive analysis of indoor termination pathways for VCP emissions, which can be particularly important for reactive species23–25, will be the focus of future VCPy work and these approximations will not be included in the present analysis.
In VCPy, emissions are calculated at the national-level and allocated to the county-level using several proxies, including population, employment statistics, agricultural pesticides use, and oil and gas well counts. County-level emissions are further processed and gridded at 12-km scale within the continental United States for input into CMAQ. County-level data on the density of agricultural land and oil and gas wells are used to grid the agricultural pesticides and oil and gas solvent sub-PUCs, respectively. Population density is used to grid the remaining sub-PUCs within each county. Seasonal and diurnal emission variations are applied to most sub-PUCs using the profiles reported in Gkatzelis et al.26 (Table S2). Sub-PUCs for which no applicable tracer from Gkatzelis et al.26 are available use a sinusoidal diurnal emissions profile with a peak at noon and no seasonal variation.
Other significant modeling updates include IVOC emissions and semi-volatile primary organic aerosol (SV-POA) profiles for all gasoline, diesel, and gas-turbine mobile sources27. The implementation of mobile IVOC emissions follows the methodology of Lu et al.28. The remaining regional emission inputs come from the 2016 version 129 emission modeling platform, which is built upon the U.S. Environmental Protection Agency’s (U.S. EPA) 2014 National Emission Inventory (NEI) version 2 (2014NEIv2) and summarized in greater detail in Appel et al.30. The simulations performed here do not apply the approach of Murphy et al.20, which accounts for the estimated potential SOA contribution from combustion sources using an empirical relationship derived from southern California observations.
Using a near-field exposure model31, prior research has indicated that non-negligible quantities of residential personal care products, household products, and coatings contain SVOC (0.3 μg m−3 < C* < 3 × 10² μg m−3) ingredients14, which can evaporate on atmospherically relevant timescales11. To test the implications of marginal SVOC evaporation from VCPs on SOA potential, a simulation that assumes 2% of all non-evaporative organics (i.e., assumed non-volatile components of VCPs) evaporate is performed. This is within the bounds of near-field exposure modeling uncertainty for many VCP categories14 and translates to ~0.355 kg person−1 year−1. In this sensitivity test, the additional emissions of SVOCs are given sinusoidal diurnal and seasonal emissions profiles, with peaks at noon and in summer, and are allocated within each county using population density as a spatial surrogate.
Chemical Transport Modeling
Air quality is simulated using CMAQv5.3.2 at 12-km resolution over the contiguous United States. The domain includes 299 rows, 459 columns, and 35 vertical layers spanning from the surface to 50 hPa, with the mid-point of the lowest layer typically ~10-m above ground level. All simulations include the complete 2016 calendar year with a 10-day spin-up beginning in December 2015 to minimize the influence of initial conditions. Additional modeling options largely follow the methods outlined in Appel et al.30, including: (1) no inline wind-blown dust, (2) the M3Dry deposition model with bi-directional NH3 exchange enabled32, (3) inline calculation of biogenic emissions using the Biogenic Emission Inventory System (BEIS) v3.6133, (4) the AERO7 aerosol module, (5) inline lightning NOx emissions calculated using the National Lighting Detection Network34, 35, (6) the CB6r3_AE7_AQ chemical mechanism36, (7) ocean halogen chemistry and sea spray aerosol emissions37, and (8) runtime emissions processing using the Detailed Emissions Scaling, Isolation, and Diagnostic (DESID) module38. Boundary conditions are generated from a 108-km Hemispheric CMAQ simulation using CMAQv5.3 and meteorology inputs are generated from the Weather Research and Forecasting model v4.1.1 (see Appel et al.30 for more details).
Substantial updates to VCP-relevant chemistry were added to both the emissions processing for CB6r3_AE7_AQ and the chemistry of AERO7. In current and previous public, operational versions of CMAQ, lower-volatility, gas-phase anthropogenic ROC emissions were not represented in the chemical mechanism14. As a result, much of the VCP mass (~30%21), often dominated by IVOCs, was not considered for SOA or radical chemistry. Recent work21, 28 introduced several new chemical components to the AERO7 module within CMAQ to alleviate this issue, with an focus on alkane-like IVOCs, oxygenated IVOCs, SVOCs, and siloxanes, and modeled Los Angeles air quality during the 2010 California Nexus of Air Quality and Climate Change (CalNex) campaign39.
Here, the mapping of all compounds emitted from VCPs are reviewed to ensure proper SOA and radical chemistry representation within CMAQ. For many VCP-relevant species emitted in high quantities (e.g., ethanol, acetone, toluene), no updates are necessary as they are explicitly considered within the chemical mechanism. For the compounds that are not explicitly included in the chemical mechanism, the order-of-operations for mapping explicit compounds to model species, with both SOA and radical chemistry considerations, is described in the Supporting Information.
To quantify the criteria pollutant enhancements resulting from VCP emissions, two main simulations are performed. The first incorporates all emission and chemical mechanism updates described above (i.e., the “base” simulation) and the second eliminates all VCP emissions (i.e., the “zero VCP” simulation). Thus, the difference of the two represents the enhancement of air pollution attributable to the VCP emissions in the updated modeling system. Seven additional zero-out simulations are performed to quantify the criteria pollutant enhancements from aggregations of different sub-PUCs. These simulations individually assess Cleaning Products, Personal Care Products, Adhesives & Sealants, Paints & Coating, Printing Inks, Pesticides, and all other categories. For the SVOC evaporation simulation, additional emissions are treated as semi-volatile with a C* of 100 μg m−3, undergo gas-phase oxidation chemistry, and have a SOA yield of ~65% at 10 μg m−3 (VSVPO3 model species20).
Air Quality Observations & Model Evaluation
Predictions of organic carbon (OC), total PM2.5, and maximum daily 8-hour O3 (MDA8 O3) concentrations from the base simulation are compared with observations acquired from the U.S. Environmental Protection Agency’s Air Quality System (AQS) to evaluate model performance. Since SOA is not routinely measured, organic carbon is the only organic fraction of PM2.5 evaluated here. For OC and total PM2.5, 24-hour filter samples are retrieved on a 1-in-3-day sampling schedule; whereas O3 measurements are collected hourly, with the maximum daily 8-hour metric generated by the Atmospheric Model Evaluation Tool (AMET40). Model predictions are paired in space and time with corresponding AQS observations using AMET. To assess model performance, the normalized mean bias (NMB) of daily model and observed pairings are sorted seasonally and regionally. We then evaluate whether the NMB from this study falls within the top 33rd percentile or the top 67th percentile of past evaluation applications, as reported by Emery et al.41. The top third of OC, PM2.5, and MDA8 O3 NMB are less than ±15%, ±10%, and ±5%, respectively, and the top two-thirds of NMB for OC, PM2.5, and MDA8 O3 are less than ±50%, ±30%, and ±15%, respectively.
RESULTS
Model Performance
The modeling configuration, emissions, and chemistry updates used here yield improved predictions of OC (Fig. 1 vs. Fig. S2) with bias metrics that often rank among the top, previously published model evaluations. Of the 24 seasonal and regional aggregations evaluated, 10 had NMB values smaller than ±15% and the remaining 14 had NMB values smaller than ±50%. OC predictions were within ±15% of observations throughout most of the country in the winter and fall months, as well as the northeast in the spring and summer and the southeastern spring. Despite the inclusion of a state-of-science VCP inventory and improved SOA chemistry, CMAQ underpredicted OC in broad swaths of the country outside the East Coast in the spring and summer months (−44% ≤ NMB ≤ −16%). In addition, the model overpredicted OC in the southeastern U.S. during the summer (NMB = 39%) and was persistently low biased in the southwest, which is dominated by monitoring locations in California.
Figure 1.
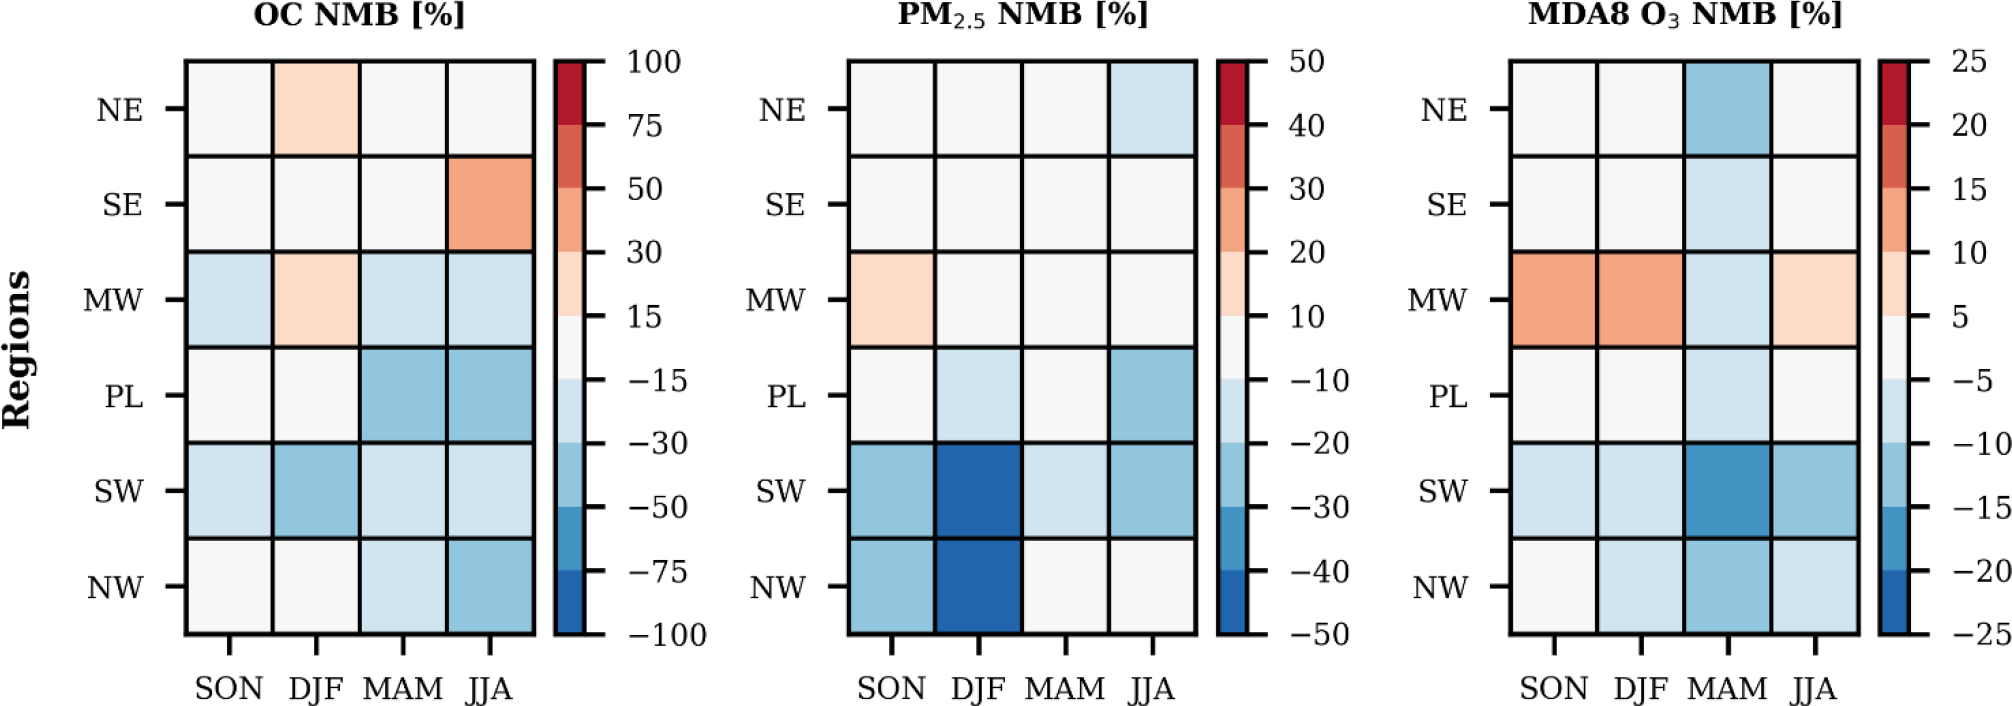
Modeling performance metrics for OC, PM2.5, and maximum daily 8-hour O3, disaggregated by season and region. Note: NE – U.S. EPA Regions 1, 2, 3; SE – U.S. EPA Region 4; MW – U.S. EPA Region 5; PL – U.S. EPA Regions 6, 7, 8; SW – U.S. EPA Region 9; NW – U.S. EPA Region 10; SON – fall months; DJF – winter months; MAM – spring months; JJA – summer months; NMB – normalized mean bias. See Table S3 in the supporting information for additional data related to the model evaluation.
Predictions of total PM2.5 had a NMB smaller than ±10% in 14 seasonal and regional aggregations and smaller than ±30% in 8 others (Fig. 1). Model performance was generally good throughout the year and contiguous United States, except for a strong low bias along the West during cooler months. The cold season negative bias is persistent in CMAQ30 and has been attributed to biased predictions of nitrate during strong meteorological inversion episodes that could be alleviated using a finer modeling grid resolution30, 42.
MDA8 O3 was well predicted in all locations and seasons, with three notable exceptions. The model was persistently low biased throughout the United States in the spring, which has previously been attributed to underestimated ozone from the lateral boundary conditions30, 37. A separate possible mechanism for this bias could be the variability in the stomatal uptake of ozone, which is a major loss pathway for tropospheric ozone. This process initiates each year in the spring43, features year-to-year variability that is difficult to model44, and can perturb regional mean surface ozone concentrations by more than 5 ppb45. Beyond this persistent springtime bias, the model results were also low biased in the southwest for all seasons, and generally high biased in the midwest for all non-springtime seasons. The correlation in low bias for OC and O3 in the southwest year-round suggests a possible systematic error, such as missing emissions, oxidants, planetary boundary layer issues, or other transport errors.
Enhancements of Criteria Pollutants Attributable to VCP Emissions
VCPs generate a spatially variable increase in SOA concentrations throughout the contiguous United States, with notable peaks in California, along much of the East Coast, and in the Upper Midwest (Fig. 2). Enhancements were highest in Southern California, with Los Angeles County featuring a population-weighted annual average enhancement of ~0.5 μg m−3. This translates to ~30% of the modeled, annual-average SOA mass in the county (Fig. S3). However, modeled organic carbon is still low biased in California (Fig. 1). This residual bias could be driven by additional missing emissions, inadequate process representations in the model, or systematic biases in meteorology. These factors can all influence the estimated increase in SOA attributable to VCPs found here. The greater New York City region showed the second highest SOA enhancements attributable to VCPs, with annual increases generally spanning 0.2 – 0.3 μg m−3, which accounts for ~17% of the modeled, annual-average SOA mass. Outside of heavily populated cities, VCP enhancements of SOA dropped precipitously throughout the Great Plains and Northwest. Nonetheless, VCPs were an important contributor to anthropogenic SOA throughout the United States with a nationwide, annual-average, population-weighted SOA enhancement of ~0.15 μg m−3, or ~10% of the modeled, population-weighted SOA mass (Fig. S3).
Figure 2.
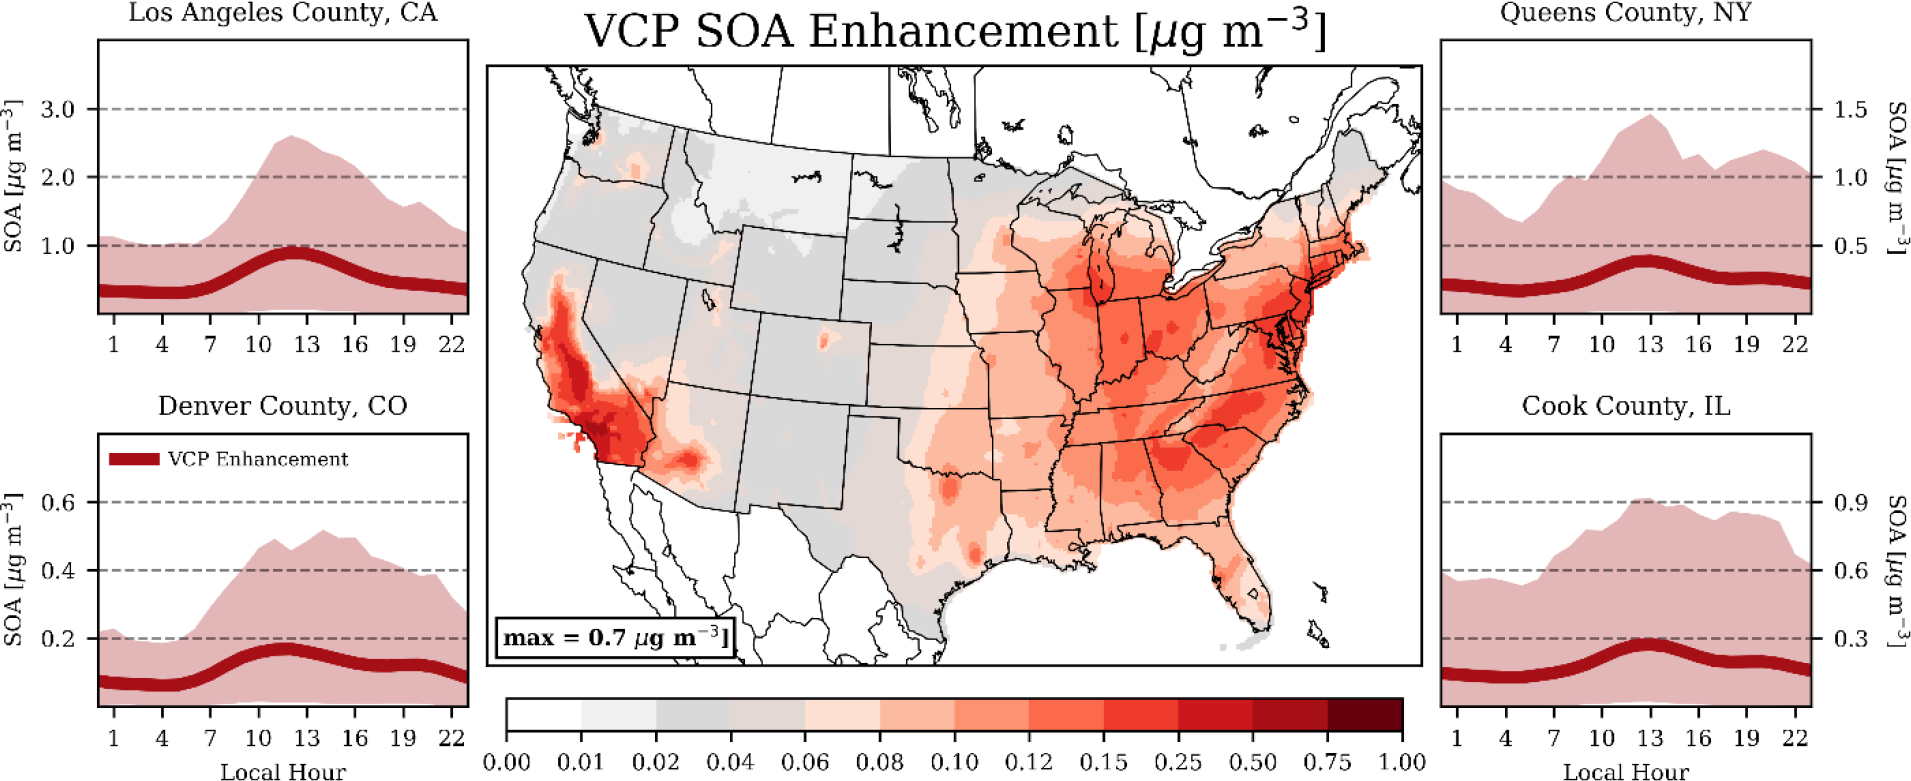
(Center) Annual-average SOA enhancements attributable to VCP emissions. (Side Panels) Diurnal, population-weighted SOA enhancements attributable to VCP emissions for select counties. Line indicates the average VCP enhancements for each hour and shading represents the VCP enhancements for 95% of all days. Note: colormap is non-linear.
Seasonally, the magnitude of VCP-SOA enhancements was typically largest in the summer and fall months (Table S4), but the proportional contribution of VCPs to modeled SOA peaked in the cooler months (Table S5) when biogenic SOA is at a minimum. For example, the summer SOA enhancements in New York City (0.3 – 0.4 μg m−3) were ~2.5x higher than the winter enhancements on an absolute basis, but VCPs contributed less on a relative basis in summer (~15%) than winter (~22%). Diurnally, mean SOA enhancements peaked mid-afternoon along with photochemical intensity and fluctuated substantially from day-to-day (Fig. 2). In Los Angeles County, the population-weighted noontime-average SOA enhancement from VCPs was 0.9 μg m−3, and 95% of the individual days fall within a range of 0.1 – 2.6 μg m−3. Notably, these daily fluctuations were persistent during both the warmer and cooler months. Daily variation was pronounced in other major populations centers, as well (e.g., Denver, New York City, Chicago), suggesting the influence of VCPs on urban SOA could be a substantial component of PM2.5 on select days throughout the United States.
While the ambient PM2.5 enhancements from VCP emissions were dominated by SOA production, VCP chemistry can lead to the formation, or even reduction, of other PM2.5 components (Fig. 2 vs. Fig. S4). These changes are driven by the effect of VCPs on local radical concentrations. VCP emissions serve as a sink of hydroxyl via reaction, which reduce the formation of nitric acid and cascaded into marginally lower ammonium nitrate concentrations (generally < 0.01 μg m−3) throughout much of the United States. However, many urban cores are VOC-limited for O3 production in cooler months46. During the winter season, VCP emissions in these locations (e.g., Los Angeles, New York City, Detroit) generated O3, which enhanced photochemistry and can produce up to ~0.3 μg m−3 of additional ammonium nitrate on select days. Annually, VCP emissions enhanced total PM2.5 most in Southern California (Fig. S4) through the SOA formation pathway, with a net increase in the statewide population-weighted PM2.5 of ~5%. Elsewhere, VCPs enhanced total PM2.5 by ~3% in New York, New Jersey, and Connecticut, and 1 – 2% in most other states (Fig. S3).
The spatial pattern of MDA8 O3 enhancements from VCP emissions closely followed the SOA enhancements, but the relative effects were more localized and modest. Nationally, VCPs enhanced annual, population-weighted MDA8 O3 by 0.4 ppb, which is ~1% of the modeled total (Fig. S5). The largest statewide enhancement in the population-weighted annual-average MDA8 O3 was 1.2 ppb in California (~3% of the modeled total; Table S4–S5). In the South Coast Air Basin (SoCAB) counties, annual-average enhancements were higher and spanned 1.6 – 3.0 ppb (4 – 6% of the modeled total). These average increases, however, do mask the relative importance of VCPs to O3 on select days. For example, VCPs occasionally enhanced middle-of-the-day O3 in Los Angeles County by 6–8 ppb (Fig. 3). Additionally, VCPs fractionally enhanced MDA8 O3 to a greater degree on high ozone days in these urban centers. On average, VCPs enhanced MDA8 O3 in SoCAB by ~4% when the daily MDA8 O3 was less than 50 ppb and by ~7% when the daily MDA8 O3 was greater than 60 ppb. MDA8 O3 in the New York City region was also sensitive to VCP emissions. Annual enhancements of MDA8 O3 averaged ~0.8 ppb in this region (2 – 3% of the modeled total), with larger contributions again on high ozone days. VCPs enhanced MDA8 O3 in NYC by ~2% when the daily MDA8 O3 was less than 50 ppb and by ~3% when the daily MDA8 O3 was greater than 60 ppb. Outside California, the Northeast, and the upper Midwest, MDA8 O3 enhancements from VCPs were minor, with most states indicating annual increases in population-weighted MDA8 O3 of 0.1 – 0.2 ppb due to VCP usage.
Figure 3.
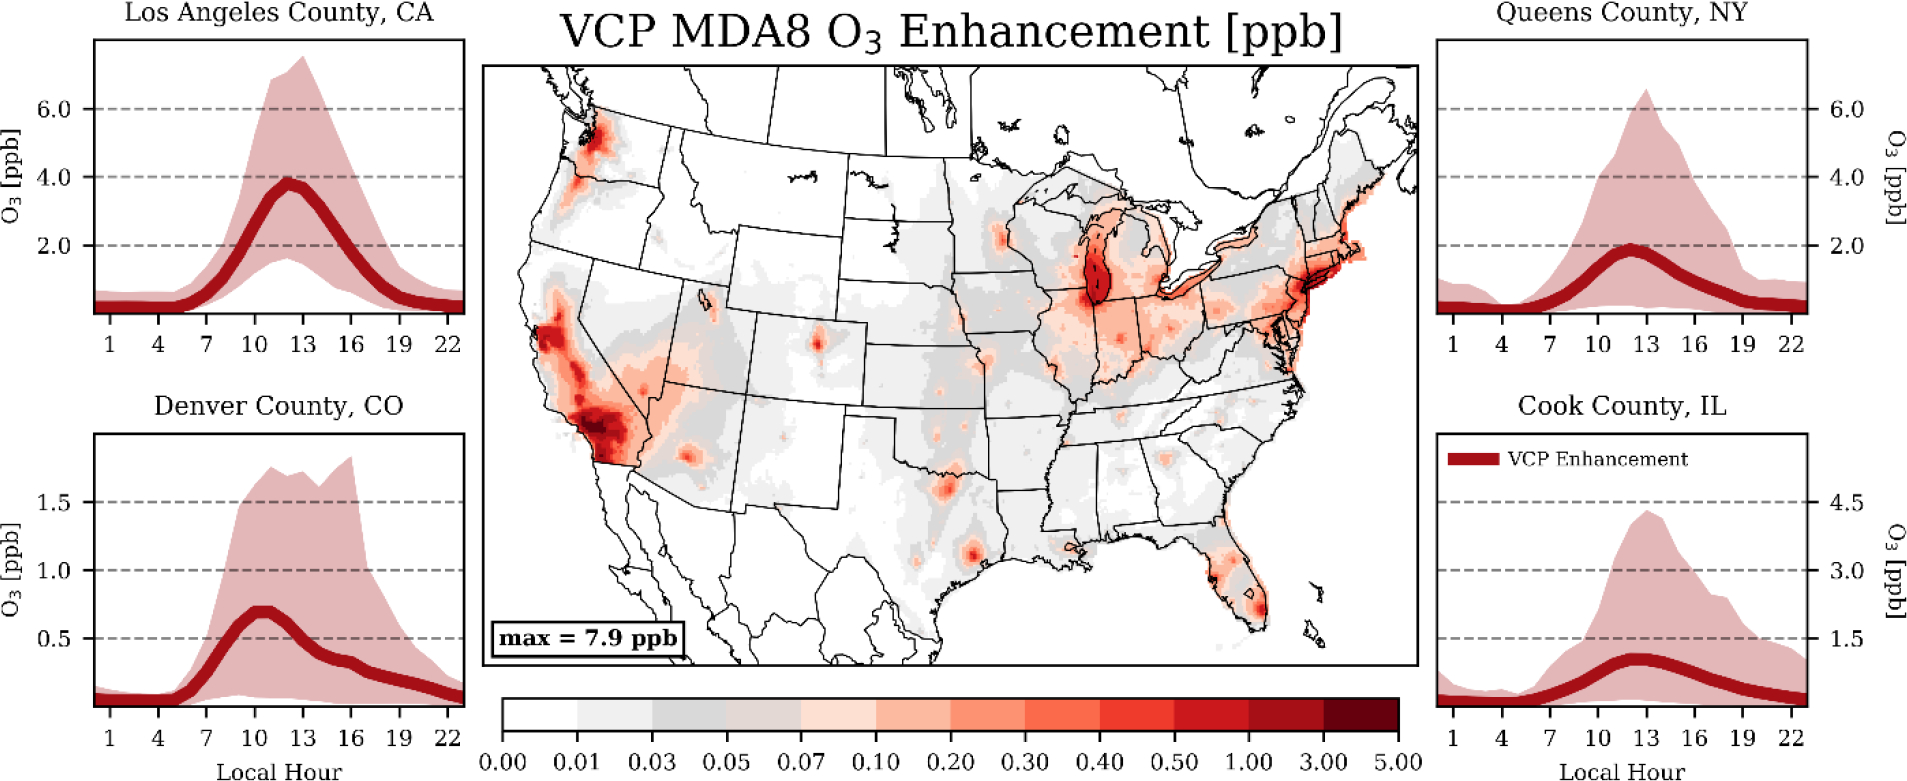
(Center) Summertime-average MDA8 O3 enhancements attributable to VCP emissions. (Side Panels) Diurnal, population-weighted O3 enhancements attributable to VCP emissions for select counties. Line indicates the average VCP enhancements for each hour and shading represents the VCP enhancements for 95% of all days. Note: colormap is non-linear.
The influence of VCP emissions on O3 peaked in the summer and in urban centers where NOx emissions were highest (Fig. 3). Southern California again experienced the largest enhancement, with summer MDA8 O3 increasing by 1.7 – 5.8 ppb (4 – 8%), on average, in the SoCAB counties. Summertime enhancements in the New York City region averaged ~1.5 ppb, which is 3 – 4% of the modeled total. While the magnitude of peak O3 enhancements in the summertime were greater than in the winter, the effects of VCP emissions on O3 were more widespread in the cooler months (Table S4). The peak county-level increase in MDA8 O3 in the summer and winter season were 5.8 ppb (San Bernardino, California) and 1.5 ppb (Orange County, California), respectively. However, the median county-level increase of MDA8 O3 in the winter was ~5x the median county-level increase in the summer, reflecting the more localized nature of VCP impacts on summer O3.
Product Use Category Contributions to SOA and MDA8 O3
Variability in the chemical composition and subsequent speciated emissions of VCP categories generated considerable differences in contributions to SOA enhancements by PUC (Fig. 4). Annual average, population-weighted SOA enhancements were largely driven by emissions from Printing Inks, Cleaning Products, and Paints & Coatings, with smaller contributions from Pesticides, Adhesives & Sealants, and Personal Care Products. The Printing Ink emissions profile used here contained large quantities of IVOC alkanes (C12-C16 hydrocarbons, represented by n-Tetradecane here) and toluene, Cleaning Products are rich in fragrances (represented by terpenes, such as limonene, here), and Paints & Coatings have an assortment of straight, branched, and cyclic IVOC alkanes, as well as toluene and xylenes in their composition. While Personal Care Products were responsible for ~20% of national VCP emissions, their contributions to SOA were predicted to be small (~6%). Siloxanes are a significant potential source of SOA in Personal Care Products, but oxidize slowly (kOH = 1.55 × 10⁻¹² cm3 molec.−1 s−1) and thus generate little SOA in the source region.
Figure 4.
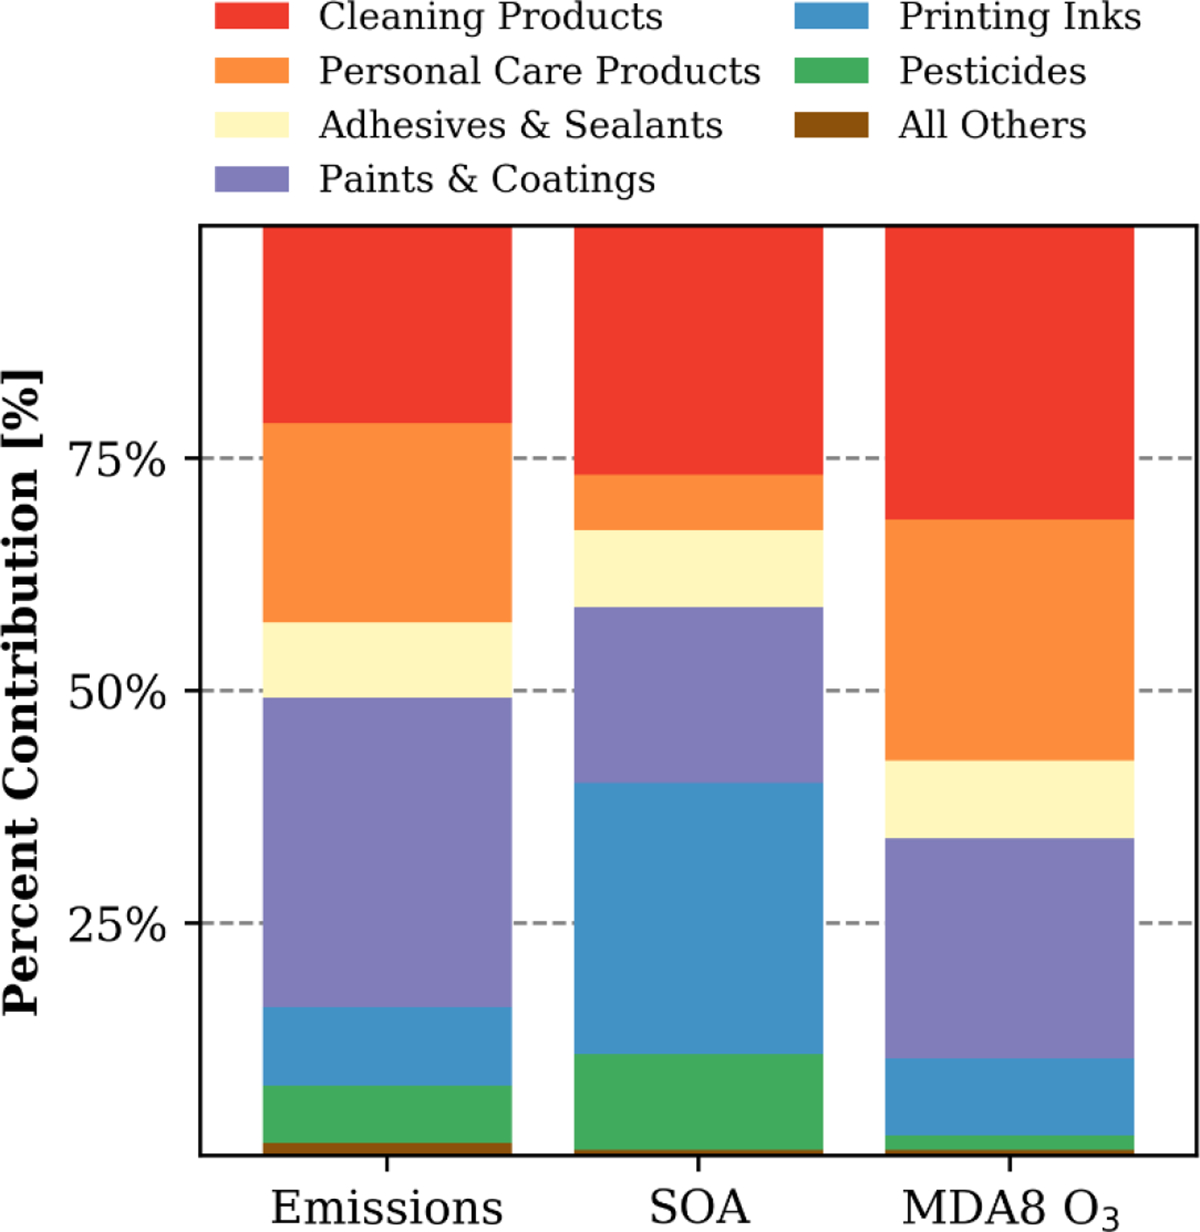
Percent contributions to national emissions, population-weighted, annual average SOA concentrations, and population-weighted, summertime average MDA8 O3 concentrations by Product Use Category for the VCP sector.
In contrast, contributions to the summertime averaged, population-weighted MDA8 O3 from each VCP category were closely correlated with emissions magnitude. Cleaning Products, Paints & Coatings, and Personal Care Products contributed ~76% of the total VCP emissions considered here and made up the bulk (~81%) of the MDA8 O3 enhancements. The contributions from both Cleaning Products and Personal Care Products were driven by fragrances and glycols. Glycols and glycol ethers drove the response from architectural coatings, and toluene and xylene were the main contributors for aerosol and industrial coatings. The MDA8 O3 contributions from both Adhesives & Sealants and Printing Inks were roughly proportional to their emissions magnitude. Lastly, emissions from pesticides and all other categories (i.e., dry-cleaning, solvent usage in oil and gas operations, lighter fluids, and other miscellaneous products) together contribute ~2% of the MDA8 O3 enhancement.
Possible Role of SVOC Evaporation on Ambient SOA
An emissions rate of ~0.355 kg person−1 year−1 of a SVOC model species with an effective SOA yield of 65% leads to ~114 Gg of ROC emissions and ~74 Gg of SOA potential. Following allocation of this SVOC using population density, the national-level, annual-average VCP-SOA increased ~8 – 17%, with the highest absolute increases over Southern California and New York City (Fig. S6). These emissions led to non-negligible average SOA enhancements in urban centers (0.1 – 0.2 μg m−3 in summer months) and increased summer, county-level VCP-SOA by 13 – 27% (maximum of 34%). While these emissions might be a potentially important source of VCP-SOA, their inclusion did not systematically improve the predictions of OC (Fig. S6). The biggest improvements occurred in the southwestern summer and throughout the contiguous United States in the fall months. However, there was added high bias in the northeastern and midwestern winter (Fig. 1 vs. Fig. S6). Since VCP emissions are correlated with population density26, 47 and low bias in modeled OC often manifests in locations with low population (i.e., the northwest and Great Plains), this suggests missing VCP sources that scale nationally cannot alone explain the remaining differences between model predictions and observations. Other drivers of modeled OC bias could include VCP sources that are regional in nature (e.g., agricultural pesticides, solvent usage in oil and gas operations)9, other sectors that are regional in nature (e.g., residential wood combustion)48, systematic biases in meteorological input, or missing SOA production pathways within CMAQ.
DISCUSSION
The results shown here indicate that VCPs enhance multiple criteria pollutants throughout the contiguous United States and are particularly impactful in populated cities. Of the criteria pollutants and their sub-components, VCPs most enhance anthropogenic SOA, which has historically been low biased in CTMs unless empirical representations of missing emissions and chemistry are added. While modeled OC performance improves when VCP emissions and SOA formation pathways are added, additional work is needed to further enhance the robustness of SOA predictions from VCPs. For example, due to data limitations, several of the product composition profiles used here are older (e.g., Printing Inks and Industrial Coatings) and their assumed composition might not reflect present-day formulations. A separate, but equally old Printing Ink composite profile from CARB’s organic profile database has an estimated effective SOA yield that is ~60% lower than what was used here. In addition, the alkane-like IVOC SOA parameterization implemented here was based on calculated precursor saturation concentration (C*) and did not consider the effect of compound structure on SOA yield49, 50. Oxygenated-IVOCs, which contribute ~6.5% of VCP emissions, are understudied SOA precursors and represented with a simple parameterization. Some chamber studies suggest these compounds may have substantially higher yields (10 – 100%51, 52) than what was assumed here (4.5%). The effects of chamber wall loss53, 54 and NOx-dependence55 on estimated SOA yields could also modify the magnitude of the VCP-SOA response. Furthermore, field studies that deploy instrumentation capable of detecting VCP-tracer compounds26 will help constrain the overall magnitude and trends of VCP emissions, as well as provide insight into additional seasonal and diurnal patterns of emission.
In the future, if emissions from the mobile sector continue their multi-decade decline, VCPs will inherit a growing proportion of the anthropogenic ROC emissions burden. Even at near-present emission conditions, the VCP IVOC emissions modeled here generate greater population-weighted SOA concentrations than mobile IVOC emissions. Future implications of VCP emissions on ozone air quality are less clear and thus are deserving of attention. Most summertime O3 production in the United States occurs under NOx-limited conditions, except for a few major urban areas (Los Angeles, Chicago, and New York56) where VCPs currently have large impacts. As NOx emissions are further reduced, even these NOx-saturated locations could become NOx-limited. However, many urban regions shift to NOx-saturated conditions during the winter57. Several epidemiological studies have indicated that annual exposure to ozone can have deleterious impacts on human-health5, 58, which suggests ozone mitigation strategies could indicate an increasing effectiveness of controlling ROC from VCPs.
In addition to criteria pollutants, oxidation of VCP emissions in the atmosphere can lead to other toxic compounds, such as formaldehyde (Fig. S3). In southern California and the New York City region, VCP emissions enhance modeled formaldehyde by 5 – 7% and 3 – 4%, respectively. These multiphase pollution endpoints (i.e., particle-phase, SOA, and gas-phase, O3 and HCHO), as well as the seasonal ammonium nitrate response previously discussed, underscore the need for chemical mechanisms that more tightly couple gas- and aerosol-phase chemistry, thus accommodating important but less recognized feedbacks. Such considerations will only increase in importance as additional chemistry updates (e.g., autoxidation, particulate organic nitrates, oligomerization) are incorporated into CTMs.
Supplementary Material
Synopsis:
Volatile chemical products are anthropogenic sources of reactive organic carbon emissions that enhance fine particulate matter and ozone throughout the United States.
ACKNOWLEDGEMENTS
The authors would like to thank Venkatesh Rao, Alison Eyth, Wyat Appel, Heather Simon, Norm Possiel, Art Diem, and George Pouliot at the U.S. EPA, Kyriacos Kyriacou at the California Air Resources Board, and Georgios Gkatzelis, Carsten Warneke, and Matthew Coggon at the National Oceanic and Atmospheric Administration Chemical Sciences Laboratory/Cooperative Institute for Research in Environmental Sciences at the University of Colorado, Boulder for helpful discussions and/or data acquisition. Comments by Heather Simon (EPA), Ivan Piletic (EPA), and three anonymous reviewers served to strengthen this manuscript.
Funding Sources
This research was supported in part by an appointment to the U.S. Environmental Protection Agency (EPA) Research Participation Program administered by the Oak Ridge Institute for Science and Education (ORISE) through an interagency agreement between the U.S. Department of Energy (DOE) and the U.S. Environmental Protection Agency. ORISE is managed by ORAU under DOE contract number DE-SC0014664. All opinions expressed in this paper are the author’s and do not necessarily reflect the policies and views of US EPA, DOE, or ORAU/ORISE.
Footnotes
The authors declare no competing financial interest.
Although this work was contributed by research staff in the Environmental Protection Agency and has been reviewed and approved for publication, it does not reflect official policy of the EPA. The views expressed in this document are solely those of authors and do not necessarily reflect those of the Agency. EPA does not endorse any products or commercial services mentioned in this publication.
ASSOCIATED CONTENT
Supporting Information. The Supporting Information associated with this manuscript is available free of charge at: (to be added later). Supporting data related to this manuscript is available at https://doi.org/10.23719/1522651.
Compound mapping, speciation updates, allocation assignments, supplemental data for main text figures, sector emissions profile, standard CMAQ evaluation, VCP contributions to ambient pollutants, annual VCP enhancements, SVOC potential emissions plots.
REFERENCES
- 1.Heald CL; Kroll JH, The fuel of atmospheric chemistry: Toward a complete description of reactive organic carbon. Sci Adv 2020, 6 (6). [DOI] [PMC free article] [PubMed] [Google Scholar]
- 2.Safieddine SA; Heald CL; Henderson BH, The global nonmethane reactive organic carbon budget: A modeling perspective. Geophys Res Lett 2017, 44 (8), 3897–3906. [Google Scholar]
- 3.Di Q; Wang Y; Zanobetti A; Wang Y; Koutrakis P; Choirat C; Dominici F; Schwartz JD, Air Pollution and Mortality in the Medicare Population. New Engl J Med 2017, 376 (26), 2513–2522. [DOI] [PMC free article] [PubMed] [Google Scholar]
- 4.Pye HOT; Ward-Caviness CK; Murphy BN; Appel KW; Seltzer KM, Secondary organic aerosol association with cardiorespiratory disease mortality in the United States. in review. 2021. [DOI] [PMC free article] [PubMed] [Google Scholar]
- 5.Turner MC; Jerrett M; Pope CA; Krewski D; Gapstur SM; Diver WR; Beckerman BS; Marshall JD; Su J; Crouse DL; Burnett RT, Long-Term Ozone Exposure and Mortality in a Large Prospective Study. Am J Resp Crit Care 2016, 193 (10), 1134–1142. [DOI] [PMC free article] [PubMed] [Google Scholar]
- 6.U.S. EPA Integrated Science Assessment for Ozone and Related Photochemical Oxidants; Office of Research and Development – Center for Public Health & Environmental Assessment – RTP: 2020. [Google Scholar]
- 7.U.S. EPA Integrated Science Assessment for Particulate Matter; Office of Research and Development – Center for Public Health & Environmental Assessment – RTP: December 2019, 2019. [Google Scholar]
- 8.McDonald BC; de Gouw JA; Gilman JB; Jathar SH; Akherati A; Cappa CD; Jimenez JL; Lee-Taylor J; Hayes PL; McKeen SA; Cui YY; Kim SW; Gentner DR; Isaacman-VanWertz G; Goldstein AH; Harley RA; Frost GJ; Roberts JM; Ryerson TB; Trainer M, Volatile chemical products emerging as largest petrochemical source of urban organic emissions. Science 2018, 359 (6377), 760–764. [DOI] [PubMed] [Google Scholar]
- 9.Seltzer KM; Pennington E; Rao V; Murphy BN; Strum M; Isaacs KK; Pye HOT, Reactive organic carbon emissions from volatile chemical products. Atmos Chem Phys 2021, 21 (6), 5079–5100. [DOI] [PMC free article] [PubMed] [Google Scholar]
- 10.Gkatzelis GI; Coggon MM; McDonald BC; Peischl J; Gilman JB; Aikin KC; Robinson MA; Canonaco F; Prevot ASH; Trainer M; Warneke C, Observations Confirm that Volatile Chemical Products Are a Major Source of Petrochemical Emissions in U.S. Cities. Environ Sci Technol 2021, 55 (8), 4332–4343. [DOI] [PubMed] [Google Scholar]
- 11.Khare P; Gentner DR, Considering the future of anthropogenic gas-phase organic compound emissions and the increasing influence of non-combustion sources on urban air quality. Atmos Chem Phys 2018, 18 (8), 5391–5413. [Google Scholar]
- 12.Robinson AL; Donahue NM; Shrivastava MK; Weitkamp EA; Sage AM; Grieshop AP; Lane TE; Pierce JR; Pandis SN, Rethinking organic aerosols: Semivolatile emissions and photochemical aging. Science 2007, 315 (5816), 1259–1262. [DOI] [PubMed] [Google Scholar]
- 13.Zhao YL; Hennigan CJ; May AA; Tkacik DS; de Gouw JA; Gilman JB; Kuster WC; Borbon A; Robinson AL, Intermediate-Volatility Organic Compounds: A Large Source of Secondary Organic Aerosol. Environ Sci Technol 2014, 48 (23), 13743–13750. [DOI] [PubMed] [Google Scholar]
- 14.Qin MM; Murphy BN; Isaacs KK; McDonald BC; Lu QY; McKeen SA; Koval L; Robinson AL; Efstathiou C; Allen C; Pye HOT, Criteria pollutant impacts of volatile chemical products informed by near-field modelling. Nat Sustain 2021, 4, 129–137. [DOI] [PMC free article] [PubMed] [Google Scholar]
- 15.Bishop GA; Stedman DH, A decade of on-road emissions measurements. Environ Sci Technol 2008, 42 (5), 1651–1656. [DOI] [PubMed] [Google Scholar]
- 16.McDonald BC; Gentner DR; Goldstein AH; Harley RA, Long-Term Trends in Motor Vehicle Emissions in US Urban Areas. Environ Sci Technol 2013, 47 (17), 10022–10031. [DOI] [PubMed] [Google Scholar]
- 17.Baker KR; Carlton AG; Kleindienst TE; Offenberg JH; Beaver MR; Gentner DR; Goldstein AH; Hayes PL; Jimenez JL; Gilman JB; de Gouw JA; Woody MC; Pye HOT; Kelly JT; Lewandowski M; Jaoui M; Stevens PS; Brune WH; Lin YH; Rubitschun CL; Surratt JD, Gas and aerosol carbon in California: comparison of measurements and model predictions in Pasadena and Bakersfield. Atmos Chem Phys 2015, 15 (9), 5243–5258. [Google Scholar]
- 18.Ensberg JJ; Hayes PL; Jimenez JL; Gilman JB; Kuster WC; de Gouw JA; Holloway JS; Gordon TD; Jathar S; Robinson AL; Seinfeld JH, Emission factor ratios SOA mass yields, and the impact of vehicular emissions on SOA formation. Atmos Chem Phys 2014, 14 (5), 2383–2397. [Google Scholar]
- 19.Woody MC; Baker KR; Hayes PL; Jimenez JL; Koo B; Pye HOT, Understanding sources of organic aerosol during CalNex-2010 using the CMAQ-VBS. Atmos Chem Phys 2016, 16 (6), 4081–4100. [Google Scholar]
- 20.Murphy BN; Woody MC; Jimenez JL; Carlton AMG; Hayes PL; Liu S; Ng NL; Russell LM; Setyan A; Xu L; Young J; Zaveri RA; Zhang Q; Pye HOT, Semivolatile POA and parameterized total combustion SOA in CMAQv5.2: impacts on source strength and partitioning. Atmos Chem Phys 2017, 17 (18), 11107–11133. [DOI] [PMC free article] [PubMed] [Google Scholar]
- 21.Pennington EA; Seltzer KM; Murphy BN; Qin M; Seinfeld JH; Pye HOT, Modeling secondary organic aerosol formation from volatile chemical products. Atmos Chem Phys Discuss 2021. [DOI] [PMC free article] [PubMed] [Google Scholar]
- 22.California Air Resources Board Organic Gas Speciation Profiles for Consumer Products (2020 Update); Air Quality Planning and Science Division: 2020. [Google Scholar]
- 23.Nazaroff WW; Weschler CJ, Cleaning products and air fresheners: exposure to primary and secondary air pollutants. Atmos Environ 2004, 38 (18), 2841–2865. [Google Scholar]
- 24.Singer BC; Hodgson AT; Hotchi T; Ming KY; Sextro RG; Wood EE; Brown NJ, Sorption of organic gases in residential rooms. Atmos Environ 2007, 41 (15), 3251–3265. [Google Scholar]
- 25.Singer BC; Revzan KL; Hotchi T; Hodgson AT; Brown NJ, Sorption of organic gases in a furnished room. Atmos Environ 2004, 38 (16), 2483–2494. [Google Scholar]
- 26.Gkatzelis GI; Coggon MM; McDonald BC; Peischl J; Aikin KC; Gilman JB; Trainer M; Warneke C, Identifying Volatile Chemical Product Tracer Compounds in US Cities. Environ Sci Technol 2021, 55 (1), 188–199. [DOI] [PubMed] [Google Scholar]
- 27.Lu QY; Zhao YL; Robinson AL, Comprehensive organic emission profiles for gasoline, diesel, and gas-turbine engines including intermediate and semi-volatile organic compound emissions. Atmos Chem Phys 2018, 18 (23), 17637–17654. [Google Scholar]
- 28.Lu QY; Murphy BN; Qin MM; Adams P; Zhao YL; Pye HOT; Efstathiou C; Allen C; Robinson AL, Simulation of organic aerosol formation during the CalNex study: updated mobile emissions and secondary organic aerosol parameterization for intermediate-volatility organic compounds. Atmos Chem Phys 2020, 20 (7), 4313–4332. [DOI] [PMC free article] [PubMed] [Google Scholar]
- 29.U.S. EPA Preparation of Emissions Inventories for the 2016v1 North American Emissions Modeling Platform, Technical Support Document (TSD); Office of Air Quality Planning and Standards, Air Quality Assessment Division, Emissions Inventory and Analysis Group: 2021. [Google Scholar]
- 30.Appel KW; Bash JO; Fahey KM; Foley KM; Gilliam RC; Hogrefe C; Hutzell WT; Kang D; Mathur R; Murphy BN; Napelnok SL; Nolte CG; Pleim JE; Pouliot GA; Pye HOT; Ran L; Roselle SJ; Sarwar G; Schwede DB; Sidi FI; Spero TL; Wong DC, The Community Multiscale Air Quality (CMAQ) model versions 5.3 and 5.3.1: system updates and evaluation. Geosci Model Dev 2021, 14, 2867–2897. [DOI] [PMC free article] [PubMed] [Google Scholar]
- 31.Isaacs KK; Glen WG; Egeghy P; Goldsmith MR; Smith L; Vallero D; Brooks R; Grulke CM; Ozkaynak H, SHEDS-HT: An Integrated Probabilistic Exposure Model for Prioritizing Exposures to Chemicals with Near-Field and Dietary Sources. Environ Sci Technol 2014, 48 (21), 12750–12759. [DOI] [PubMed] [Google Scholar]
- 32.Pleim JE; Ran LM; Appel W; Shephard MW; Cady-Pereira K, New Bidirectional Ammonia Flux Model in an Air Quality Model Coupled With an Agricultural Model. J Adv Model Earth Sy 2019, 11 (9), 2934–2957. [DOI] [PMC free article] [PubMed] [Google Scholar]
- 33.Bash JO; Baker KR; Beaver MR, Evaluation of improved land use and canopy representation in BEIS v3.61 with biogenic VOC measurements in California. Geosci Model Dev 2016, 9 (6), 2191–2207. [Google Scholar]
- 34.Kang DW; Foley KM; Mathur R; Roselle SJ; Pickering KE; Allen DJ, Simulating lightning NO production in CMAQv5.2: performance evaluations. Geosci Model Dev 2019, 12 (10), 4409–4424. [DOI] [PMC free article] [PubMed] [Google Scholar]
- 35.Kang DW; Pickering KE; Allen DJ; Foley KM; Wong DC; Mathur R; Roselle SJ, Simulating lightning NO production in CMAQv5.2: evolution of scientific updates. Geosci Model Dev 2019, 12 (7), 3071–3083. [DOI] [PMC free article] [PubMed] [Google Scholar]
- 36.Yarwood G; Whitten GZ; Jung J; Heo G; Allen DT Development, Evaluation and Testing of Version 6 of the Carbon Bond Chemical Mechanism (CB6); ENVIRON International Corporation: 2010. [Google Scholar]
- 37.Sarwar G; Gantt B; Foley K; Fahey K; Spero TL; Kang DW; Mathur R; Foroutan H; Xing J; Sherwen T; Saiz-Lopez A, Influence of bromine and iodine chemistry on annual, seasonal, diurnal, and background ozone: CMAQ simulations over the Northern Hemisphere. Atmos Environ 2019, 213, 395–404. [DOI] [PMC free article] [PubMed] [Google Scholar]
- 38.Murphy BN; Nolte CG; Sidi F; Bash JO; Appel KW; Jang C; Kang D; Kelly J; Mathur R; Napelnok S; Pouliot G; Pye HOT, The Detailed Emissions Scaling, Isolation, and Diagnostic (DESID) module in the Community Multiscale Air Quality (CMAQ) Modeling System version 5.3. Geoscientific Model Development Discussions 2020. [DOI] [PMC free article] [PubMed] [Google Scholar]
- 39.Ryerson TB; Andrews AE; Angevine WM; Bates TS; Brock CA; Cairns B; Cohen RC; Cooper OR; de Gouw JA; Fehsenfeld FC; Ferrare RA; Fischer ML; Flagan RC; Goldstein AH; Hair JW; Hardesty RM; Hostetler CA; Jimenez JL; Langford AO; McCauley E; McKeen SA; Molina LT; Nenes A; Oltmans SJ; Parrish DD; Pederson JR; Pierce RB; Prather K; Quinn PK; Seinfeld JH; Senff CJ; Sorooshian A; Stutz J; Surratt JD; Trainer M; Volkamer R; Williams EJ; Wofsy SC, The 2010 California Research at the Nexus of Air Quality and Climate Change (CalNex) field study. J Geophys Res-Atmos 2013, 118 (11), 5830–5866. [Google Scholar]
- 40.Appel KW; Gilliam RC; Davis N; Zubrow A; Howard SC, Overview of the atmospheric model evaluation tool (AMET) v1.1 for evaluating meteorological and air quality models. Environ Modell Softw 2011, 26 (4), 434–443. [Google Scholar]
- 41.Emery C; Liu Z; Russell AG; Odman MT; Yarwood G; Kumar N, Recommendations on statistics and benchmarks to assess photochemical model performance. J Air Waste Manage 2017, 67 (5), 582–598. [DOI] [PubMed] [Google Scholar]
- 42.Kelly JT; Koplitz SN; Baker KR; Holder AL; Pye HOT; Murphy BN; Bash JO; Henderson BH; Possiel NC; Simon H; Eyth AM; Jang C; Phillips S; Timin B, Assessing PM2.5 model performance for the conterminous U.S. with comparison to model performance statistics from 2007–2015. Atmos Environ 2019, 214 (1). [DOI] [PMC free article] [PubMed] [Google Scholar]
- 43.Clifton OE; Lombardozzi DL; Fiore AM; Paulot F; Horowitz LW, Stomatal conductance influences interannual variability and long-term changes in regional cumulative plant uptake of ozone. Environ Res Lett 2020, 15 (11). [Google Scholar]
- 44.Clifton OE; Fiore AM; Munger JW; Malyshev S; Horowitz LW; Shevliakova E; Paulot F; Murray LT; Griffin KL, Interannual variability in ozone removal by a temperate deciduous forest. Geophys Res Lett 2017, 44 (1), 542–552. [Google Scholar]
- 45.Baublitz CB; Fiore AM; Clifton OE; Mao JQ; Li JY; Correa G; Westervelt DM; Horowitz LW; Paulot F; Williams AP, Sensitivity of Tropospheric Ozone Over the Southeast USA to Dry Deposition. Geophys Res Lett 2020, 47 (7). [Google Scholar]
- 46.Simon H; Reff A; Wells B; Xing J; Frank N, Ozone Trends Across the United States over a Period of Decreasing NOx and VOC Emissions. Environ Sci Technol 2015, 49 (1), 186–195. [DOI] [PubMed] [Google Scholar]
- 47.Coggon MM; McDonald BC; Vlasenko A; Veres PR; Bernard F; Koss AR; Yuan B; Gilman JB; Peischl J; Aikin KC; DuRant J; Warneke C; Li SM; de Gouw JA, Diurnal Variability and Emission Pattern of Decamethylcyclopentasiloxane (D-5) from the Application of Personal Care Products in Two North American Cities. Environ Sci Technol 2018, 52 (10), 5610–5618. [DOI] [PubMed] [Google Scholar]
- 48.U.S. EPA 2017 National Emissions Inventory: January 2021 Updated Release, Technical Support Document Office of Air Quality Planning and Standards, Air Quality Assessment Division, Emissions Inventory and Analysis Group: 2021. [Google Scholar]
- 49.Lim YB; Ziemann PJ, Effects of Molecular Structure on Aerosol Yields from OH Radical-Initiated Reactions of Linear, Branched, and Cyclic Alkanes in the Presence of NOx. Environ Sci Technol 2009, 43 (7), 2328–2334. [DOI] [PubMed] [Google Scholar]
- 50.Tkacik DS; Presto AA; Donahue NM; Robinson AL, Secondary Organic Aerosol Formation from Intermediate-Volatility Organic Compounds: Cyclic, Linear, and Branched Alkanes. Environ Sci Technol 2012, 46 (16), 8773–8781. [DOI] [PubMed] [Google Scholar]
- 51.Charan SM; Buenconsejo RS; Seinfeld JH, Secondary organic aerosol yields from the oxidation of benzyl alcohol. Atmos Chem Phys 2021, 20 (21), 13167–13190. [Google Scholar]
- 52.Li WH; Li LJ; Chen CL; Kacarab M; Peng WH; Price D; Xu J; Cocker DR, Potential of select intermediate-volatility organic compounds and consumer products for secondary organic aerosol and ozone formation under relevant urban conditions. Atmos Environ 2018, 178, 109–117. [Google Scholar]
- 53.Krechmer JE; Pagonis D; Ziemann PJ; Jimenez JL, Quantification of Gas-Wall Partitioning in Teflon Environmental Chambers Using Rapid Bursts of Low-Volatility Oxidized Species Generated in Situ. Environ Sci Technol 2016, 50 (11), 5757–5765. [DOI] [PubMed] [Google Scholar]
- 54.Matsunaga A; Ziemann PJ, Gas-Wall Partitioning of Organic Compounds in a Teflon Film Chamber and Potential Effects on Reaction Product and Aerosol Yield Measurements. Aerosol Sci Tech 2010, 44 (10), 881–892. [Google Scholar]
- 55.Chuang WK; Donahue NM, A two-dimensional volatility basis set - Part 3: Prognostic modeling and NOx dependence. Atmos Chem Phys 2016, 16 (1), 123–134. [Google Scholar]
- 56.Jin X; Fiore A; Boersma KF; De Smedt I; Valin L, Inferring Changes in Summertime Surface Ozone–NOx–VOC Chemistry over U.S. Urban Areas from Two Decades of Satellite and Ground-Based Observations. Environ Sci Technol 2020, 54 (11), 6518–6529. [DOI] [PMC free article] [PubMed] [Google Scholar]
- 57.Jin XM; Fiore AM; Murray LT; Valin LC; Lamsal LN; Duncan B; Folkert Boersma K; De Smedt I; Abad GG; Chance K; Tonnesen GS, Evaluating a Space-Based Indicator of Surface Ozone-NOx-VOC Sensitivity Over Midlatitude Source Regions and Application to Decadal Trends. J Geophys Res-Atmos 2017, 122 (19), 10231–10253. [DOI] [PMC free article] [PubMed] [Google Scholar]
- 58.Lim CC; Hayes RB; Ahn J; Shao YZ; Silverman DT; Jones RR; Garcia C; Bell ML; Thurston GD, Long-Term Exposure to Ozone and Cause-Specific Mortality Risk in the United States. Am J Resp Crit Care 2019, 200 (8), 1022–1031. [DOI] [PMC free article] [PubMed] [Google Scholar]
Associated Data
This section collects any data citations, data availability statements, or supplementary materials included in this article.