Summary paragraph
Cellular transformation induces phenotypically diverse populations of tumor-infiltrating T cells1, 2, 3, 4, 5, and immune checkpoint blockade therapies preferentially target T cells that recognize cancer cell neoantigens6, 7. Yet, how other classes of tumor-infiltrating T cells contribute to cancer immunosurveillance remains elusive. Here in a survey of T cells in murine and human malignancies, we rediscovered a population of αβ T cell receptor (TCR)-positive FCER1G-expressing innate-like T cells with high cytotoxic potential8, hereon termed ‘killer innate-like T cells’, or ILTCks. Broadly reactive to unmutated self antigens, ILTCks arose from distinct thymic progenitors following early encounter with cognate antigens, and were continuously replenished by thymic progenitors during tumor progression. Notably, expansion and effector differentiation of intratumoral ILTCks depended on interleukin-15 (IL-15) expression in cancer cells, and inducible activation of IL-15 signaling in adoptively transferred ILTCk progenitors suppressed tumor growth. Thus, antigen receptor self-reactivity, unique ontogeny, and distinct cancer cell-sensing mechanism distinguish ILTCks from conventional cytotoxic T lymphocytes as a new class of tumor-elicited immune response.
The concept of cancer immunosurveillance ascribes a role of cellular immunity in eliminating transformed cells with conventional CD8+ cytotoxic T lymphocytes being a primary mediator9, 10, 11 which nonetheless transition to a dysfunctional state of exhaustion characterized by expression of inhibitory receptors such as programmed death-1 (PD-1)12. Despite the clinical success of anti-PD-1 to revive cancer immunity, many patients do not respond to checkpoint blockade therapies13, 14, 15, calling for investigation of alternative mechanisms of cancer immunosurveillance.
ILTCks display a distinct transcriptome
To investigate the heterogeneity among tumor-infiltrating T cells, we performed single cell RNA-sequencing (scRNA-seq) analysis of CD45+TCRβ+CD8α+ cells from breast tumor tissues of MMTV-PyMT (PyMT) mice, which revealed five distinct clusters (Fig. 1a). Cluster 1 (C1) cells had relatively high expression of naïve T cell markers, such as Il7r and Tcf7 (Fig. 1b), representing recently activated T cells. Markers associated with T cell exhaustion, including Pdcd1 (encoding PD-1) and Tox, were highly expressed in C2 cells (Fig. 1b). C3 cells, characterized by high expression of Gzmb, Klrb1c (encoding NK1.1), and Fcer1g (Fig. 1b and Extended Data Fig. 1), represented the αβ TCR lineage killer innate-like T cells (αβILTCks) that we recently identified8. C4 cells expressed high levels of type I interferon stimulated genes, including Isg15 and Ifit3 (Ref16). C5 cells upregulated Mki67 and Top2a, suggesting their proliferative state. Thus, tumor-infiltrating CD8α+ T cells in PyMT mice exhibit diverse differentiation and proliferation states.
Figure 1. Characterization of tumor-infiltrating CD8+ T cells.
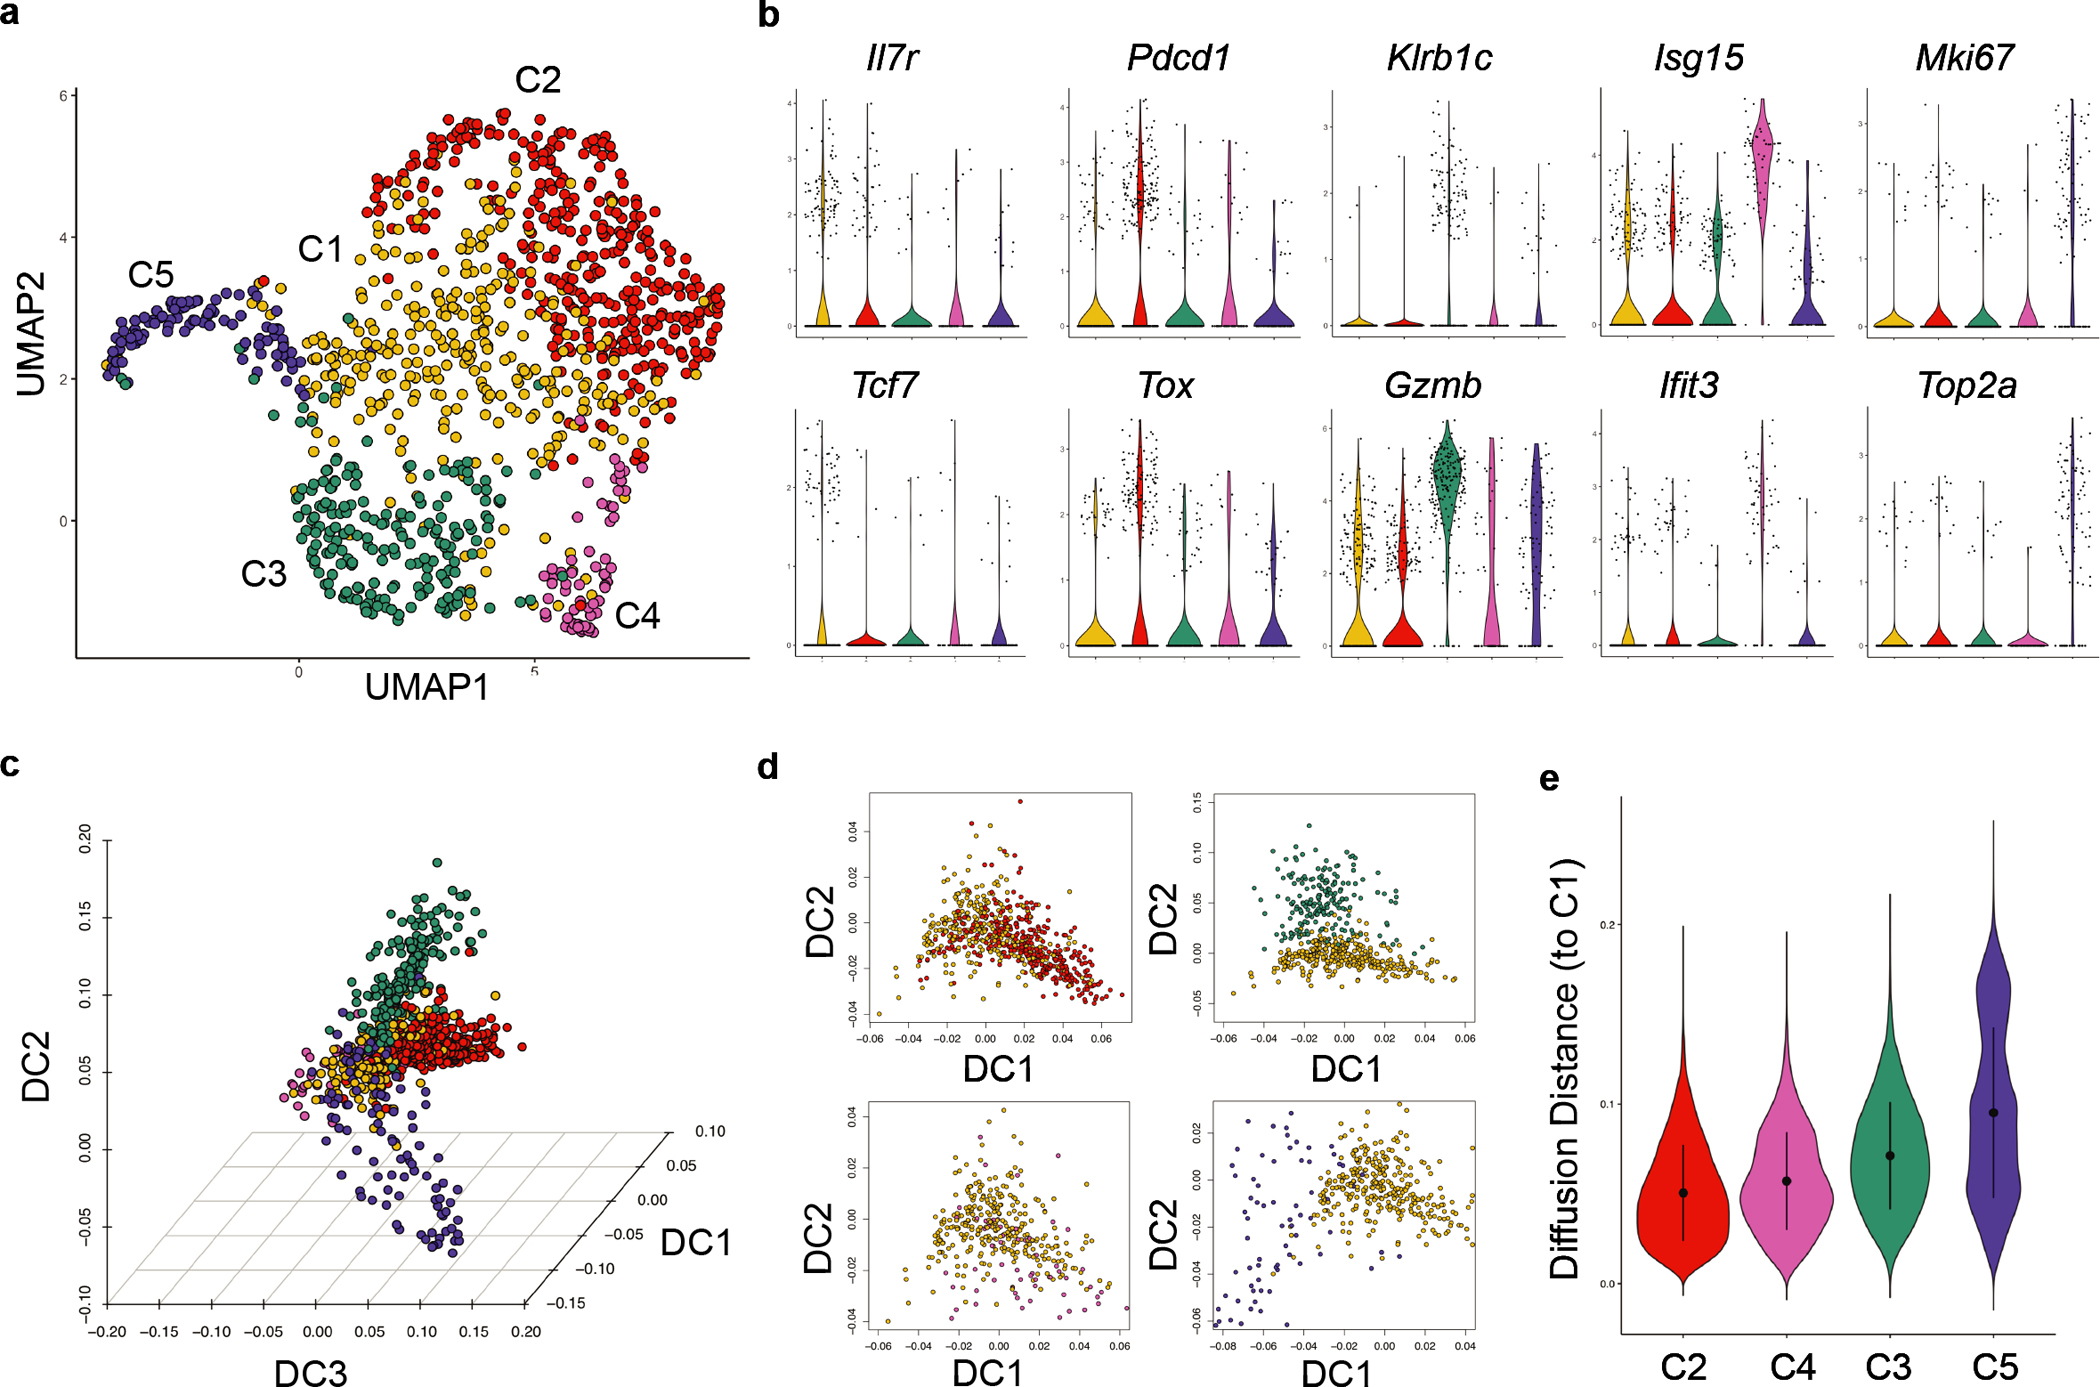
a, Uniform manifold approximation and projection (UMAP) of CD45+TCRβ+CD8α+ lymphocytes in breast tumor tissues from PyMT mice. Clusters (C) are denoted by color. b, Violin plots comparing expression of signature genes of indicated clusters. c, Three-dimensional diffusion embedding generated using clusters C1-C5 cells. d, Visualization of diffusion component (DC) analysis comparing the gene expression programs of cells from C2-C5 to that of C1 cells. e, Diffusion distance from C2-C5 cells to C1 cells. Statistical differences between the distribution of diffusion distances for each pair of clusters were calculated using a two-sided Wilcoxon test with P < 2.2e-16 between C2 and C4, C2 and C3, and C2 and C5.
To infer the potential differentiation trajectories, we computed a three-dimensional diffusion map embedding using all five clusters (Fig. 1c). We observed substantial mixing between recently activated (C1) and exhausted (C2) cells (Fig. 1d–e), reflecting phenotypic changes driven by chronic stimulation11, 12. In contrast, αβILTCks (C3) and proliferative (C5) cells were more distantly segregated from C1 (Fig. 1d–e). After correcting for ‘cell-cycle effects’, the hypothetical trajectory of recently activated-to-αβILTCk transition remained disparate from the well-established recently activated-to-exhausted T cell differentiation pathway (Extended Data Fig. 2a–b). Thus, C1 cells either give rise to C3 cells through a unique differentiation pathway, or are not their progenitors. Notably, a C3-like cluster of tumor-infiltrating CD8α+ T cells highly expressing the αβILTCk gene signature was reproducibly present in PyMT breast tumors and in a murine prostate cancer model (Extended Data Fig. 2c–h) as well as in human colorectal carcinoma4 (Extended Data Fig. 2i–k), together suggesting that the αβILTCk differentiation program represents an evolutionarily conserved tumor-elicited immune response.
ILTCks recognize unmutated tumor antigen
To interrogate how tumor-resident NK1.1+CD8α+ αβILTCks may be distinct from conventional PD-1+CD8α+ T cells (PD-1+ TCs), we obtained the profiles of paired-TCR sequences utilized by each subset (Extended Data Fig. 3a and Supplementary Table 1). While complementarity-determining region 3 (CDR3) lengths were comparable between NK1.1+ αβILTCk- and PD-1+ TC-derived TCRs (Extended Data Fig. 3b), discrete patterns of TCR usage were noted. Over 50% of PD-1+ TC TCR repertoire was attributed to five unique TCR pairs (Fig. 2a), reflecting their oligoclonal expansion17, 18. In contrast, NK1.1+ αβILTCk TCRs were largely polyclonal with moderate clonal expansion (Fig. 2a). Importantly, we did not detect any TCR pairs used by both NK1.1+ αβILTCks and PD-1+ TCs, suggesting against their development from a shared progenitor.
Figure 2. αβILTCk differentiation diverges from conventional CD8+ T cells during thymic development in a TCR-specificity dependent manner.
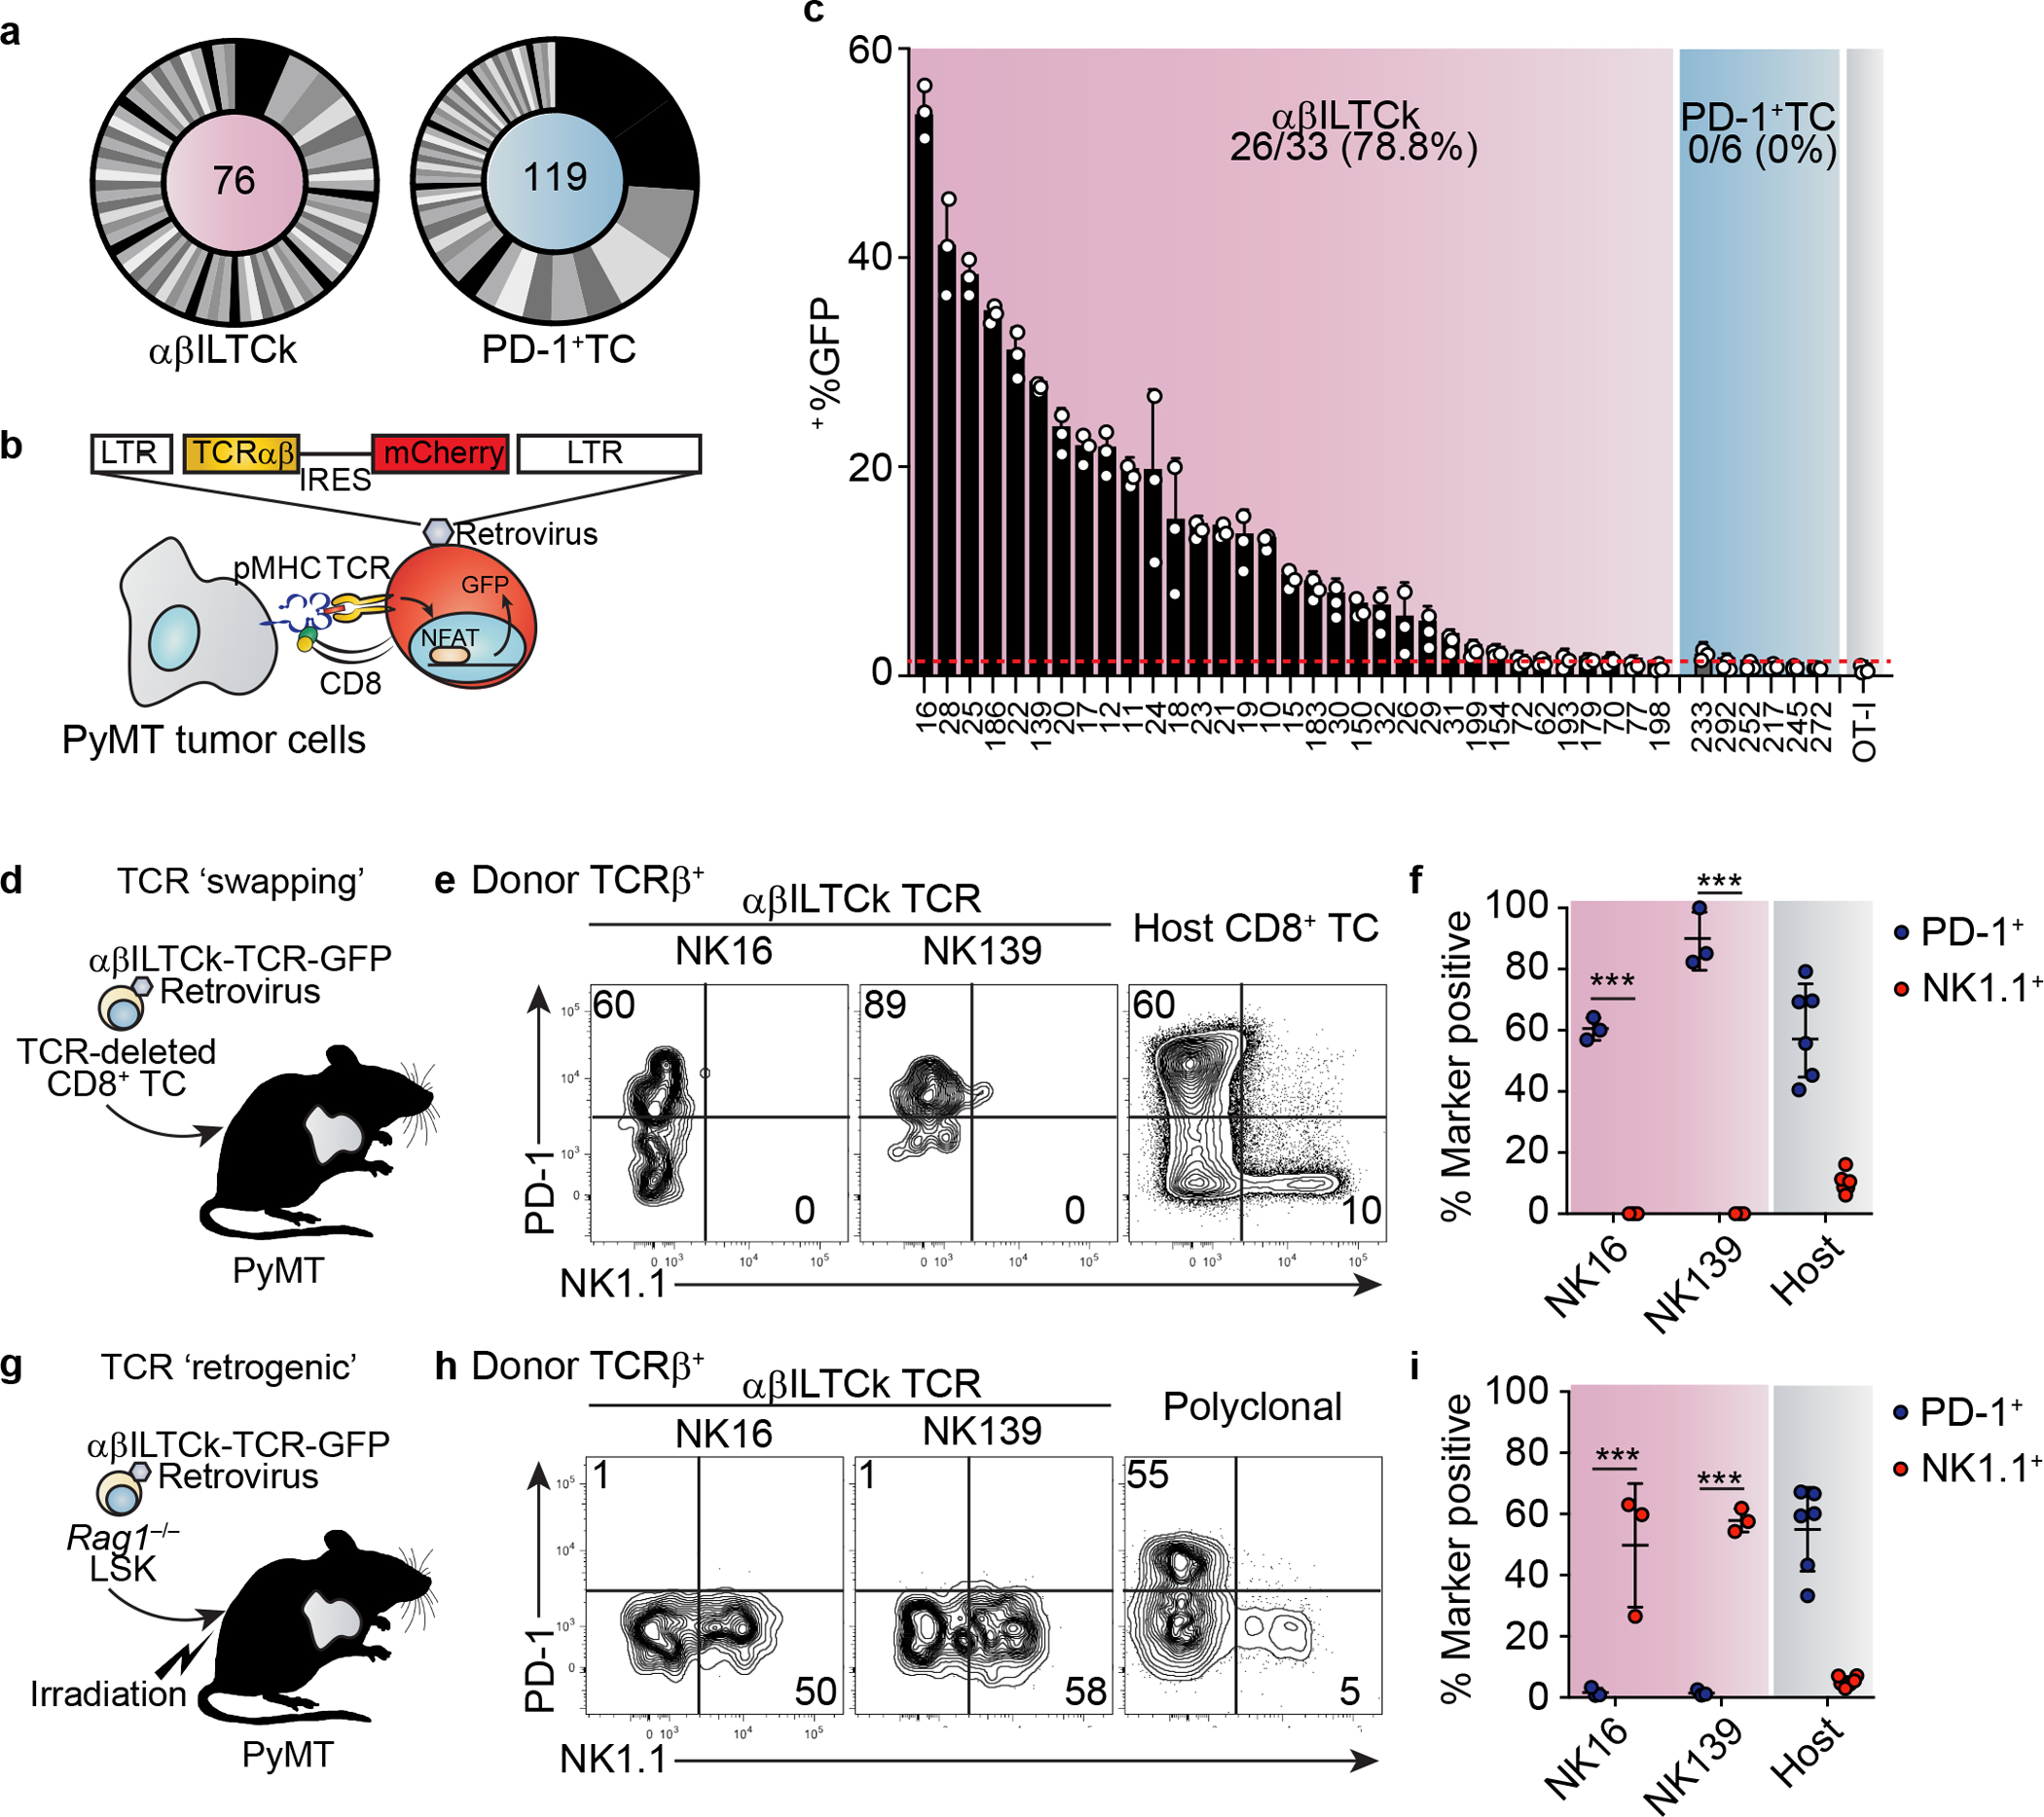
a, CDR3 analysis of TCR pairs isolated from the indicated cell populations with the number of unique CDR3 analyzed for indicated cell types denoted in the middle of each pie chart. Data are pooled from three mice. b, A schematic diagram of the TCR-reporter assay. c, Frequency of GFP+ among CD8+ reporter cells expressing indicated TCRs after co-culturing with primary PyMT cancer cells. Data are pooled from three independent experiments. d, A schematic diagram showing the TCR ‘swapping’ experiment. Endogenously rearranged TCRs of naïve CD8+ T cells were substituted with indicated NK1.1+ αβILTCk-derived TCRs. Engineered cells were adoptive transferred into tumor-bearing mice and analyzed seven days later. e-f, Expression of PD-1 and NK1.1 by donor conventional CD8+ T cells engineered to express indicated NK1.1+ αβILTCk-derived TCR. n = 3 for each TCR. g, Generation of TCR ‘retrogenic’ bone marrow chimeras by reconstitution of lethally irradiated PyMT mice with a mixture of Rag1−/− Lineage−c-Kit+Sca1− (LSK) cells which were transduced with retroviruses expressing the indicated NK1.1+ αβILTCk-derived TCRs and Rag1+/+ total bone marrow cells. h-i, Expression of PD-1 and NK1.1 by donor-derived tumor-infiltrating CD8+ T cells expressing indicated monoclonal or polyclonal TCRs in the TCR ‘retrogenic’ bone marrow chimeras. n = 3 for each TCR. All statistical data are shown as mean ± S.D (biologically independent mice in e-f and h-i). Two-tailed un-paired t-test (f,i). ***P < 0.001.
To define the specificity of TCRs from each subset, we profiled their reactivities against primary PyMT cancer cells using a modified TCR reporter assay system19 (Fig. 2b, Extended Data Fig. 3c, and Supplementary Table 2). Strikingly, 26 out of 33 (78.8%) NK1.1+ αβILTCk-derived TCRs exhibited substantial reactivity against heterologous cancer cells (Fig. 2c), suggesting that they recognize unmutated antigens shared by cancer cells from multiple mice. In contrast, none of the PD-1+ TC-derived TCRs reacted to heterologous cancer cells above the background level established by an irrelevant OT-I TCR (Fig. 2c), implying their reactivity to neoantigens unique to each tumor.
Notably, all except for one αβILTCk-derived TCRs, NK150, required the co-receptor CD8 for antigen recognition (Extended Data Fig. 3d), and such reactivity was lost when the cancer cells lacked classical major MHC-I-encoding genes, H2-K1 and H2-D1, or B2m, the obligate subunit of all MHC-I molecules (Extended Data Fig. 4a–c). Intratumoral NK1.1+ αβILTCk responses were substantially impaired in H2-K1−/−H2-D1−/− or B2m−/− PyMT mice (Extended Data Fig. 4d–e), indicating that αβILTCk TCRs, akin to their CD8+ TC counterparts, are predominantly classical MHC-I-restricted.
To test whether αβILTCk TCRs recognize the MHC-I molecule irrespective of the sequences of peptides presented, we repeated TCR reporter assay using a PyMT tumor-derived cancer cell line lacking the endoplasmic reticulum peptide transporter Tap1, and therefore having a nearly undetectable level of surface MHC-I (Extended Data Fig. 4f). SIINFEKL peptide-stabilized MHC-I expression alone was insufficient to activate αβILTCk TCRs (Extended Data Fig. 4g–h), indicating that these TCRs recognize specific peptide-MHC-I complex rather than the MHC-I molecule itself.
ILTCks are agonistically selected
To investigate whether conventional CD8+ T cells give rise to NK1.1+ αβILTCks, we ‘substituted’ the endogenously rearranged TCRs for an αβILTCk-derived TCR in naïve CD8+ T cells (Extended Data Fig. 5a–e). Following adoptive transfer into tumor-bearing recipient mice (Fig. 2d), αβILTCk-derived TCR-expressing CD8+ T cells upregulated PD-1, but not NK1.1 (Extended Data Fig. 5f and Fig. 2e–f). Furthermore, whereas conventional CD8+ T cell responses require priming by Batf3- and Irf8-dependent conventional type 1 dendritic cells (cDC1s)20, intratumoral NK1.1+ αβILTCk responses were independent of cDC1s (Extended Data Fig. 6). These findings suggest that αβILTCks are independent of DC-mediated priming in secondary lymphoid organs, and arise with distinct ontology from conventional CD8+ T cells. Indeed, developing thymocytes expressing αβILTCk-derived TCRs consistently and specifically generated NK1.1+ αβILTCks, but not PD-1+ TCs in the tumor (Fig. 2g–i and Extended Data Fig. 7a–c). Thus, NK1.1+ αβILTCk and PD-1+ TC represent two mutually exclusive cell fate choices, and the commitment to either lineage may occur during thymocyte development in a TCR-specificity-dependent manner.
Whereas thymocytes with a polyclonal TCR repertoire predominantly generated conventional CD4 and CD8 single positive (SP) T cells (Fig. 3a–b), those harboring a monoclonal αβILTCk TCR yielded only CD4−/dullCD8−/dull cells (Fig. 3a–b and Extended Data Fig. 7d–e). Thus far, all known TCRαβ+ T cells undergo a CD4+CD8+ double positive (DP) stage in the thymus during development21. Expectedly, tumor-resident NK1.1+ αβILTCks and PD-1+ TCs, but not CD19+ B cells, were unanimously fate-mapped by the Rorc-Cre allele, which is transiently active in DP thymocytes22 (Extended Data Fig. 7f–g). However, unlike other innate-like T cells such as invariant natural killer T (iNKT) marked by high expression of the transcription factor Zbtb16, NK1.1+ αβILTCks were not fate-mapped by the Zbtb16-CreRosa26LSL-YFP allele (Extended Data Fig. 7h–i), as a likely consequence of lack of classical MHC-I expression on DP thymocytes23.
Figure 3. Thymocytes bearing αβILTCk-TCRs undergo ‘agonist’ selection, and continually repopulate tumor.
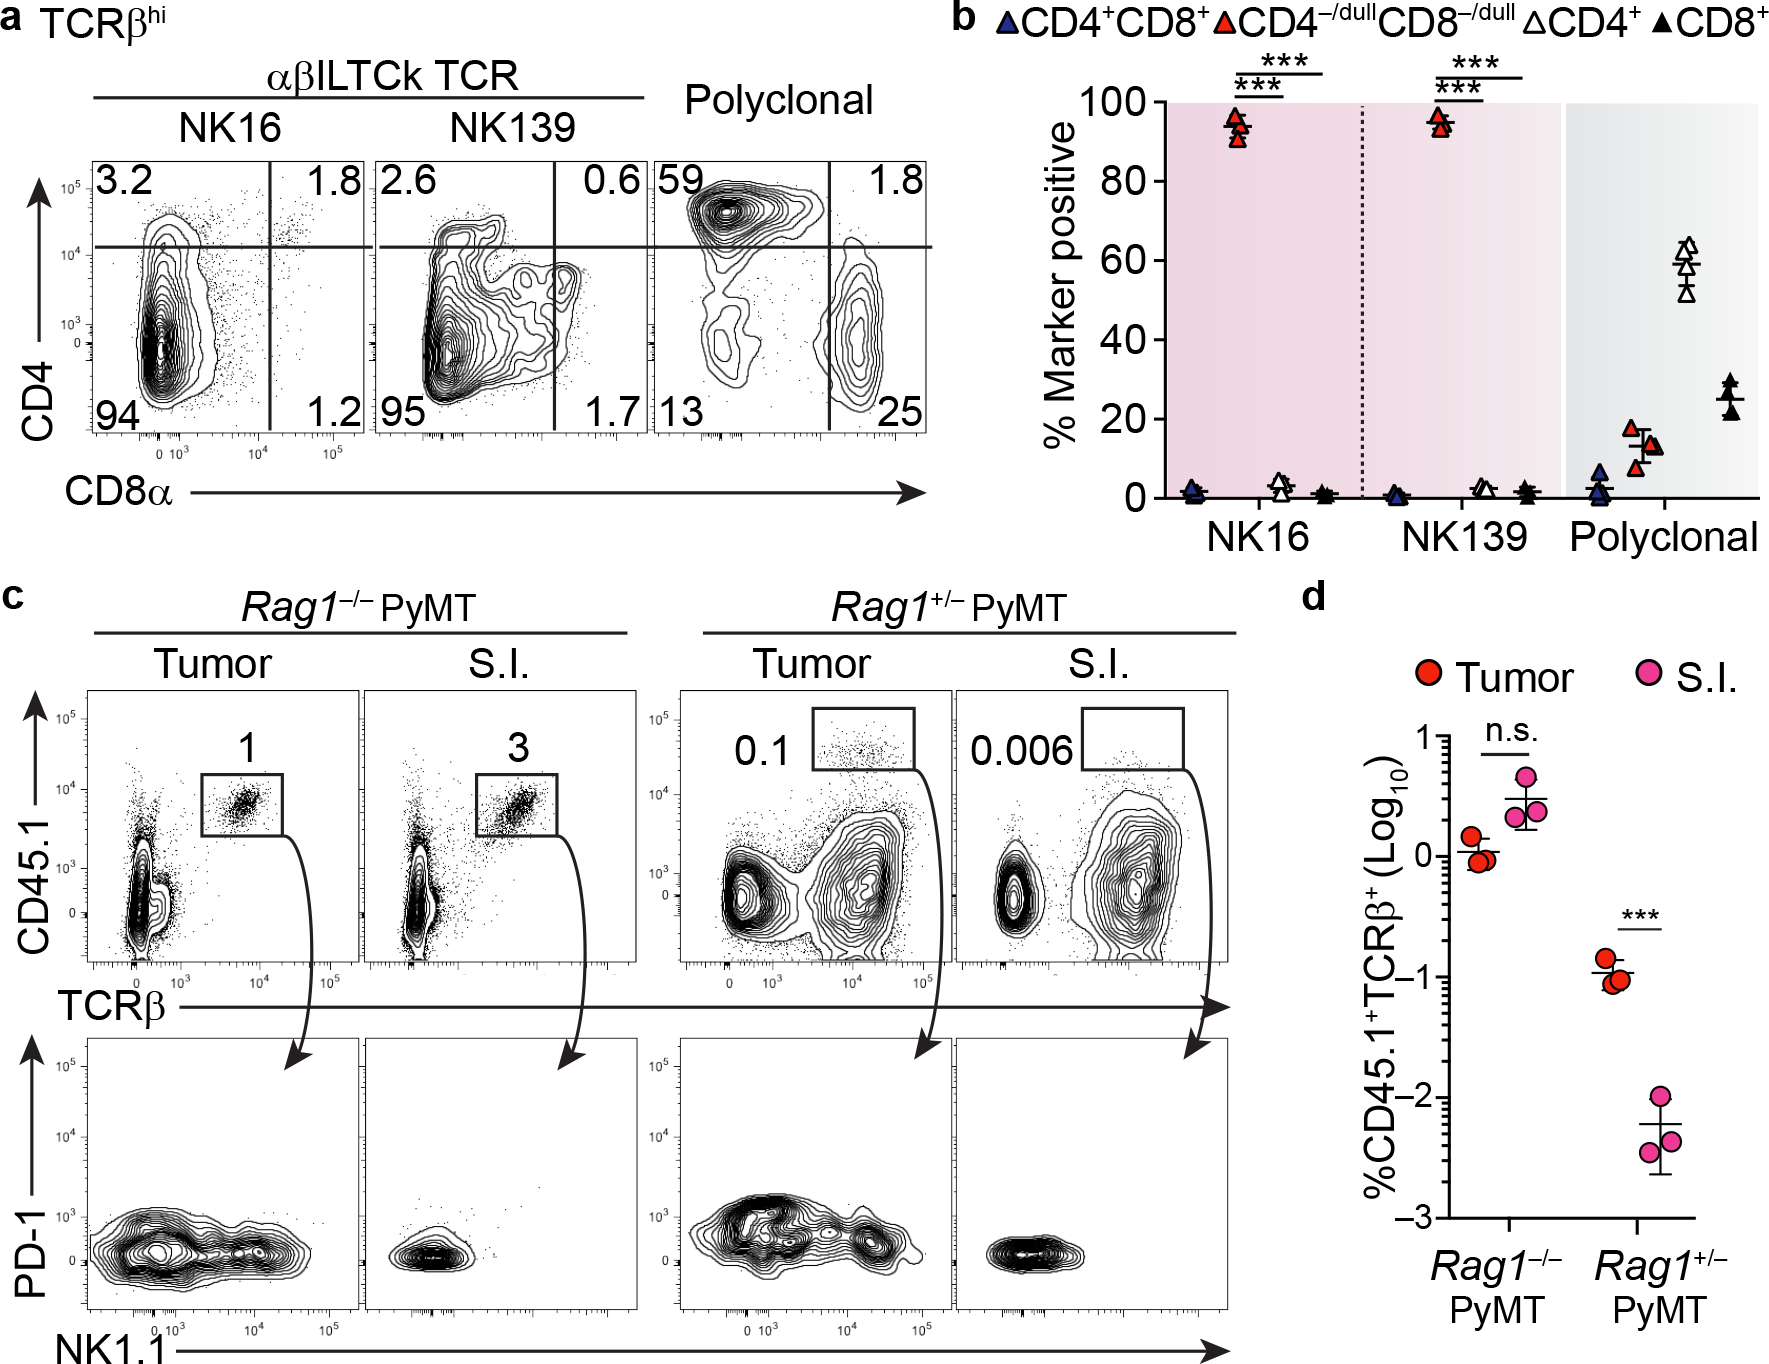
a-b, Expression of CD4 and CD8α by donor-derived TCRβ+ thymocytes bearing the indicated monoclonal or polyclonal TCRs in the TCR ‘retrogenic’ bone marrow chimeras. c, Frequency of donor αβILTCk progenitor-derived cells, identified as CD45.1+TCRβ+ present in the tumor and small intestinal (S.I.) epithelium from CD45.2+ Rag1−/− (n = 3) or Rag1+/− PyMT recipient mice (n = 3). The bottom panel shows the expression pattern of PD-1 and NK1.1 on CD45.1+TCRβ+ donor cells. d, Statistical analysis of the contribution of donor αβILTCk progenitors to the tumor αβILTCk and SI IEL compartments in indicated recipient mice. All statistical data are shown as mean ± S.D (biologically independent mice in a-d). Two-tailed un-paired t-test (b, d). ***P < 0.001 and n.s.: not significant.
Following positive selection, DP thymocytes transiently expressed low levels of PD-1. In contrast, αβILTCk-TCR-expressing thymocytes maintained high PD-1 expression (Extended Data Fig. 7j–k), suggesting a history of strong TCR stimulation. Indeed, 23 out of 33 (69.7%) of αβILTCk-derived TCRs exhibited substantial reactivity to a cortical thymic epithelial cell line, the level of which surpassed that of the OT-I TCR, which drove positive selection of conventional CD8+ T cell (Extended Data Fig. 7l and data not shown). These findings suggest that strong autoreactivity drives αβILTCk lineage commitment, akin to the ‘agonist’ selection process which specifies iNKT cell and intestinal intraepithelial lymphocyte (IEL) fates24.
To distinguish between the role of hematopoietic and radiation-resistant stromal compartments in mediating αβILTCk selection, we generated TCR ‘retrogenic’ mice using wild-type or B2m−/− animals as recipients. Intriguingly, the thymic αβILTCk progenitor compartment remained unaltered in B2m−/− recipients (Extended Data Fig. 7m), but was mildly and substantially diminished with B2m ablation in the hematopoietic compartment only and in both compartments, respectively (Extended Data Fig. 7n). Thus, ‘agonist’ selection signals for αβILTCks are redundantly supplied by both the radiation-sensitive hematopoietic and radiation-resistant stromal compartments.
ILTCks continually repopulate tumor
A substantial proportion of αβILTCk-TCR-bearing thymocytes co-expressed PD-1 and CD122 (Extended Data Fig. 7j–k), a phenotype reminiscent of IEL-committed thymic progenitors25. Indeed, αβILTCk TCR-expressing thymocytes differentiated into small intestinal IELs in addition to intratumoral αβILTCks with both populations expressing the CD8αα homodimer (Extended Data Fig. 8a–c). Upon adoptive transfer into lymphopenic tumor-bearing mice, polyclonal TCRβ+CD4−/loCD8−/loPD-1+CD122+ thymic progenitors generated both intratumoral αβILTCks and intestinal IELs (Fig. 3c–d and Extended Data Fig. 8d–e). However, αβILTCk/IEL progenitors engrafted tumor but not small intestinal αβILTCk/IEL pool in lympho-replete mice (Fig. 3c–d). To further explore the dynamics of intratumoral αβILTCk and intestinal IEL repopulation, we utilized the Fgd5-CreERRosa26LSL-tdTomato allele, in which a pulse of tamoxifen administration labels a fraction of hematopoietic stem cells26, allowing stable tracking of their progenies (Extended Data Fig. 8f). With 20% labeling efficiency in the Lineage−c-Kit+Sca1+ bone marrow stem cells, approximately 3% of thymic αβILTCk/IEL progenitors were fate-mapped, comparable to the DP, SP, and iNKT cell compartments in adult mice (Extended Data Fig. 8g–i). In contrast, the previously described ‘type B IEL progenitors’, were not fate-mapped (Extended Data Fig. 8h–i), reflecting their embryonic/neonatal origin25, 27. In the periphery, comparable proportions of intratumoral PD-1+ TCs and NK1.1+ αβILTCks were fate-mapped (Extended Data Fig. 8j, l). In contrast, small intestinal CD8αα+ IELs showed negligible labeling (Extended Data Fig. 8k–l), confirming early seeding and in situ proliferation as their primary means for population maintenance27. Thus, the intratumoral αβILTCk, but not intestinal IEL, compartment is continuously replenished by thymic progenitors.
FCER1G expression marks ILTCk lineage
To gain insights into the specification of ILTCk lineage, we compared the gene expression profiles of tumor-infiltrating NK1.1+ αβILTCks and PD-1+ TCs to their respective thymic progenitors (Extended Data Fig. 9a). Genes upregulated in αβILTCk progenitors but suppressed in their mature counterparts were enriched for those marked of antigen stimulation including the Tox-Pdcd1 program28, 29, 30 (Extended Data Fig. 9b and Supplementary Table 3), reflecting the ‘agonist’ selection event25. Downregulation of Lat and Cd2 in αβILTCk progenitors might dampen TCR signaling, and render mature αβILTCks not susceptible to exhaustion (Extended Data Fig. 9c and Supplementary Table 3). Notably, genes encoding a number of NK receptors and signaling molecules were upregulated in αβILTCk progenitors (Extended Data Fig. 9d and Supplementary Table 3), and remained highly expressed in mature NK1.1+ αβILTCks8. In contrast, pathways associated with terminal effector differentiation and tissue residency programs, including Gzmc, Itga1, and Itgae, were likely acquired in response to tumor microenvironment-specific local signals (Extended Data Fig. 9e and Supplementary Table 3).
While adoptive transfer of committed αβILTCk progenitors consistently generated NK1.1+ αβILTCks, a substantial proportion remained as NK1.1− (Fig. 3c). This was unlikely a result of pre-existing heterogeneity within the αβILTCk progenitors as thymocytes expressing a monoclonal TCR also gave rise to NK1.1− and NK1.1+ subsets (Fig. 2g–i and Extended Data Fig. 7b–c). While the NK1.1− cells were transcriptionally more similar to NK1.1+ αβILTCks than PD-1+ TCs (Extended Data Fig. 9f), they had higher expression of transcripts enriched in thymic αβILTCk progenitors including Pdcd1 (Supplementary Table 4). Genes associated with terminal effector differentiation including Gzmc were co-upregulated upon acquisition of NK1.1 (Supplementary Table 4). Thus, NK1.1 marks activated αβILTCks and may not identify all αβILTCk lineage of cells in the tumor.
scRNA-sequencing experiments revealed that Fcer1g/FCER1G was differentially expressed in the transcriptionally defined αβILTCk cluster (C3) in murine cancer models (Extended Data Fg. 1 and 9g–h) and also marked a C3 subset transcriptionally similar to murine αβILTCks in tumor tissues from patients with colorectal cancer (Extended Data Fig. 2i–k and 9i). These observations suggest that Fcer1g/FCER1G may represent a conserved αβILTCk lineage-defining marker. Indeed, FCER1G protein was already upregulated in committed PD-1hiCD122hi thymic αβILTCk progenitors, but not in CD8 SPs, and continued to be expressed in tumor-infiltrating NK1.1+ αβILTCKs but not PD-1+ T cells (Extended Data Fig. 9j–k), indicating that FCER1G specifically and stably marks cells committed to the αβILTCk lineage.
Among CD4−CD8α−TCRβ+CD1d−NK1.1− thymocytes, the FCER1G+CD122+ population expressed high levels of PD-1, and lacked granzyme B (GzmB) expression, phenotypically identical to αβILTCk/IEL progenitors defined by CD122 and PD-1 co-expression (Fig. 4a–b). Among tumor-infiltrating T cells, the FCER1G+CD122+ population remained as CD4− with the majority upregulating CD8αα homodimer (Extended Data Fig. 9l–m), and uniformly lacked PD-1 expression (Fig. 4a–b). Notably, FCER1G+CD122+ T cells contained both NK1.1+GzmB+/− αβILTCks and their immature NK1.1−GzmB− precursors (Fig. 4a–b). Thus, FCER1G expression sufficiently identifies tumor-infiltrating αβILTCks regardless of their activation states.
Figure 4. FCER1G expression marks cells of the αβILTCk-lineage.
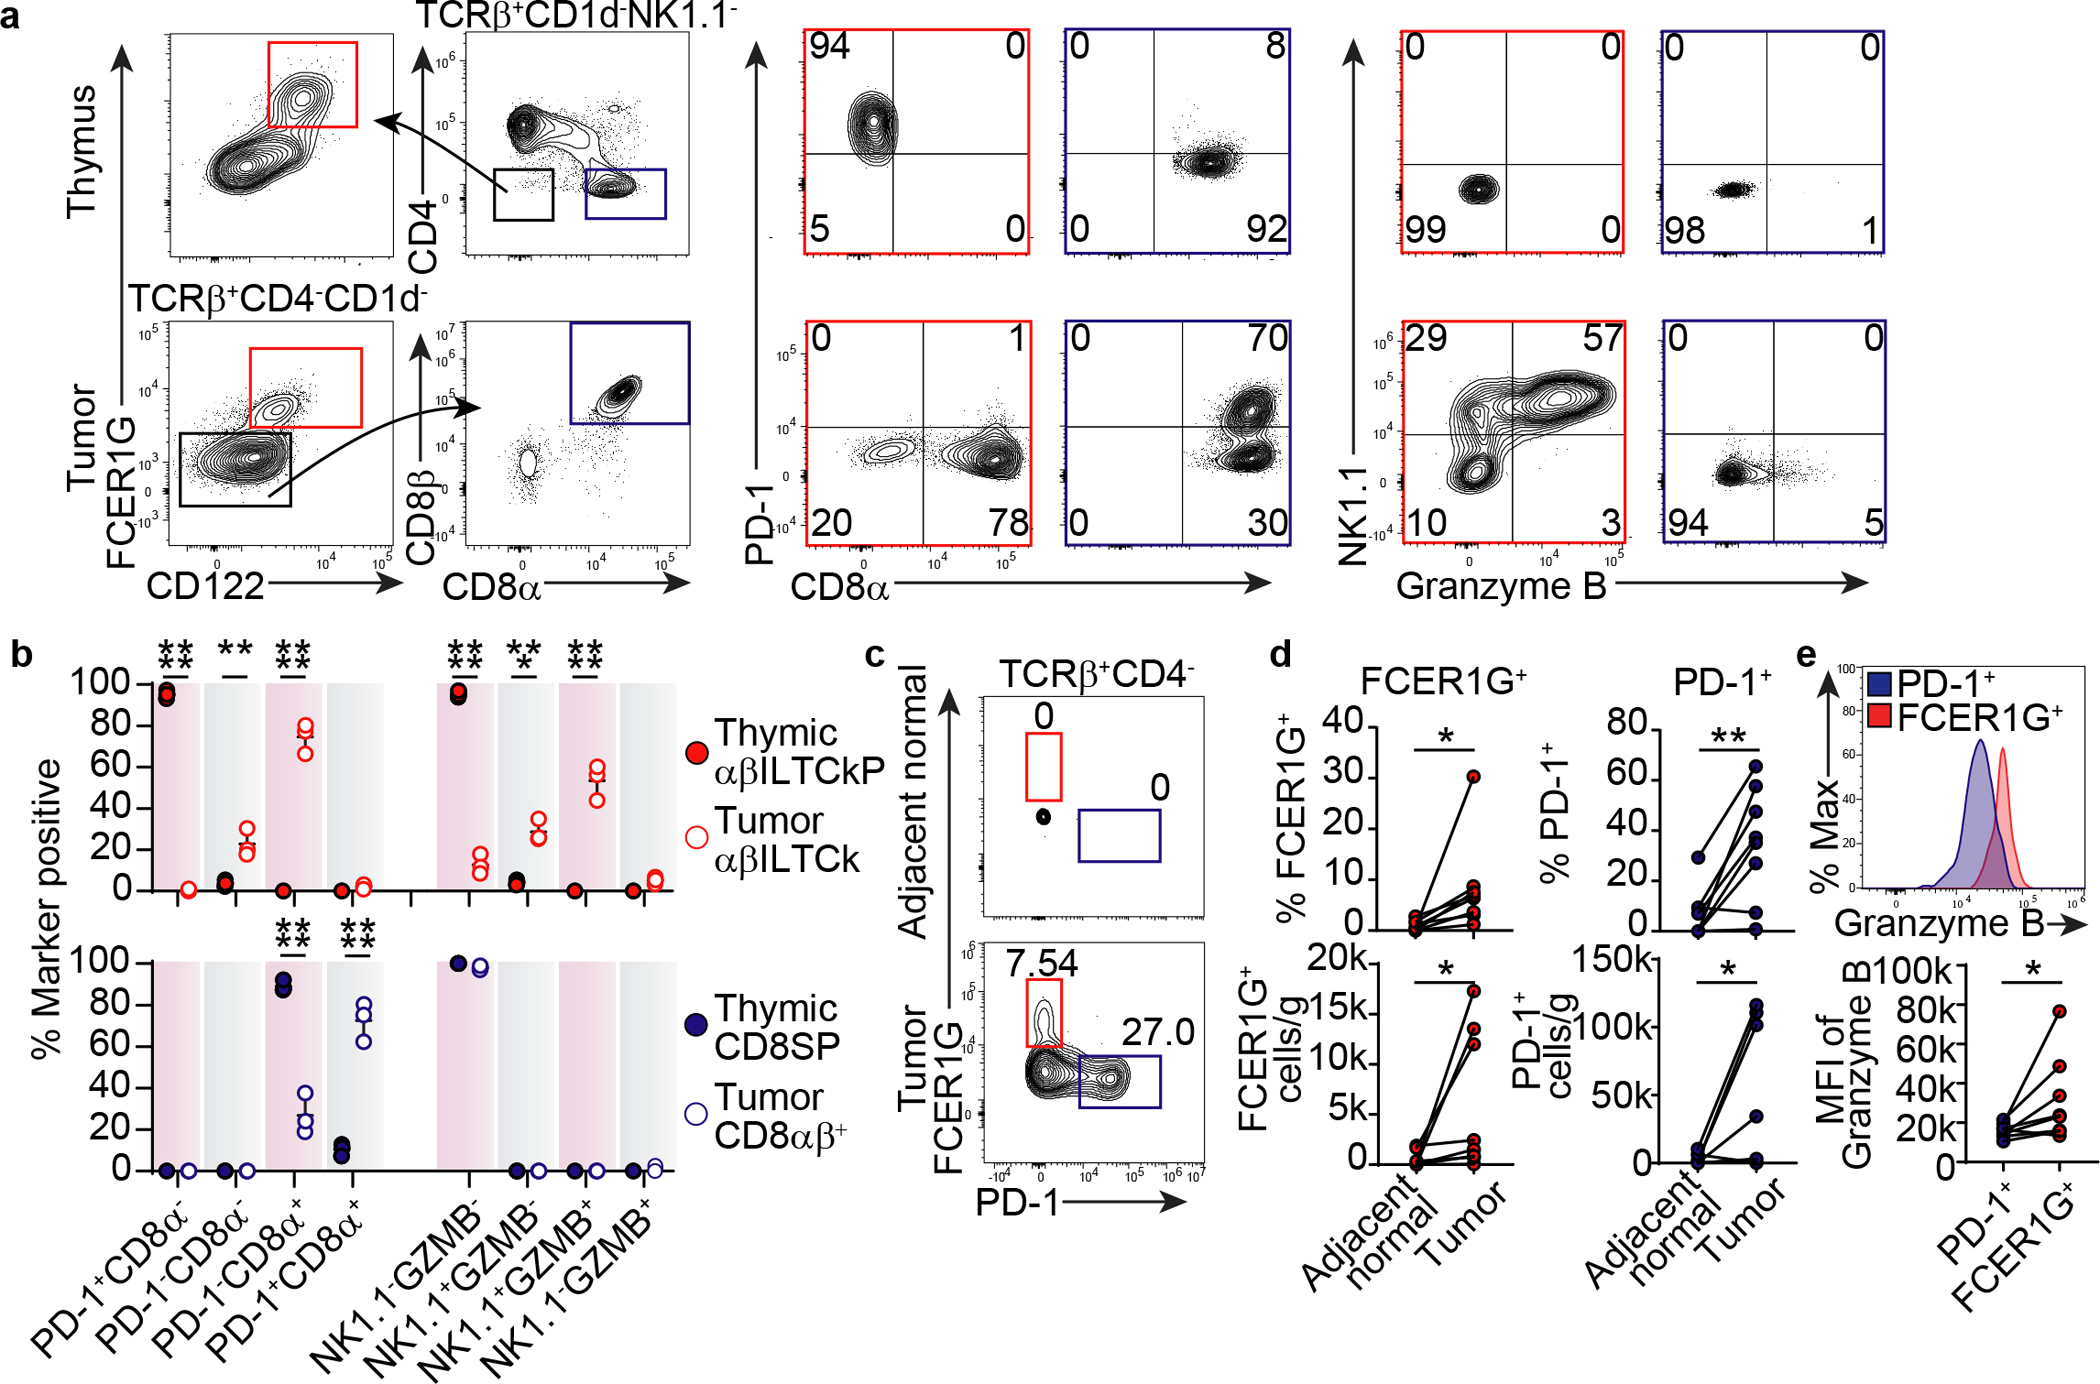
a-b, Flow cytometric analysis of FCER1G, CD122, CD4, CD8α, CD8β, PD-1, NK1.1, and granzyme B expression in TCRβ+CD1d−NK1.1− thymocytes and TCRβ+CD4−CD1d− tumor-infiltrating T cells from PyMT mice (n = 3). Frequency of thymic FCER1G+CD122+ αβILTCk progenitor (αβILTCkP), intratumoral αβILTCk, thymic CD8 single positive (CD8SP), and intratumoral CD8αβ+ T cells expressing indicated combination of markers are plotted. c-d, Expression of FCER1G and PD-1 by CD45+TCRβ+CD4− cells in tumor tissues or adjacent normal colon from patients with colon carcinoma (n = 8). e, Granzyme B expression in FCER1G+TCRβ+ and PD-1+TCRβ+CD4− cells in tumor tissues from patients with colon carcinoma (n = 8). All statistical data are shown as mean ± S.D (biologically independent mice in a-b and human samples in c-e). Two-tailed un-paired (b) and paired t-test (d-e). *P < 0.05; **P < 0.01; ***P < 0.001 and ****P < 0.0001.
In patients with colon carcinoma, FCER1G+TCRβ+ cells were also readily detected in tumor tissues (Extended Data Fig. 9n) with a co-receptor expression profile similar to their murine counterparts (Extended Data Fig. 9n–o). FCER1G+ T cells were enriched in tumor tissues relative to adjacent normal colon (Fig. 4c–d), but expressed higher levels of granzyme B compared to their PD-1+ counterparts (Fig. 4e). Collectively, these findings identify FCER1G as an αβILTCk lineage-defining marker and demonstrate that the αβILTCk program represents an evolutionarily conserved tumor-elicited immune response in both mouse and human.
ILTCk is engineerable for cancer therapy
Consistent with previous studies that NK1.1+ αβILTCks are critically dependent on the pro-inflammatory cytokine IL-158, we observed an almost complete absence of FCER1G+CD122+ thymic αβILTCk progenitors in mice lacking Il15 (Fig. 5a–b). As IL-15 is expressed in both lymphoid and nonlymphoid tissues, the exact source of IL-15 that drives the expansion and activation of intratumoral αβILTCks remains elusive. Ablation of Il15 in hematopoietic lineage of cells did not impair the tumor-elicited αβILTCk response (data not shown). Notably, IL-15 expression was markedly increased in transformed mammary epithelium compared to healthy mammary tissues (Fig. 5c). IL-15 was also readily detected in tumor epithelium from patients with colon carcinoma (Extended Data Fig. 10a), and the frequency of FCER1G+, but not PD-1+, T cells was positively associated with IL-15 levels (Fig. 5d and Extended Data Fig. 10a–b).
Figure 5. αβILTCks sense cancer cell-expressed IL-15, and inducible hyperactivation of IL-15 signaling in αβILTCks suppresses tumor growth.
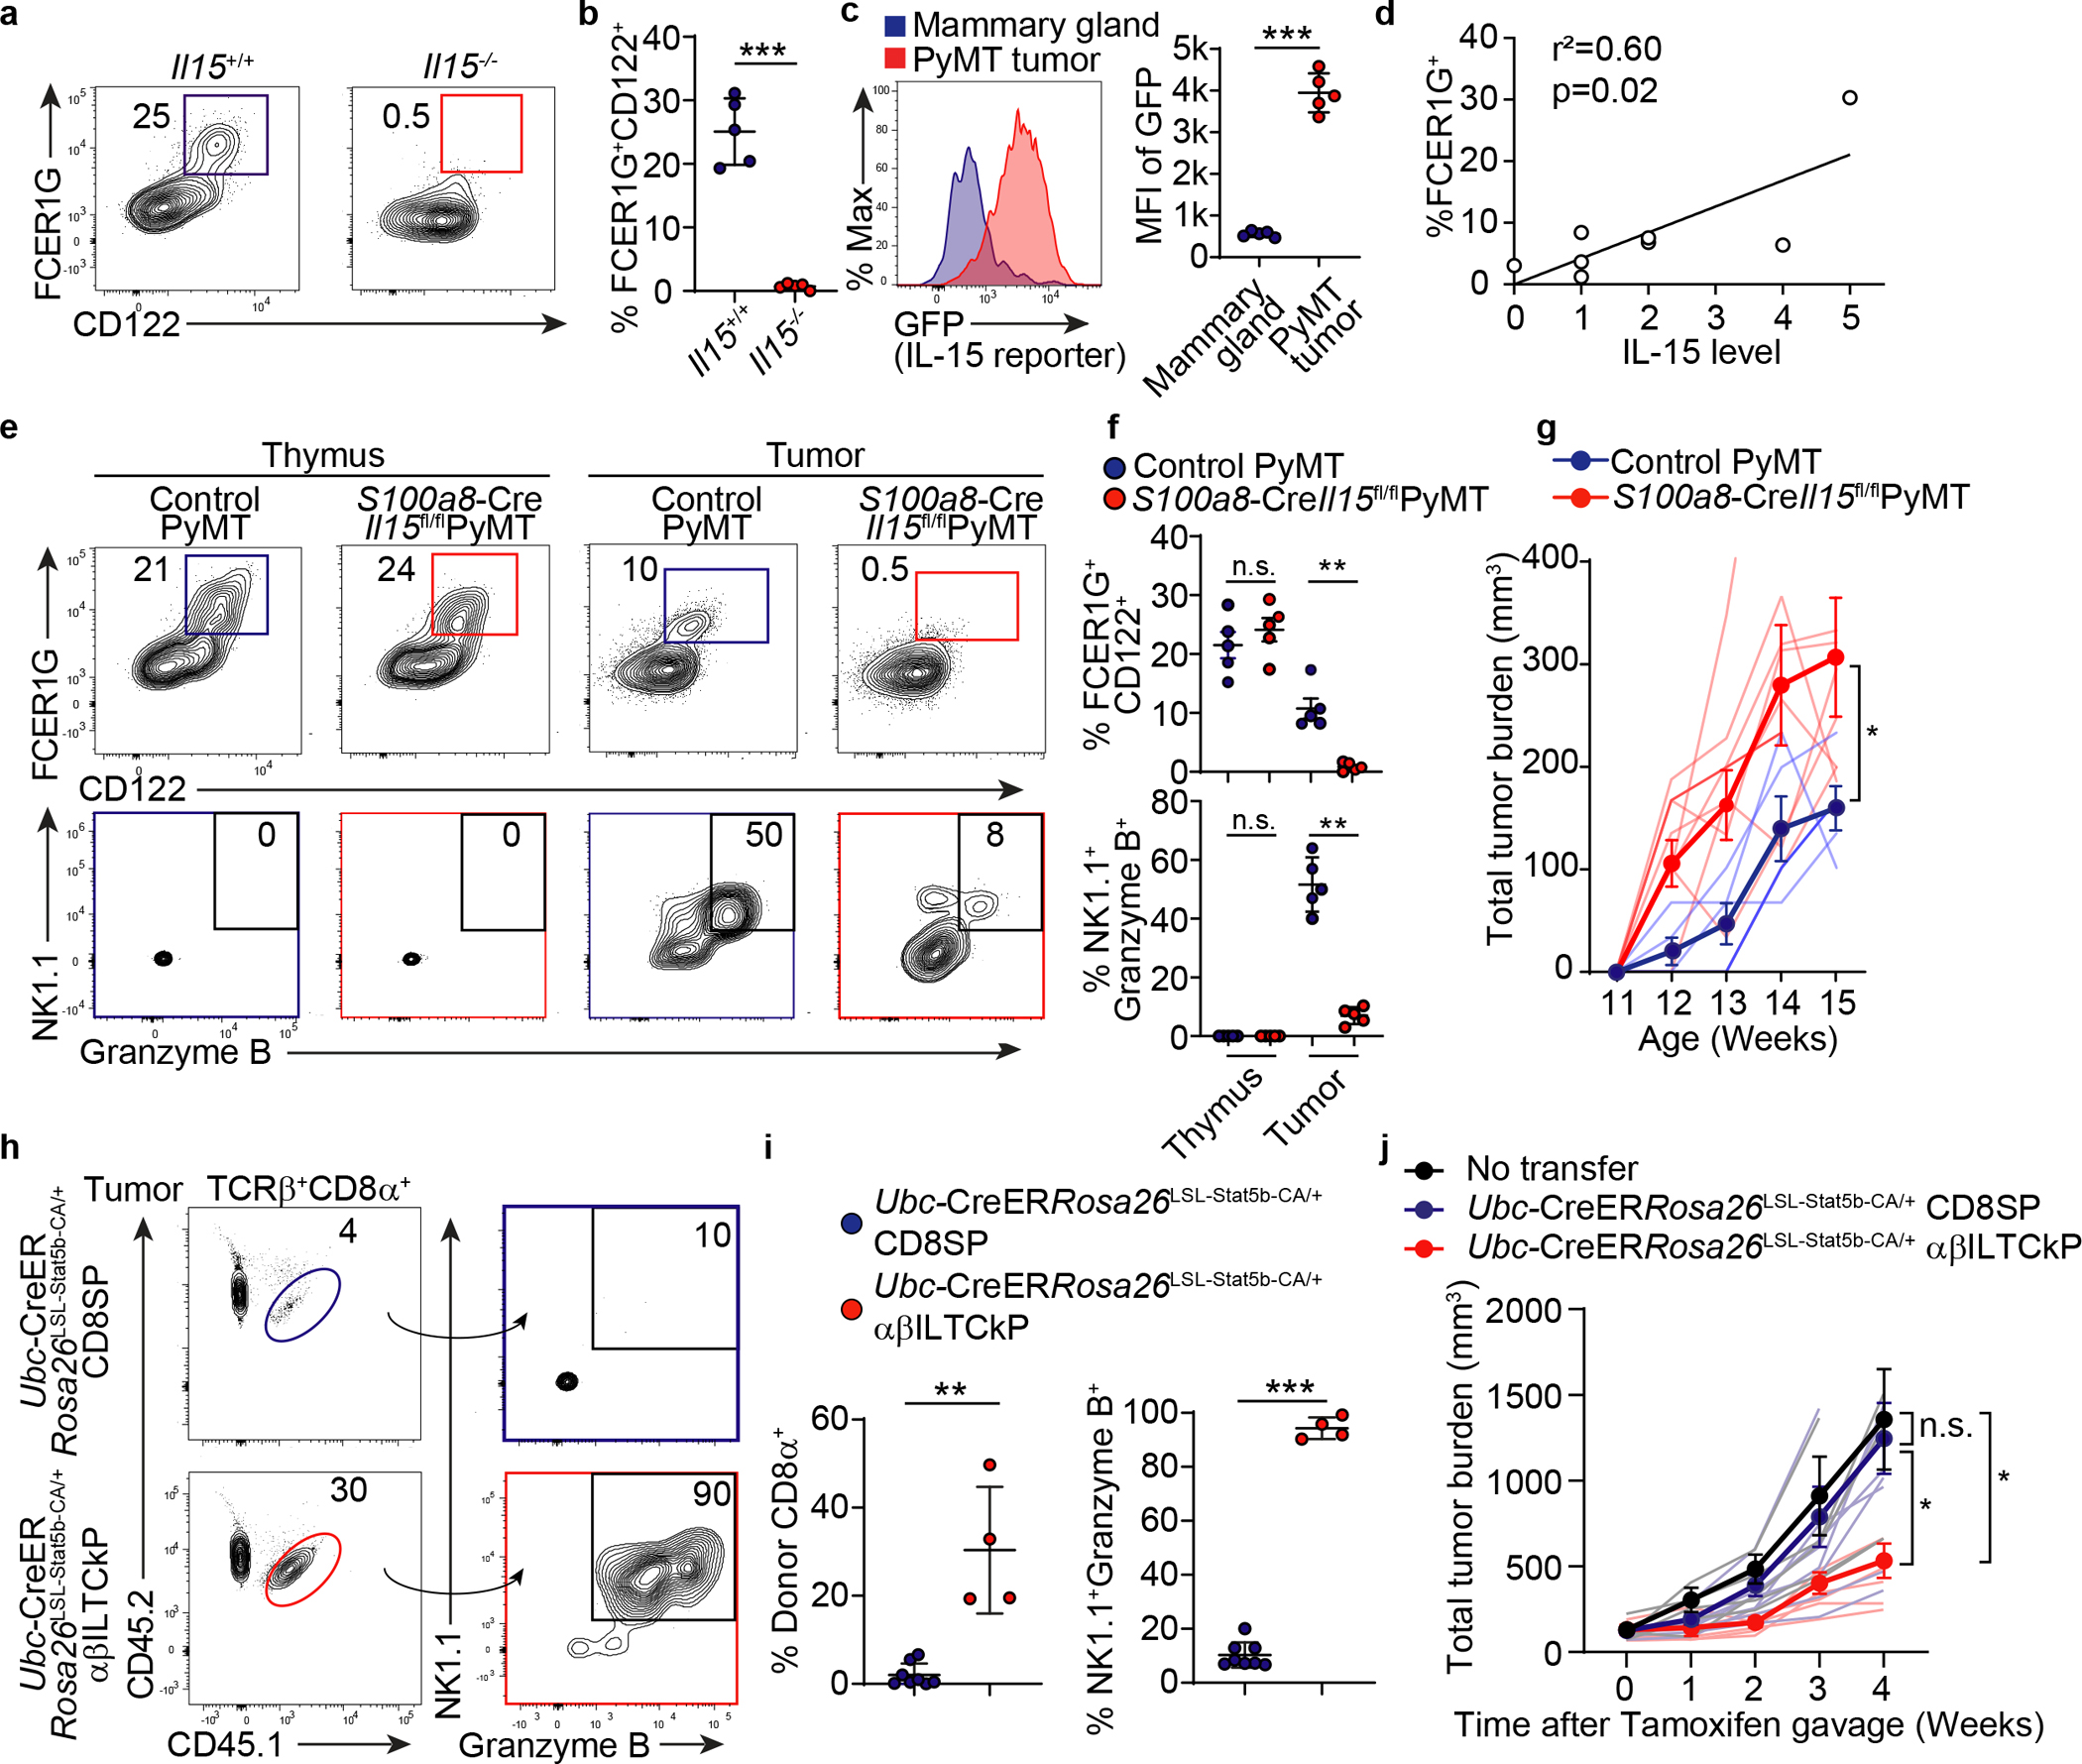
a-b, Flow cytometric analysis of FCER1G and CD122 expression in TCRβ+CD1d−NK1.1−CD4−CD8α− thymocytes from Il15−/− (n = 5) and Il15+/+ (n = 5) mice. c, GFP expression by CD45−EpCAM+ cells from IL-15-GFP reporter control (n = 5) and PyMT mice (n = 5). d, Correlation between frequency of FCER1G+ cells among CD45+TCRβ+CD4− cells and IL-15 expression level in tumor tissues from colon carcinoma patients. e-f, Flow cytometric analysis of FCER1G and CD122 expression in TCRβ+CD1d−NK1.1−CD4−CD8α− thymocytes and CD45+TCRβ+CD4− tumor-infiltrating cells from S100a8-CreIl15fl/flPyMT (n = 5) or control PyMT (n = 5) mice. Bottom panel shows expression of NK1.1 and granzyme B in FCER1G+CD122+ cells. g, Tumor burden in mice of indicated genotypes. Control PyMT (n = 4) and S100a8-CreIl15fl/flPyMT (n = 8). h-i, Flow cytometric analysis of adoptively transferred CD45.1+CD45.2+ αβILTCk progenitors (αβILTCkP, n = 4) or CD8 single positive T cells (CD8SP, n = 8) cells among TCRβ+CD8α+ tumor-infiltrating cells and NK1.1 as well as granzyme B expression in donor cells. j, Tumor burden in mice adoptively transferred with no cells (n = 5), Ubc-CreERRosa26LSL-Stat5b-CA/+ thymic CD8SPs (n = 8) or αβILTCkPs (n = 5). All statistical data are shown as mean ± S.D (biologically independent mice in a-c, e-g, h-j). Two-tailed un-paired t-test (b-c,f,i), linear regression (d) and two-way analysis of variance (ANOVA) (g,j) with post hoc Bonferroni t-test. *P < 0.05; **P < 0.01; ***P < 0.001 and n.s.: not significant.
To investigate whether cancer cell-expressed IL-15 regulated αβILTCk response, we utilized the S100a8-CreIl15fl/flPyMT mice in which Il15 was deleted in transformed, but not healthy, mammary epithelium (Extended Data Fig. 10c and data not shown). S100a8-CreIl15fl/flPyMT mice had comparable thymic FCER1G+CD122+ αβILTCk progenitors (Fig. 5e–f). Strikingly, tumor-infiltrating αβILTCks were markedly reduced in S100a8-CreIl15fl/flPyMT mice compared to controls, and residual αβILTCks had largely diminished expression of NK1.1 and granzyme B (Fig. 5e–f). Notably, S100a8-CreIl15fl/flPyMT mice exhibited accelerated tumor growth compared to wild-type controls (Fig. 5g). These findings demonstrate that ILTCks sense cancer cell-derived IL-15 for cancer immunosurveillance.
Notably, IL-15 was sufficient to induce NK1.1 as well as granzyme B upregulation and the concomitant PD-1 downregulation in thymic αβILTCk progenitors (Extended Data Fig. 10d). To explore whether ectopic activation of IL-15 signaling in adoptively transferred αβILTCk progenitors could suppress tumor development, we purified thymic αβILTCk progenitors from Ubc-CreERRosa26LSL-Stat5b-CA/+ mice in which tamoxifen administration induces expression of a constitutively active form of the transcription factor Stat5b (Stat5b-CA) that principally coordinates the transcriptional program downstream of IL-15 signaling31 (Extended Data Fig. 10e). Following adoptive transfer into lymphocyte-deficient tumor-bearing PyMT mice, inducible activation of Stat5b resulted in a 60-fold expansion of transferred cells and uniform upregulation of NK1.1 and granzyme B within four weeks (Extended Data Fig. 10f–i). Importantly, mice receiving Stat5b-CA-armed αβILTCks exhibited significantly deterred tumor growth compared to those transferred with control αβILTCks or no cells (Extended Data Fig. 10j).
When adoptively transferred into lympho-replete PyMT hosts, Stat5b-CA-armed αβILTCk progenitors readily colonized tumor tissues and underwent robust expansion as well as effector differentiation, resulting in diminished tumor growth (Fig. 5h–j and Extended Data Fig. 10k). In contrast, adoptively transferred Stat5b-CA-armed thymic CD8 SP T cells failed to engraft or differentiate, likely due to low frequency of tumor-reactive clones and expectedly, tumor growth was unaltered (Fig. 5h–j). Thus, IL-15 signaling axis in αβILTCk can be a powerful and exploitable substrate for the development of cancer therapies.
Discussion
In this study, we established FCER1G+ αβILTCk program as a distinct and evolutionary conserved class of tumor-elicited T cell response and identified cancer-cell-derived IL-15 as a necessary and sufficient driver for its anti-tumor effect. As FCER1G provides necessary activation motifs for several NK receptors, its early expression in committed thymic αβILTCk progenitors may potentiate their rapid acquisition of effector functions upon NK receptor upregulation in tumor tissues. While FCER1G also specifically marked a subset of human tumor-infiltrating αβILTCk-like cells, FCER1G can be induced by prolonged IL-15 exposure in a fraction of circulating human CD8+ T cells32. Conceivably, FCER1G expression may be more dynamically regulated in human than mouse αβILTCks. Alternatively, FCER1G may mark other lineages in addition to αβILTCk in human, resolution of which requires further investigation. Despite expressing broadly tumor-reactive TCRs, antigen recognition is dispensable for cytotoxicity by IL-15-activated αβILTCks8. Our data suggest early encounter with self-antigen may permanently dampen TCR signaling in the αβILTCk lineage, but the post-selection role of TCR in αβILTCks remains to be determined. Our study highlights the strength of αβILTCk-based adoptive cellular transfer therapy as such an approach does not require a priori knowledge of specific target antigens. Thus, strategies targeting ILTCks may be particularly effective against tumors with low mutation burden or refractory to checkpoint blockade modalities.
Methods
Human samples.
Use of human tumor samples was approved by the MSKCC Institutional Review Board (IRB) protocol: #16-1071. Patients also consented for tissue use on the following protocol: #06-107. Patients with non-metastatic colon cancer were prospectively identified and the resected specimens were collected and obtained as per protocol. The demographics and pathologic information for the colon cancer patients is shown in Supplementary Table 5. The histological diagnoses and mismatch repair status of the colon tumors were confirmed by expert colon cancer pathologists. Tumor and adjacent normal colon samples were directly obtained from specimens resected in the operating room in coordination with pathology assistance. Tissue samples were placed in separate labeled containers containing Roswell Park Memorial Institute (RPMI) medium and transported in regular ice to the laboratory within 1 hour. The human tissues were briefly cut into pieces and subjected to enzymatic digestion using Human Tumor Dissociation Kit (130-095-929, Miltenyi Biotec) in combination with gentleMACS™ Octo Dissociator with Heaters with preset program 37C_h_TDK_2 according to the manufacturer’s protocol. The resulting cell suspension was filtered through a 70 μm cell strainer and washed with PBS and centrifuge at 1600 rpm for 6 minutes. Cell pellet was further resuspended in RPMI with 2% FBS. Cells were centrifuged on a Ficoll gradient and then washed with PBS before use.
Mice.
C57BL/6J (B6), B6.SJL-PtprcaPepcb/BoyJ (CD45.1), FVB/N-Tg(MMTV-PyVT)634Mul/J (PyMT), C57BL/6-Tg(TRAMP)8247Ng/J (TRAMP), B6.129S7-Rag1tm1Mom/J (Rag1−), B6.129P2-B2mtm1Unc/J (B2m−), B6.129S(C)-Batf3tm1Kmm/J (Baft3−), B6(Cg)-Il15tm1.2Nsl/J (Il15−), B6(Cg)-Irf8tm1.1Hm/J (Irf8fl), B6.Cg-Tg(Itgax-cre)1−1Reiz/J (Itgax-Cre), B6.FVB-Tg(Rorc-cre)1Litt/J (Rorc-Cre), B6.Cg-Tg(S100A8-cre,-EGFP)1Ilw/J (S100a8-Cre), B6(SJL)-Zbtb16tm1.1(EGFP/cre)Aben/J (Zbtb16-Cre), C57BL/6N-Fgd5tm3(cre/ERT2)Djr/J (Fgd5-CreER), B6.Cg-Ndor1Tg(UBC-cre/ERT2)1Ejb/1J (Ubc-CreER), B6J.129(Cg)-Gt(ROSA)26Sortm1.1(CAG-cas9*,-EGFP)Fezh/J (Rosa26Cas9), B6;129S6-Gt(ROSA)26Sortm9(CAG-tdTomato)Hze/J (Rosa26LSL-tdTomato), and B6.129X1-Gt(ROSA)26Sortm1(EYFP)Cos/J (Rosa26LSL-YFP) were purchased from the Jackson Laboratory. The H2-k1−/−H2-d1−/−, Rosa26LSL-Stat5b-CA, and Il152A-eGFP mice were previously described31, 33, 34 and kindly provided to us by FA. Lemonnier, AY. Rudensky, and RM. Kedl, respectively. Il15fl mice with exon 5 flanked by two loxP sites were generated, and kindly provided to us by K. Ikuta. All mice were backcrossed to the C57BL/6 background and maintained under specific pathogen-free conditions. Animal experimentation was conducted in accordance with procedures approved by the Institutional Animal Care and Use Committee of Memorial Sloan Kettering Cancer Center.
Single-cell RNA sequencing analysis.
FASTQ files for single cell RNA-sequencing of tumor-infiltrating TCRβ+CD8+ T cells were demultiplexed and aligned to the mm10 genome using Cell Ranger v3.0.2 (10× genomics). The resulting count matrix of cells by genes, which contains the number of UMIs for each gene associated with each cell, was filtered as follows. First, cells with greater than 20% mitochondrial gene expression were removed. All mitochondrial and ribosomal genes were then filtered out, as well as the noncoding RNAs Neat1 and Malat1. Genes with log mean expression < 2.5 were also filtered out. UMI counts were then log and library size-normalized with a scale factor of 10,000 according to the standard Seurat v2.4 pipeline35, 36 in the R statistical environment (https://www.R-project.org/ v3.6.1; “Action of the Toes”). For the MMTV-PyMT dataset, after sequencing quality control, 1,015 cells were further analyzed and a total of 10,670 genes were used for dimension reduction by uniform manifold approximation and projection (UMAP) analysis. Dimensionality reduction via PCA was then conducted on the normalized count matrix, and the top 10 principal components were used for Louvain clustering analysis using the FindClusters() function at resolution 0.6. A two-dimensional embedding of the data was generated using UMAP with the top 10 principal components as input, using the RunUMAP() function. Differential gene expression analysis was conducted using the FindMarkers() function, with “Wilcox” specified as the statistical test. Significantly differentially expressed genes were computed for each cluster as genes differentially expressed in each cluster versus all others at FDR P < 0.05. Heatmaps for significantly differentially expressed genes between clusters were generated using the pheatmap package (Kolde, R. pheatmap: https://cran.rproject.org/web/packages/pheatmap/index.html) in R. Diffusion map analyses were conducted using the destiny package37 in R. To visualize clusters presented in Figure 1, we first computed a diffusion map embedding with all 5 clusters together using the destiny package37 in R, with k = 60. To quantify potential lineage transitions between the naïve cluster C1 and all other clusters, we calculated the pairwise diffusion distance38 between each cell in C1 and all other clusters. For pseudotime analysis, we first regressed out the effect of cell cycle genes, and used Monocle39, 40, 41 to estimate lineage branching using differentially expressed genes between clusters at FDR P < 0.001. All other single cell datasets, including the one from Zhang et al4 were analyzed as described above. Specifically, we analyzed all tissues and all 12 patients from the Zhang et al human colorectal cancer dataset4. The αβILTCk signature was constructed by performing a differential expression analysis between the αβILTCk cluster C3 and all other clusters presented in Figure 1, taking genes with FDR P < 0.05 and logFC > 0 (i.e. upregulated in αβILTCk vs all others). This signature was then applied to other datasets using the addModuleScore() function in Seurat.
Bulk RNA-sequencing analysis.
FASTQ files for bulk RNA-sequencing of thymic αβILTCk/IEL progenitors and CD8 single positive cells (two biological replicates each) were first mapped to the mm10 genome using HiSat2 v2.0.5 (Ref42). The genomic index along with the list of splice sites and exons were created by HiSat2 using the genome assembly GRCm38.p5 from ENSEMBL together with the comprehensive gene annotation for GRCm38.p5 (Release M13) from GENCODE43. Gene-level counts were computed using Rsubread44 (options isPairedEnd = TRUE, requireBothEndsMapped = TRUE, minOverlap = 80, countChimericFragments = FALSE). DESeq2 (Ref45) was used to perform differential expression analysis on the resulting count matrix. Genes were considered significantly differentially expressed at FDR P < 0.05. Pathway analyses were conducted using the enrichGO() function in the R package clusterProfiler46 to assess enrichment in pathways curated in Gene Ontology.
Generation of single-cell TCR-sequencing library.
Amplification of TCRα and TCRβ chains from single sorted cells was performed by iRepertoire Inc. (Huntsville, AL, USA). Briefly, RT-PCR1 was performed with nested, multiplex primers covering both TCRα and TCRβ loci, and including partial Illumina adaptors. Included on the reverse primer was an in-line 6-nt barcode, which served as a plate identifier so that multiple 96-well plates could be multiplexed in the same sequencing flow cell. After RT-PCR1, the first round PCR1 products were rescued using SPRISelect Beads (Beckman Coulter). A second PCR was performed with dual-indexed primers that complete the sequencing adaptors introduced during PCR1 and provide plate positional information for the sequenced products. Sequencing was performed using the Illumina MiSeq v2 500-cycle kit with 250 paired-end reads.
Data processing of single-cell TCR-seq library.
Raw data were demultiplexed by Illumina dual indices and the 6-nt internal plate barcode information for each well of the 96-well PCR plates. Data were analyzed using the previously described iRmap program47, 48. Reads were trimmed according to their base qualities with a 2-base sliding window. If either quality value in this window is lower than 20, the sequence stretch from the window to the 3’ end is trimmed from the original read. Trimmed pair-end reads were joined together through overlapping alignment with a modified Needleman-Wunsch algorithm. If paired forward and reverse reads in the overlapping region were not perfectly matched, both forward and reverse reads were thrown out without further consideration. The merged reads were mapped using a Smith-Waterman algorithm to germline V, D, J and C reference sequences downloaded from the IMGT web site49. To define the CDR3 region, the position of CDR3 boundaries of reference sequences from the IMGT database were migrated onto reads through mapping results, and the resulting CDR3 regions were extracted and translated into amino acids. The data for each chain of the receptor pair begins from within the beginning of framework (FR) 2 and extends to the beginning of the C-region (including the isotype). Information for FR1 and CDR3 were inferred from alignments for downstream cloning and expression.
Immune cell isolation from murine tissues.
Tumor-infiltrating immune cells were isolated from murine mammary tumors as previously described50. Briefly, tumor tissues were minced with a razor blade then digested in 280 U/mL Collagenase Type 3 (Worthington Biochemical) and 4 μg/mL DNase I (Sigma) in HBSS at 37°C for one hour and 15 minutes with periodic vortex every 20 minutes. Digested tissues were passed through 70 μm filters and pelleted. Cells were resuspended in 40% Percoll (Sigma) and layered above 60% Percoll. Sample was centrifuged at 1,900 g at 4°C for 30 minutes without brake. Cells at interface were collected, stained and analyzed by flow cytometry or sorting. Isolation of small intestinal intraepithelial lymphocytes has been previously described51. Briefly, small intestine between distal duodenum and proximal ileum was opened longitudinally and intestinal content was cleaned by washing in ice-cold PBS, followed by incubation in PBS/10 mM EDTA/1 mM Dithiothreitol solution at 37°C for 15 minutes with vigorous shaking. Tissues were passed through 100 μm filters and pelleted. Cells were resuspended in 40% Percoll and centrifuged at 1,200 g at room temperature for 20 minutes. Cell pellets were collected, stained and analyzed by flow cytometry.
Flow cytometry and cell sorting.
For flow cytometry experiments, cells were incubated with 2.4G2 mAb to block FcγR binding, DAPI (4, 6-diamidino-2-phenylindole; Sigma) or Aqua Live/Dead (Thermo Fisher Scientific) for the exclusion of dead cells and were stained with panels of antibodies for 30 minutes on ice. Granzyme B staining was carried out using the intracellular transcription factor buffer set from BD Pharmingen. All samples were acquired with an LSRII (BD) or LSR Fortessa (BD), and analyzed with FlowJo software version 9.6.2 (Tree Star). Cell sorting was performed with a FACSAria II (BD) using a 100 μm nozzle. Tumor-infiltrating NK1.1+ αβILTCks and PD-1+ T cells were sorted as CD45+TCRγδ−TCRβ+CD4−CD8α+PD-1−NK1.1+ and CD45+TCRγδ−TCRβ+CD4−CD8α+PD-1+NK1.1−, respectively. Thymic αβILTCk/IEL progenitors and CD8 single positive cells were sorted as CD4−/dullCD8α−/dullCD1d/PBS-57−CD25−TCRβ+CD122+CD5hiPD-1+NK1.1− and TCRβ+CD4−CD8α+, respectively. For sorting of LSK cells, total bone marrow cells were incubated with CD117 MicroBeads (Miltenyi Biotec) according to the manufacturer’s instruction, followed by positive selection with an LS column (Miltenyi Biotec) prior to staining with monoclonal antibodies. LSK cells were sorted as Lineage− (CD3ε−B220−Gr1−CD11b−Ter119−) CD117+Sca1+. For single cell TCR-sequencing experiments, respective populations were single cell sorted into V-bottom 96-well plates (iRepertoire) which were flash-frozen and stored at −80°C prior to library construction.
TCR cloning and reporter assay.
Gene Blocks (Genewiz, NJ) containing the coding regions for the leader, variable and constant domains of paired TCRα and TCRβ joined by a 2A peptide-encoding sequence were inserted into MSCV-IRES-mCherry or MSCV-IRES-GFP retroviral vectors, which contain an MSCV2.2 backbone with an IRES-fluorescence protein cassette to facilitate identification of cells expressing the construct. For TCR constructs used in the ‘swapping’ experiments, a silent G to T mutation in the sequence encoding the constant region of the TCRβ chain was introduced to prevent Cas9 targeting. Production of retrovirus has been previously described52. A mixture of CD8+ and CD8− TCR reporter cell lines (58α−β−, gift from K. Murphy) were transduced with retroviruses expressing TCR pairs isolated from tumor-infiltrating αβILTCks and PD-1+ T cells. Successful pairing and expression of transduced TCRs were verified by detection of surface TCRβ in mCherry+ cells with flow cytometry. TCR-expressing reporter cell lines were co-cultured with sorted primary cancer cells from PyMT mice or a cortical thymic epithelial cell line, ANV-41-2 (gift from MRM. van den Brink) in the presence of 10 ng/ml of IFN-γ (Peprotech) for 24 hours, followed by analysis of GFP expression in mCherry+ cells.
Generation of Tap1−/− and B2m−/− PyMT cell lines.
To generate the PyMT early passage (PyMT-EP) cell line, a piece of PyMT tumor was subjected to enzymatic digestion 280 U/mL Collagenase Type 3 and 4 μg/mL DNase I in HBSS at 37°C for 30 minutes. The cell mixture was passed through a 100 μm cell strainer and were plated as a polyclonal population in a 10-cm dish in DMEM/F12 (Thermo Fisher Scientific) supplemented with 10% FBS, 1X Insulin-Transferrin-Selenium-Ethanolamine (Thermo Fisher Scientific), 100 U penicillin, 0.1 mg/ml streptomycin and 1X Normocin (Invivogen). Medium was changed regularly, and EpCAM-expressing cells were subsequently sorted.
To generate PyMT-EP cell lines lacking Tap1 or B2m, sequences encoding sgRNAs targeting Tap1 (5’-ACGGCCGTGCATGTGTCCCA) or B2m (5’-CCGAGCCCAAGACCGTCTAG) were cloned into a lentiCRISPR v2 plasmid (gift from F. Zhang, Addgene plasmid # 52961). Packaging and production of lentivirus was described previously53. Following lentiviral transduction, PyMT-EP cells were selected on media containing 1 μg/mL of puromycin for four days. H-2Db-deficient cells were subsequently sorted.
Generation of TCR ‘retrogenic’ bone marrow chimeras.
TCR ‘retrogenic’ bone marrow chimeras were generated as previously described with slight modifications54, 55. LSK cells were sorted from bone marrows of Rag1−/− mice, maintained in DMEM-F12 supplemented with 15% FBS, 10 mM HEPES, 50 ng/μL SCF (Peprotech), and 50 ng/μL TPO (Peprotech) for 24 hours prior to two consecutive transductions with TCR-IRES-GFP-expressing retroviruses. A mixture of 105 transduced Rag1−/− LSK cells and 3 × 10⁶ total bone marrow cells from Rag1+/+ mice were co-transferred intravenously into a lethally irradiated (9.5 Gy) 8- to 10-week old PyMT recipient mouse via retroorbital injection. Bone marrow chimeras were analyzed when palpable tumors appeared between 8 and 12 weeks post reconstitution. Donor T cells expressing a monoclonal TCR were gated as GFP+TCRβ+ whereas those expressing a polyclonal TCR repertoire were identified as GFP−TCRβ+.
For fate mapping experiments using the Zbtb16-CreRosa26LSL-YFP mice, bone marrow chimeras were generated as previously described56 to circumvent basal labeling by the Zbtb16-Cre allele. Briefly, CD45.2+ YFP− LSKs were sorted and intravenously transferred to lethally irradiated CD45.1+CD45.2+ PyMT mice.
TCR ‘swapping’ and adoptive transfers in vivo.
The TCR-targeting retroviral plasmid was constructed using pTGMP (gift from S. Lowe, Addgene plasmid # 32716) as a backbone. Briefly, a sequence encoding the mCherry fluorescent protein was inserted downstream of the PGK promoter. The GFP-miR30 cassette was replaced with three consecutive hU6 promoter driven sgRNA units targeting the TCR loci. Viral supernatants were prepared by transfection of PlatE packaging cells52 with TransIT 293 (Mirus Bio). For retroviral transduction of activated T cells, CD8+ T cells from the lymph nodes of CD45.1+CD45.2+ Rosa26Cas9/Cas9 mice were isolated using the EasySep™ Mouse CD8+ T Cell Isolation Kit (StemCell Technologies) and activated with 0.1 μg/mL anti-CD3ε (145-2C11, Biolegend) and 1 μg/ml anti-CD28 (37.51, BioXCell) in multiwell tissue culture plates coated with goat antibody to Armenian hamster IgG (Jackson ImmunoResearch), followed by ‘spin-inoculation’ with retroviruses expressing TCR-targeting sgRNAs and TCRs of interest. Transduced T cells were ‘rested’ in the presence of 10 ng/mL IL-7 (Peprotech). T cells expressing the TCRs of interest in place of endogenously rearranged TCRs were sorted as mCherry+GFP+TCRβ+ and adoptively transferred into CD45.2+ tumor-bearing PyMT recipient mice via intravenous injection, followed by analysis seven days later. For adoptive transfer of thymic αβILTCk/IEL progenitors, approximately 200,000 or 600,000 cells sorted from pooled thymi from five to ten mice at four week of age were transferred intravenously into a Rag1−/− or Rag1+/+ PyMT recipient, respectively.
αβILTCk-based adoptive cellular transfer.
For transfer into lymphocyte-deficient hosts, approximately 200,000 thymic αβILTCk/IEL progenitors sorted from Ubc-CreERRosa26Stat5b-CA/+ or Ubc-CreERRosa26+/+ mice were transferred intravenously into Rag1−/−PyMT recipients. For transfer into lympho-replete hosts, approximately 1,000,000 thymic αβILTCk/IEL progenitors and CD8 single positive cells from CD45.1+CD45.2+ Ubc-CreERRosa26Stat5b-CA/+ mice were sorted and transferred intravenously into sublethally irradiated CD45.2+ PyMT recipients. All recipients subsequently receive 5 mg Tamoxifen via oral gavage one week post transfer.
Tumor measurement.
Mammary tumors in female PyMT mice were measured weekly with a caliper. Tumor burden was calculated using the formula (L × W2) × (π/6), in which L is length W is width. Total tumor burden was calculated by summing up individual tumor volumes of each mouse with an end-point defined when total burden reached 3,000 mm3 or one tumor reached 2,000 mm3.
Quantitative PCR with reverse transcription.
CD45−EpCAM+ tumor cells from S100a8-CreIl15fl/flPyMT or control PyMT mice were purified by cell-sorting. Total RNA was extracted with an RNeasy Micro Kit (Qiagen), reversed-transcribed with SuperScript II Reverse Transcriptase (ThermoFisher), and amplified in a StepOnePlus Real-Time PCR System with SYBR Green PCR Master Mix (Applied Biosystems). The change-in-cycling-threshold (2−ΔΔCt) method was used for calculation of relative target gene expression normalized to the housekeeping transcript Gapdh. RT–PCR primer pairs included Il15 forward, acatccatctcgtgctacttgt; reverse, gcctctgttttagggagacct; Gapdh forward, acagtccatgccatcactgcc; reverse, gcctgcttcaccaccttcttg.
Immunofluorescence microscopy.
Fresh human tumors were fixed in Periodate-Lysine-Paraformaldehyde (PLP) for 16–24 hours, 30% sucrose for 24 hours, then frozen in OCT. Tissue was sectioned at 20 μm thickness, blocked and permeabilized in buffer containing 0.1 M Tris, 1% BSA, 1% FBS, 0.3% Triton-X100, 2% normal mouse/rat/goat serum for 30 minutes and stained with anti-IL-15 (MAB647, R&D), AF594-conjugated anti-CHD1 (DECMA-1, Biolegend) overnight at 4°C. Slides were washed and stained with secondary AF488-conjugated goat anti-mouse antibody (A32723, Invitrogen) and DAPI. Images were taken on confocal microscope using 3 color channels. IL-15 levels were scored accordingly as the average percentage of IL-15 staining positivity among CDH1 positive cells from 10 field of view per sample. 0: no staining. 1: 1–20%, 2: 21–40%, 3: 41–60%, 4: 61–80%, 5: 81–100% positivity.
Antibodies.
The following antibodies were used in Flow cytometry: Alexa Fluor (AF) 488-conjugated anti-CD31 (MEC13.3, Biolegend), FITC-conjugated anti-PD-1 (29F.1A12, Biolegend), anti-CD8β (H35-17.2, BD Pharmingen), anti-FCER1G (FCABS400F, Mili-Mark), PE-conjugated anti-PD-1 (29F.1A12, Biolegend), anti-CD122 (TM-β1, BD Pharmingen), anti-CD117 (2B8, Biolegend), anti-H-2Db (KH95, Biolegend), PerCP-Cy5.5-conjugated anti-CD4 (GK1.5, Biolegend), PerCP-eFluor710-conjugated anti-TCRγδ (eBioGL3, Thermo Fisher Scientific), PE-Cy7-conjugated anti-CD8α (53–6.7, Biolegend), anti-PD-1 (29F.1A12, Biolegend), anti-NK1.1 (PK136, Biolegend), anti-EpCAM (G8.8, Biolegend), A647-conjugated anti-TCRβ (H57-597, Biolegend), anti-Sca1 (D7, Biolegend), anti-Granzyme B (GB11, Thermo Fisher Scientific), APC-conjugated anti-CD25 (3C7, Biolegend), anti-H-2Kb (AF6-88.5, Biolegend), APC-Cy7-conjugated anti-CD45.2 (104, Biolegend), anti-TCRβ (H57-597, Biolegend), APC-R700-conjugated anti-HLA-DR (G46-6, BD), Pacific Blue-conjugated anti-B220 (RA3-6B2, Biolegend), anti-CD19 (6D5, Biolegend), anti-CD3ε (145-2C11, Biolegend), anti-CD11b (M1/70, Biolegend), anti-Gr1 (RB6-8C5, Biolegend), anti-Ter119 (Ter119, Biolegend), anti-CD8α (53–6.7, Biolegend), Brilliant Violet (BV) 510-conjugated anti-CD45 (30-F11, BD Pharmingen), BV 605-conjugated anti-CD5 (53–7.3, BD Pharmingen), anti-CD45 (30-F11, BD Pharmingen), BV 650-conjugated anti-CD45.1 (A20, Biolegend), anti-CD45 (30-F11, BD Pharmingen), BV 711-conjugated anti-CD49a (Ha31/8, BD Pharmingen), BV 786-conjugated anti-CD103 (2E7, BD Pharmingen), Biotinylated anti-CD3ε (17A2, Biolegend), anti-Gr1 (RB6-8C5, Biolegend), anti-B220 (RA3-6B2, Biolegend), anti-Ter119 (Ter119, Biolegend), anti-CD11b (M1/70, Biolegend). Secondary reagents: Streptavidin-conjugated BV 421 (Biolegend). AF647-conjugated CD1d/PBS-57 tetramer was supplied by the NIH Tetramer Core Facility.
Statistical analysis.
All statistical measurements are displayed as mean ± S.D. P-values were calculated with an unpaired two-tailed Student’s t-test for two-group comparisons, by one-way ANOVA for multi-group comparisons with the Turkey post hoc test, and by Kolmogorov-Smirnov test for comparison of frequency distributions using Prims 8 software. To calculate differences in diffusion distance between clusters defined in Figure 1a, we first estimated the diffusion map for all clusters (Figure 1c). The diffusion distance was defined as the pairwise Euclidean distance between each point in three-dimensional diffusion map space (Figure 1c) and points in other clusters. Statistical differences between the distribution of diffusion distances for each pair of clusters were calculated using a two-sided Wilcoxon test. Adjusted P-values of < 0.05 were considered significant.
Data availability
All processed single-cell RNA-seq and bulk RNA-seq data that support the findings of this study have been deposited with GEO under accession code GSE195937. Previously published single-cell RNA-seq data reanalyzed here are available under accession code GSE108989.
Extended Data
Extended Data Figure 1. scRNA-seq analysis of tumor-infiltrating CD8+ T cells.
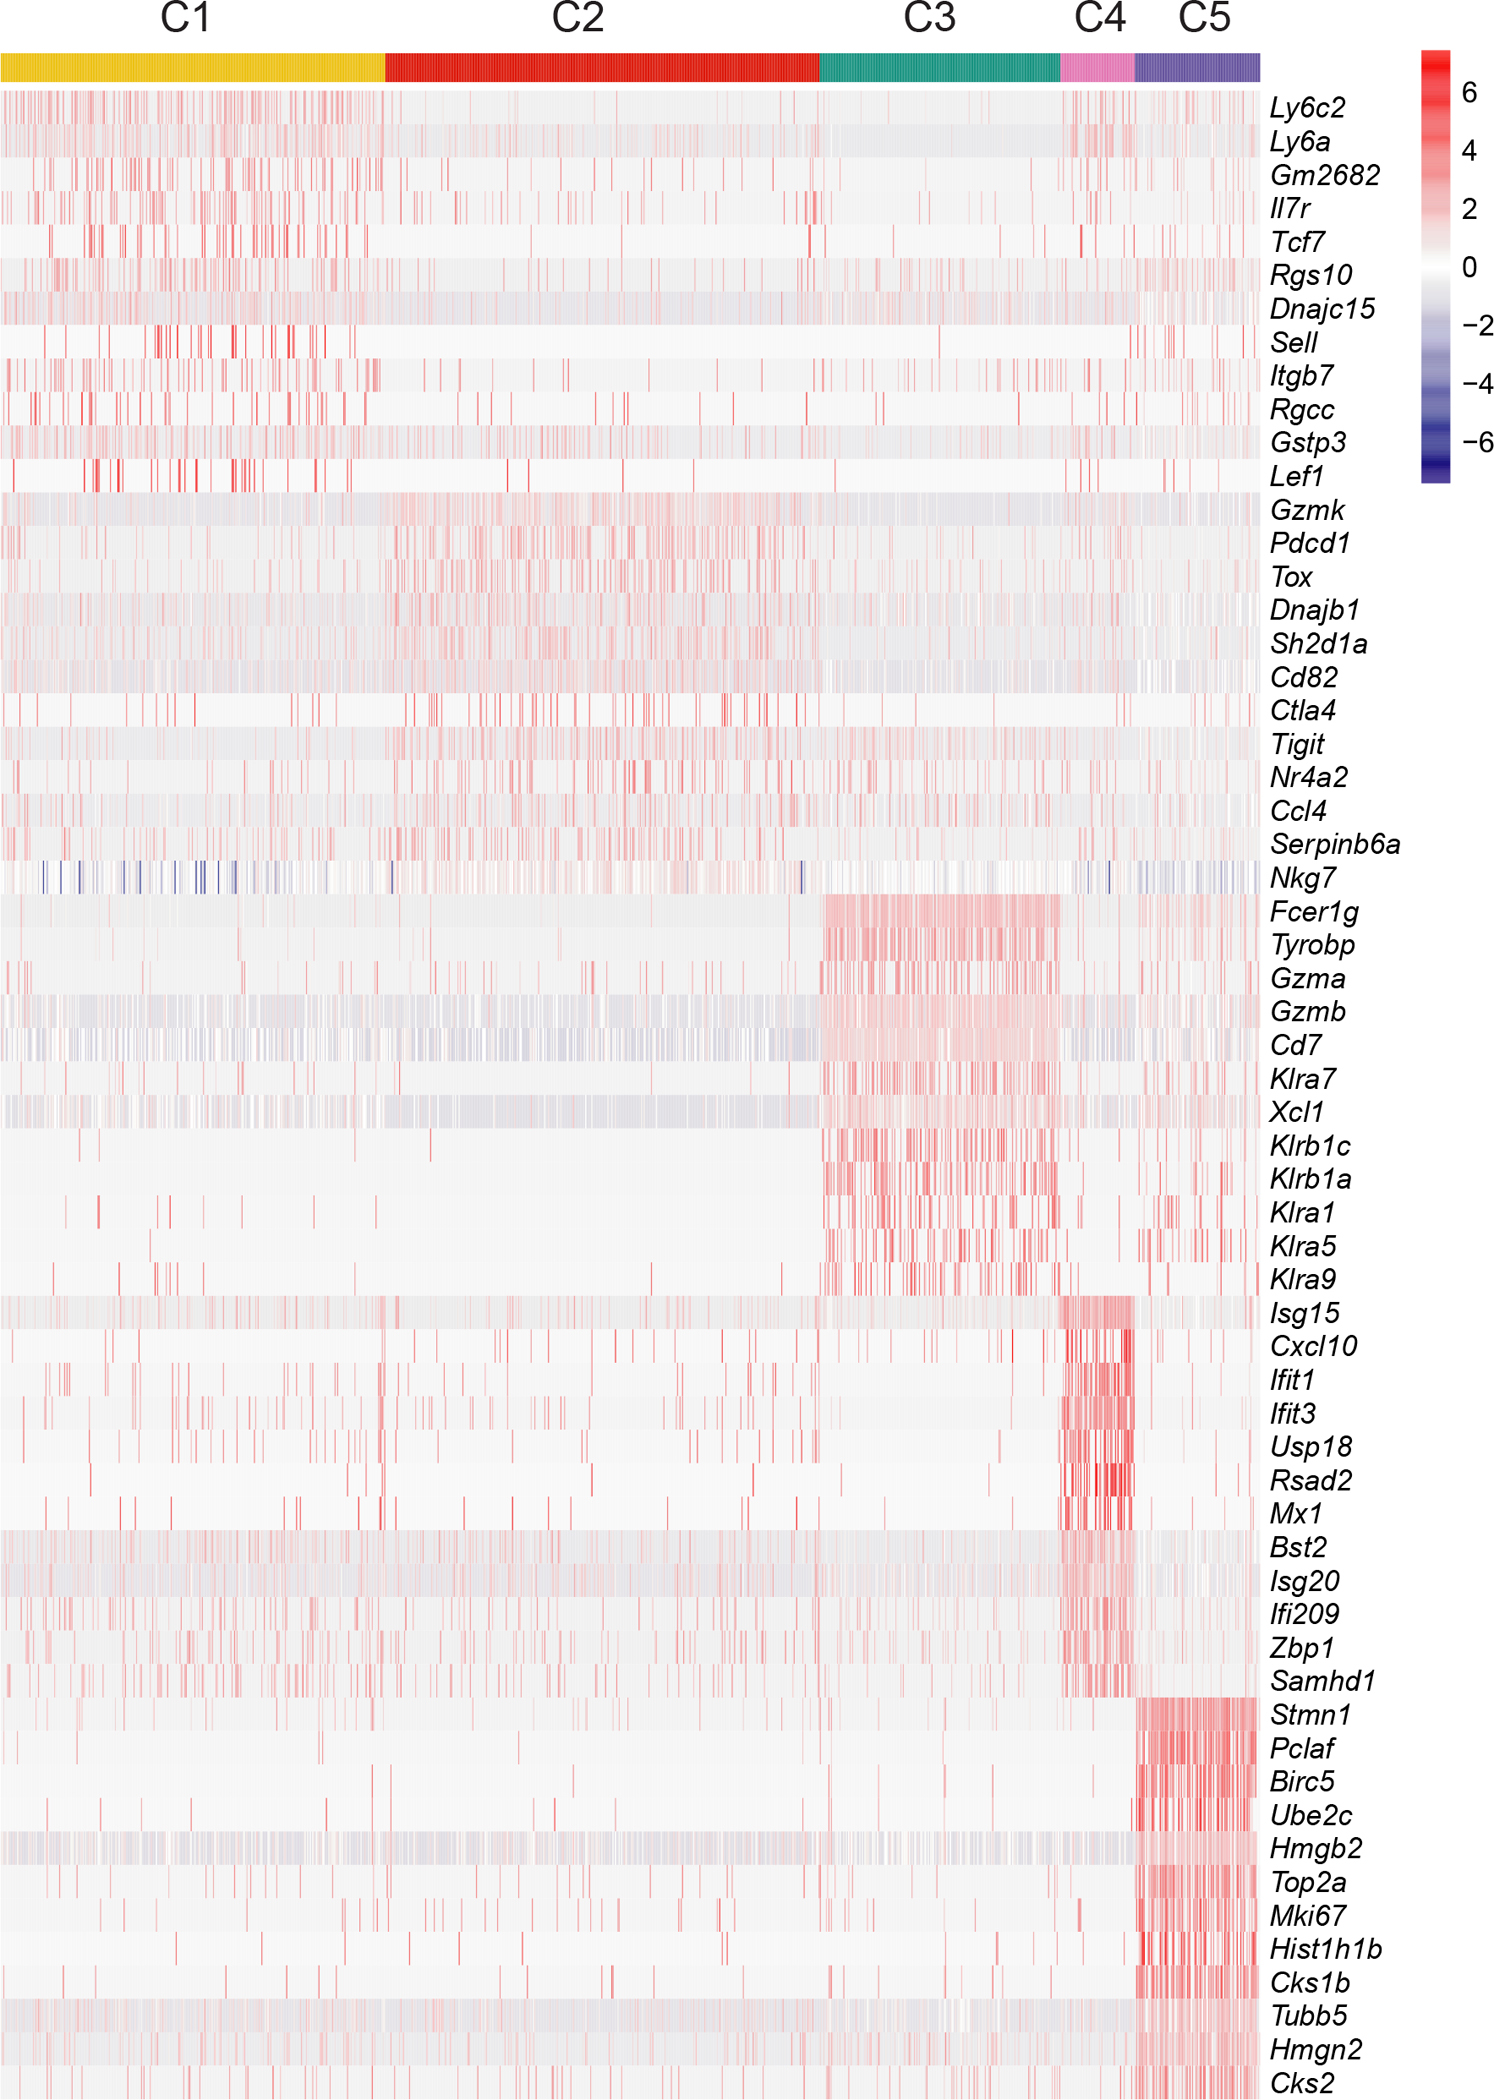
Heat map of the expression levels of selected genes in different clusters.
Extended Data Figure 2. Distinct developmental trajectories underlie the evolutionarily conserved αβILTCk responses.
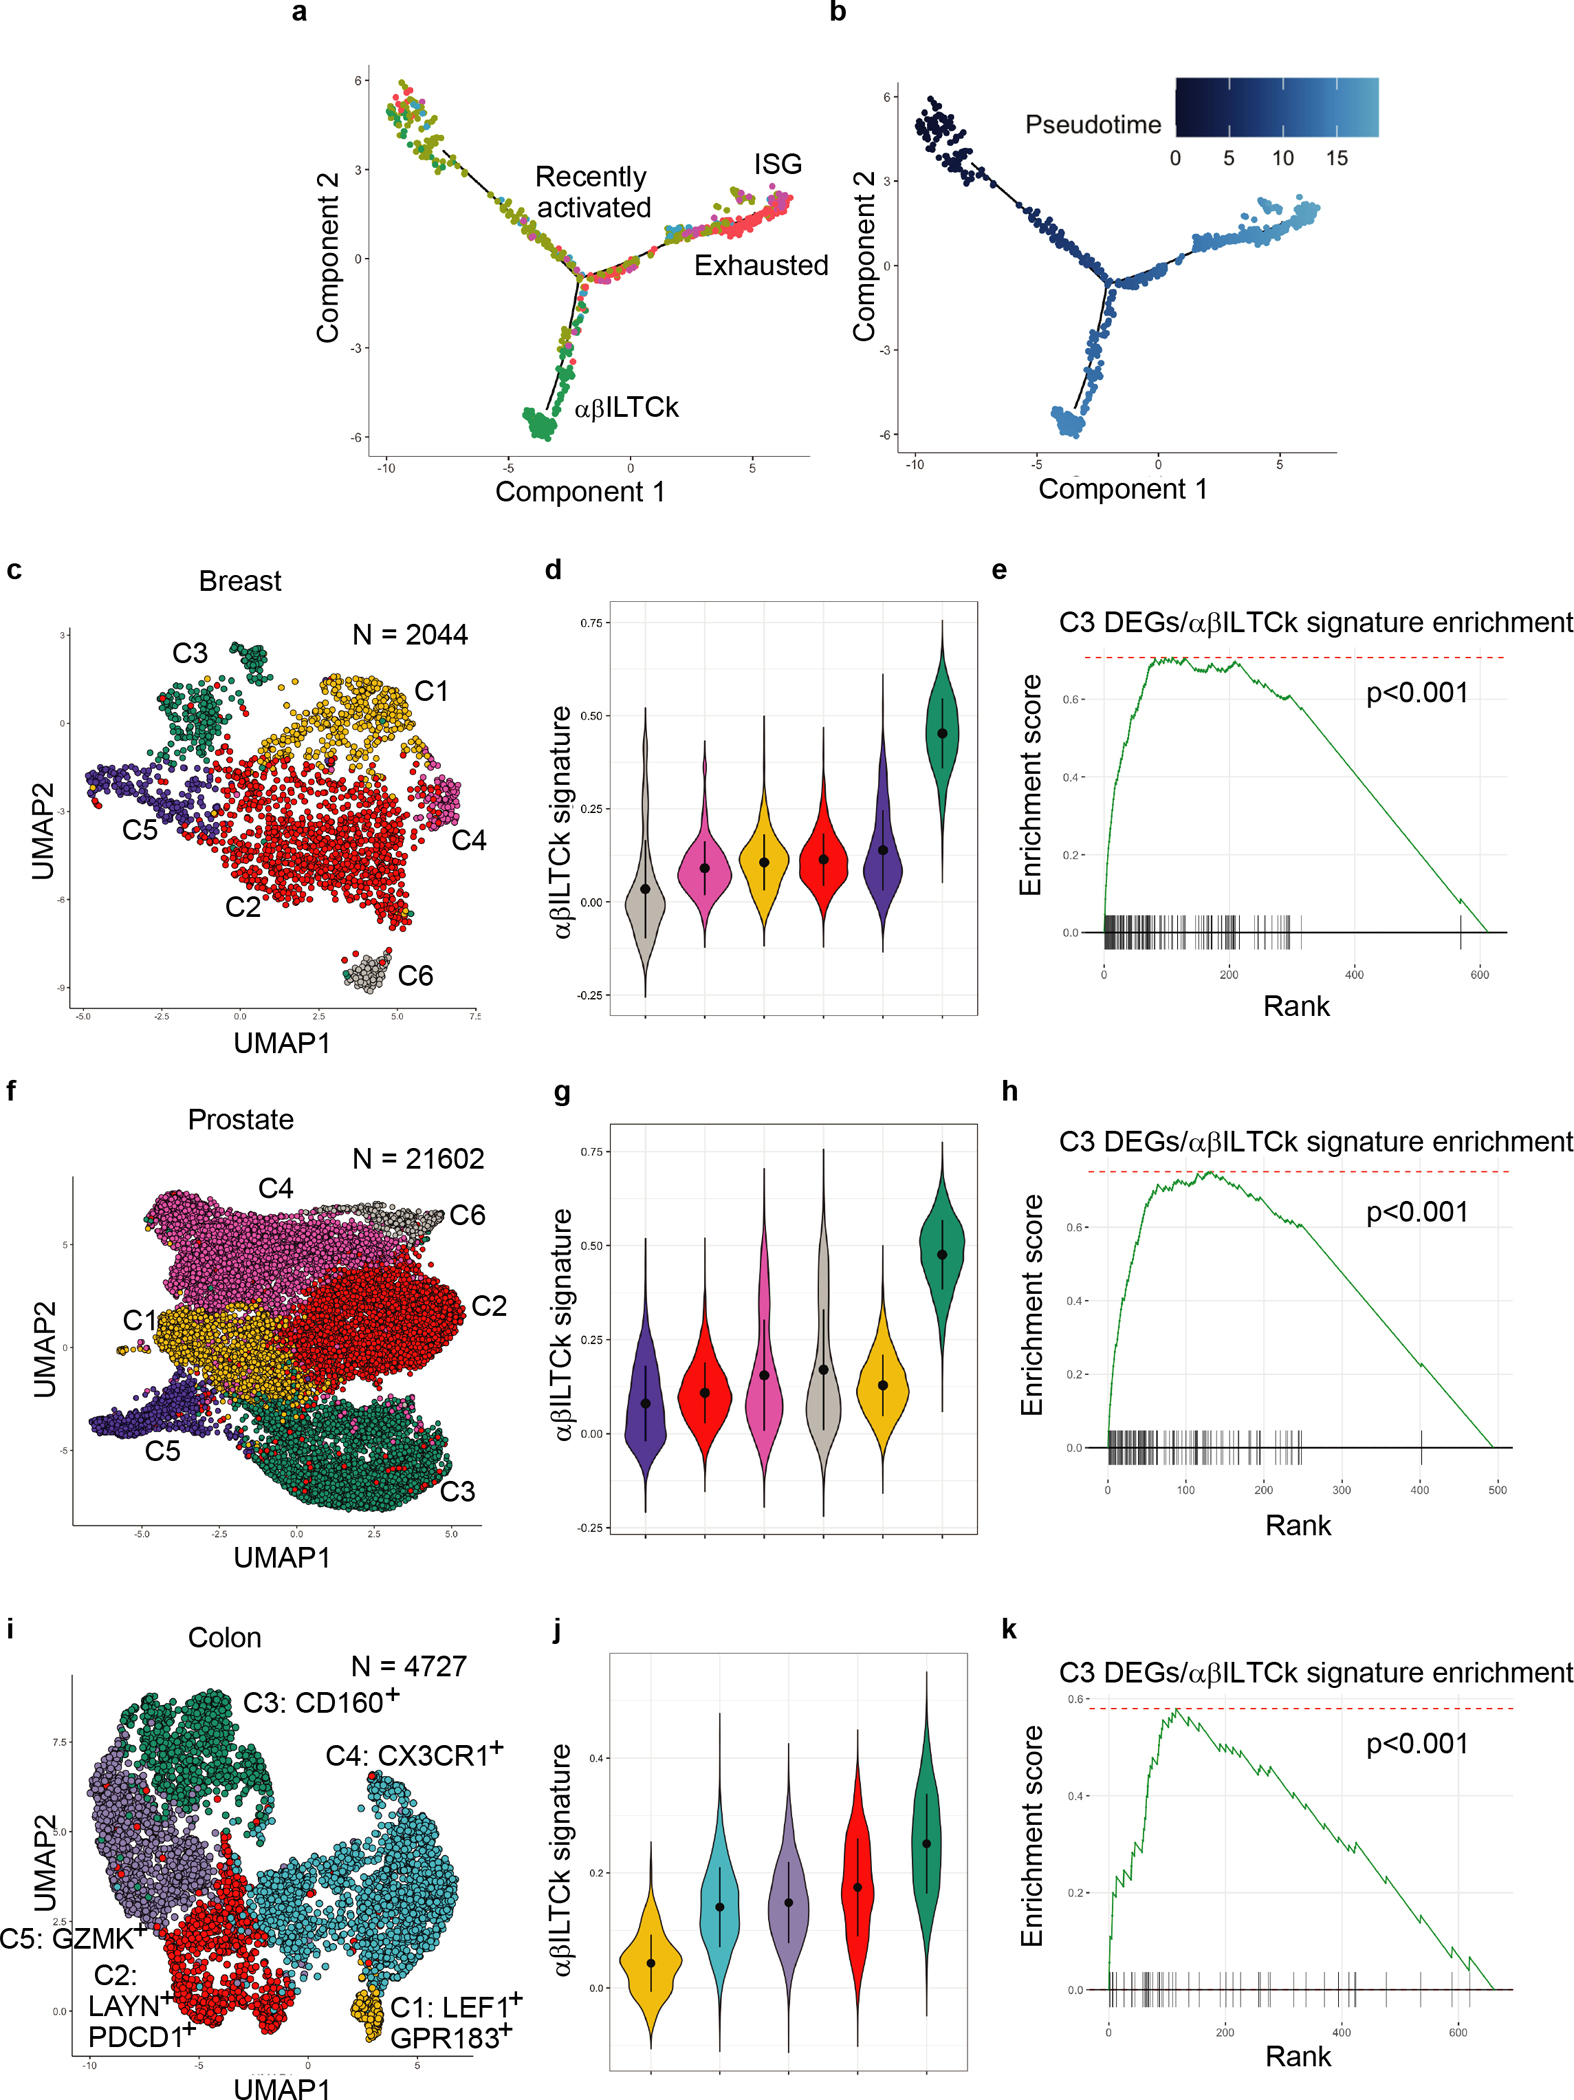
a-b, Monocle pseudotime analysis showing hypothetical developmental trajectories of indicated tumor-infiltrating CD8+ T cell subsets using recently activated cells as a starting population. c, Uniform manifold approximation and projection (UMAP) of CD45+TCRβ+CD8α+ lymphocytes isolated from breast tumor tissues of PyMT mice. d, Violin plots showing the enrichment of αβILTCk gene signature in the indicated cell clusters from PyMT mice. e, Enrichment of αβILTCk signature genes in cluster C3 from PyMT mice. f, UMAP of CD8+ T cells isolated from prostate tumor tissues of TRAMP mice. g, Enrichment of αβILTCk gene signature in the indicated cell clusters from TRAMP mice. h, Enrichment of αβILTCk signature genes in cluster C3 from TRAMP mice. i, UMAP of CD8+TCRαβ+ T cells present in a previously published human colorectal carcinoma dataset12. j, Violin plots showing enrichment of αβILTCk gene signature in various cell clusters from the human colorectal carcinoma tissues. k, Enrichment of αβILTCk signature genes in cluster C3 from the human colorectal carcinoma dataset.
Extended Data Figure 3. Recognition of cancer cell antigens by NK1.1+ αβILTCk-TCRs.
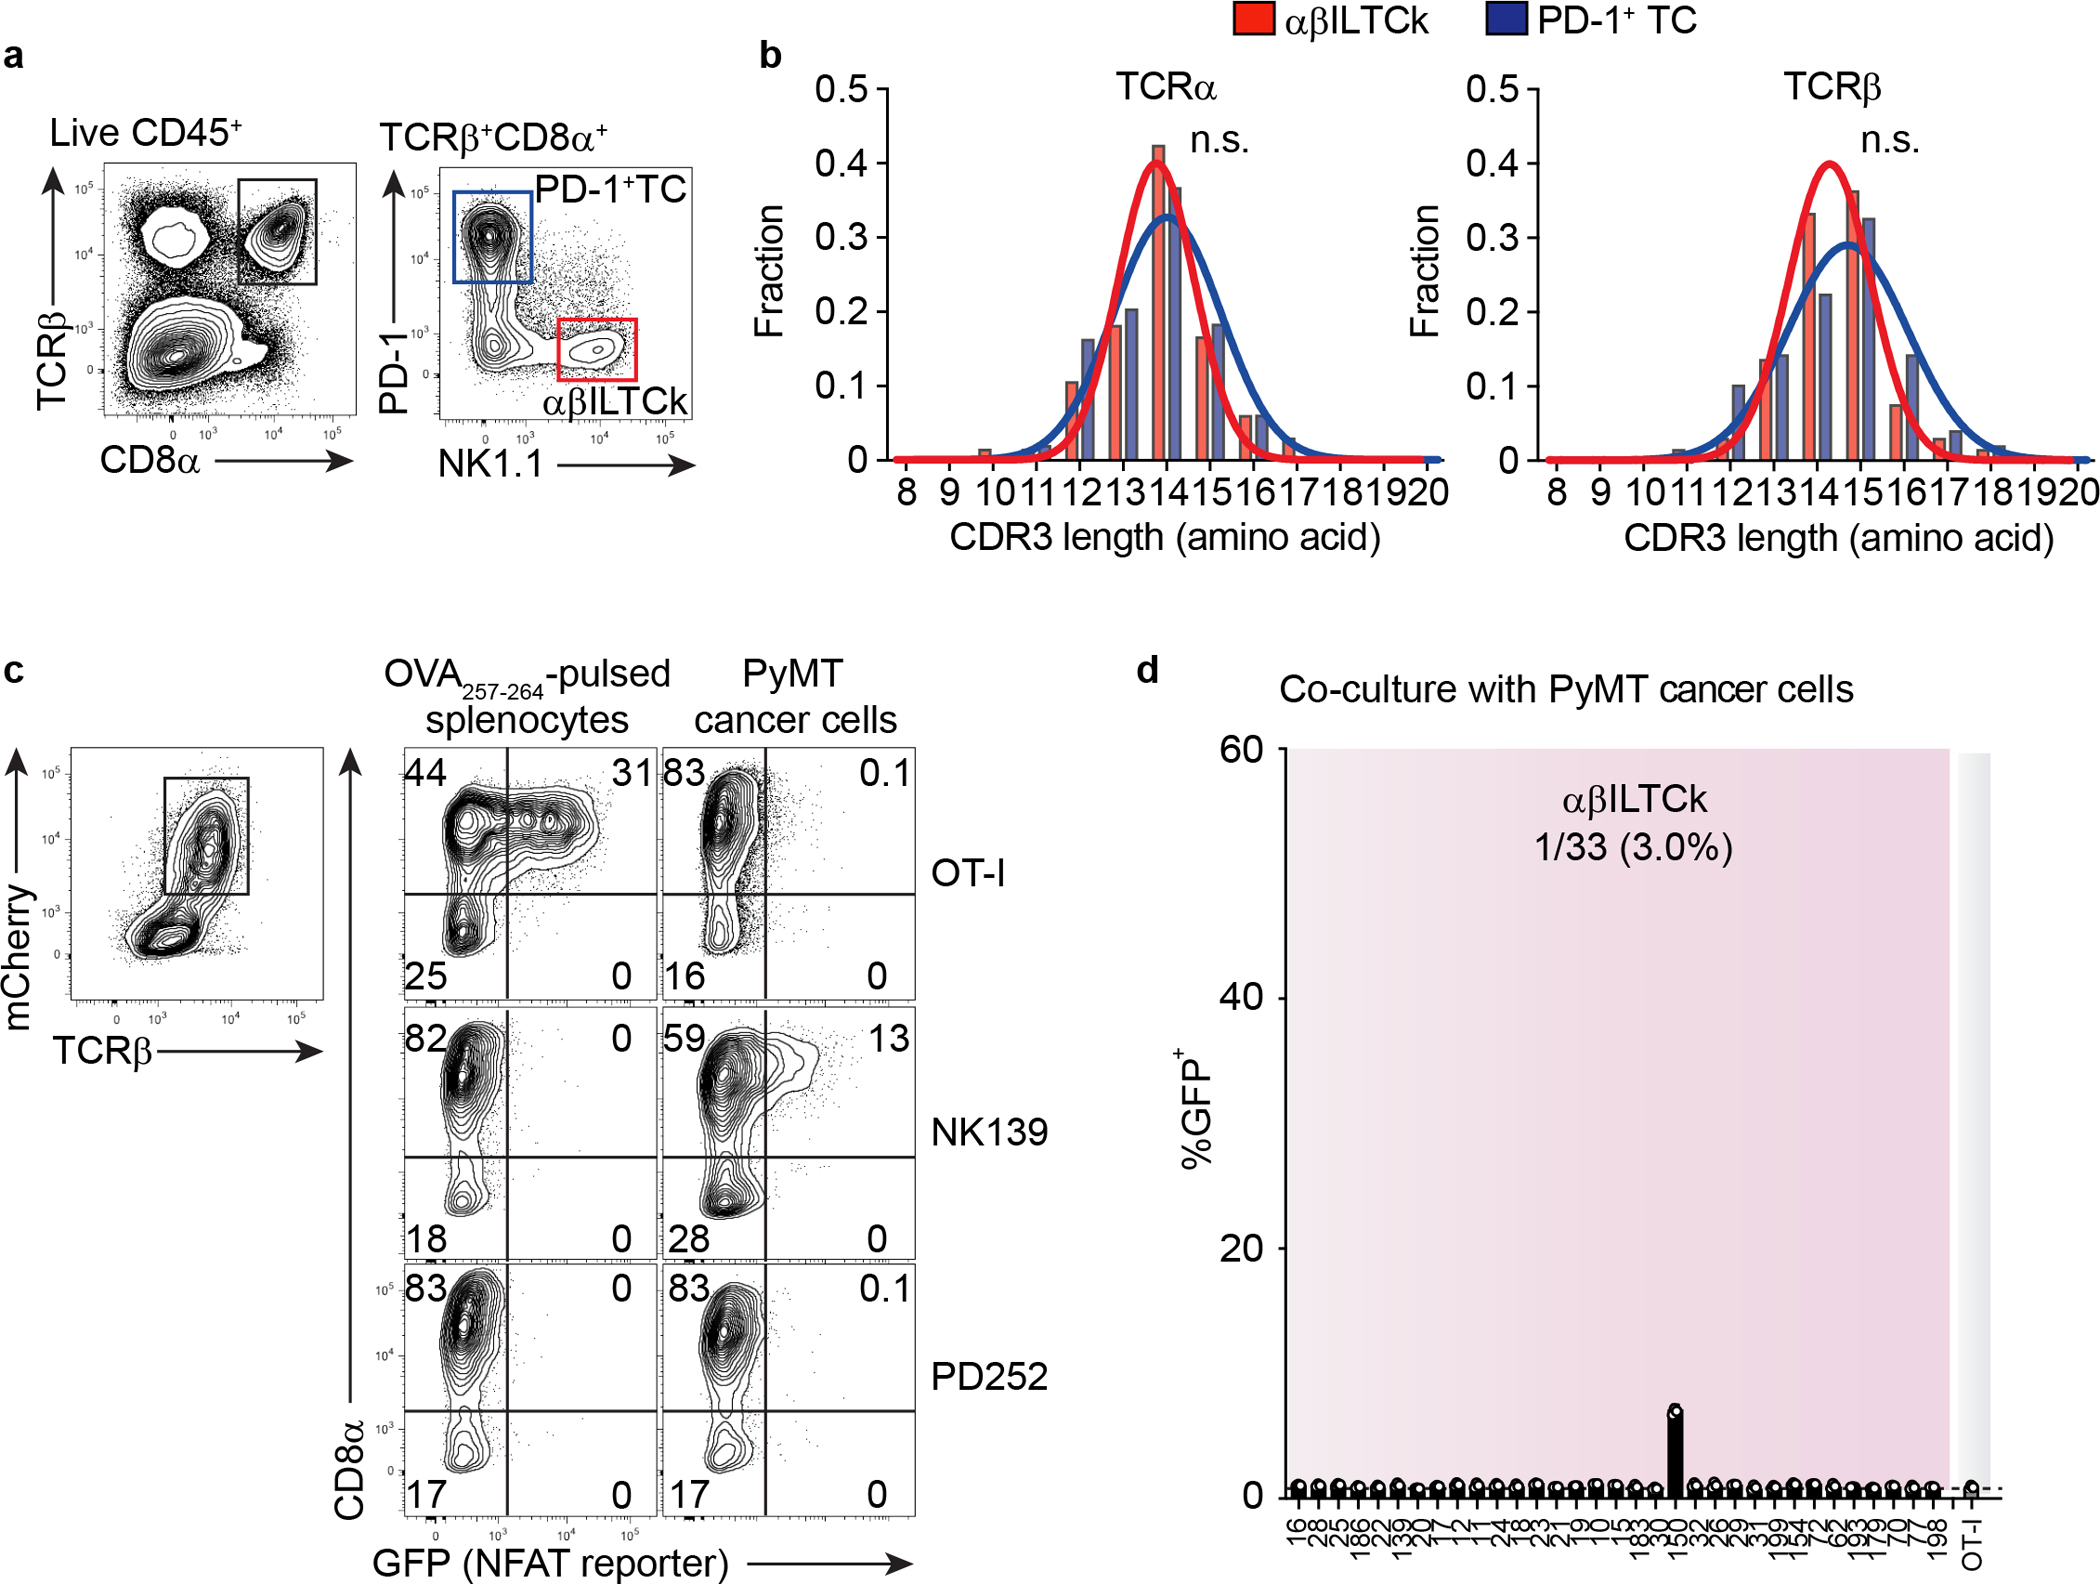
a, A representative flow plot showing the gating strategy used to isolate NK1.1+ αβILTCks and PD-1+ T cells (TCs) from PyMT mice. NK1.1+ αβILTCks are identified as CD45+TCRβ+CD8α+PD-1−NK1.1+ whereas PD-1+ TCs are defined as CD45+TCRβ+CD8α+PD-1+NK1.1−. b, A histogram showing the distribution of CDR3 lengths of TCRα and TCRβ pairs isolated from αβILTCks and PD-1+ TCs. Data are pooled from two independent experiments. c, Flow cytometric analysis showing the frequency of GFP+ cells among CD8+ and CD8− reporter cell line expressing indicated TCRs 24 hours after co-culturing with primary PyMT cancer cells or splenocytes pulsed with the SIINFEKL peptide (OVA257–264). Data are representative of three independent experiments. d, Frequency of GFP+ cells among CD8− reporter cell line expressing indicated NK1.1+ αβILTCk-derived TCRs 24 hours after co-culturing with primary PyMT cancer cells. n = 3 for each TCR. All statistical data are shown as mean ± S.D (biologically independent mice in a-c and independent samples in d).
Extended Data Figure 4. The majority of αβILTCks recognize tumor-associated antigens presented in the context of classical MHC-I.
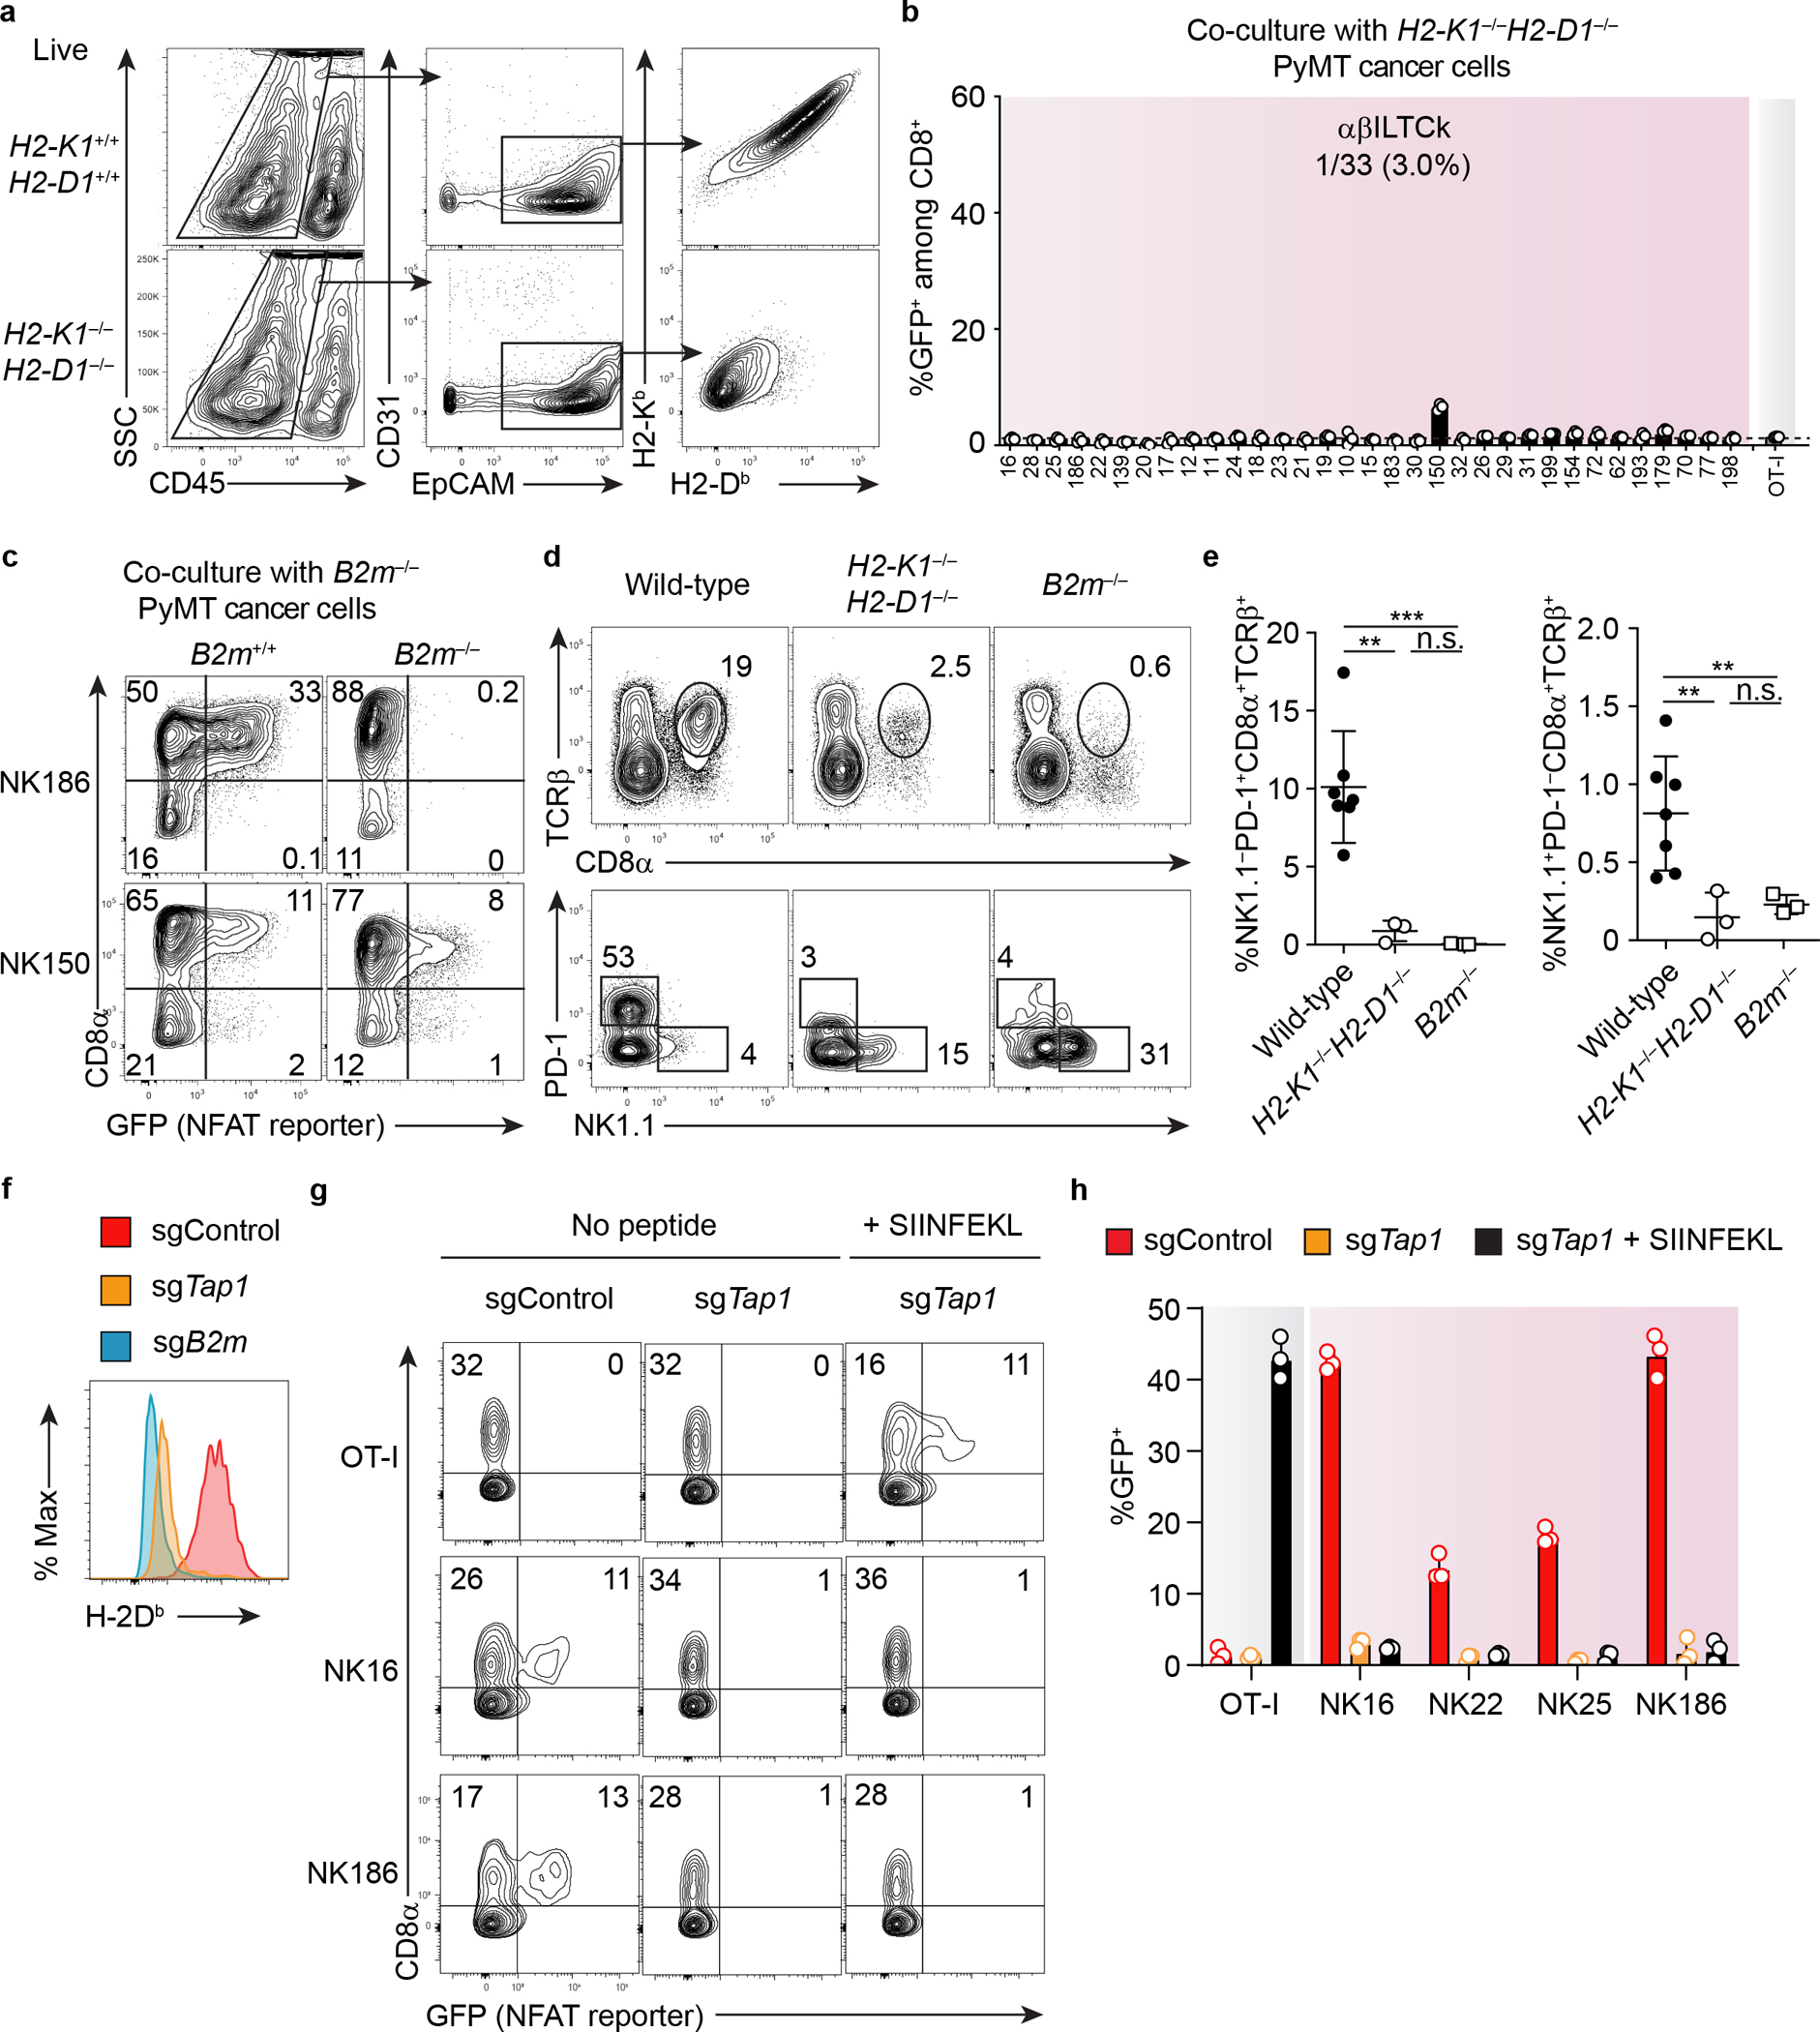
a, A representative flow plot showing the expression of classical MHC-I (H2-Kb and H2-Db) on PyMT cancer cells, defined as CD45−CD31−EpCAM+ from mice of indicated genotypes. Data are representative of two independent experiments. b, Frequency of GFP+ cells among CD8+ reporter cell line expressing indicated TCRs 24 hours after co-culturing with primary PyMT cancer cells doubly deficient for H2-Kb and H2-Db. Data are pooled from three independent experiments. c, Flow cytometric analysis showing the frequency of GFP+ cells among CD8+ and CD8− reporter cell line expressing the indicated TCRs 24 hours after co-culturing with primary PyMT cancer cells lacking β2m. Data are representative of two independent experiments. d, Frequency of TCRβ+CD8α+ cells among CD45+ tumor-infiltrating cells in mice lacking classical MHC-I (H2-K1−/−H2-D1−/−, n = 3), both classical and non-classical MHC-I (B2m−/−, n = 3) or control wild-type mice (n = 7). The profiles of PD-1 and NK1.1 expression by TCRβ+CD8α+ are shown in the bottom panel. e, Statistical analysis of frequency of PD-1+ T cells and αβILTCks among tumor-infiltrating CD45+ cells in mice of indicated genotypes. f, Flow cytometric analysis showing H-2Db expression on control, TAP1- or β2m-deficient PyMT cell lines generated by Cas9-mediated genome editing with small guide RNA (sgRNA). g, Expression of GFP in reporter cell lines expressing the indicated TCRs 24 hours after co-culture with control or TAP1-deficient PyMT cells lines in the presence of absence of SIINFEKL peptide. h, Frequency of GFP+ cells among TCR-expressing reporter cells after co-culture with PyMT cell lines of indicated genotypes with or without SIINFEKL peptide. Data are pooled from three independent experiments. All statistical data are shown as mean ± S.D (biologically independent mice in a,c-e and independent samples in b,f-h). **P < 0.01; ***P < 0.001 and n.s.: not significant.
Extended Data Figure 5. Generation of CD8+ T cells with altered specificity via TCR ‘swapping.’.
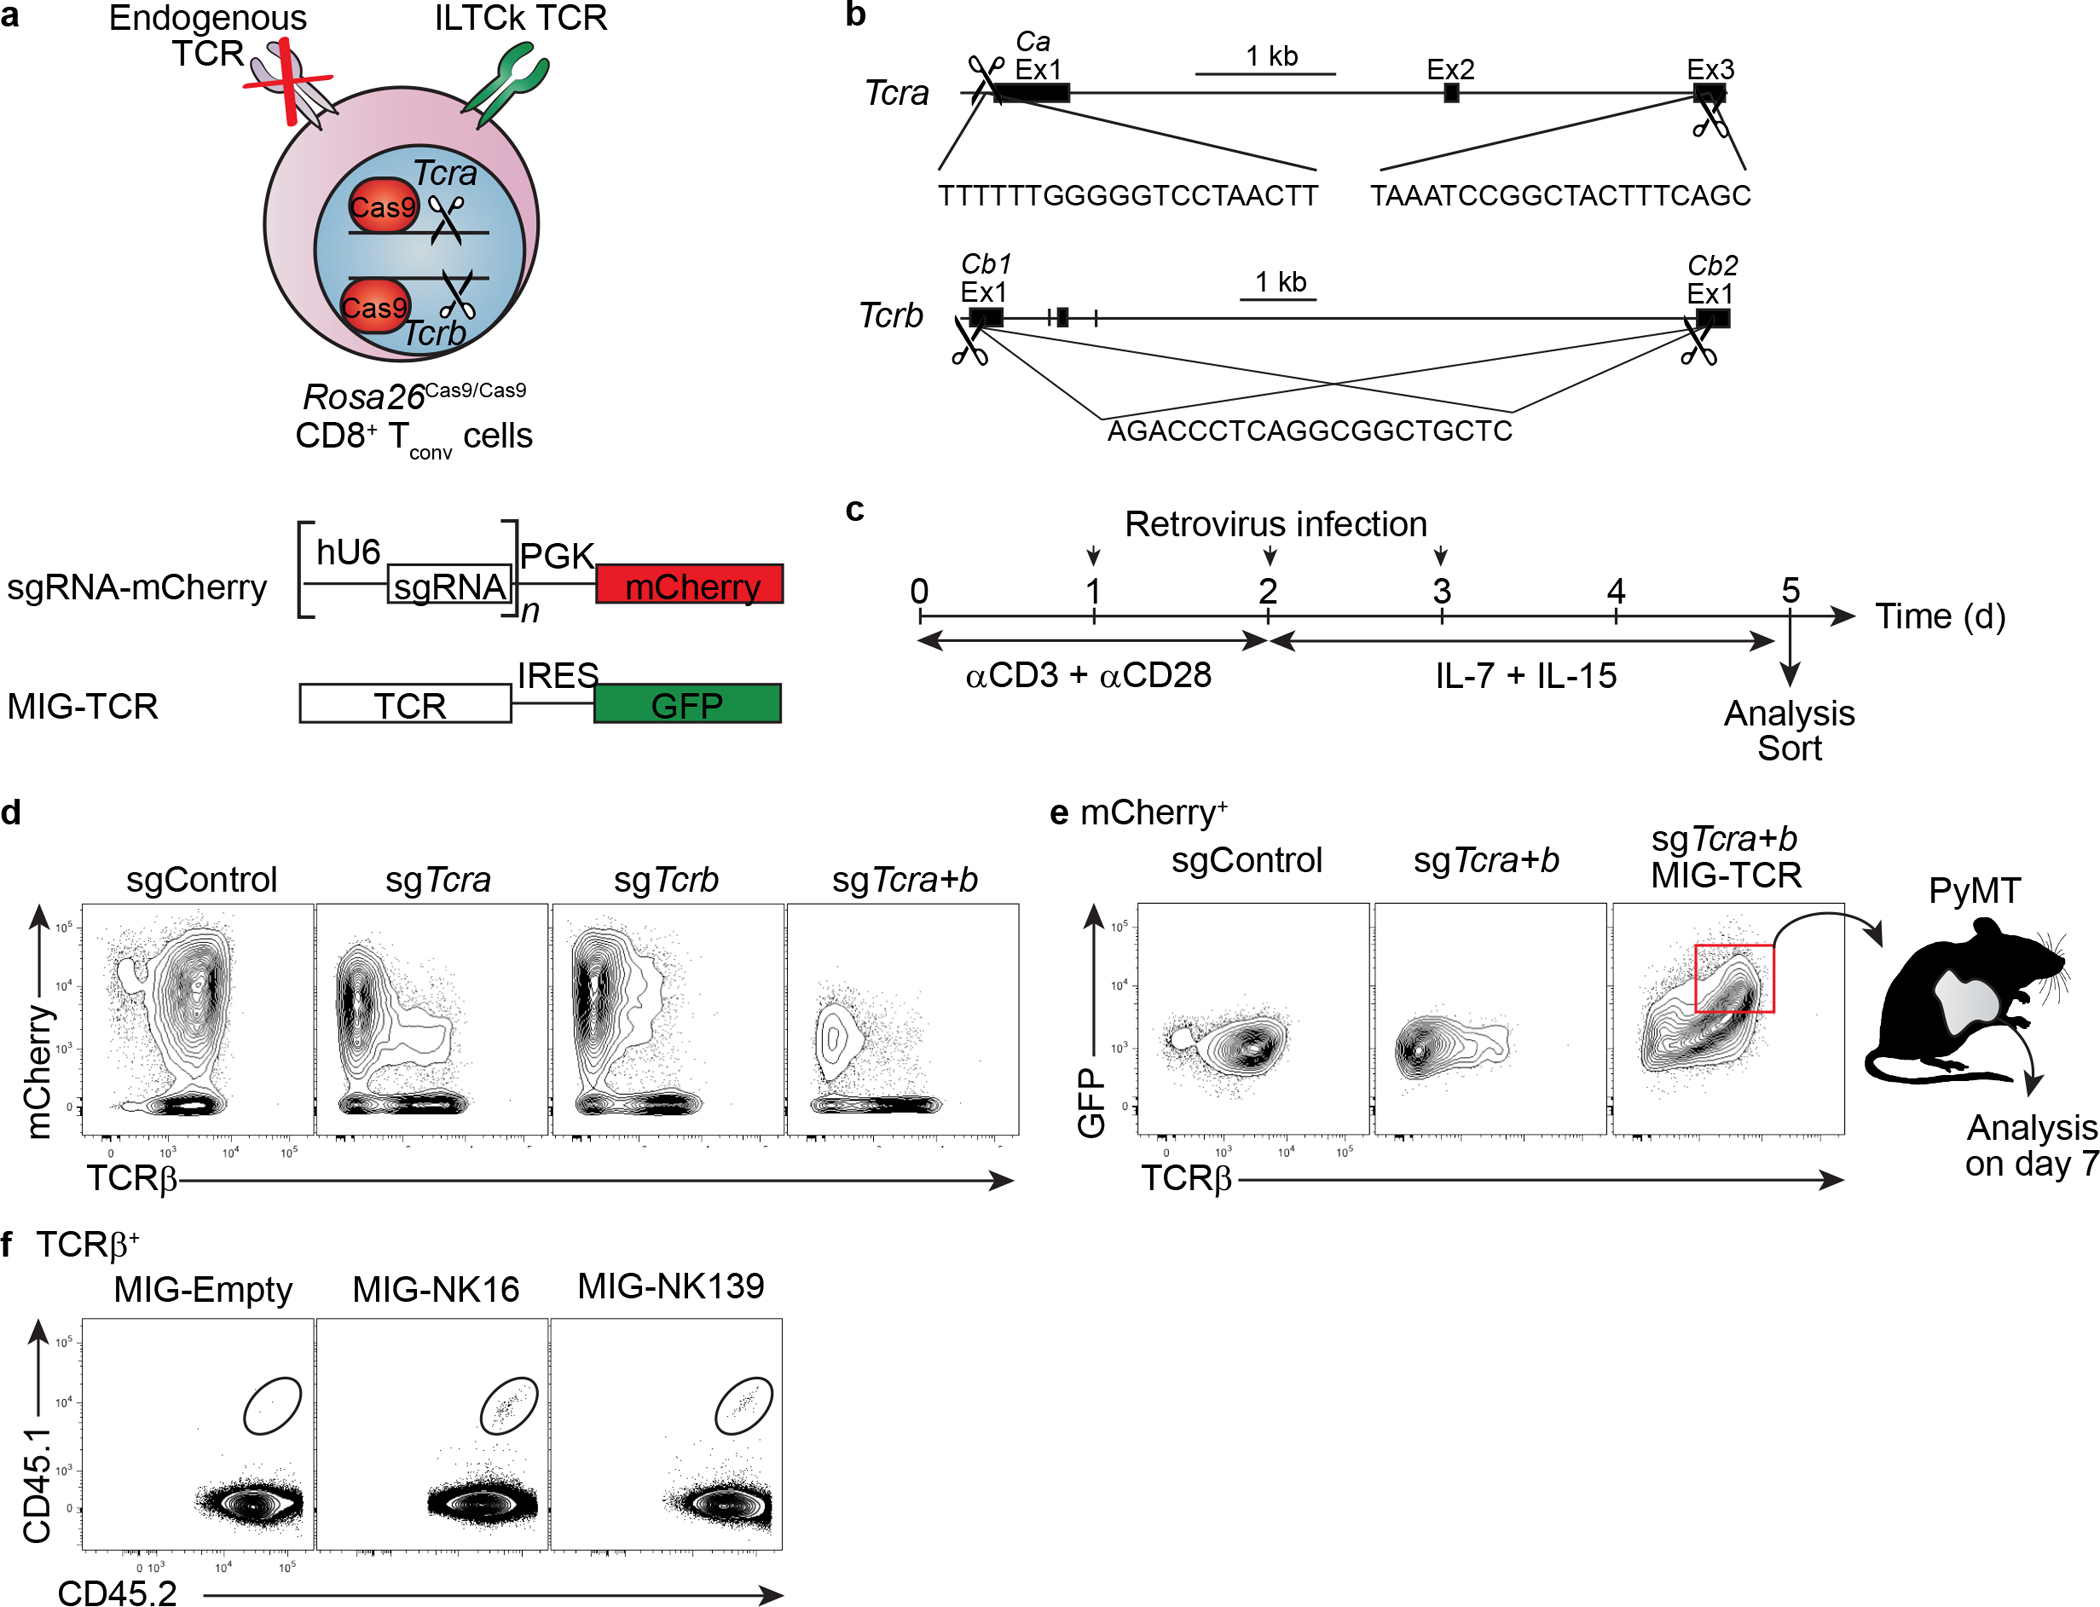
a-b, A schematic diagram showing the experimental design. Cas9-mediated deletion of endogenously rearranged TCR in CD8+ T cells is achieved by the introduction of three distinct TCR-loci-targeting small guide RNAs (sgRNAs) expressed from a single retrovirus. A TCR of interest is introduced into the TCR-deleted CD8+ T cells by another retrovirus. c, A timeline outlining the steps to generate CD8+ T cells with altered antigen receptor specificity. d, Representative flow plots showing the successful deletion of both the TCRα and TCRβ chains after transduction with sgRNA-expressing retrovirus. e, Flow plots showing the re-expression of surface TCR after retrovirus-mediated introduction of a TCR of interest. f, Representative flow plots showing the colonization of tumor tissues in CD45.2+ recipient mice by CD45.1+CD45.2+ donor CD8+ T cells, which have undergone the ‘swap’ procedure to express the indicated TCRs seven days post adoptive transfer. Data are representative of two independent experiments. Biologically independent mice in f and independent samples in d-e.
Extended Data Figure 6. αβILTCk development is cDC1-independent.

a, Flow cytometric analysis of TCRβ, CD8α, PD-1, and NK1.1 expression in tumor-infiltrating CD45+ cells from Batf3−/−PyMT (n = 10) and control Batf3+/+PyMT mice (n = 13). b, Frequency of tumor-infiltrating PD-1+ T cells and αβILTCks in mice of indicated genotypes. c, Flow cytometric analysis of TCRβ, CD8α, PD-1, and NK1.1 expression in tumor-infiltrating CD45+ cells from Itgax-CreIrf8fl/flPyMT (n = 8) and control Itgax-CreIrf8+/+PyMT mice (n = 9). d, Frequency of tumor-infiltrating PD-1+ T cells and αβILTCks in mice of indicated genotypes. All statistical data are shown as mean ± S.D (biologically independent mice in a-d). Two-tailed unpaired t-test in b,d. ****P < 0.0001 and n.s.: not significant.
Extended Data Figure 7. Recognition of thymus-derived self-antigens by αβILTCk-TCRs specifies αβILTCk lineage commitment from DP thymocytes.
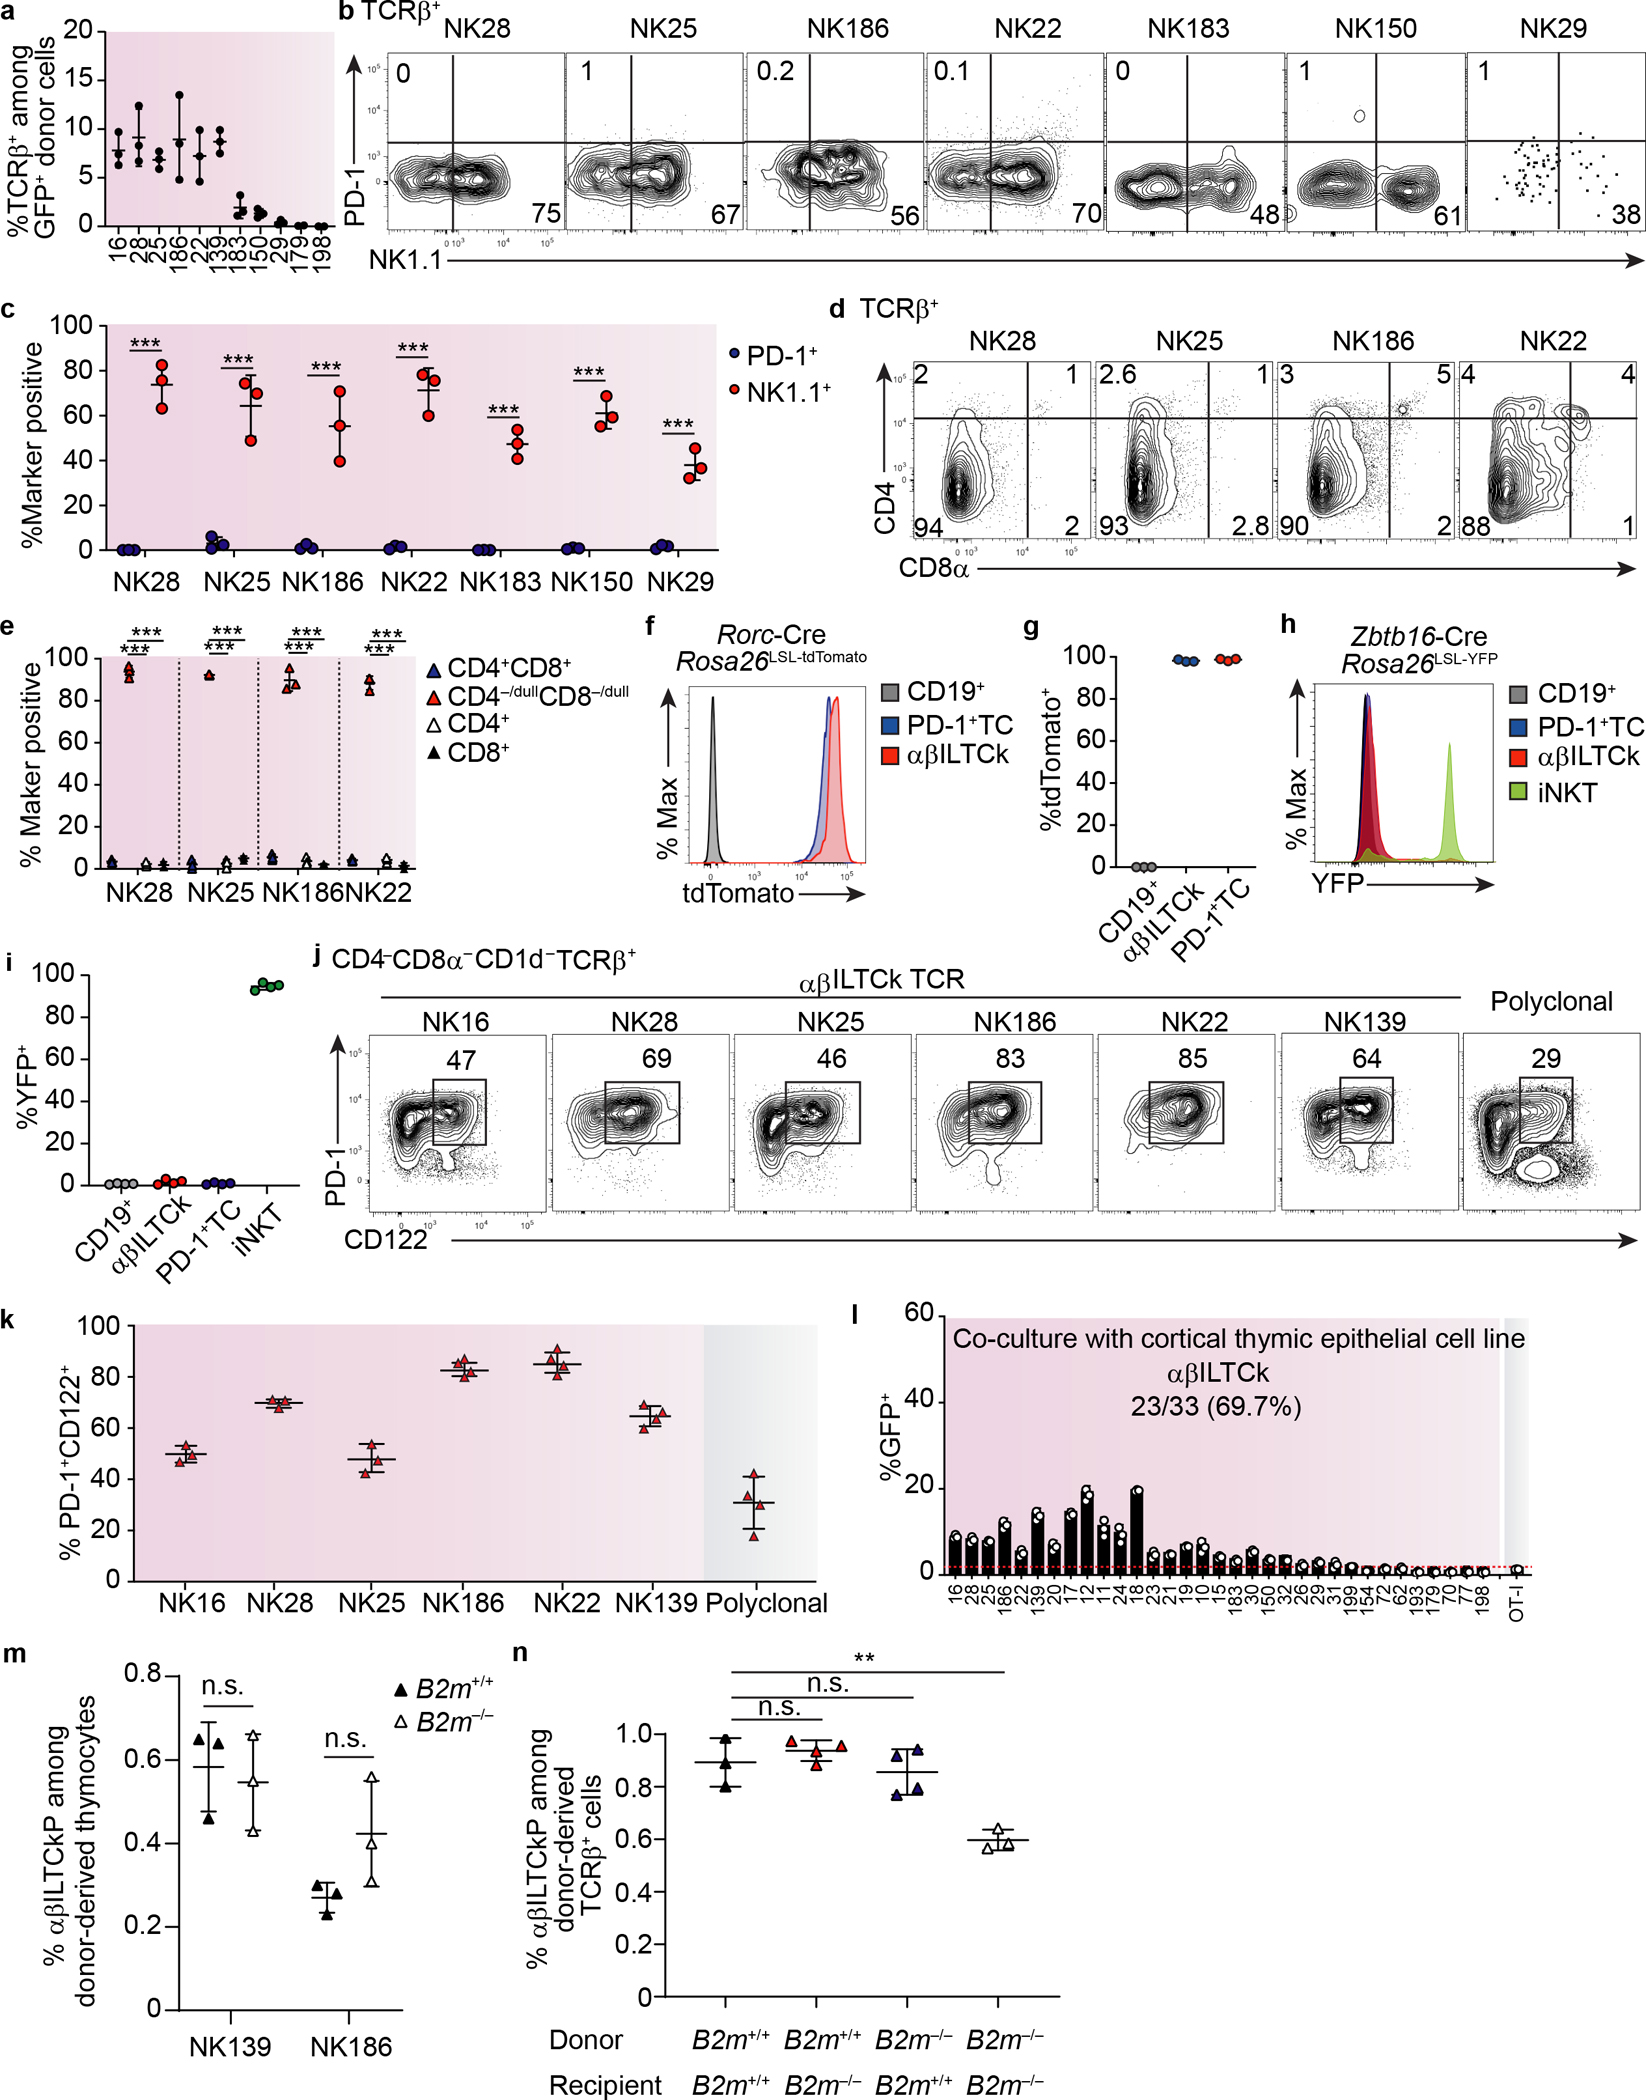
a, Frequency of TCRβ+ cells among donor-derived (GFP+) tumor-infiltrating cells in ‘retrogenic’ TCR bone marrow chimeras. n = 3 for each TCR. b, Expression of PD-1 and NK1.1 by donor-derived tumor-infiltrating T cells expressing indicated αβILTCk-derived TCRs in the TCR ‘retrogenic’ bone marrow chimeras. c, Frequency of PD-1+ or NK1.1+ cells among donor-derived tumor-infiltrating cells expressing the indicated TCRs. n = 3 for each TCR. d, Expression of CD4 and CD8α by donor-derived TCRβ+ thymocytes bearing the indicated TCRs in the TCR ‘regtrogenic’ bone marrow chimeras. e, Frequency of CD4+CD8+, CD4−/dullCD8−/dull, CD4+, and CD8+ T cells among donor-derived TCRβ+ thymocytes expressing the indicated TCRs. n = 3 for TCR. f, Expression of tdTomato by splenic CD19+ cells and intratumoral PD-1+ T cells (TCs) as well as αβILTCks in Rorc-CreRosa26LSL-tdTomatoPyMT mice. Data are representative of two independent experiments. g, Frequency of tdTomato+ cells among each indicated lymphocyte compartment. n = 3. h, Expression of YFP by splenic CD19+ cells, intratumoral PD-1+ TCs as well as αβILTCks, and thymic iNKT cells in PyMT mice reconstituted with YFP− bone marrow from Zbtb16-CreRosa26LSL-YFP mice. i, Frequency of YFP+ cells among indicated lymphocyte compartment. n = 4. j, Surface expression of PD-1 and CD122 on donor-derived TCRβ+ thymocytes bearing the indicated monoclonal TCR in the TCR ‘retrogenic’ bone marrow chimeras. Data are representative of three independent experiments. k, Frequency of PD-1+CD122+ T cells among donor-derived TCRβ+ thymocytes with indicated TCR. n = 3 for NK16, NK28, and NK25, n = 4 for NK186, NK22, and NK139 TCR. l, Frequency of GFP+ cells among CD8+ reporter cell line expressing indicated TCRs 24 hours after co-culturing with a cortical thymic epithelial cell line. Data are pooled from two independent experiments. m, Frequency of αβILTCk progenitors (αβILTCkPs) among donor-derived thymocytes expressing the NK139 or NK186 TCRs in B2m+/+ or B2m−/− recipient mice reconstituted with Rag1−/−B2m+/+ bone marrow cells. n = 3 for each TCR. n, Frequency of αβILTCkPs among donor-derived thymocytes in B2m+/+ or B2m−/− recipient mice reconstituted with B2m+/+ or B2m−/− bone marrow cells. n = 3 for each bone marrow chimera. All statistical data are shown as mean ± S.D (biologically independent mice in a-k and independent samples in i). Two-tailed unpaired t-test in c,e,m,n. **P < 0.01; ***P < 0.001 and n.s.: not significant.
Extended Data Figure 8. Continuous replenishment of the intratumoral αβILTCk compartment by circulating progenitors.
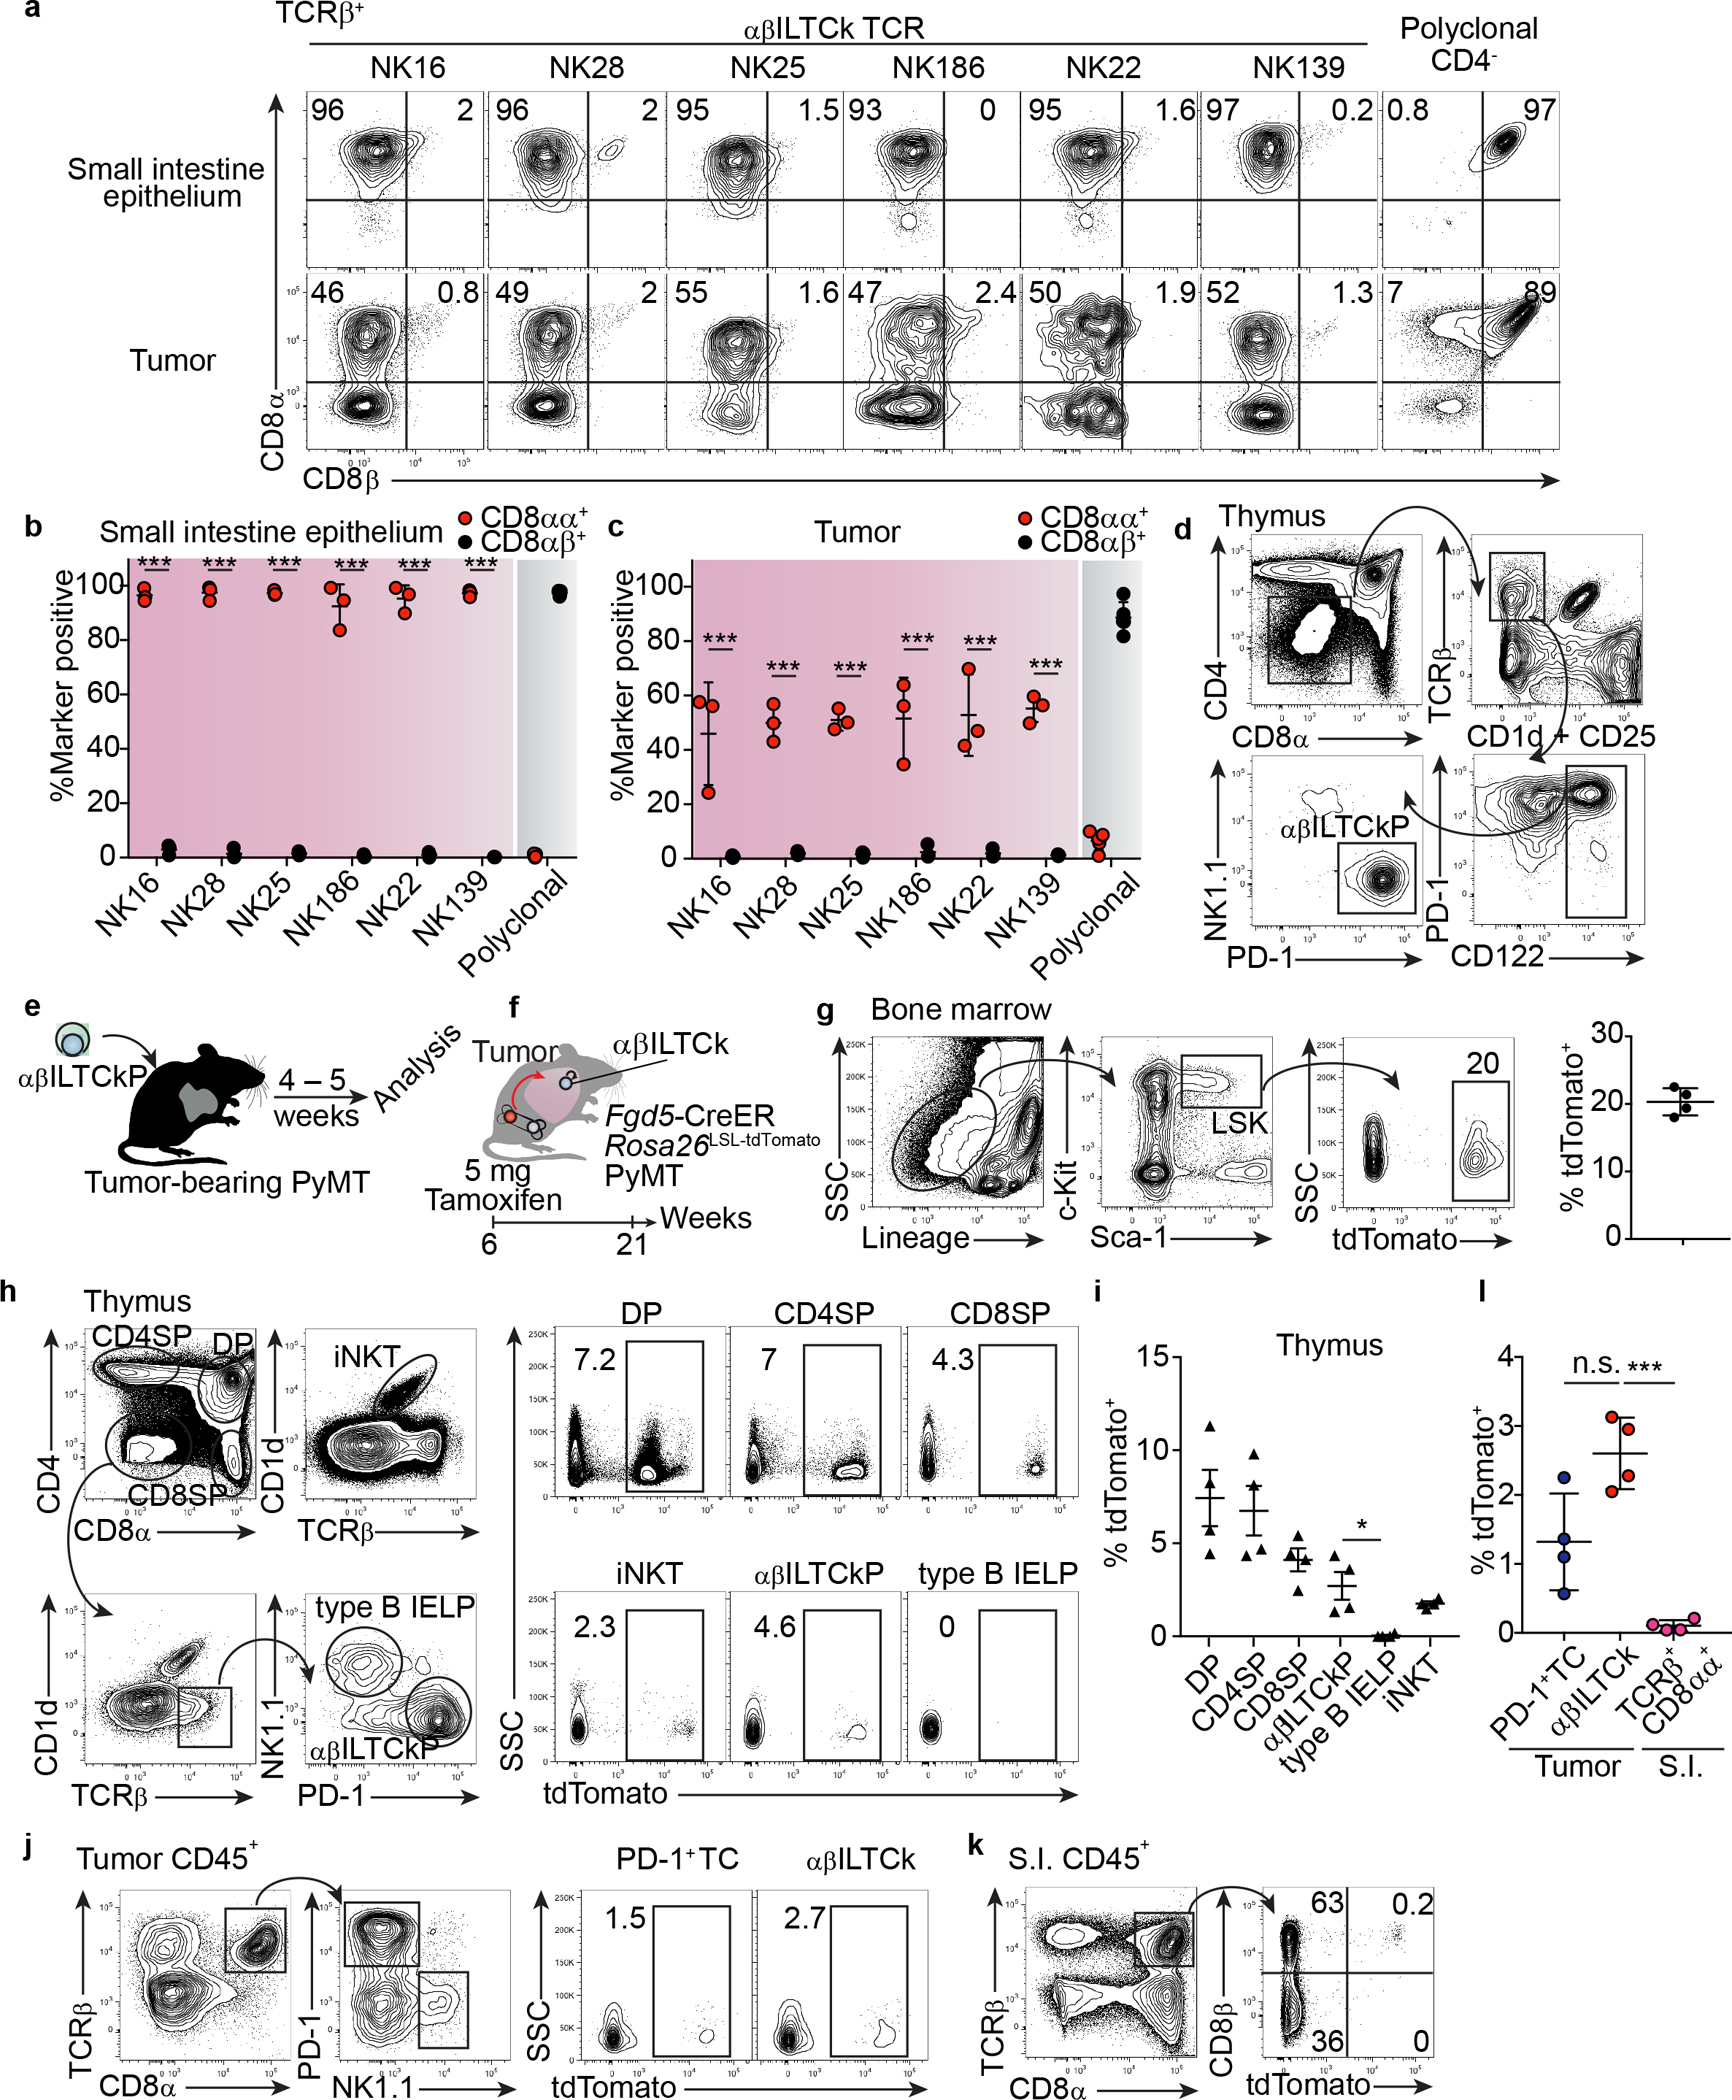
a, Flow cytometric analysis of CD8α and CD8β co-receptor expression on donor-derived T cells bearing the indicated monoclonal TCR in the tumor and small intestinal (S.I.) epithelium from TCR ‘retrogenic’ bone marrow chimeras. Data are representative of three independent experiments. b, Frequency of CD8αα+ and CD8αβ+ cells among donor TCRβ+ cells in the small intestine epithelium. c, Frequency of CD8αα+ and CD8αβ+ cells among donor TCRβ+ cells in PyMT tumors. Data are pooled from three independent experiments. d, A gating strategy for isolating the putative αβILTCk-committed thymic progenitors (αβILTCkPs). αβILTCkPs are defined as CD4−/dullCD8−/dullTCRβ+CD1d−CD25−PD-1+CD122+NK1.1−. Data are representative of three independent experiments. e, A schematic diagram showing the experimental setup to assess the differentiation potential of putative αβILTCkPs. f, Tracking the contribution of adult bone marrow hematopoiesis to various lymphocyte lineages. Fgd5-CreERRosa26LSL-tdTomatoPyMT mice were administered 5 mg of Tamoxifen via oral gavage, and lymphocytes in multiple organs were analyzed 21 weeks later for tdTomato expression. g, Flow plots showing tdTomato expression in bone marrow lineage−c-Kit+Sca1+ (LSK) hematopoietic stem cells from Fgd5-CreERRosa26LSL-tdTomatoPyMT mice 21 weeks post Tamoxifen administration. n = 4. h, Flow cytometric analysis showing the expression of tdTomato in indicated thymic progenitors as gated in the left panel. i, Frequency of Fgd5-CreER-fate-mapped cells among indicated thymic progenitor populations. n = 4. j, Flow cytometric analysis showing the expression of tdTomato in PD-1+ T cells (TCs) and αβILTCk as gated in the left panel. k, Expression of tdTomato and CD8β in TCRβ+CD8α+ cells isolated from the S.I. epithelium. l, Frequency of tdTomato-expressing cells among the indicated lymphocyte populations isolated from the tumor and S.I. epithelium. n = 4. All statistical data are shown as mean ± S.D (biologically independent mice in a-d,g-l). Two-tailed unpaired t-test in b-c,l. *P < 0.05; ***P < 0.001 and n.s.: not significant.
Extended Data Figure 9. FCER1G and CD122 co-expression identifies αβILTCks in mouse and human.
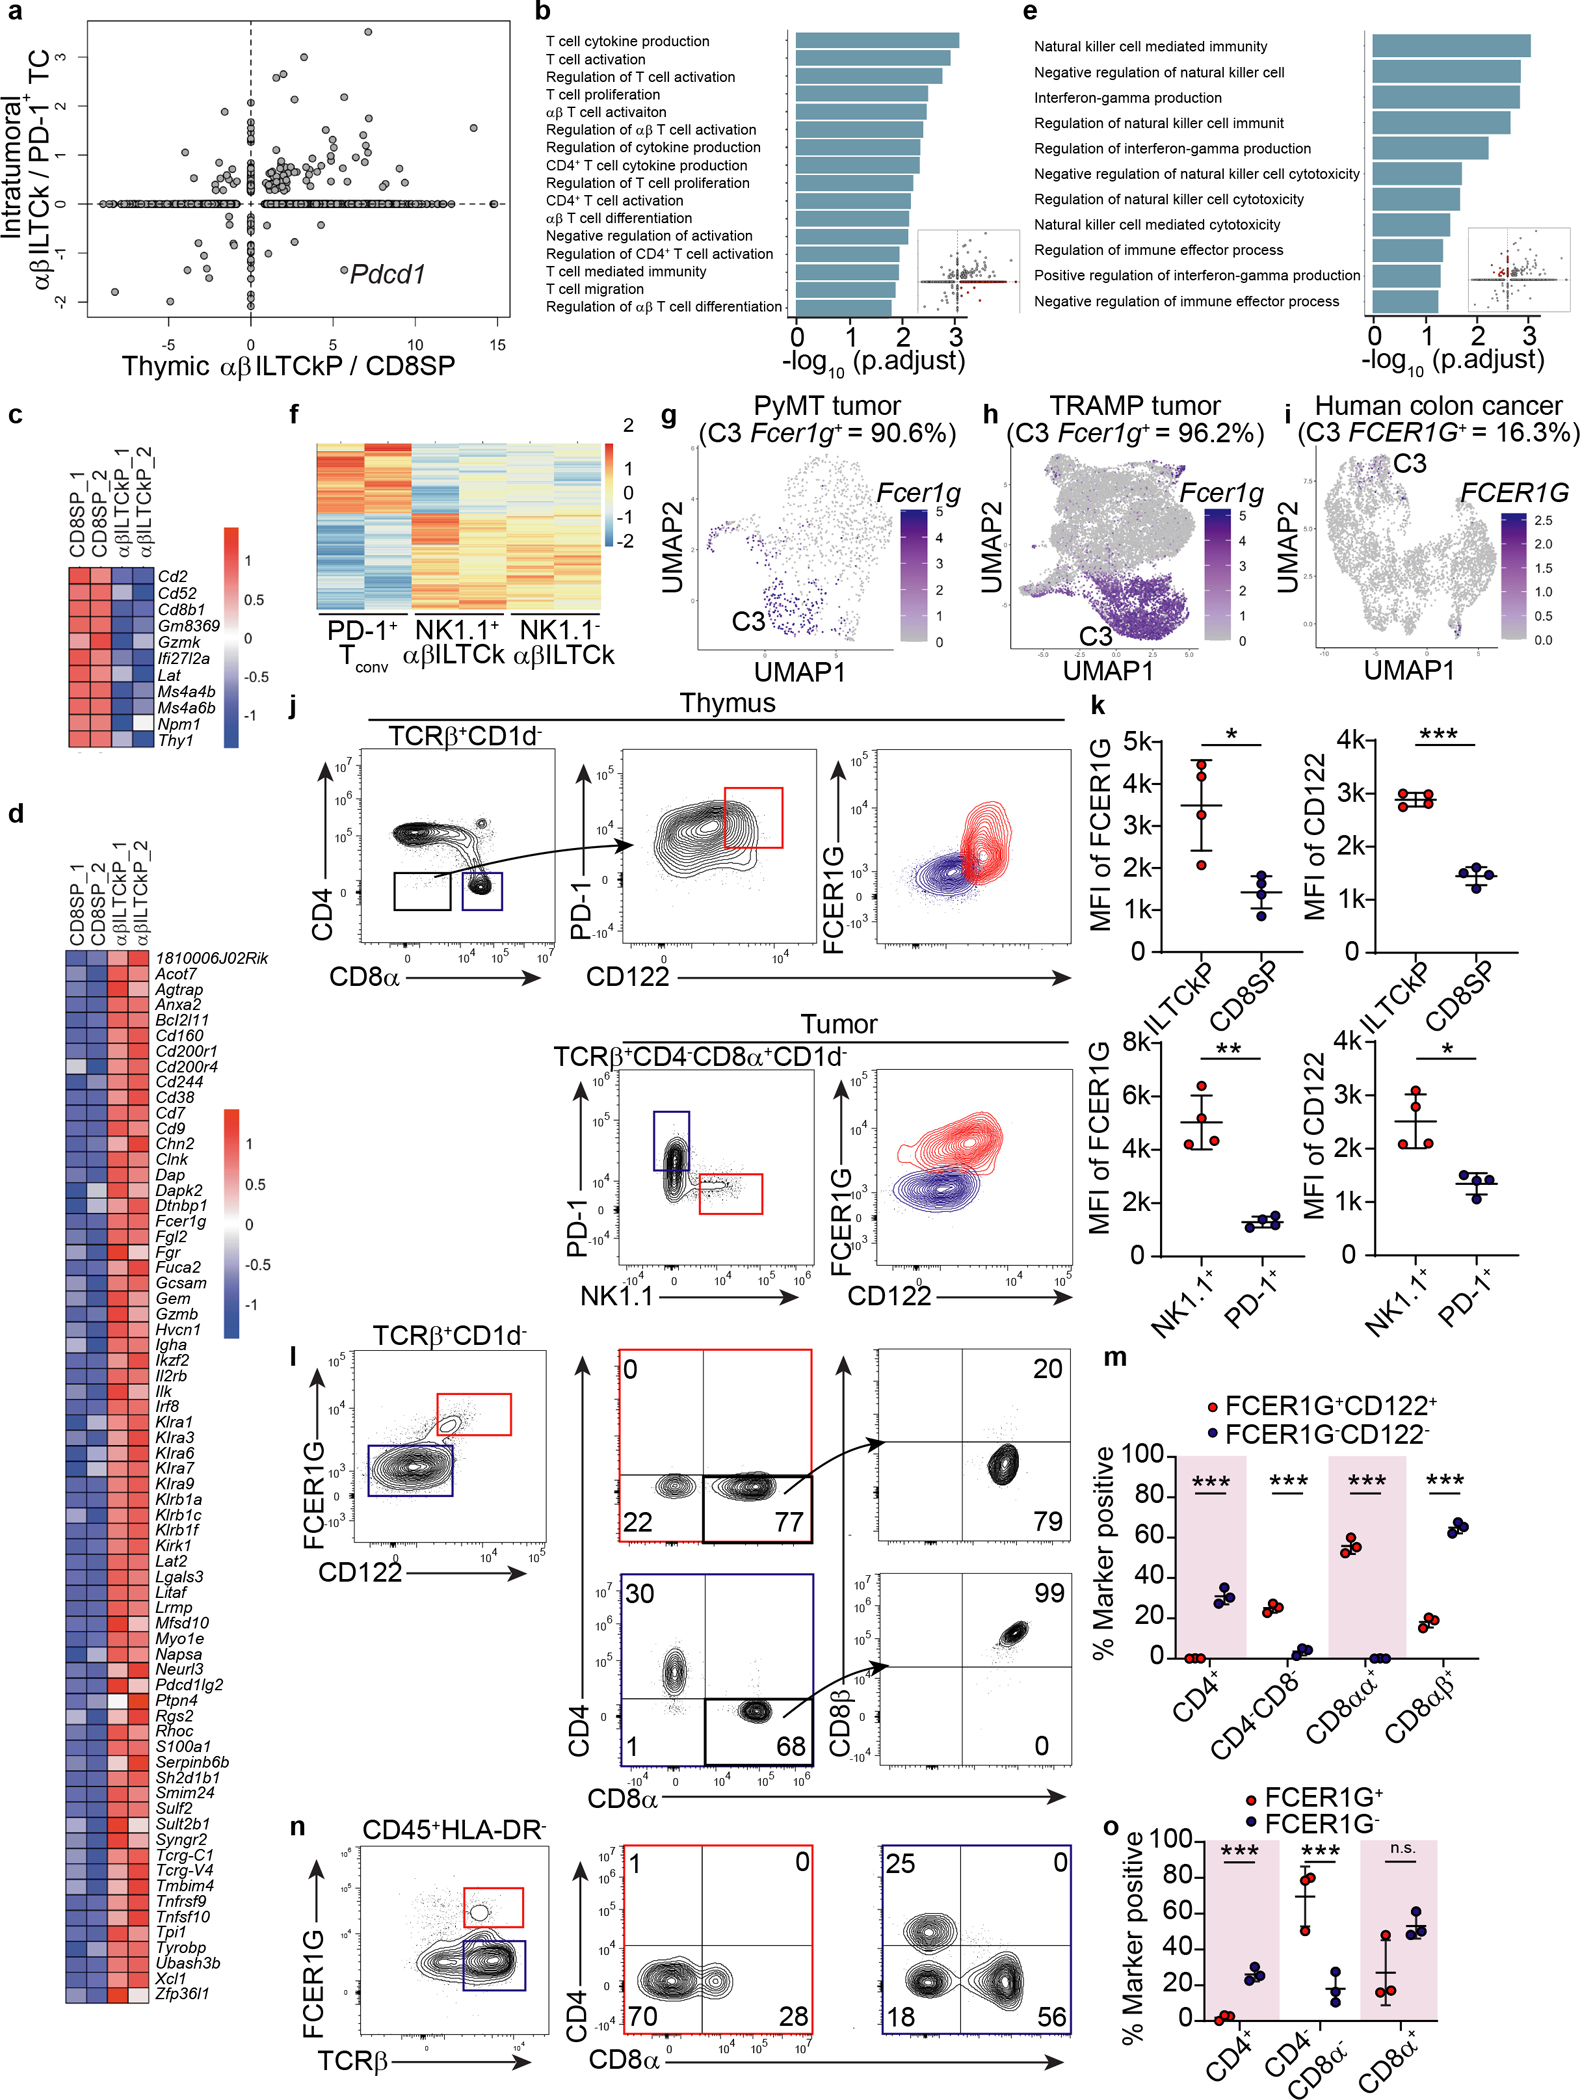
a, A scatter plot comparing the gene expression program differentiating αβILTCk-committed thymic progenitors (αβILTCkPs) from CD8 single positive T cells (SPs) (x-axis) to that distinguishing intratumoral αβILTCks from PD-1+ T cells (TCs) (y-axis). Each dot denotes a gene with the axes representing fold change of the gene expression level. b, Pathway analysis of genes upregulated in thymic αβILTCkPs but subsequently downregulated in intratumoral αβILTCks. c, A heatmap showing genes downregulated in thymic αβILTCkPs relative to their CD8 SP counterparts. d, A heatmap showing genes upregulated in thymic αβILTCkPs relative to their CD8 SP counterparts. e, Pathway analysis of genes upregulated in intratumoral αβILTCks compared to their thymic precursors. f, A heat map showing differentially expressed genes among intratumoral PD-1+ TCs, NK1.1+ and NK1.1− αβILTCks isolated from ‘retrogenic’ bone marrow chimeras generated with NK139 TCR-expressing Rag1−/− bone marrow cells. g, Uniform manifold approximation and projection (UMAP) of CD45+TCRβ+ lymphocytes in breast tumor tissues from PyMT mice showing Fcer1g-expressing cells. h, UMAP of CD45+TCRβ+ lymphocytes in prostate tumor tissues from TRAMP mice showing Fcer1g-expressing cells. i, UMAP of CD45+TCRβ+ lymphocytes present in a previously published human colorectal carcinoma dataset12, showing FCER1G-expressing cells. j, Flow cytometric analysis of FCER1G and CD122 expression in CD4−CD8α−TCRβ+CD1d− and CD8α+TCRβ+CD1d− thymocytes as well as TCRβ+CD4−CD1d−CD8α+NK1.1+ and TCRβ+CD4−CD1d−CD8α+PD-1+ tumor-infiltrating cells from PyMT mice (n = 4). k, Expression levels of FCER1G and CD122 in indicated cell populations. l, Flow cytometric analysis of CD4, CD8α, and CD8β expression in FCER1G+CD122+ and FCER1G−CD122− tumor-infiltrating TCRβ+CD1d− cells from PyMT mice (n = 3). m, Frequency of FCER1G+CD122+ and FCER1G−CD122− tumor-infiltrating TCRβ+CD1d− cells expressing indicator combination of markers. n, Flow cytometric analysis of CD4 and CD8α expression by FCER1G+ and FCER1G− CD45+HLA-DR−TCRβ+ cells in tumor tissues from patients with colon carcinoma. o, Frequency of FCER1G+CD45+HLA-DR−TCRβ+ and FCER1G−CD45+HLA-DR−TCRβ+ tumor-infiltrating cells expressing indicated combination of markers. Data are representative of and pooled from three patient samples. All statistical data are shown as mean ± S.D (biologically independent mice in j-m and human samples in n-o). Two-tailed unpaired t-test in k,m,o. *P < 0.05; **P < 0.01; ***P < 0.001 and n.s.: not significant.
Extended Data Figure 10. Adoptive transfer of Stat5b-CA-armed αβILTCks deters tumor growth.
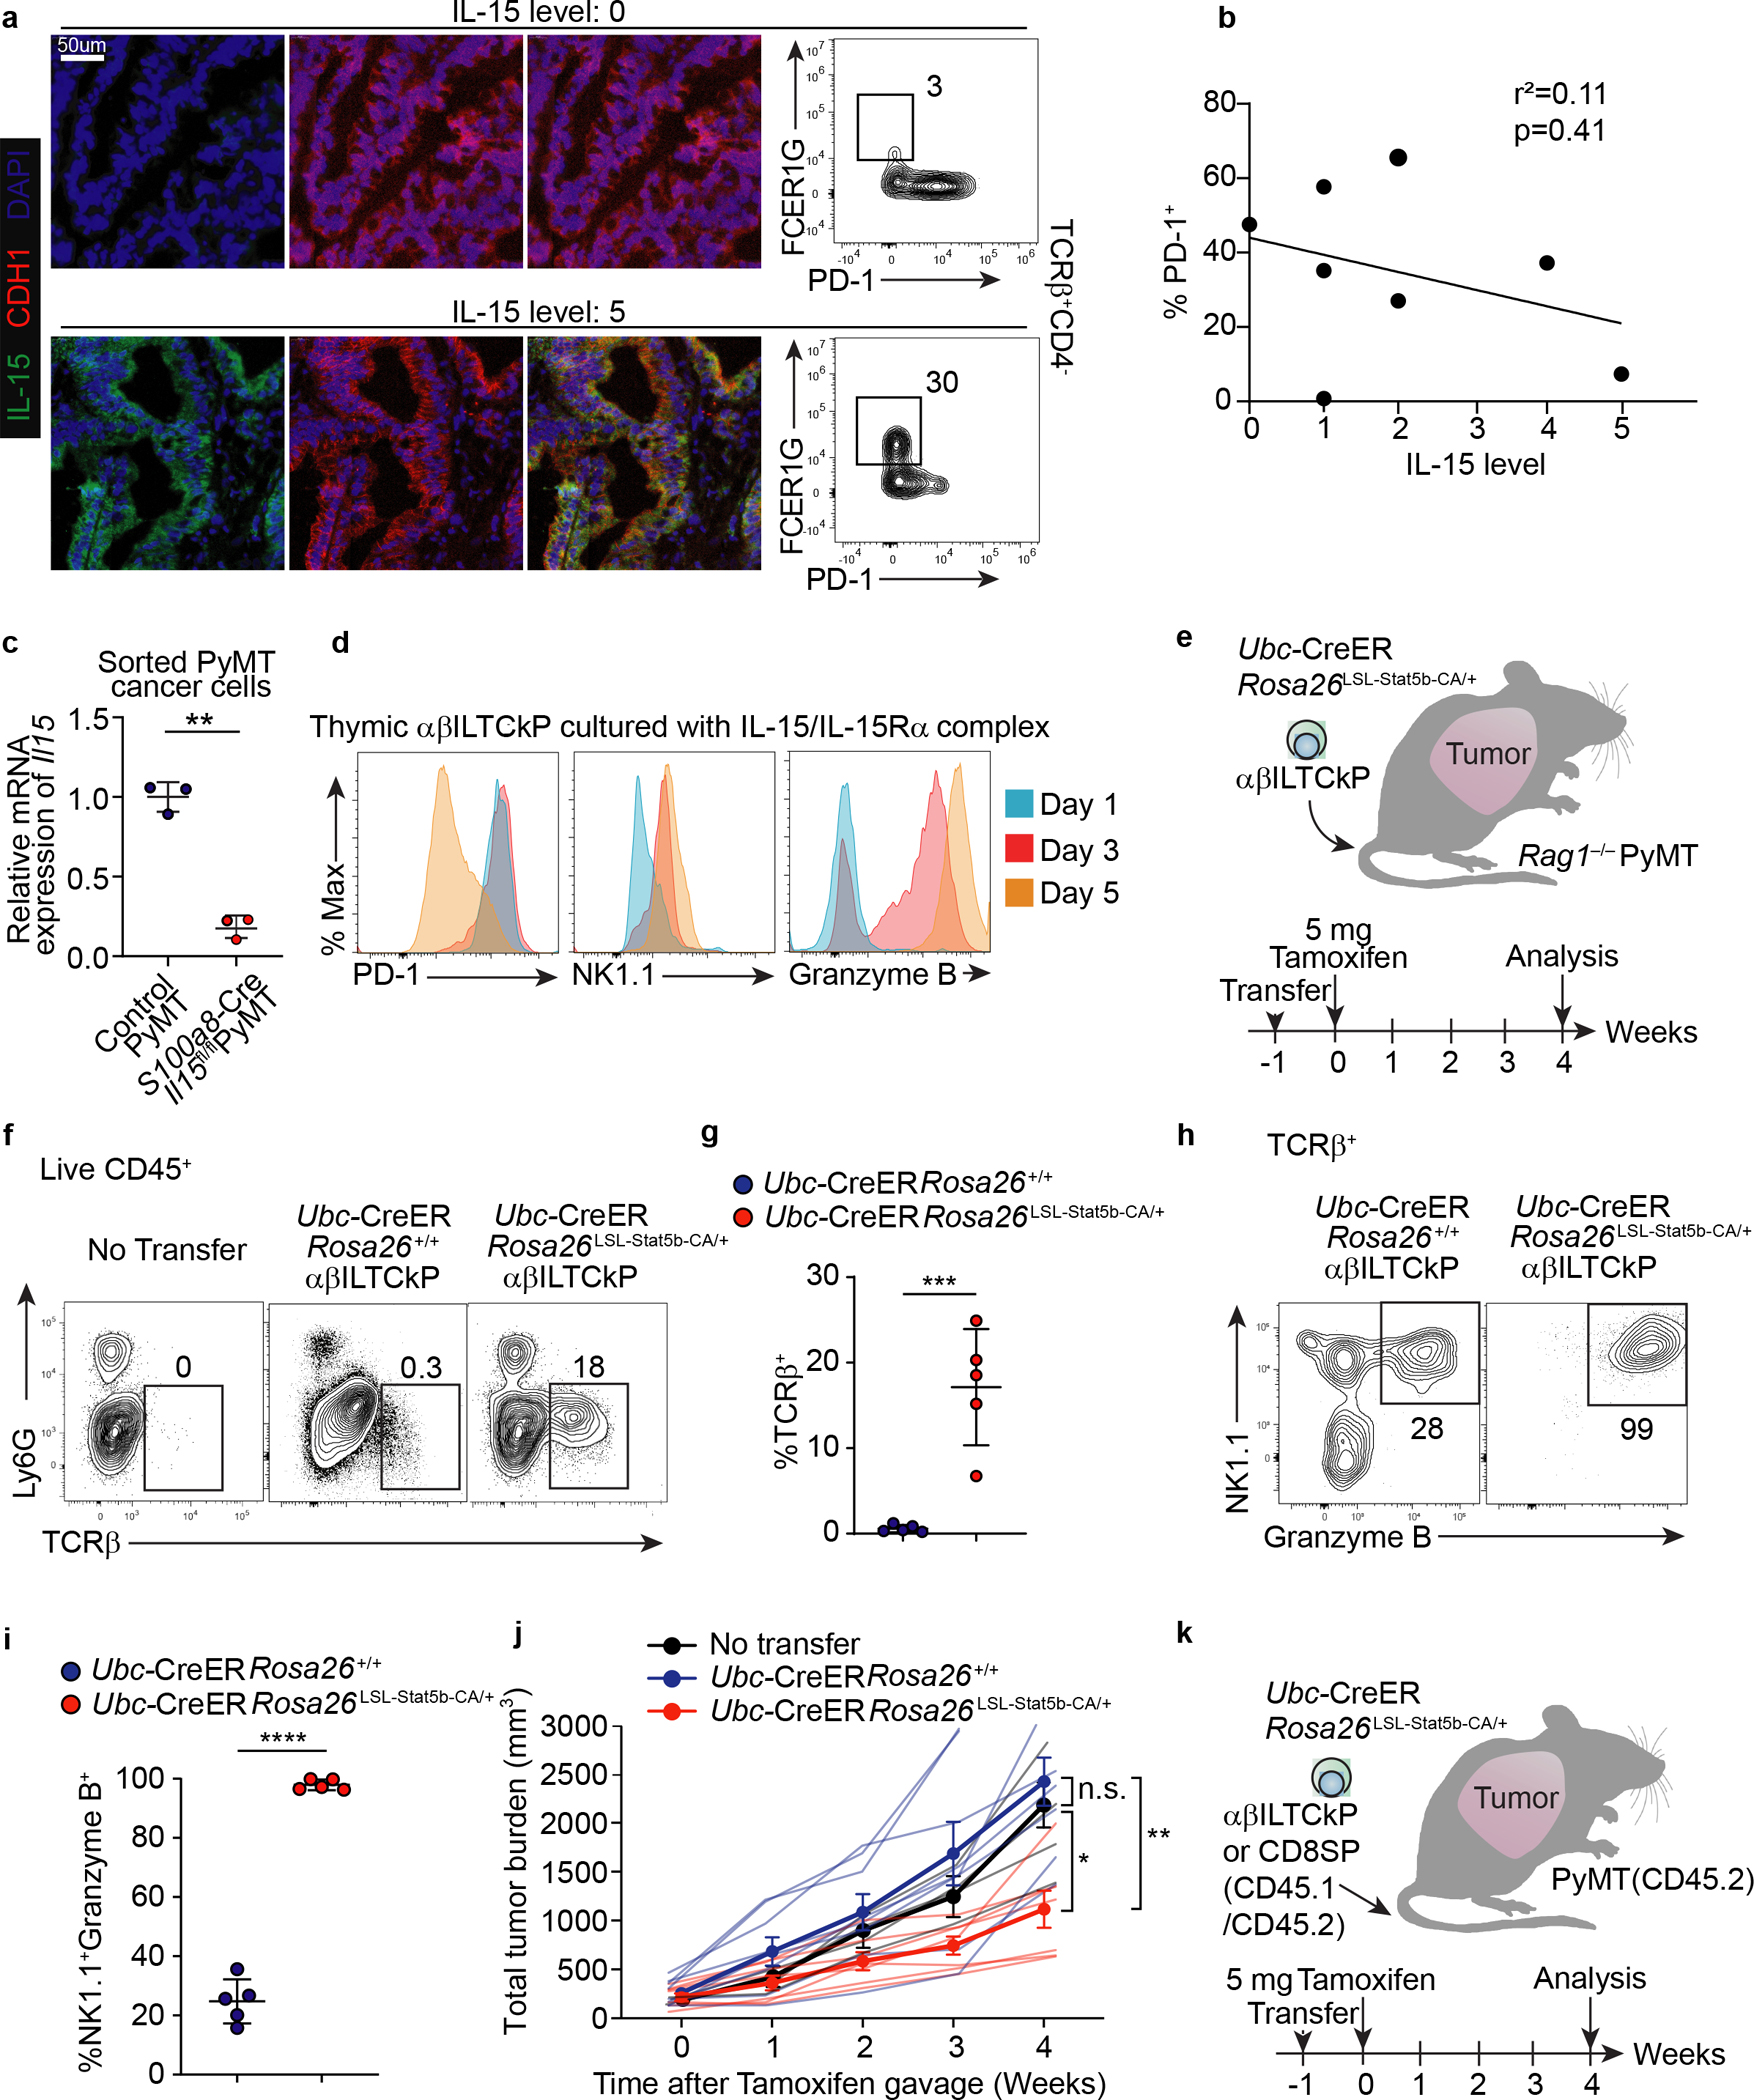
a, Immunofluorescence images showing expression of IL-15 and CDH1 in tumor tissues from patients with colon carcinoma (left panel). Flow cytometric analysis of FCER1G and PD-1 expression in TCRβ+CD4− cells from the same tumor tissue (right panel). Data are representative of two independent experiments. b, Correlation between frequency of PD-1+ cells among CD45+TCRβ+CD4− cells and IL-15 expression level in tumor tissues from patients with colon carcinoma. Each dot denotes an independent patient sample. c, Statistical analysis showing relative mRNA expression of Il15 in sorted CD45−EpCAM+ cancer cells from S100a8-CreIl15fl/flPyMT (n = 3) and control PyMT mice (n = 3). d, Flow cytometric analysis of PD-1, NK1.1, and granzyme B expression in thymic αβILTCk progenitors (αβILTCkPs) one, three, or five days after culturing in the presence of 100 ng/ml IL-15/IL-15Ra complex. Data are representative of three independent experiments. e, A schematic diagram showing αβILTCk-based adoptive cellular transfer experiment. A constitutively active form of Stat5b (Stat5b-CA) was induced in thymic αβILTCkPs by tamoxifen administration one week after adoptive transfer into lymphocyte-deficient PyMT recipient mice with a total tumor burden of 300 – 400 mm3. f, Expression of Ly6G and TCRβ by tumor-infiltrating CD45+ cells. g, Statistical analysis of the frequency of donor-derived Ubc-CreERRosa26+/+ (n = 5) or Ubc-CerERRosa26LSL-Stat5b-CA/+ (n = 5) TCRβ+ cells among tumor-infiltrating CD45+ cells. h, Flow cytometric analysis of NK1.1 and granzyme B expression by donor-derived TCRβ+ cells in the tumor. i, Frequency of NK1.1+Granzyme B+ cells among transferred TCRβ+ cells. j, Total tumor burden in mice adoptively transferred with no cells or thymic αβILTCkPs of indicated genotypes. Data are pooled from three independent experiments. No transfer (n=4), Ubc-CreERRosa26+/+ (n=8), and Ubc-CreERRosa26Stat5b-CA/+ (n=7). k, A schematic diagram showing αβILTCk-based adoptive cellular transfer experiment. A constitutively active form of Stat5b (Stat5b-CA) was induced in thymic CD45.1+CD45.2+ αβILTCk progenitors or CD8 single positive T cells by tamoxifen administration one week after adoptive transfer into congenically distinct CD45.2+ PyMT recipient mice. All statistical data are shown as mean ± S.D (independent human samples in a-b, biologically independent mice in c,f-j and independent cell culture samples in d). Linear regression (b), two-tailed unpaired t-test (c,g,i) and two-way analysis of variance (ANOVA) (j) with post hoc Bonferroni t-test.. *P < 0.05; **P < 0.01; ***P < 0.001; ****P < 0.0001 and n.s.: not significant.
Supplementary Material
Supplementary Table 1. Unique CDR3 amino acid sequences found in TCRs utilized by tumor-infiltrating αβILTCks and PD-1+CD8+ T cells (TCs).
Supplementary Table 2. Full-length nucleotide sequences of TCRs used in the TCR reporter assay.
Supplementary Table 3. Differentially expressed genes and associated biological pathways among intratumoral PD-1+CD8+ T cells, αβILTCks, and their respective thymic precursors.
Supplementary Table 4. Differentially expressed genes between intratumoarl NK1.1+ and NK1.1− αβILTCks.
Supplementary Table 5. Epidemiological and clinicopathological characteristics of colon caner patient recruited in the study.
Acknowledgements
We thank members of the M.O.L. laboratory for helpful discussions. This work was supported by the National Institute of Health (R01 CA243904-01A1 to M.O.L., F30 AI29273-03 to B.G.N., and F31 CA210332 to M.H.D.), a Howard Hughes Medical Institute Faculty Scholar Award (M.O.L.), a CLIP grant from Cancer Research Institute (M.O.L.), the Ludwig Center for Cancer Immunotherapy and the Functional Genomic Initiative grants (M.O.L.), and the Memorial Sloan Kettering Cancer Center (MSKCC) Support Grant/Core Grant (P30 CA08748). C.C., X.Z., and S.L. are Cancer Research Institute Irvington Fellows supported by the Cancer Research Institute. E.G.S. is a recipient of a Fellowship from the Alan and Sandra Gerry Metastasis and Tumor Ecosystems Center of MSKCC.
Footnotes
Competing Interest
MSKCC has filed a patent application regarding use of ILTCk in cancer immunotherapy. MOL is an SAB member of and holds equity or stock options in Amberstone Biosciences Inc, and META Pharmaceuticals Inc.
All References
- 1.Zheng C et al. Landscape of Infiltrating T Cells in Liver Cancer Revealed by Single-Cell Sequencing. Cell 169, 1342–1356 e1316 (2017). [DOI] [PubMed] [Google Scholar]
- 2.Azizi E et al. Single-Cell Map of Diverse Immune Phenotypes in the Breast Tumor Microenvironment. Cell 174, 1293–1308 e1236 (2018). [DOI] [PMC free article] [PubMed] [Google Scholar]
- 3.Simoni Y et al. Bystander CD8(+) T cells are abundant and phenotypically distinct in human tumour infiltrates. Nature 557, 575–579 (2018). [DOI] [PubMed] [Google Scholar]
- 4.Zhang L et al. Lineage tracking reveals dynamic relationships of T cells in colorectal cancer. Nature 564, 268–272 (2018). [DOI] [PubMed] [Google Scholar]
- 5.Zheng L et al. Pan-cancer single-cell landscape of tumor-infiltrating T cells. Science 374, abe6474 (2021). [DOI] [PubMed] [Google Scholar]
- 6.Schumacher TN & Schreiber RD Neoantigens in cancer immunotherapy. Science 348, 69–74 (2015). [DOI] [PubMed] [Google Scholar]
- 7.Yarchoan M, Hopkins A & Jaffee EM Tumor Mutational Burden and Response Rate to PD-1 Inhibition. The New England journal of medicine 377, 2500–2501 (2017). [DOI] [PMC free article] [PubMed] [Google Scholar]
- 8.Dadi S et al. Cancer Immunosurveillance by Tissue-Resident Innate Lymphoid Cells and Innate-like T Cells. Cell 164, 365–377 (2016). [DOI] [PMC free article] [PubMed] [Google Scholar]
- 9.DuPage M, Mazumdar C, Schmidt LM, Cheung AF & Jacks T Expression of tumour-specific antigens underlies cancer immunoediting. Nature 482, 405–409 (2012). [DOI] [PMC free article] [PubMed] [Google Scholar]
- 10.Matsushita H et al. Cancer exome analysis reveals a T-cell-dependent mechanism of cancer immunoediting. Nature 482, 400–404 (2012). [DOI] [PMC free article] [PubMed] [Google Scholar]
- 11.Chen DS & Mellman I Elements of cancer immunity and the cancer-immune set point. Nature 541, 321–330 (2017). [DOI] [PubMed] [Google Scholar]
- 12.McLane LM, Abdel-Hakeem MS & Wherry EJ CD8 T Cell Exhaustion During Chronic Viral Infection and Cancer. Annu Rev Immunol 37, 457–495 (2019). [DOI] [PubMed] [Google Scholar]
- 13.Sharma P & Allison JP The future of immune checkpoint therapy. Science 348, 56–61 (2015). [DOI] [PubMed] [Google Scholar]
- 14.Topalian SL, Taube JM, Anders RA & Pardoll DM Mechanism-driven biomarkers to guide immune checkpoint blockade in cancer therapy. Nature reviews. Cancer 16, 275–287 (2016). [DOI] [PMC free article] [PubMed] [Google Scholar]
- 15.Baumeister SH, Freeman GJ, Dranoff G & Sharpe AH Coinhibitory Pathways in Immunotherapy for Cancer. Annu Rev Immunol 34, 539–573 (2016). [DOI] [PubMed] [Google Scholar]
- 16.Schneider WM, Chevillotte MD & Rice CM Interferon-stimulated genes: a complex web of host defenses. Annu Rev Immunol 32, 513–545 (2014). [DOI] [PMC free article] [PubMed] [Google Scholar]
- 17.Yost KE et al. Clonal replacement of tumor-specific T cells following PD-1 blockade. Nature medicine 25, 1251–1259 (2019). [DOI] [PMC free article] [PubMed] [Google Scholar]
- 18.Savage PA et al. Recognition of a ubiquitous self antigen by prostate cancer-infiltrating CD8+ T lymphocytes. Science 319, 215–220 (2008). [DOI] [PubMed] [Google Scholar]
- 19.Ise W et al. CTLA-4 suppresses the pathogenicity of self antigen-specific T cells by cell-intrinsic and cell-extrinsic mechanisms. Nature immunology 11, 129–135 (2010). [DOI] [PMC free article] [PubMed] [Google Scholar]
- 20.Hildner K et al. Batf3 deficiency reveals a critical role for CD8alpha+ dendritic cells in cytotoxic T cell immunity. Science 322, 1097–1100 (2008). [DOI] [PMC free article] [PubMed] [Google Scholar]
- 21.Starr TK, Jameson SC & Hogquist KA Positive and negative selection of T cells. Annu Rev Immunol 21, 139–176 (2003). [DOI] [PubMed] [Google Scholar]
- 22.Eberl G & Littman DR Thymic origin of intestinal alphabeta T cells revealed by fate mapping of RORgammat+ cells. Science 305, 248–251 (2004). [DOI] [PubMed] [Google Scholar]
- 23.Georgiev H, Peng C, Huggins MA, Jameson SC & Hogquist KA Classical MHC expression by DP thymocytes impairs the selection of non-classical MHC restricted innate-like T cells. Nat Commun 12, 2308 (2021). [DOI] [PMC free article] [PubMed] [Google Scholar]
- 24.Stritesky GL, Jameson SC & Hogquist KA Selection of self-reactive T cells in the thymus. Annu Rev Immunol 30, 95–114 (2012). [DOI] [PMC free article] [PubMed] [Google Scholar]
- 25.Ruscher R, Kummer RL, Lee YJ, Jameson SC & Hogquist KA CD8alphaalpha intraepithelial lymphocytes arise from two main thymic precursors. Nature immunology 18, 771–779 (2017). [DOI] [PMC free article] [PubMed] [Google Scholar]
- 26.Gazit R et al. Fgd5 identifies hematopoietic stem cells in the murine bone marrow. The Journal of experimental medicine 211, 1315–1331 (2014). [DOI] [PMC free article] [PubMed] [Google Scholar]
- 27.Ruscher R et al. Intestinal CD8alphaalpha IELs derived from two distinct thymic precursors have staggered ontogeny. The Journal of experimental medicine 217 (2020). [DOI] [PMC free article] [PubMed] [Google Scholar]
- 28.Khan O et al. TOX transcriptionally and epigenetically programs CD8(+) T cell exhaustion. Nature 571, 211–218 (2019). [DOI] [PMC free article] [PubMed] [Google Scholar]
- 29.Alfei F et al. TOX reinforces the phenotype and longevity of exhausted T cells in chronic viral infection. Nature 571, 265–269 (2019). [DOI] [PubMed] [Google Scholar]
- 30.Scott AC et al. TOX is a critical regulator of tumour-specific T cell differentiation. Nature 571, 270–+ (2019). [DOI] [PMC free article] [PubMed] [Google Scholar]
- 31.Chinen T et al. An essential role for the IL-2 receptor in Treg cell function. Nat Immunol 17, 1322–1333 (2016). [DOI] [PMC free article] [PubMed] [Google Scholar]
- 32.Correia MP et al. Distinct human circulating NKp30(+)FcepsilonRIgamma(+)CD8(+) T cell population exhibiting high natural killer-like antitumor potential. Proceedings of the National Academy of Sciences of the United States of America 115, E5980–E5989 (2018). [DOI] [PMC free article] [PubMed] [Google Scholar]
- 33.Perarnau B et al. Single H2Kb, H2Db and double H2KbDb knockout mice: peripheral CD8+ T cell repertoire and anti-lymphocytic choriomeningitis virus cytolytic responses. Eur J Immunol 29, 1243–1252 (1999). [DOI] [PubMed] [Google Scholar]
- 34.Sosinowski T et al. CD8alpha+ dendritic cell trans presentation of IL-15 to naive CD8+ T cells produces antigen-inexperienced T cells in the periphery with memory phenotype and function. J Immunol 190, 1936–1947 (2013). [DOI] [PMC free article] [PubMed] [Google Scholar]
- 35.Butler A, Hoffman P, Smibert P, Papalexi E & Satija R Integrating single-cell transcriptomic data across different conditions, technologies, and species. Nat Biotechnol 36, 411–420 (2018). [DOI] [PMC free article] [PubMed] [Google Scholar]
- 36.Stuart T et al. Comprehensive Integration of Single-Cell Data. Cell 177, 1888–1902 e1821 (2019). [DOI] [PMC free article] [PubMed] [Google Scholar]
- 37.Angerer P et al. destiny: diffusion maps for large-scale single-cell data in R. Bioinformatics 32, 1241–1243 (2016). [DOI] [PubMed] [Google Scholar]
- 38.Haghverdi L, Buettner F & Theis FJ Diffusion maps for high-dimensional single-cell analysis of differentiation data. Bioinformatics 31, 2989–2998 (2015). [DOI] [PubMed] [Google Scholar]
- 39.Trapnell C et al. The dynamics and regulators of cell fate decisions are revealed by pseudotemporal ordering of single cells. Nat Biotechnol 32, 381–386 (2014). [DOI] [PMC free article] [PubMed] [Google Scholar]
- 40.Qiu X et al. Single-cell mRNA quantification and differential analysis with Census. Nat Methods 14, 309–315 (2017). [DOI] [PMC free article] [PubMed] [Google Scholar]
- 41.Qiu X et al. Reversed graph embedding resolves complex single-cell trajectories. Nat Methods 14, 979–982 (2017). [DOI] [PMC free article] [PubMed] [Google Scholar]
- 42.Kim D, Langmead B & Salzberg SL HISAT: a fast spliced aligner with low memory requirements. Nat Methods 12, 357–360 (2015). [DOI] [PMC free article] [PubMed] [Google Scholar]
- 43.Mudge JM & Harrow J Creating reference gene annotation for the mouse C57BL6/J genome assembly. Mamm Genome 26, 366–378 (2015). [DOI] [PMC free article] [PubMed] [Google Scholar]
- 44.Liao Y, Smyth GK & Shi W The Subread aligner: fast, accurate and scalable read mapping by seed-and-vote. Nucleic Acids Res 41, e108 (2013). [DOI] [PMC free article] [PubMed] [Google Scholar]
- 45.Love MI, Huber W & Anders S Moderated estimation of fold change and dispersion for RNA-seq data with DESeq2. Genome Biol 15, 550 (2014). [DOI] [PMC free article] [PubMed] [Google Scholar]
- 46.Yu G, Wang LG, Han Y & He QY clusterProfiler: an R package for comparing biological themes among gene clusters. OMICS 16, 284–287 (2012). [DOI] [PMC free article] [PubMed] [Google Scholar]
- 47.Yang Y et al. Distinct mechanisms define murine B cell lineage immunoglobulin heavy chain (IgH) repertoires. Elife 4, e09083 (2015). [DOI] [PMC free article] [PubMed] [Google Scholar]
- 48.Wang C et al. High-throughput, high-fidelity HLA genotyping with deep sequencing. Proceedings of the National Academy of Sciences of the United States of America 109, 8676–8681 (2012). [DOI] [PMC free article] [PubMed] [Google Scholar]
- 49.Lefranc MP et al. IMGT, the international ImMunoGeneTics database. Nucleic Acids Res 27, 209–212 (1999). [DOI] [PMC free article] [PubMed] [Google Scholar]
- 50.Franklin RA et al. The cellular and molecular origin of tumor-associated macrophages. Science 344, 921–925 (2014). [DOI] [PMC free article] [PubMed] [Google Scholar]
- 51.Gasteiger G, Fan X, Dikiy S, Lee SY & Rudensky AY Tissue residency of innate lymphoid cells in lymphoid and nonlymphoid organs. Science 350, 981–985 (2015). [DOI] [PMC free article] [PubMed] [Google Scholar]
- 52.Morita S, Kojima T & Kitamura T Plat-E: an efficient and stable system for transient packaging of retroviruses. Gene Ther 7, 1063–1066 (2000). [DOI] [PubMed] [Google Scholar]
- 53.Sanjana NE, Shalem O & Zhang F Improved vectors and genome-wide libraries for CRISPR screening. Nat Methods 11, 783–784 (2014). [DOI] [PMC free article] [PubMed] [Google Scholar]
- 54.Mayans S et al. alpha beta T Cell Receptors Expressed by CD4(−)CD8 alpha beta Intraepithelial T Cells Drive Their Fate into a Unique Lineage with Unusual MHC Reactivities. Immunity 41, 207–218 (2014). [DOI] [PMC free article] [PubMed] [Google Scholar]
- 55.McDonald BD, Bunker JJ, Ishizuka IE, Jabri B & Bendelac A Elevated T Cell Receptor Signaling Identifies a Thymic Precursor to the TCR alpha beta(+)CD4(−)CD8 beta(−) Intraepithelial Lymphocyte Lineage. Immunity 41, 219–229 (2014). [DOI] [PMC free article] [PubMed] [Google Scholar]
- 56.Constantinides MG, McDonald BD, Verhoef PA & Bendelac A A committed precursor to innate lymphoid cells. Nature 508, 397–+ (2014). [DOI] [PMC free article] [PubMed] [Google Scholar]
Associated Data
This section collects any data citations, data availability statements, or supplementary materials included in this article.
Supplementary Materials
Supplementary Table 1. Unique CDR3 amino acid sequences found in TCRs utilized by tumor-infiltrating αβILTCks and PD-1+CD8+ T cells (TCs).
Supplementary Table 2. Full-length nucleotide sequences of TCRs used in the TCR reporter assay.
Supplementary Table 3. Differentially expressed genes and associated biological pathways among intratumoral PD-1+CD8+ T cells, αβILTCks, and their respective thymic precursors.
Supplementary Table 4. Differentially expressed genes between intratumoarl NK1.1+ and NK1.1− αβILTCks.
Supplementary Table 5. Epidemiological and clinicopathological characteristics of colon caner patient recruited in the study.
Data Availability Statement
All processed single-cell RNA-seq and bulk RNA-seq data that support the findings of this study have been deposited with GEO under accession code GSE195937. Previously published single-cell RNA-seq data reanalyzed here are available under accession code GSE108989.


