Abstract
Background:
Absence of Golgi microtubule-associated protein 210 (GMAP210), encoded by the TRIP11 gene, results in achondrogenesis. Although TRIP11 is thought to be specifically required for chondrogenesis, human fetuses with the mutation of TRIP11 also display bony skull defects where chondrocytes are usually not present. This raises an important question of how TRIP11 functions in bony skull development.
Results:
We disrupted Trip11 in neural crest-derived cell populations, which are critical for developing skull in mice. In Trip11 mutant skulls, expression levels of ER stress markers were increased compared to controls. Morphological analysis of electron microscopy data revealed swollen ER in Trip11 mutant skulls. Unexpectedly, we also found that Golgi stress increased in Trip11 mutant skulls, suggesting that both ER and Golgi stress-induced cell death may lead to osteopenia-like phenotypes in Trip11 mutant skulls. These data suggest that Trip11 plays pivotal roles in the regulation of ER and Golgi stress, which are critical for osteogenic cell survival.
Conclusion:
We have recently reported that the molecular complex of ciliary protein and GMAP210 is required for collagen trafficking. In this paper, we further characterized the important role of Trip11 being possibly involved in the regulation of ER and Golgi stress during skull development.
Keywords: Apoptosis, Cranial neural crest cells, Endoplasmic Reticulum, Skull, TRIP11
Introduction
Lethal skeletal dysplasia is known as one of the most severe skeletal defects1,2. Mutations of Golgi microtubule-associated protein 210 (GMAP210), encoded by the TRIP11 gene, result in lethal skeletal dysplasia3. A recent mouse phenotypic analysis shows that GMAP210 is essential for chondrogenesis, but less essential in other skeletogenic cells such as osteoblasts and osteoclasts4, suggesting that GMAP210 functions specifically in chondrocytes. However, human fetuses with lethal skeletal dysplasia due to GMAP210 mutations also display severe skeletal defects in the skull vault, where chondrocytes are not present3. This observation suggests that GMAP210 may also play a critical role in osteogenesis during skull development.
The skull consists of several bony plates critical for protecting sensory organs and brain5,6. The vertebrate skull, consisting of the neurocranium (e.g., skull vault and base) and the viscerocranium (e.g., jaws), is formed from skeletogenic mesenchyme derived from either mesodermal cells or cranial neural crest cells (CNCCs)7,8. CNCCs are multipotent stem cells that generate skeletogenic precursor cells in a part of the skull vault. Causes of particular craniofacial skeletal malformations can be traced back to problems occurring during specific phases of CNCC development9,10. Therefore, it is critical to understand details of the molecular mechanism and function of CNCCs in skull formation.
We recently examined the function of GMAP210 in CNCCs11. We found that the molecular complex of ciliary protein intraflagellar transport 20 (IFT20) and GMAP210 regulates skull development11. Importantly, the molecular complex of IFT20-GMAP210 plays a pivotal role in trafficking of type I collagen. Thus, this cellular mechanism is required for smooth collagen trafficking and secreting adequate amounts of collagen matrix essential for skull maturation11. However, it remains unclear whether GMAP210 is solely involved in the regulation of collagen trafficking in osteogenesis during craniofacial bone development.
In this study, we report an additional role of Trip11 in CNCCs derived skull bone. Our study suggests that Trip11 may play a pivotal role in the regulation of ER and Golgi stress during skull vault development.
Results and Discussion
GMAP210 is expressed in cranial neural crest derivatives
It has been reported that GMAP210 is expressed in all cell types such as cartilage and bone in the trunk region3. However, it remains unclear how GMAP210 functions in cranial neural crest cells (CNCCs), a critical cell population for developing craniofacial skeletal structure. To examine GMAP210 expression in CNCCs, we crossed Wnt1-Cre mice with Rosa26-EGFP reporter mice to label CNCCs and performed immunohistochemistry. We found expression of GMAP210 in migratory and postmigratory CNCCs (Fig. 1A). Expression of GMAP210 was also detected in CNCC-derivatives including frontal bone, cartilage primordium of ala orbitalis, nasal septum cartilage, and maxillary and mandibular bones (Fig. 1B). These results suggest that GMAP210 may function to regulate craniofacial bone development in mice.
Fig. 1. GMAP210 expression pattern in neural crest cells.
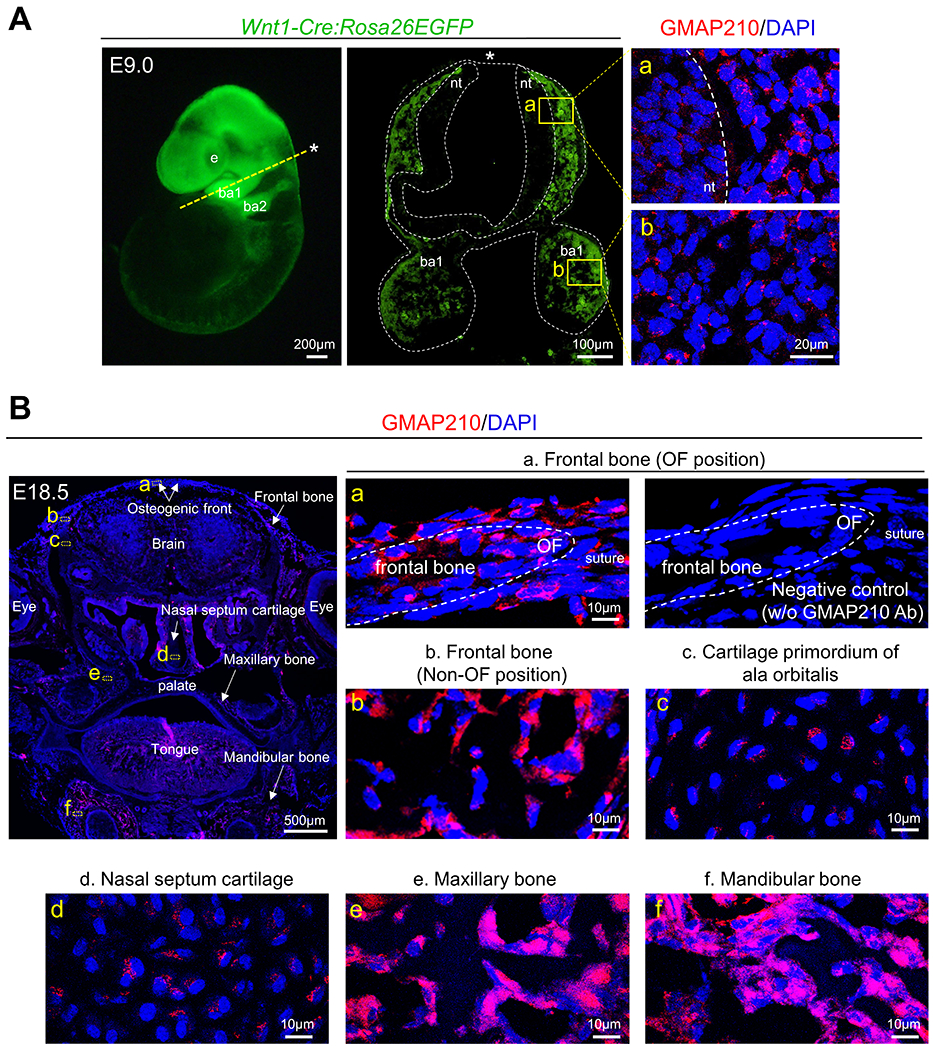
(A) Whole-mount and immunohistological analysis of Rosa26EGFP:Wnt1-Cre embryo at E9.0. Yellow dashed line in the left panel indicates the orientation of immunohistological analysis. Asterisks indicate the dorsal side. Right panels show the localization of GMAP210 (magenta) in the boxed areas. Right upper panel (a) shows migratory cranial neural crest cells (CNCCs) from dorsal surface of neural tube into the first branchial arch. Right lower panel (b) shows postmigratory CNCCs in the first branchial arch. ba1, first branchial arch; ba2, second branchial arch; e, eye; nt, neural tube. (B) Immunohistological analysis of GMAP210 (magenta) in the wild-type’s frontal bone (a: OF and b: Non-OF position), c: cartilage primordium of ala orbitalis, d: nasal septum cartilage, e: maxillary bone, and f: mandibular bone at E18.5. White dashed lines indicate skull tissue. These are representative images of n = 3 individual embryos in each group. OF, osteogenic front.
CNC-specific disruption of Trip11 results in craniofacial bone defects.
To examine the role of GMAP210, we disrupted Trip11 in a CNC-specific manner using Wnt1-Cre mice (hereafter Trip11 cKO mice). Although the majority of Trip11 cKO mice died after birth11, some survived up to the weaning stage (Fig. 2A). Microcomputed tomography (micro-CT) analysis revealed that CNC-derived bones (e.g., nasal and frontal bones) showed defects of mineralization in Trip11 cKO mice (Fig. 2B). Skeletal staining analysis confirmed that formation of craniofacial bones was severely attenuated in Trip11 cKO mice (Fig. 2C). Superimposition of the lateral photographs further showed the attenuation of craniofacial bone structure in Trip11 cKO mice (Fig. 2D). Next, we wished to examine craniofacial defects during embryogenesis. Whole mount skeletal staining showed that while body size was comparable between wild-type and Trip11 cKO embryos (Fig. 3A), face size was smaller in Trip11 cKO embryos compared with wild-types (Fig. 3B, C). Cephalometric analysis revealed that CNC-derived bones, including nasal-frontal, maxillary and mandibular bones were defective, which was consistent with our experimental strategy to delete Trip11 in a CNC-specific manner (Fig. 3D, E). At this time, the cause of neonatal death observed in the majority of Trip11 cKO mice remains unclear. One possibility is that Trip11 cKO mice may not be able to move their jaw and tongue appropriately due to defective hyoid bones and condylar cartilage formation (Fig. 3F, G). In this case, Trip11 cKO mice presumably could not take milk and/or could not properly breathe (Fig. 3H). Consistent with previous findings3,4, cartilage components such as cartilage primordium of ala orbitalis, nasal capsule cartilage, nasal septum cartilage and Meckel’s cartilage were also defective (Fig. 4A). Quantification analysis of Safranin O revealed that they were less maturated in Trip11 cKO embryos (Fig. 4B). We confirmed that the amount of type I collagen matrix in frontal bone was decreased in Trip11 cKO embryos compared with controls (Fig. 4C). Together, these results suggest that Trip11 is essential for craniofacial bone and cartilage development.
Fig. 2. Loss of Trip11 in neural crest cells results in craniofacial skeletal defects at postnatal stages.
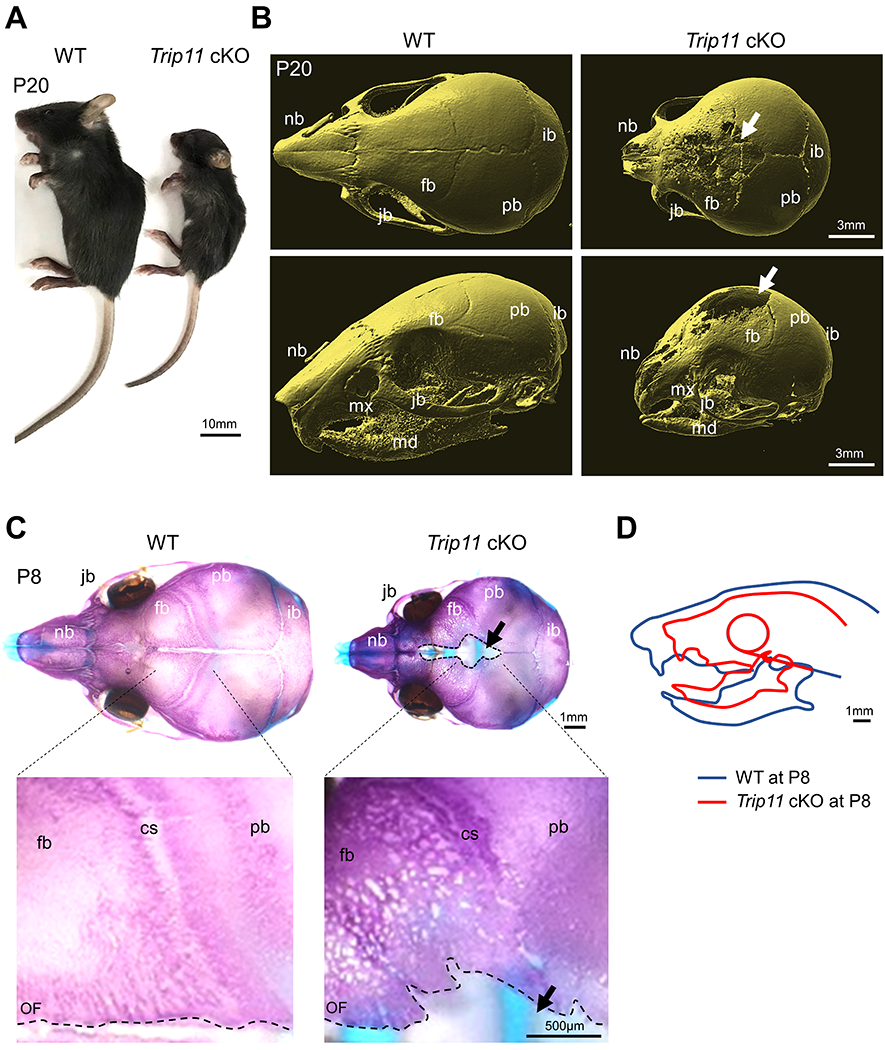
(A, B) Whole-mount and micro-CT images of control (WT) and Trip11:Wnt1-Cre (Trip11 cKO) mice at postnatal day (P) 20. Arrows indicate the defected frontal bone area. (C) Alcian blue- and Alizarin red-staining of WT and Trip11 cKO mice at P8. Lower panels are high magnification images of upper panels. Arrows indicate defected frontal bone area. Black dashed lines indicate osteogenic front (OF). (D) Superimposition of the lateral photographs orientated by a horizontal plane extending from the lower point of the globe of the eye to upper margin of ear canal, showing the facial profile of WT and Trip11 cKO at P8. cs, coronal suture; fb, frontal bone; ib, interparietal bone; jb, jugal bone; md, mandible; mx, maxilla; nb, nasal bone; pb, parietal bone; OF, osteogenic front.
Fig. 3. Loss of Trip11 in neural crest cells results in craniofacial skeletal defects.
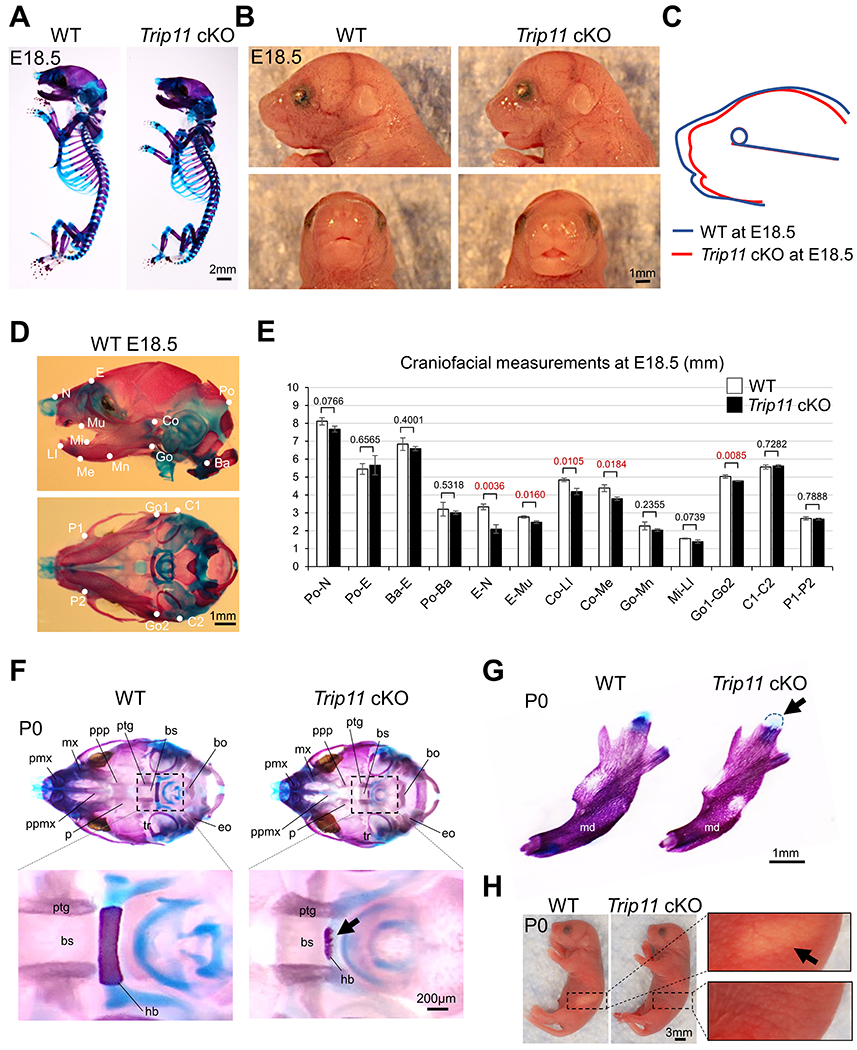
(A) Whole-mount view of Alcian blue- and Alizarin red-staining of control (WT) and Trip11:Wnt1-Cre (Trip11 cKO) embryos at E18.5. (B) Lateral and frontal view of faces at E18.5. (C) Superimposition of the lateral photographs oriented by a horizontal plane extending from the lower point of the globe of the eye to upper margin of ear canal at E18.5. (D) Cephalometric landmarks of lateral and transverse view. Abbreviations: see Table 1. (E) Comparison of craniofacial measurements between WT and Trip11 cKO at E18.5. Abbreviations: see Table 2. (F) Alcian blue- and Alizarin red-staining of WT and Trip11 cKO at birth (P0). Lower panels show high magnification images of the boxed areas in upper panels. Arrow indicates defected hyoid bone in Trip11 cKO mouse. (G) Skeletal staining analysis of the mandibular bone of WT and Trip11 cKO mice at P0. Arrow indicates defective condylar cartilage. (H) Whole-mount view of WT and Trip11 cKO at P0. Right panels show high magnification images of the boxed areas. Arrow indicates a milk band in WT mouse. These are representative images of n=3 individual embryos in each group, and data E are as mean ± SD, n = 3 individual embryos in each group. bo, basioccipital; bs, basisphenoid; eo, exoccipital; hb, hyoid bone; md, mandible; mx, maxilla; p, palatine; pmx, premaxilla; ppmx, palatal process of maxilla; ppp, palatal process of palatine; ptg, pterygoid; tr, tympanic ring.
Fig. 4. Loss of Trip11 induces defective craniofacial bone and cartilage formation.
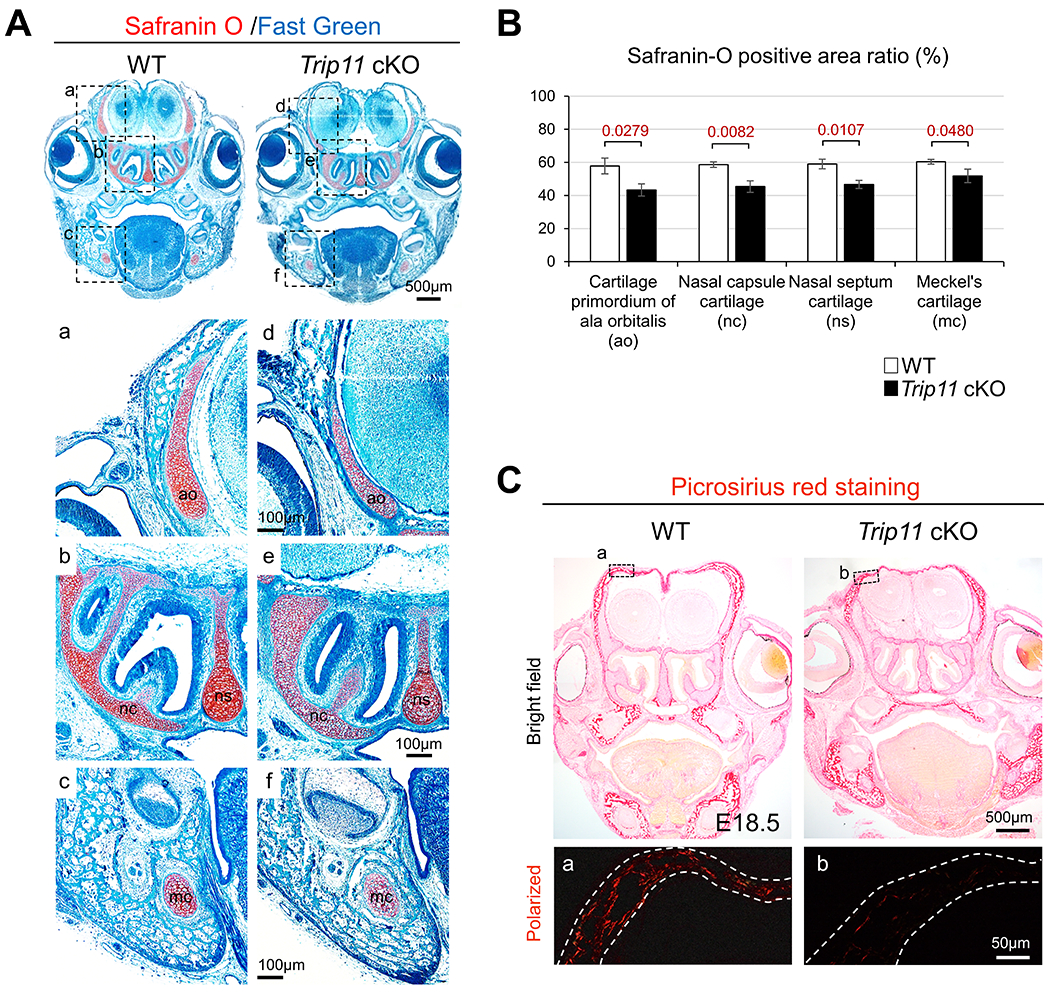
(A) Safranin O staining of control (WT) and Trip11:Wnt1-Cre (Trip11 cKO) at E17.5. Bottom six panels are high magnification images of the boxed areas in upper panels. ao, cartilage primordium of ala orbitalis; mc, Meckel’s cartilage; nc, nasal capsule cartilage; ns, nasal septum cartilage. (B) Quantification of the ratio of Safranin-O staining positive area from cartilage primordium of ala orbitalis, nasal capsule cartilage, nasal septum cartilage and Meckel’s cartilage (ROI: 0.10mm2). (C) Picrosirius red staining of WT and Trip11 cKO at E18.5. Lower panels are high magnification images of the boxed area in the upper panels with polarized lens. White dashed lines indicate skull tissue. These are representative images of n=3 individual embryos in each group, and data B are as mean ± SD, n = 3 individual embryos in each group.
Loss of Trip11 increases apoptosis in skull tissues.
We have recently reported that proliferation and differentiation activities in CNC-derived osteoblasts are normal in Trip11 cKO mice11. This suggests that the initial process of osteogenesis may not be affected by deletion of Trip11. However, it remains unclear whether disruption of Trip11 affects cell survival and thus causes craniofacial skeletal defects. To examine this possibility, we performed TUNEL analysis at mid-late gestation. While the number of apoptosis positive cells in CNC-derived bone and cartilage were comparable at E15.5 (Fig. 5A), it was increased in the area of CNC-derived frontal bone of Trip11 cKO mice at E18.5 (Fig. 5B). Our quantification analysis showed that increased cell death was observed in the non-osteogenic front area of CNC-derived frontal bone (Fig. 5C). These results suggest that defective cell survival is associated with skull abnormalities in Trip11 cKO mice.
Fig. 5. Loss of Trip11 induces apoptosis during skull development.

TUNEL assay (magenta) and corresponding quantification of coronal sections from control (WT) and Trip11:Wnt1-Cre (Trip11 cKO) embryos at (A) E15.5 and (B) E18.5. Upper panels show low magnification images with anatomical landmarks. Lower ten panels show the high magnification images of the boxed areas in the upper panel focusing on OF position of frontal bone (a, f, k and p; OF position), Non-OF position of frontal bone (b, g, l and q; Non-OF position), cartilage primordium of ala orbitalis (b, g, l and q; ao), maxillary bone (c, h, m and r; mx), mandibular bone (d, i, n and s; md) and nasal septum cartilage (e, j, o and t; ns). White dashed lines indicate the outline of each tissue. (C) Graphs show the quantification of the ratio of TUNEL positive cells in each area (ROI: 0.25mm2) at E15.5 (upper graph) and E18.5 (lower graph). These are representative images of n=3 individual embryos in each group, and data C are as mean ± SD, n = 3 individual embryos in each group. ao, cartilage primordium of ala orbitalis; mc, Meckel’s cartilage; md, mandibular bone; mx, maxillary bone; ns, nasal septum cartilage; OF, osteogenic front.
Loss of Trip11 is involved in the elevation of ER stress in skull tissues.
The endoplasmic reticulum (ER) is a critical cellular organelle required for folding a diversity of proteins. Unfolded and misfolded proteins can accumulate in the ER, causing elevated levels of ER stress12,13. To avoid excessive accumulation of unfolded proteins, ER stress response machinery is used to promote cell survival14,15 and alteration of these ER stress responses can cause multiple skeletal defects in humans12,13,16–19. However, it remains unclear whether GMAP210 is involved in the regulation of ER stress response in skull tissues. To address this question, expression of several ER stress markers was examined using control and Trip11 cKO skull tissues. Among tested ER stress markers, sXbp1 expression was moderately reduced and the expression levels of Atf4, Bip and Chop were significantly increased in Trip11 cKO skulls compared with controls (Fig. 6A). Immunohistochemical analysis further confirmed that the number of Bip and CHOP positive cells increased in CNC-derived Trip11 cKO frontal bone (Fig. 6B, C). These are important findings because it has been well characterized that ER stress response genes are frequently upregulated when the ER stress-apoptosis pathway is activated20–22. Because upregulation of ER stress frequently enlarges the physical space of ER cisternae in order to maintain cellular homeostasis17,18,23, we examined whether disruption of Trip11 alters ER cisternae structures in the skull. Transmission electron microscopy (TEM) analysis revealed that the size of ER cisternae in Trip11 cKO skull tissues was larger than in controls (Fig. 6D, E). These data demonstrate that Trip11 may be involved in the regulation of ER stress response during skull development.
Fig. 6. Loss of Trip11 is involved in abnormal ER stress in skull tissue.
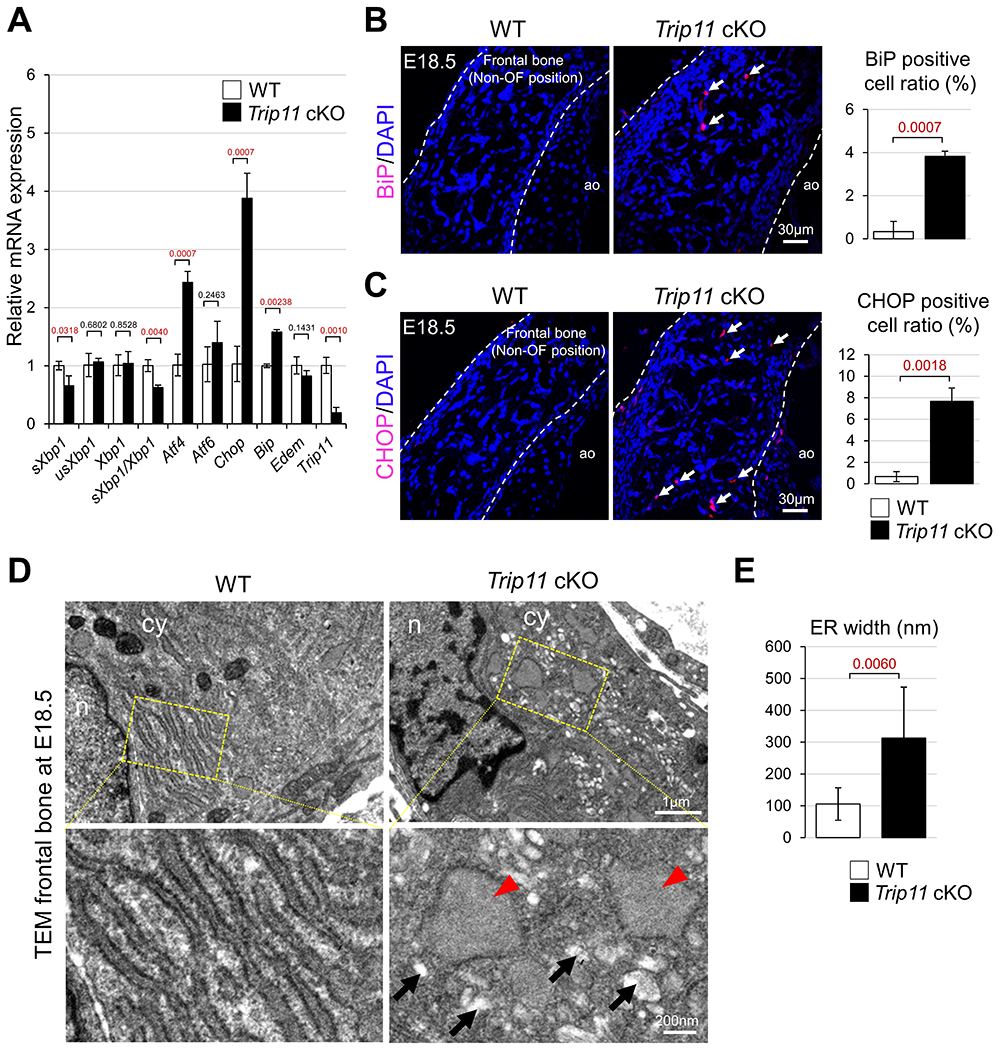
(A) Quantitative RT-PCR analysis of ER stress markers in control (WT) and Trip11:Wnt1-Cre (Trip11 cKO) using frontal bones at E18.5. (B, C) Immunohistological analysis for BiP or CHOP of WT and Trip11 cKO frontal bones at E18.5. Arrows indicate BiP or CHOP positive cells. White dashed lines indicate skull tissue. Quantification of BiP or CHOP positive cell ratio in the frontal bones at E18.5 (ROI: 0.25mm2). ao, cartilage primordium of ala orbitalis. (D) Transmission Electron Microscopy (TEM) images of frontal bones from WT and Trip11 cKO mice at E18.5. Lower panels show higher magnification images of the boxes in upper panels. Red arrowheads and black arrows indicate swollen ER and Golgi cisternae, respectively. n, nucleus; cy, cytoplasm. (E) Quantification of ER cisternae width, which is measured using TEM images of D. The average width is quantified from 20 cells/200 ER lumens in per skull. ER width is defined as the shorter dimension of the ER cisternal space in TEM images. These are representative images of n=3 individual embryos in each group, and data A, B, C and E are as mean ± SD, n = 3 individual embryos in each group.
Loss of Trip11 is associated with aberrant Golgi stress during skull development.
The Golgi complex plays a pivotal role in regulating transportation of proteins via the selective secretory pathway and some studies demonstrate that the Golgi complex also functions as a sensor of cellular stress24,25. Although the signal transduction cascade activated by ER stress is well characterized, little is known about whether aberrant Golgi stress response is associated with skeletal defects. To examine this possibility, expression of several Golgi stress markers was examined using control and Trip11 cKO skull tissues. Among analyzed Golgi stress markers24,26–28, the expression levels of Golga2, Golgb1, Acbd3, Arf4, Cth, Slc7a1 and Slc7a11 were significantly increased in Trip11 cKO skulls compared with controls (Fig. 7A). Western blot analysis further confirmed that the levels of GM130 (Golgi matrix protein 130, part of a cis-Golgi matrix protein) known as a marker of Golgi stress29, was increased in Trip11 cKO compared with wild-type skull (Fig. 7B, C). Because recent studies suggest that increased Golgi stress induces the fragmentation of Golgi and cell death24,26,27, we hypothesized that aberrant Golgi stress may cause smaller sizes of cis-Golgi in Trip11 cKO skulls. To examine this possibility, the size of cis-Golgi was examined by confocal microscope. The Golgi labeled by GM130, a marker of cis-Golgi, was smaller in Trip11 cKO osteoblasts compared with controls (Fig. 7D, E). Profile plot analysis of cis-Golgi29,30 confirmed that the size of cis-Golgi was reduced in Trip11 cKO osteoblasts (Fig. 7F, G). Finally, TEM analysis revealed that Golgi stack structures were severely attenuated and swollen Golgi cisternae were presented in Trip11 cKO skull (Fig. 7H). These observations prompt us to hypothesize that GMAP210 may have two cellular functions in skull development. As we have recently reported, GMAP210 is critical for regulating collagen trafficking in the area of the osteogenic front (OF)11. In addition to this unique function, GMAP210 is also required for osteoblast cell survival via orchestrating both ER and Golgi stress. Therefore, loss of Trip11 in CNC-derived osteoblasts may result in both less collagen secretion and increased cell death, leading to skull defects in mice (Fig. 8).
Fig. 7. Loss of Trip11 is associated with aberrant Golgi stress in skull tissue.
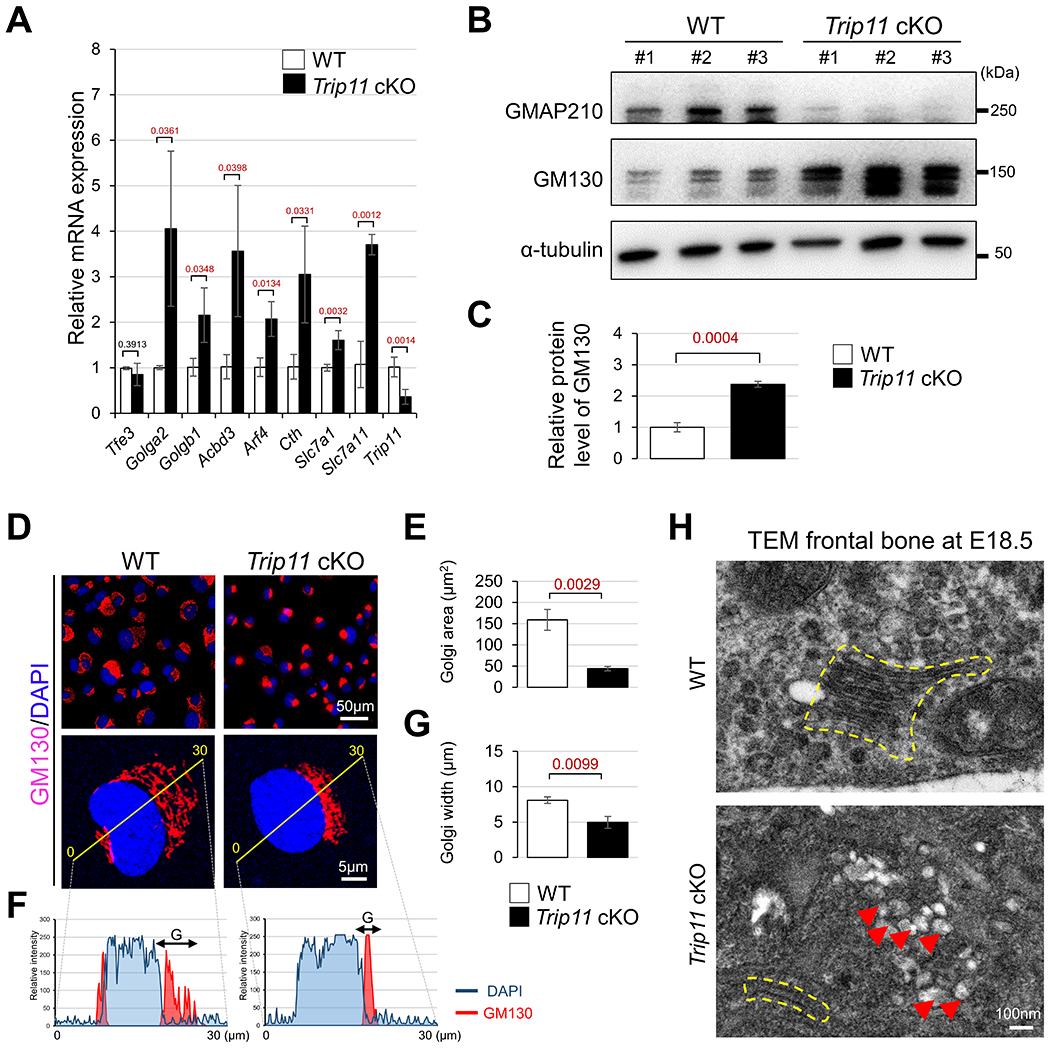
(A) Quantitative RT-PCR analysis of Golgi stress markers in control (WT) and Trip11:Wnt1-Cre (Trip11 cKO) frontal bones at E18.5. (B) Western blot analysis for GMAP210 and GM130 using WT and Trip11 cKO frontal bones at E18.5. Skull lysates were prepared from three individual WT and Trip11 cKO embryos (#1, #2, and #3). (C) Quantification of relative protein level of GM130. (D) Immunofluorescent staining for GM130 of control (WT) and Trip11:Wnt1-Cre (Trip11 cKO) osteoblasts isolated from nasal and frontal bones at E18.5. Lower panels show high magnification representative images. (E) Quantification the cis-Golgi size in osteoblasts. The average size of cis-Golgi in each sample is measured from at least 100 osteoblasts, and the measurement is repeated three times using other osteoblasts isolated from 3 individual skulls in each group. (F) Profile plots analysis of GM130 (red), and DAPI (blue) fluorescence. Yellow lines in the lower panels of D indicate where fluorescent intensity is quantified. “G” is defined as cis-Golgi width. (G) Quantification of cis-Golgi width. The average Golgi width is quantified by 30 osteoblasts in each sample, and the measurement is repeated three times using other osteoblast isolated from 3 individual skulls in each group. (H) Transmission Electron Microscopy (TEM) images of frontal bones from WT and Trip11 cKO mice at E18.5. Yellow dashed lines indicate Golgi shape and red arrowheads indicate swollen cisternae. These are representative images of n=3 individual embryos in each group, and data A, C, E and G are as mean ± SD, n = 3 individual embryos in each group.
Fig. 8. A Schematic model of this study.
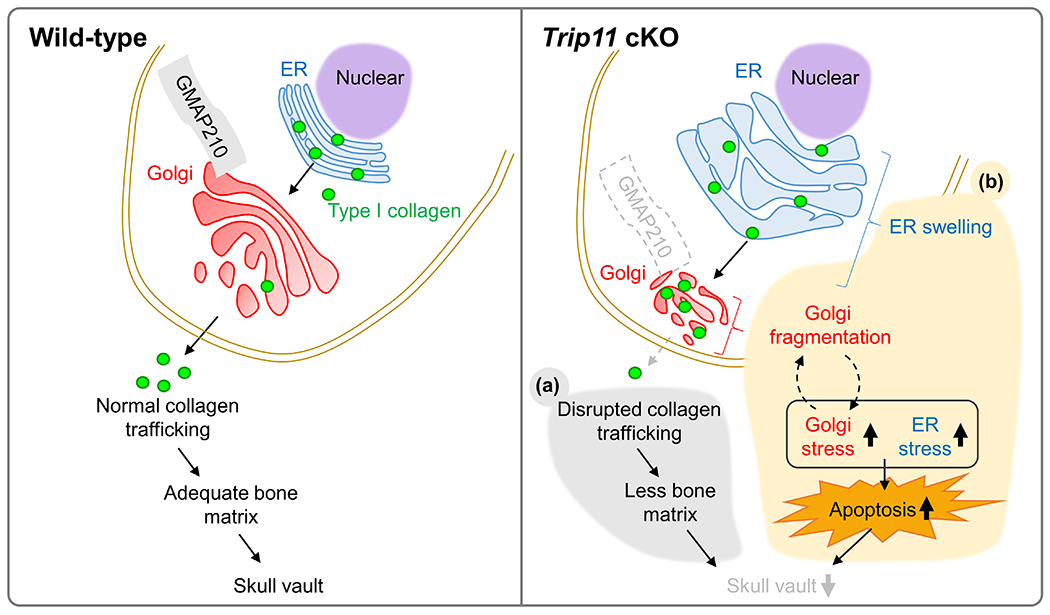
We previously reported that GMAP210 is critical for regulating collagen trafficking in the area of the OF. In this paper, we demonstrate that GMAP210 is also required for osteoblast cell survival via orchestrating both ER and Golgi stress. Loss of Trip11 in CNC-derived osteoblasts results in less collagen secretion (a) and increased cell death (b), thus leading to skull defects in mice.
Conclusions
Mutation of TRIP11 causes achondrogenesis in humans. These patients also display a lack of mineralization in the skull vault where chondrocytes are not present; however, its molecular etiology remains unclear. Recently, we have reported that lack of Trip11 in CNCCs results in altered collagen trafficking in skull development. In this paper, we further characterized the skull defects observed in CNC-specific Trip11 mutants. While we don’t exclude other causative events which may be involved in the etiology of Trip11 mutants, our results suggest that Trip11 may play a pivotal role in the regulation of ER and Golgi stress, which may be required for proper skull development.
Experimental procedures
Animals
Trip11 floxed mice were generated as previously described4. Wnt1-Cre mice were obtained from The Jackson Laboratory31. Mice were housed under controlled conditions, namely 21–22°C (+/−0.5°C), 30–75% (+/−10%) relative humidity and 12:12 light-dark cycle with lights on at 7:00 am. Food and water were available ad libitum for all animals. IACUC number was “AWC-18-0137”. Experimental protocol was reviewed and approved by the Animal Welfare Committee and the Institutional Animal Care and Use Committee of the McGovern Medical School at UTHealth. We crossed Trip11flox/+:Wnt1-Cre (male) with Trip11flox/flox (female) mice to obtain Trip11 mutants. Through this mating, over 300 embryos and pups were produced and a total of 75 mutants (Trip11flox/flox:Wnt1-Cre) were harvested at embryonic day (E) 15.5, 17.5, 18.5, newborn, P8 and P20. Because we mainly focused on embryonic stages, sex differences were not tested. Trip11 mutants were harvested from at least 40 different litters.
Skeletal preparations, histological analysis, and fluorescence imaging
Staining of craniofacial tissues with Alizarin red and Alcian blue was carried out as previously described11,32,33. Cephalometric analysis was performed using the lateral and dorsoventral pictures after skeletal staining. Definitions of cephalometric landmarks and measurements are described in Table 1, 234,35. Immunofluorescent staining, H&E staining, Safranin-O staining, and Picrosirius red staining were performed as previously described33,36,37. TUNEL assay was performed using Click-iT™ Plus TUNEL Assay for In Situ Apoptosis Detection kit (Invitrogen; C10618). Primary antibodies used in immunohistochemistry staining were as follows: BiP (1:100, Santacruz Biotechnology; Sc-13968), CHOP (1:100, Santacruz Biotechnology; Sc-575), EGFP (1:1,000, abcam; ab13970), and GMAP210 (1:200, LS Biosciences; LS-C20059). Stained slides were examined with an Olympus FluoView FV1000 laser scanning confocal microscope using the software FV10-ASW Viewer (version 4.2). For histological and immunohistological analysis, we used coronal sections containing eye, which enabled us to examine CNC-derived frontal bone. A minimum of ten to twelve sections were analysed for each genotyped sample.
Table 1.
Definitions of cephalometric landmarks
| N | The most anterior point on the nasal bone | |
| E | The intersection of the frontal bone and floor of anterior cranial fossa | |
| Po | The most posterior and superior point on the skull | |
| Ba | The most posterior and inferior point on the occipital condyle | |
| Co | The most posterior and superior point on the mandibular condyle | |
| Go | The most posterior point on the mandibular ramus | |
| Mn | The most concave portion of the concavity on the inferior border of the mandibular corpus | |
| Me | The most inferior and anterior point of the lower border of the mandible | |
| LI | The most anterior and superior point on the alveolar bone of the mandibular incisor | |
| Mi | The junction of the alveolar bone and the mesial surface of the first mandibular molar | |
| Mu | The junction of the alveolar bone and the mesial surface of the first maxillary molar | |
| Go1 | The points on the angle of the mandible that produce the widest width | |
| Go2 | The right points on the angle of the mandible that produce the widest width | |
| P1 | The most anterior and medial points on the left within the temporal fossae that produce the most narrow palatal width | |
| P2 | The most anterior and medial points on the right within the temporal fossae that produce the most narrow palatal width | |
| C1 | The points on the cranium on the left that produce the widest cranial width | |
| C2 | The points on the cranium on the right that produce the widest cranial width |
Table 2.
Cephalometric measurements of the craniofacial skeleton
| Neurocranium | Po-N | Total skull length | |
| Po-E | Cranial vault length | ||
| Ba-E | Total cranial base length | ||
| Po-Ba | Posterior neurocranium height | ||
| Viscerocranium | E-N | Nasal length | |
| E-Mu | Viscerocranial height | ||
| Mandible | Co-LI | Total mandibular length | |
| Co-Me | Length from condylar head to Me | ||
| Go-Mn | Posterior corpus length | ||
| Mi-LI | Anterior corpus length | ||
| Transverse mesurements | Go1-Go2 | Bigonial width | |
| C1-C2 | Maximum cranial width | ||
| P1-P2 | Palatal width |
Difinitions of cephalometric landmarks
N The most anterior point on the nasal bone
E The intersection of the frontal bone and floor of anterior cranial fossa
Po The most posterior and superior point on the skull
Micro-computed tomography (μCT) analysis
After fixation, skull samples were scanned with a Scano Viva CT 40 (Scanco Medical, Wangen-Bruttisellen, Switzerland). Voxel size was 15μm×15μm×15μm, X-ray energy was 23μAs and 70kVp, slice thickness was 15μm, and 3-dimensional (3D) reconstructions were performed by IMARIS software (version 9.6).
Isolation of primary osteoblast, and immunocytochemistry
We collected CNC-derived osteoblasts from embryos at E18.5. Nasal and frontal bones were subjected to five sequential digestions with an enzyme mixture containing 1 mg/ml collagenase type I (Sigma-Aldrich, C0130) and 1 mg/ml collagenase type II (Sigma-Aldrich, C6885). Cell fractions (from two to five of the sequential digestions) were collected and cultured in growth medium [alpha-MEM supplemented with 10% (vol/vol) fetal bovine serum (FBS), 100 U/ml penicillin and 100 mg/ml streptomycin]. Immunocytochemistry was performed as previously described11,36. The primary antibody GM130 (1:500, BD Biosciences, 610822) was used. Plot profile was performed30 to measure the size of cis-Golgi using ImageJ software.
Transmission Electron Microscopy (TEM) analysis
Skull tissues were fixed for at least 24 h in Karnovsky’s fixative, decalcified in 10% EDTA for one week, and then refixed for at least 24 h in Karnovsky’s fixative. Samples were then secondarily fixed in 1% osmium tetroxide for one hour, dehydrated in increasing concentrations of ethanol, embedded in epoxy resin, sectioned at 100 nm thickness using an ultramicrotome, stained with uranyl acetate and lead citrate, and imaged at 80 kV using a JEOL JEM-1230 TEM equipped with a Gatan digital camera.
Quantitative real-time RT-PCR
Total RNA was extracted from CNC-derived nasal and frontal bones at E18.5 (n=3 per group) using TRIzol Reagent (Thermo Fisher Scientific; 15596-026). Quantitative RT-PCR was carried out using the SsoAdvanced Universal SYBR Green Supermix (Bio-Rad; 1725274). Conditions for qRT-PCR were 95°C for 2 min, 95°C for 5 sec, and 60°C for 30 sec, for 40 cycles. Sequences of each primer are listed in Table 3. Data were normalized to Gapdh levels and quantified using the 2−ΔΔCT method.
Table 3.
Primer for sequences for quantitative RT-PCR
| Gene names | Protein names | Forward primer (5’-3’) | Reverse primers (5’-3’) |
|---|---|---|---|
| Gapdh | GAPDH | CGTCCCGTAGACAAAATGGT | TCAATGAAGGGGTCGTTGAT |
| Trip11 | GMAP210 | GTCTCCAAGCAAAGAGATGAGACT | GTGGTTTTGCTTTTCTAATTCAGC |
| sXbp1 | XBP-1 (spliced) | CTGAGTCCGAATCAGGTGCAG | GTCCATGGGAAGATGTTCTGG |
| usXbp1 | XBP-1 (unspliced) | CAGCACTCAGACTATGTGCA | GTCCATGGGAAGATGTTCTGG |
| Xbp1 | XBP-1 (total) | TGGCCGGGTCTGCTGAGTCCG | GTCCATGGGAAGATGTTCTGG |
| Atf4 | ATF4 | GGGTTCTGTCTTCCACTCCA | AAGCAGCAGAGTCAGGCTTTC |
| Atf6 | ATF6 | TCGCCTTTTAGTCCGGTTCTT | GGCTCCATAGGTCTGACTCC |
| Chop | CHOP | CCACCACACCTGAAAGCAGAA | AGGTGAAAGGCAGGGACTCA |
| Bip | BiP | TTCAGCCAATTATCAGCAAACTCT | TTTTCTGATGTATCCTCTTCACCAGT |
| Edem | EDEM | CTACCTGCGAAGAGGCCG | GTTCATGAGCTGCCCACTGA |
| TFE3 | TFE3 | TGCGTCAGCAGCTTATGAGG | AGACACGCCAATCACAGAGAT |
| Golga2 | GM130 | TGTCACAGAACCGAGAGCTGA | GCTGCTCCTGTAGACCCTG |
| Golgb1 | Giantin | GCCTTCACTAAGAGCATGTCAT | GCTGATCCTTTAGAGCAATGCAG |
| Acbd3 | GCP60 | GAGGAGCTTTACGGCCTGG | CTTATGCAGTGCCACGAACTT |
| Arf4 | ARF4 | CTGGCAAGACGACAATTCTGT | CCACAAAAATGAGACCCTGGGTA |
| Cth | CSE | TTCCTGCCTAGTTTCCAGCAT | GGAAGTCCTGCTTAAATGTGGTG |
| Slc7a1 | xCT | CTGCCTCAACACCTATGACCT | GAGAGCAGCAATCAAGAAGGAG |
| Slc7a11 | Cat1 | GGCACCGTCATCGGATCAG | CTCCACAGGCAGACCAGAAAA |
Western blot analysis
CNC-derived osteoblast lysates or skull tissue lysates were prepared in RIPA buffer. After centrifugation at 15,000 g, supernatants were separated by SDS/PAGE, blotted onto a PVDF membrane, analyzed with specific antibodies, and visualized with enhanced chemiluminescence. Antibodies used were as follows: GM130 (1:500, BD Biosciences; 610822), GMAP210 (1:500, LS Biosciences, LS-C20059), and α-tubulin (1:5,000, Abcam, ab7291). The Clarity Max ECL Substrate (Bio-Rad) was used for chemiluminescent detection, and signals were quantified with Image Lab Version 5.0 (Bio-Rad).
Statistical analysis
Statistical analyses were performed using Student’s t tests. P values of less than 0.05 were considered statistically significant. P values were showed in each graph.
Acknowledgments
We acknowledge Dr. Patrick Smits and Dr. Matthew Warman for the Trip11 floxed mice; Dr. Jacqueline Hecht and Dr. Karen Posey for CHOP and BiP antibodies; Dr. Catherine Ambrose for micro-CT analysis. This study was supported by a research grant NIDCR/NIH R01DE025897 (Y.K.) and by a fellowship from the Uehara Memorial Foundation (H.Y.).
Grant support:
NIDCR/NIH R01DE025897 (Y.K.)
Uehara Memorial Foundation (H.Y.)
Footnotes
Disclosures: All authors state that they have no conflicts of interest.
References
- 1.Tretter AE, Saunders RC, Meyers CM, et al. Antenatal diagnosis of lethal skeletal dysplasias. Am J Med Genet. Feb 17 1998;75(5):518–22. [PubMed] [Google Scholar]
- 2.Spranger J International classification of osteochondrodysplasias. The International Working Group on Constitutional Diseases of Bone. Eur J Pediatr. Jun 1992;151(6):407–15. 10.1007/BF01959352. [DOI] [PubMed] [Google Scholar]
- 3.Smits P, Bolton AD, Funari V, et al. Lethal skeletal dysplasia in mice and humans lacking the golgin GMAP-210. The New England journal of medicine. Jan 21 2010;362(3):206–16. 10.1056/NEJMoa0900158. [DOI] [PMC free article] [PubMed] [Google Scholar]
- 4.Bird IM, Kim SH, Schweppe DK, et al. The skeletal phenotype of achondrogenesis type 1A is caused exclusively by cartilage defects. Development. Jan 8 2018;145(1). 10.1242/dev.156588. [DOI] [PMC free article] [PubMed] [Google Scholar]
- 5.Richtsmeier JT, Flaherty K. Hand in glove: brain and skull in development and dysmorphogenesis. Acta Neuropathol. Apr 2013;125(4):469–89. 10.1007/s00401-013-1104-y. [DOI] [PMC free article] [PubMed] [Google Scholar]
- 6.Morriss-Kay GM, Wilkie AO. Growth of the normal skull vault and its alteration in craniosynostosis: insights from human genetics and experimental studies. Journal of anatomy. Nov 2005;207(5):637–53. 10.1111/j.1469-7580.2005.00475.x. [DOI] [PMC free article] [PubMed] [Google Scholar]
- 7.Mishina Y, Snider TN. Neural crest cell signaling pathways critical to cranial bone development and pathology. Experimental cell research. Jul 15 2014;325(2):138–47. 10.1016/j.yexcr.2014.01.019. [DOI] [PMC free article] [PubMed] [Google Scholar]
- 8.Jiang X, Iseki S, Maxson RE, Sucov HM, Morriss-Kay GM. Tissue origins and interactions in the mammalian skull vault. Developmental biology. Jan 1 2002;241(1):106–16. 10.1006/dbio.2001.0487. [DOI] [PubMed] [Google Scholar]
- 9.Chai Y, Maxson RE Jr. Recent advances in craniofacial morphogenesis. Developmental dynamics : an official publication of the American Association of Anatomists. Sep 2006;235(9):2353–75. 10.1002/dvdy.20833. [DOI] [PubMed] [Google Scholar]
- 10.Noden DM, Trainor PA. Relations and interactions between cranial mesoderm and neural crest populations. Journal of anatomy. Nov 2005;207(5):575–601. 10.1111/j.1469-7580.2005.00473.x. [DOI] [PMC free article] [PubMed] [Google Scholar]
- 11.Yamaguchi H, Meyer MD, He L, Senavirathna L, Pan S, Komatsu Y. The molecular complex of ciliary and golgin protein is crucial for skull development. Development. Jul 1 2021;148(13). 10.1242/dev.199559. [DOI] [PMC free article] [PubMed] [Google Scholar]
- 12.Gething MJ, Sambrook J. Protein folding in the cell. Nature. Jan 2 1992;355(6355):33–45. 10.1038/355033a0. [DOI] [PubMed] [Google Scholar]
- 13.Ellgaard L, Molinari M, Helenius A. Setting the standards: quality control in the secretory pathway. Science. Dec 3 1999;286(5446):1882–8. 10.1126/science.286.5446.1882. [DOI] [PubMed] [Google Scholar]
- 14.Ron D Translational control in the endoplasmic reticulum stress response. The Journal of clinical investigation. Nov 2002;110(10):1383–8. 10.1172/JCI16784. [DOI] [PMC free article] [PubMed] [Google Scholar]
- 15.Rutkowski DT, Kaufman RJ. A trip to the ER: coping with stress. Trends in cell biology. Jan 2004;14(1):20–8. 10.1016/j.tcb.2003.11.001. [DOI] [PubMed] [Google Scholar]
- 16.Yang X, Matsuda K, Bialek P, et al. ATF4 is a substrate of RSK2 and an essential regulator of osteoblast biology; implication for Coffin-Lowry Syndrome. Cell. Apr 30 2004;117(3):387–98. 10.1016/s0092-8674(04)00344-7. [DOI] [PubMed] [Google Scholar]
- 17.Murakami T, Saito A, Hino S, et al. Signalling mediated by the endoplasmic reticulum stress transducer OASIS is involved in bone formation. Nature cell biology. Oct 2009;11(10):1205–11. 10.1038/ncb1963. [DOI] [PubMed] [Google Scholar]
- 18.Saito A, Hino S, Murakami T, et al. Regulation of endoplasmic reticulum stress response by a BBF2H7-mediated Sec23a pathway is essential for chondrogenesis. Nature cell biology. Oct 2009;11(10):1197–204. 10.1038/ncb1962. [DOI] [PubMed] [Google Scholar]
- 19.Patterson SE, Dealy CN. Mechanisms and models of endoplasmic reticulum stress in chondrodysplasia. Developmental dynamics : an official publication of the American Association of Anatomists. Jul 2014;243(7):875–93. 10.1002/dvdy.24131. [DOI] [PubMed] [Google Scholar]
- 20.Oyadomari S, Mori M. Roles of CHOP/GADD153 in endoplasmic reticulum stress. Cell Death Differ. Apr 2004;11(4):381–9. 10.1038/sj.cdd.4401373. [DOI] [PubMed] [Google Scholar]
- 21.Carrara M, Prischi F, Nowak PR, Kopp MC, Ali MM. Noncanonical binding of BiP ATPase domain to Ire1 and Perk is dissociated by unfolded protein CH1 to initiate ER stress signaling. eLife. Feb 18 2015;4. 10.7554/eLife.03522. [DOI] [PMC free article] [PubMed] [Google Scholar]
- 22.Kopp MC, Larburu N, Durairaj V, Adams CJ, Ali MMU. UPR proteins IRE1 and PERK switch BiP from chaperone to ER stress sensor. Nat Struct Mol Biol. Nov 2019;26(11):1053–1062. 10.1038/s41594-019-0324-9. [DOI] [PMC free article] [PubMed] [Google Scholar]
- 23.Saito A, Ochiai K, Kondo S, et al. Endoplasmic reticulum stress response mediated by the PERK-eIF2(alpha)-ATF4 pathway is involved in osteoblast differentiation induced by BMP2. The Journal of biological chemistry. Feb 11 2011;286(6):4809–18. 10.1074/jbc.M110.152900. [DOI] [PMC free article] [PubMed] [Google Scholar]
- 24.Sbodio JI, Snyder SH, Paul BD. Golgi stress response reprograms cysteine metabolism to confer cytoprotection in Huntington’s disease. Proceedings of the National Academy of Sciences of the United States of America. Jan 23 2018;115(4):780–785. 10.1073/pnas.1717877115. [DOI] [PMC free article] [PubMed] [Google Scholar]
- 25.Passemard S, Perez F, Gressens P, El Ghouzzi V. Endoplasmic reticulum and Golgi stress in microcephaly. Cell Stress. Oct 30 2019;3(12):369–384. 10.15698/cst2019.12.206. [DOI] [PMC free article] [PubMed] [Google Scholar]
- 26.Oku M, Tanakura S, Uemura A, et al. Novel cis-acting element GASE regulates transcriptional induction by the Golgi stress response. Cell Struct Funct. 2011;36(1):1–12. 10.1247/csf.10014. [DOI] [PubMed] [Google Scholar]
- 27.Taniguchi M, Nadanaka S, Tanakura S, et al. TFE3 is a bHLH-ZIP-type transcription factor that regulates the mammalian Golgi stress response. Cell Struct Funct. 2015;40(1):13–30. 10.1247/csf.14015. [DOI] [PubMed] [Google Scholar]
- 28.He Q, Liu H, Deng S, et al. The Golgi Apparatus May Be a Potential Therapeutic Target for Apoptosis-Related Neurological Diseases. Front Cell Dev Biol. 2020;8:830. 10.3389/fcell.2020.00830. [DOI] [PMC free article] [PubMed] [Google Scholar]
- 29.Eisenberg-Lerner A, Benyair R, Hizkiahou N, et al. Golgi organization is regulated by proteasomal degradation. Nature communications. Jan 21 2020;11(1):409. 10.1038/s41467-019-14038-9. [DOI] [PMC free article] [PubMed] [Google Scholar]
- 30.Wehrle A, Witkos TM, Unger S, et al. Hypomorphic mutations of TRIP11 cause odontochondrodysplasia. JCI Insight. Feb 7 2019;4(3). 10.1172/jci.insight.124701. [DOI] [PMC free article] [PubMed] [Google Scholar]
- 31.Danielian PS, Muccino D, Rowitch DH, Michael SK, McMahon AP. Modification of gene activity in mouse embryos in utero by a tamoxifen-inducible form of Cre recombinase. Current biology : CB. Dec 3 1998;8(24):1323–6. [DOI] [PubMed] [Google Scholar]
- 32.Komatsu Y, Yu PB, Kamiya N, et al. Augmentation of Smad-dependent BMP signaling in neural crest cells causes craniosynostosis in mice. Journal of bone and mineral research : the official journal of the American Society for Bone and Mineral Research. Jun 2013;28(6):1422–33. 10.1002/jbmr.1857. [DOI] [PMC free article] [PubMed] [Google Scholar]
- 33.Noda K, Kitami M, Kitami K, Kaku M, Komatsu Y. Canonical and noncanonical intraflagellar transport regulates craniofacial skeletal development. Proceedings of the National Academy of Sciences of the United States of America. May 10 2016;113(19):E2589–97. 10.1073/pnas.1519458113. [DOI] [PMC free article] [PubMed] [Google Scholar]
- 34.Oishi S, Shimizu Y, Hosomichi J, et al. Intermittent hypoxia induces disturbances in craniofacial growth and defects in craniofacial morphology. Arch Oral Biol. Jan 2016;61:115–24. 10.1016/j.archoralbio.2015.10.017. [DOI] [PubMed] [Google Scholar]
- 35.Lekvijittada K, Hosomichi J, Maeda H, et al. Intermittent hypoxia inhibits mandibular cartilage growth with reduced TGF-beta and SOX9 expressions in neonatal rats. Scientific reports. Jan 13 2021;11(1):1140. 10.1038/s41598-020-80303-3. [DOI] [PMC free article] [PubMed] [Google Scholar]
- 36.Kitami M, Yamaguchi H, Ebina M, Kaku M, Chen D, Komatsu Y. IFT20 is required for the maintenance of cartilaginous matrix in condylar cartilage. Biochemical and biophysical research communications. Jan 29 2019;509(1):222–226. 10.1016/j.bbrc.2018.12.107. [DOI] [PMC free article] [PubMed] [Google Scholar]
- 37.Yamaguchi H, Terajima M, Kitami M, et al. IFT20 is critical for collagen biosynthesis in craniofacial bone formation. Biochemical and biophysical research communications. Dec 17 2020;533(4):739–744. 10.1016/j.bbrc.2020.09.033. [DOI] [PMC free article] [PubMed] [Google Scholar]


