Abstract
We present a unifying statistical formulation for many fundamental problems in genome science and develop a reference-free, highly efficient algorithm that solves it. Sequence diversification – nucleic acid mutation, rearrangement, and reassortment – is necessary for the differentiation and adaptation of all replicating organisms. Identifying sample-dependent sequence diversification, e.g. adaptation or regulated isoform expression, is fundamental to many biological studies, and is achieved today with next-generation sequencing. Paradoxically, current analyses begin with attempts to align to or assemble necessarily incomplete reference genomes, a step that is at odds with detecting the most important examples of sequence diversification. In addition to being computationally expensive, reference-first approaches suffer from diminished discovery power: they are blind to unaligned or mis-aligned sequences. We provide a unifying formulation for detecting sample-dependent sequence diversification that subsumes core problems faced in diverse biological fields. This formulation allows us to construct an algorithm that performs inference on raw reads, avoiding references completely. We illustrate the power of our approach for new data-driven biological discovery with examples of novel single-cell resolved, cell-type-specific isoform expression, including expression in the major histocompatibility complex, and de novo prediction of viral protein adaptation including in SARS-CoV-2.
Introduction
Processes that mutate or rearrange nucleic acids – sequence diversification – are fundamental to evolution and adaptation across the tree of life and the simplest self-replicating elements. Diversification of pathogen genomes enables host range expansion. Host genomes and transcriptomes must be diversified to respond (1, 2). CRISPR spacers turnover and accumulate sequence diversity in response to infections (3); in jawed vertebrates, V(D)J recombination and somatic hypermutation generate diversity during the adaptive immune response. Sequence diversification also seeds natural selection and controls phenotypic diversity: examples include single nucleotide changes and structural variations such as small and large insertions and deletions and movement of transposable elements across the tree of life (4, 5, 6, 7). Sequence diversification in the RNA transcriptome enables dynamic phenotypes from the same reference genome, and takes the form of regulated RNA-isoform expression, e.g., RNA editing and RNA splicing, and enables host-response to virus’ and multicellular gene expression programs to name a few.
Thus, identifying sequence diversification is the core objective of wide-ranging biological studies, from those studying the human immune response to ecological metagenomics to clinical virology. Next-generation sequencing has enabled study of sequence diversification at scale, and it is now routine. However, the uniting biological goal – the study of sample-dependent sequence diversification – has yet to be identified and formulated in a statistical framework. To illustrate this conceptual unification, we now discuss three key and broadly studied examples in greater detail, showing how they can be formulated within this framework.
Example 1: detecting sample-dependent RNA splicing. Suppose that exon 1 is spliced primarily to exon 2 in cell-type A, but is spliced to exon 3 in cell-type B. Here, the sequence in exon 1 has downstream sample-specific diversity (Fig. 1b). Many such examples and variations, including allele-specific splicing or expression and more complex splicing patterns, have important phenotypic consequences (8). Example 2: Detecting V(D)J rearrangement in the adaptive immune response. Here, RNA (or DNA) measurements aim to identify sample-dependent rearrangement. Regions near diversifying sequences in any V(D)J genomic sequence will exhibit sample-dependent diversity, as cells have highly diverse sequences adjacent to the constant receptor sequence (e.g. immunoglobulin constant regions). Example 3: signatures of viral evolution. As a pathogen adapts to a host, host-interacting genes are under intense selective pressure (9). Because of the scale of strain-level pathogen diversity, sequence diversification in these genes is sample-dependent as strains compete. Space limits the number of known biological examples we discuss in the main text, but myriad problems ranging from plant genomics, to *seq approaches to study chromosomal configurations, to biosurveillance and biomarker detection can be formulated under this framework (more are described in the Supplement).
Figure 1.
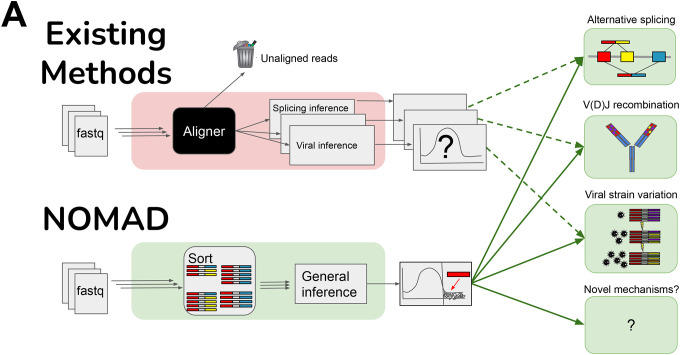
A. Overview of NOMAD (green) vs. existing methods (red). Typical workflows (red) remove reads during fastq preprocessing and alignment, and only then perform statistical significance testing. For every desired inferential task, a different inference pipeline must be used (red). NOMAD performs direct significance testing on raw fastq reads, bypassing alignment and enabling data-scientifically driven inference, using optional ontology mapping for interpretation. If optional mapping is desired, typically 1000 fold fewer reads than in initial fastqs files must be aligned.
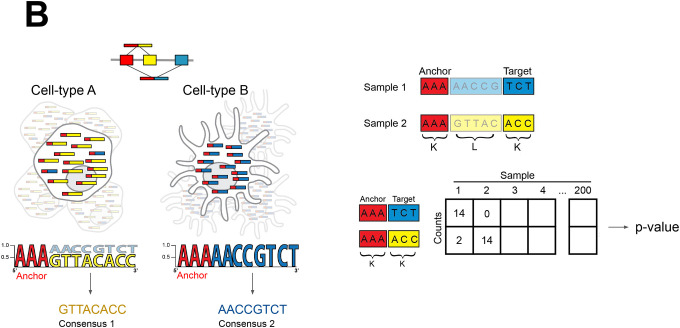
B. Overview of NOMAD statistics: raw fastq files are parsed into kmer anchors (red) and targets (blue and yellow) separated by a lookahead sequence of length L. For each anchor, statistical inference is performed on a contingency table of targets by samples. Reads with sample-dependent sequence diversification by alternative splicing are depicted. For each significant anchor, a per-sample consensus sequence is built which can be interpreted as the dominant isoform in the case of alternative splicing.
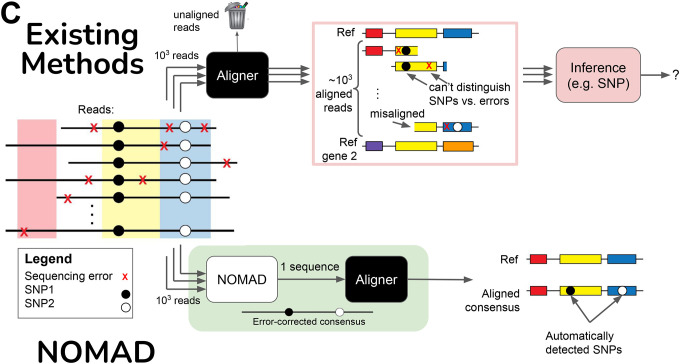
C. Consensus building denoises inputs to aligners before the alignment process. Sequencing errors (red X’s) are randomly distributed in reads, and by plurality vote across reads from the given sample, error-corrected as a consensus is built. Without this step, aligners will (a) fail to align, (b) yield misaligned reads, or (c) align reads correctly but with sequencing errors. Even if correct alignments are made, resulting mismatches with the reference must be further post-processed to make inference that discriminates sequencing errors from SNPs.
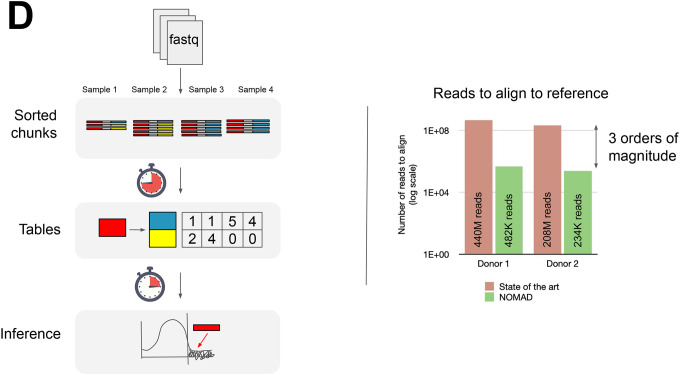
D. Left: NOMAD takes in fastq data, extracts (anchor, target) pairs of k-mers which are sorted and counted, and performs statistical inference. Right: After compressing and denoising via sample consensus sequences, NOMAD reduces the number of alignments required by a factor of 103.
The above formulation is very general and has broad applications in genome science beyond just RNA-Seq. As a biologically unrelated example, consider detecting when a transposon is silent in sample A but is active and mobile in sample B. In sample B, the transposon is inserted in many sequence contexts, creating a greater diversity of bordering k-mers. Thus, the sequence adjacent to the transposon arms has sample-specific diversity in the host genome. NOMAD opens many directions for future work and extension of existing results, both statistical and biological (Supplement).
Today, genomic data analysis is performed in a fragmented and ad-hoc manner, commonly consisting of several multi-step methods that lack theoretical underpinnings or a shared probabilistic formulation. Critically, most workflows operating on sequencing data rely upon reference genomes for a key initial step, first performing alignment, pseudoalignment (hereafter, alignment), or assembly. Statistical inference to detect the prespecified sample-specific sequence diversification of interest (eg. alternative splicing or selection for viral mutation) is performed only afterwards, on the aligned output (10). We refer to this approach as “reference-first”.
Reference-first approaches limit the scope and statistical accuracy of biological discovery, and require intensive computational effort. While annotations and references are useful ontological guideposts, they are only approximately correct. A scientist may not want to introduce bias by pre-specifying references or may not know to do so a priori. Further, reference-first inference provides results that are conditional on aligner outputs, with bias towards reference alleles (11). Downstream statistical analysis is therefore done on a signal convolved with an unknown noise source. Thus, references and annotations are scientifically and statistically problematic for reliable, sensitive, and interpretable discovery.
Shortcomings of reference-first approaches include possible failures to (properly) map sequences due to search heuristics; sequence divergence of individual human genomes creates intrinsic limitations of analysis based on a reference genome, or even pangeomes (12). Reads representing the extensive inter-individual structural variants or other regions not present in the reference are difficult to analyze, and it is thought many person-specific and somatic variants are still missed (13). References’ inability to capture genetic diversity has critical implications for disparities: under-represented groups have comparatively incomplete references (14). All of these problems are more significant for genomic analysis of somatically acquired diseases such as repeat expansions or structurally unstable tumors, where each clone likely has its own “reference genome” (15). De novo approaches have discovered vast person-specific genetic variation, but require high sequencing depth and coverage significantly beyond what is available in many studies, and remain reference-based (4). To our knowledge, no valid p values have been proposed to quantify sample-dependent sequence diversification of de novo assembly approaches.
In studies of the non-human world, such as viral surveillance or environmental metagenomics, reference-first approaches have even more problems (16). Recent work shows that the scope of missed microbial sequence diversity due to the use of reference-first approaches is likely vast (17); further, the scale of the microbial world means references will necessarily be incomplete; indeed, metagenomic studies typically have > 50% unaligned reads (18). Viral reads are often unaligned for similar reasons: viral reference genomes and reference transcriptomes cannot capture the complexity of viral quasispecies (19) or the vast extent of viral polymorphism and splicing (20), and new viral assemblies are constantly being discovered and added to reference databases (21, 22). It is impossible to imagine pre-specifying a set of reference genomes or transcriptomes due to the rapid genomic changes that define the microbial world and have significant clinical impact (23) and where the use of databases limits inference (24). In plant genomics and non-model organism work, it is common to lack a reference genome entirely, making inference on differential isoform expression through alignment impossible. Together, this is a strong argument for reserving reference-based analysis for secondary interpretation.
In addition to these important theoretical issues, reference-based methods have critical practical drawbacks. Alignment to annotations and assembly on large files require significant time, memory, ad hoc parameter choices (e.g., alignment parameters), and are error-prone (25). The popular gapped aligner STAR (26) requires 60GB of memory to store the index of the human genome, for example, making analysis intractable for low-compute-resource scenarios. More recent aligners like HISAT and Bowtie2 require far less memory but the field continues to debate their sensitivity (27, 28).
NOMAD is a statistics-first approach to identify sample-dependent sequence diversification
We show that detecting sample-dependent sequence diversification can be reduced to a natural statistical test on raw sequencing read data. Inference can be performed on pairs of k-mers, contiguous subsequences of length k. We say that a k-mer (called an “anchor”) has sample-dependent diversity if the distribution of k-mers starting L basepairs downstream of it (called “targets”) depends on the sample (Fig. 1b) (29). Inference can be performed for much more general constructions of anchors and targets (Supplement).
The above formulation can be used to detect regulated alternative splicing, a fundamental problem in RNA-seq. A simple example task is to detect if different sample classes (e.g. cell-types) splice exon 1 to exon 2 vs exon 1 to exon 3 at different rates (Fig. 1b). If so, for an anchor sequence a in exon 1 and target sequences t1 and t2 in exons 2 and 3 respectively, conditional on observing a in a read, the probability of observing t1 or t2 later in the read varies by sample class. If, instead, all sample classes have the same splicing distribution for these exons, the probability of observing a specific target t given that a was observed L basepairs upstream is sample-independent. Sample class might be different timepoints, disease statuses, or, in the case of single-cell sequencing, cell type labels or individual cells. Thus, detecting per-sample differences in the conditional distributions of P(t | a) will detect regulated alternative splicing and many more biological examples of sequence diversification.
The probabilistic formulation above unifies many fundamental problems in genome science. It allows us to develop a novel statistics-first approach, NOMAD (de NOvo estiMAtion of Differential elements), that provides a framework for detecting sample-dependent sequence diversification. NOMAD is reference-free, extremely computationally efficient, and provides powerful and valid statistical inference. NOMAD makes all predictions completely independently of references and annotations, which are only used for optional post-facto interpretation. NOMAD performs inference directly on the data observed in genomic studies: raw fastq files, completely bypassing references. Following the above example, NOMAD detects anchor subsequences a where, given observing a in a read, the conditional distribution of observing a target sequence t a distance L downstream of a is sample-dependent (Fig. 1b). Importantly, NOMAD can be run in an unsupervised mode without any sample labels.
We next present the NOMAD algorithm and a snapshot of its results. When run on single-cell RNA-seq samples of macrophage and capillary cells, NOMAD discovers cell-regulated isoforms missed by existing methods and runs much faster than those methods. NOMAD gies new insights into cell-type specific variant calls and expression of the major histocompatibility locus. On single-cell RNA-seq of human and mouse lemur B and T cells, with no single-cell-level metadata and using annotations only for post-facto interpretation of calls, NOMAD can statistically prioritize the variable regions of the Immunoglobulin loci as having highest inter-cell sequence diversity. Lemur inference is made using the human reference as an approximation. Finally, NOMAD’s generality enables it to prioritize viral sequence variants in Influenza and SARS-CoV-2 under selection in complex mixtures, blindly predicting the spike protein as the most highly diversifying protein and reidentifying mutations Omicron variants. In each example, NOMAD reveals biology missed by specialized existing algorithms. NOMAD is implemented as a fully containerized Nextflow pipeline, and is publicly available at https://github.com/kaitlinchaung/nomad.
Results
NOMAD performs direct, reference-free statistical inference
NOMAD performs inference directly on observed fastq reads, an approach we call “statistics-first”. Its statistical approach maps detecting sample-dependent sequence diversification to analysis of contingency tables: for each anchor, fastq files are parsed into contingency tables of targets by samples parsed into separate contingency tables for each anchor in a highly efficient manner (Methods). Anchors with overlapping sequences are processed in parallel. NOMAD then detects deviations from the null hypothesis that samples have the same target distribution (30): first, an anchor-sample difference score Sj for each sample j is computed, a measure of how different this sample’s target distribution is from the empirical target distribution across all samples. Then, in the simplest case of a classical two-group comparison, the NOMAD statistics is the average difference scores (Sj) for each sample in each group (Methods, Supplement).
More generally, the NOMAD statistic S is the weighted linear combination of anchor-sample scores across samples which allows us to efficiently compute the statistic S. It is amenable to theoretical analysis and allows us to provide closed form p value bounds for each anchor. These bounds are multiple testing corrected (31, 32) to yield the q-value reported here (Methods). A large test statistic means that the target distributions significantly deviate from being identically distributed. avoiding common statistical pitfalls that require ad hoc per-sample count lower bounds (33). NOMAD also provides a effect size between 0 and 1, and can be interpreted as a measure of how distinctly target sequences are partitioned by sample (eg. cell type), taking value 0 when sample groups have no difference in target distributions and increasing in magnitude to 1 when the target distributions of the two groups are disjoint (Methods). We also generalize the procedure above to cases without sample-level metadata (e.g. in single-cell RNA-seq when cell-type is unknown), which is NOMAD’s unsupervised mode.
NOMAD denoises reads and reduces number of reads input to costly alignment steps
Alignment is sometimes needed or desired for post-facto biological interpretation. NOMAD is able to dramatically reduce the number of reads required in this step; in empirical tests, this reduction is 1000-fold. It accomplishes this by performing an efficient statistically principled extension of anchors, one per sample, which we term “consensus building.” Given an anchor, the per-sample consensus is constructed such that position i reports the ‘plurality vote’ i bases away from the 3’ end of the anchor among all reads from the sample containing the anchor (Methods, Fig. 1c). To illustrate, continuing example 1, suppose cells of cell-type A splice exon 1 to exon 2, but cells of cell-type B splice exon 1 to exon 3. If a length-27 anchor is 40 bp upstream of the 3’ end of exon 1, sample 1’s consensus is 13 bases of exon 1 followed by exon 2, whereas in sample 2 it is 13 bases of exon 1 followed by exon 3.
If a dominant isoform exists, the consensus will be a sequence from that isoform, e.g. a splice junction represented by it, and will be free of sequencing errors with high probability (Methods). Consensus’ can be mapped with any spliced aligner to predict splice sites, deletions, or other genomic events. Plurality voting denoises the reads, enabling confident calls of SNPs, splicing, or structural variants versus sequencing errors (Methods, Fig. 1b).
In reference-first workflows, every read must be aligned, e.g. for S samples and M reads per sample, S*M alignments must be performed. On the other hand, NOMAD only reports the m anchor/consensus sequences that already have statistical evidence of a biologically important signal, requiring only S*m alignments. The number of reads per sample M is commonly in the range of 10 million, whereas the number of NOMAD-nominated anchors m is typically <10,000 (though this is data-dependent), yielding dramatic savings in time and computation (Fig 1d). We now illustrate NOMAD’s performance in three disparate areas of genome science. All datasets were selected prior to running NOMAD, constituting blind tests of the algorithm. In each case, NOMAD extends results obtained from domain-specific algorithms.
NOMAD provides an efficient, statistical and reference-free differential isoform detection in single cells
Single-cell RNA-seq potentiates the discovery of cell-type-defining isoforms, including paralogous genes and those generated by alternative splicing. Many approaches for statistically rigorous detection of differential isoform expression have been recently developed, but all require reference alignments with aforementioned limitations (10, 28, 34), p-values require intensive computation, and each method has power to detect only certain events, for example, splicing but not SNPs. They also struggle to resolve multi-mapped reads (10, 34). NOMAD generalizes and extends existing pipelines: detecting alternative isoform expression, regulated splicing at unannotated boundaries, and allele-specific expression in one test.
We tested NOMAD’s performance by randomly choosing macrophage and capillary cells profiled with Smart-seq2 from the human lung (two donors) (35). We first ran NOMAD using the sample identity metadata on donors 1 and 2 separately (14 macrophage and capillary cells each in donor 1; 9 each in donor 2). These cell types were chosen due to having a biologically validated, differentially spliced positive control MYL6 based on prior work, including analysis of a superset of cells analyzed here (10, 36). To our knowledge, MYL6 is the only such known positive control. Macrophages are difficult to profile with Smart-seq 2, so cell numbers analyzed are small.
NOMAD runs dramatically faster than existing algorithms that detect differential isoform expression, eg. SpliZ (10, 37). To achieve significance calls for donor 1, each cell required an average run time of 2.28 minutes and 758 MB of memory; for donor 2, each cell required an average run time of 3.5 minutes and 2.4 GB of memory on standard high performance compute architecture. We believe that NOMAD’s memory and time requirements can be significantly further reduced (Supplement). To demonstrate that NOMAD is lightweight, we tested NOMAD on a 2015 Intel laptop with a Intel(R) Core(TM) i7–6500U CPU @ 2.50GHz processor, generating significance calls for 10 cells totaling over 43 million reads in only 1 hour 45 min. We performed a post-facto alignment step for interpretation of splicing and isoform expression and comparison to SpliZ, the current best performing algorithm: alignments for 482,272 and 234,456 sequences for donors 1 and 2 respectively were needed with NOMAD (Methods) compared to 440 million and 208 million reads required for alignment by existing methods, a nearly 1000-fold reduction.
4052 (54%) and 4324 (60%) of NOMAD’s called anchors (for donor 1 and 2 respectively) map to the human genome, and not to databases of repetitive elements or Rfam (38, 39) (Methods, Supplement). This large number of called anchors is expected to include examples of cell-type-specific expression of alleles, isoforms, or splice variants, including those that may have low effect size. Because NOMAD has power to detect many forms of sample-specific sequence diversity, biologists interested in specific events can impose criteria to narrow NOMAD’s calls for their application. To illustrate this, we applied an “isoform detection conditions” to NOMAD’s list of significant anchors to prioritize differential isoform expression, requiring relatively high sequence divergence of targets and that a consensus split-maps (Methods).
175 and 164 anchors (donor 1, 2, resp.) met these criteria, mapping to 37 and 36 different genes (Supplement, Methods). A large fraction of these anchors split-map to annotated exon boundaries, 149 (85%) and 138 (84%), demonstrating that NOMAD is specific and has a high rate of identifying known splice variants. We then investigated NOMAD calls shared in both donors. SpliZ called MYL6, among other genes in one donor, though not genes we discuss below; it made no calls in donor 2, so we cannot compare to its shared results.
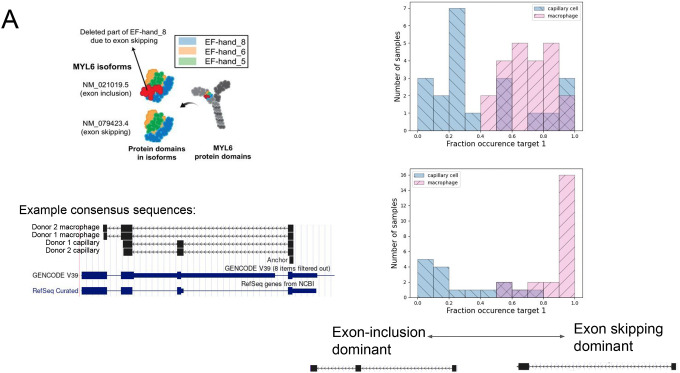
MYL6 anchors were shared in both donors (Fig. 2a) (q values of 1.4E-8 and 5.9E-41 in donors 1 and 2, resp). MYL6 is a subunit of the myosin light chain recently discovered to have regulated alternative splicing in these two cell types (36), and thus constitutes a positive control. Unlike previous methods, NOMAD identifies it without using genome or transcriptome annotation.
Figure 2.
A. NOMAD detects anchors in MYL6, a positive control. Q value of 1.4E-8 for donor 1, 5.8E-41 for donor 2. Consensus split-read mapping shows capillary cells dominantly include and macrophage cells skip exon the exon in MYL6 including the EF_hand_8 domain (shown by the red color). Figure schematic taken from (36).
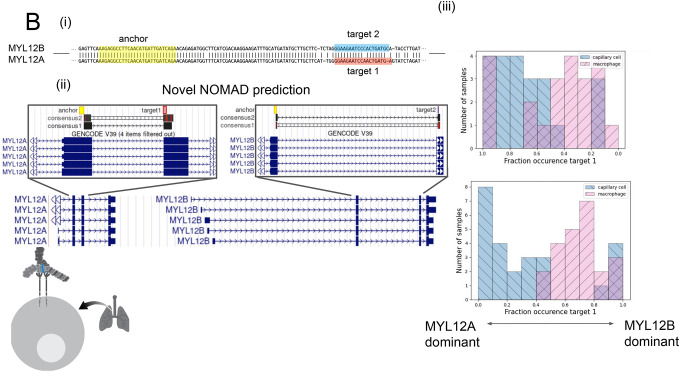
B. (i) Anchors mapping to MYL12 isoforms. Q value of 2.5E-8 for donor 1, 2.3E-42 for P3. An anchor highlighted in yellow includes a shared NOMAD-called anchor between donors 1 and 2; MYL12A and MYL12B isoforms share >95% nucleotide identity in coding regions. (ii) NOMAD’s approach automatically detects targets and creates consensus sequences that unambiguously distinguish the two isoforms. (iii) In both donors, NOMAD reveals differential regulation of MYL12A and MYL12B in capillary cells (MYL12A dominant) and macrophages (MYL12B dominant). The schematic illustrates MYL12 (in blue) within the myosin light chain complex, recently shown to interact with CD69 in the lung.
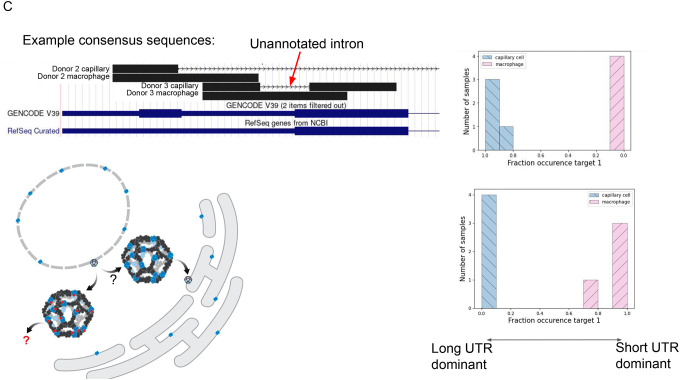
C. Schematic model shows SEC13 embedded in COP2-encased vesicles that bud from the endoplasmic reticulum; SEC13 is also found in the nuclear membrane. Short UTR isoforms, missing the C terminus of the protein, are dominant in capillary cells; long UTRs are dominant in macrophages. Each donor capillary cell has an identical consensus in donor 1, reflecting an unannotated splice isoform. Q value of 1.2E-9 for P2, 6.3E-26 for P3.
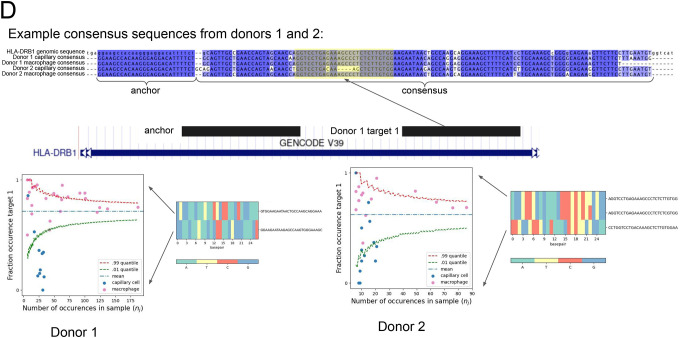
D. Unique alignment of the NOMAD-identified anchor, target1 pair to HLA-DRB1. Q value of 4.0E-10 for P2, 1.2E-4 for donor 2. Each donor, celltype pair has a distinct, cell-type specific consensus sequence, reflected by the multiway alignment to HLA-DRB1 3’ UTR. Nucleotide composition of the most abundant targets are depicted as heatmaps. Scatter plots show cell-type regulation of different HLA-DRB1 alleles not explained by a null binomial sampling model p<2E-16 for donor 1, 5.6E-8 for donor 2, finite sample confidence intervals depicted in red and green, statistical test described in Methods.
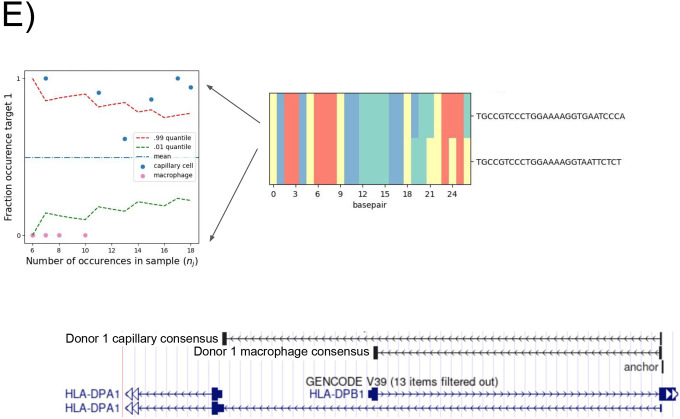
E. Donor 1 specific splice variant of HLA-DPB1. Anchor Q value: 7.9E-22. Detected targets in macrophages exclusively expressing the short isoform which shortens the ORF and changes the 3’ UTR; splice variants found de novo by NOMAD consensus’. Binomial hypothesis test as in D for cell-type target expression depicted in scatter plots (p<2.8E-14).
We next examined other NOMAD calls shared by the two donors. Anchors mapping to MYL12 paralogs were some of the most abundant and included shared anchors between the donors (Methods, Fig. 2b). MYL12 is also a subunit of the myosin light chain. In humans (as in many species) there are two paralogous genes, MYL12A and MYL12B, located in tandem on chromosome 18. The paralogs have >95% shared nucleotide identity in coding sequences (Fig. 2b), causing “reference-first” algorithms to fail to distinguish them due to mapping ambiguity.
NOMAD’s approach automatically detects targets that unambiguously distinguish the two paralogs, and demonstrates their clear differential regulation in capillary cells and macrophages (Fig 2). We have also observed differential MYL12 isoform expression in other cell types (data not shown). Note that in this case the isoforms identified are due to paralogous genes rather than alternative splicing of a single gene, an example illustrating discovery enabled by NOMAD’s generality. MYL12 was recently discovered to mediate allergic inflammation by interacting with CD69 (40); while little is known about differential functions of the two MYL12 paralogs, the distinct roles of highly similar actin paralogs may be a precedent (41, 42).
SEC13 was the only other gene found in both donors under its isoform conditions (Fig. 2c). In this case, the exact anchor sequence is not shared, but each donor had significant (q<1E-9) cell-type specific isoform involved regulated splicing in the N terminus and 3’ UTR region, though through different splicing events. SEC13 is an essential gene in retinal development (43), shuttling between the nuclear pore and cytoplasm with annotated isoforms differing in the C terminal amino acid sequences (13 amino acids in isoform 1 vs. 37 in isoform 2) (44) and in the 3’ UTR sequences. NOMAD shows splicing regulation in this region in both donors perfectly correlated with cell type, with the shorter UTR, including an unannotated variant, expressed exclusively in macrophages (Fig 2c). In donor 2 a distinct anchor was called: consensus sequences reveal an unannotated, in-frame splice variant that excludes the 4 N terminal amino acids and a short fragment of the 3’ UTR. This intron would be very short, but bigger than the shortest reported spliceosomal intron in humans (45). No evidence of donor 1’s splice variant was found in donor 2 (and vice versa) using manual inspection of reads. A second anchor in SEC13 shows an annotated SNP found de novo that also correlates perfectly with cell type (Supplement).
SEC13 illustrates that NOMAD’s statistics-first approach provides power to prioritize regulated splicing events for potential biological function. NOMAD jointly discovers SNPs (more generally, any reference variant), cell-type isoform specificity, and unannotated isoforms: existing algorithms perform one but not the other task, with diminished theoretical performance if both variants and cell-type-specific splicing exist.
NOMAD identifies HLA-allele-specific expression at the single-cell level
NOMAD has the potential to resolve cell-type regulation of isoforms unrelated to splicing, such as gene isoforms or paralogs (e.g. MYL12) which are challenging or impossible to resolve with current methods. To illustrate this point, we inspected anchors called by NOMAD in both donors without requiring split mapping and with a less stringent requirement on target diversity (Methods). The only further shared anchors mapped to UBC, ACTB, and genes in the HLA family, including MHC-I and HLA-A,HLA-B and HLA-C, and MHC-II HLA-DRB1 or were unannotated.
HLA is the name for the human major histocompatibility locus (46), a highly polymorphic and rapidly evolving gene family that is critical to adaptive immunity. Currently, HLA mapping requires prespecifying gene panels (47), manual curation, and custom pipelines (48), which still struggle to identify infrequent alleles. To our knowledge, no approach identifies single-cell-resolved HLA allelic expression, though cases where it has been manually identified through classical methods show it has great biological impact (49, 50). NOMAD provides clear statistical and biological inference that HLA-locus alleles are cell-type-specific: anchors with significant target sequence divergence are automatically selected (Fig. 2d,e).
We investigated the HLA-DRB1-annotated NOMAD hits’ cell-type specificity (Fig. 2d). HLA-DRB1 is a major disease risk locus for multiple sclerosis (47, 51), yet due to heterogeneity in the locus, GWAS studies are underpowered to predict pathogenic variants even when detected using reference panels of HLA alleles, which are limited (52). We investigated a shared anchor for which both donors display highly cell-type-specific expression (Fig. 2d, q<1.2E-4). Target 1 in donor 1 maps uniquely to HLA-DRB1, so we can name the gene NOMAD identifies. Consensus’ also map to this gene but other targets map to more than one gene with the HLA-DRB annotation: since annotations can be imperfect, we do not attempt to provide unequivocal HLA allele assignment or typing (Supplement). However, NOMAD provides robust inference that HLA-DRB genes, and likely others in the MHC loci, have single-cell type regulated expression, but have yet to be discovered due to its polymorphism, and associated mapping challenges.
Because the HLA locus is highly polymorphic, NOMAD calls in the locus may be shared at the level of gene name assigned to the anchor but not anchor sequence. Indeed, >10% of called genes in each donor were in the HLA family (12/98 and 12/81, respectively). Because individuals have polymorphisms in this locus, we investigated a donor-specific call with an effect size near 1 in HLA-DPB1 (donor 2); NOMAD did not call this anchor in donor 1. HLA-DPB1 is a MHC class II gene (53) with regulation during activation of bulk CD4+ T cell populations (54, 52), but we are not aware of it being explored in other cell types or at the single-cell level. Consensus mapping (Fig. 2e) shows high cell-type-specific alternative splicing regulation. The long isoform detected in macrophages and the short in capillary cells are predicted to have different functions due to changes in the open reading frame and UTR.
In summary, by bypassing references, NOMAD achieves greater statistical and biological discovery power than existing methods. To our knowledge, NOMAD is the first method to establish cell-type-specific isoform regulation in the examples above, beyond the expected positive control MYL6 discovered recently (36). NOMAD provides joint direct inference on (un)annotated isoforms, SNPs, and isoform discrimination, impossible with existing methods. NOMAD’s fast and transparent workflow should enable rapid and broad application to single cell sequencing studies and unify many analytic workflows (Supplement). To our knowledge, even the best existing algorithms have not and cannot detect these events (10, 55).
NOMAD’s statistical approach does not require sample metadata such as cell type. We ran NOMAD in its unsupervised mode which calls significant anchors without prespecified cell annotations, as well as reporting “discriminative splits” which can be viewed as an approximate cell type classification. Such classification is highly desirable since the process of annotating individual cells is laborious, error-prone, and sometimes cell types are not known a priori or cannot be determined by experts. >90% of genes hit by 2 or more anchors in NOMAD’s supervised mode were also called in the unsupervised mode, including MYL6, MYL12 and SEC13 (Methods, Supplement). Preliminary analysis further suggests NOMAD can be used for unsupervised classification such as clustering in single cell data (current work).
Unsupervised discovery of B, T cell receptor diversity
The adaptive immune system generates more than 10^12 (56) T cell receptor (TCR) and B cell receptor (BCR) variants through V(D)J recombination and somatic hypermutation. The recombined sequences are absent from any reference genome, and the locus may have polymorphisms absent from the reference. Identifying diversity in V(D)J regions from single-cell RNA-seq has important implications for understanding adaptive immune responses. Existing methods require specialized workflows to perform this task, including filtering and receptor annotations (57, 58). We tested if NOMAD could identify V(D)J sequences based on the statistical characteristics of the V(D)J sequence diversity alone.
We randomly chose 50 naive B cells profiled with Smart-seq2 (SS2) from the peripheral blood of donor 1 and 128 CD4+ T cells from donor 2 from the Tabula Sapiens Project (59) and ran NOMAD in its unsupervised mode, (60) without sample metadata, to determine if it prioritized anchors in the BCR (resp. TCR) in B (resp. T) cells which are expected to have high cell-dependent sequence diversification.
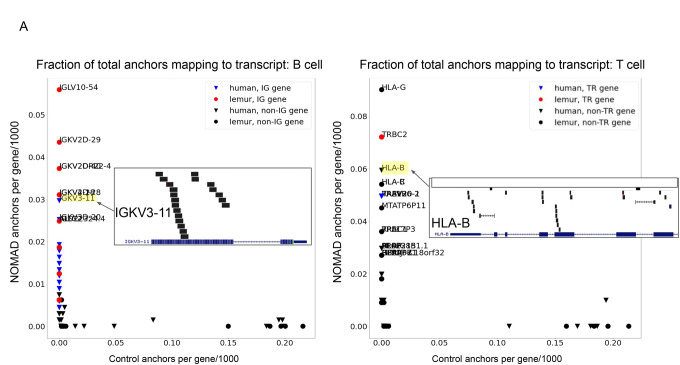
NOMAD blindly rediscovered the high degree of single-cell variability in the immunoglobulin (IG) in B cells: this locus was most highly ranked by anchor counts per transcript (Fig. 3a). To test the possibility that NOMAD anchors just represent the most abundant sequences, we constructed a list of anchors ranked by abundance independent of target diversity, and performed all analysis in parallel. We call this list the control (Methods). In B cells, NOMAD anchor counts were highest in genes IGKV3–11, IGKV3D-20, IGKV3D-11, and IGKC, the first three being variable regions of the B cell receptor (Fig. 3a).
Figure 3.
A. Analysis of lemur and human B (left) and T (right) cells. Human genes are depicted as triangles; lemur as circles. Post-facto alignments show variable regions in the kappa light chain in human B cells are most densely hit by NOMAD anchors and absent from controls; in T cells, the HLA loci and TRB including its constant and variable region are most densely hit, which are absent from controls. x-axis indicates the fraction of the 1000 control anchors (most abundant anchors) that map to the named transcript, y-axis indicates the fraction of NOMAD’s 1000 most significant anchors that map to the named transcript. Each inset depicts anchor density alignment in the IGKV region (left) and HLA-B in CD4+ T cells (top right) and TRBC-2 (bottom right), showing these regions are densely hit.
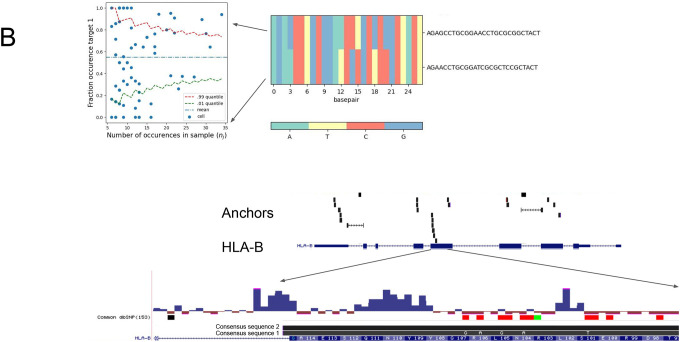
B. NOMAD-annotated anchors are enriched in HLA-B (Panel A). HLA-B sequence variants are identified de novo by the consensus approach, including allele-specific expression of two HLA-B variants, one annotated in the genome reference, the other with 5 SNPs coinciding with annotated SNPS. L: heatmap of per cell fraction expression of each of 2 variants: NOMAD shows that T cells have allelic expression of HLA-B, not explicable by low sampling depth (binomial test as in Fig. 3d,e described in Methods, p< 4.6E-24).
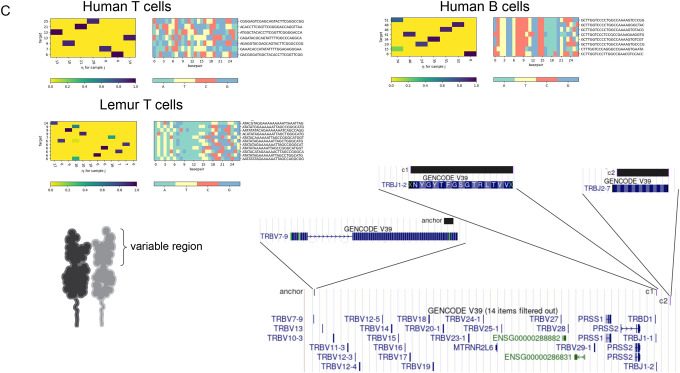
C. In human T cells (left), anchor in the TRVB7–9 gene, and two example consensus’ map to disjoint J segments, TRBJ1–2 and TRBJ2–7. Histograms depict combinatorial single-cell (columns) by target (row) expression of targets detected by NOMAD. Examples of Human B cells and lemur T cells are depicted similarly. Human B cell anchor maps to the immunoglobulin kappa chain constant region (IGKC), and as predicted, targets map imperfectly to IGKJ (not shown). Lemur T cell anchor maps to the human gene TBC1D14.
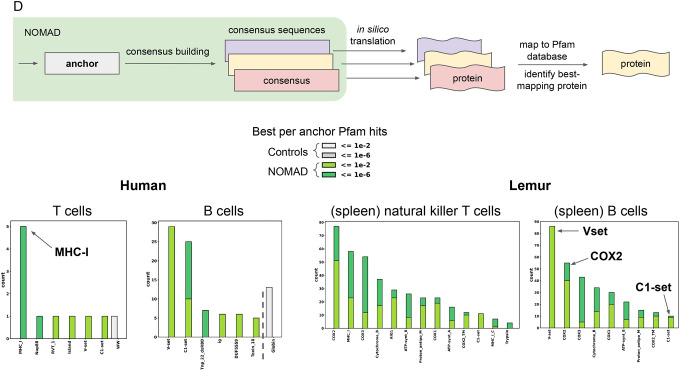
D. NOMAD protein profile analysis schematized at top (Methods) shows that NOMAD recovers domains known to be diversified in adaptive immune cells, bypassing any genome reference or alignment; control hits computed from the most abundant anchors have no such enrichment. In B cells, the V set hits are exclusively at a relatively high E-value, as predicted by protein diversification generated during V(D)J making matching to reference domains imperfect. The third hit is near perfect Tnp_22_dsRBD double stranded RNA binding domain, suggesting potential activation of LINE elements in B cells (green: NOMAD; grey: control). COX2, known to be involved in immune response, is highly ranked in both lemur T and B cells. Plots were truncated for clarity of presentation as indicated by dashed grey line; full plots are in Supplement.
We investigated NOMAD-called anchors in IGKC, the constant region of the kappa light chain. As expected, inspection of a called NOMAD anchor mapping to the constant region had highly diverse, single-cell-specific target composition. Each target mapped uniquely, but imperfectly, to an adjacent IGKJ gene; somatic hypermutation and imperfect end joining are expected to yield imperfect mapping (Fig. 3c, Supplement). Additionally, NOMAD’s consensus provides a partial, local reconstruction of the Immunoglobulin locus that includes some of its variability. NOMAD goes further in providing statistical inference that this locus has sample-specific sequence diversity with no per-cell metadata.
HLA-B, RAP1B, TRAV26–2, and TRBV20–1 were the highest-ranked transcripts in T cells measured by anchor counts. HLA-B is a major histocompatibility (MHC) class I receptor known to be expressed in T cells, and TRAV26–2 and TRBV20–1 are variable regions of the T cell receptor. T cell expression of HLA-B alleles has been correlated with T cell response to HIV (61, 62). Fig. 3A, (Supplement) shows many other genes known to be rearranged by V(D)J were also recovered. In the control sets for both B and T cells, enriched genes were unrelated to immune functions (Fig. 3d, Supplement).
We investigated NOMAD’s most densely hit transcript in T cells: HLA-B (Fig. 3b). Mapping assembled consensus’ shows two dominant alleles: one perfectly matches a reference allele, the other has 4 polymorphisms all corresponding with positions of known SNPs. NOMAD statistically identifies T cell variation in the expression of these two alleles, some T cells having only detectable expression of one but not the other (p< 4,6E-24) (63). Other HLA alleles called by NOMAD, including HLA-F, have similar patterns of variation in allele-specific expression (Supplement).
Gene ontology (64, 65) (GO) term enrichment (Methods) also showed NOMAD anchors prioritized genes related to immune function in both datasets (Supplement): for B cells, the most significant GO terms pertained to adaptive immune response and immunoglobulin production; for T cells, the most significant GO terms pertained to antigen processing and presentation of endogenous peptide antigen via MHC class I (Supp). The control set for B cells did not contain any significant GO terms, while the control set of T cells contained one GO term, for regulation of cell adhesion.
We tested if NOMAD can identify functionally important sequence diversity bypassing genomic annotation completely. To do this, for each anchor, we assigned a protein domain based on in silico translation of its consensus sequence and mapping to the Pfam database (66). The protein domain with best mapping to the database is assigned to the anchor resulting in a set of “NOMAD protein profiles” (Methods, Supplement).
NOMAD protein profiles in B and T cells were highly enriched in domains involved in immune function: the most frequently hit were V-set and C1-set (29 and 25 hits, respectively), domains annotated as the IG-like variable, and constant domains of the immunoglobulin locus, respectively, for the B cells, and 5 hits to the MHC_I profile for the T cells (Fig. 3d). V1 set domain hits have higher E-values, consistent with their mutational burden that would enrich for lower homology to the reference profile. Intriguingly, Tnp_22_dsRBD, a double stranded RNA binding domain contained in L1 transposons, is strongly enriched, suggesting potential activation. Controls have no such enrichment, and map to Globin (13 hits) and WW (1 hit) profiles.
As NOMAD is reference-free, it can be applied to organisms with incomplete or missing reference genomes. We applied NOMAD to 111 natural killer T cells and 289 B cells isolated from the spleen of two mouse lemur (Microcebus murinus) individuals profiled by SS2 (67), as the Microcebus atlas contained very few B and T cells from peripheral blood. This was again a blind test of NOMAD using a random choice of cells and cell types predicted to have V(D)J recombination. Despite the publishing of a high-quality reference genome assembly for the mouse lemur (67), certain regions of the genome remain challenging to annotate with traditional pipelines. As for other species, annotation of the T and B cell receptor loci currently rely on careful curation given their numerous genes that undergo somatic rearrangements and mutations (Ezran et al, manuscript in prep). Because mouse lemurs are primates, regions of partial homology in the T cell receptor and B cell receptor could allow them to be identified by alignment to the human annotation. The human transcript annotations with the most NOMAD anchor hits in lemur B cells were IGLV10–54, IGKV2D-29, IGKV2D-40, and IGKV2OR22–4; for T cells, the transcripts were HLA-G, TRBC2, HLA-C, and HLA-B. Similar to human B and T cells, the transcripts with the most hits in the control set were unrelated to immune function. Together, these show that NOMAD can discover sequence diversification in the V(D)J locus in T and B cells without any reference, using only an annotation guidepost from an organism (human) who shared an ancestor ~60–75 million years ago (68).
In lemur, like in human, NOMAD protein profiles provided unsupervised rediscovery of known biology. The most frequent hits in B cell were the V-set (86 hits, with higher E-values), IG-like domains resembling the antibody variable domain, and COX2 (55 hits, a subunit of cytochrome c oxidase, a protein known to be activated in the inflammatory response) (69). for T cells, the transcripts were COX2 and MHC_I (77 and 58 hits, respectively). Neither control yielded profile hits. Together, this shows that NOMAD can identify sequences with predicted adaptive immune function de novo, using no reference genome, and suggests that unsupervised statistical approaches can discover new functional immune cell types.
Finally, existing pipelines for assembling BCR sequences, eg. BASIC (58) cannot always identify V(D)J rearrangement, including in some cells profiled in (67). We selected the 35 B/plasma cells where no variable gene family on the light chain variable region could be programmatically identified by BASIC. NOMAD automatically identified anchors mapping to the IGLV locus, and its consensus’ include sequences that BLAST to the light chain variable region (Supplement).
NOMAD discovers sequence diversification in proteins at the host-viral interface without a genomic reference
Viral mutations cannot be comprehensively cataloged: strain evolution is constant and viruses exist as quasispecies (70),(20). NOMAD provides inference to identifying the most variable sample-dependent viral sequences bypassing any genomic reference. We tested if NOMAD could detect actively adapting viral sequences de novo. It stands to reason that NOMAD anchors should identify near genomic positions with known strain-level variation and in regions known to undergo high mutation rates. Because virus’ genomes and transcriptomes diversify when infecting a host, NOMAD should prioritize anchors near genome sequences known to be under selection, eg. the receptor binding domain of the spike glycoprotein in SARS-CoV-2 (71).
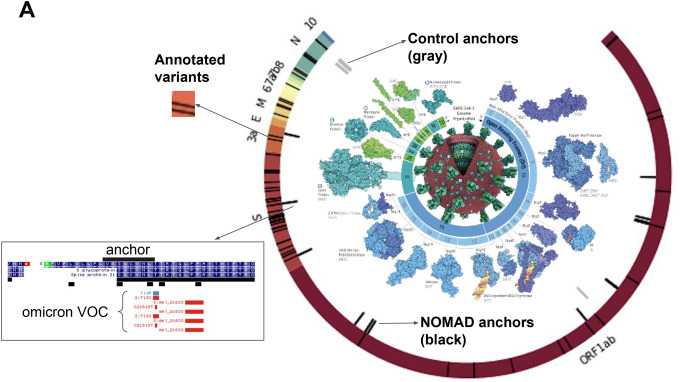
To test this, we ran NOMAD in unsupervised mode on blindly chosen samples with COVID infections from the SRA taken from December 2021 to February 2022 in France, a period of known Omicron-Delta coinfection (SRP365288). To test if known variants could be rediscovered, we mapped NOMAD anchors with high effect size (and matched controls) to the Wuhan strain (Methods). NOMAD anchors had a low bowtie-mapping rate to the Wuhan reference (7%, 19/267). Mapped anchors are enriched near known mutations in the omicron and delta strains and include an anchor adjacent to annotated variants of concern in the spike protein of the Omicron strain (Fig. 4a, Supplement). BLAST of bowtie-unmapped anchors show further hits to SARS reference strains: of the bowtie unaligned anchors, 17/20 blasted (E-value <.1) to strains isolated in 2022.
Figure 4.
A. Highest effect size NOMAD anchors for SARS-CoV2 (L) that map with bowtie to the Wuhan reference (NC_045512) are shown; enrichment near variants of concern, including a sequence immediately adjacent to one of NOMAD’s called anchors. SARS-CoV2 genome depicted with annotated ORFs and lines depicting positions of variants of concern (VOC) annotated as Omicron and Delta variants. No control anchor maps to spike or other areas of VOC density except in N (nucleocapsid). Protein graphics from https://pdb101.rcsb.org/browse/coronavirus. Data from https://www.ncbi.nlm.nih.gov/sra/SRX14565486[accn.
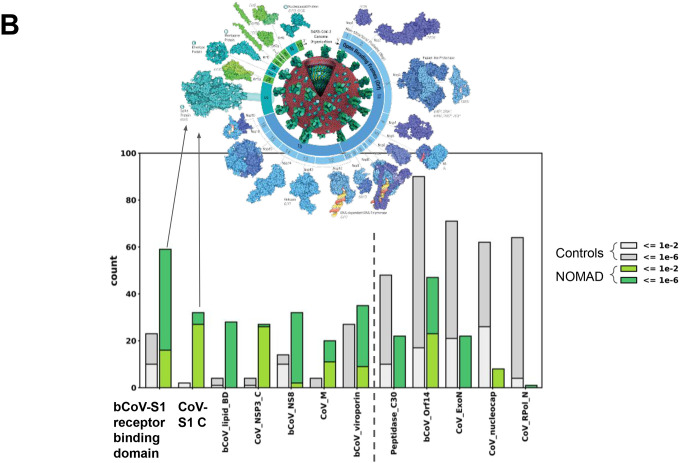
B. NOMAD SARS-CoV2 protein profile hits to the Pfam database (greens) and control (greys); ordered by enrichment in NOMAD hits compared to control. Spike protein domains are highly enriched in the NOMAD hit list (L), the receptor binding domain being highest. NOMAD hits to the CoV spike have higher E-values, suggesting mutations with respect to the reference. The most highly enriched hit is the betacoronavirus S1 glycoprotein receptor binding domain (bCoV_S1_RBD), followed by the spike glycoprotein C-terminal domain (CoV_S1_C), the ORF9b betacoronavirus lipid binding domain (bCoV-lipid_BD), and the coronavirus nonstructural protein 3 replicase C-terminal domain (CoV_NSP3_C). CoV_S1_C and CoV_NSP3_C hits have high E-value hits, potentially explained by an evolutionary divergence from the Pfam entry, predicted if NOMAD were detecting unannotated variants in the SARS-CoV-2 genome. Data from https://www.ncbi.nlm.nih.gov/sra/SRX14565486[accn. Protein graphics from https://pdb101.rcsb.org/browse/coronavirus. Plot was truncated for clarity of presentation as indicated by dashed grey line (Supplement).
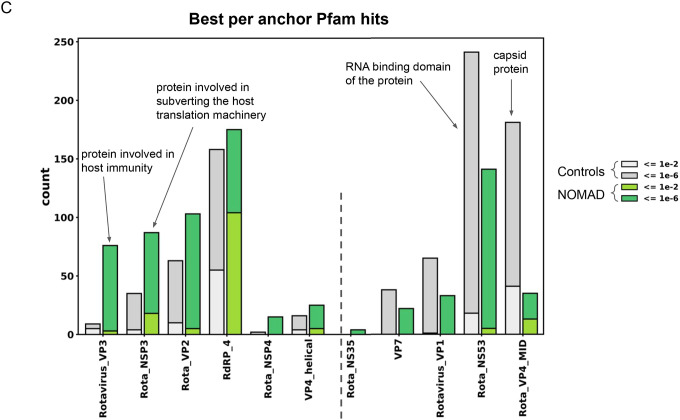
C. NOMAD protein profiles for Rotavirus metagenomic study PRJNA729919: NOMAD protein profile hits to the Pfam database (greens) and control (greys); ordered by enrichment in NOMAD hits compared to control. The most enriched domain is the rotavirus VP3 (Rotavirus_VP3, 76 NOMAD hits vs 9 control hits), a viral protein known to be involved in host immune suppression, followed by the rotavirus NSP3 (Rota_NSP3, 87 NOMAD vs 35 control hits), a viral protein involved in subverting the host translation machinery (77), both proteins that might be expected to be under constant selection given their intimate host interaction. Most enriched in the control: Rota_VP4_MID, an outer capsid coat protein, and RotaNS53, an RNA binding domain of the protein. Plot was truncated for clarity of presentation as indicated by dashed grey line (Supplement).
We performed protein profile analysis of a subset of NOMAD vs. control anchor hits (Supplement). Ranking domain hits by enrichment of NOMAD versus the control (Fig. 4b), the two most enriched are betacoronavirus S1 glycoprotein receptor binding domain (bCoV_S1_RBD, 59 NOMAD vs 23 control hits), followed by the spike glycoprotein C-terminal domain (CoV_S1_C, 32 NOMAD vs 2 control hits), ORF9b betacoronavirus lipid binding domain (bCoV-lipid_BD, 28 NOMAD vs 4 control hits), and the coronavirus nonstructural protein 3 replicase C-terminal domain (CoV_NSP3_C, 27 NOMAD vs 4 control hits).
CoV_S1_C and CoV_NSP3_C gave higher E-value hits from NOMAD. The E-value quantifies alignment quality to Pfam’s reference profiles. NOMAD’s results imply these domains may have evolutionary divergence from the Pfam entry, as would be expected when sampling SARS-CoV-2 variants absent from the reference. Spike polymorphisms between omicron and delta, likely selected by human neutralizing antibody repertoire and/or enhanced receptor binding and entry efficacy, (72) are known. NOMAD identifies them de novo, absent a reference, suggesting that NOMAD could also be useful in identifying protein domains under active adaptation in this and other viruses.
To study the generality of the NOMAD approach to viral discovery, we ran NOMAD in unsupervised mode on other data sampled from viral infections: a cell culture study of an influenza-A infection model (SRP294571) and a metagenomic study of rotavirus breakthrough cases (PRJNA729919), and performed protein profile analysis (Supplement). In influenza, NOMAD’s most frequently hit profiles were Actin (62 hits), and GTP_EFTU (23 hits), and the Influenza-derived Hemagglutinin (17 hits), consistent with virus-induced alternative splicing of Actin (73) and EF-Tu, further elucidating these proteins’ roles during infection (74, 75) (no such hits were found in the control). In rotavirus, the most enriched domain in NOMAD compared to control was the rotavirus VP3 (Rotavirus_VP3, 76 NOMAD hits vs 9 control hits), a viral protein known to be involved in host immune suppression (76), and the rotavirus NSP3 (Rota_NSP3, 87 NOMAD vs 35 control hits), a viral protein involved in subverting the host translation machinery (77), both proteins that might be expected to be under constant selection given their intimate host interaction (Fig. 4c).
Conclusion:
Sample-dependent diversifying sequences are critical for adaptation and cell specialization, spanning DNA diversity generated during V(D)J recombination, sample-specific isoform expression, and adaptation, from viruses to bacteria to complex eukaryotes. Diverse subfields of genomic data-science are unified by attempting to discover sample-dependent sequence diversification. NOMAD is a statistics-first algorithm that efficiently solves this task.
Even within one small pairwise comparison of human cell types profiled with RNA-seq, NOMAD provides many novel insights: from allelic expression of the MHC locus to subtle isoform-sequence variation previously out of reach. Higher-powered, deeper study could shed light on enigmatic aspects of genome regulation such as regulated expression of isoforms with minute amino acid differences, including in HLA alleles and in large and small non-coding RNAs (33, 75). In addition, NOMAD unifies the detection of intron retention, alternative linear splicing, allele-specific splicing, gene fusions, and circular RNA. Its efficiency means it can be run at scale on millions of single cells, and likely on the entire short read archive. NOMAD can also be applied to analyze DNA and protein sequence, or any *seq experiment, from Hi-C to spatial transcriptomics. It also potentiates use in areas of statistical genetics, such as genome-wide association studies, where anchors near statistically significant genetic variants should be identified.
While we have mainly focused on RNA biology in this manuscript, NOMAD is incredibly general. We expect NOMAD to be especially impactful in analysis of plants and microbes, which are far less well annotated, and moreover where DNA and RNA diversity is so vast that references will be unlikely to ever capture it. We believe NOMAD also will potentiate discovery of the mechanisms underlying these diversifying processes. Running NOMAD on paired DNA and RNA seq should identify regulated RNA species, including but not limited to splicing, again bypassing the need for genome assembly.
Findings from SARS-CoV-2 point to a broader potential for NOMAD in viral and generally genomic surveillance seeking to identify emerging pathogens and identify new selective pressures on organisms (e.g. through wastewater). Mutational hotspots are a signature of genetic adaptation, from the simplest virus to complex eukaryotes. NOMAD provides a reference-free method to find k-mers that are under evolutionary selection, as would be expected for any emerging viral threat or microbe adapting to or causing disease in hosts, including mobile cargo such as phage that modify virulence. NOMAD may be an effective tool to monitor and provide viral surveillance for known or novel pathogens.
NOMAD is a “statistic-first” algorithm with post-facto human interpretation by optional coupling with annotation for interpretation. It translates the field’s “reference-first” approach to “statistics-first”, performing direct statistical hypothesis tests on raw sequencing data, enabled by its probabilistic modeling of reads rather than of alignment outputs. Three statistical directions are the subject of current work including extension to parametric inference for these topics: 1) improving function construction for mapping of targets to real numbers for biological and statistical inference; 2) clustering of samples and anchors; 3) statistical tests of anchor and target dependence to predict regulatory relationships. We also anticipate field-specific modules for NOMAD, eg: generating longer consensus sequences via local assembly for example, in BCR and TCR typing.
In summary, NOMAD enables direct, large-scale study of sample-dependent sequence diversification, completely bypassing the need for references or assemblies, and brings to fruition the promise of data-driven biological discovery previously impossible to study.
Limitations of the study
Some problems of course cannot be formulated in the manner posed, such as cases where the estimand is RNA or DNA abundance. However, the problems that can be addressed using this formulation span diverse fields which are of great current importance (Supplement), including those previously discussed.
Methods
Anchor preprocessing
Anchors and targets are defined as sequences of length k positioned at a distance R=max(0, (L - 2 * k) / 2) apart, where L is read length. If L=100 and k=27, then R= 23. We note that largest choices of L have provable theoretical properties regarding information contained in anchor-target pairs following the style of analysis in (78). Anchor sequences can be extracted as adjacent, disjoint sequences or as tiled sequences that begin at a fixed step size (here fastqs were tiled every 5 bp). For this manuscript, 4M reads per fastq file were used. Extracted anchor and target sequences are then counted for each sample, and anchor-target counts are then collected across all samples for restratification by the first kMers of the anchors. This stratification step allows for user control over parallelization. To reduce the number of hypotheses tested and required to correct for, we proceed with p value calculation only for anchors with more than 50 total counts across all samples.
NOMAD Statistics
P values
NOMAD performs statistical inference directly on raw fastq reads. NOMAD begins by constructing the empirical conditional distribution of targets for each anchor and sample (p samples, p>1) by extracting (anchor, target) pairs of k=27-mers from the fastq files (Fig 1b); following notation in (29). Constructing the samples by targets counts matrix for each anchor is extremely inefficient, as it simply requires enumerating every read in every fastq file for each possible anchor sequence. Innovative, yet very simple, preprocessing techniques accomplish this in an efficient manner with complexity nearly linear in the file size, enabling facile statistical inference. For example, this computation and the statistical inferential step explained below together took an average of 2.28 minutes and 750 MB of memory to process 4 million reads, a dramatic speed up over existing methods.
While contingency tables have been widely analyzed in the statistics community (30, 79–83), no existing tests provide closed form, finite-sample valid statistical inference with desired power for the application setting at hand (Supplement). We construct our test statistic S as follows. First, we randomly construct a function f, which maps each target independently to {0,1}. We then compute the mean value of targets with respect to this function. Next, we compute the mean within each sample of this function. Then, we construct our anchor-sample score for sample j, Sj, as a scaled version of the difference between these two. Finally, we construct our test statistic S as the weighted sum of these Sj, with weights corresponding to the cj (class-identity in the two-group case with metadata). In the below equations, Dj,k denotes the sequence of the k-th target observed for the j-th sample.
This allows us to construct statistically valid p values as:
By applying Hoeffding’s inequality on these sums of independent random variables (under the null) (84).
As discussed, we compute this statistic for K different random choices of f, and in the case where sample group metadata is not available, also for L random choices of c. To yield valid p values for this anchor, we apply Bonferroni correction over the L*K multiple hypotheses we test (just K when sample metadata is available). Then, in order to determine the significant anchors, we apply BY correction (BH with positive dependence) to our list of p values for each anchor, yielding valid FDR controlled Q values reported throughout the manuscript.
Note that, in the case of A anchors, we can trivially instead simply apply BY correction to our A*L*K hypotheses, instead of first Bonferroni correction for L*K hypotheses then BY correcting our A aggregate hypotheses. This procedure will still be FDR controlled, and will yield at least as many discovered anchors. For clarity here, however, we apply Bonferroni correction to yield valid p values for each anchor individually.
Effect size:
NOMAD provides a measure of effect size when the cj’s used are +/− 1, to allow for prioritization of anchors with large inter-sample differences in target distributions. Effect size is calculated based on the split c and function f that yield the most significant NOMAD p value. Fixing these, the effect size is the absolute value of the difference between the mean function value over targets (with respect to f) across those samples with cj = +1, and the mean over targets (with respect to f) across those samples with cj = −1.
This effect size has natural relations to a simple 2 group alternative hypothesis. It can also be shown to relate to the total variation distance between the empirical distributions of the two groups. These connections are discussed further in the Supplement.
Consensus sequences
A consensus sequence is built for each significant anchor for the sequence downstream of the anchor sample. A separate consensus is built for each sample by aggregating all reads from this sample that contain the given anchor. Then, NOMAD constructs the consensus as the plurality vote of all these reads; concretely, the consensus at basepair i is the plurality vote of all reads that contain the anchor, i basepairs after the anchor appears in the read (a read does not vote for consensus base i if it has terminated within i basepairs after the anchor appeared). The consensus base as well as the fraction agreement with this base among the reads is recorded.
The consensus sequences can be used for both splice site discovery and other applications, such as identifying point mutations and highly diversifying sequences, e.g. VDJ rearrangements. The statistical properties of consensus building make it an appealing candidate for use in de novo assembly (Supplement).
To provide intuition regarding the error correcting capabilities of the consensus, consider a simple probabilistic model where our reads from a sample all come from the same underlying sequence. In this case, under the substitution only error model, we have that the probability that our consensus for n reads makes a mistake at a given location i under independent sequencing error rate epsilon is at most
We can see that even for n=10, this probability is less than 1.3E-7 for a given basepair, which can be union-bounded over the length of the consensus to yield a vanishingly small probability of error. Thus, for a properly aligned read, if a basepair differs between the consensus and reference it is almost certainly a SNP.
Annotations
Anchors, targets, and consensus sequences are annotated in summary files to lend functional and biological context (Supplement). To identify false positive sequences or contextualize mobile genetic elements, anchors and targets can be aligned with bowtie2 to a set of indices, corresponding to databases of sequencing artifacts, transposable elements, and mobile genetic elements. In these alignments, the best hit is reported, relative to an order of priority (29). Similarly, anchor, target, and consensus sequences can be aligned to reference genomes and transcriptomes, to provide information about the location of sequences relative to genomic elements. To perform homology-based annotation, anchor sequences were extended by their consensus sequences (Supplement), and aligned to annotated protein, non-coding RNA (ncRNA), and eukaryotic repetitive DNA databases, namely, the Pfam, Rfam, and Dfam, respectively following (29).
Splice junction calls
To identify exon coordinates for reporting concordance with annotations in this manuscript, consensus sequences are mapped with STAR aligner (default settings) (26). Gapped alignments are extracted and their coordinates are annotated with known splice junction coordinates using bedtools bamtobed --split; each resulting contiguously mapping segment is called a “called exon” (see below). From each consensus sequence, called exons are generated as start and end sites of each contiguously mapped sequence in the spliced alignment. These ‘called exons’ are then stratified as start sites and end sites. Note that the extremal positions of all called exons would not be expected to coincide with a spliced boundary (see below); “called exon” boundaries would coincide with an exon boundary if they are completely internal to the set of called exon coordinates. Each start and end site of each called exon is intersected with an annotation file of known exon coordinates; it receives a value of 0 if the site is annotated, and 1 if it is annotated as alternative. The original consensus sequence and the reported alignment of the consensus sequence are also reported. Gene names for each consensus are assigned by bedtools intersect with gene annotations (hg38 RefSeq for human data by default), possibly resulting in multiple gene names per consensus.

Example of how spliced reads are converted to “called exons” (bottom) and are compared to annotated exons (top); right most and leftmost boundaries of called exons are not expected to coincide with annotated exon boundaries and are excluded from analysis of concordance between consensus called-exons and annotations.
Identifying cell-type specific isoforms in SS2
In the analysis of HLCA SS2 data, we utilize “isoform detection conditions” for alternative isoform detection. These conditions select for (anchor, target) pairs that map exclusively to the human genome, anchors with at least one split-mapping consensus sequence, mu_lev > 5, and M > 100. We define mu_lev as the average target distance from the most abundant target as measured by the Levenstein distance. To identify anchors and targets that map exclusively to the human genome, we included anchors and targets that had exactly one element annotation, where that one element annotation must be grch38_1kgmaj. To identify anchors with at least one split-mapping consensus, we selected anchors that had at least one consensus sequence with at least 2 called exons. The conditions on Levenshtein distance, designed to require significant across-target sequence diversity, significantly reduced anchors analyzed (excluding many SNP-like effects). We further restricted to anchors with M > 100, to account for the lower cell numbers in macrophage cells; note that the user can perform inference with a lower M requirement, based on input data. For HLA discussion, gene names were called using consensus_gene_mode.
Timing for SS2
Because code was run on a server with dynamic memory, we report summary statistics as follows. For the steps parallelized by fastq file, such as anchor and target retrieval, total time for dataset run, as reported by Nextflow, was parsed per cell. Thus, the average time per cell is reported. For the steps parallelized by 64 files (q value calculations), total extracted times were summed and divided by number of cells. For steps that consisted of aggregating files, total run time was divided by number of cells. Thus, the total time and memory should be multiplied by the total number of cells to achieve an estimate of the pipeline time for this dataset.
HLA analysis in HLCA
NOMAD summary files were processed by restricting to anchors aligning to the human genome and no other databases used in the pipeline for post-facto annotation (Supplement), and having at least 1 target with this characteristic. Further, mu_lev had to exceed 1.5.
Protein Domain Analysis
For each set of enriched anchors, homology-based annotation was attempted against an annotated protein database, the Pfam (66). For each dataset, up to 103 of the most significant anchors (q-value < 0.01) were first assessed against each individual experiment for downstream consensus sequence extensions by appending each consensus nucleotide that both satisfied a minimum observation count of 10 and a minimum observation of identity fraction of 0.8, until whichever metric first exhibited two consecutive failures. In the case of the HIV and Microcebus datasets, 875 and 347 significant anchors were available, and thus used, respectively. Anchors that did not have any consensus nucleotides appended were kept as is. An extended anchor was generated for each experiment in which an anchor was found. Each extended anchor was then stored in a final concatenated multi .fasta file with unique seqID headers for each experiment’s extended anchors.
To assess these extended anchors for protein homology, this concatenated .fasta file was then translated in all six frames using the standard ‘code 11’ translation table using seqkit (85) prior to using hmmsearch from the HMMer3 package (86) to assess each resulting amino acid sequences against the Pfam35 profile Hidden Markov Model (pHMM) database.
All hits to the Pfam database were then binned at different E-value orders of magnitude and plotted using matplotlib (87) in jupyter (88). In each case, control assessments were performed by repeating the extension and homology searches against an equivalent number of control anchors, selected as the most frequent anchors from that dataset.
Lastly it is worth noting that while only counts of the best scoring Pfam hits were assessed in this study, other information is also produced by HMMer3. In particular, relative alignment positions are given for each hit which could be used to more finely pinpoint the precise locus at which sequence diversification is detected.
NOMAD comparison to BASIC analysis of lemur spleen B cells
We ran NOMAD on cells where BASIC failed to identify the light chain variable gene family. We selected cells annotated as “No BCR light chain” by BASIC which was run in -a mode
We identified anchors which were mapped by bowtie to the IGL gene string (human annotation via the following command issued in NOMAD’s genome_annotation output directory).
This resulted in the following 5 anchors:
CCTCAGAGGAGGGCGGGAACAGCGTGA
CTCGGTCACTCTGTTCCCGCCCTCCTC
GCCCCCTCGGTCACTCTGTTCCCGCCC
GGGCGGGAACAGCGTGACCGAGGGGGC
TCACTCTGTTCCCGCCCTCCTCTGAGG
We then grepped these sequences in the anchors and consensus files generated by NOMAD and ran blast with the parameters
mt=“6 qseqid sseqid pident length mismatch gapopen qstart qend sstart send evalue bitscore sseqid sgi sacc slen staxids stitle” with E-value threshold of .1
# command
blastn -outfmt “$fmt” -query “$fasta” -remote -db nt -out “$algnfile” -evalue 0.1 -task blastn -dust no -word_size 24 -reward 1 -penalty -3 -max_target_seqs 200
We checked that light chain variable regions were called via grep for the words “light chain variable” yielding 60 sequences. Each cell could have at most |anchors| contributions to this number, and thus at least 12 cells (conservatively) had NOMAD-identified partial light chain variable sequences.
SARS-CoV2 analysis
All methods are described in the text. Data was downloaded from SRP365288. Bowtie was run in default mode. NOMAD anchors were chosen with effect size threshold >.8. After bowtie mapping, the number of control anchors were chosen to match the number of anchors mapped by bowtie to create comparable numbers. In total, 19 NOMAD anchors mapped with bowtie and 17 mapped from the control and are displayed in Fig 4. An effect size threshold was imposed due to the size of the SARS-CoV-2 genome to obtain low anchor density for analysis. NC_045512.fa, Omicron and Delta mutation variant downloaded as fastas from the UCSC genome browser in June of 2022 using the track browser
 and
and

Rotavirus metagenomics:
Data is taken from NCBI SRA accession PRJNA729919
Control analysis
To construct control anchor lists based on abundance, we considered all anchors input to NOMAD and counted their abundance, collapsing counts across targets. That is, ach anchor receives a count determined by the number of times it appears at an offset of 5 in the read up to position R- max(0,R/2–2*k) where R is the length of the read, summed over all targets. The 1000 most abundant anchors were output as the control set. For analysis comparing control to NOMAD anchors, min(|NOMAD anchor list|,1000) most abundant anchors from the control set were used and the same number of NOMAD anchors were used, sorted by p value.
Gene ontology(GO) term analysis
For comparison of NOMAD anchors with the control set, 1000 of the most significant anchors were analyzed in parallel with the control anchors. Transcripts were assigned to anchors by mapping the anchor sequences to a bowtie2 reference of the human transcriptome. The unique gene list was then used as input to GO term analysis (64, 65). Analysis was performed independently on the NOMAD and control sets without a background set, using the “Homo sapiens” reference, “biological process” ontology, and default significance parameters. For all downstream analyses, only GO terms with statistically significant results were reported.
SARS-CoV2
Anchors with effect size exceeding 0.8 were selected and mapped with bowtie default parameters against the Wuhan strain NC_045512 downloaded from NCBI in 2022. Equal numbers of controls were chosen and also mapped with identical parameters. Mapping was 7% to this index, 19 out of 267 anchors aligned. 19 control anchors were then selected, 17 (89%) of which mapped to the reference. These sets of anchors are depicted in Figure 4a,b.
Acknowledgements
We thank Elisabeth Meyer for extensive edits, figure help, and assistance with exposition; Roozbeh Dehghannasiri for selecting and collating data from HLCA/TSP/Tabula Microcebus analysis, running the SpliZ, and feedback on presentation; the Tabula Microcebus Consortium (Camille Ezran and Hannah Frank) for data sharing and discussion of B and T cell receptor detection algorithms; Jessica Klein for extensive figure assistance; Arjun Rustagi for extensive discussion and assistance in interpretation of viral biology; Michael Swift for discussion of B and T cell receptor detection algorithms; Julia Olivieri for feedback on presentation and detailed comments on the manuscript; Andy Fire for useful discussions and feedback on the manuscript; Robert Bierman for figure assistance and laptop timing; and Aaron Straight, Catherine Blish, Peter Kim, and all members of the Salzman lab for feedback and comments.
J.S. is supported by the Stanford University Discovery Innovation Award, National Institute of General Medical Sciences grant nos. R35 GM139517 and the National Science Federation Faculty Early Career Development Program Award no. MCB1552196. T.Z.B. is supported by the NSF Graduate Research Fellowship Program and the Stanford Graduate Fellowship. K.C., T.Z.B. and J.S. are inventors on provisional patents related to this work.
Code and data availability
The code used in this work is available at https://github.com/kaitlinchaung/nomad. The human lung scRNA-seq data used here is accessible through the European Genome-phenome Archive (accession number: EGAS00001004344). The fastq files for the Tabula Sapiens data (both 10X Chromium and Smart-seq2) were downloaded from https://tabula-sapiens-portal.ds.czbiohub.org/. B cells were used from pilot 1 and T cells from individual 2. The mouse lemur single-cell RNA-seq data used in this study was generated as part of the Tabula Microcebus consortium. Analysis of each set of cells, B and natural killer T cells, were performed on two individuals together and the fastq files were downloaded from: https://tabula-microcebus.ds.czbiohub.org. The sample sheets used as inputs to nextflow for all analysis are uploaded to the github site. Viral data was downloaded from the NCBI: Influenza (SRP294571), SARS-CoV-2 (SRP365288), and rotavirus (PRJNA729919).
Bibliography
- 1.Daugherty M. D., Malik H. S., Rules of engagement: molecular insights from host-virus arms races. Annu. Rev. Genet. 46, 677–700 (2012). [DOI] [PubMed] [Google Scholar]
- 2.Rudman S. M., Greenblum S. I., Rajpurohit S., Betancourt N. J., Hanna J., Tilk S., Yokoyama T., Petrov D. A., Schmidt P., Direct observation of adaptive tracking on ecological time scales in Drosophila. Science. 375, eabj7484 (2022). [DOI] [PMC free article] [PubMed] [Google Scholar]
- 3.Faure G., Shmakov S. A., Yan W. X., Cheng D. R., Scott D. A., Peters J. E., Makarova K. S., Koonin E. V., CRISPR-Cas in mobile genetic elements: counter-defence and beyond. Nat. Rev. Microbiol. 17, 513–525 (2019). [DOI] [PMC free article] [PubMed] [Google Scholar]
- 4.Ebert P., Audano P. A., Zhu Q., Rodriguez-Martin B., Porubsky D., Bonder M. J., Sulovari A., Ebler J., Zhou W., Serra Mari R., Yilmaz F., Zhao X., Hsieh P., Lee J., Kumar S., Lin J., Rausch T., Chen Y., Ren J., Santamarina M., Eichler E. E., Haplotype-resolved diverse human genomes and integrated analysis of structural variation. Science. 372 (2021), doi: 10.1126/science.abf7117. [DOI] [PMC free article] [PubMed] [Google Scholar]
- 5.LeGault K. N., Hays S. G., Angermeyer A., McKitterick A. C., Johura F.-T., Sultana M., Ahmed T., Alam M., Seed K. D., Temporal shifts in antibiotic resistance elements govern phage-pathogen conflicts. Science. 373 (2021), doi: 10.1126/science.abg2166. [DOI] [PMC free article] [PubMed] [Google Scholar]
- 6.Arnold B. J., Huang I.-T., Hanage W. P., Horizontal gene transfer and adaptive evolution in bacteria. Nat. Rev. Microbiol. 20, 206–218 (2022). [DOI] [PubMed] [Google Scholar]
- 7.Chang N.-C., Rovira Q., Wells J. N., Feschotte C., Vaquerizas J. M., Zebrafish transposable elements show extensive diversification in age, genomic distribution, and developmental expression. Genome Res. gr.275655.121 (2022), doi: 10.1101/gr.275655.121. [DOI] [PMC free article] [PubMed] [Google Scholar]
- 8.Ule J., Blencowe B. J., Alternative splicing regulatory networks: functions, mechanisms, and evolution. Mol. Cell. 76, 329–345 (2019). [DOI] [PubMed] [Google Scholar]
- 9.Yang L., Emerman M., Malik H. S., McLaughlin R. N., Retrocopying expands the functional repertoire of APOBEC3 antiviral proteins in primates. eLife. 9 (2020), doi: 10.7554/eLife.58436. [DOI] [PMC free article] [PubMed] [Google Scholar]
- 10.Olivieri J. E., Dehghannasiri R., Salzman J., The SpliZ generalizes “percent spliced in” to reveal regulated splicing at single-cell resolution. Nat. Methods. 19, 307–310 (2022). [DOI] [PMC free article] [PubMed] [Google Scholar]
- 11.Degner J. F., Marioni J. C., Pai A. A., Pickrell J. K., Nkadori E., Gilad Y., Pritchard J. K., Effect of read-mapping biases on detecting allele-specific expression from RNA-sequencing data. Bioinformatics. 25, 3207–3212 (2009). [DOI] [PMC free article] [PubMed] [Google Scholar]
- 12.Sudmant P. H., Rausch T., Gardner E. J., Handsaker R. E., Abyzov A., Huddleston J., Zhang Y., Ye K., Jun G., Fritz M. H.-Y., Konkel M. K., Malhotra A., Stütz A. M., Shi X., Casale F. P., Chen J., Hormozdiari F., Dayama G., Chen K., Malig M., Korbel J. O., An integrated map of structural variation in 2,504 human genomes. Nature. 526, 75–81 (2015). [DOI] [PMC free article] [PubMed] [Google Scholar]
- 13.Ho S. S., Urban A. E., Mills R. E., Structural variation in the sequencing era. Nat. Rev. Genet. 21, 171–189 (2020). [DOI] [PMC free article] [PubMed] [Google Scholar]
- 14.Sherman R. M., Salzberg S. L., Pan-genomics in the human genome era. Nat. Rev. Genet. 21, 243–254 (2020). [DOI] [PMC free article] [PubMed] [Google Scholar]
- 15.Meyerson M., Pellman D., Cancer genomes evolve by pulverizing single chromosomes. Cell. 144, 9–10 (2011). [DOI] [PubMed] [Google Scholar]
- 16.Consortium T. N. A. O., A Global Nucleic Acid Observatory for Biodefense and Planetary Health. arXiv (2021), doi: 10.48550/arxiv.2108.02678. [DOI] [Google Scholar]
- 17.Batson J., Dudas G., Haas-Stapleton E., Kistler A. L., Li L. M., Logan P., Ratnasiri K., Retallack H., Single mosquito metatranscriptomics identifies vectors, emerging pathogens and reservoirs in one assay. eLife. 10 (2021), doi: 10.7554/eLife.68353. [DOI] [PMC free article] [PubMed] [Google Scholar]
- 18.Flemming H.-C., Wuertz S., Bacteria and archaea on Earth and their abundance in biofilms. Nat. Rev. Microbiol. 17, 247–260 (2019). [DOI] [PubMed] [Google Scholar]
- 19.Kirkegaard K., van Buuren N. J., Mateo R., My Cousin, My Enemy: quasispecies suppression of drug resistance. Curr. Opin. Virol. 20, 106–111 (2016). [DOI] [PMC free article] [PubMed] [Google Scholar]
- 20.Kim D., Lee J.-Y., Yang J.-S., Kim J. W., Kim V. N., Chang H., The Architecture of SARS-CoV-2 Transcriptome. Cell. 181, 914–921.e10 (2020). [DOI] [PMC free article] [PubMed] [Google Scholar]
- 21.Edgar R. C., Taylor J., Lin V., Altman T., Barbera P., Meleshko D., Lohr D., Novakovsky G., Buchfink B., Al-Shayeb B., Banfield J. F., de la Peña M., Korobeynikov A., Chikhi R., Babaian A., Petabase-scale sequence alignment catalyses viral discovery. Nature. 602, 142–147 (2022). [DOI] [PubMed] [Google Scholar]
- 22.Zayed A. A., Wainaina J. M., Dominguez-Huerta G., Pelletier E., Guo J., Mohssen M., Tian F., Pratama A. A., Bolduc B., Zablocki O., Cronin D., Solden L., Delage E., Alberti A., Aury J.-M., Carradec Q., da Silva C., Labadie K., Poulain J., Ruscheweyh H.-J., Wincker P., Cryptic and abundant marine viruses at the evolutionary origins of Earth’s RNA virome. Science. 376, 156–162 (2022). [DOI] [PMC free article] [PubMed] [Google Scholar]
- 23.Evans D. R., Griffith M. P., Sundermann A. J., Shutt K. A., Saul M. I., Mustapha M. M., Marsh J. W., Cooper V. S., Harrison L. H., Van Tyne D., Systematic detection of horizontal gene transfer across genera among multidrug-resistant bacteria in a single hospital. eLife. 9 (2020), doi: 10.7554/eLife.53886. [DOI] [PMC free article] [PubMed] [Google Scholar]
- 24.Wright R. J., Comeau A. M., Langille M. G. I., From defaults to databases: parameter and database choice dramatically impact the performance of metagenomic taxonomic classification tools. BioRxiv (2022), doi: 10.1101/2022.04.27.489753. [DOI] [PMC free article] [PubMed] [Google Scholar]
- 25.Mangul S., Martin L. S., Hill B. L., Lam A. K.-M., Distler M. G., Zelikovsky A., Eskin E., Flint J., Systematic benchmarking of omics computational tools. Nat. Commun. 10, 1393 (2019). [DOI] [PMC free article] [PubMed] [Google Scholar]
- 26.Dobin A., Davis C. A., Schlesinger F., Drenkow J., Zaleski C., Jha S., Batut P., Chaisson M., Gingeras T. R., STAR: ultrafast universal RNA-seq aligner. Bioinformatics. 29, 15–21 (2013). [DOI] [PMC free article] [PubMed] [Google Scholar]
- 27.Westoby J., Herrera M. S., Ferguson-Smith A. C., Hemberg M., Simulation-based benchmarking of isoform quantification in single-cell RNA-seq. Genome Biol. 19, 191 (2018). [DOI] [PMC free article] [PubMed] [Google Scholar]
- 28.Fenn A. M., Tsoy O., Faro T., Roessler F., Dietrich A., Kersting J., Louadi Z., Lio C. T., Voelker U., Baumbach J., Kacprowski T., List M., Alternative splicing analysis benchmark with DICAST. BioRxiv (2022), doi: 10.1101/2022.01.05.475067. [DOI] [PMC free article] [PubMed] [Google Scholar]
- 29.Abante J., Wang P. L., Salzman J., DIVE: a reference-free statistical approach to diversity-generating and mobile genetic element discovery. BioRxiv (2022), doi: 10.1101/2022.06.13.495703. [DOI] [PMC free article] [PubMed] [Google Scholar]
- 30.Agresti A., A Survey of Exact Inference for Contingency Tables. Stat. Sci. 7, 131–153 (1992). [Google Scholar]
- 31.Benjamini Y., Hochberg Y., Controlling the False Discovery Rate: A Practical and Powerful Approach to Multiple Testing. Journal of the Royal Statistical Society. Series B (Methodological). 57, 289–300 (1995). [Google Scholar]
- 32.Benjamini Y., Yekutieli D., The control of the false discovery rate in multiple testing under dependency. Ann. Statist. 29, 1165–1188 (2001). [Google Scholar]
- 33.Buen Abad Najar C. F., Yosef N., Lareau L. F., Coverage-dependent bias creates the appearance of binary splicing in single cells. BioRxiv (2019), doi: 10.1101/2019.12.19.883256. [DOI] [PMC free article] [PubMed] [Google Scholar]
- 34.Huang Y., Sanguinetti G., BRIE2: computational identification of splicing phenotypes from single-cell transcriptomic experiments. Genome Biol. 22, 251 (2021). [DOI] [PMC free article] [PubMed] [Google Scholar]
- 35.Travaglini K. J., Nabhan A. N., Penland L., Sinha R., Gillich A., Sit R. V., Chang S., Conley S. D., Mori Y., Seita J., Berry G. J., Shrager J. B., Metzger R. J., Kuo C. S., Neff N., Weissman I. L., Quake S. R., Krasnow M. A., A molecular cell atlas of the human lung from single-cell RNA sequencing. Nature. 587, 619–625 (2020). [DOI] [PMC free article] [PubMed] [Google Scholar]
- 36.Olivieri J. E., Dehghannasiri R., Wang P. L., Jang S., de Morree A., Tan S. Y., Ming J., Ruohao Wu A., Tabula Sapiens Consortium S. R. Quake, M. A. Krasnow, J. Salzman, RNA splicing programs define tissue compartments and cell types at single-cell resolution. eLife. 10 (2021), doi: 10.7554/eLife.70692. [DOI] [PMC free article] [PubMed] [Google Scholar]
- 37.Benegas G., Fischer J., Song Y. S., Robust and annotation-free analysis of alternative splicing across diverse cell types in mice. eLife. 11 (2022), doi: 10.7554/eLife.73520. [DOI] [PMC free article] [PubMed] [Google Scholar]
- 38.Kalvari I., Nawrocki E. P., Argasinska J., Quinones-Olvera N., Finn R. D., Bateman A., Petrov A. I., Non-Coding RNA Analysis Using the Rfam Database. Curr. Protoc. Bioinformatics. 62, e51 (2018). [DOI] [PMC free article] [PubMed] [Google Scholar]
- 39.Kalvari I., Nawrocki E. P., Ontiveros-Palacios N., Argasinska J., Lamkiewicz K., Marz M., Griffiths-Jones S., Toffano-Nioche C., Gautheret D., Weinberg Z., Rivas E., Eddy S. R., Finn R. D., Bateman A., Petrov A. I., Rfam 14: expanded coverage of metagenomic, viral and microRNA families. Nucleic Acids Res. 49, D192–D200 (2021). [DOI] [PMC free article] [PubMed] [Google Scholar]
- 40.Hayashizaki K., Kimura M. Y., Tokoyoda K., Hosokawa H., Shinoda K., Hirahara K., Ichikawa T., Onodera A., Hanazawa A., Iwamura C., Kakuta J., Muramoto K., Motohashi S., Tumes D. J., Iinuma T., Yamamoto H., Ikehara Y., Okamoto Y., Nakayama T., Myosin light chains 9 and 12 are functional ligands for CD69 that regulate airway inflammation. Sci. Immunol. 1, eaaf9154 (2016). [DOI] [PubMed] [Google Scholar]
- 41.Vedula P., Kurosaka S., Leu N. A., Wolf Y. I., Shabalina S. A., Wang J., Sterling S., Dong D. W., Kashina A., Diverse functions of homologous actin isoforms are defined by their nucleotide, rather than their amino acid sequence. eLife. 6 (2017), doi: 10.7554/eLife.31661. [DOI] [PMC free article] [PubMed] [Google Scholar]
- 42.Perrin B. J., Ervasti J. M., The actin gene family: function follows isoform. Cytoskeleton (Hoboken). 67, 630–634 (2010). [DOI] [PMC free article] [PubMed] [Google Scholar]
- 43.Niu X., Hong J., Zheng X., Melville D. B., Knapik E. W., Meng A., Peng J., The nuclear pore complex function of Sec13 protein is required for cell survival during retinal development. J. Biol. Chem. 289, 11971–11985 (2014). [DOI] [PMC free article] [PubMed] [Google Scholar]
- 44.Liu Z., Yan M., Lei W., Jiang R., Dai W., Chen J., Wang C., Li L., Wu M., Nian X., Li D., Sun D., Lv X., Wang C., Xie C., Yao L., Wu C., Hu J., Xiao N., Mo W., Zhang L., Sec13 promotes oligodendrocyte differentiation and myelin repair through autocrine pleiotrophin signaling. J. Clin. Invest. 132 (2022), doi: 10.1172/JCI155096. [DOI] [PMC free article] [PubMed] [Google Scholar]
- 45.Hubé F., Francastel C., Mammalian introns: when the junk generates molecular diversity. Int. J. Mol. Sci. 16, 4429–4452 (2015). [DOI] [PMC free article] [PubMed] [Google Scholar]
- 46.Kaufman J., Unfinished business: evolution of the MHC and the adaptive immune system of jawed vertebrates. Annu. Rev. Immunol. 36, 383–409 (2018). [DOI] [PubMed] [Google Scholar]
- 47.Luo Y., Kanai M., Choi W., Li X., Sakaue S., Yamamoto K., Ogawa K., Gutierrez-Arcelus M., Gregersen P. K., Stuart P. E., Elder J. T., Forer L., Schönherr S., Fuchsberger C., Smith A. V., Fellay J., Carrington M., Haas D. W., Guo X., Palmer N. D., Raychaudhuri S., A high-resolution HLA reference panel capturing global population diversity enables multi-ancestry fine-mapping in HIV host response. Nat. Genet. 53, 1504–1516 (2021). [DOI] [PMC free article] [PubMed] [Google Scholar]
- 48.Naito T., Suzuki K., Hirata J., Kamatani Y., Matsuda K., Toda T., Okada Y., A deep learning method for HLA imputation and trans-ethnic MHC fine-mapping of type 1 diabetes. Nat. Commun. 12, 1639 (2021). [DOI] [PMC free article] [PubMed] [Google Scholar]
- 49.Fairfax B. P., Makino S., Radhakrishnan J., Plant K., Leslie S., Dilthey A., Ellis P., Langford C., Vannberg F. O., Knight J. C., Genetics of gene expression in primary immune cells identifies cell type-specific master regulators and roles of HLA alleles. Nat. Genet. 44, 502–510 (2012). [DOI] [PMC free article] [PubMed] [Google Scholar]
- 50.Kovats S., Main E. K., Librach C., Stubblebine M., Fisher S. J., DeMars R., A class I antigen, HLA-G, expressed in human trophoblasts. Science. 248, 220–223 (1990). [DOI] [PubMed] [Google Scholar]
- 51.Barcellos L. F., Sawcer S., Ramsay P. P., Baranzini S. E., Thomson G., Briggs F., Cree B. C. A., Begovich A. B., Villoslada P., Montalban X., Uccelli A., Savettieri G., Lincoln R. R., DeLoa C., Haines J. L., Pericak-Vance M. A., Compston A., Hauser S. L., Oksenberg J. R., Heterogeneity at the HLA-DRB1 locus and risk for multiple sclerosis. Hum. Mol. Genet. 15, 2813–2824 (2006). [DOI] [PubMed] [Google Scholar]
- 52.Gutierrez-Arcelus M., Baglaenko Y., Arora J., Hannes S., Luo Y., Amariuta T., Teslovich N., Rao D. A., Ermann J., Jonsson A. H., NHLBI Trans-Omics for Precision Medicine (TOPMed) Consortium, Navarrete C., Rich S. S., Taylor K. D., Rotter J. I., Gregersen P. K., Esko T., Brenner M. B., Raychaudhuri S., Allele-specific expression changes dynamically during T cell activation in HLA and other autoimmune loci. Nat. Genet. 52, 247–253 (2020). [DOI] [PMC free article] [PubMed] [Google Scholar]
- 53.Unanue E. R., Turk V., Neefjes J., Variations in MHC class II antigen processing and presentation in health and disease. Annu. Rev. Immunol. 34, 265–297 (2016). [DOI] [PubMed] [Google Scholar]
- 54.Senju S., Kimura A., Yasunami M., Kamikawaji N., Yoshizumi H., Nishimura Y., Sasazuki T., Allele-specific expression of the cytoplasmic exon of HLA-DQB1 gene. Immunogenetics. 36, 319–325 (1992). [DOI] [PubMed] [Google Scholar]
- 55.Buen Abad Najar C. F., Burra P., Yosef N., Lareau L. F., Identifying cell-state associated alternative splicing events and their co-regulation. BioRxiv (2021), doi: 10.1101/2021.07.23.453605. [DOI] [PMC free article] [PubMed] [Google Scholar]
- 56.Briney B., Inderbitzin A., Joyce C., Burton D. R., Commonality despite exceptional diversity in the baseline human antibody repertoire. Nature. 566, 393–397 (2019). [DOI] [PMC free article] [PubMed] [Google Scholar]
- 57.Lindeman I., Emerton G., Mamanova L., Snir O., Polanski K., Qiao S.-W., Sollid L. M., Teichmann S. A., Stubbington M. J. T., BraCeR: B-cell-receptor reconstruction and clonality inference from single-cell RNA-seq. Nat. Methods. 15, 563–565 (2018). [DOI] [PubMed] [Google Scholar]
- 58.Canzar S., Neu K. E., Tang Q., Wilson P. C., Khan A. A., BASIC: BCR assembly from single cells. Bioinformatics. 33, 425–427 (2017). [DOI] [PMC free article] [PubMed] [Google Scholar]
- 59.Tabula Sapiens Consortium*, Jones R. C., Karkanias J., Krasnow M. A., Pisco A. O., Quake S. R., Salzman J., Yosef N., Bulthaup B., Brown P., Harper W., Hemenez M., Ponnusamy R., Salehi A., Sanagavarapu B. A., Spallino E., Aaron K. A., Concepcion W., Gardner J. M., Kelly B., et al. , The Tabula Sapiens: A multiple-organ, single-cell transcriptomic atlas of humans. Science. 376, eabl4896 (2022). [DOI] [PMC free article] [PubMed] [Google Scholar]
- 60.Criscitiello M. F., Unusual T cell receptor in opossum. Science. 371, 1308–1309 (2021). [DOI] [PubMed] [Google Scholar]
- 61.Kiepiela P., Leslie A. J., Honeyborne I., Ramduth D., Thobakgale C., Chetty S., Rathnavalu P., Moore C., Pfafferott K. J., Hilton L., Zimbwa P., Moore S., Allen T., Brander C., Addo M. M., Altfeld M., James I., Mallal S., Bunce M., Barber L. D., Goulder P. J. R., Dominant influence of HLA-B in mediating the potential co-evolution of HIV and HLA. Nature. 432, 769–775 (2004). [DOI] [PubMed] [Google Scholar]
- 62.Elahi S., Dinges W. L., Lejarcegui N., Laing K. J., Collier A. C., Koelle D. M., McElrath M. J., Horton H., Protective HIV-specific CD8+ T cells evade Treg cell suppression. Nat. Med. 17, 989–995 (2011). [DOI] [PMC free article] [PubMed] [Google Scholar]
- 63.Francis J. M., Leistritz-Edwards D., Dunn A., Tarr C., Lehman J., Dempsey C., Hamel A., Rayon V., Liu G., Wang Y., Wille M., Durkin M., Hadley K., Sheena A., Roscoe B., Ng M., Rockwell G., Manto M., Gienger E., Nickerson J., Pregibon D. C., Allelic variation in class I HLA determines CD8+ T cell repertoire shape and cross-reactive memory responses to SARS-CoV-2. Sci. Immunol. 7, eabk3070 (2022). [DOI] [PMC free article] [PubMed] [Google Scholar]
- 64.Ashburner M., Ball C. A., Blake J. A., Botstein D., Butler H., Cherry J. M., Davis A. P., Dolinski K., Dwight S. S., Eppig J. T., Harris M. A., Hill D. P., Issel-Tarver L., Kasarskis A., Lewis S., Matese J. C., Richardson J. E., Ringwald M., Rubin G. M., Sherlock G., Gene Ontology: tool for the unification of biology. Nat. Genet. 25, 25–29 (2000). [DOI] [PMC free article] [PubMed] [Google Scholar]
- 65.The Gene Ontology Consortium, The Gene Ontology resource: enriching a GOld mine. Nucleic Acids Res. 49, D325–D334 (2021). [DOI] [PMC free article] [PubMed] [Google Scholar]
- 66.Mistry J., Chuguransky S., Williams L., Qureshi M., Salazar G. A., Sonnhammer E. L. L., Tosatto S. C. E., Paladin L., Raj S., Richardson L. J., Finn R. D., Bateman A., Pfam: The protein families database in 2021. Nucleic Acids Res. 49, D412–D419 (2021). [DOI] [PMC free article] [PubMed] [Google Scholar]
- 67.The Tabula Microcebus Consortium, Ezran C., Liu S., Chang S., Ming J., Botvinnik O., Penland L., Tarashansky A., de Morree A., Travaglini K. J., Hasegawa K., Sin H., Sit R., Okamoto J., Sinha R., Zhang Y., Karanewsky C. J., Pendleton J. L., Morri M., Perret M., Krasnow M. A., Tabula Microcebus: A transcriptomic cell atlas of mouse lemur, an emerging primate model organism. BioRxiv (2021), doi: 10.1101/2021.12.12.469460. [DOI] [Google Scholar]
- 68.Ezran C., Karanewsky C. J., Pendleton J. L., Sholtz A., Krasnow M. R., Willick J., Razafindrakoto A., Zohdy S., Albertelli M. A., Krasnow M. A., The mouse lemur, a genetic model organism for primate biology, behavior, and health. Genetics. 206, 651–664 (2017). [DOI] [PMC free article] [PubMed] [Google Scholar]
- 69.Groeger A. L., Cipollina C., Cole M. P., Woodcock S. R., Bonacci G., Rudolph T. K., Rudolph V., Freeman B. A., Schopfer F. J., Cyclooxygenase-2 generates anti-inflammatory mediators from omega-3 fatty acids. Nat. Chem. Biol. 6, 433–441 (2010). [DOI] [PMC free article] [PubMed] [Google Scholar]
- 70.Domingo E., Sheldon J., Perales C., Viral quasispecies evolution. Microbiol. Mol. Biol. Rev. 76, 159–216 (2012). [DOI] [PMC free article] [PubMed] [Google Scholar]
- 71.Magazine N., Zhang T., Wu Y., McGee M. C., Veggiani G., Huang W., Mutations and Evolution of the SARS-CoV-2 Spike Protein. Viruses. 14 (2022), doi: 10.3390/v14030640. [DOI] [PMC free article] [PubMed] [Google Scholar]
- 72.Kumar S., Thambiraja T. S., Karuppanan K., Subramaniam G., Omicron and Delta variant of SARS-CoV-2: A comparative computational study of spike protein. J. Med. Virol. 94, 1641–1649 (2022). [DOI] [PubMed] [Google Scholar]
- 73.Thompson M. G., Dittmar M., Mallory M. J., Bhat P., Ferretti M. B., Fontoura B. M., Cherry S., Lynch K. W., Viral-induced alternative splicing of host genes promotes influenza replication. eLife. 9 (2020), doi: 10.7554/eLife.55500. [DOI] [PMC free article] [PubMed] [Google Scholar]
- 74.Sun X., Whittaker G. R., Role of the actin cytoskeleton during influenza virus internalization into polarized epithelial cells. Cell. Microbiol. 9, 1672–1682 (2007). [DOI] [PubMed] [Google Scholar]
- 75.Kuo S.-M., Chen C.-J., Chang S.-C., Liu T.-J., Chen Y.-H., Huang S.-Y., Shih S.-R., Inhibition of Avian Influenza A Virus Replication in Human Cells by Host Restriction Factor TUFM Is Correlated with Autophagy. MBio. 8 (2017), doi: 10.1128/mBio.00481-17. [DOI] [PMC free article] [PubMed] [Google Scholar]
- 76.Song Y., Feng N., Sanchez-Tacuba L., Yasukawa L. L., Ren L., Silverman R. H., Ding S., Greenberg H. B., Reverse genetics reveals a role of rotavirus VP3 phosphodiesterase activity in inhibiting rnase L signaling and contributing to intestinal viral replication in vivo. J. Virol. 94 (2020), doi: 10.1128/JVI.01952-19. [DOI] [PMC free article] [PubMed] [Google Scholar]
- 77.Gratia M., Sarot E., Vende P., Charpilienne A., Baron C. H., Duarte M., Pyronnet S., Poncet D., Rotavirus NSP3 Is a Translational Surrogate of the Poly(A) Binding Protein-Poly(A) Complex. J. Virol. 89, 8773–8782 (2015). [DOI] [PMC free article] [PubMed] [Google Scholar]
- 78.Salzman J., Jiang H., Wong W. H., Statistical Modeling of RNA-Seq Data. Stat. Sci. 26 (2011), doi: 10.1214/10-STS343. [DOI] [PMC free article] [PubMed] [Google Scholar]
- 79.Diaconis P., Sturmfels B., Algebraic algorithms for sampling from conditional distributions. Ann. Statist. 26 (1998), doi: 10.1214/aos/1030563990. [DOI] [Google Scholar]
- 80.Diaconis P., Efron B., Testing for Independence in a Two-Way Table: New Interpretations of the Chi-Square Statistic. Ann. Statist. 13 (1985), doi: 10.1214/aos/1176349634. [DOI] [Google Scholar]
- 81.Chen Y., Diaconis P., Holmes S. P., Liu J. S., Sequential monte carlo methods for statistical analysis of tables. J. Am. Stat. Assoc. 100, 109–120 (2005). [Google Scholar]
- 82.Diaconis P., Holmes S., in Discrete probability and algorithms, Aldous D., Diaconis P., Spencer J., Steele J. M., Eds. (Springer; New York, New York, NY, 1995), vol. 72 of The IMA volumes in mathematics and its applications, pp. 43–56. [Google Scholar]
- 83.Fisher R. A., On the Interpretation of X2 from Contingency Tables, and the Calculation of P. Journal of the Royal Statistical Society. 85, 87 (1922). [Google Scholar]
- 84.Wainwright M. J., High-Dimensional Statistics: A Non-Asymptotic Viewpoint (Cambridge University Press, 2019). [Google Scholar]
- 85.Shen W., Le S., Li Y., Hu F., SeqKit: A Cross-Platform and Ultrafast Toolkit for FASTA/Q File Manipulation. PLoS ONE. 11, e0163962 (2016). [DOI] [PMC free article] [PubMed] [Google Scholar]
- 86.Johnson L. S., Eddy S. R., Portugaly E., Hidden Markov model speed heuristic and iterative HMM search procedure. BMC Bioinformatics. 11, 431 (2010). [DOI] [PMC free article] [PubMed] [Google Scholar]
- 87.Hunter J. D., Matplotlib: A 2D Graphics Environment. Comput. Sci. Eng. 9, 90–95 (2007). [Google Scholar]
- 88.Kluyver T., Ragan-Kelley B., Pérez F., Granger B. E., Bussonnier M., Frederic J., Kelley K., Hamrick J. B., Grout J., Corlay S., Others, Jupyter Notebooks-a publishing format for reproducible computational workflows. (2016), vol. 2016. [Google Scholar]
Associated Data
This section collects any data citations, data availability statements, or supplementary materials included in this article.
Data Availability Statement
The code used in this work is available at https://github.com/kaitlinchaung/nomad. The human lung scRNA-seq data used here is accessible through the European Genome-phenome Archive (accession number: EGAS00001004344). The fastq files for the Tabula Sapiens data (both 10X Chromium and Smart-seq2) were downloaded from https://tabula-sapiens-portal.ds.czbiohub.org/. B cells were used from pilot 1 and T cells from individual 2. The mouse lemur single-cell RNA-seq data used in this study was generated as part of the Tabula Microcebus consortium. Analysis of each set of cells, B and natural killer T cells, were performed on two individuals together and the fastq files were downloaded from: https://tabula-microcebus.ds.czbiohub.org. The sample sheets used as inputs to nextflow for all analysis are uploaded to the github site. Viral data was downloaded from the NCBI: Influenza (SRP294571), SARS-CoV-2 (SRP365288), and rotavirus (PRJNA729919).


