Abstract
New four-groups-based azo/ester/Schiff base liquid crystals, ((4-substitutedphenylimino)methyl)phenyl 4-[2-(4-alkoxyhenyl)diazenyl]benzoate, Ina–d, were synthesized and analyzed for their mesomorphic stability and optical activity. In these compounds, a terminal alkoxy group of variable chain length from n = 6 to n = 16 carbons is attached to the end of a phenylazo benzoate moiety and the other end of the molecules is connected to a different polar compact substituent X (CH3O, CH3, H, and Cl). FT-IR, 1H NMR, mass spectroscopy and elemental analysis were carried out for molecular structure confirmation of the prepared compounds. The mesomorphic properties were confirmed using a combination of differential scanning calorimetry (DSC) and polarized light microscopy (PLM). The photophysical property was studied by UV-vis spectroscopy. All the prepared homologous series exhibited high thermal stability with a wide-temperature mesomorphic range. The thermal and geometrical parameters of the investigated compounds were estimated by density functional theory (DFT). The results revealed that all the compounds were not completely planar with a relatively high twisting moiety at the CH N part and their twist angles were affected by the electronic nature of the attached X group. Moreover, the calculated quantum chemical parameters as determined by the DFT approach of the investigated compounds were related to the experimentally determined values of the mesophase thermal stability (Tc) and mesophase temperature ranges (ΔTSmA and ΔTN) as well as the type of the mesophase.
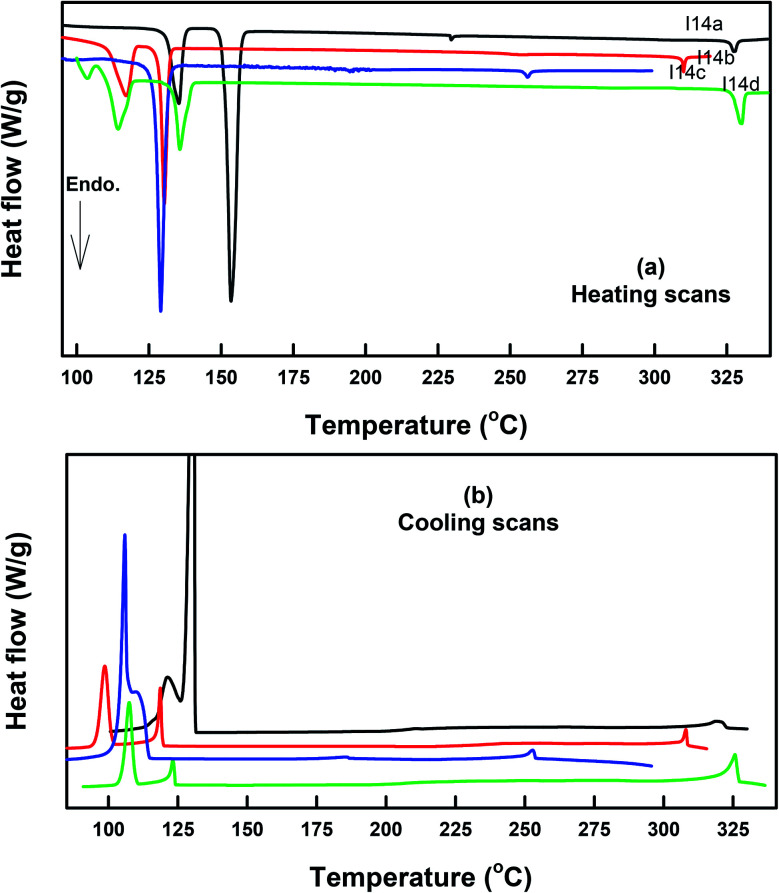
DSC thermograms of some prepared compounds: (a) recorded from second heating and (b) from cooling at a rate of ±10 °C min−1.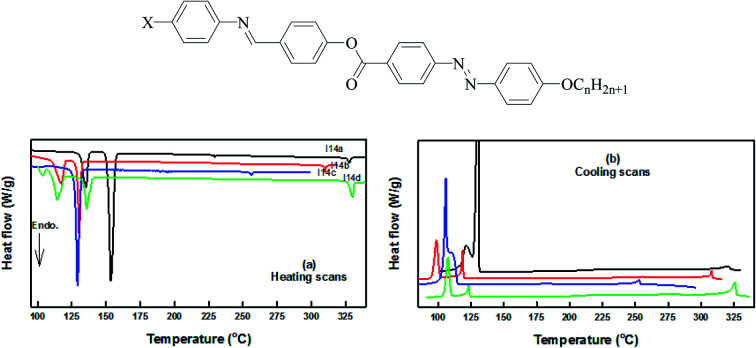
1. Introduction
Achievement of the proper characteristics for new device applications requires structure–activity relationship tools to design suitable materials.1–4 Optical devices and temperature/humidity sensors are important applications in the field of liquid crystal (LC) instrumentation.5–9 Thus, liquid-crystal molecular structures are constructed based on the factors and principles of anisotropic mesogenic shapes. To understand the relationship between the molecular geometry of mesogens and their mesomorphic properties, many Schiff base/ester liquid crystals based on two or three ring compounds have been investigated and their optical behaviors studied.10–14 Moreover, low molar mass liquid crystal compounds comprising just a single mesogenic unit1,15–17 exhibit behavior significantly different from molecules having two or more mesogenic groups.14,18–21 Thus, the addition of new mesogens or aromatic rings as well as different terminal substituents (compact group or alkoxy/alkyl chains) will impact the molecular geometry and offer wide thermal stability ranges of the designed materials.22 Further, slight changes in the molecular architecture can lead to considerable changes in the mesomorphic transitions and play an important role in the formation, type, and stability of the observed mesophase.14,18–20,23–28 Recently, the design of molecular deformation architectures that influence the mesophase formation have been studied,29–32e.g., lattices with free space, fibers in the twist-bend nematic phase,33,34 and oligomers.1,35–37 Many of these studies have involved an investigation of the impact of the terminal groups on the phase-transition temperatures.38 Also, the incorporation of –CH N– linkages to rigid phenyl rings provides a stepped core shape and helps retain the linearity of the molecular structure. Thus, this can enhance the stability of the formed mesophases.39 Azo group (–N N–) linkages can lead to marked changes in the photophysical and photochemical properties of such prepared materials. Consequently, in designing new thermotropic LCs with a mesogenic core, the terminal groups and a flexible chain are the essential specifications.40 To ensure the molecules have structural linearity and a large molecular polarizability a para-substituted phenyl ring is typically used.41 Moreover, the use of theoretical calculations to estimate the thermal and geometrical parameters for predicting the molecular geometry and correlating the calculated data with experiment values is one of our interests.19,20,42–51 Because of their interesting properties and the considerable temperature range of azo/ester LCs, several compounds bearing different terminal groups have been prepared and their mesomorphic properties studied.25–28 Substituents with different polarities residing at both terminals along the molecular axis of a mesogenic compound have been known to either promote or suppress their mesophase thermal transitions. The high dipole moment due to the attachment of polar substituents improves the stability of the lattice. The introduction of a Schiff base mesogenic core in the three rings azo/ester system plays an important role in the mesomorphic behavior. The alteration of the molecular polarizability and the resultant magnitudes of the anisotropic forces of attractions could lead to an enhancement of the thermal stability of the mesophase. The careful selection of the molecular geometry of prepared compounds to modify their mesomorphic behavior is one of our interests.14,19,20
The present work was focused on the synthesis of a new series of four-ring liquid-crystalline compounds, Ina–d, and an investigation of their thermal, mesomorphic, and optical behaviors. Such investigations included the effect of the terminal alkoxy chain length (n = 6 to 16 carbons) and the polarity of the small compact substituent (X = OCH3, CH3H, and Cl) on the thermal stability of the mesophase transitions and type. Moreover, a comparison between the present four-ring compounds and previously prepared three-ring system, IIna–d, was made and is discussed herein. Further, several theoretical parameters were estimated from density functional theory (DFT) calculations for the prepared compounds and the results correlated with the experimental results.
Ina, X = CH3O; Inb, X = CH3; Inc, X = H and, Ind; X = Cl, n = 6, 8, 10, 12, 14, and 16.
2. Experimental
2.1. Preparation of Ina–d
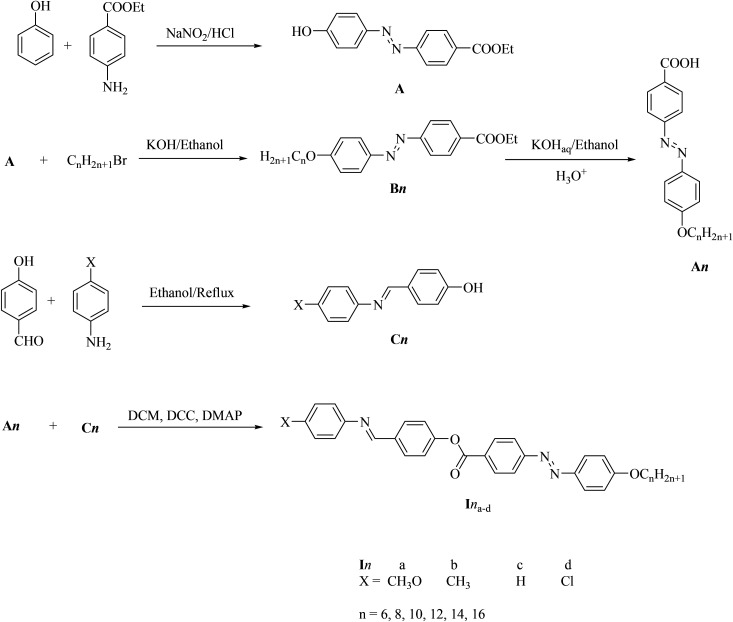
The Ina–d compounds were prepared according to Scheme 1.
Scheme 1. Synthesis of (4-substituted phenylimino)methyl)phenyl 4-[2-(4-alkoxyphenyl)diazenyl]benzoate, Ina–d.
2.2. Preparation of ((4-substitutedphenylimino)methyl)phenyl 4-[2-(4-alkoxyphenyl)diazenyl]benzoate, Ina–d
Molar equivalents of 4-[2-(4-methoxyphenyl)diazenyl]benzoic acid (An) and (4-substitutedphenylimino)methyl)phenol (Cn) (0.01 mol each) were dissolved in 25 ml dry methylene chloride (DCM). To the resulting mixture, N,N′-dicyclohexylcarbodiimide, DCC, (0.02 mol) and a few crystals of 4-(dimethylamino) pyridine (DMAP), as a catalyst, were added and the solution left to stand for 72 h at room temperature with continuous stirring. The solid separated was then filtered off and the solution evaporated. The solid residue obtained was recrystallized twice from acetic acid and twice from ethanol. The purity of the prepared samples was checked with TLC using TLC sheets coated with silica gel (E Merck), and CH2Cl2/CHOH (9 : 1) as the eluent, whereby only one spot was detected by a UV-lamp.
2.3. (4-Methoxyphenylimino)methyl)phenyl 4-[2-(4-dodecyloxyphenyl)diazenyl]benzoate, I12a
Yield: 93.7%; mp 155.0 °C, FTIR ( , cm−1): 2927, 2857 (CH2 stretching), 1733 (C O), 1596 (C N), 1468 (C–OAsym), 1255 (C–OSym).1HNMR (300 MHz, CDCl3):δ = 0.90 (t, 3H, CH3(CH2)9CH2CH2, J = 5.1 Hz), 1.29–1.55 (m, 12H, CH3(CH2)9CH2CH2), 1.84 (q, 2H, J = 7.0 Hz, CH3(CH2)9CH2CH2), 4.08 (t, 2H, CH3(CH2)9CH2CH2, J = 6.1 Hz), 6.94 (d, 2H, J = 8.7 Hz, Ar–H), 7.02 (d, 2H, J = 9.0 Hz, Ar–H), 7.25–7.26 (m, 2H, Ar–H), 7.37 (d, 2H, J = 8.4 Hz, Ar–H), 7.96–8.01 (m, 4H, Ar–H), 8.34 (d, 2H, J = 8.8 Hz, Ar–H), 8.52 (s, 1H, CH N). Elemental analyses: found (Calc.): C, 75.55 (75.58); H, 7.29 (7.32); N, 6.76 (6.78).
2.4. (4-Methylphenylimino)methyl)phenyl 4-[2-(4-dodecyloxyphenyl)diazenyl]benzoate, I12b
Yield: 94.0%; mp 155.0 °C, FTIR ( , cm−1): 2932, 2863 (CH2 stretching), 1735 (C O), 1600 (C N), 1486 (C–OAsym), 1248 (C–OSym). 1HNMR (300 MHz, CDCl3):δ = 0.90 (t, 3H, CH3(CH2)9CH2CH2, J = 6.6 Hz), 1.29–1.56 (m, 12H, CH3(CH2)9CH2CH2), 1.85 (q, 2H, J = 6.6 Hz, CH3(CH2)9CH2CH2), 2.40 (s, 3H, CH3), 4.08 (t, 2H, CH3(CH2)9CH2CH2, J = 6.6 Hz), 7.03 (d, 2H, J = 9.0 Hz, Ar–H), 7.15 (d, 2H, J = 8.1 Hz, Ar–H), 7.21–7.27 (m, 4H, Ar–H), 7.37 (d, 2H, J = 8.6 Hz, Ar–H), 7.97–8.02 (m, 4H, Ar–H), 8.34 (d, 2H, J = 8.4 Hz, Ar–H), 8.50 (s, 1H, CH N). 13C NMR (101 MHz, CDCl3) δ 170.87, 158.23, 154.78, 148.45, 135.89, 131.20, 129.9, 129.72, 125.26, 122.50, 122.07, 120.75, 119.50, 114.78, 68.41, 31.85, 29.53, 29.30, 29.10, 25.94, 22.62, 20.96, 14.10. Elemental analyses: found (Calc.): C, 77.56 (77.58); H, 7.49 (7.51); N, 6.95 (6.96).
2.5. Phenyliminomethyl)phenyl 4-[2-(4-dodecyloxyphenyl)diazenyl]benzoate, I12c
Yield: 91.0%; mp 129.0 °C, FTIR ( , cm−1): 2927, 2861 (CH2 stretching), 1733 (C O), 1595 (C N), 1457 (C–OAsym), 1256 (C–OSym). 1HNMR (300 MHz, CDCl3):δ = 0.90 (t, 3H, CH3(CH2)9CH2CH2, J = 5.1 Hz), 1.29–1.55 (m, 12H, CH3(CH2)9CH2CH2), 1.89 (q, 2H, J = 7.2 Hz, CH3(CH2)9CH2CH2), 3.86 (s, 3H, OCH3), 4.08 (t, 2H, CH3(CH2)9CH2CH2, J = 6.0 Hz), 7.03 (d, 2H, J = 9.0 Hz, Ar–H), 7.17 (d, 2H, J = 8.6 Hz, Ar–H), 7.37–7.41 (m, 4H, Ar–H), 7.97–8.01 (m, 4H, Ar–H), 8.34 (d, 2H, J = 8.6 Hz, Ar–H), 8.47 (s, 1H, CH N). 13C NMR (101 MHz, CDCl3) δ 170.89, 162.23, 154.12, 153.81, 146.71, 138.08, 127.58, 125.07, 122.63, 119.45, 114.75, 68.40, 32.30, 31.88, 30.73, 29.62, 29.55, 29.34, 26.20, 25.96, 25.30, 25.20, 24.47, 22.65, 14.10. Elemental analyses: found (Calc.): C, 77.37 (77.39); H, 7.32 (7.35); N, 7.10 (7.12).
2.6. (4-Chlorophenylimino)methyl)phenyl 4-[2-(4-dodecyloxyphenyl)diazenyl]benzoate, I12d
Yield: 94.0%; mp 140.0 °C, FTIR ( , cm1): 2928, 2862 (CH2 stretching), 1733 (C O), 1594 (C N), 1471 (C–OAsym), 1251 (C–OSym). 1HNMR (300 MHz, CDCl3):δ = 0.90 (t, 3H, CH3(CH2)9CH2CH2, J = 5.1 Hz), 1.29–1.55 (m, 12H, CH3(CH2)9CH2CH2), 1.89 (q, 2H, J = 7.2 Hz, CH3(CH2)9CH2CH2), 3.86 (s, 3H, OCH3), 4.08 (t, 2H, CH3(CH2)9CH2CH2, J = 6.0 Hz), 7.03 (d, 2H, J = 9.0 Hz, Ar–H), 7.17 (d, 2H, J = 8.6 Hz, Ar–H), 7.37–7.41 (m, 4H, Ar–H), 7.97–8.01 (m, 4H, Ar–H), 8.34 (d, 2H, J = 8.6 Hz, Ar–H), 8.47 (s, 1H, CH N). 13C NMR (101 MHz, CDCl3) δ 1l70.61, 162.43, 153.45, 152.78, 145.70, 131.84, 131.21, 129.16, 125.32, 122.55, 121.75, 114.81, 68.45, 32.31, 31.89, 29.61, 29.34, 29.13, 26.20, 25.97, 25.30, 25.20, 24.47, 22.67, 14.11. Elemental analyses: found (Calc.): C, 73.10 (73.12); H, 6.77 (6.78); N, 6.70 (6.73); Cl, 5.67 (5.68).
3. Results and discussion
3.1. Molecular structure characterization
The IR spectra, 1H NMR, mass, and elemental analyses for the compounds investigated were consistent with the molecular structures assigned. The analysis data of the investigated compounds are given as supplemental materials (Fig. S1–S4†). The 1H NMR results showed the expected integrated aliphatic to aromatic proton ratios in all the compounds. The FT-IR results showed that the length of the alkoxy chain and polarity of the compact substituent X group did not extensively impact the position of the absorption bands of the main characteristic functional groups. The mass spectra and elemental analyses confirmed the molecular structure and the purity of the materials investigated.
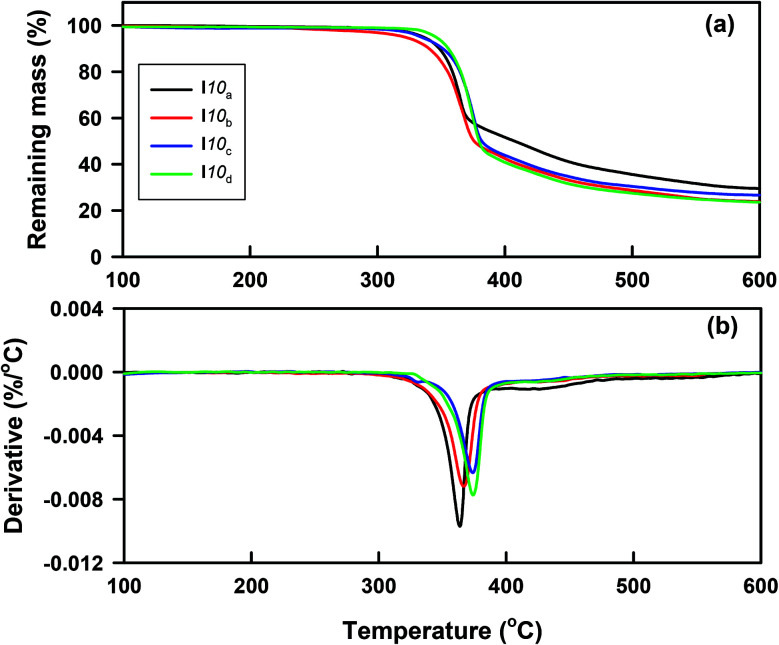
3.2. TG analysis
The thermal stability of all the prepared homologues series Ina–d were studied by thermogravemetric analysis (TG). The typical TG curves and their corresponding derivatives (DTG) of the compounds I10(a–d), as examples, are shown in Fig. 1. The thermal degradation parameters, such as Tonset (the temperature at which the thermal degradation starts), Tmax (the temperature at which the thermal degradation rate is at the maximum), and m% (the mass percentage loss recorded in each stage), are given in Table 1. As can be seen from Fig. 1 and Table 1, the thermal decomposition occurred through two degradation steps with various mass losses, depending on the chemical structure. The first main step occurred in the temperature range 320–395 °C and started at 336 °C, 321 °C, 334 °C, and 346 °C, with maximum degradation rates (Tmax) at 364 °C, 367 °C, 374 °C, and 376 °C for I10a, I10b, I10c, and I10d, respectively; indicating that the thermal stability increased in the following order: I10d > I10a > I10c > I10b. While the second one with a low mass loss took place between 395 °C and 465 °C with the maximum degradation rate almost independent of the substituent X. Additionally, the degradation was not complete up to 600 °C, and the amount of residue left over was found to be between 23% and 29%. Based on the previous studies,52–58 the suggested degradation of azo-based materials occurs through the cleavage of the azo bond by reductive processes. The larger conjugation of the I10d and I10a with Cl and –OCH3 substituents, respectively, through resonance from the delocalization of the non-bonding electron pairs of the substituent and π electrons of the aromatic rings and azo bonds, may enhance the thermal stability. These results revealed that the compounds under investigation possessed a high thermal stability up to 316–341 °C, which covers the temperature window where the mesophase transitions were detected calorimetry, except for the compounds with short alkoxy terminal groups (I6a–b and I8a–b), where the isotropic transition could not observed by DSC and was detected only with PLM.
Fig. 1. TG and DTG curves of the I10a–d group.
Thermal degradation parameters of I10(a–d).
| Compound | Thermal degradation stages | T onset (°C) | T max. (°C) | Residue (%) | Mass (%) |
|---|---|---|---|---|---|
| I10a | I | 336 | 364 | 29.4 | 60 |
| II | 384 | 428 | 21 | ||
| Residue | — | — | 29 | ||
| I10b | I | 321 | 367 | 23.7 | 50 |
| II | 383 | 430 | 26 | ||
| Residue | — | — | 24 | ||
| I10c | I | 334 | 374 | 26.6 | 52 |
| II | 392 | 430 | 21 | ||
| Residue | — | — | 27 | ||
| I10d | I | 346 | 376 | 23.5 | 48 |
| II | 398 | 432 | 29 | ||
| Residue | — | — | 23 |
3.3. Mesophase behavior
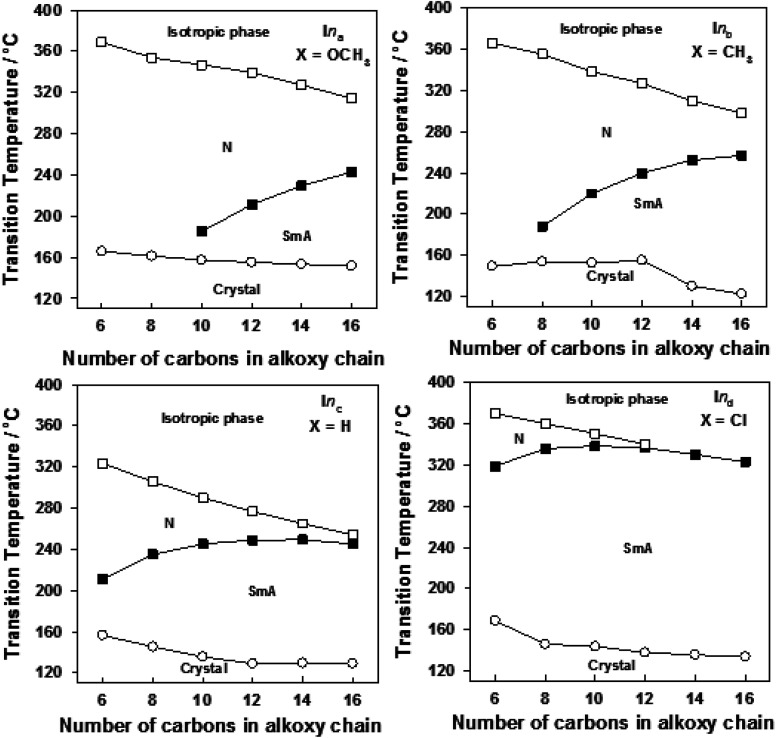
The DSC thermograms of some selected compounds, namely I14a–d, during both heating and cooling scans are shown in Fig. 2. It is clearly shown that upon heating, all the compounds (Fig. 2a) showed three endotherms characteristic of the crystal-SmA, SmA–N, and N-isotropic transitions. While, during the cooling cycle, all the compounds exhibited a nematic and SmA phase, but their transitions were shifted to lower temperatures compared with those observed through the heating cycle. The PLM measurements revealed textures that confirmed the SmA and N mesophases (Fig. 3). The SmA phase showed a focal conic fan texture and N had a threaded/schlieren texture. This indicated that these compounds possessed enantiotropic dimorphic properties. Details of the transition temperatures and the associated enthalpies of all the investigated homologues in the Ina–d series, as derived from DSC measurements, are summarized in Table 2. The transition temperatures of all the investigated derivatives are represented graphically in Fig. 4 in order to evaluate the effect of the terminal alkoxy-chain length on the mesophase behavior in each series having a different terminal compact substituent X.
Fig. 2. DSC thermograms of some representative compounds: (a) recorded from second heating and (b) from cooling at a rate of ±10 °C min−1.
Fig. 3. PLM textures of: (a) the nematic phase of I12b at 240.0 °C upon cooling; (b) smectic A phase of I16d at 299.0 °C upon heating; (c) smectic A phase of I16d at 280.0 °C upon cooling.
Transition temperature (°C), associated (enthalpy of transitions in kJ mol−1), and entropy changes of Ina–da.
| Compounds | T Cr–SmA | T Cr–N | T SmA–N | T SmA–I | T N–I | ΔSSmA–N/R | ΔSSmA–I/R | ΔSN–I/R |
|---|---|---|---|---|---|---|---|---|
| I6a | 165.9(51.31) | 369.0b | — | |||||
| I8a | 161.4(44.67) | 352.0b | ||||||
| I10a | 157.5(50.46) | 185.1(0.33) | 348.0b | 0.087 | ||||
| I12a | 155.4(50.08) | 211.4(0.40) | 339.6(3.60) | 0.098 | 0.707 | |||
| I14a | 153.4(77.32) | 229.6(0.55) | 327.4(3.98) | 0.132 | 0.797 | |||
| I16a | 151.7(47.09) | 242.9(0.64) | 314.4(4.23) | 0.149 | 0.880 | |||
| I6b | 149.3(24.83) | 366.0b | ||||||
| I8b | 153.8(21.95) | 188.1(0.41) | 355.4(1.37) | 0.110 | 0.460 | |||
| I10b | 152.5(35.95) | 220.8(0.59) | 338.3(2.69) | 0.143 | 0.530 | |||
| I12b | 155.1(38.91) | 240.0(0.68) | 327.0(3.39) | 0.160 | 0.680 | |||
| I14b | 130.3(26.31) | 252.3(0.96) | 310.0(3.88) | 0.220 | 0.800 | |||
| I16b | 122.4(62.38) | 257.0(1.10) | 298.1(4.23) | 0.250 | 0.890 | |||
| I6c | 156.5(30.56) | 211.7(0.87) | 323.5(2.88) | 0.220 | 0.580 | |||
| I8c | 145.4(19.21) | 234.9(1.01) | 305.7(2.93) | 0.240 | 0.610 | |||
| I10c | 135.7(44.37) | 245.3(1.64) | 290.1(3.23) | 0.380 | 0.690 | |||
| I12c | 129.0(37.57) | 249.2(1.78) | 276.8(3.38) | 0.410 | 0.740 | |||
| I14c | 129.6(57.78) | 249.3(1.85) | 265.0(3.53) | 0.426 | 0.790 | |||
| I16c | 129.2(59.05) | 245.4(1.94) | 254.3(3.81) | 0.450 | 0.870 | |||
| I6d | 168.7(29.47) | 319.0(0.83) | 370.0b | 0.170 | — | |||
| I8d | 146.1(20.34) | 335.9(1.40) | 360.0b | 0.280 | — | |||
| I10d | 143.8(21.28) | 338.5(2.19) | 350.5(3.01) | 0.430 | 0.580 | |||
| I12d | 137.9(21.98) | 336.6(4.26) | 340.2(3.16) | 0.840 | 0.620 | |||
| I14d | 135.7(22.57) | 330.2(8.09) | 2.950 | |||||
| I16d | 133.9(19.23) | 322.9(8.97) | 3.340 |
Cr–SmA denotes transition from solid to the SmA phase. Cr–N denotes transition from solid to the N phase. SmA–N denotes transition from SmA to the N phase. SmA–I denotes transition from SmA to the isotropic phase. N–I denotes transition from nematic to the isotropic phase.
Values detected by PLM only.
Fig. 4. Effect of the alkoxy-chain length on the mesophase behavior of the individual homologous series of Ina–d.
The data in Table 2 and Fig. 4 revealed that the melting temperatures of (Cr–N/SmA) for the methoxy, unsubstituted, and chloro derivatives slightly declined with increasing the alkoxy chain length from n = 6 up to 16, except for the methyl derivatives, which showed an irregular trend. The melting point increased as the polarizability of the compounds within the same series increased. However, the obtained current trend was not in agreement with this common rule. Additionally, all the members of the homologous series were enantiotropic with a high mesophase thermal stability and broad temperature mesomorphic range. For the electron-donating terminal CH3O group (Ina), their compounds were dimorphic, exhibiting enantiotropic SmA and N phases, except for the short chains n = 6 and n = 8, which were purely nematogenic. The SmA range (ΔTSmA = TSmA − Tcr) increased from 27.6 °C to 91.2 °C with increasing the alkoxy chain length from n = 10 up to 16, while the N phase range (ΔTN = Tiso − TSmA) decreased from 203.1 °C to 71.5 °C as the alkoxy chain length n ascended from 6 to 16. Compounds with the terminal CH3 substituent (Inb) were also found to be dimorphic, possessing SmA and N mesophases, except I6b, which was purely nematogenic. ΔTSmA increased from 34.3 °C to 134.6 °C with increasing n from 8 to 16, while ΔTN was reduced from 167.3 °C to 41.1 °C as n increased from 6 to 16. For X = H (Inc series), all the compounds exhibit dimorphic SmA and N phases, irrespective of the alkoxy chain length, with a relatively low thermal stability compared with the Ina and Inb series. ΔTSmA was enhanced from 54.4 °C to 116.2 °C, while ΔTN was reduced from 112.6 °C to 8.9 °C. The electron-withdrawing Cl derivatives had the highest broad mesomorphic range. Compounds of the Inc series with the electron-withdrawing group Cl possessed an SmA phase, with high thermal stability and a wide range, and N phases for alkoxy chain lengths up to n = 12; then with increasing the length of the terminal alkoxy chain (n = 14 and 16), the phase became purely smectogeic (SmA). ΔTSmA increased from 150.3 °C to 189.0 °C with increasing n from 8 to 16, while ΔTN was reduced from 51.0 °C to 3.6 °C as n increased from 6 to 12. For all the series, irrespective of the polarity of the substituent X, the stability of the nematic phase decreased while the SmA phase increased, as usual, with increasing the terminal alkoxy chain length.59,60 The descending trend in the thermal transition of the N phase could be ascribed to the dilution of the rigid mesogenic core. Nevertheless, the appearance of SmA phase depressed the nematic phase range as the alkoxy chain length increased. This was probably due to increase in the van der Waals attractions forces between the long alkoxy chains, leading to their intertwining and facilitating the lamellar packing, which is of crucial importance for the occurrence of the smectic phase.
Based on the above data, the thermal stability of the N phase (N-isotropic transition), at a given alkoxy chain, declined in the following order: Cl > CH3O > CH3 > H, while the thermal stability of the SmA phase (Tcry–TSmA transition) increased in the order: Cl > CH3 > CH3O > H. The increment of the SmA mesophase range (ΔTSmA) followed the order: Cl > CH3 > CH3O > H and the reduction in the N range (ΔTN) in the order: Cl > CH3O > CH3 > H. In general, the polarity of the substituent groups, polarizability, aspect ratio, rigidity, and architecture of the molecule are considered important factors that are responsible for the stability of the formed mesophases and their textures. These factors contribute to different extents to the mesophase behavior. It was already known that the stability of a mesophase of a given mesomorphic compound is increased by any enhancement in the polarity and/or polarizability of the mesogenic core of the molecule, which is affected by the polarity of the substituent, which would consequently affect the polarity of the whole molecular structure. Also, increasing van der Waals attractions, which increase with increasing the terminal alkoxy group, enhance the stability of the SmA phase by favoring lamellar packing. On the other hand, it suppresses the nematic phase range. These factors that affect the stability of the mesophases and their types are discussed and correlated with the molecular geometries and quantum chemical parameters studied by DFT calculations in the next section.
The entropy change of mesophase transitions (ΔS/R) was estimated for the investigated compounds and the results are included in Table 2. Independent of the terminal alkoxy-chain length of molecules (n), an irregular trend and small magnitudes of the ΔS/R associated with the SmA–N, N-isotropic were observed. However, the obtained small values in all the derivatives might probably be due to the somewhat molecular biaxiality induced by the ester linkage group and the relatively high values of the clearing temperatures, which in turn reduces the SmA–N, N-isotropic entropy changes.61–63 However; the variation and complexity in the entropy change with a compact terminal group X and alkoxy chain length may be attributed to a change in the molecular interactions between molecules, which are affected by the dipole moment, polarizability, rigidity, aspect ratio (length/breadth ratio), and geometrical shape of molecules. These factors may contribute to the conformational, orientational, and translational entropies of the molecule to different extents. Although, the increment of the alkoxy chain length has a dilution effect on core–core interactions, it increases the polarizability of the whole molecule, which increases the intermolecular adhesion forces between adjacent molecules that promote the degree of molecular ordering. The increase in ΔS/R values with increasing the number of carbons in the alkoxy chain is probably due to the disappearance of the long orientational order and the increase in the number of conformational distributions in mesophase transitions.
The terminally substituted polarizable –Cl group leads to an increase in the dipole moment of the molecule, which enhances the lateral interaction and consequently allows the molecules to pack more efficiently in the liquid-crystal phase, resulting in a higher ΔS/R magnitude, which is especially associated with SmA-isotropic transitions, as in the case here with the I14d and I16d derivatives.
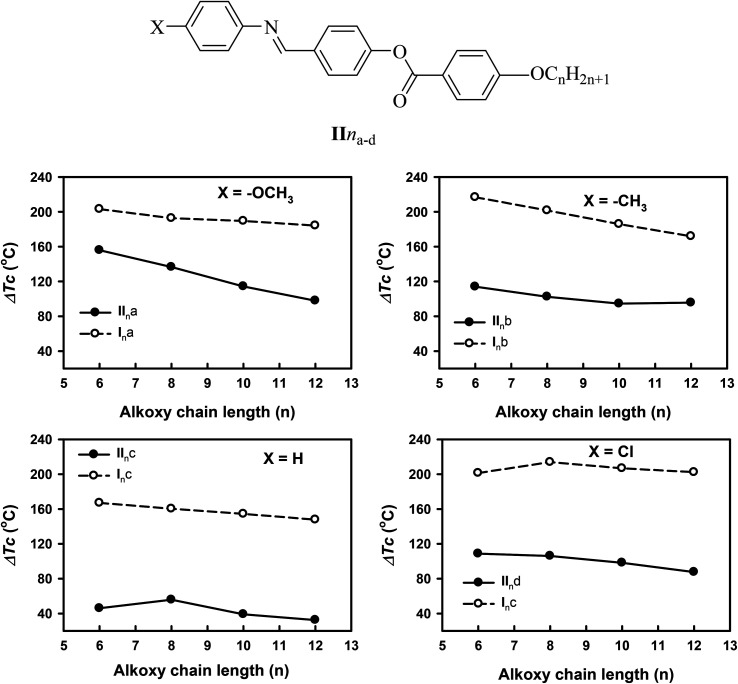
In order to investigate the effect of the addition of an extra phenylazo group moiety into the previously investigated three-ring analogues20 with –COO– and –CH N– connecting units (IIna–d) to give Ina–d20 on the mesophase thermal stability range (ΔTc), a comparison was made with the data reported before20 and the results are illustrated in Fig. 5. As can be seen from Fig. 4, the addition of the extra phenylazo group into the three Schiff base/ester compounds resulted in a great increase in the Tc values and their ranges. The ΔTc values were found to be increased in the range of 101.1–116.5 °C, 116.8–97.1 °C, 46.0–32.5 °C, and 108.7–87.6 °C for methoxy, methyl, unsubstituted, and chloro derivatives. These increment were attributed to the increase in polarizability of the whole molecule as well as the increase in rigidity and the aspect ratio, which in turn lead to an increase in the intermolecular interactions between molecules.
Fig. 5. Comparison of ΔTc of the 4-ring (Ina–d) and 3-ring (IIna–d) analogues.
3.4. DFT calculations and conformational analysis
3.4.1. Thermal parameters and geometrical structure
The theoretical calculations were performed in the gas phase with the DFT/B3LYP method and the basis set 6-31G (d,p). The calculations were carried out for all substituents with 12 carbon atoms alkoxy chain length (I12a–d) and all chain lengths for the chloro derivative (Ind), as examples. The absence of imaginary frequency of the estimated compound is good evidence of the stability of these compounds. The estimated optimum structures are shown in Fig. 6. The calculated quantum chemical parameters are tabulated in Table 3. It could be emphasized from Table 3 and Fig. 6 that not all the compounds were completely planar with a relatively high twisting moiety at the CH N unit. The electronic nature of the polar compact terminal group has a high impact on the twist angle; however, the length of the terminal alkoxy chains almost has no significant effect on the aromatic rings planarity. Our group reported that21,23 the planarity of the mesogenic core of the LC molecules was enhanced by the mesomeric nature of the polar terminal substituent, where the higher donation of electrons by the substituent to the conjugated π-cloud, the greater the enforcement of the system to be planar. This phenomena could explain the lowest twist angle of the methoxy derivative (I12a) of 31.57°. On the other hand, the chloro-substituted derivative (I12d) of the negative inductive effect of the chloro group and its lower donating ability showed the highest twist angle of 39.52° (Table 3).
Fig. 6. Calculated geometrical structures of compounds I12a–d.
Thermal parameters (Hartree/particle) and dipole moment (Debye) of I12a–d and Inda.
| Parameter | I12a | I 12 b | I 12 c | I 6 d | I 8 d | I 10 d | I 12 d | I 14 d | I 16 d | |
|---|---|---|---|---|---|---|---|---|---|---|
| E corr | 0.7671 | 0.7625 | 0.735129 | 0.553804 | 0.610854 | 0.667968 | 0.725161 | 0.782295 | 0.839413 | |
| ZPVE | −1977.50 | −1902.30 | −1863.04 | −2086.95 | −2165.52 | −2244.09 | −2322.65 | −2401.22 | −2479.79 | |
| E tot | −1977.50 | −1902.28 | −1863.00 | −2086.92 | −2165.48 | −2244.05 | −2322.61 | −2401.17 | −2479.74 | |
| H | −1977.50 | −1902.28 | −1863.00 | −2086.92 | −2165.48 | −2244.04 | −2322.61 | −2401.17 | −2479.74 | |
| G | −1977.60 | −1902.42 | −1863.13 | −2087.03 | −2165.60 | 2244.17 | −2322.74 | −2401.31 | −2479.89 | |
| Total dipole moment | 6.93 | 6.85 | 7.21 | 9.42 | 9.47 | 9.50 | 9.51 | 9.52 | 8.67 | |
| Polarizability α | 610.52 | 594.83 | 578.59 | 524.99 | 549.70 | 573.86 | 597.77 | 621.52 | 645.13 | |
| Twist angles | A–B | 31.57 | 37.26 | 38.86 | 39.10 | 39.33 | 39.50 | 39.52 | 39.49 | 39.47 |
| B–C | 12.93 | 2.24 | 7.61 | 1.22 | 1.08 | 2.04 | 2.42 | 2.24 | 2.27 | |
ZPVE: sum of electronic and zero-point energies; Etot: sum of electronic and thermal energies; H: sum of electronic and thermal enthalpies; G: sum of electronic and thermal free energies.
3.4.2. Relationship between the experimental and theoretical variables
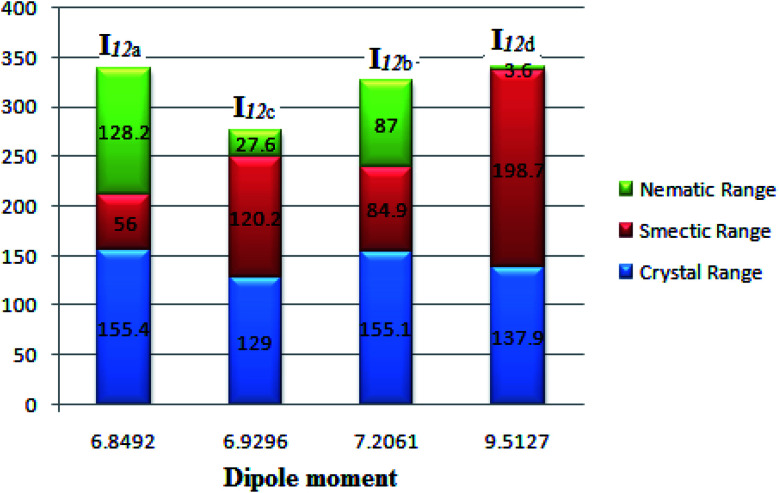
The thermal parameters, dipole moments and polarizability of the investigated compounds (Table 3) related to the experimentally determined values of the mesophase thermal stability (Tc) and mesophase temperature ranges (ΔTSmA and ΔTN) were investigated. As shown in Fig. 7, the estimated polarizability of the investigated homologues series I12a–d had a significant effect on both the mesophase thermal stability as well as the mesophase range. As the polarizability increased, the mesophase stability increased successively. Similarly, the mesophase range of the liquid crystals of the homologues series I12a–d influenced the increment of the polarizability, except for the chloro derivative (I12d), and this result might be explained in the terms of its high dipole moment (9.5127 Debye), whereby the high dipole moment enhances the lateral interaction rather than the terminal attraction of the molecules. This principle also illustrates the highest smectic range and the least nematic one of Cl-derivative compared to the other substituents. On the other hand, the presence of the methoxy group of I12a makes the end–end attraction more pronounced than the lateral interaction, which enhances the nematic more than the smectic mesophase, Fig. 7.
Fig. 7. Relation of the mesophase thermal stability and the mesophase range of the homologues series I12a–d with their calculated polarizability.
Fig. 8 shows the relation of the mesophase thermal stabilities and the mesophases temperature ranges of the homologues series I12a–d with their calculated twist angle between aromatic rings A–B connected with imine group. It can be clearly seen that as the twist angle increases, the chance for packing the molecules decreases, and consequently, there is a decrement in the mesophase stability and its range, except for the chloro derivative (I12d). This result is taken as evidence that the mesophase stability and its range is caused by an accumulation of factors not only one. Moreover, it is obvious that the less planar the molecules, the higher the range of a more ordered smectic phase, and the lower the range of the nematic mesophase. This might be attributed to the competitive interaction between the lateral and the terminal interaction that is affected by the planarity of the molecules.
Fig. 8. Relation of the mesophase stability and the mesophase range of the homologues series I12a–d with their calculated twist angle between rings A–B.
Fig. 9 emphasizes that the dipole moment of the investigated compounds significantly affects the mesophase type, mesophase stability, and its range. As the dipole moment increases, the parallel interaction increases to form a highly ordered smectic mesophase; however, the lower dipole moment enhances the nematic mesophase formation by enforcing the terminal attraction.
Fig. 9. Dependence of the mesophase stability of the homologues series I12a–d with the calculated dipole moment.
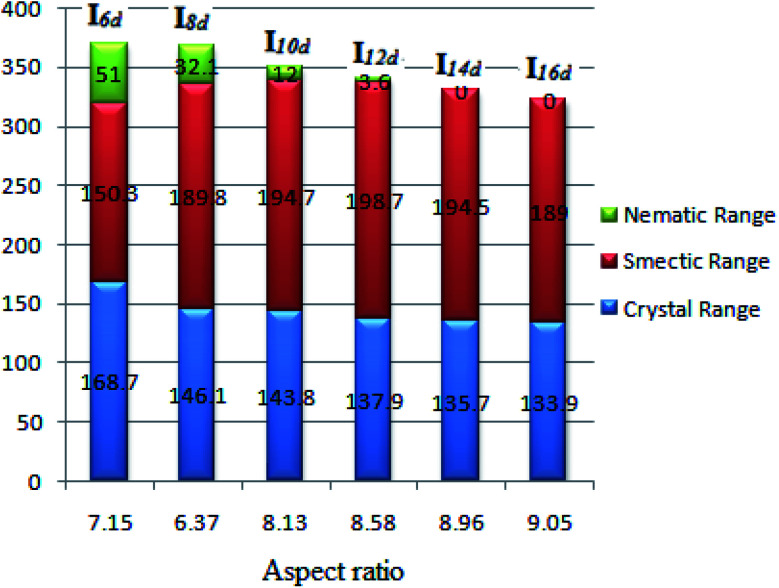
One of the important parameters affecting the liquid-crystal behavior is the aspect ratio (molecular length to the width ratio). This is a structural feature that is relevant in the formation of liquid crystals. The melting of the liquid-crystal material makes the solid diminish because of the increasing molecular fluctuations and rotations, whereby the smectic and nematic phases gain from the retention of positional and orientational ordering due to the lateral and terminal interactions, respectively.20,23,24,42,64–68 The dependence of the mesophase stabilities and their ranges on the calculated aspect ratio (L/D) of Ind is given in Table 4 and represented graphically (Fig. 10). Increasing the aspect ratio leads to a significant increase in the thermal stability of the smectic A and its range up to an alkoxy chain length of n = 12 and then declines while the thermal stability of the nematic phase and its range then decreases. As expected, as the aspect ratio of the molecule increases, the more side–side interactions there are to enhance the smectic mesophase rather than the less ordered nematic phase. However, at an alkoxy chain length longer than 12 carbon atom, the lateral attraction of the chains shows a less pronounced effect to increase the nematic range but not to such a large extent. Moreover, the increment of the alkoxy chains strengthens the end–end interaction with respect to the π–π stacking of the benzene rings.
Predicted dimensions of Ind.
| Compound | Width (D) Å | Length (L) C Å | Aspect ratio (L/D) |
|---|---|---|---|
| I6d | 4.97 | 35.54 | 7.15 |
| I8d | 5.98 | 38.10 | 6.37 |
| I10d | 5.00 | 40.63 | 8.13 |
| I12d | 5.03 | 43.14 | 8.58 |
| I14d | 5.09 | 45.62 | 8.96 |
| I16d | 5.31 | 48.06 | 9.05 |
Fig. 10. Dependence of the mesophase stabilities and their ranges of Ind on the calculated aspect ratio.
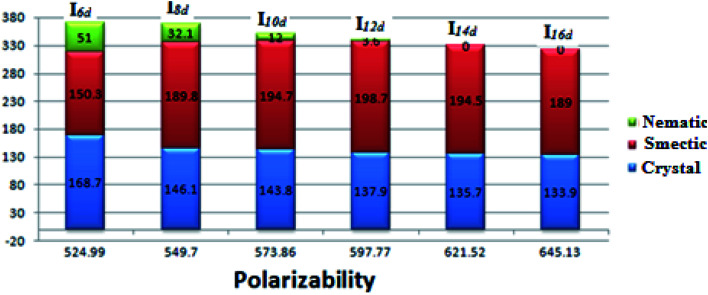
The effect of the polarizability of the alkoxy chain length on the thermal stabilities and their ranges for Ind is shown in Fig. 11. The results reveal that the effect of polarizability on the mesophase stabilities and their ranges follows the same trend as the effect of the aspect ratio. However, the presence of a nematic mesophase (less ordered) with the shorter alkoxy chains and a smectic phase (more ordered) for the longer chain lengths could be explained in the term of the increment of the polarizability with increasing the alkoxy chain length. There is greater lateral interaction aggregation of the alkoxy chains in the ordered smectic phase as the alkoxy chain length increases.
Fig. 11. Dependence of the mesophase stabilities and their ranges of Ind on the polarizability.
3.4.3. Photophysical and Frontier molecular orbitals
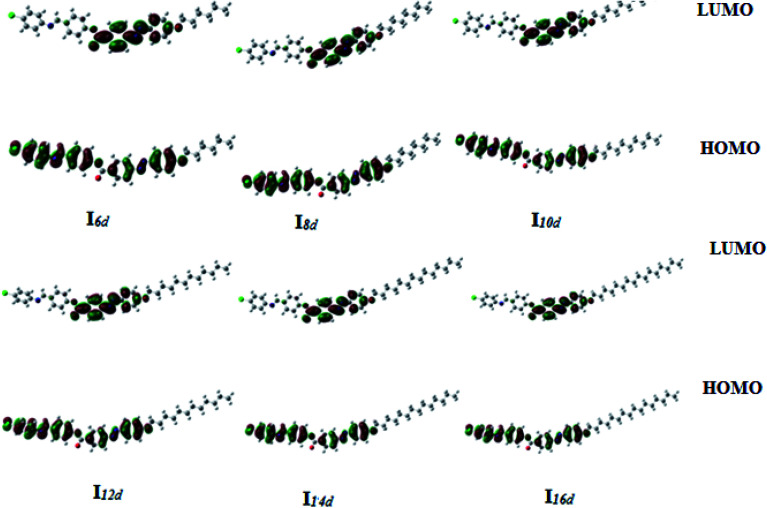
Telecommunications, optical interconnections, and signal processing are all important applications of nonlinear optical (NLO) liquid crystals.69,70 The energy gap between the Frontier molecular orbitals (FMOs), HOMO (highest occupied molecular orbital), and LUMO (lowest unoccupied molecular orbital) is the important parameter affecting these applications. Furthermore, the prediction of the energy difference between FMOs is an indicator of other important variables, such as the chemical hardness (η), global softness (S), and polarizability (α). It is well known that high polarizability is a good characteristic for good NLO compounds, while the polarizability is improved by having a low energy gap of the FMO.71Fig. 12 and 13 show the estimated energy differences and the ground-state isodensity surface plots for the FMOs of I12a–d and Ind. As shown in Table 5, the FMO energy gap and the global softness (S) were impacted by the electronic nature of the terminal substituent. The methoxy derivative, I12a, exhibited the smallest energy gap and this could be explained in terms of the mesomeric effect of the oxygen atom, which allows extra conjugation of the π-cloud, consequently, lowering the energy levels of the FMO. Similarly, the hyperconjugation of the methyl group pulls the level of the FMO to a lower value and decreases the energy gap between them. However, the chloro derivative, I12d, with the same alkoxy chain length showed a higher energy gap 0.12281 a.u. compared to the 0.11912 a.u. of the unsubstituted derivative, I12c. On the other hand, the length of the alkoxy chain had no significant effect on the energy difference between the FMOs. Additionally, the electronic nature of the terminal group rather than the length of the alkoxy chains affect the global softness and the hardness of the molecules, indicating that the conjugated system might be probably affected by the electronic nature of the polar substituent. Also, the donation ability of the terminal substituent increases the global softness as well when the polarizability increases. Consequently, it could be possible to build up compounds with a molecular geometry that gives them characteristics to be better candidates for nonlinear optical applications.
Fig. 12. Calculated ground-state isodensity surface plots for the Frontier molecular orbitals of I12a–d.
Fig. 13. Calculated ground-state isodensity surface plots for the Frontier molecular orbitals of Ind.
Molecular orbital energies, hardness (η), and global softness (S) of I12a–d and Ind.
| Compound | EHOMO (a.u) | ELUMO (a.u) | ΔE(ELUMO − EHOMO) (a.u) | η = ΔE(ELUMO − HOMO)/2 | S = 1/ΔE = (1/2η) |
|---|---|---|---|---|---|
| I12a | −0.20951 | −0.10377 | 0.10574 | 0.05287 | 9.45716 |
| I12b | −0.21870 | −0.10426 | 0.11444 | 0.05722 | 8.73820 |
| I12c | −0.22405 | −0.10493 | 0.11912 | 0.05956 | 8.39490 |
| I6d | −0.23005 | −0.10720 | 0.12285 | 0.06143 | 8.14001 |
| I8d | −0.22998 | −0.10718 | 0.12280 | 0.06140 | 8.14332 |
| I10d | −0.22997 | −0.10716 | 0.12281 | 0.06141 | 8.14266 |
| I12d | −0.22995 | −0.10714 | 0.12281 | 0.06141 | 8.14266 |
| I14d | −0.22995 | −0.10713 | 0.12282 | 0.06141 | 8.14200 |
| I16d | −0.22996 | −0.10712 | 0.12284 | 0.06142 | 8.14067 |
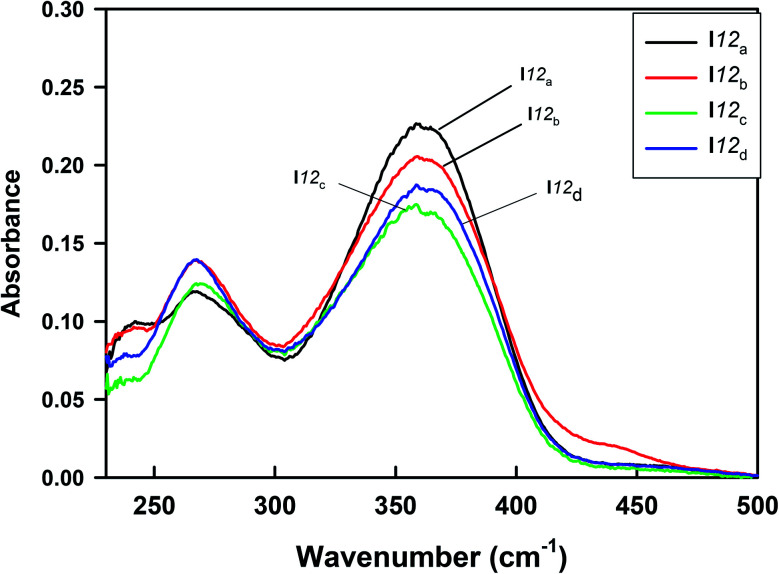
The UV-vis absorption spectra of the homologues series of the I12a–d compounds are shown in Fig. 14, and the data are tabulated in Table 6. As can be seen from Fig. 14, the present compounds with N N, COO, and –N CH– linkages exhibited two absorption bands at 267 nm and ≈364 nm. The more intense peak observed at ≈364 nm may be assigned to π–π* transition in the π-electronic system throughout the whole aromatic rings and connecting units, with a suitable charge-transfer (CT) property,63–65 while the weak absorption band that appeared around 267 nm may be related to n-π* transition of the azobenzene moiety.
Fig. 14. UV-vis absorption spectra of the homologues series of the investigated compounds I12a–d.
λ max (nm) of the homologues series I12a–d.
| Compound | X | Peak 1 | Peak 2 |
|---|---|---|---|
| I12a | CH3O | 267 | 364 |
| I12b | CH3 | 267 | 363 |
| I12c | H | 267 | 361 |
| I12d | Cl | 267 | 363 |
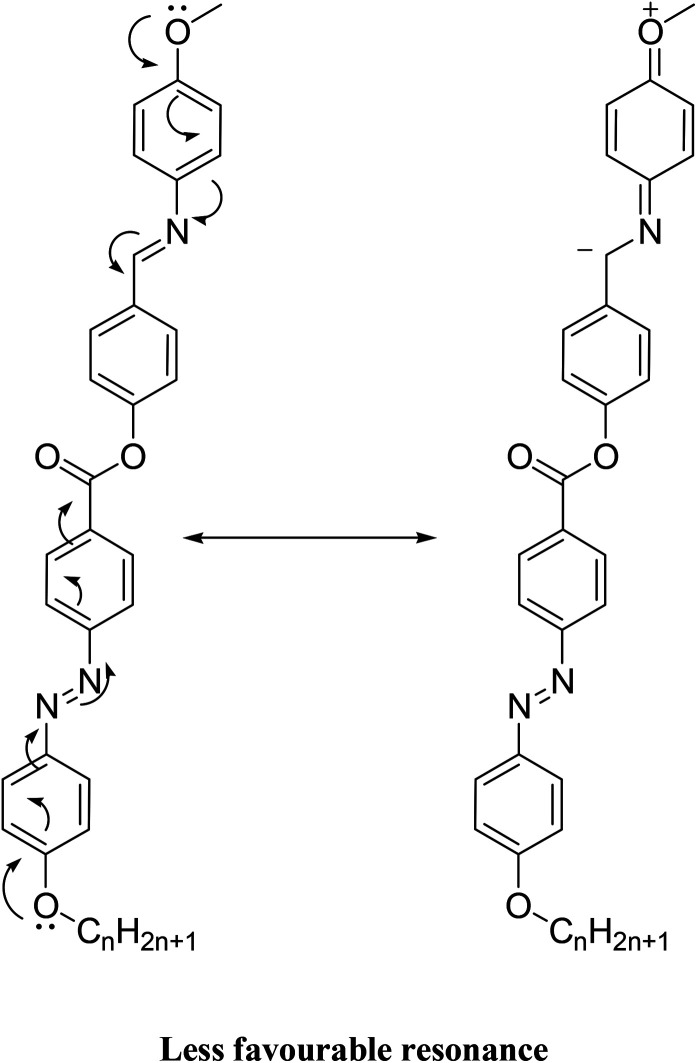
It is noteworthy that there was somewhat of an effect on the absorption peaks position of these compounds under investigation. This result could be explained in terms of the estimated data by DFT calculations, Table 5. The change in the polarity of the terminal substituent X impacted the HOMO–LUMO energy gaps of the molecules, as shown in Fig. 12. Moreover, the terminal methoxy group of I12a had no pronounced effect, as expected, on the energy difference between the Frontier molecular orbitals (FMOs); this could be explained in terms of the resonance effect of the terminal methoxy group of the imino part opposite the alkoxy chain of the azo moiety (Fig. 15).
Fig. 15. Resonating structures of I12a.
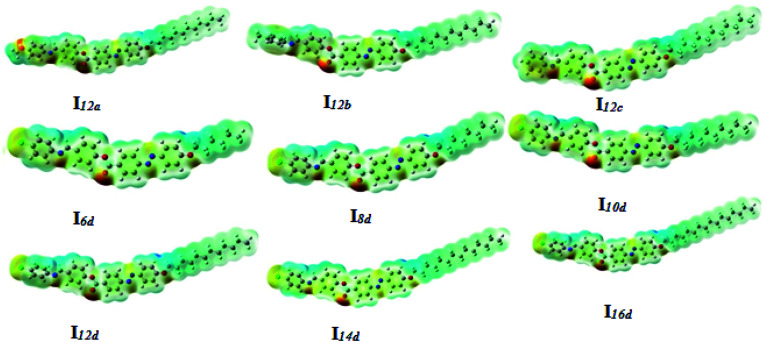
3.4.4. Molecular electrostatic potential
Charge-distribution maps for I12a–d and Ind were calculated under the same basis sets according to the molecular electrostatic potential (MEP) (Fig. 16). The red region (negatively charged atomic sites) was localized on the oxygen atoms and the maximum one was related to the carbonyl oxygen atom of the ester linkage, while the alkyl chains of the terminal alkoxy chains showed the least negatively charged atomic sites (blue regions). As shown in Fig. 16, the electronic nature and the electronegativety of the attached atom of the terminal compact group had a higher impact on the extent and on the orientation of the charge distribution map rather than the length of the alkoxy chain. Recently, we reported the relationship between the theoretical charge distribution and the experimental mesophase type.15,21,72,73 The methoxy (I12a) and the methyl (I12b) derivatives showed the nematic mesophase even for the longest chain lengths, which could be explained in terms of the higher aggregation ability of the terminal groups compared to the side–side parallel interaction. On the other hand, the chloro group increases the dipole moment of the molecule and its highly negatively charged atomic sites with respect to the unsubstituted derivative (I12c) give the chloro derivatives (I12d) more opportunity for lateral interaction rather than the terminal one, which in turn enhances the smectic mesophase formation more than the nematic phase. The results also reveal that the length of the attached alkoxy chain had an insignificant effect on the orientation of the charge-distribution map; however, the extent of the least negatively charged atomic sites (blue regions) slightly increased with the alkoxy chain length. This may effect the type of mesophase by alteration of the competitive interaction between the terminal and lateral interactions, where at longer alkoxy chain lengths, the strength of the van der Waals interaction increases to an extent that overcomes the end–end interaction to enhance the smectic mesophase.
Fig. 16. Molecular electrostatic potentials (MEP) of I12a–d and Ind.
4. Conclusion
A new four-ring series of compounds with –N N–, –COO– and –CH N– connecting units, (4-substitutedphenylimino)methyl)phenyl 4-[2-(4-alkoxyhenyl)diazenyl]benzoate, were successfully synthesized and their molecular structures confirmed via FT-IR, 1H-NMR, 13C-NMR, mass spectra and elemental analyses. Their thermotropic and optical behaviours were studied and correlated with theoretical parameters derived from DFT calculations.
The study revealed that:
(1) All the prepared compounds exhibited high thermal stability with broad enantiotropic temperature mesomorphic ranges.
(2) The geometrical parameters of the prepared compounds were highly affected by the electronic nature of the terminal substituent X as well as the alkoxy chain length.
(3) The twist angle of the non-coplanar geometry impacted the mesophase type, stability and its range.
(4) As the dipole moment increased, the smectic mesophase was enhanced by enforcing the lateral attraction.
(5) Increasing the aspect ratio of Ind led to significant increases in the thermal stability of the smectic A and its range up to C12 and then declined, while the thermal stability of the nematic phase and its range decreases.
(6) The results revealed that the effect of the calculated polarizability of the same compounds Ind on the mesophase stabilities and their ranges followed the same trend as the effect of the aspect ratio.
(7) The FMOs' energy gap and global softness (S) were impacted by the electronic nature of the terminal substituent.
Conflicts of interest
There are no conflicts to declare.
Supplementary Material
Electronic supplementary information (ESI) available. See DOI: 10.1039/c9ra10499b
References
- Imrie C. T. Henderson P. A. Yeap G.-Y. Liq. Cryst. 2009;36:755–777. doi: 10.1080/02678290903157455. [DOI] [Google Scholar]
- Yeap G.-Y. Lee H.-C. Mahmood W. A. K. Imrie C. T. Takeuchi D. Osakada K. Phase Transitions. 2011;84:29–37. doi: 10.1080/01411594.2010.513613. [DOI] [Google Scholar]
- Yeap G.-Y. Osman F. Imrie C. T. Liq. Cryst. 2015;42:543–554. doi: 10.1080/02678292.2015.1004843. [DOI] [Google Scholar]
- Yeap G.-Y. Hng T.-C. Yeap S.-Y. Gorecka E. Ito M. M. Ueno K. Okamoto M. Mahmood W. A. K. Imrie C. T. Liq. Cryst. 2009;36:1431–1441. doi: 10.1080/02678290903271504. [DOI] [Google Scholar]
- Pramanik A. Das M. K. Das B. Żurowska M. Dąbrowski R. Liq. Cryst. 2015;42:412–421. doi: 10.1080/02678292.2014.996792. [DOI] [Google Scholar]
- Heilmeier G. H. Zanoni L. Appl. Phys. Lett. 1968;13:91–92. doi: 10.1063/1.1652529. [DOI] [Google Scholar]
- Heilmeier G. H. Zanoni L. A. Barton L. A. Proc. IEEE. 1968;56:1162–1171. [Google Scholar]
- Goodby J., Ferroelectricity and related phenomena, Gordon and Breach Science publishers, New York, 1991, vol. 7, ch. 2, p. 99 [Google Scholar]
- Carlton R. J. Hunter J. T. Miller D. S. Abbasi R. Mushenheim P. C. Tan L. N. Abbott N. L. Liq. Cryst. Rev. 2013;1:29–51. doi: 10.1080/21680396.2013.769310. [DOI] [PMC free article] [PubMed] [Google Scholar]
- Veerabhadraswamy B. N. Rao D. S. S. Yelamaggad C. V. Chem.–Asian J. 2018;13:1012–1023. doi: 10.1002/asia.201800119. [DOI] [PubMed] [Google Scholar]
- Huang C.-C. Hsu C.-C. Chen L.-W. Cheng Y.-L. Soft Matter. 2014;10:9343–9351. doi: 10.1039/C4SM01829J. [DOI] [PubMed] [Google Scholar]
- Segura J. L. Mancheño M. J. Zamora F. Chem. Soc. Rev. 2016;45:5635–5671. doi: 10.1039/C5CS00878F. [DOI] [PubMed] [Google Scholar]
- Gowda A. Jacob L. Joy N. Philip R. Pratibha R. Kumar S. New J. Chem. 2018;42:2047–2057. doi: 10.1039/C7NJ04807F. [DOI] [Google Scholar]
- Hagar M. Ahmed H. Saad G. Liq. Cryst. 2018;45:1324–1332. doi: 10.1080/02678292.2018.1435831. [DOI] [Google Scholar]
- Ahmed H. A. Hagar M. Alhaddad O. A. Crystals. 2019;9:133. doi: 10.3390/cryst9030133. [DOI] [Google Scholar]
- Imrie C. T. Henderson P. A. Curr. Opin. Colloid Interface Sci. 2002;7:298–311. doi: 10.1016/S1359-0294(02)00092-4. [DOI] [Google Scholar]
- Imrie C. T. Henderson P. A. Chem. Soc. Rev. 2007;36:2096–2124. doi: 10.1039/B714102E. [DOI] [PubMed] [Google Scholar]
- Ahmed H. Hagar M. El-Sayed T. Alnoman R. B. Liq. Cryst. 2019:1–11. [Google Scholar]
- Hagar M. Ahmed H. Saad G. J. Mol. Liq. 2019;273:266–273. doi: 10.1016/j.molliq.2018.10.035. [DOI] [Google Scholar]
- Ahmed H. Hagar M. Saad G. Liq. Cryst. 2019:1–10. [Google Scholar]
- Nafee S. S. Hagar M. Ahmed H. A. Alhaddad O. A. El-Shishtawy R. M. Raffah B. M. J. Mol. Liq. 2019:112161. doi: 10.1016/j.molliq.2019.112161. [DOI] [PMC free article] [PubMed] [Google Scholar]
- Gulbas H. Coskun D. Gursel Y. Bilgin-Eran B. Adv. Mater. 2014;5:333–338. [Google Scholar]
- Nafee S. S. Hagar M. Ahmed H. A. El-Shishtawy R. M. Raffah B. M. Molecules. 2019;24:3032. doi: 10.3390/molecules24173032. [DOI] [PMC free article] [PubMed] [Google Scholar]
- Alnoman R. Ahmed H. A. Hagar M. Molecules. 2019;24:4293. doi: 10.3390/molecules24234293. [DOI] [PMC free article] [PubMed] [Google Scholar]
- Ahmed H. Saad G. Liq. Cryst. 2015;42:1765–1772. doi: 10.1080/02678292.2015.1086443. [DOI] [Google Scholar]
- Mahmoud N. E. Saad G. R. Fahmi A. A. Naoum M. M. Liq. Cryst. 2018;45:1711–1722. doi: 10.1080/02678292.2018.1477211. [DOI] [Google Scholar]
- Saad G. R. Ahmed N. H. Fahmi A. A. Kaddah M. M. Naoum M. M. Liq. Cryst. 2019:1–13. [Google Scholar]
- Ahmed N. H. Saad G. R. Naoum M. M. Liq. Cryst. 2019:1–12. [Google Scholar]
- Tschierske C. Liq. Cryst. 2018;45:2221–2252. doi: 10.1080/02678292.2018.1501822. [DOI] [Google Scholar]
- Goodby J. W. Liq. Cryst. 2017;44:1755–1763. [Google Scholar]
- Zannoni C. Liq. Cryst. 2018;45:1880–1893. doi: 10.1080/02678292.2018.1512170. [DOI] [Google Scholar]
- Hagar M. Ahmed H. A. Nafee S. S. El-Shishtawy R. M. Raffah B. M. Molecules. 2019;24:3032. doi: 10.3390/molecules24173032. [DOI] [PMC free article] [PubMed] [Google Scholar]
- Prasad V. Nagendrappa Gowdru N. Manjunath M. Liq. Cryst. 2018;45:666–679. doi: 10.1080/02678292.2017.1371344. [DOI] [Google Scholar]
- Paterson D. A. Walker R. Abberley J. P. Forestier J. Harrison W. T. Storey J. M. Pociecha D. Gorecka E. Imrie C. T. Liq. Cryst. 2017;44:2060–2078. [Google Scholar]
- Nesrullajev A. Bilgin-Eran B. Mater. Chem. Phys. 2005;93:21–25. doi: 10.1016/j.matchemphys.2005.02.001. [DOI] [Google Scholar]
- Yasa-Sahin O. Yazici O. Karaagac B. Sakar D. Cankurtaran O. Bilgin-Eran B. Karaman F. Liq. Cryst. 2010;37:1111–1118. doi: 10.1080/02678292.2010.489154. [DOI] [Google Scholar]
- Canli N. Y. Günes S. Pivrikas A. Fuchsbauer A. Sinwel D. Sariciftci N. Yasa Ö. Bilgin-Eran B. Sol. Energy Mater. Sol. Cells. 2010;94:1089–1099. doi: 10.1016/j.solmat.2010.02.030. [DOI] [Google Scholar]
- Bhola G. Bhoya U. Mol. Cryst. Liq. Cryst. 2016;630:188–196. doi: 10.1080/15421406.2016.1146941. [DOI] [Google Scholar]
- Kelker H. Scheurle B. Angew. Chem., Int. Ed. 1969;8:884–885. doi: 10.1002/anie.196908841. [DOI] [Google Scholar]
- Gray G. W., Thermotropic liquid crystals, John Wiley & Sons Inc, 1987 [Google Scholar]
- Collings P. J. and Hird M., Introduction to liquid crystals: chemistry and physics, CRC Press, 2017 [Google Scholar]
- Ahmed H. Hagar M. Alhaddad O. Liq. Cryst. 2019:1–10. [Google Scholar]
- Hagar M. Ahmed H. A. Alhaddadd O. A. Crystals. 2018;8:359. doi: 10.3390/cryst8090359. [DOI] [Google Scholar]
- Hagar M. Ahmed H. A. Saad G. R. J. Mol. Liq. 2019;273:266–273. doi: 10.1016/j.molliq.2018.10.035. [DOI] [Google Scholar]
- Ahmed H. Hagar M. Alaasar M. Naoum M. Liq. Cryst. 2019;46:550–559. doi: 10.1080/02678292.2018.1512664. [DOI] [Google Scholar]
- Hagar M. Ahmed H. Alhaddadd O. Crystals. 2018;8:359. doi: 10.3390/cryst8090359. [DOI] [Google Scholar]
- Hagar M. Soliman S. M. Ibid F. El Sayed H. J. Mol. Struct. 2013;1049:177–188. doi: 10.1016/j.molstruc.2013.06.005. [DOI] [Google Scholar]
- Soliman S. M. Hagar M. Ibid F. El Sayed H. Spectrochim. Acta, Part A. 2015;145:270–279. doi: 10.1016/j.saa.2015.01.061. [DOI] [PubMed] [Google Scholar]
- Hagar M. Soliman S. M. Ibid F. El Sayed H. J. Mol. Struct. 2016;1108:667–679. doi: 10.1016/j.molstruc.2015.12.007. [DOI] [Google Scholar]
- Aboelnaga A. Hagar M. Soliman S. M. Molecules. 2016;21:848. doi: 10.3390/molecules21070848. [DOI] [PMC free article] [PubMed] [Google Scholar]
- Hagar M. Ahmed H. Saad G. Liq. Cryst. 2018;45:1324–1332. doi: 10.1080/02678292.2018.1435831. [DOI] [Google Scholar]
- Gür M. Kocaokutgen H. Taş M. Dyes Pigm. 2007;72:101–108. doi: 10.1016/j.dyepig.2005.08.005. [DOI] [Google Scholar]
- Kocaokutgen H. Gümrükçüoğlu I. J. Therm. Anal. Calorim. 2003;71:675–679. doi: 10.1023/A:1022888817658. [DOI] [Google Scholar]
- DeTar D. F. Ballentine A. R. J. Am. Chem. Soc. 1956;78:3916–3920. doi: 10.1021/ja01597a015. [DOI] [Google Scholar]
- Andrei A. Moanţă A. Dumitru M. Manolea H. O. Andrei A. Dinescu M. Goldner-Constantinescu C. J. Therm. Anal. Calorim. 2017;128:89–105. doi: 10.1007/s10973-016-5895-7. [DOI] [Google Scholar]
- Rotaru A. Constantinescu C. Rotaru P. Moanţâ A. Dumitru M. Socaciu M. Dinescu M. Segal E. J. Therm. Anal. Calorim. 2008;92:279. doi: 10.1007/s10973-007-8818-9. [DOI] [Google Scholar]
- Rotaru A. Brătulescu G. Rotaru P. Thermochim. Acta. 2009;489:63–69. doi: 10.1016/j.tca.2009.01.023. [DOI] [Google Scholar]
- Rotaru A. Dumitru M. J. Therm. Anal. Calorim. 2017;127:21–32. doi: 10.1007/s10973-016-5599-z. [DOI] [Google Scholar]
- Imrie C. Taylor L. Liq. Cryst. 1989;6:1–10. doi: 10.1080/02678298908027317. [DOI] [Google Scholar]
- Imrie C. T. Liq. Cryst. 2006;33:1449–1485. doi: 10.1080/02678290601140498. [DOI] [Google Scholar]
- Donaldson T. Staesche H. Lu Z. Henderson P. Achard M. Imrie C. Liq. Cryst. 2010;37:1097–1110. doi: 10.1080/02678292.2010.494412. [DOI] [Google Scholar]
- Henderson P. A. Niemeyer O. Imrie C. T. Liq. Cryst. 2001;28:463–472. doi: 10.1080/02678290010007558. [DOI] [Google Scholar]
- Henderson P. A. Imrie C. T. Liq. Cryst. 2011;38:1407–1414. doi: 10.1080/02678292.2011.624368. [DOI] [Google Scholar]
- Alhaddad O. Ahmed H. Hagar M. Molecules. 2020;25:365. doi: 10.3390/molecules25020365. [DOI] [PMC free article] [PubMed] [Google Scholar]
- Nafee S. S. Ahmed H. Hagar M. Liq. Cryst. 2020:1–12. [Google Scholar]
- Nafee S. S. Hagar M. Ahmed H. A. Alhaddad O. El-Shishtawy R. M. Raffah B. M. J. Mol. Liq. 2019:112161. doi: 10.3390/molecules24173032. [DOI] [PMC free article] [PubMed] [Google Scholar]
- Ha S.-T. Lee T.-L. ISRN Mater. Sci. 2014;2014:1–7. doi: 10.1155/2014/904657. [DOI] [Google Scholar]
- Wöhrle T. Wurzbach I. Kirres J. Kostidou A. Kapernaum N. Litterscheidt J. Haenle J. C. Staffeld P. Baro A. Giesselmann F. Laschat S. Chem. Rev. 2016;116:1139–1241. doi: 10.1021/acs.chemrev.5b00190. [DOI] [PubMed] [Google Scholar]
- Khoo I.-C. and Wu S.-T., Optics and nonlinear optics of liquid crystals, World Scientific, 1993 [Google Scholar]
- Chemla D. S., Nonlinear optical properties of organic molecules and crystals, Elsevier, 2012 [Google Scholar]
- Meredith G. R. VanDusen J. Williams D. J. Macromolecules. 1982;15:1385–1389. doi: 10.1021/ma00233a033. [DOI] [Google Scholar]
- Hagar M. Ahmed H. A. Alhaddad O. A. Liq. Cryst. 2019:1440–1451. doi: 10.1080/02678292.2019.1581290. doi: 10.1080/02678292.2019.1581290. [DOI] [Google Scholar]
- Hagar M. Ahmed H. Alhaddad O. Liq. Cryst. 2019:1–12. [Google Scholar]
Associated Data
This section collects any data citations, data availability statements, or supplementary materials included in this article.


