

Abstract
Background
Exercise or physical activity is recommended for improving pain and functional status in people with knee or hip osteoarthritis. These are complex interventions whose effectiveness depends on one or more components that are often poorly identified. It has been suggested that health benefits may be greater with high‐intensity rather than low‐intensity exercise or physical activity.
Objectives
To determine the benefits and harms of high‐ versus low‐intensity physical activity or exercise programs in people with hip or knee osteoarthritis.
Search methods
We searched the Cochrane Central Register of Controlled Trials (CENTRAL; issue 06, 2014), MEDLINE (194 8 to June 2014) , EMBASE (198 0 to June 2014), CINAHL (1982 to June 2014), PEDro (1929 to June 2014), SCOPUS (to June 2014) and the World Health Organization (WHO) International Clinical Registry Platform (to June 2014) for articles, without a language restriction. We also handsearched relevant conference proceedings, trials, and reference lists and contacted researchers and experts in the field to identify additional studies.
Selection criteria
We included randomized controlled trials of people with knee or hip osteoarthritis that compared high‐ versus low‐intensity physical activity or exercise programs between the experimental and control group.
High‐intensity physical activity or exercise programs training had to refer to an increase in the overall amount of training time (frequency, duration, number of sessions) or the amount of work (strength, number of repetitions) or effort/energy expenditure (exertion, heart rate, effort).
Data collection and analysis
Two review authors independently assessed study eligibility and extracted data on trial details. We contacted authors for additional information if necessary. We assessed the quality of the body of evidence for these outcomes using the GRADE approach.
Main results
We included reports for six studies of 656 participants that compared high‐ and low‐intensity exercise programs; five studies exclusively recruited people with symptomatic knee osteoarthritis (620 participants), and one study exclusively recruited people with hip or knee osteoarthritis (36 participants). The majority of the participants were females (70%). No studies evaluated physical activity programs. We found the overall quality of evidence to be low to very low due to concerns about study limitations and imprecision (small number of studies, large confidence intervals) for the major outcomes using the GRADE approach. Most of the studies had an unclear or high risk of bias for several domains, and we judged five of the six studies to be at high risk for performance, detection, and attrition bias.
Low‐quality evidence indicated reduced pain on a 20‐point Western Ontario and McMaster Universities Arthritis Index (WOMAC) pain scale (mean difference (MD) ‐0.84, 95% confidence interval (CI) ‐1.63 to ‐0.04; 4% absolute reduction, 95% CI ‐8% to 0%; number needed to treat for an additional beneficial outcome (NNTB) 11, 95% CI 14 to 22) and improved physical function on the 68‐point WOMAC disability subscale (MD ‐2.65, 95% CI ‐5.29 to ‐0.01; 4% absolute reduction; NNTB 10, 95% CI 8 to 13) immediately at the end of the exercise programs (from 8 to 24 weeks). However, these results are unlikely to be of clinical importance. These small improvements did not continue at longer‐term follow‐up (up to 40 weeks after the end of the intervention). We are uncertain of the effect on quality of life, as only one study reported this outcome (0 to 200 scale; MD 4.3, 95% CI ‐6.5 to 15.2; 2% absolute reduction; very low level of evidence).
Our subgroup analyses provided uncertain evidence as to whether increased exercise time (duration, number of sessions) and level of resistance (strength or effort) have an impact on the exercise program effects.
Three studies reported withdrawals due to adverse events. The number of dropouts was small. Only one study systematically monitored adverse effects, but four studies reported some adverse effects related to knee pain associated with an exercise program. We are uncertain as to whether high intensity increases the number of adverse effects (Peto odds ratio 1.72, 95% CI 0.51 to 5.81; ‐ 2% absolute risk reduction; very low level of evidence). None of the included studies reported serious adverse events.
Authors' conclusions
We found very low‐quality to low‐quality evidence for no important clinical benefit of high‐intensity compared to low‐intensity exercise programs in improving pain and physical function in the short term. There was insufficient evidence to determine the effect of different types of intensity of exercise programs.
We are uncertain as to whether higher‐intensity exercise programs may induce more harmful effects than those of lower intensity; this must be evaluated by further studies. Withdrawals due to adverse events were poorly monitored and not reported systematically in each group. We downgraded the evidence to low or very low because of the risk of bias, inconsistency, and imprecision.
The small number of studies comparing high‐ and low‐intensity exercise programs in osteoarthritis underscores the need for more studies investigating the dose–response relationship in exercise programs. In particular, further studies are needed to establish the minimal intensity of exercise programs needed for clinical effect and the highest intensity patients can tolerate. Larger studies should comply with the Consolidated Standards of Reporting Trials (CONSORT) checklist and systematically report harms data to evaluate the potential impact of highest intensities of exercise programs in people with joint damage.
Plain language summary
Benefits and harms of high‐ versus low‐intensity exercise programs for hip or knee osteoarthritis
Review question
We searched the literature until June 2014 for studies on the benefits and harms of high‐ versus low‐intensity exercise programs for people with hip or knee osteoarthritis.
Background
Osteoarthritis is a chronic condition that affects the joints (commonly hips, knees, spine, and hands). Over time, cartilage wears down in joints. People with osteoarthritis generally feel pain and can have difficulties performing daily activities such as walking. Exercise or physical activity programs are non‐drug treatments usually recommended for people with hip or knee osteoarthritis. Many types of exercises are prescribed, but it may be unclear whether or not they are effective. Several different components can play a role in the effectiveness of an exercise regimen, such as exercise duration, frequency, or level of resistance. High intensity can be defined as an extra amount of time (duration or frequency) or resistance (strength or effort) required in the exercise programs.
Study characteristics
We identified six randomized controlled trails with 656 participants. Five studies (620 participants) enrolled people with knee osteoarthritis, and one study (36 participants) enrolled people with knee or hip osteoarthritis. The studies included more women (70%) than men.
Key results
On a scale of 0 to 20 points (lower scores mean reduced pain), people who completed a high‐intensity exercise program rated their pain 0.84 points lower (4% absolute improvement) than people who completed a low‐intensity exercise program. People who performed a low‐intensity exercise program rated their pain at 6.6 points.
On a scale of 0 to 68 points (lower scores mean better function), people who completed a high‐intensity exercise program rated their physical function 2.65 points lower (4% absolute improvement) than people who completed a low‐intensity exercise program. People who performed a low‐intensity exercise program rated their pain at 20.4 points.
On a scale of 0 to 200 mm visual analog scale (higher score means better function), people who completed a high‐intensity exercise program rated their quality of life 4.3 mm higher (6.5 mm lower to 15.2 mm higher) (2% absolute improvement) than people who performed a low‐intensity exercise program. People who performed a low‐intensity exercise program rated their quality of life at 66.7 mm.
Two per cent more people had adverse effects with high‐intensity exercise, or 17 more people out of 1000.
• 39 out of 1000 people reported an adverse effect related to high‐intensity exercise program
• 22 out of 1000 people reported an adverse effect related to low‐intensity exercise program
Adverse events were not systematically monitored and and were incompletely reported by group. None of the included studies reported serious adverse events.
Based on the evidence, people with knee osteoarthritis who perform high‐intensity exercise may experience slight improvements in knee pain and function at the end of the exercise program (8 to 24 weeks) when compared with a low‐intensity exercise program. We are uncertain as to whether high‐intensity exercise improves quality of life or increases the number of people who experience adverse events.
Quality of evidence
We graded the quality of evidence as low for pain and function and very low for quality of life. The small number of studies and participants included in some analyses reduced the robustness and precision of these findings.
Adverse effects were poorly recorded. Very low quality evidence shows we are uncertain whether higher‐intensity exercise programs may result in more side effects than lower‐intensity exercise programs. Further research may change the result.
Summary of findings
Background
Description of the condition
Osteoarthritis is the most common type of arthritis and related diseases in the world (Murray 2012). The prevalence increases with age, and lifestyle factors such as obesity and lack of physical activity are risk factors (Woolf 2003). Approximately 10% of the world's population aged 60 or older have symptomatic osteoarthritis (Zhang 2010).
Osteoarthritis is a chronic condition that affects the joints and occurs when cartilage in joints wears down over time. The disease process can affect almost any joint, but occurs mostly in the knees, hips, spine, and hands. The population impact is greatest for osteoarthritis of the hips and knees (Vos 2012).
People with osteoarthritis generally experience pain, reduced joint motion, and muscle weakness and are unable to perform a variety of daily living activities (Moskowitz 2009). Although osteoarthritis is a degenerative disease and therefore has no cure, a number of treatments can control symptoms and improve quality of life.
Description of the intervention
People with osteoarthritis experiencing pain have reduced activities (Moskowitz 2009). Similarly, reduced muscle strength is associated with pain and functional disability (Jan 2008). Current international guidelines, in Hochberg 2012 and Brosseau 2014, recommend managing osteoarthritis by promoting activity and participation in regular physical activities and exercise therapy (Vignon 2006; McAlindon 2014). Several clinical studies have shown that aerobic physical activity and muscle‐strengthening exercise may help reduce symptoms of osteoarthritis and improve function (Latham 2010). Prescribed physical activity or exercise therapies usually target aerobic capacity, muscular strength, and flexibility. The World Health Organization defines physical activity as all forms of activity (for example occupational, recreational, sports related) involving skeletal muscles that require energy expenditure (World Health Organization 2010). Exercise refers to a form of physical activity that is planned and structured and is often developed by a fitness or rehabilitation specialist for the client or patient (Bouchard 2007). The delivery of exercise programs varies by amount and magnitude of work (level of resistance, frequency, duration, and progression), supervision (type, mode of delivery), and setting (home, community/gym, healthcare setting).
How the intervention might work
Physical activity or exercise may be effective for people with osteoarthritis (Bijlsma 2011). Exercise prescription includes different components: intensity, frequency, duration, and mode. Intensity is a feature of exercise programs that may be high, vigorous, moderate, or low depending on the treatment goal (for example muscle weakness) or the subject population. Studies exploring the impact of intensity level of exercise on physical performance, Kraus 2002, Heiwe 2011, and Robbins 2012, have suggested that a more intense program of physical activity or exercise may be more effective for stroke patients, in Hunter 2011, or older adults, in Galvao 2005. Health benefits may be greater with high‐ versus low‐intensity exercise programs.
Why it is important to do this review
Several systematic reviews have highlighted a minimum intensity of exercise programs that is necessary for health benefits (Fransen 2008a; Fransen 2008b), but evidence for the effect of high‐intensity physical activity or exercise programs on pain and physical function in people with hip or knee osteoarthritis is lacking. In a Cochrane review including only a single trial (39 participants), the benefits of an exercise program did not differ by high or low intensity for people with knee osteoarthritis (Brosseau 2003). Moreover, the interaction between the effect of intensity and type of treatment (physical activity, exercise) or the joint involved could not be explored. More recently, several new clinical studies have reported that more intensive exercise programs increasing the strength of muscles and overall activity level may be beneficial for adults with osteoarthritis (Jan 2008). Several trials have been published since 2003, and a reappraisal of the available evidence regarding the effect of intensity on both physical activity (for example walking or cycling) and exercise programs is warranted.
Objectives
To determine the benefits and harms of high‐ versus low‐intensity physical activity or exercise programs on pain and physical function in people with hip or knee osteoarthritis.
Methods
Criteria for considering studies for this review
Types of studies
We only included randomized controlled trials (RCTs).
Types of participants
We included studies if they recruited at least 75% of participants with clinically or radiographically confirmed primary osteoarthritis of the knee or hip. We excluded studies of people with inflammatory arthritis, such as rheumatoid arthritis. We did not consider studies of children.
Types of interventions
Studies were eligible if they compared high‐ and low‐intensity physical activity or exercise programs between the experimental and control groups.
The World Health Organization 2010 study defines physical activity as “any movement produced by skeletal muscles that requires energy expenditure.” ”Exercise program” is defined as a form of physical activity that is planned, structured, and repeated over a period of time (Bouchard 2007), with “the intention of improving or maintaining physical fitness or health” (Kwakkel 2004; Umpierre 2011).
We considered high‐intensity programs in the experimental group as the following:
the additional amount of time spent in an activity or exercise compared to the control group (session duration or number of sessions, or both); and
the amount of resistance work (strength, rates) or effort (magnitude) required to perform an activity or exercise compared to the control group (resistance exercise).
More specifically, high‐intensity physical activity or exercise program training could refer to an increase in (1) the overall amount of training time: the program length (week, months), frequency (days/week), duration of sessions (minutes), number of sessions, or (2) the amount of work (torque, repetitions, strength) or amount of effort/energy expenditure (exertion, heart rate, effort).
The review included studies involving the following types of comparisons:
The same exercise or physical activity programs performed in the experimental and control groups but with different intensity.
Any exercise or physical activity performed in the experimental and control groups but with additional exercise or physical activity program(s) in the experimental group.
We excluded studies that compared exercise programs with no exercise training (for example passive stretch, educational advice, placebo or sham).
Types of outcome measures
We used data from the outcomes assessment conducted immediately on completion of the intervention program. When data were available, we analyzed the effects at mid‐term (6 to 12 months) and long‐term (after 12 months) follow‐up.
Major outcomes
The major outcomes were pain, function, and quality of life, as currently recommended for osteoarthritis trials (Altman 1996; Pham 2004). For safety, the major outcomes were the number of participants who withdrew because of adverse events and number of participants experiencing any serious adverse events.
Pain
If a trial provided data on more than one pain scale, we extracted data on the pain scale that was highest on the following list according to a previously described hierarchy of pain‐related outcomes (Jüni 2006; Reichenbach 2007).
Pain overall
Pain on walking
Western Ontario and McMaster Universities Osteoarthritis Index (WOMAC) pain subscale
Pain during activities other than walking
WOMAC global scale
Lequesne osteoarthritis index global score
Other algofunctional scale
Patient global assessment
Physician global assessment
Other outcome
No continuous outcome reported
Physical function
If a trial provided data on more than one physical function scale, we extracted data according to the following hierarchy.
Global disability score
Walking disability
WOMAC disability subscore
Composite disability scores other than WOMAC
Disability other than walking
WOMAC global scale
Lequesne osteoarthritis index global score
Other algofunctional scale
Quality of life
We extracted quality‐of‐life data collected by the Medical Outcomes Survey Short Forms 12 and 36, EuroQoL, Sickness Impact Profile, or Nottingham Health Profile.
Safety
Withdrawals due to adverse events
Severe adverse events outcomes: inpatient hospitalization, life‐threatening events or death
Adverse effects associated with the exercise intervention including joint or muscle contractures, fatigue, pain, falls, function limitations
Minor outcomes
Physical global performance
Walking ability, including gait speed and walking endurance
Muscle strength, using quantitative strength sensors
Aerobic capacity, including peak VO2 or peak work rate
Range of motion
Physical activity levels
Number of steps
Joint imaging
Joint space narrowing measurement on radiography
The Kellgren‐Lawrence classification
Search methods for identification of studies
Electronic searches
We first searched the following databases the Cochrane Central Register of Controlled Trials (CENTRAL,2012, Issue 10 ), MEDLINE through OVID (1948 to October 2012), EMBASE through Elsevier (1980 to October 2012), CINAHL (1982 to October 2012) and PEDro (from 1929 to October 2012). The MEDLINE search involved the Cochrane highly sensitive search strategy, sensitivity‐maximizing version (2008 revision). The EMBASE search involved the UK Cochrane Centre search filter to identify reports of RCTs. We used the Google Scholar search engine to find additional references.
We performed an updated search in all the databases on June 2014.
The Trials Search Co‐ordinator for the Cochrane Musculoskeletal Review Group helped develop search equations. The queries combined free text words and controlled vocabulary. The search strategy was based on synonyms of (“physical activity” OR “exercise”) AND “osteoarthritis.” We used an adapted search strategy to search MEDLINE (Appendix 1), EMBASE (Appendix 2), the Cochrane Central Register of Controlled Trials (CENTRAL; Cochrane Library) (Appendix 3), CINAHL (Appendix 4), and PEDro (Appendix 5). We did not restrict the search by language of publication or publication status.
Searching other resources
we searched for aditional relevant systematic reviews in the Cochrane Database of Systematic Reviews and the Database of Abstracts of Reviews of Effects (DARE) (to J une 2014) .
We handsearched the reference lists of selected trials and systematic reviews identified from electronic searches.
We also searched conference proceedings available online for the American College of Rheumatology, European League Against Rheumatism, and Osteoarthritis Research Society International (up to the two latest editions). We contacted authors and field experts for any additional published or unpublished data.
To identify trials in progress, we used the WHO International Clinical Trials Registry Platform (www.apps.who.int/trialsearch); ClinicalTrials.gov (www.clinicaltrials.gov); and the metaRegister of Controlled Trials (mRCT) (www.controlled‐trials.com).
We contacted authors of active or completed trials for provisional results if they had not yet been published. We supplemented database searching and hand‐searching and for the RCTs identified by the first step by tracking citations in SCOPUS (Appendix 6).
Data collection and analysis
Selection of studies
We removed duplicate records from retrieved references. Using the inclusion and exclusion criteria, two review authors (JPR, CN) independently screened the titles and abstracts identified by the search strategy in order to identify potentially relevant studies. These review authors obtained and screened the full‐length articles for selected titles and abstracts to check for eligibility and decide on their inclusion. Disagreements were resolved by discussion and with the assistance of a third review author (MMLC) if needed.
If results of eligible trials were available in an abstract only, we contacted the trial authors to ask for a report of the trial results. We linked multiple reports relating to the same trial or trials with potentially overlapping populations. If we could not exclude the possibility of overlapping populations, we selected the more recent trial.
To confirm the eligibility of studies, we assessed the intensity of exercise programs. Interventions in rehabilitation are in fact complex (Boutron 2008), involving several components that may interact separately or together, for difficulties in classification. For each included study, the two review authors (JPR, CN) used the following steps:
identified the experimental and the control group; and
rated the intensity of physical activity or exercise programs in the experimental and control group as high or low on the basis of their description.
We used a consensus method to resolve disagreements and consulted a third review author (IB) if necessary. If the article did not contain information on the exercise program intensity, we contacted the trial authors for additional information. In the absence of sufficient information, we excluded the study. Review authors were blinded to all characteristics of the trial except for the content of the interventions.
Data extraction and management
Two review authors (JPR, MMLC) independently extracted results of individual trials by using a standardized piloted extraction form accompanied by a codebook. We resolved disagreements by consensus or by consulting a third review author (IB) if necessary. We based the extraction form on other forms used by the Cochrane Musculoskeletal Review Group and pilot‐tested it with five reports of RCTs.
Relevant information extracted were as follows:
Trial characteristics: funding, settings and number of centers, country, study design.
Participant characteristics: age, sex, measure of physical function, level of pain, description of radiographic damage, non‐steroidal anti‐inflammatory drugs or other drugs, coexisting diseases, other.
-
Intervention characteristics:
number of intervention groups;
content of each intervention (details);
qualitative data: a detailed description of the interventions including the different components of the program received by each group, mode of delivery (individual, in group, through Internet), with supervision or not (face‐to‐face or at home), clinical expertise and background of the healthcare professionals who provided the physical activity or exercise programs (physiotherapist, fitness instructor, registered nurse, other); and
quantitative data: number of sessions, timing and duration of each session, duration of each component, and overall duration. We hypothesized that more frequent interventions conducted over a longer time may influence outcomes. We calculated the intensity of treatment and used this calculation to test whether greater intensity of exercise programs had greater effects on outcomes.
Tolerance and adverse events: data on compliance of participants in each group and any adverse events or side effects related to the interventions as well as data on drop‐out/adherence rates.
Outcome/data results: outcomes and time points used, results of each intervention group, number of participants randomized, and number of participants used for the analysis in each group.
When necessary, we approximated the means and measures of dispersion from data in the reports.
We entered data into Review Manager and checked it for accuracy (RevMan 2011).
Assessment of risk of bias in included studies
We evaluated the risk of bias in each included study according to the 'Risk of bias' tool recommended by The Cochrane Collaboration. Two review authors (JPR, MMLC) independently examined seven specific domains: sequence generation, allocation concealment, blinding of participants or personnel, blinding of outcome assessors, incomplete outcome data, selective outcome reporting, and other potential source of bias (that is design specific, baseline imbalance). We scored each criterion as “high risk of bias,” “low risk of bias,” or “unclear risk of bias,” depending on the information supplied in the report.
We classified studies as at low risk of bias if all key domains had low risk of bias and no serious flaws; high risk of bias if one or more domains had high risk of bias; and unclear risk of bias if one or more domains had unclear risk of bias (Higgins 2011). We resolved any disagreements by involving a third review author (IB).
Measures of treatment effect
For dichotomous data, we expressed the results of each RCT as risk ratios (RRs) with corresponding 95% confidence intervals(CIs). We used the Peto method to calculate a Peto Odds ratio from the number of adverse effects reported by each study before combining them (Deeks 2011).
For continuous outcomes, we summarized results as mean difference (MD) if the same tool was used to measure the same outcome across separate studies. Alternatively, we calculated the standardized mean difference (SMD) when studies measured the same outcome but used different tools. The SMD expresses the size of the intervention effect in each study relative to the variability observed in that study. We calculated the SMD by dividing the MD by the standard deviation (SD) for the outcome among participants. An SMD greater than 0 indicates a beneficial effect in favor of high‐intensity exercise or physical activity. We computed a 95% CI for the SMD. We interpreted the SMD as described in Cohen 1988: SMD = 0.2 is considered a small beneficial effect; 0.5 a medium effect; and 0.8 a large effect.
If the meta‐analysis resulted in statistically significant overall estimates, we transformed the treatment effect measures (pooled estimate of RR or SMD) into measures that are clinically useful in daily practice, such as the number needed to treat for an additional beneficial outcome or harmful outcome and the absolute and/or relative improvement on the original units to express the final results of the review. We back‐translated the results by multiplying the SMD by the SD for a representative study (Akl 2011).
Unit of analysis issues
For cross‐over trials, we planned to extract data from the first period only, but we included none in this review. Whenever possible, we used results from an intention‐to‐treat analysis.
For studies containing more than two intervention groups, allowing for multiple pair‐wise comparisons between all possible pairs of intervention groups, we included the same group of participants only once in the meta‐analysis following the procedure recommended by The Cochrane Collaboration (Deeks 2011).
Dealing with missing data
In case of missing outcome data, we contacted the original investigators to request data. We performed sensitivity analyses to assess how sensitive the results were to changes and addressed the potential impact of missing data on the review findings in the Discussion section.
Assessment of heterogeneity
We evaluated clinical heterogeneity by determining if different clinical factors (characteristics of participants, interventions, outcome measures) varied between trials and could have an influence on the treatment effects. We assessed statistical heterogeneity by a visual inspection of graphs and by using the I2 statistic, which describes the proportion of variability in effect estimates due to heterogeneity rather than sampling error (Higgins 2002).
We interpreted the value of the I2 statistic according to the following thresholds (Higgins 2011): 0% to 40%, might not be important; 30% to 60%, may represent moderate heterogeneity; 50% to 90%, may represent substantial heterogeneity; and 75% to 100%, considerable heterogeneity. We also computed the 95% CI for the I2 statistic (Ioannidis 2007a), as well as the between‐study variance Tau2, estimated from the random‐effects model (Rucker 2008). In all cases, we considered the results from both the fixed‐effect and random‐effects models and chose the most appropriate.
Assessment of reporting biases
We planned to draw contour‐enhanced funnel plots for each meta‐analysis to assess the presence of small‐study effects (Peters 2008). As the required statistical conditions were not met (10 or more studies, no statistical significant heterogeneity, and ratio of the maximal to minimal variance across studies greater than 4), we did not perform these analyses.
Data synthesis
We performed a meta‐analysis if the data of the studies were clinically and statistically sufficiently homogeneous. If not sufficiently homogeneous, we explored heterogeneity in stratified analyses. The starting point for all meta‐analyses of studies of effectiveness involved identifying the data type for the outcome measurements.
We performed separate meta‐analyses for each outcome of interest. We conducted fixed‐effect meta‐analyses using inverse weighting by variances of treatment contrasts. We conducted random‐effects analyses using the approach in the Hardy 1996 study with CIs of profile likelihood form. We considered the results from both the fixed‐effect and random‐effects models and chose a model based on the assessment of heterogeneity, the size of trials, and the risk of bias within trials.
We planned to perform a bivariate random‐effects meta‐analysis to address issues of correlated outcome and missingness, but, since no data were missing, we did not perform the analysis.
Subgroup analysis and investigation of heterogeneity
To explore heterogeneity in estimating the effect of intensity, we performed subgroup analyses according to the type of exercise intensity. We compared exercise program effect for pain and function whether the intensity varied in time (duration) and in resistance (strength or effort).
Sensitivity analysis
We performed a sensitivity analysis to assess how the results of meta analysis might be affected by a selection bias (study recruitment participants with hip and knee osteoarthritis) on immediate post‐treatment pain and physical function outcomes.
We planned to perform a sensitivity analysis to assess this effect on the meta‐analysis results, excluding studies at high or unclear risk of bias, but since all of the identified studies had high or unclear risk of bias, we were unable to perform this analysis.
'Summary of findings' tables
We presented the primary outcomes of the review in 'Summary of findings' tables (pain, physical function, quality of life, and adverse effects associated with the exercise program).
We included:
'Summary of findings' tables that provided key information concerning the quality of evidence, the magnitude of effect of the interventions examined, and the sum of available data on the main outcomes, as recommended in the Cochrane Handbook for Systematic Reviews of Interventions (Schünemann 2011a); and
an overall grading of the evidence related to each main outcome, using the GRADE approach (Schünemann 2011b).
Overall outcome data presented in the 'Summary of findings' tables are based on the time of measurement immediately after the end of the exercise program.
For dichotomous outcomes, we calculated the absolute risk difference by using the risk difference statistic in Review Manager (RevMan 2011), with results expressed as a percentage. The relative percentage change (RPC) was calculated using the risk ratio computed from the Peto Odds Ratio (Schünemann 2011b). RPC was obtained as the RR ‐1 and reported as a percentage. The number needed to treat for an additional harmful outcome (NNTH) from the control group event rate was calculated using the Visual Rx NNT calculator (Cates 2008).
For continuous outcomes, the absolute risk difference was calculated as the MD between high‐ and low‐intensity physical activity or exercise program groups in the original measurement units (divided by the scale), expressed as a percentage; the relative difference was calculated as the absolute change (or MD) divided by the pooled baseline mean obtained from the low‐intensity exercise program group in Review Manager. We used the Wells calculator to obtain the number needed to treat for an additional beneficial outcome for continuous measures (available at the Cochrane Musculoskeletal Group editorial office; http://musculoskeletal.cochrane.org). We determined the minimal clinically important difference for the WOMAC score. We assumed that for each subscale, a change of at least 4 points on the 15‐point WOMAC pain scale (15% for absolute improvement) and 10 points on the 68‐point WOMAC function scale (15% for absolute improvement) was needed to be considered a clinically meaningful difference (Tubach 2012).
Results
Description of studies
Results of the search
We included six studies (nine reports) (Mangione 1999; McCarthy 2004; Jan 2008; Ng 2010; Foroughi 2011; Singh 2011). The search retrieved 6493 citations, and 3374 citations after duplicates were removed. We excluded 2969 studies on citation screening and 385 studies on abstract screening (see Figure 1). After selecting 20 full‐text reports, we excluded 11 reports because they did not meet the selection criteria: no randomization (one study) and no comparison of high‐ versus low‐intensity interventions (10 studies). The remaining nine eligible full‐text reports corresponded to six studies of interventions that were exclusively high‐intensity exercise programs compared with low‐intensity exercise programs. McCarthy 2004 reported on additional variables in two different reports, which were counted as one study for analysis. Likewise, Foroughi 2011 reported on additional variables in two reports that were counted as one study. We found one report and a thesis of one study that were counted as one study (Singh 2011). We had insufficient information to determine inclusion eligibility for one trial (Steinhilber 2012), and we could not contact the authors, so we listed the study in the Characteristics of studies awaiting classification section. In addition, we identified four ongoing trials (see Characteristics of ongoing studies). We requested additional information from eight authors and received responses from six (Ng 2010; Teixeira 2011; Foroughi 2011; Messier 2011; Pua 2012; Østerås 2012) (see Appendix 7). The last searches were performed in June 2014.
1.

Study flow diagram.
Included studies
We have provided a full description of the six included studies in Characteristics of included studies.
Methods
All included studies were RCTs with a parallel‐group design.
Sample size
The six studies included 656 participants. The median sample size was 78 (lower quartile = 43; upper quartile = 176).
Participants
Two studies were conducted in Australia and one study each in the United Kingdom, United States, Taiwan, and India. Most participants (70%) were female, and one study included females only (Foroughi 2011). The mean age of participants was 61 years (range 56 to 71 years). All studies recruited participants in a single center.
The location of osteoarthritis was reported in all studies. The predominant location was the knee. Only one study included participants with hip or knee osteoarthritis (Ng 2010). Two studies reported the mean duration of osteoarthritis: 14 and 12 years (Mangione 1999;Foroughi 2011).
Interventions
All six included studies examined an exercise program and compared outcomes of high and low intensity of exercise. No study examined a physical activity program with different intensity.
Three studies assessed the effect of exercise programs with the two levels of intensity by amount of time spent in the program (McCarthy 2004; Ng 2010; Singh 2011), and two compared the two levels by resistance (strength or effort) (Mangione 1999; Jan 2008; Foroughi 2011).
The duration of programs ranged from eight to 24 weeks. The mean frequency was three sessions per week (range two to five per week).
See Characteristics of included studies for a description of the components of the exercise programs.
Three studies examined exercise programs with a single component: walking (Ng 2010), set of muscle repetitions (Foroughi 2011), or cycling (Mangione 1999), and three studies examined an exercise program with multiple components (Jan 2008; McCarthy 2004; Singh 2011). Most exercise programs were supervised. Two were partially or completely unsupervised, with an exercise program executed at home (McCarthy 2004; Ng 2010). The intervention was delivered by an experienced or trained exercise therapist in four studies and not clearly reported in two studies (Mangione 1999; Singh 2011).
Adherence to training interventions
Adherence to the interventions was defined in terms of (1) attendance at an appointment and (2) compliance with the training advice or the content of the sessions provided by the healthcare professional (Brazzelli 2011).
We were not able to perform an analysis on attendance. In most of the studies, attendance or compliance was not clearly reported.
The included studies did not systematically report compliance. Ng 2010 reported greater compliance with walking programs performed for three versus five days (100% versus 58% to 100%).
Outcomes
Only a limited number of studies reported the same outcomes prespecified in the protocols (see Additional tables). The six studies considered the end of the intervention as the final data collection point (range eight to 24 weeks).
Primary outcomes (Table 3): all six studies reported pain outcomes. Four studies used the WOMAC pain scale (McCarthy 2004; Jan 2008; Ng 2010; Foroughi 2011), one used a visual analog scale (VAS) (Singh 2011), and one used the Arthritis Impact Measurement Scale 2 (AIM2) subscale to assess pain intensity (Mangione 1999). Five studies assessed physical function. All used the WOMAC disability subscores (McCarthy 2004; Jan 2008; Ng 2010; Foroughi 2011; Singh 2011). Only one study reported quality of life, by the Short Form 36 and the EuroQol consisting of a 200 mm vertical VAS (McCarthy 2004).
1. Primary outcomes reported in included studies.
| Study ID | Primary outcome reported | ||||||||
| Pain (WOMAC) | Pain (VAS) | Pain (AIM2) |
P Function (WOMAC) |
P Function (ALF) |
QoL (SF‐36) | Qol (EuroQol) |
WOMAC global |
Safety | |
| Mangione 1999 | no | no | yes | no | no | no | no | no | yes |
| McCarthy 2004 | yes | yes | no | yes | yes | yes | yes | no | yes |
| Jan 2008 | yes | no | no | yes | no | no | no | no | yes |
| Ng 2010 | yes | no | no | yes | no | no | no | yes | yes |
| Foroughi 2011 | yes | no | no | yes | no | no | no | yes | yes |
| Singh 2011 | no | yes | no | yes | no | no | no | no | no |
AIM2: Arthritis Impact Measurement Scale 2 ALF: aggregated locomotor function QoL: quality of life SF‐36: Short Form 36 VAS: visual analog scale WOMAC: Western Ontario and McMaster Universities Arthritis Index
Secondary outcomes (Table 4): included studies reported multiple secondary outcomes but o nly few studies used the same outcome measures . Two studies reported gait speed, for a fast pace, in Mangione 1999 and Jan 2008, and normal pace, in Mangione 1999 and Foroughi 2011. Three studies reported muscle strength for knee extensor muscles (McCarthy 2004; Jan 2008; Foroughi 2011), two studies knee flexor muscles (Jan 2008; Foroughi 2011), and two studies global strength (Foroughi 2011; Singh 2011). One study examined aerobic capacity (Mangione 1999). Two studies examined range of motion (McCarthy 2004; Singh 2011). One study examined physical activity and number of steps (Ng 2010), and data could not be extracted.
2. Secondary outcomes reported in included studies.
| Study ID | Secondary outcome reported | ||||||||
|
Gait speed (fast) |
Gait speed (normal) |
Muscle strength (knee extensor) |
Muscle strength (knee flexor) |
Muscle strength (global) |
Aerobic capacity |
Range of motion |
Physical activity |
Number of steps | |
| Mangione 1999 | yes | yes | no | no | no | yes | no | no | no |
| McCarthy 2004 | no | no | yes | no | no | no | yes | no | no |
| Jan 2008 | yes | no | yes | yes | no | no | no | no | no |
| Ng 2010 | no | no | no | no | no | no | no | yes | yes |
| Foroughi 2011 | no | yes | yes | yes | yes | no | no | no | no |
| Singh 2011 | no | no | no | no | yes | no | yes | no | no |
Follow‐up assessment : two studies provided follow‐up assessments at mid‐term (six to 16 weeks after the end of the interventions) (McCarthy 2004;Ng 2010), and one study at long‐term (40 weeks after the end of the interventions) (McCarthy 2004).
Safety
Severe adverse events or withdrawal due to adverse events: three studies reported dropouts or adverse events. Foroughi 2011 reported dropout events in the high‐ and low‐intensity exercise program groups. Mangione 1999 reported adverse events but did not specify in which group they occurred. Ng 2010 reported dropout events in both groups for health reasons. McCarthy 2004, Jan 2008, and Singh 2011 did not report the presence or absence of adverse events.
Adverse effects: only one study systematically reported adverse effects related to the exercise programs (Foroughi 2011), and three additional studies made specific reference to the presence of adverse effects (McCarthy 2004; Jan 2008; Ng 2010) (see Characteristics of included studies).
Excluded studies
After screening of citations and abstracts, we excluded 12 reports on examining the full text. We based exclusions on unmet criteria related to (1) no randomization assignment (1 study) and (2) no clear difference in intensity in exercise programs between groups (11 studies).
Ongoing studies
See Characteristics of ongoing studies
We identified four ongoing studies registered in WHO ICTRP as potentially eligible for inclusion, but no findings were available yet. Three studies are comparing high versus low strength training on knee osteoarthritis: in the United States ( Messier 2011 ), in Sweden ( Äng 2013 ) and in Singapore ( Pua 2012 ). One study is examining the effects of high versus low exercise program on hip osteoarthritis in Norway ( Østerås 2012).
Risk of bias in included studies
Results of the 'Risk of bias' assessment are in Characteristics of included studies and Figure 2. Figure 2 provides a summary of the judgments of each methodological quality item for each study.
2.

Risk of bias summary: review authors' judgements about each risk of bias item for each included study.
Allocation
We considered allocation sequence generation adequate in five studies (Mangione 1999; McCarthy 2004; Jan 2008; Ng 2010; Foroughi 2011), and unclear in one study (Singh 2011). Four of these studies used a computer‐generated list for sequence generation and one study a random table (Jan 2008). Although one study used a central allocation to conceal allocation from the investigator enrolling participants and was rated as low risk (McCarthy 2004), four studies were rated as at unclear risk of bias because they provided insufficient information to determine allocation methods. We rated one study as at high risk of bias because the treatment allocation was not concealed (Ng 2010).
Blinding
In exercise studies, participants and care providers are rarely blinded from treatment allocation. In five studies, we rated performance bias at high risk (Mangione 1999; McCarthy 2004; Jan 2008; Ng 2010; Singh 2011). We rated one study as at low risk of bias because the participants were blinded to the investigators' hypothesis (Foroughi 2011). For detection bias, we separated the assessment of blinded assessors for subjective and objective outcomes. As five studies reported that participants were not blinded, we rated these as at high risk of bias; we rated one study as at low risk of bias (Foroughi 2011). For the objective outcomes, we rated the studies as at low (McCarthy 2004; Jan 2008; Foroughi 2011), high (Ng 2010; Singh 2011), and unclear risk of bias (Mangione 1999).
Incomplete outcome data
We rated five studies as at high risk of bias. Five studies featured a median of 16% drop‐out after inclusion (range 4% to 28%). Two studies reported an intention‐to‐treat (ITT) analysis (McCarthy 2004; Jan 2008). Only one study mentioned a method of imputation (last observation carried forward) to replace the missing data (McCarthy 2004). We considered this method inappropriate and might introduce a bias in estimating the treatment effect. The three other studies did not report an ITT analysis and showed a statistically significant rate (greater than 10%) of dropouts (Mangione 1999;Ng 2010;Foroughi 2011). The last study reported no information on dropouts (Singh 2011).
The attrition rate at the end of exercise programs ranged from 0% to 32%. Overall, the proportion was larger with high‐ versus low‐intensity programs, except in one trial in which the attrition was larger in low‐ versus high‐intensity programs (32% versus 12%) (Ng 2010).
Selective reporting
We found the research protocol for two studies (Ng 2010; Foroughi 2011). We assessed four trials as at unclear risk of bias because they did not distinguish between primary and secondary outcomes or outcomes data was not reported in a valid format, or both (Mangione 1999;Jan 2008;Foroughi 2011;Singh 2011). We assessed the remaining two studies as at high risk of bias because additional outcomes data were reported in separate reports or were not reported in the final publication, or both (McCarthy 2004; Ng 2010). No studies were assessed as at low risk of bias.
Other potential sources of bias
The studies appeared to be free of other serious potential sources of bias. Only one of the included studies reported differences in compliance between the high‐ and low‐intensity interventions (Ng 2010). The compliance was lower for high‐intensity programs, which could have biased final results. We noted no difference in baseline participant characteristics. Of the six included studies, three did not report a source of funding (Jan 2008; Foroughi 2011; Singh 2011). Ng 2010 declared that Sanofi‐Aventis Consumer Health Care, a pharmaceutical company, supplied the study glucosamine intakes but did not report if it has another role in the trial. McCarthy 2004 and Mangione 1999reported that their trials were funded by the National Institute for Health Research and the Arthritis Foundation, respectively.
Effects of interventions
Summary of findings for the main comparison. Summary of findings table: Physical activity and exercise programs in osteoarthritis.
| Physical activity and exercise programs in osteoarthritis | ||||||
| Patient or population: People with hip or knee osteoarthritis Settings: Hospital or primary care Intervention: High‐ versus low‐intensity exercise programs | ||||||
| Outcomes | Illustrative comparative risks* (95% CI) | Relative effect (95% CI) | No of Participants (studies) | Quality of the evidence (GRADE) | Comments | |
| Assumed risk | Corresponding risk | |||||
| Control | High‐ versus low‐intensity exercise | |||||
| Pain (at study completion) WOMAC (VAS or NRS) from 0 to 20; lower scores mean reduced pain Follow‐up: 8 to 24 weeks | The mean pain (at study completion) in the control groups was 6.6 points | The mean pain (at study completion) in the intervention groups was 0.84 lower (1.63 to 0.04 lower) | ‐ | 313 (4 studies) | ⊕⊕⊝⊝ low1,2 | MD ‐0.84 (95% CI ‐1.63 to ‐0.04). Absolute mean reduction 4% with high intensity exercise programs (95% CI ‐8% more to 0% fewer). Relative reduction ‐13% (95% CI ‐25% more to 0% fewer). NNTB = 11 (95% CI 14 to 22)3,4 |
| Physical function (at study completion) WOMAC (self administered health status measure) from 0 to 68; lower scores mean better function Follow‐up: 8 to 24 weeks | The mean physical function (at study completion) in the control groups was 20.4 points | The mean physical function (at study completion) in the intervention groups was 2.65 lower (5.29 to 0.01 lower) | ‐ | 310 (4 studies) | ⊕⊕⊝⊝ low1,2 | MD ‐2.65 (95% CI ‐5.29 to ‐0.01). Absolute mean reduction 4% with high intensity exercise programs (95% CI ‐8% more to 0% fewer). Relative mean reduction 13% (95% CI ‐26% more to 0% fewer). NNTB = 10 (95% CI 8 to 13)4,5 |
|
Quality of life (at study completion)
EuroQol (VAS) from 0 to 200 mm; higher score means better function Follow‐up: 8 weeks |
The mean quality of life (at study completion) in the control groups was 66.7 mm | The mean quality of life (at study completion) in the intervention groups was 4.3 higher (6.5 to 15.2 higher) | ‐ | 214 (1 study) | ⊕⊝⊝⊝ very low1,2,6 | MD 4.3 (95% CI ‐6.5 to 15.2). Absolute mean improvement 2% (95% CI ‐3% fewer to 8% more). Relative improvement 6% (95% CI ‐10% fewer to 23% more). NNTB = NA4,7 |
| Adverse effects (related to the exercise programs) Follow‐up: 8 to 24 weeks | 22 per 1000 | 39 per 1000 (11 to 131 higher) | Peto OR 1.72 (0.51 to 5.81) | 364 (4 studies) | ⊕⊝⊝⊝ very low1,2,8,9 | Absolute risk reduction 2% fewer events with low intensity exercise programs (95% CI 11% fewer to ‐ 1% more). Relative risk reduction: 69% fewer with low intensity exercise progams (95% CI 425% more to ‐ 48% fewer). NNTH = 65 (95% CI NNTB 92 to NNTH 11)4 |
| Severe adverse events or withdrawals (due to adverse events) ‐ not reported | See comment | See comment | Not estimable | ‐ | See comment | 3 studies reported dropouts or withdrawals (due to adverse events). No severe adverse events were observed9 |
| *The basis for the assumed risk (e.g. the median control group risk across studies) is provided in footnotes. The corresponding risk (and its 95% confidence interval) is based on the assumed risk in the comparison group and the relative effect of the intervention (and its 95% CI). CI: confidence interval; MD: mean difference; NA: not applicable; NNTB: number needed to treat for an additional beneficial outcome; NNTH: number needed to treat for an additional harmful outcome; NRS: numeric rating scale; OR: odds ratio; SD: standard deviation; VAS: visual analog scale; WOMAC: Western Ontario and McMaster Universities Arthritis Index | ||||||
| GRADE Working Group grades of evidence High quality: Further research is very unlikely to change our confidence in the estimate of effect. Moderate quality: Further research is likely to have an important impact on our confidence in the estimate of effect and may change the estimate. Low quality: Further research is very likely to have an important impact on our confidence in the estimate of effect and is likely to change the estimate. Very low quality: We are very uncertain about the estimate. | ||||||
1 Downgraded because of lack of blinding. No intention‐to‐treat analysis. Incomplete outcome data. 2 Downgraded because of imprecision. 3 Calculations based on the control group baseline mean (SD) WOMAC pain: ‐1.54 (3.84) points on 0‐20 scale (from McCarthy 2004) and an assumed minimal clinically important difference of 4 points (Tubach 2012). 4 NNT for continuous outcomes calculated using the Wells calculator (from the CMSG Editorial office; http://musculoskeletal.cochrane.org/), and for dichotomous outcomes using the Cates NNT calculator (www.nntonline.net/visualrx/). 5 Calculations based on the control group baseline mean (SD) WOMAC function: ‐4.5 (14.7) points on 0‐68 scale (from McCarthy 2004) and an assumed minimal clinically important difference of 14 points (Tubach 2012). 6 Only one study reported EuroQol data. 7 Calculations based on the control group baseline mean (SD) EuroQol: 66.7 (18.2) points on 200 mm scale (from McCarthy 2004) and an assumed minimal clinically important difference of 15% of mean baseline. 8 Downgraded because of inconsistency (only 1 of 6 studies systematically monitored adverse effects. Unbalanced withdrawals across exercise groups and are > 10%). 9 Some studies did not report whether or not adverse events occurred in either group.
Summary of findings 2. Subgroup analysis: Exercise duration versus resistance in people with knee or hip osteoarthritis.
| Subgroup analysis: Exercise duration versus resistance in people with knee or hip osteoarthritis | ||||||
| Patient or population: People with knee or hip osteoarthritis Settings: Hospital or primary care Intervention: Subgroup analysis: exercise type of intensity (duration and resistance) | ||||||
| Outcomes | Illustrative comparative risks* (95% CI) | Relative effect (95% CI) | No of Participants (studies) | Quality of the evidence (GRADE) | Comments | |
| Assumed risk | Corresponding risk | |||||
| Control | Subgroup analysis: Exercise duration versus resistance | |||||
|
Pain ‐ duration exercise
WOMAC (VAS or Likert) from 0 to 20
Follow‐up: 8 to 12 weeks lower scores mean reduced pain |
The mean pain ‐ duration exercise in the control groups was 8.6 points | The mean pain ‐ duration exercise in the intervention groups was 1.37 lower (2.47 to 0.28 lower) | ‐ | 200 (2 studies) | ⊕⊝⊝⊝ very low1,2 | MD ‐1.37 (95% CI‐2.47 to ‐0.28). Absolute mean reduction 7% with high intensity exercise programs (95% CI ‐12% mor e to 1% fewer). Relative mean reduction 16% (95% CI ‐29% more to 3% fewer). NNTB = 11 (95% CI 9 to 14)3,4 |
|
Pain ‐ resistance exercise
WOMAC (VAS or Likert) from 0 to 20
Follow‐up: 8 to 24 weeks lower scores mean reduced pain |
The mean pain ‐ resistance exercise in the control groups was 4.6 points | The mean pain ‐ resistance exercise in the intervention groups was 0.23 lower (1.4 lower to 0.93 lower) | ‐ | 113 (2 studies) | ⊕⊝⊝⊝ very low1,2 | MD ‐0.23 (‐1.40 to 0.93). Absolute mean reduction 1% with high intensity exercise programs (95% CI ‐7% more to 5% fewer). Relative mean reduction 5% (95% CI ‐30% more to 20% fewer). NNTB = 17 (95% CI 13 to 22)4,5 |
|
Function ‐ duration exercise
WOMAC from 0 to 68
Follow‐up: 8 to 12 weeks lower scores mean better function |
The mean function ‐ duration exercise in the control groups was 27 points | The mean function ‐ duration exercise in the intervention groups was 4.10 lower (8.12 to 0.07 lower) | ‐ | 200 (2 studies) | ⊕⊝⊝⊝ very low1,2 | MD ‐4.1 (‐8.12 to ‐0.07). Absolute mean reduction 6% with high intensity exercise programs (95% CI ‐12% more to 0% fewer). Relative mean reduction 15% (95% CI ‐30% more to 0% fewer ). NNTB = 10 (95% CI 8 to 13)4,6 |
|
Function ‐ resistance exercise
WOMAC from 0 to 68
Follow‐up: 8 to 24 weeks lower scores mean better function |
The mean function ‐ resistance exercise in the control groups was 16.3 points | The mean function ‐ resistance exercise in the intervention groups was 1.57 lower (5.06 to 1.93 lower) | ‐ | 113 (2 studies) | ⊕⊕⊝⊝ low1,2 | MD ‐1.57 (‐5.06 to 1.93). Absolute mean reduction 2% with high intensity exercise programs (95% CI ‐7% more to 3% fewer). Relative mean reduction ‐10% (95% CI‐31% more to 12% fewer). NNTB = 18 (95% CI 14 to 23)4,7 |
| *The basis for the assumed risk (e.g. the median control group risk across studies) is provided in footnotes. The corresponding risk (and its 95% confidence interval) is based on the assumed risk in the comparison group and the relative effect of the intervention (and its 95% CI). CI: confidence interval; MD: mean difference; NA: not applicable; NNTB: number needed to treat for an additional beneficial outcome; NNTH: number needed to treat for an additional harmful outcome; NRS: numeric rating scale; SD: standard deviation; VAS: visual analog scale; WOMAC: Western Ontario and McMaster Universities Arthritis Index | ||||||
| GRADE Working Group grades of evidence High quality: Further research is very unlikely to change our confidence in the estimate of effect. Moderate quality: Further research is likely to have an important impact on our confidence in the estimate of effect and may change the estimate. Low quality: Further research is very likely to have an important impact on our confidence in the estimate of effect and is likely to change the estimate. Very low quality: We are very uncertain about the estimate. | ||||||
1 Downgraded because of lack of blinding. No intention‐to‐treat analysis. Incomplete outcome data. 2 Downgraded because of imprecision (large confidence interval with small sample size). 3 Calculations based on the control group baseline mean (SD) pain: 10.0 (3.7) points on 0‐20 scale (from McCarthy 2004). 4 NNT for continuous outcomes calculated using the Wells calculator (from the CMSG Editorial office; http://musculoskeletal.cochrane.org/), and for dichotomous outcomes using the Cates NNT calculator (www.nntonline.net/visualrx/). 5 Calculations based on the control group baseline mean (SD) pain: 7.8.0 (3.3) points on 0‐20 scale (from Jan 2008). 6 Calculations based on the control group baseline mean (SD) function: 30.8 (14.4) points on 0‐68 scale (from McCarthy 2004). 7 Calculations based on the control group baseline mean (SD) function: 26.1 (8.1) points on 0‐68 scale (from Jan 2008).
All studies reported means and standard deviation data for the outcomes at baseline and at the end of the intervention.
Primary outcomes
Pain
Four studies assessed pain on the WOMAC pain subscale at the end of the exercise program (McCarthy 2004; Jan 2008; Ng 2010; Foroughi 2011). Pooled analysis (Figure 3; Analysis 1.1) revealed a statistically significant reduction (mean difference (MD) (fixed‐effect model): ‐0.84, 95% confidence interval (CI) ‐1.63 to ‐0.04, I2 = 0%, P = 0.04, low‐quality evidence) on the 20‐point WOMAC pain scale for the high‐ versus low‐intensity exercise programs, an absolute reduction in pain of 4% (8% better to 0% worse), and relative reduction of 13% (25% better to 0% worse) (Table 1). Between‐study heterogeneity was negligible (I2= 0%). One study with 200 participants found a statistically significant reduction (MD ‐1.7 cm, 95% CI ‐1.9 to ‐1.4) on a 10‐cm VAS equivalent to a MD of ‐0.67 (95% CI ‐0.8 to ‐0.6) on a Likert scale (Singh 2011). One study of 39 participants found no statistically significant difference on the AIM2 pain subscale (MD ‐0.11, 95% CI ‐1.3 to 1.1) (Mangione 1999).
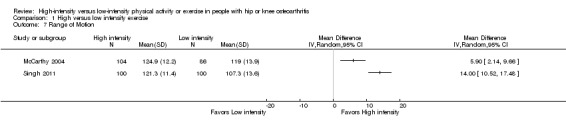
3.

Forest plot of comparison: 1 High‐ versus low‐intensity exercise, outcome: 1.1 Pain (WOMAC).
1.1. Analysis.

Comparison 1 High versus low intensity exercise, Outcome 1 Pain (WOMAC).
Two studies including 199 participants assessed pain with a high‐ versus low‐intensity exercise program at the mid‐term (six to 16 weeks) (McCarthy 2004;Ng 2010), and one study of 139 participants at the long‐term (40 weeks) after the end of the intervention (McCarthy 2004): there was difference at the mid‐term (MD ‐0.82, 95% CI ‐1.90 to 0.26, I2 = 41%, P = 0.14) and an effect at the long‐term (MD ‐1.33, 95% CI ‐2.56 to ‐0.10, P = 0.03). For these two studies, the programs varied in the amount of time spent in exercise (total program duration or session) between the groups.
Physical function
Five studies evaluated the effect of high‐ versus low‐intensity exercise programs on physical function. At the end of the exercise program, four studies including 313 participants reported a statistically significant mean reduction on the 68‐point WOMAC disability subscale (fixed‐effect model) of ‐2.65, 95% CI ‐5.29 to ‐0.01, I2 = 0%, P = 0.05, low‐quality evidence, for high‐ versus low‐intensity exercise (McCarthy 2004; Jan 2008; Ng 2010; Foroughi 2011) (Figure 4; Analysis 1.2), an absolute reduction in function of 4% (8% better to 0% worse) and relative reduction of 13% (26% better to 0% worse) (Table 1). Between‐study heterogeneity was negligible (I2= 0%). We did not include one study of 200 participants in the pooled analysis because we identified that the results were discordant and inconsistent (score ranged between 0 and 4) with the findings of the other four studies (Singh 2011). We requested of study authors how they scored the WOMAC function test. We received no additional information despite two requests (Appendix 7). Singh 2011 found a statistically significant difference between high‐ and low‐intensity programs for physical function (MD ‐0.51, 95% CI ‐0.6 to ‐0.4; lower score favoring high‐intensity exercise), which is unlikely to be of clinical significance.
4.

Forest plot of comparison: 1 High‐ versus low‐intensity exercise, outcome: 1.2 Physical Function (WOMAC).
1.2. Analysis.

Comparison 1 High versus low intensity exercise, Outcome 2 Physical Function (WOMAC).
Based upon data from two studies, we observed no statistical difference in physical function at mid‐term, McCarthy 2004 and Ng 2010, and long‐term, McCarthy 2004, between high‐ and low‐intensity exercise programs (Analysis 1.2).
Quality of life
One study ( McCarthy 2004 ) of 214 participants found no statistically significant difference between high‐ and low‐intensity exercise programs on quality of life measured by the EuroQol at the end of the intervention (MD 4.3, 95% CI ‐6.5 to 15.2, very low‐quality evidence), an absolute reduction in quality of life of 2% (8% better to ‐3% worse) and relative reduction of 6% (10% better to ‐23% worse) and in the mid‐term (MD ‐2.95%, CI ‐16.3 to 12.9) and long‐term (MD 0.9, 95% CI ‐13.0 to 14.7) (Table 1).
Safety
Serious adverse events or withdrawals due to adverse events
Three studies reported adverse events (Mangione 1999; Ng 2010; Foroughi 2011). Due to the limited number of events and lack of information, we decided not to pool the data. Ng 2010 and Foroughi 2011 reported the same number of dropouts or withdrawals between high‐ (n = 3) and low‐intensity exercise groups (n = 3). Dropouts were due to medical reasons. Mangione 1999 reported two adverse events (fall during the warm‐up session, hit the shin with the cycling pedal) without specifying the group in which events occurred. No severe adverse events were reported.
Adverse effects
Four studies including 364 participants provided information on adverse effects related to exercise programs (Analysis 1.3). Only one study with 54 participants declared systematic monitoring (Foroughi 2011). Three studies reported some adverse effects in the high intense groups : Jan 2008 (three), Foroughi 2011 (two), Ng 2010 (two). Adverse effects were primarily related to knee pain associated with an exercise program
1.3. Analysis.

Comparison 1 High versus low intensity exercise, Outcome 3 Adverse effects.
In our analysis of all reported data, the number of effects was not statistically different between the high‐ versus low‐intensity exercise programs (Peto odds ratio 1.72, 95% CI 0.51 to 5.81, I2 = 22%, P = 0.39, very low‐quality evidence) (Analysis 1.3),
Secondary outcomes
Gait speed
T hree studies reported gait speed (Mangione 1999; Jan 2008; Foroughi 2011). In two studies, no statistically significant difference was found between the high‐ and low‐intensity exercise programs in free walking speed (MD (random‐effects model): 0.04, 95% CI ‐0.05 to 0.13, I2 = 14%, P = 0.37) or fast walking speed in the short‐term (one trial, MD 0.08, 95% CI ‐0.13 to 0.29, P = 0.45) (Analysis 1.4). Jan 2008 reported data that we could not transform for the analysis. Between‐study heterogeneity was negligible (I2 = 14%).
1.4. Analysis.

Comparison 1 High versus low intensity exercise, Outcome 4 Gait speed.
Muscle strength
Many different muscle groups were tested, with heterogeneity in number of methods used to evaluate muscle strength. We then calculated the effect size using standardized mean difference (SMD) to allow for pooling data resulting from different units of measurement. Three studies of 285 participants reported muscle strength on the knee extensor (McCarthy 2004; Jan 2008; Foroughi 2011), and showed no statistically significant difference between high‐ and low‐intensity exercise programs immediately after treatment (SMD (random‐effects model): 0.38, 95% CI 0.04 to 0.72, I2 = 42%, P = 0.03) (Analysis 1.5), although with substantial statistical heterogeneity (I2 = 42%). Two studies of 113 participants found no statistically significant difference (SMD (random‐effects model): 0.18, 95% CI ‐0.64 to 1.00) on strength of knee flexor muscles immediately after treatment (Jan 2008;Foroughi 2011) (Analysis 1.5), with large statistical heterogeneity (I2 = 78%). Two studies of 245 participants measured global strength (Foroughi 2011; Singh 2011), and showed an improvement with high‐ versus low‐intensity exercise programs after treatment (SMD 1.01, 95% CI 0.74 to 1.27, I2 = 0%, P = 0.001). Between‐study heterogeneity was negligible (I2 = 0%).
1.5. Analysis.

Comparison 1 High versus low intensity exercise, Outcome 5 Muscle strength.
Aerobic capacity
One study of 39 participants found no statistically significant difference on aerobic capacity between the high‐ and low‐intensity exercise programs at the end of treatment (MD ‐1.40, 95% CI ‐4.2 to 1.4) (Mangione 1999) (Analysis 1.6). We considered this studyas at high risk of bias because of the lack of blinding and high attrition (30% in the two groups).
1.6. Analysis.

Comparison 1 High versus low intensity exercise, Outcome 6 Aerobic capacity.
Range of motion
Two studies, of 190 and 200 participants, reported statistically significant effects of high‐ versus low‐intensity exercise programs on range of motion (McCarthy 2004;Singh 2011). As the data showed signs of heterogeneity (I2 = 92%), we did not pool the data (Analysis 1.7).
1.7. Analysis.
Comparison 1 High versus low intensity exercise, Outcome 7 Range of Motion.
Physical activity level and number of steps
Only one study reported the two outcomes (Ng 2010). Data were incomplete. We performed no analysis for these twp outcomes.
Subgroup analysis
We conducted subgroup analyses ( Figure 5 , Figure 6) to explore possible differences in pooled MDs for immediate post‐treatment on pain and physical function outcomes according to the type of intensity of exercise programs (time and level of resistance).
5.

Forest plot of comparison: 2 Subgroup analysis: Exercise duration versus resistance, outcome: 2.1 WOMAC Pain.
6.

Forest plot of comparison: 2 Subgroup analysis: Exercise duration versus resistance, outcome: 2.2 Physical Function.
Pain
Subgroup analysis ( Analysis 2.1 ) showed a statistical significant difference (MD ‐1.37, 95% CI ‐2.47 to ‐0.28, I2 = 0%, P = 0.01, absolute mean reduction 7%, very low‐quality evidence). With different amounts of time spent in exercise programs, pain on the 20‐point WOMAC pain scale was lower with higher than with lower intensity exercise.This finding did not seem to be of clinical significance. No statistical significant differences was found for amount of resistance (MD ‐0.23, 95% CI ‐1.40 to 0.93, I2 = 0%, P = 0.71, absolute mean reduction 1%, very low‐quality evidence) ( Table 2).
2.1. Analysis.

Comparison 2 Subgroup analysis: Exercise duration versus resistance, Outcome 1 Pain.
Physical Function
Subgroup analysis ( Analysis 2.2 ) showed a statistically significant difference (MD ‐4.10, 95% CI ‐8.12 to ‐0.07, I2 = 0%, P = 0.05, absolute mean reduction 6%, very low‐quality evidence) on the 68‐point WOMAC disability subscale.
2.2. Analysis.

Comparison 2 Subgroup analysis: Exercise duration versus resistance, Outcome 2 Function.
This finding did not seem to be of clinical significance. High‐ and low‐intensity exercise programs did not differ statistically in the effect of resistance (MD ‐1.57, 95% CI ‐5.06 to 1.93, I2 = 33%, P = 0.38, absolute mean reduction 2%, very low‐quality evidence).
Adverse events
No statistical difference was found between the subgroup exercise programs ( Analysis 2.3).
2.3. Analysis.

Comparison 2 Subgroup analysis: Exercise duration versus resistance, Outcome 3 Adverse effects.
We did not conduct other subgroup analyses as described in the protocol, as we found that data were insufficient.
Sensitivity analysis
The results were robust on excluding one trial, Ng 2010, that included participants with hip and knee osteoarthritis (results not shown).
Discussion
Summary of main results
The main purpose of this review was to evaluate the effect of high‐ versus low‐intensity physical activity or exercise programs on reducing pain and improving physical function and quality of life for people with hip or knee osteoarthritis. We characterized the intensity of an activity or an exercise program either by the overall amount of training time (duration, number of sessions) or the amount of resistance (strength or effort). We included six studies involving 656 participants.
Based upon low‐quality evidence, we found a small improvement in pain and function of high‐intensity compared to low‐intensity exercise programs in people with knee osteoarthritis, but this is unlikely to be of clinical importance. We are uncertain of the effect on quality of life.The pooled analysis showed small statistical effect sizes for pain (0.84 points) on a 20‐point WOMAC scale and physical function (2.65 points) on a 68‐point WOMAC scale. The minimal clinically important difference values we used for the WOMAC measures were 15% for absolute improvement and 20% for relative improvement (Tubach 2012). The statistically significant differences we observed between high‐ and low‐intensity exercise were much smaller, and therefore unlikely to be of clinical significance. In addition, the effects of high‐intensity exercise were found only in the short‐term after treatment. Based upon very low‐quality evidence, we found a statistically significant difference in subgroup analyses depending on the type of intensity of exercise programs (time and level of resistance). However, these findings were unlikely to be of clinical importance.
In most of the included trials adverse events were poorly monitored and poorly reported. We are uncertain as to whether higher‐intensity exercise programs may induce more harmful effects than lower‐intensity programs. We downgraded the evidence from high to low or very low because of the risk of bias, imprecision (small number of studies or participants, large confidence interval, small effects), and inconsistency in the reporting of adverse effects.
Overall completeness and applicability of evidence
Our evidence is limited to exercise programs for participants with knee osteoarthritis. We did not perform a meta‐analysis of physical activity interventions or participants with hip osteoarthritis because of the lack of data. Generalization of our findings to other populations should be limited. Most participants in the included trials were women (greater than 70%), confirming the gender differences noted in the prevalence of knee osteoarthritis (O'Connor 2007). However, the extracted data did not allow us to consider gender‐related differences in the evaluation of the effectiveness of exercise programs. We were also unable to determine whether knee osteoarthritis severity plays a role. More research is needed into the potential impact of disease severity on the effects of exercise programs.
All included studies assessed a variety of interventions, with different levels of intensity. The type of exercise programs differed among the six studies. None of the studies compared the same exercise interventions. Programs included walking (Ng 2010), cycling (Mangione 1999), global muscle strengthening (McCarthy 2004), dynamic resistance training (Jan 2008; Foroughi 2011), and isometric resistance training (Singh 2011). We could not determine the optimal type of exercise.
The studies assessed a variety of outcome measures relating to pain, physical function, quality of life, and physical performance. The outcomes measured often differed between studies. For pain (4 studies) and physical function (5 studies), the WOMAC scales were most commonly used (see Table 3). The same outcome (that is WOMAC pain or disability subscore) was sometimes available in different units (Likert, visual analog scale, or numeric rating scale) or different scales, and we had to rescale the data to pool the measures in the analysis.
Apart from pain and physical function, quality of life and adverse events were the main outcomes assessed in the studies. However, only one study specified quality of life as an outcome, and few studies (n = 3) reported information on any adverse events. In addition, only one study reported the secondary outcomes we examined. Finally, the results were limited to short‐term effects because a limited number of studies reported follow‐up assessments for longer times
Quality of the evidence
We found limitations in the included studies inherent to study design (lack of blinding, incomplete data reporting, no intention‐to‐treat (ITT) analysis) and imprecision (inadequate and small sample sizes, and small number of studies).
We found the overall quality of evidence to be low for pain and physical function to very low for adverse effects for the primary outcomes using the GRADE approach. Most of the studies had an unclear or high risk of bias for several domains. We downgraded most studies (n = 5) to high risk of bias for performance, detection, and attrition bias because of lack of blinding and incomplete outcome data, which can affect the quality of the randomization. Given that the primary outcomes of this review were participant self reported pain and physical function, the treatment effect sizes may be inflated. We assessed potential bias due to incomplete outcome data as at high risk of bias because of the lack of ITT analysis and high level of attrition (see Characteristics of included studies).
Although sample size does not contribute to the assessment of study risk of bias, most of the included six studies were underpowered to provide clear answers, and we downgraded evidence because of imprecision. Three studies had small sample sizes (less than 100 participants), and two did not report a prospective sample size calculation. Due to the small sample sizes, we are unclear whether the recruited participants represent all people with knee osteoarthritis. The intervention may benefit only a subset of people (that is selection bias)
Despite performing an extensive search, we included a limited number of studies (n = 6). We were unable to estimate the impact of publication bias on our results.
Potential biases in the review process
The studies included in this review form the best available evidence for the review question. We conducted an extensive search of the literature in all relevant databases and included six studies of interventions for exercise programs in participants with knee osteoarthritis. We also identified two ongoing trials for potential additional data. We made all attempts to reduce the bias involved with the review process. For missing data, we made attempts to extract data that were graphically displayed using software tools (that is http://arohatgi.info/WebPlotDigitizer/index.html) or to gather the information from authors of the included studies.
Agreements and disagreements with other studies or reviews
Systematic reviews, Wang 2012, Uthman 2013, and Juhl 2014, and recommendations, Fernandes 2013, investigating the effects of exercise programs for knee osteoarthritis have been published, and have reported that exercise programs are effective for reducing pain and improving functional outcome in people with knee osteoarthritis. However, we lack information regarding the optimal intensity of exercise for people with knee or hip osteoarthritis. Only a few studies have directly compared different intensities of exercise programs, and the type of exercise varied widely, so specifying the required dose for optimal benefit for symptoms of lower‐limb osteoarthritis is difficult.
Previous systematic reviews of exercise suggested a relationship between the time spent in an exercise program and the size of outcomes for various health conditions such as stroke, in Veerbeek 2014, or back pain, in Ferreira 2010. A similar (positive dose–response) relationship between the time spent in the exercise program (number of supervised exercise sessions and session duration) and the effect size for pain was reported by Juhl 2014 when considering only aerobic exercise in the meta‐regression analysis. However, this evidence was obtained from indirect comparisons, with a global effect size computed by meta‐regression (EUnetHTA 2013). All randomized controlled trials we included compared exercise programs for which participants were randomized to a high‐ or low‐intensity group (direct comparisons) within each study. This situation is reinforced by the results found by indirect comparisons and adds confidence to the findings.
In a meta‐analysis considering only the exercise programs based on resistance, Juhl 2014 found no statistically significant regression coefficients on meta‐regression analysis of intensity resistance or effort, but equally by length of exercise program, number of supervised sessions, duration of individual supervised sessions, or number of sessions per week as covariates. This absence of the effect of high‐intensity strength training of the lower limb was also reported in a study of older adults (Raymond 2013). In our subgroup analysis, we also found no statistically significant difference between level of intensity with resistance exercises with the same length of program. Resistance exercises seem to have a positive impact on muscle strength improvements in healthy elderly, in Fiatarone Singh 2004 and Porter 2006, or rheumatoid patient population, in Baillet 2012. Furthermore, there is a large body of evidence for many years showing changes in strength and muscle composition in relation to different intensities (Beijersbergen 2013).
Strengthening may also be effective in people with knee osteoarthritis, but we lack data favoring a greater effect of exercise with high versus low resistance. The intensity of exercises for both groups may not have been separated enough to differentiate between the loadings achieved by the study groups. Future studies should investigate a specific exercise program designed for a sham‐exercise group, whereby the joint receives low loading.
Adverse events have been reported during exercising (Chilibeck 2011). Recently, some data have suggested that physical exercise may induce adverse effects in knee joints of animals (Siebelt 2014). High‐resistance exercise should perhaps be used with caution, particularly for people with depleted cartilage or severity stage of osteoarthritis. The lack of evidence of the beneficial effect of high resistance suggests a preference for moderate resistance in strengthening exercises for people with knee osteoarthritis, but with a long‐duration program.
Authors' conclusions
Implications for practice.
We found very low‐ to low‐quality evidence for no important clinical benefit of high‐intensity compared to low‐intensity exercise programs in improving pain and physical function in the short term. We did not find important clinical difference in subgroup analyses depending on the type of intensity of exercise programs (time and level of resistance).
We are unable to make a conclusion about the effects for quality of life between high‐ and low‐intensity exercise programs. Adverse events related to exercise were minor, but they were poorly recorded. It is uncertain if higher‐intensity exercise programs may induce more harmful effects than lower‐intensity programs; this must be evaluated by further studies.
Our review highlights the need for better reporting of exercise programs in clinical trials with explicit descriptions that enable replication (Slade 2012). We could not investigate the effect of other exercise characteristics (for example delivery modalities such as supervision or mono‐ or multi‐modal exercise). Studies directly comparing prescriptive elements (modality, intensity, duration of exercise) are critically needed to advance this field.
Implications for research.
The small number of studies comparing high‐ and low‐intensity exercise programs in osteoarthritis underscores the need for more studies to investigate the dose–response relationship. More research is required to further study the potential impact of clinical characteristics of participants in terms of gender and disease severity on the effects of an exercise program.
The i ncluded s tudies did not provide any justification for the levels of intensity of exercise programs. No authors reported evidence for the minimal and maximal intensity that could be delivered. We could not ensure that exercise of sufficient intensity was performed because exercises performed at high resistance failed to increase muscle strength of knee extensor or knee flexor, in Jan 2008 and Foroughi 2011, or aerobic capacity, in Mangione 1999. The difference (small or large) between the high‐ and low‐intensity programs varied across studies. The differences may be insufficient to induce any effects, particularly for resistance exercise programs. In particular, further studies are needed to establish the minimal effective intensity of programs required to produce a clinical effect and the highest intensity that patients can tolerate. Dose selection should be better justified, especially when the suboptimal dose is unknown.
Clinical studies in the field of rehabilitation should be carefully designed and follow the most recent Consolidated Standards of Reporting Trials (CONSORT) guidelines to report their data. Most studies included in this review did not use ITT analysis, concealed allocation, or blinding of assessors or did not report data on common outcome measures. In addition, specific designs can also be considered to address some limitations that traditional randomized controlled trials face, such as the small number of participants in clinical trials of rehabilitation (Graham 2012).
Acknowledgements
The review authors are grateful to Louise Falzon, the Trials Search Co‐ordinator for the Cochrane Musculoskeletal Group, for her assistance in designing the search strategy, and to Pr Serge Poiraudeau for his comments.
We thank Dr Elizabeth Tanjong Ghogomu and Lara Maxwell, Cochrane Musculoskeletal Review Group, for their valuable comments and expert advice.
We also thank Dr Ann Moseley for help searching studies.
Appendices
Appendix 1. MEDLINE search strategy
1. osteoarthritis/
2. (degenerative adj2 arthritis).tw.
3. (osteoarthr$ or arthrosis).tw.
4. or/1‐3
5. Knee/
6. exp Knee Joint/
7. knee$.tw.
8. Hip/
9. Hip Joint/
10. (hip or hips).tw.
11. or/5‐10
12. 4 and 11
13. Osteoarthritis, Knee/
14. Osteoarthritis, Hip/
15. or/12‐14
16. exp Exercise/
17. exp Exercise Movement Techniques/
18. exp Exercise Therapy/
19. Rehabilitation/
20. exp Motor Activity/
21. exercis$.tw.
22. physical activit$.tw.
23. strength$.tw.
24. ((isometric$ or isokinetic$ or aerobic$ or endurance or weigh$ or resistance) adj3 (train$ or therap$ or rehab$ or program$)).tw.
25. ((high or low) adj (intens$ or impact or dose$ or amount$)).tw.
26. Physical Therapy Modalities/
27. (physical ther$ or physiother$).tw.
28. (run$ or jog$ or walk$ or treadmill$ or cycl$ or row$ or gait).tw.
29. or/16‐28
30. randomized controlled trial.pt.
31. controlled clinical trial.pt.
32. randomized.ab.
33. placebo.ab.
34. drug therapy.fs.
35. randomly.ab.
36. trial.ab.
37. groups.ab.
38. or/30‐37
39. (animals not (humans and animals)).sh.
40. 38 not 39
41. and/15,29,40
Appendix 2. EMBASE search strategy
1. osteoarthritis/
2. (degenerative adj2 arthritis).tw.
3. (osteoarthr$ or arthrosis).tw.
4. or/1‐3
5. knee/
6. knee$.tw.
7. hip/
8. (hip or hips).tw.
9. or/5‐8
10. 4 and 9
11. knee osteoarthritis/
12. hip osteoarthritis/
13. or/10‐12
14. exp exercise/
15. exp kinesiotherapy/
16. rehabilitation/
17. exp motor activity/
18. exercis$.tw.
19. physical activit$.tw.
20. strength$.tw.
21. ((isometric$ or isokinetic$ or aerobic$ or endurance or weigh$ or resistance) adj3 (train$ or therap$ or rehab$ or program$)).tw.
22. ((high or low) adj (intens$ or impact or dose$ or amount$)).tw.
23. exp physiotherapy/
24. (physical ther$ or physiother$).tw.
25. (run$ or jog$ or walk$ or treadmill$ or cycl$ or row$ or gait).tw.
26. or/14‐25
27. 13 and 26
28. (random$ or placebo$).ti,ab.
29. ((single$ or double$ or triple$ or treble$) and (blind$ or mask$)).ti,ab.
30. controlled clinical trial$.ti,ab.
31. RETRACTED ARTICLE/
32. or/28‐31
33. (animal$ not human$).sh,hw.
34. 32 not 33
35. 27 and 34
Appendix 3. CENTRAL search strategy
#1 MeSH descriptor Osteoarthritis, this term only
#2 degenerative Near/2 arthritis:ti,ab
#3 (osteoarthr* or arthrosis):ti,ab
#4 (#1 OR #2 OR #3)
#5 MeSH descriptor Knee, this term only
#6 MeSH descriptor Knee Joint explode all trees
#7 knee*:ti,ab
#8 MeSH descriptor Hip, this term only
#9 MeSH descriptor Hip Joint, this term only
#10 (hip or hips):ti,ab
#11 (#5 OR #6 OR #7 OR #8 OR #9 OR #10)
#12 (#4 AND #11)
#13 MeSH descriptor Osteoarthritis, Knee, this term only
#14 MeSH descriptor Osteoarthritis, Hip, this term only
#15 (#12 OR #13 OR #14)
#16 MeSH descriptor Exercise explode all trees
#17 MeSH descriptor Exercise Movement Techniques explode all trees
#18 MeSH descriptor Exercise Therapy explode all trees
#19 MeSH descriptor Rehabilitation, this term only
#20 MeSH descriptor Motor Activity explode all trees
#21 exercis*:ti,ab
#22 physical activit*:ti,ab
#23 strength*:ti,ab
#24 ((isometric* or isokinetic* or aerobic* or endurance or weigh* or resistance) near/3 (train* or therap* or rehab* or program*)):ti,ab
#25 ((high or low) next (intens* or impact or dose* or amount*)):ti,ab
#26 MeSH descriptor Physical Therapy Modalities explode all trees
#27 (physical ther* or physiother*):ti,ab
#28 (run* or jog* or walk* or treadmill* or cycl* or row* or gait):ti,ab
#29 (#16 OR #17 OR #18 OR #19 OR #20 OR #21 OR #22 OR #23 OR #24 OR #25 OR #26 OR #27 OR #28)
#30 (#15 AND #29)
Appendix 4. CINAHL search strategy
S1 (MH "Osteoarthritis")
S2 TI degenerative N2 arthritis OR AB degenerative N2 arthritis
S3 TI osteoarthr* or AB arthrosis OR TI osteoarthr* OR AB arthrosis
S4 S1 or S2 or S3
S5 (MH "Knee")
S6 (MH "Knee Joint+")
S7 TI knee* OR AB knee*
S8 (MH "Hip")
S9 (MH "Hip Joint")
S10 TI hip OR TI hips OR AB hip OR AB hips
S11 S5 or S6 or S7 or S8 or S9 or S10
S12 S4 and S11
S13 (MH "Osteoarthritis, Knee")
S14 (MH "Osteoarthritis, Hip")
S15 S12 or S13 or S14
S16 (MH "Exercise+")
S17 (MH "Therapeutic Exercise")
S18 (MH "Rehabilitation")
S19 (MH "Motor Activity+")
S20 TI exercis* OR AB exercis*
S21 TI physical activit* OR AB physical activit*
S22 TI strength* OR AB strength*
S23 TI Isometric* N3 train* OR AB Isometric* N3 train*
S24 TI Isokinetic* N3 train* OR AB Isokinetic* N3 train*
S25 TI Aerobic* N3 train* OR AB Aerobic* N3 train*
S26 TI endurance N3 train* OR AB endurance N3 train*
S27 TI weigh* N3 train* OR AB weigh* N3 train*
S28 TI resistance N3 train* OR AB resistance N3 train*
S29 TI Isometric* N3 therap* OR AB Isometric* N3 therap*
S30 TI Isokinetic* N3 therap* OR AB Isokinetic* N3 therap*
S31 TI Aerobic* N3 therap* OR AB Aerobic* N3 therap*
S32 TI endurance N3 therap* OR AB endurance N3 therap*
S33 TI weigh* N3 therap* OR AB weigh* N3 therap*
S34 TI resistance N3 therap* OR AB resistance N3 therap*
S35 TI Isometric* N3 rehab* OR AB Isometric* N3 rehab*
S36 TI Isokinetic* N3 rehab* OR AB Isokinetic* N3 rehab*
S37 TI Aerobic* N3 rehab* OR AB Aerobic* N3 rehab*
S38 TI endurance N3 rehab* OR AB endurance N3 rehab*
S39 TI weigh* N3 rehab* OR AB weigh* N3 rehab*
S40 TI resistance N3 rehab* OR AB resistance N3 rehab*
S41 TI Isometric* N3 program* OR AB Isometric* N3 program*
S42 TI Isokinetic* N3 program* OR AB Isokinetic* N3 program*
S43 TI Aerobic* N3 program* OR AB Aerobic* N3 program*
S44 TI endurance N3 program* OR AB endurance N3 program*
S45 TI weigh* N3 program* OR AB weigh* N3 program*
S46 TI resistance N3 program* OR AB resistance N3 program*
S47 TI high intens* OR AB high intens*
S48 TI high impact OR AB high impact
S49 TI high dose* OR AB high dose*
S50 TI high amount* OR AB high amount*
S51 TI low intens* OR AB low intens*
S52 TI low impact OR AB low impact
S53 TI low dose* OR AB low dose*
S54 TI low amount* OR AB low amount*
S55 (MH "Physical Therapy+")
S56 TI physical ther* or TI physiother* OR AB physical ther* or AB physiother*
S57 TI run* OR AB run* OR TI jog* OR AB jog* or TI walk* OR AB walk* OR TI treadmill* OR AB treadmill* OR TI cycl* OR AB cycl* OR TI row* or AB row* OR TI gait OR AB gait
S58 S16 or S17 or S18 or S19 or S20 or S21 or S22 or S23 or S24 or S25 or S26 or S27 or S28 or S29 or S30 or S31 or S32 or S33 or S34 or S35 or S36 or S37 or S38 or S39 or S40 or S41 or S42 or S43 or S44 or S45 or S46 or S47 or S48 or S49 or S50 or S51 or S52 or S53 or S54 or S55 or S56 or S57 S59 S15 and S58
Appendix 5. PEDro search strategy
1.Osteoarthritis OR arthritis (title or abstract)
2. Hip OR Knee (body part)
3 Exercise OR Physical Activity (title or abstract)
4 Training OR hydrotherapy, balneotherapy OR skill training OR strength training (therapy)
5. 3 OR 4
6 Systematic Review OR Clinical Trial (method)
7. 1 AND 2 AND 5 AND 6
Appendix 6. SCOPUS search strategy
1 TITLE‐ABS‐KEY(osteoarthr* OR degenerative arthritis OR arthrosis)
2 TITLE‐ABS‐KEY(hip OR hips OR knee*)
3 TITLE‐ABS‐KEY(exercis* OR physical activit* OR strength* OR isometric* train* OR isokinetic* train* OR aerobic* train* OR endurance train* OR weigh* train* OR resistance train* OR isometric* therap* OR isokinetic* therap* OR aerobic* therap* OR endurance therap* OR weigh* therap* OR resistance therap* OR isometric* rehab* OR isokinetic rehab* OR aerobic* rehab* OR endurance rehab* OR weigh* rehab* OR resistance rehab* OR isometric program* OR isokinetic program* OR aerobic* program* OR endurance program* OR weigh* program* OR resistance program*)
4 TITLE‐ABS‐KEY(high intens* OR low intens* OR high impact OR low impact OR high dose* OR low dose* OR high amount* OR low amount*)
5 TITLE‐ABS‐KEY(physical ther* OR physiother* OR run* OR jog* OR walk* OR treadmill* OR cylc* OR row* OR gait)
6 3 OR 4 OR 5
7 1 AND 2 AND 6
8 Limit 7 to Conference Paper
Appendix 7. Survey of authors’ reactions to provide information on trials
| [Study ID] | [Study author contacted] | [Study author replied] | Current status | |
| Teixeira 2011 | 26/06/2013 | 28/06/2013 | provided more data | |
| Ng 2010 | 15/07/2013 | 16/07/2013 | provided more data | |
| Foroughi 2011 | 04/10/2013 | 08/10/2013 | provided more data | |
| Singh 2011 | 10/03/2014 | no contact | no data provided | |
| Messier 2011 | 06/11/2013 | 07/11/2013 | data not available | |
| Pua 2012 | 06/11/2013 | 07/11/2013 | data not available | |
| Østerås 2012 | 06/11/2013 | 07/11/2013 | data not available | |
| Steinhilber 2012 | 13/11/2013 | No contact | data not available |
Data and analyses
Comparison 1. High versus low intensity exercise.
| Outcome or subgroup title | No. of studies | No. of participants | Statistical method | Effect size |
|---|---|---|---|---|
| 1 Pain (WOMAC) | 4 | Mean Difference (IV, Fixed, 95% CI) | Subtotals only | |
| 1.1 at study completion | 4 | 313 | Mean Difference (IV, Fixed, 95% CI) | ‐0.84 [‐1.63, ‐0.04] |
| 1.2 at mid term | 2 | 199 | Mean Difference (IV, Fixed, 95% CI) | ‐0.82 [‐1.90, 0.26] |
| 1.3 at long‐term | 1 | 138 | Mean Difference (IV, Fixed, 95% CI) | ‐1.33 [‐2.56, ‐0.10] |
| 2 Physical Function (WOMAC) | 4 | Mean Difference (IV, Fixed, 95% CI) | Subtotals only | |
| 2.1 at study completion | 4 | 313 | Mean Difference (IV, Fixed, 95% CI) | ‐2.65 [‐5.29, ‐0.01] |
| 2.2 at mid term | 2 | 199 | Mean Difference (IV, Fixed, 95% CI) | ‐2.95 [‐7.00, 1.10] |
| 2.3 at long‐term | 1 | 138 | Mean Difference (IV, Fixed, 95% CI) | ‐4.20 [‐9.32, 0.92] |
| 3 Adverse effects | 4 | 364 | Peto Odds Ratio (Peto, Fixed, 95% CI) | 1.72 [0.51, 5.81] |
| 4 Gait speed | 3 | Mean Difference (IV, Random, 95% CI) | Subtotals only | |
| 4.1 Free walking speed | 2 | 77 | Mean Difference (IV, Random, 95% CI) | 0.04 [‐0.05, 0.13] |
| 4.2 Fast walking speed | 2 | 107 | Mean Difference (IV, Random, 95% CI) | 0.08 [‐0.13, 0.29] |
| 5 Muscle strength | 4 | Std. Mean Difference (IV, Random, 95% CI) | Subtotals only | |
| 5.1 Knee extensor | 3 | 285 | Std. Mean Difference (IV, Random, 95% CI) | 0.38 [0.04, 0.72] |
| 5.2 Knee Flexor | 2 | 113 | Std. Mean Difference (IV, Random, 95% CI) | 0.18 [‐0.64, 1.00] |
| 5.3 Global strength | 2 | 245 | Std. Mean Difference (IV, Random, 95% CI) | 1.01 [0.74, 1.27] |
| 6 Aerobic capacity | 1 | Mean Difference (IV, Fixed, 95% CI) | Totals not selected | |
| 7 Range of Motion | 2 | Mean Difference (IV, Random, 95% CI) | Totals not selected |
Comparison 2. Subgroup analysis: Exercise duration versus resistance.
| Outcome or subgroup title | No. of studies | No. of participants | Statistical method | Effect size |
|---|---|---|---|---|
| 1 Pain | 4 | Mean Difference (IV, Fixed, 95% CI) | Subtotals only | |
| 1.1 Duration exercise | 2 | 200 | Mean Difference (IV, Fixed, 95% CI) | ‐1.37 [‐2.47, ‐0.28] |
| 1.2 Resistance exercise | 2 | 113 | Mean Difference (IV, Fixed, 95% CI) | ‐0.23 [‐1.40, 0.93] |
| 2 Function | 4 | Mean Difference (IV, Fixed, 95% CI) | Subtotals only | |
| 2.1 Duration exercise | 2 | 200 | Mean Difference (IV, Fixed, 95% CI) | ‐4.10 [‐8.12, ‐0.07] |
| 2.2 Resistance exercise | 2 | 113 | Mean Difference (IV, Fixed, 95% CI) | ‐1.57 [‐5.06, 1.93] |
| 3 Adverse effects | 5 | Odds Ratio (IV, Fixed, 95% CI) | Subtotals only | |
| 3.1 Duration exercise | 2 | 242 | Odds Ratio (IV, Fixed, 95% CI) | 0.62 [0.11, 3.64] |
| 3.2 Resistance Exercise | 3 | 161 | Odds Ratio (IV, Fixed, 95% CI) | 3.68 [0.55, 24.73] |
Characteristics of studies
Characteristics of included studies [ordered by study ID]
Foroughi 2011.
| Methods | Randomized Controled Trial (RCT) with 2 groups | |
| Participants | Location: Australia Randomized: 54 Age: mean 65.5 years Sample: 54 women with knee primary osteoarthritis Settings: academic, monocenter Inclusion criteria: women > 40 years old with primary osteoarthritis of at least 1 knee, following ACR criteria Exclusion criteria: secondary osteoarthritis, joint injury, injection or surgery within the past 6 months or joint replacement, already participated in structured exercise, contraindications to exercise and/or function al magnetic resonance imagery (fMRI) , severe functional limitation or cognitive impairment |
|
| Interventions | Intensity: Exercise program with different levels of strength resistance High resistance (n = 26): frequency: 3 times/week * 24 weeks; session duration: 30 min; intensity: trained at 80% of their peak muscle strength with 8 repetitions * 3 sets Progression: 3% increments in resistance per session as tolerated Low resistance (n = 28): frequency: 3 times/week * 24 weeks; session duration: 30 min; intensity: minimal resistance was set and no progression with 8 repetitions * 2 sets Supervision: an experienced physiologist |
|
| Outcomes | At 24 weeks: WOMAC (pain, physical function, global), adverse events, walking speed, muscle strength (unilateral knee extension, bilateral knee flexion, leg press) A Likert scale (range 0‐20 or 0‐68) in WOMAC |
|
| Notes |
|
|
| Risk of bias | ||
| Bias | Authors' judgement | Support for judgement |
| Random sequence generation (selection bias) | Low risk | Quote: "participants were randomly allocated using a computer randomization program." |
| Allocation concealment (selection bias) | Unclear risk | Quote: "A co‐investigator uninvolved in participant testing or training managed the randomization procedure." Comment: It is unclear if the sequence of randomization was concealed from the investigator enrolling participants |
| Blinding of participants and personnel (performance bias) All outcomes | Unclear risk | Quote: "All participants were blinded to the investigator’s hypothesis." Comment: Staff were not blinded. It unclear how this influenced the data |
| Blinding of outcome assessment (detection bias) Subjective | Low risk | Comment: Performance was measured by a 3D motion acquisition system. It is unlikely that this provided risk of bias, even though the outcome assessor was not blinded |
| Blinding of outcome assessment (detection bias) Objective | Low risk | Comment: Performance was measured through a 3D motion acquisition system. It is unlikely that this provided risk of bias, even though the outcome assessor was not blinded |
| Incomplete outcome data (attrition bias) All outcomes | High risk | Comment: Unbalanced drop‐out rate, >10%. No imputation method used. No ITT analysis, which might introduce a bias |
| Selective reporting (reporting bias) | Unclear risk | Comment: Trial registered (ACTRv12605000116628). All outcomes specified in the protocol were separately reported in the 2 publications. It is unclear how this could influence the data |
| Other bias | Low risk | Comment: There is no indication that there are other important risks of bias. Power sample size calculation provided |
Jan 2008.
| Methods | RCT with 3 groups ITT analysis |
|
| Participants | Location: Taiwan Randomized: 102 Age: mean 62.6 years Sample: 79 females and 19 males with knee osteoarthritis Settings: university hospital, monocenter Inclusion criteria: > 50 years old, knee pain and osteophytes confirmed by radiography, osteoarthritis grade 3 on the Kellgren‐Lawrence classification, history of pain > 6 months, no NSAIDs during the study Exclusion criteria: knee physical therapy 3 months prior, other problems with knee joint, neuropathy, unstable medical conditions |
|
| Interventions | Intensity: Exercise program with different levels of strength resistance High resistance (n = 34): frequency: 3 times/week * 8 weeks; session duration: 30 min; intensity: trained at 60% of 1RM (about 45 to 50 kg) with 8 repetitions * 3 sets Low resistance (n = 34): frequency: 3 times/week * 8 weeks; session duration: 50 min; intensity: trained at 10% 1RM (about 7 to 10 kg) with 15 repetitions * 10 sets Progression: every 2 weeks 1RM was retested and increased by 5% as tolerated in each group Control group (n = 34): received no exercise Supervision: an experienced therapist |
|
| Outcomes | At 8 weeks: WOMAC (pain, physical function), walking time (level ground, stairs, figure‐eight pattern, spongy surface), muscle strength (flexion and extension of the knee; torque tested at 60, 120, and 180°/s). A Likert scale (range 0‐20 or 0‐68) for the WOMAC | |
| Notes |
|
|
| Risk of bias | ||
| Bias | Authors' judgement | Support for judgement |
| Random sequence generation (selection bias) | Low risk | Quote: "using a random numbers table from a random integer generator" |
| Allocation concealment (selection bias) | Unclear risk | Comment: Unclear if the list of randomization is concealed |
| Blinding of participants and personnel (performance bias) All outcomes | High risk | Comment: Participants and staff were not blinded |
| Blinding of outcome assessment (detection bias) Subjective | High risk | Comment: Participants not blinded |
| Blinding of outcome assessment (detection bias) Objective | Low risk | Quote: "All evaluations were performed by the same examiner, who was unaware of the participants’ group assignments." |
| Incomplete outcome data (attrition bias) All outcomes | High risk | Quote: "3 participants in HR group discontinued the exercise intervention due to severe knee pain. We speculate that the intensity and repetitions of the resistance training might be 2 factors influencing the training effect in patients with knee osteoarthritis" Comment: Despite an ITT analysis, the drop‐out rate was unbalanced between the 2 groups (3 vs 0) and seems related to the intervention. No imputation technique was described |
| Selective reporting (reporting bias) | Unclear risk | Comment: Insufficient information. No protocol registration. Major and minor outcomes are not specified; unclear what they are |
| Other bias | Low risk | Comment: Power sample size calculation. No difference at baseline between groups. From the data provided, no indication of other important risks of bias |
Mangione 1999.
| Methods | RCT with 2 groups | |
| Participants | Location: USA Randomized: 39 Age: mean 71 years Sample: 26 females and 13 males with knee osteoarthritis Settings: academic, monocenter Inclusion criteria: community dwelling, ≥ 50 years, knee pain and positive radiography or clinical signs of osteoarthritis Exclusion criteria: rheumatoid disease, history of unstable metabolic diseases, neurological disorders or cardiopulmonary conditions that precluded participation in aerobic exercise |
|
| Interventions | Intensity: Exercise program with different levels of effort High effort (n = 19): frequency: 3 times/week * 10 weeks; session duration: 25 min; intensity: cycling fixed at 70% HRR Low effort (n = 20): frequency: 3 times/week * 10 weeks; session duration: 25 min; intensity: cycling fixed at 40% HRR All groups: Warm‐up, then cycling exercises for 25‐min training period on a stationary cycle and cool‐down exercise. Each session lasted about 1 hr. Intensity determined from the maximum HR. The authors did not provide any information regarding the progression or the supervision of sessions Using a Likert scale (range 0‐20 or 0‐68) for WOMAC |
|
| Outcomes | At 10 weeks: subscale pain, Arthritis Impact Measurement Scale 2, walking speed, 6‐min walk test, peak oxygen consumption | |
| Notes |
|
|
| Risk of bias | ||
| Bias | Authors' judgement | Support for judgement |
| Random sequence generation (selection bias) | Low risk | Comment: Computer generated random numbers used |
| Allocation concealment (selection bias) | Unclear risk | Comment: No procedure was described |
| Blinding of participants and personnel (performance bias) All outcomes | High risk | Comment: Insufficient information, but it is unlikely that participants and care providers were blinded |
| Blinding of outcome assessment (detection bias) Subjective | High risk | Comment: Insufficient information, but it is unlikely that the participants were blinded |
| Blinding of outcome assessment (detection bias) Objective | Unclear risk | Comment: No information on blinding of outcome assessors was provided. Unclear how this influenced the data |
| Incomplete outcome data (attrition bias) All outcomes | High risk | Comment: No ITT analysis. High rate of drop‐out (30%), which might introduce bias |
| Selective reporting (reporting bias) | Unclear risk | Comment: Insufficient information. No protocol registration. Major and minor outcomes not declared; unclear what they are |
| Other bias | Unclear risk | Comment: No sample size calculation provided. Baseline performance seems similar between the 2 groups |
McCarthy 2004.
| Methods | RCT with 2 groups | |
| Participants | Location: UK Randomized: 225 Age: mean 64.7 years Sample: 125 females and 89 males with knee osteoarthritis Settings: academic, monocenter Inclusion criteria: met the ACR clinical criteria (knee pain, knee radiograph, clinical features) and radiological evidence of osteophytes Exclusion criteria: symptomatic back or hip disease, knee osteoarthritis secondary to inflammatory arthritis, symptoms affecting the ankles or feet, person unable or unwilling to attend a physiotherapy treatment, psychiatric or medical morbidity that precludes participation in exercise treatment, receiving an intra‐articular steroid injection within 3 months |
|
| Interventions | Intensity: Exercise program with different levels of time spent in exercise High intensity (n = 111): frequency: 2 times/week * 8 weeks; session duration: 45 min; intensity: home exercise + class exercise = circuit of exercise (5‐min warm‐up, 5‐min stretching, 5‐min balance training, 10‐min isotonic exercises, 5‐min isometric quadriceps exercises, 5‐min cool‐down). Progression: the class exercise program was increased and decreased by the senior physiotherapist by clinical discretion and in discussion with the participant Low intensity (n = 103): frequency: no information; session duration: no information; intensity: home exercise = muscle strengthening exercises, muscular endurance exercise, range of motion, standing balance. The home exercise was progressed. The level of intensity was fixed at 60% of the initial assessment, then reassessed and increased to 70% after 4 weeks, then to 80% All groups: Home and class exercises were progressed or reduced in case of an exacerbation of symptoms Supervision: senior therapist in the class exercise |
|
| Outcomes | At 8 weeks: Pain VAS, WOMAC pain, WOMAC physical function, SF‐36, EuroQol (ED‐5D), muscle strength, range of motion 3 months: EuroQol (ED‐5D) 6 months: SF‐36, EuroQol (ED‐5D), muscle strength, pain VAS, WOMAC, range of motion 9 months: EuroQol (ED‐5D) 12 months: SF‐36, EuroQol (ED‐5D), muscle strength, pain VAS, WOMAC, range of motion Using a Likert scale (range 0‐20 or 0‐68) in WOMAC |
|
| Notes |
|
|
| Risk of bias | ||
| Bias | Authors' judgement | Support for judgement |
| Random sequence generation (selection bias) | Low risk | Quote: "Subject allocation was carried out using a computerised minimisation algorithm built into an access." Comment: Adequate method was used |
| Allocation concealment (selection bias) | Low risk | Quote: "The lead investigator provided participants’ details to the trial data manager, who used a computerised, password‐secured randomisation system (Microsoft Access) to allocate patients, at a location separate from the trial investigator’s place of work." Comment: Allocation seemed to have remained concealed and the risk of selection bias low |
| Blinding of participants and personnel (performance bias) All outcomes | High risk | Quote: "This design feature allowed the patients to know which of the two treatment programs they were receiving." Comment: Participants and staff were not blinded |
| Blinding of outcome assessment (detection bias) Subjective | High risk | Comment: Participants were not blinded, introducing a risk of bias for subjective outcomes |
| Blinding of outcome assessment (detection bias) Objective | Low risk | Quote: "To protect against bias, outcome assessments were made blind to allocation." |
| Incomplete outcome data (attrition bias) All outcomes | High risk | Quote: "An ITT analysis on the major outcome’s 12‐month data was conducted using last value carried forward (LVCF) imputation to examine further the effect of missing data." Comment: ITT conducted only on 12 months' data. A drop‐ out rate > 10% is noted and unbalanced among the 2 groups immediately at the end of the intervention (83% and 94%) . |
| Selective reporting (reporting bias) | High risk | Comment: No protocol was found. Major and minor outcomes were specified, but additional outcomes data was incompletely reported in different reports (i.e. the SF‐36 score is reported in McCarthy a but not McCarthy b) |
| Other bias | Low risk | Comment: There is no indication of other important risks of bias. Baseline performances seem similar between the 2 groups. A sample size calculation was provided |
Ng 2010.
| Methods | RCT with 2 groups? | |
| Participants | Location: Australia Randomized: 36 Age: mean 60.4 years Sample: 17 females and 11 males with hip or knee osteoarthritis Settings: university Inclusion criteria: age from 40 to 75 years, osteoarthritis diagnosed in one hip or knee and experiencing clinical symptoms within the previous month, ability to walk at least 15 min continuously and safely participate in an exercise program Exclusion criteria: other forms of arthritis, corticosteroid or visco supplement injections, history of infection, living in a dependent environment, taking daily medication for osteoarthritis, planning surgery in the next 6 months, receiving psychiatric or psychological treatment, pregnant or planning to become pregnant, exercising more than 60 min per week, or participating in another research study |
|
| Interventions | Intensity: Exercise program with different levels of time spent in exercise High intensity (n = 17): frequency: 5 times/week * 12 weeks; duration: 30 to 60 minutes Low intensity (n = 19): frequency: 3 times/week * 12 weeks; duration: 30 to 60 m inutes Intensity and progression: all groups were asked to walk at least 3000 steps (30 min) during 6 weeks and 6000 steps (60 min) during the 6 other weeks Supervision: unsupervised |
|
| Outcomes | At 12 weeks: WOMAC (pain, function, global) using a numerical rating scale (range 0‐10); Active Australia Physical Activity Questions, number of steps Follow‐up at 18 weeks: WOMAC (pain, function, global); Active Australia Physical Activity Questions, number of steps We converted the final scores expressed in a VAS to a Likert scale for the WOMAC pain (range 0‐20) and function (range 0‐68) subscales |
|
| Notes |
|
|
| Risk of bias | ||
| Bias | Authors' judgement | Support for judgement |
| Random sequence generation (selection bias) | Low risk | Comment: A computer random‐number generator was used |
| Allocation concealment (selection bias) | High risk | Quote: "For practical reasons, allocation to group was not concealed." "The assessor and main analyst (NTMN) was not blinded to group allocation and conducted the randomisation process before baseline, which may have contributed to ascertainment or performance biases." Comment: Confirmed by the author that the allocation was not concealed |
| Blinding of participants and personnel (performance bias) All outcomes | High risk | Comment: Insufficient information, but it is unlikely that participants and care providers were blinded |
| Blinding of outcome assessment (detection bias) Subjective | High risk | Quote: "assessor and main analyst (NTMN) were not blinded to group allocation" |
| Blinding of outcome assessment (detection bias) Objective | High risk | Quote: "assessor and main analyst (NTMN) were not blinded to group allocation" Comment: Participants were not likely blinded, introducing a risk of bias |
| Incomplete outcome data (attrition bias) All outcomes | High risk | Quote: "data were analysed on a per protocol basis" Comment: No ITT. Rate of drop‐out is unbalanced between the 2 groups (12% and 32%), and high in 1 group |
| Selective reporting (reporting bias) | High risk | Comment: Protocol registration. All the important outcomes data were not reported in the final publication. The authors kindly provided the data (WOMAC) on request |
| Other bias | High risk | Quote: "Compliance was higher in the three‐day walking group than in the five‐day walking group. Among participants in the three‐day walking group, there was 100% compliance with walking
three days per week during Weeks 8, 9, 12, 15, and 18. Among participants in the five‐day walking group, compliance ranged from 93% (Week 7) to 58% (Week 16) during the 12‐week walking program." Comment: Compliance in the 5‐day group was lower and different than in the 3‐day group, for a high risk of bias. No sample size calculation |
Singh 2011.
| Methods | RCT with 2 groups | |
| Participants | Location: India Randomized: 200 Age: mean 54.1 years Sample: 138 females and 62 males with knee osteoarthritis Settings: unknown Inclusion criteria: age between 40 and 65 years. Knee osteoarthritis Exclusion criteria: conditions that precluded participation in exercise such as coronary heart disease, myocardial infarction, unstable angina, chronic bronchitis, emphysema, peripheral disease, thrombophlebitis, embolism, kidney failure, uncontrolled hypertension |
|
| Interventions | Intensity: Exercise program with different levels of time spent in exercise High intensity (n = 100): frequency: 5 times/week * 8 weeks; session duration: 40 min; intensity: aerobic warm‐up (5‐10 min), walking (5‐10 min), cycling at 60% of maximum heart rate (15‐20 min) in addition to the conventional exercise program Low intensity (n = 100): frequency: 5 times/week * 8 weeks; duration: unknown min; intensity: conventional exercise program = hot packs, isometric exercises to quadriceps and hamstrings, range of motion, stretching and joint mobilization exercises, progressive resisted exercises All groups: participated in a conventional exercise program The authors did not provide any information on the progression or the supervision of the sessions |
|
| Outcomes | At 8 weeks: pain (VAS), WOMAC (function), muscle strength (isometric and isotonic strength measures), range of motion. Unclear whether VAS or Likert was used in WOMAC | |
| Notes |
|
|
| Risk of bias | ||
| Bias | Authors' judgement | Support for judgement |
| Random sequence generation (selection bias) | Unclear risk | Comment: No information on the process of randomization |
| Allocation concealment (selection bias) | Unclear risk | Comment: Insufficient information on allocation concealment |
| Blinding of participants and personnel (performance bias) All outcomes | High risk | Comment: Insufficient information, but it is unlikely that participants and care providers were blinded, for possible risk of bias |
| Blinding of outcome assessment (detection bias) Subjective | High risk | Comment: Insufficient information, but it is unlikely that participants and care providers were blinded, for possible risk of bias |
| Blinding of outcome assessment (detection bias) Objective | High risk | Comment: Insufficient information, but it is unlikely that participants and care providers were blinded |
| Incomplete outcome data (attrition bias) All outcomes | Unclear risk | Comment: Insufficient information |
| Selective reporting (reporting bias) | Unclear risk | Comment: Insufficient information. WOMAC score could not be extracted because of insufficient data presentation |
| Other bias | Unclear risk | Comment: Baseline performance seems similar between the 2 groups. No sample size calculation |
1RM: one repetition maximum ACR: American College of Rheumatology HR: heart rate HRR: heart rate reserve ITT: intention to treat NSAIDS: nonsteroidal anti‐inflammatory drugs RCT: randomized controlled trial SF‐36: Short Form 36 VAS: visual analog scale WOMAC: Western Ontario and McMaster Universities Arthritis Index
Characteristics of excluded studies [ordered by study ID]
| Study | Reason for exclusion |
|---|---|
| Chang 2012 | RCT but no variation of intensity between the 2 interventions. Compared exercise with elastic bands + conventional modality treatments (shortwave diathermy, hot packs, transcutaneous electrical nerve stimulation, interferential current versus conventional modality treatments |
| Diracoglu 2005 | RCT but no variation of intensity between the 2 interventions. Compared strengthening exercise + balance versus strengthening exercise alone |
| Eyigor 2004 | Intervention not appropriate. Effect of intensity could not be evaluated between the 2 groups. Compared isokinetic exercise program versus progressive resisted exercises program (isotonic regimen) |
| Fitzgerald 2011 | RCT but no variation of intensity between the 2 interventions. Same amount of time in training between the 2 groups |
| Green 1993 | RCT but no variation of intensity between the 2 interventions. Study compared home exercise versus hydrotherapy |
| Kruger 1997 | Not an RCT |
| Sevick 2000 | RCT but no variation of intensity between the 2 interventions. Study compared an aerobic exercise program consisting of walking on a treadmill at 50% to 70% of their heart reserve versus a resistance exercise program consisting of strengthening major muscle groups of both the upper and lower extremities |
| Shakoor 2007 | RCT but no variation in intensity between the 2 interventions. Compared exercise versus exercise + activity modification advice |
| Teixeira 2011 | This study appears to be the same trial as Fitzgerald 2011 and was excluded |
| Topp 2002 | RCT but no variation in intensity between the 2 interventions. Compared dynamic resistance versus isometric resistance versus no intervention |
| Veenhof 2006 | RCT but no variation in intensity between the 2 interventions. Compared behavioral versus usual care |
RCT: randomized controlled trial
Characteristics of studies awaiting assessment [ordered by study ID]
Steinhilber 2012.
| Methods | RCT |
| Participants | 26 participants with hip osteoarthritis and 10 with hip replacement |
| Interventions | Institutional hip exercises versus home‐based strengthening |
| Outcomes | Adherence, strength, Short Form 36 |
| Notes | Contacted for additional information but received no response |
RCT: randomized controlled trial
Characteristics of ongoing studies [ordered by study ID]
Messier 2011.
| Trial name or title | Strength Training for ARthritis Trial (START) |
| Methods | RCT |
| Participants | Knee osteoarthritis |
| Interventions | High‐intensity strength training versus low‐intensity strength training versus attention control |
| Outcomes | Pain, knee joint compressive forces, function, mobility, inflammatory markers, thigh composition measured at baseline, 6, 12, 18 months |
| Starting date | March 2012 |
| Contact information | jollajk@wfu.edu, United States |
| Notes | NCT01489462 |
Pua 2012.
| Trial name or title | Eccentric resistance ergometry in knee osteoarthritis rehabilitation: a randomized clinical trial (EUREKA) |
| Methods | RCT |
| Participants | Knee osteoarthritis |
| Interventions | Standard physiotherapy treatment and exercise on an eccentric ergometer versus standard physiotherapy |
| Outcomes | Isometric knee extensor torque, gait speed, bridging, knee pain, knee passive range of motion, Short Form‐36, standing balance |
| Starting date | April 2012 |
| Contact information | pua.yong.hao@sgh.com.sg, Singapore |
| Notes | ACTRN12612000411842 |
Äng 2013.
| Trial name or title | Dose‐response effects of medical exercise therapy in patients with osteoarthritis of the knee ‐ a Nordic multicenter clinical trial |
| Methods | RCT |
| Participants | Knee osteoarthritis |
| Interventions | High‐dosage exercise therapy versus low‐dosage exercise therapy |
| Outcomes | Knee Injury and Osteoarthritis Outcome Score, VAS pain scale, self rated patient satisfaction scale, Hospital Anxiety and Depression scale, Catastrophizing Scale, Tampa Scale of Kinesiophobia, 20‐meter walk test, 30s Maximal Repeated Unilateral Knee Bending test, Five Time Repeated Chair Stands |
| Starting date | December 2013 |
| Contact information | Tom.Torstensen@ki.se; Bjorn.Ang@ki.se, Sweden |
| Notes | NCT02024126 |
Østerås 2012.
| Trial name or title | Dose‐response: exercise therapy on hip osteoarthritis, a pilot study |
| Methods | RCT |
| Participants | Hip osteoarthritis |
| Interventions | High‐dosage exercise therapy versus low‐dosage exercise therapy |
| Outcomes | Stairs, squats, WOMAC Index of Osteoarthritis (questionnaire) measured 8 weeks and 6 months |
| Starting date | september 2012 |
| Contact information | freddy_p123@hotmail.com, Norway |
| Notes | NCT01700933 |
RCT: randomized controlled trial VAS: visual analog scale WOMAC: Western Ontario and McMaster Universities Arthritis Index
Differences between protocol and review
Measure of treatment effect in continuous outcomes: added mean difference calculation when the same tool was used to measure the same outcome across separate studies.
'Summary of findings' tables: added minimum clinical important difference threshold and methods of calculation to express absolute and relative changes for dichotomous or continuous outcome measures. We followed the recommendations provided by the Cochrane Musculoskeletal Review Group.
We did not perform contour‐enhanced funnel plots to assess the presence of small‐study effects as the required statistical conditions were not met.
We stated in the protocol that we would attempt to fit a bivariate random‐effects meta‐analysis to address the issue between correlated outcomes and missing data. As no data were missing, we did not perform the analysis.
We did not perform subgroup analysis to explore whether a relationship exists between the type of treatments, type of intervention, type of joint, indication of exercise, duration of treatment as insufficient data was available. Meta‐regression was also not possible due to the small number of included studies.
We stated in the protocol that would attempt to perform a sensitivity analysis to explore how the results of meta‐analysis might be affected by including only studies at low risk of bias. However, as all the identified studies were at high risk of bias, we did not perform the analysis.
Contributions of authors
JPR and MMLC wrote the review.
LB wrote the previous systematic review that is the foundation of the current work.
JPR, MMLC, IB, LB, PR, and LT conceived of and designed the review and interpreted the data.
JPR and CN independently screened retrieved clinical studies for inclusion.
JPR and MMLC extracted data from included studies and performed the methodological quality assessment.
JPR, MMLC, and LT analyzed the data.
JPR, MMLC, IB, LT, LB, and PR reviewed the final manuscript prior to submission.
Sources of support
Internal sources
-
EHESP, French school of public health, France.
in‐kind support
-
Centre de recherche Epidémiologies et Biostatistique, INSERM U1153, France.
in‐kind support
-
Hôpital Hôtel‐Dieu, APHP, France.
in‐kind support
External sources
No sources of support supplied
Declarations of interest
None of the researchers have a commercial for‐profit interest in this review. There was no financial support from the pharmaceutical industry for this review.
New
References
References to studies included in this review
Foroughi 2011 {published and unpublished data}
- Foroughi N, Smith RM, Lange AK, Baker MK, Fiatarone Singh MA, Vanwanseele B. Lower limb muscle strengthening does not change frontal plane moments in women with knee osteoarthritis: A randomized controlled trial. Clinical Biomechanics 2011 Feb;26(2):167‐74. [DOI] [PubMed] [Google Scholar]
- Foroughi N, Smith RM, Lange AK, Singh MA, Vanwanseele B. Progressive resistance training and dynamic alignment in osteoarthritis: A single‐blind randomised controlled trial. Clinical Biomechanics (Bristol, Avon) 2011 Jan;26(1):71‐7. [DOI] [PubMed] [Google Scholar]
Jan 2008 {published data only}
- Jan MH, Lin JJ, Liau JJ, Lin YF, Lin DH. Investigation of clinical effects of high‐ and low‐resistance training for patients with knee osteoarthritis: a randomized controlled trial. Physical Therapy 2008 Apr;88(4):427‐36. [DOI] [PubMed] [Google Scholar]
Mangione 1999 {published data only}
- Mangione KK, McCully K, Gloviak A, Lefebvre I, Hofmann M, Craik R. The effects of high‐intensity and low‐intensity cycle ergometry in older adults with knee osteoarthritis. The Journals of Gerontology Series A: Biological Sciences and Medical Sciences 1999 Apr;54(4):M184‐90. [DOI] [PubMed] [Google Scholar]
McCarthy 2004 {published data only}
- McCarthy CJ, Mills PM, Pullen R, Richardson G, Hawkins N, Roberts CR, et al. Supplementation of a home‐based exercise programme with a class‐based programme for people with osteoarthritis of the knees: a randomised controlled trial and health economic analysis. Health Technology Assessment 2004 Nov;8(46:iii‐iv):1‐61. [DOI] [PubMed] [Google Scholar]
- McCarthy CJ, Mills PM, Pullen R, Roberts C, Silman A, Oldham JA. Supplementing a home exercise programme with a class‐based exercise programme is more effective than home exercise alone in the treatment of knee osteoarthritis. Rheumatology (Oxford) 2004 Jul;43(7):880‐6. [DOI] [PubMed] [Google Scholar]
Ng 2010 {published and unpublished data}
- Ng NT, Heesch KC, Brown WJ. Efficacy of a progressive walking program and glucosamine sulphate supplementation on osteoarthritic symptoms of the hip and knee: a feasibility trial. Arthritis Research and Therapy 2010;12(1):R25. [DOI] [PMC free article] [PubMed] [Google Scholar]
Singh 2011 {published data only}
- Singh J. Effects of Exercise Rehabilitation Programme on Osteoarthritic Knee With Special Reference to Biochemical Changes (Thesis submitted to the faculty of the Punjabi University). 2010. [Google Scholar]
- Singh J, Singh P, Sohal MS. Effect of exercise rehabilitation programme on clinical health status of osteoarthritis knee patients. Indian Journal of Physiotherapy and Occupational Therapy 2011 Jul‐Sep;5(3):191‐8. [Google Scholar]
References to studies excluded from this review
Chang 2012 {published data only}
- Chang TF, Liou TH, Chen CH, Huang YC, Chang KH. Effects of elastic‐band exercise on lower‐extremity function among female patients with osteoarthritis of the knee. Disability and Rehabilitation 2012;34(20):1727‐35. [DOI] [PubMed] [Google Scholar]
Diracoglu 2005 {published data only}
- Diracoglu D, Aydin R, Baskent A, Celik A. Effects of kinesthesia and balance exercises in knee osteoarthritis. Journal of Clinical Rheumatology 2005;11(6):303‐10. [DOI] [PubMed] [Google Scholar]
Eyigor 2004 {published data only}
- Eyigor S, Hepguler S, Capaci K. A comparison of muscle training methods in patients with knee osteoarthritis. Clinical Rheumatology 2004;23(2):109‐15. [DOI] [PubMed] [Google Scholar]
Fitzgerald 2011 {published and unpublished data}
- Fitzgerald GK, Piva SR, Gil AB, Wisniewski SR, Oddis CV, Irrgang JJ. Agility and perturbation training techniques in exercise therapy for reducing pain and improving function in people with knee osteoarthritis: a randomized clinical trial. Physical Therapy 2011;91(4):452‐69. [DOI] [PMC free article] [PubMed] [Google Scholar]
Green 1993 {published data only}
- Green J, McKenna F, Redfern EJ, Chamberlain MA. Home exercises are as effective as outpatient hydrotherapy for osteoarthritis of the hip. British Journal of Rheumatology 1993;32(9):812‐5. [DOI] [PubMed] [Google Scholar]
Kruger 1997 {published data only}
- Kruger H, Garche U. The use of isokinetic systems at osteoarthritis during in‐patient rehabilitation, part II ‐ isokinetic training [Einsatz isokinetischer systeme bei gonarthrosen wahrend stationarer rehabilitation: teilII ‐ isokinetisches training]. Pravention Und Rehabilitation 1997;9(4):161‐5. [Google Scholar]
Sevick 2000 {published data only}
- Sevick MA, Bradham DD, Muender M, Chen GJ, Enarson C, Dailey M, et al. Cost‐effectiveness of aerobic and resistance exercise in seniors with knee osteoarthritis. Medicine and Science in Sports and Exercise 2000;32(9):1534‐40. [DOI] [PubMed] [Google Scholar]
Shakoor 2007 {published data only}
- Shakoor MA, Taslim MA, Hossain MS. Effects of activity modification on the patients with osteoarthritis of the knee. Bangladesh Medical Research Council Bulletin 2007;33(2):55‐9. [DOI] [PubMed] [Google Scholar]
Teixeira 2011 {published data only}
- Teixeira PE, Piva SR, Fitzgerald GK. Effects of impairment‐based exercise on performance of specific self‐reported functional tasks in individuals with knee osteoarthritis. Physical Therapy 2011;91(12):1752‐65. [DOI] [PMC free article] [PubMed] [Google Scholar]
Topp 2002 {published data only}
- Topp R, Woolley S, Hornyak J, Khuder S, Kahaleh B. The effect of dynamic versus isometric resistance training on pain and functioning among adults with osteoarthritis of the knee. Archives of Physical Medicine and Rehabilitation 2002;83(9):1187‐95. [DOI] [PubMed] [Google Scholar]
Veenhof 2006 {published data only}
- Veenhof C, Köke AJ, Dekker J, Oostendorp RA, Bijlsma JW, Tulder MW, et al. Effectiveness of behavioral graded activity in patients with osteoarthritis of the hip and/or knee: A randomized clinical trial. Arthritis and Rheumatism 2006;55(6):925‐34. [DOI] [PubMed] [Google Scholar]
References to studies awaiting assessment
Steinhilber 2012 {published data only}
- Steinhilber B, Haupt G, Miller R, Boeer J, Grau S, Janssen P, et al. Feasibility and efficacy of an 8‐week progressive home‐based strengthening exercise program in patients with osteoarthritis of the hip and/or total hip joint replacement: a preliminary trial. Clinical Rheumatology 2012 Mar;31(3):511‐9. [DOI] [PubMed] [Google Scholar]
References to ongoing studies
Äng 2013 {unpublished data only}
- Dose‐response effects of medical exercise therapy in patients with osteoarthritis of the knee ‐ a Nordic multicenter clinical trial. Ongoing study December 2013.
Messier 2011 {unpublished data only}
- Strength Training for ARthritis Trial (START). Ongoing study March 2012.
Pua 2012 {unpublished data only}
- Eccentric resistance ergometry in knee osteoarthritis rehabilitation: a randomized clinical trial (EUREKA). Ongoing study April 2012.
Østerås 2012 {unpublished data only}
- Dose‐response: exercise therapy on hip osteoarthritis, a pilot study. Ongoing study september 2012.
Additional references
Akl 2011
- Akl EA, Oxman AD, Herrin J, Vist GE, Terrenato I, Sperati F, et al. Using alternative statistical formats for presenting risks and risk reductions. Cochrane Database of Systematic Reviews 2011, Issue 3. [DOI: 10.1002/14651858.CD006776] [DOI] [PMC free article] [PubMed] [Google Scholar]
Altman 1996
- Altman R, Brandt K, Hochberg M, Moskowitz R, Bellamy N, Bloch DA, et al. Design and conduct of clinical trials in patients with osteoarthritis: recommendations from a task force of the Osteoarthritis Research Society. Results from a workshop. Osteoarthritis and Cartilage 1996;4(4):217‐43. [DOI] [PubMed] [Google Scholar]
Baillet 2012
- Baillet A, Vaillant M, Guinot M, Juvin R, Gaudin P. Efficacy of resistance exercises in rheumatoid arthritis: meta‐analysis of randomized controlled trials. Rheumatology (Oxford) 2012 Mar;51(3):519‐27. [PUBMED: 22120463] [DOI] [PubMed] [Google Scholar]
Beijersbergen 2013
- Beijersbergen CM, Granacher U, Vandervoort AA, DeVita P, Hortobágyi T. The biomechanical mechanism of how strength and power training improves walking speed in old adults remains unknown. Ageing Research Reviews 2013 Mar;12(2):618‐27. [PUBMED: 23501431] [DOI] [PubMed] [Google Scholar]
Bijlsma 2011
- Bijlsma JW, Berenbaum F, Lafeber FP. Osteoarthritis: an update with relevance for clinical practice. The Lancet 2011;377(9783):2115‐26. [DOI] [PubMed] [Google Scholar]
Bouchard 2007
- Bouchard C, Blair S, Haskell W. Physical Activity and Health. Human Kinetics, Inc., 2007. [Google Scholar]
Boutron 2008
- Boutron I, Moher D, Altman DG, Schulz KF, Ravaud P. Extending the CONSORT statement to randomized trials of nonpharmacologic treatment: explanation and elaboration. Annals of Internal Medicine 2008;148(4):295‐309. [DOI] [PubMed] [Google Scholar]
Brazzelli 2011
- Brazzelli M, Saunders DH, Greig CA, Mead GE. Physical fitness training for stroke patients. Cochrane Database of Systematic Reviews 2011, Issue 11. [DOI: 10.1002/14651858.CD003316.pub4] [DOI] [PubMed] [Google Scholar]
Brosseau 2003
- Brosseau L, MacLeay L, Robinson V, Wells G, Tugwell P. Intensity of exercise for the treatment of osteoarthritis. Cochrane Database of Systematic Reviews 2003, Issue 2. [DOI: 10.1002/14651858.CD004259] [DOI] [PubMed] [Google Scholar]
Brosseau 2014
- Brosseau L, Rahman P, Poitras S, Toupin‐April K, King J, Smith C, et al. Systematic critical appraisal for the non‐pharmacological management of osteoarthritis using AGREE II. PLoS ONE 2014 May;9(1):e82986. [PUBMED: 24840205] [DOI] [PMC free article] [PubMed] [Google Scholar]
Cates 2008
- Dr Chris Cates' EBM website. Visual Rx Version 3. http://www.nntonline.net/ 2008.
Chilibeck 2011
- Chilibeck PD, Vatanparast H, Cornish SM, Abeysekara S, Charlesworth S. Evidence‐based risk assessment and recommendations for physical activity: arthritis, osteoporosis, and low back pain. Applied Physiology, Nutrition, and Metababolism 2011 Jul;36(Suppl 1):S49‐79. [PUBMED: 21800948] [DOI] [PubMed] [Google Scholar]
Cohen 1988
- Cohen J. Statistical Power Analysis for the Behavioral Sciences. 2nd Edition. Hillsdale, New Jersey: Lawrence Earlbaum Associates, 1988. [Google Scholar]
Deeks 2011
- Deeks JJ, Higgins JPT, Altman DG. Chapter 9: Analysing data and undertaking meta‐analyses. In: Higgins JPT, Green S (editors). Cochrane Handbook for Systematic Reviews of Interventions Version 5.1.0 [updated March 2011]. The Cochrane Collaboration, 2011. Available from www.cochrane‐handbook.org.
EUnetHTA 2013
- EUnetHTA – European Network for Health Technology Assessment. Comparators and comparisons – direct and indirect comparisons. http://www.eunethta.eu/outputs/ (site accessed 21 May 2014).
Fernandes 2013
- Fernandes L, Hagen KB, Bijlsma JW, Andreassen O, Christensen P, Conaghan PG, et al. EULAR recommendations for the non‐pharmacological core management of hip and knee osteoarthritis. Annals of the Rheumatic Diseases 2013 Jul;72(7):1125‐35. [PUBMED: 23595142.] [DOI] [PubMed] [Google Scholar]
Ferreira 2010
- Ferreira ML, Smeets RJ, Kamper SJ, Ferreira PH, Machado LA. Can we explain heterogeneity among randomized clinical trials of exercise for chronic back pain? A meta‐regression analysis of randomized controlled trials. Physical Therapy 2010 Oct;90(10):1383‐403. [20671101] [DOI] [PubMed] [Google Scholar]
Fiatarone Singh 2004
- Fiatarone Singh MA. Exercise and aging. Clinics in Geriatric Medicine 2004;20(2):201‐21. [DOI] [PubMed] [Google Scholar]
Fransen 2008a
- Fransen M, McConnell S. Exercise for osteoarthritis of the knee. Cochrane Database of Systematic Reviews 2008, Issue 4. [DOI: 10.1002/14651858.CD004376.pub2] [DOI] [PubMed] [Google Scholar]
Fransen 2008b
- Fransen M, McConnell S, Hernandez‐Molina G, Reichenbach S. Exercise for osteoarthritis of the hip. Cochrane Database of Systematic Reviews 2009, Issue 3. [DOI: 10.1002/14651858.CD007912] [DOI] [PubMed] [Google Scholar]
Galvao 2005
- Galvao DA, Taaffe DR. Resistance exercise dosage in older adults: single‐ versus multiset effects on physical performance and body composition. Journal of American Geriatrics Society 2005;53(12):2090‐7. [DOI] [PubMed] [Google Scholar]
Graham 2012
- Graham JE, Karmarkar AM, Ottenbacher KJ. Small sample research designs for evidence‐based rehabilitation: issues and methods. Archives of Physical Medicine and Rehabilitation 2012 Aug;93(8 Suppl):S111‐6. [PUBMED: 22580169] [DOI] [PMC free article] [PubMed] [Google Scholar]
Hardy 1996
- Hardy RJ, Thompson SG. A likelihood approach to meta‐analysis with random effects. Statistics in Medicine 1996;15(6):619‐29. [DOI] [PubMed] [Google Scholar]
Heiwe 2011
- Heiwe S, Jacobson SH. Exercise training for adults with chronic kidney disease. Cochrane Database of Systematic Reviews 2011, Issue 10. [DOI: 10.1002/14651858.CD003236.pub2] [DOI] [PMC free article] [PubMed] [Google Scholar]
Higgins 2002
- Higgins JP, Thompson SG. Quantifying heterogeneity in a meta‐analysis. Statistics in Medicine 2002;21(11):1539‐58. [DOI] [PubMed] [Google Scholar]
Higgins 2011
- Higgins JPT, Green S (editors). Cochrane Handbook for Systematic Reviews of Interventions Version 5.1.0 [updated March 2011]. The Cochrane Collaboration, 2011. Available from www.cochrane‐handbook.org.
Hochberg 2012
- Hochberg MC, Altman RD, April KT, Benkhalti M, Guyatt G, McGowan J, et al. American College of Rheumatology 2012 recommendations for the use of nonpharmacologic and pharmacologic therapies in osteoarthritis of the hand, hip, and knee. Arthritis Care and Research 2012 Apr;64(4):465‐74. [PUBMED: 22563589] [DOI] [PubMed] [Google Scholar]
Hunter 2011
- Hunter SM, Hammett L, Ball S, Smith N, Anderson C, Clark A, et al. Dose‐response study of mobilisation and tactile stimulation therapy for the upper extremity early after stroke: a phase I trial. Neurorehabilitation and Neural Repair 2011;25(4):314‐22. [DOI] [PubMed] [Google Scholar]
Ioannidis 2007a
- Ioannidis JP, Patsopoulos NA, Evangelou E. Uncertainty in heterogeneity estimates in meta‐analyses. BMJ 2007;335(7626):914‐6. [DOI] [PMC free article] [PubMed] [Google Scholar]
Juhl 2014
- Juhl C, Christensen R, Roos EM, Zhang W, Lund H. Impact of exercise type and dose on pain and disability in knee osteoarthritis: a systematic review and meta‐regression analysis of randomized controlled trials. Arthritis and Rheumatology 2014 Mar;66(3):622‐36. [PUBMED: 24574223] [DOI] [PubMed] [Google Scholar]
Jüni 2006
- Jüni P, Reichenbach S, Dieppe P. Osteoarthritis: rational approach to treating the individual. Best Practice and Research. Clinical Rheumatology 2006;20(4):721‐40. [DOI] [PubMed] [Google Scholar]
Kraus 2002
- Kraus WE, Houmard JA, Duscha BD, Knetzger KJ, Wharton MB, McCartney JS, et al. Effects of the amount and intensity of exercise on plasma lipoproteins. The New England Journal of Medicine 2002 Nov 7;347(19):1483‐92. [PUBMED: 12421890] [DOI] [PubMed] [Google Scholar]
Kwakkel 2004
- Kwakkel G, Peppen R, Wagenaar RC, Wood Dauphinee S, Richards C, Ashburn A, et al. Effects of augmented exercise therapy time after stroke: a meta‐analysis. Stroke 2004;35(11):2529‐39. [DOI] [PubMed] [Google Scholar]
Latham 2010
- Latham N, Liu CJ. Strength training in older adults: the benefits for osteoarthritis. Clinics in Geriatric Medicine 2010;26(3):445‐59. [DOI] [PMC free article] [PubMed] [Google Scholar]
McAlindon 2014
- McAlindon TE, Bannuru RR, Sullivan MC, Arden NK, Berenbaum F, Bierma‐Zeinstra SM, et al. OARSI guidelines for the non‐surgical management of knee osteoarthritis. Osteoarthritis Cartilage 2014 Mar;22(3):363‐88. [24462672] [DOI] [PubMed] [Google Scholar]
Moskowitz 2009
- Moskowitz RW. The burden of osteoarthritis: clinical and quality‐of‐life issues. American Journal of Managed Care 2009;15(8 Suppl):S223‐9. [PubMed] [Google Scholar]
Murray 2012
- Murray CJ, Vos T, Lozano R, Naghavi M, Flaxman AD, Michaud C, et al. Disability‐adjusted life years (DALYs) for 291 diseases and injuries in 21 regions, 1990‐2010: a systematic analysis for the Global Burden of Disease Study 2010. The Lancet 2012 Dec 15;23(381):9867. [PUBMED: 23245608] [DOI] [PubMed] [Google Scholar]
O'Connor 2007
- O'Connor MI. Sex differences in osteoarthritis of the hip and knee. Journal of the American Academy of Orthopaedic Surgeons 2007;15 Suppl 1:S22‐5. [PUBMED: 17766785] [PubMed] [Google Scholar]
Peters 2008
- Peters J, Sutton AJ, Jones DR, Abrams KR, Rushton L. Contour‐enhanced meta‐analysis funnel plots help distinguish publication bias from other causes of asymmetry. Journal of Clinical Epidemiology 2008 Oct;61(10):991‐6. [DOI: 10.1016/j.jclinepi.2007.11.010] [DOI] [PubMed] [Google Scholar]
Pham 2004
- Pham T, Heijde D, Altman RD, Anderson JJ, Bellamy N, Hochberg M, et al. OMERACT‐OARSI initiative: Osteoarthritis Research Society International set of responder criteria for osteoarthritis clinical trials revisited. Osteoarthritis and Cartilage 2004;12(5):389‐99. [DOI] [PubMed] [Google Scholar]
Porter 2006
- Porter MM. Power training for older adults. Applied Physiology, Nutrition and Metabolism 2006 Apr;31(2):87‐94. [PUBMED: 16604125] [DOI] [PubMed] [Google Scholar]
Raymond 2013
- Raymond MJ, Bramley‐Tzerefos RE, Jeffs KJ, Winter A, Holland AE. Systematic review of high‐intensity progressive resistance strength training of the lower limb compared with other intensities of strength training in older adults. Archive of Physical Medicine and Rehabilitation 2013 Aug;94(8):1458‐72. [PUBMED: 23473702] [DOI] [PubMed] [Google Scholar]
Reichenbach 2007
- Reichenbach S, Sterchi R, Scherer M, Trelle S, Burgi E, Burgi U, et al. Meta‐analysis: chondroitin for osteoarthritis of the knee or hip. Annals of Internal Medicine 2007;146(8):580‐90. [DOI] [PubMed] [Google Scholar]
RevMan 2011 [Computer program]
- The Nordic Cochrane Centre, The Cochrane Collaboration. Review Manager (RevMan). Version 5.1. Copenhagen: The Nordic Cochrane Centre, The Cochrane Collaboration, 2011.
Robbins 2012
- Robbins DW, Marshall PW, McEwen M. The effect of training volume on lower‐body strength. The Journal of Strength and Conditioning Research 2012;26(1):34‐9. [DOI] [PubMed] [Google Scholar]
Rucker 2008
- Rucker G, Schwarzer G, Carpenter JR, Schumacher M. Undue reliance on I(2) in assessing heterogeneity may mislead. BMC Medical Research Methodology 2008;8:79. [DOI] [PMC free article] [PubMed] [Google Scholar]
Schünemann 2011a
- Schünemann HJ, Oxman AD, Higgins JPT, Vist GE, Glasziou P, Guyatt GH. Chapter 11: Presenting results and ‘Summary of findings' tables. In: Higgins JPT, Green S (editors). Cochrane Handbook for Systematic Reviews of Interventions Version 5.1.0 [updated March 2011]. The Cochrane Collaboration, 2011. Available from www.cochrane‐handbook.org.
Schünemann 2011b
- Schünemann HJ, Oxman AD, Vist GE, Higgins JPT, Deeks JJ, Glasziou P, et al. Chapter 12: Interpreting results and drawing conclusions. In: Higgins JPT, Green S (editors). Cochrane Handbook for Systematic Reviews of Interventions Version 5.1.0 [updated March 2011]. The Cochrane Collaboration, 2011. Available from www.cochrane‐handbook.org.
Siebelt 2014
- Siebelt M, Groen HC, Koelewijn SJ, Blois E, Sandker M, Waarsing JH, et al. Increased physical activity severely induces osteoarthritic changes in knee joints with papain induced sulphate‐glycosaminoglycan depleted cartilage. Arthritis Research and Therapy 2014;16(1):R32. [MEDLINE: ] [DOI] [PMC free article] [PubMed] [Google Scholar]
Slade 2012
- Slade SC, Keating JL. Exercise prescription: a case for standardised reporting. British Journal of Sports Medicine 2012 Dec;46(16):1110‐3. [PUBMED: 22089077] [DOI] [PubMed] [Google Scholar]
Tubach 2012
- Tubach F, Ravaud P, Martin‐Mola E, Awada H, Bellamy N, Bombardier C, et al. Minimum clinically important improvement and patient acceptable symptom state in pain and function in rheumatoid arthritis, ankylosing spondylitis, chronic back pain, hand osteoarthritis, and hip and knee osteoarthritis: Results from a prospective multinational study. Arthritis Care and Research 2012 Nov;64(11):1699‐707. [PUBMED: 22674853] [DOI] [PubMed] [Google Scholar]
Umpierre 2011
- Umpierre D, Ribeiro PA, Kramer CK, Leitão CB, Zucatti AT, Azevedo MJ, et al. Physical activity advice only or structured exercise training and association with HbA1c levels in type 2 diabetes: a systematic review and meta‐analysis. JAMA 2011 May 4;305(17):1790‐9. [PUBMED: 21540423] [DOI] [PubMed] [Google Scholar]
Uthman 2013
- Uthman OA, Windt DA, Jordan JL, Dziedzic KS, Healey EL, Peat GM, et al. Exercise for lower limb osteoarthritis: systematic review incorporating trial sequential analysis and network meta‐analysis. BMJ 2013;20(347):f5555. [PUBMED: 24055922] [DOI] [PMC free article] [PubMed] [Google Scholar]
Veerbeek 2014
- Veerbeek JM, Wegen E, Peppen R, Wees PJ, Hendriks E, Rietberg M, et al. What is the evidence for physical therapy poststroke? A systematic review and meta‐analysis. PLoS One 2014 Feb 4;9(2):e87987. [PUBMED: 24505342] [DOI] [PMC free article] [PubMed] [Google Scholar]
Vignon 2006
- Vignon E, Valat JP, Rossignol M, Avouac B, Rozenberg S, Thoumie P, et al. Osteoarthritis of the knee and hip and activity: a systematic international review and synthesis (OASIS). Joint Bone Spine 2006;73(4):442‐55. [DOI] [PubMed] [Google Scholar]
Vos 2012
- Vos T, Flaxman AD, Naghavi M, Lozano R, Michaud C, Ezzati M, et al. Years lived with disability (YLDs) for 1160 sequelae of 289 diseases and injuries 1990‐2010: a systematic analysis for the Global Burden of Disease Study 2010. The Lancet 2012 Dec 15;380(9859):2163‐96. [PUBMED: 23245607] [DOI] [PMC free article] [PubMed] [Google Scholar]
Wang 2012
- Wang SY, Olson‐Kellogg B, Shamliyan TA, Choi JY, Ramakrishnan R, Kane RL. Physical therapy interventions for knee pain secondary to osteoarthritis: a systematic review. Annals of Internal Medicine 2012 Nov 6;157(9):632‐44. [PUBMED: 23128863] [DOI] [PubMed] [Google Scholar]
Woolf 2003
- Woolf A, Plfuger B. Burden of major musculoskeletal conditions. Bulletin of the World Health Organization 2003;81(9):646‐56. [PMC free article] [PubMed] [Google Scholar]
World Health Organization 2010
- World Health Organization. Global recommendations on physical activity for health. www.who.int/dietphysicalactivity/publications (accessed 1 June 2012).
Zhang 2010
- Zhang Y, Jordan JM. Epidemiology of osteoarthritis. Clinics in Geriatric Medicine 2010;26(3):355‐69. [PUBMED: 2920533] [DOI] [PMC free article] [PubMed] [Google Scholar]