

Abstract
DNA self‐assembly has proven to be a highly versatile tool for engineering complex and dynamic biocompatible nanostructures from the bottom up with a wide range of potential bioapplications currently being pursued. Primary among these is healthcare, with the goal of developing diagnostic, imaging, and drug delivery devices along with combinatorial theranostic devices. The path to understanding a role for DNA nanotechnology in biomedical sciences is being approached carefully and systematically, starting from analyzing the stability and immune‐stimulatory properties of DNA nanostructures in physiological conditions, to estimating their accessibility and application inside cellular and model animal systems. Much remains to be uncovered but the field continues to show promising results toward developing useful biomedical devices. This review discusses some aspects of DNA nanotechnology that makes it a favorable ingredient for creating nanoscale research and biomedical devices and looks at experiments undertaken to determine its stability in vivo. This is presented in conjugation with examples of state‐of‐the‐art developments in biomolecular sensing, imaging, and drug delivery. Finally, some of the major challenges that warrant the attention of the scientific community are highlighted, in order to advance the field into clinically relevant applications.
Keywords: diagnostics, DNA, healthcare, imaging, nanomedicine, origami, theranostics
Deoxyribonucleic acid (DNA) nanotechnology is a versatile tool for engineering complex nanostructures. Among bioapplications currently being pursued is healthcare. This review discusses aspects of DNA nanotechnology that make it useful for this purpose, how its biocompatibility is being optimized, and the state‐of‐the‐art developments in biomolecular sensing, imaging, and drug delivery along with major challenges remaining for translation.

1. Introduction
Similar to the concept portrayed in the film “The Fantastic Voyage,” the futuristic dream of tiny nanorobots entering a patient's body, identifying and reporting back any anomalies, followed by automatically treating the patient still remains in the realm of science fiction.1 However, biomedical scientists everywhere are focused on engineering nanosystems to mimic the various individual functionalities of such nanorobots for achieving similar, more realistic goals.2 After the discovery of chromosomes,3 genes,4 and deoxyribonucleic acid5 (DNA) in the 20th century, one of the key avenues of biomedical research has been largely focused on how to control genes that express functional anomalies and lead to diseases such as cancer, neurodegeneration, and congenital defects. In the event of genetic errors, can we detect the corresponding causative mutations and subsequently turn off or even replace the gene responsible at the somatic level? In cases of abnormal and pathological cellular division, can we identify the culprit cells and shut down their mitotic machinery? In this picture—primarily based on genes, genetic mutations, and ribonucleic acids (RNA)—extraneous nucleic acids and gene editing enzymes are the useful tools currently being developed that can be harnessed to target and accordingly control biological processes.6 Noncoding RNAs7 as well as the CRISPR‐Cas98 technology are examples of such functional tools, but a new emerging candidate for increasing the necessary access to and addressing subcellular and genetic components is structural DNA nanotechnology. Here, DNA plays the pivotal role of both a nanoscale assembly material and a facilitator for delivering functional molecules, contrary to its own canonical role as a genetically functional molecule that serves primarily as a biological blueprint.
Structural DNA nanotechnology is a highly interdisciplinary branch of biomaterials research that recruits DNA for developing 2D and 3D nanostructures typically on the order of 10 to 1000 nm in size.9 A DNA structure, unlike a simple single‐ or double‐stranded DNA (ssDNA and dsDNA, respectively) or plasmidic DNA, is typically designed based on the principles of DNA origami,10 scaffold‐free DNA self‐assembly,11 or a host of other strategies that have emerged over the last decade.12 Such DNA nanostructures have now matured to the point where they efficiently form with high yields and there are well‐established tools for their characterization and purification.13 Some of the key merits of building DNA‐based structures are the predictable base‐pair assembly code of DNA (Adenine (A) binds to Thymine (T) by two hydrogen bonds, Cytosine (C) binds to Guanine (G) by three hydrogen bonds) which enables limitless design space for DNA structure development, nanometer‐scale addressability on DNA molecules, and an unprecedented arsenal of chemistries allowing the conjugation of DNA with other inorganic and organic particles, as summarized in Table 1 . A range of proof‐of‐concept demonstrations and initial technological applications have already leveraged these properties with areas that include, for example, single‐molecule analyses,14 nanopatterning,15 light harvesting,16 synthetic multi‐enzyme‐cascade systems,17 molecular computing,18 and more pertinent to this review, applications in biomedical research.
Table 1.
Examples of established attachment chemistries for DNA conjugation with various molecules
| Molecule | Attachment chemistry | Purpose | Example ref |
|---|---|---|---|
| Dyes | |||
| Conjugating dyesa) | NHS or maleimide react to amine or thiol on DNA; hydrazine on dye + aldehyde on DNA | Probes and sensors for diagnostics | 19 |
| Intercalating dyes | Pi‐stacking electrostatic interaction with DNA bases | DNA quantification, competitive binding assays | 20 |
| Small molecules | |||
| Doxorubicin | DNA intercalation | Cancer treatment | 21 |
| Folate | Azide on folate + alkyne on DNA | Targeting drug delivery | 22 |
| Nanoparticles | |||
| AuNPsb) & AuNRsc) | Avidin‐biotin; reactive amine or thiol on DNA | Contrast agents, imaging, therapy | 23 |
| QDsd) | Metal affinity coordination with amine or thiol on DNA | Assays, imaging agents | 24 |
| Peptides | |||
| Short peptides | Alkynyl on peptide + azide on DNA | Targeted therapy | 25 |
| Enzymes/proteins | DNA‐guided conjugation of two metal‐affinity domains on protein and another DNA | Protein imaging, enzyme delivery | 26 |
| Enzymes/proteins | Azide on protein + dybenzocyclocytne on DNA | Protein imaging | 27 |
| Histidine tag | Disulphide link | Protein conjugation, QD attachment | 28 |
| Proteins | Tus protein + Ter gene sequence | Drug delivery, biosensing | 29 |
| Other | |||
| Macromolecules | 3' nucleotide triphosphates + deoxynucleotidyl transferase | Microarrays, biosensing | 30 |
Some dyes and functional groups (amines, thiols) can be incorporated directly into nascent DNA during synthesis
AuNPs, Gold nanoparticles
AuNRs, Gold nanorods
QDs, Quantum dots.
The current research landscape in developing targeted nanomaterials‐based therapeutic or contrast agent carriers or scaffolds includes, but is certainly not limited to, lipids,31 silicon‐based capsules, nanoparticles (NPs),32 metal‐organic frameworks,33 and carbon nanotubes.34 These materials are shaping the bedrock of future medicine in the form of colloids and drug‐adsorbing microspheres, for example, that will further the goal of large‐scale production and dissemination of therapeutic drugs.35 For many therapies, there are significant remaining challenges that are still not overcome by these materials, such as intricate control over dosage, toxicity, polydispersity of assembled materials, and loading deviations. The biggest current issue is perhaps that of nontargeted or systemic delivery where the whole body is dosed by a drug, yet achieving the most efficacious therapy would require very specific targeting while relying on a far smaller viable dosage. In the search for new efficient therapeutic carriers, the scientific community has a long way to go and there remains a demand for multifunctional and targeted drug delivery vehicles and other analogous materials that possess some combination of relevant desirable attributes, including:
Being easily assembled or synthesized
Biocompatible or minimally toxic
Possessing multifunctionality
Programmable
Provides for controlled dosage
Triggered release
Can carry nonsoluble cargo
Targeted
Inexpensive
Tunable retention and clearance rates
Scalable synthesis
DNA nanotechnology offers more access to many, albeit not all, of these desirable attributes as compared to classical molecular scaffolds and other organic and inorganic nanomaterials. The desire for precise spatial organization at the nanometer regime becomes even more crucial for biomedical purposes due to the high stakes involved in introducing a foreign particle into living organisms, and this is a property that can potentially be achieved using DNA‐based carriers. Moreover, therapeutic vehicles need to be “smart” and have well‐defined sensing and signal transduction from the environment to the medical practitioner and back to the environment. However, it is extremely challenging to detect a biological signal then potentially amplify it and relay the signal to the next step let alone from the inside of a body to outside. Signal transduction is where DNA nanostructures may potentially have superiority due to their ability to “talk” to biological systems as well as nonbiological systems, and therefore can act as an excellent liaison for exchange of critical information. To accomplish this, there are specific reaction mechanisms that elicit predictable chemical or physical reconfigurations into DNA molecules and these, in turn, can be embedded into DNA‐based biomedical systems for interfacing with the environment, a representative list of which is shown in Table 2 . Mechanisms of reconfiguration can be chemical (e.g., cleavage of a DNA strand), physical (e.g., change in secondary or tertiary shape of the DNA nanostructure), or molecular (e.g., DNA amplification by enzymes) in nature. Alternatively, DNA can enable the relay of signals from other molecules by virtue of conjugation such as carrying fluorescent molecules, intercalating agents, or other responsive (bio)molecules such as enzymes. With the help of these signal transduction mechanisms combined with conjugation to NPs and biomolecules, and the intrinsic power of self‐assembly, DNA cumulatively has properties that could potentially address and even consolidate three important aspects of current research in healthcare, namely, sensing, imaging, and drug delivery. Design of a next generation of combined or multifunctional platforms are often referred to as “theranostics” (therapy+diagnostics).36 To this end, DNA nanotechnology does not yet promise a solution to all the challenges but offers both incremental and significant advances in coming closer to one. Due to the strong and growing interest in this still nascent field we note several other excellent articles over the last few years that focus on related aspects of DNA technology and healthcare.37
Table 2.
Representative DNA response reaction mechanisms
| Mechanism | Stimulus signal | Target DNA seq. | Response type | Example ref |
|---|---|---|---|---|
| Chemical | pH | G‐rich sequences | G‐quadruplex formation | 38 |
| Chemical | pH | C‐rich sequences | I‐switch formation | 39 |
| Chemical | Na, K ions | G‐rich sequences | G‐quadruplex formation | [[qv: 38a,40]] |
| Chemical | Hg ions | T‐rich sequences | Duplex formation | 41 |
| Chemical | Ions, water | Branched DNA structure network | DNA hydrogel shape change | 42 |
| Chemical | ATPb) | A‐rich sequences | ssDNA to ATP aptamer | 43 |
| Chemical | Thiol reducing agent such as TCEPa) | Disulphide links | Cleavage of S‐S bond; separation of ssDNA domains | 44 |
| Physical | Light | Caging group coated ssDNA | ssDNA to dsDNA | 40, 45 |
| Physical | Heat | Complementary ssDNA | ssDNA to dsDNA | 46 |
| Molecular | Toehold‐bearing ssDNA | DNA duplex with partial complementarity | Displace existing duplex, release ssDNA | 47 |
| Molecular | Cellular peptides, ligands, membrane receptors | DNA aptamers | Linear DNA to well‐defined secondary structure | 48 |
| Molecular | Short ssDNA | Hybridization chain reaction (HCR) | Small DNA units to higher‐order structures | 49 |
| Molecular | Restriction enzymes | Enzyme‐specific DNA sequences | Cleavage of dsDNA to ssDNA | 50 |
| Molecular | Polymerases | Enzyme‐specific DNA primers | Increase in DNA size by amplification | 51 |
| Molecular | DNAzymes | Enzyme‐specific DNA sequences | Cleavage of DNA | 52 |
TCEP, tris(2‐carboxyethyl)phosphine
ATP, adenosine triphosphate.
We begin this review by briefly discussing the design and assembly of DNA‐based structures for biomedical applications, their stability, capabilities in physiologically relevant environments, and their biocompatibility, as these are the critical first issues that need to be addressed. Following that, we bring an update on the state‐of‐the‐art in functional DNA‐based architectures currently being designed and implemented for diagnostics, imaging, and therapeutics, with a focused eye on how the structural properties of DNA are key enablers toward the special role the overall technology may play in future biomedicine. Lastly, we will highlight some of the imminent challenges still faced on the path of DNA‐based biomedical devices toward translation into real‐world clinical applications. Given the rapidly expanding nature of this field, we cannot include every pertinent example and our apologies are extended for any omissions.
2. Design and Assembly of DNA Nanostructures
Nanoscale DNA structures are materials constructed by leveraging the architectural properties of the DNA molecule. Broadly, DNA nanostructures are synthesized by the self‐assembly of ssDNA sequences that have predetermined Watson‐Crick base pairing complementarity. Key to the engineering of DNA nanostructures is the design of distinct subsequences (or domains) in each ssDNA strand to be complementary to domains in other ssDNA strands such that the collective hybridization of these strands produces complex DNA‐based shapes and architectures. Based on this design principle, DNA nanostructures can be classified into two main categories—scaffolded DNA nanostructures where one long ssDNA molecule called the scaffold, which is typically the 7249 base pair (bp) ssDNA genome of the m13 bacteriophage, is then folded into a desired shape using a set of 100–200 short (24–60 bp) ssDNA molecules called staple strands. The concept, referred to as DNA origami, was invented by Paul Rothemund in 2006[[qv: 10a]] and has since matured into a diverse repository of techniques to create scaffolded DNA structures.[[qv: 10b,53]] The other class of DNA nanostructures are tile‐ or brick‐based DNA nanostructures that are created using a pool of short ssDNA strands and lack one single unifying scaffold strand.[[qv: 11a,b]] There are many reports utilizing such DNA nanostructures that exemplify the technique and the field of DNA nanotechnology currently harnesses both scaffolded and tile/brick‐based strategies for constructing what appears to be a limitless set of DNA‐based structures.9, 54
The process of designing and creating a DNA nanostructure begins with the help of several open‐source software tools for modeling the structure and optimizing the architecture using existing knowledge in DNA base pairing, higher order structural properties, and the properties of other conjugated or interacting (bio)materials and particles. Examples of such software tools include CaDNAno,[[qv: 10c,55]] CanDo,56 and Daedalus.[[qv: 53a]] Furthermore, it is possible to generate the 3D molecular coordinates of the structures, which in turn allows for the computational analysis of the structures with atomic resolution.57 The software tools enumerated above also have the sophistication of generating the requisite set of DNA sequences that would create a desired DNA architecture, which can be readily codified and transmitted to in‐house DNA synthesizers or commercial vendors for subsequent purchase.
The experimental procedure for assembling DNA structures typically entails mixing five‐ to ten‐fold excess staple strands with the scaffold strand in buffer conditions (pH 7.5–8.5) containing divalent (Mg2+) or monovalent (Na+, K+) cations to facilitate stable DNA‐DNA hybridization, and then subjecting the mixture to a structure‐specific temperature‐based annealing protocol. The addition of staple strands in excess concentration compared to the scaffold is key to thermodynamically driving the self‐assembly reaction forward to produce the desired structure in high formation yields. The yields achieved in DNA origami constructs are typically within the 50–95% range depending on the complexity of the nanostructure while yield for tile‐ and brick‐based architectures vary across the whole spectrum.[[qv: 11a]] There is also a wide suite of purification techniques available that can be employed to remove unbound initial reactants after the formation of a DNA nanostructure and these include centrifugation and chromatography, for example.13 The most common impurity that interferes with downstream applications arises from the large concentration of excess staple ssDNA strands and brick strands that remain in solution. In other cases, DNA nanostructures are created with excess proteins, dyes, ligands, and NPs, which also need to be addressed at the purification stage. And lastly, the requisite characterization to test for structural accuracy, integrity, yield, and homogeneity is performed using microscopy, fluorescence, chromatography, and other common molecular biological techniques.13
Purity and characterization of DNA nanostructures, while sufficient to demonstrate significant advances in proof‐of‐concept for these applications, is mostly still of low resolution and it is still quite challenging to deduce what percentage of the formed DNA nanostructures are 100% perfectly formed and how many are less than that due to inaccuracies at the individual ssDNA molecule level. What is also less understood at the moment is a clear distinction between well‐formed or “well‐enough” formed structures for a specific application. The following sections on the role of DNA nanostructures in sensing, imaging, and therapy would require an answer to the above question before clinical stage applicability of DNA‐based structures can be considered as that, in most cases, requires perfectly defined and identical materials.
3. DNA Nanostructural Stability in Biological Environments
For a material to be considered as a viable tool to build biomedically useful nanocarriers, it is key that it demonstrate certain desirable and tunable degrees of biocompatibility. The material should maintain long‐term structural stability following assembly in various physiological environments as well as along a putative path to the target or subcellular destination, and along this path premature functional activation of its components should be negligible. Moreover, such constructs should have a suitable half‐life, wherein after the target functionality is achieved the constructs should ideally follow a process of destruction and/or excretion with minimum toxicity. For synthetic DNA nanostructures to fit these requirements, several preliminary fundamental experiments have been done to interrogate their efficacy and candidacy as robust nanomaterials with many more questions yet to be answered.
Various DNA structures have already been tested against physiologically relevant environments, which this section will discuss sequentially moving from the extracellular environment to subcellular destinations with certain representative conditions highlighted in each, as summarized in Table 3 . The characterization of DNA nanostructure integrity and structural robustness in these investigations is predominantly by gel electrophoresis including agarose gel electrophoresis (AGE) and polyacrylamide gel electrophoresis (PAGE), microscopic techniques such as atomic force microscopy (AFM) and transmission electron microscopy (TEM), or fluorescence microscopy. The goal of walking along the putative biological pathway that a therapeutic agent would typically embark on toward a target subcellular destination is to highlight how DNA nanostructures fare in comparison to traditionally used simpler linear or circular DNA molecules or plasmid species that are usually applied in cellular or tissue transfections and what challenges remain to be overcome in this vein for clinical applications of DNA nanostructures.
Table 3.
Stability of DNA structures in representative physiologically relevant environments
One of the first physiological environments faced by biomedical nanocarriers is the serum or other components of cell culture media into which they will most probably be introduced for cellular uptake. Serum such as fetal bovine serum (FBS) and other cell culture media components contain useful nutrients, hormones, enzymes, and ions that support cell growth in experimental formats. The composition, while ideal for the development of cells, may actually pose a hostile environment for DNA nanoconstructs, causing degradation and dehybridization of the constituent DNA molecules thereby rendering them incapable of fulfilling their purpose.[[qv: 56a,59–63,67]] Standard commercial 10% FBS includes a host of proteins for cell development but also DNA digesting components that can cleave DNA strands. The threat posed by serum nuclease activity to ssDNA and dsDNA molecules (e.g., short and plasmid forms) is well‐known, so it is essential to see if DNA nanostructures follow the same trend against serum‐based nucleases in physiologically relevant amounts.
Keum and Bermudez tested a DNA tetrahedron (7 nm largest dimension; this is specified after every structure throughout to provide some information on relative size) independently in the presence of a restriction enzyme and a nonspecific nuclease.62 DdeI is a restriction endonuclease that cleaves a very conserved sequence (5'‐CTNAG‐3' where N is nonspecific) within a dsDNA molecule whereas DNaseI is an exonuclease that indiscriminately cleaves the terminal dsDNA bases. Two designs of the tetrahedron were developed—one where the DdeI‐specific sequence was embedded into an edge of the tetrahedron, called the T1 structure (therefore lacking spatial limitations to interact with the enzyme) and one where the sequence was embedded into one of the tetrahedral vertices called T2 (a potential spatially inhibiting enzyme interaction). As each strand in the tetrahedral structure is 63 bp long, a similar linear dsDNA containing the DdeI cleavage site was subjected to the same enzyme treatment for comparison purposes. In the treatment with 2 units (U) of DdeI (30.7 molar ratio enzyme:substrate) at 37 °C for 1 h, which is in large excess compared to physiologically prevalent nuclease concentrations, T1 showed susceptibility to degradation in the same way as dsDNA, as characterized by PAGE. In contrast, T2 demonstrated stability, which suggests that nonlinear motifs in DNA nanostructures can protect them against endonuclease digestion and may be a potentially interesting design feature to consider when designing structures for cellular uptake. Against 0.2–10 U of the nonspecific DNaseI (0.77 molar ratio enzyme:substrate), concentrations that were nearly tenfold higher than physiologically present concentrations, the nanostructure was as susceptible to degradation as the linear dsDNA sample.
Even higher order 3D DNA structures such as a DNA origami “nanobottle” (50 nm), DNA rod (350 nm), and wireframe polyhedron (50 nm) showed loss of structural integrity to DNaseI (0.25–1.25 U mL−1); each showed signs of degradation at different concentrations of the enzyme.63 The nanobottle was designed with the commonly used “honeycomb” lattice55 arrangement of DNA helices in the structure, giving it a high packing density of DNA, which could be a contributing factor to its superior stability following exposure to 1.25 U mL−1 DNaseI. In contrast, the rod (square lattice arrangement but high surface area) and wireframe polyhedron (low helical packing density) suffered degradation over 0.5 and 0.25 U mL−1, respectively, illuminating a possible correlation between robustness and general packing density in a DNA structure. It should be noted that the molecular weights (MW) of the three structures tested were not equal (nanobottle ≈5.3 MDa, rod ≈4.7 MDa, wireframe polyhedron ≈4.7 MDa) but equivalent amounts of total DNA (1 nmole of phosphate) in all three structures was incubated with the nuclease. The 3D DNA origami structures made of honeycomb lattice helix bundles (hb) of various sizes—18, 24, and 32 hb—demonstrated a nearly 30‐fold higher resistance to DNaseI degradation (2 × 10⁻⁹ m per structure against 10 U enzyme) compared to a plasmid of the same size.[[qv: 56a]] Studies such as these indicate stability against nuclease attacks using course level resolution by AGE and microscopy but these, in turn, lack the power to analyze DNA structural integrity at the primary (linear sequence) or, sometimes, the secondary (DNA‐DNA base pairing) level.
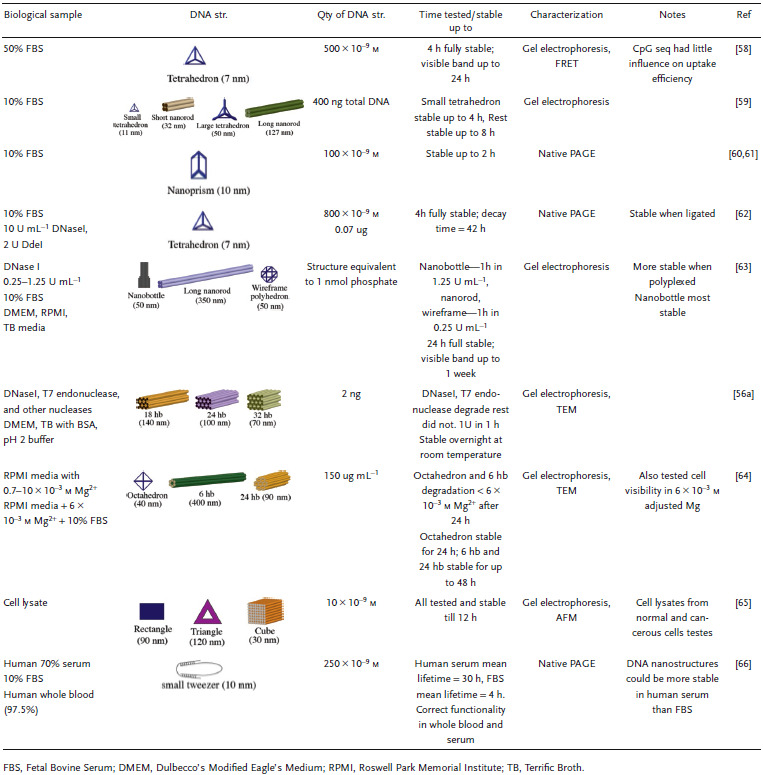
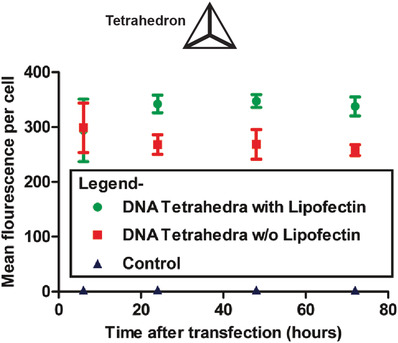
Four different kinds of DNA nanostructures were also tested for stability in FBS.59 Two ≈250 kDa structures consisting of a small tetrahedron (11 nm) and a small rod (32 nm) made from “p425” scaffold (425 bases long; a derivative of the m13mp18 plasmid) and two ≈4.5 MDa structures consisting of a large tetrahedron (50 nm) and large rod (127 nm) made from “p7560” scaffold (7560 bases; also derived from m13mp18) were treated (at equal DNA mass of 400 ng) with 10% FBS (non‐heat‐inactivated in this example) and characterized by AGE. The results in Figure 1 show the small tetrahedron remains stable up to 4 h, as indicated by the smearing in AGE band migration, whereas the other three structures are stable up to 8 h. As a control, p425 and p7560 scaffold strands that were used for the assembly of these four structures were also subjected to the same treatment but showed signs of structural degradation at 1 h.
Figure 1.
Stability of DNA nanostructures in 10% FBS. The design of four DNA nanostructures tested for stability against 10% FBS—small tetrahedron (ST), small rod (SR), large tetrahedron (LT), and large rod (LR). Representative AFM (for ST and SR) and TEM (for LT and LR) images, scale bar = 50 nm. Time‐course AGE analysis of structural integrity after treatment with 10% FBS, in comparison to p425 and p7560 dsDNA scaffolds. Reproduced with permission.59 Copyright 2018, American Chemical Society.
Nuclease resistance was shown to increase significantly by first ligating the ends of the oligonucleotides within the tetrahedron.60, 62 This can be explained by the loss of the exonuclease recognition site on the tetrahedral edge following ligation. Next, this ligated DNA tetrahedron was tested for stability in 10% FBS and results showed that the structure was stable for up to 42 h.62 Similarly, when a DNA “nanoprism” (10 nm) was tested in 10% FBS for stability it resisted degradation for 2 h in the unmodified state.60 However, upon attaching functional groups such as hexaethylene glycol to the 5' and 3' ends of the DNA nanoprism, the stability increased tenfold. Again, it appears that modifying DNA with functional groups or removing open ends, like closing nicked ends via ligation, prevents nuclease recognition. In a follow up study, the DNA nanoprism was designed using phosphorothioate modified strands, which is argued to form a weaker duplex with complementary DNA compared to an unmodified DNA‐DNA duplex, and this assembly was found to be stable for nearly 12 h.61 One thing to point out, based on the variability in FBS stability of DNA structures, is that DNA structural stability also significantly depends on the age of the FBS used. It was observed that fresh FBS tends to have higher nuclease activity than older samples.64
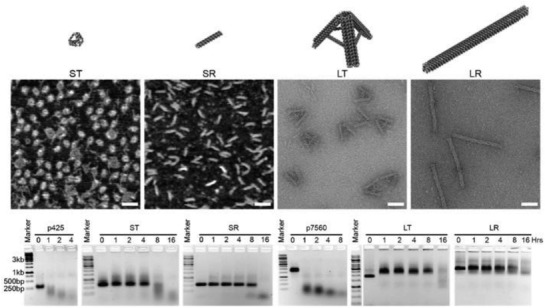
Surprisingly, preliminary reports of DNA nanostructures in human blood and serum conditions have shown a longer range of stability than in FBS. The stability of small DNA “tweezers” (10 nm) were tested in 70% human serum and the tweezers were found to remain not only structurally but also functionally robust up to 30 h.66 The DNA tweezers were programmed to switch between “open” and “closed” states (as shown in Figure 2 ) via fuel strand‐triggered DNA strand displacement reactions. The functionality of the DNA tweezers was tested in whole blood sample (97.5% heparinized whole human blood) and 97.5% human serum using Förster resonance energy transfer (FRET) to visualize the different states. By adding 50% molar excess fuel strands in each step, they found that the DNA tweezer function in human samples mimicked that of the control samples in phosphate buffer saline (PBS).
Figure 2.
Stability of DNA tweezers in human blood and serum. Top: native PAGE results of DNA tweezers incubated in 70% human serum for various time points. Bottom: mean lifetimes of the DNA tweezers, its various functional configurations, and a linear control probe incubated in 70% human serum. Red asterisk indicates absence of data due to purification issues. Cy5.5‐IBRQ, IowaBlack RQ quencher, TET‐IBFQ, IowaBlack FQ quencher. Reproduced with permission under the terms of the Creative Commons Attribution 3.0 Unported Licence.66 Copyright 2015, The Royal Society of Chemistry.
Cell culture media also typically contains lower concentrations of cations such as Mg2+ compared to the 10–20 × 10−3 m Mg2+ ions that are typically included for DNA nanostructure stability in experimental buffers.63, 64 This poses a critical question about long‐term stability without Mg and could lead to the complete degradation of the structure before entry to cells. Hahn et al. performed an interesting study that identified a “middle ground” where DNA nanostructures consisting of a DNA wireframe octahedron (50 nm), long DNA nanorod (400 nm), or solid DNA nanotube (90 nm), and mammalian cells could coexist in a modified cell culture media.64 First, it was found that in standard RPMI (Roswell Park Memorial Institute) media at varying magnesium concentrations (0.7 × 10⁻³ to 10 × 10−3 m), the octahedron and nanorod could not maintain shape at less than 6 × 10⁻³ m Mg2+ concentration. Similarly, the structures degraded by 24 h in RPMI media + 10% FBS. Second, alterations to the media and heat inactivation of the FBS improved DNA nanostructure stability. They tested modified media for cell viability and found that media adjusted with actin (an FBS inactivating agent) worked well for cell viability as well as nanostructure stability. However, the concern about low divalent ion presence in cell cultures and inside the cell is not shared in any subsequent work. Moreover, as will be discussed, in many cases DNA structures still demonstrate sufficient stability to be internalized intact into cells.
Another biological environment that a biomedical nanodevice must sustain is the intracellular space. The internalization pathway (discussed later) consists of a series of subcellular compartments as well as additional nucleases. Mei et al. generated cellular lysates from mammalian cells and incubated three different DNA constructs including a rectangle (90 nm), a triangle (120 nm), and a cuboid (30 nm) for 12 h to find that all DNA structures showed excellent structural integrity using AGE and AFM.65 Moreover, the structures were stable at room temperature in both normal and cancerous cell lysates. On the other hand, linear ss m13, which acts as a scaffold strand in DNA origami structures, and dsDNA lambda phage plasmid (another control with higher MW than these DNA nanostructures) displayed signs of degradation after 1 h when subjected to the same treatment. The ds lambda strand, despite having six times higher MW than the DNA origami structures, suffered degradation which suggests that the complex shape and size of the DNA structures could be a major contributing factor toward their superior stability.
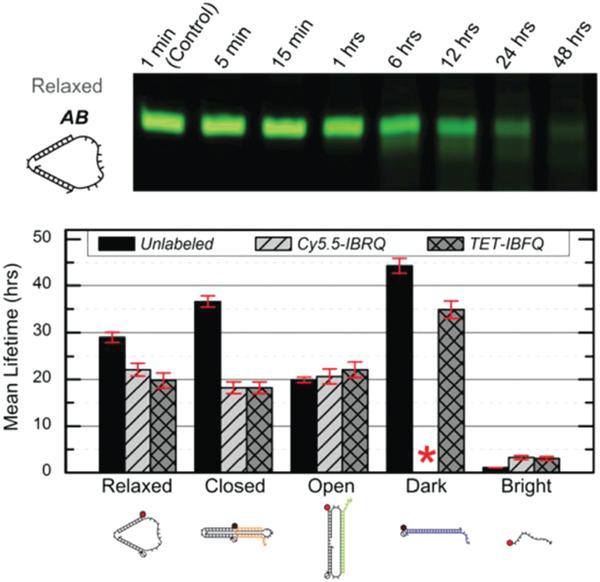
Cell membranes are typically impermeable to foreign nucleic acids (defined as DNA and RNA molecules not indigenous to the cell) and this forms the first line of cellular defense against bacterial and viral nucleic acids. Successful cellular internalization of nucleic acid molecules has been a major roadblock in healthcare, preventing many nucleic acid therapeutics (siRNA, for instance) from reaching their intracellular targets due to nonspecific nucleases, membranes, and other cellular barriers unless chemical modifications are adopted to “mask” the nucleic acid cargo and imbue it with stealth‐like properties.68 Traditionally this masking effect has been achieved using viral or nonviral polymeric nucleic acid delivery systems.69 Given this precedence of resistance to cellular entry without masking, studies showing successful internalization of DNA nanostructures happening at all are quite surprising and suggest that the mechanism for recognition of DNA nanostructures by cell membranes is different from that seen with more linear ssDNA and dsDNA counterparts. In 2011, Walsh et al. showed cellular uptake of a DNA tetrahedron by mammalian cells for the first time (Figure 3 ).70 Interestingly, the DNA tetrahedron structure itself has emerged as a benchmark structure for expanding the role of DNA nanotechnology in healthcare, primarily due to its exceptional simplicity in assembly and its applicability as a small “cage” that could hold cargo ranging from proteins to quantum dots (QDs) for cellular delivery.71 In Walsh's seminal work, transfection of 1 µg of Cy5‐conjugated DNA tetrahedron in HEK (human embryonic kidney) cells was tested with and without the assistance of the transfection agent—Lipofectin, and Cy5 fluorescence observations revealed the stable presence of the tetrahedron within the cells for up to 72 h post‐transfection. Lipofectin is a cationic lipid‐based transfection agent which functions by forming a net positively charged complex with DNA thereby blocks nuclease binding sites and facilitates binding of the DNA to the cell membrane that is generally lipid‐rich and negatively charged. Lipofectin‐DNA complexes are readily internalized by the cell via endocytosis.72 ssDNA oligonucleotides showed an elevated fluorescence readout when introduced to the HEK cell culture to compare with DNA tetrahedron uptake, but on addition of nonspecific nucleases to the system that digested any extraneously attached DNA from the outer cell surface, fluorescence output was reduced significantly; this indicated that while ssDNA adhered to the cell surface, perhaps by hydrophobic interactions, it failed to efficiently internalize. Transfection of the DNA tetrahedron occurred successfully even without the addition of Lipofectin (though it is difficult to assess the transfection efficacy in relation to the initial amount of incubated tetrahedral structure) while simple dsDNA molecules showed the least uptake by cells.
Figure 3.
Mammalian cell internalization of a DNA tetrahedron with and without a transfection agent. Shown here is the flow cytometric analysis of the transfection efficiency and retention inside the cells of fluorescently labeled DNA tetrahedron, with and without Lipofectin. Control was mock transfection without DNA tetrahedron. Reproduced with permission.70 Copyright 2011, American Chemical Society.
Many other simple and complex DNA nanostructures have been tested for uptake in various cancerous[[qv: 22a,25,48a,59,73]] and normal mammalian cell lines,58, 67, 74 without apparent or overt cytotoxicity being observed. There is no easy or universal way to define cellular uptake efficiency and stability of DNA nanostructures as the two properties are dependent on the size and compactness of the nanostructure as well as the cell type.[[qv: 74c]] The complete pathway followed by DNA nanostructures and the factors that dictate apparent differences in the fate of these different structures inside the cell are yet to be completely revealed. Current research indicates that DNA nanostructures are predominantly internalized via receptor‐mediated endocytosis as their sizes typically lie under 200 nm.[[qv: 58,67,73b,75]] The structures remain in the cytoplasm in endosomal vesicles and do not, in general, transport to the nucleus.58 Progressively, at time points which vary by still unknown factors, the structures are fated for lysosomal degradation.[[qv: 74a,b]] Table 4 enumerates some of the representative work performed to understand these processes. When inside endosomes, drug or cargo release from DNA carriers has been primarily attributed to diffusion.[[qv: 59,74c]] Cellular uptake of a DNA tetrahedron was tracked by Liang et al. in HeLa (human cervical carcinoma) cells using confocal imaging of a Cy3 dye conjugated on the tetrahedron.[[qv: 73b]] By individually inhibiting the two dominant endocytic pathways—clatherin‐ and caveolin‐mediated pathways—using specific chemical inhibitors (such as methyl‐β‐cyclodextrin to block clatherin‐mediated endocytosis) they were able to identify that the structures internalized via the latter of the two pathways. Actual lysosomal localization occurred within 3 h, and the structure remained intact within the cytoplasm for at least 8 h as revealed by FRET (between Cy3 and Cy5 dyes). Bastings et al. studied 11 different DNA origami nanostructures ranging in sizes from 50 to 400 nm by chemically modifying each with an oligolysine‐PEG coating and compared their internalization efficacy.[[qv: 74c]] Three Cy5 dye molecules were also conjugated to each structure to track their uptake via confocal microscopy. The chemical coating with oligolysine‐PEG was shown previously to enhance uptake. They also compared the cellular uptake of the structures in 3 different cell lines—HEK293, HUVE (human umbilical endothelial) cells, and BMDC (human bone‐marrow derived immune cells)—with known differences in NP uptake rates. The subsequent analysis provided a clearer picture on the factors that govern DNA nanostructure uptake into cells, namely the shape, density, and overall compactness of the DNA nanostructures. The DNA “block,” which is a solid hb (16 nm × 21 nm × 50 nm) had better uptake efficiency than a “barrel” that is hollow (60 nm diameter) or wireframe octahedron (50 nm) of the same MW (≈5 MDa). Additionally, the three cell lines showed varied uptake capacity for the same nanostructure suggesting that uptake rate into target cells must be carefully considered before DNA nanostructures are exploited as biomedical delivery agents. In the case of HEK293 and HUVE cells, the fluorescence readout used to monitor the uptake of the nanostructures reached its highest values at 2 h whereas the fluorescence intensity steadily increased in the BMDCs for up to 12 h but at a slower rate.
Table 4.
Representative examples of cellular uptake of DNA nanostructures
There is still a lack of information on the actual internalization process and how a negatively charged molecule such as a DNA nanostructure interacts with the negatively charged lipid‐rich cell membrane prior to endocytosis. In addition to the work by Liang et al. on DNA nanostructure tracking,[[qv: 73b]] Xia et al. published an excellent study on DNA tetrahedron uptake by three different cells—BEAS‐2B (normal bronchial epithelial) cells, HeLa cells, and RAW264.7 (mouse macrophage precursor immune cells) cells—by mapping the internalization pathway of the nanostructure.[[qv: 74b]] The quantitative trajectory for each cell type through the internalization process varied right from the membrane anchoring stage; endocytosis was rapid for the RAW immune cells but slower by 8 s for the normal and cancer cell types, though this time difference may not be significant. Inside the cell, fluorescence intensity indicative of tetrahedron concentration increased up to 12 h in the immune cells then decreased over time, but the epithelial cells (BEAS‐2B) showed a steady increase in uptake for 24 h. This again confirms that the choice and engineering of an optimal DNA‐based nanocarrier may be highly dependent on the target tissue type.
In a more recent study, the physical mechanism underlying the uptake of a DNA tetrahedral structure was interrogated in depth by Ding et al.82 They verified that the internalization of the structure was predominantly mediated by caveolin proteins which are present on lipid “rafts” (cholesterol‐rich domains) on the cell membrane. According to their analysis, which combined molecular simulations and experimental data, attraction from the net‐positive caveolin proteins was crucial for the initial approach of the tetrahedral structures to the cell membrane. Thereafter, in order to minimize the like‐charge repulsion between the negative membrane and DNA, the tetrahedral structures were found to approach the membrane vertex‐first. Particle dynamic simulations revealed that the tetrahedral structures reoriented themselves to a “corner attack” position on approaching the membrane. This is one of the first studies that has taken a critical look at the molecular mechanism of DNA structural uptake and provides insight into physical design features that support DNA architecture‐cell membrane attraction. Based on the observation about the successful “corner attack” strategy of the DNA tetrahedron's approach to the cell membrane,82 it is probably worth reviewing the other DNA nanoshapes that have been studied in relation to cell uptake efficiencies and analyzing their surface charge density to identify what makes one shape more favorable for uptake than the other.
The choice of cellular receptor to be targeted can also be critical to influencing the internalization pathway of drug carrying DNA‐based structures. For instance, folate receptor, known to be highly expressed on certain cancer cells versus at a very low rate on normal cells, has major clinical relevance for improved drug targeting.83 One study showed that the presence of a single folate molecule on a DNA octahedral cage (20 nm) magnified its uptake by 40 times between malignant cells and normal cells.[[qv: 22b]] Two cell lines with predetermined folate receptor makeup on the cell membrane—HeLa (folate positive) and A431 (human epidermoid cancer cells; folate negative)—were incubated for 24 h at 37 °C with 3 × 10⁻⁶ m (2 µg mL−1) of the octahedral cage and it was found, via DNA blot analysis of DNA extracted from cell lysates, that HeLa cells showed a much clearer preference for the folate‐labeled cage than A431. Strikingly, DNA cages without folate molecules only had tenfold less uptake in HeLa cells in contrast to cages+folate, which points to a general preference for DNA structure uptake by HeLa cells. Even the internalization pathway is correlated to the ligands attached on the DNA nanostructure. For example, in a follow‐on study, the uptake of this octahedral cage was compared between two different cell surface receptors (as shown in Figure 4 ).[[qv: 74d]] Two known receptors—LOX‐1 (a receptor for oxidized low‐density lipoprotein; ox‐LDL) and αFR‐1 (α isoform of the folate receptor)—have different signaling pathways for uptake of molecules. The former is a scavenger receptor and leads to dynamin‐dependent uptake pathway ending in lysosomal degradation while the latter is dynamin‐independent and tags for lysosomal load release into the cytoplasm thereby circumventing degradation. Octahedral cages at roughly 18 × 10−6 m (13 µg mL−1) labeled with fluorescein isothiocyanate (FITC) and biotin and folate ligands against the ox‐LDL or αFR‐1 receptors, respectively, were introduced into cell lines that have different membrane receptor makeup—HeLa (αFR positive), COS‐LOX‐1 (LOX‐1 positive; COS are monkey kidney fibroblast‐like cells), A431 (αFR negative) and COS‐NT (LOX‐1 negative) cells. The cage internalized in COS‐LOX‐1 cell was directed to lysosomes within 4 h of uptake as seen by confocal analysis whereas in HeLa cells the cage accumulated and remained in the cytoplasm for over 48 h, with the control cells showing no nanostructure uptake.
Figure 4.
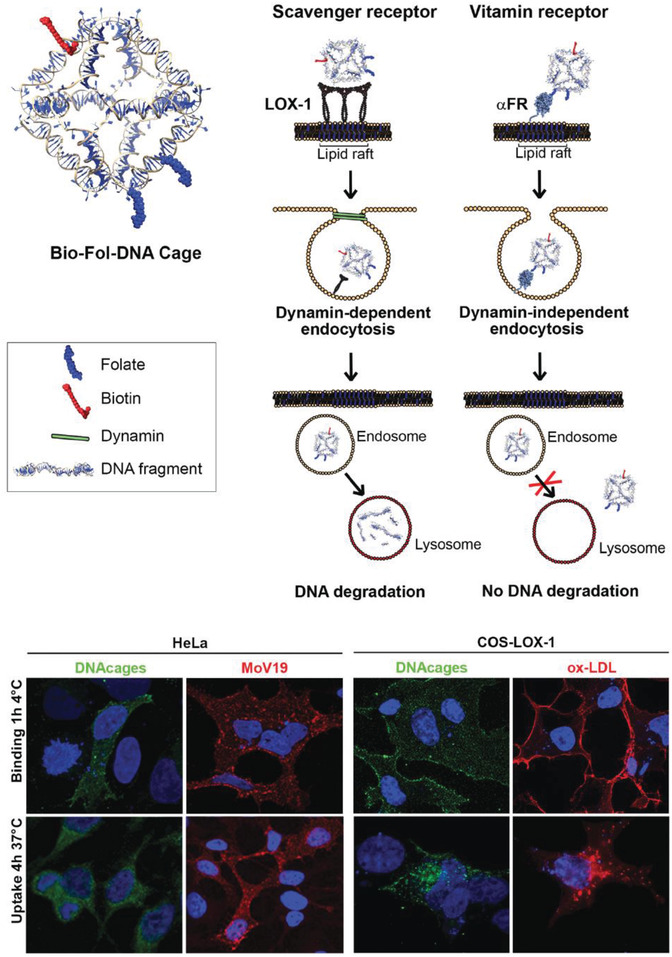
Uptake of a DNA octahedron via two endocytic pathways. Top: schematic of a DNA octahedral structure modified with one biotin molecule and two folate molecules. Two internalization pathways were tested for the uptake of this DNA structure—scavenger (with LOX‐1 receptor) and vitamin B12 (with α‐folate receptor). Bottom: confocal analysis of the intracellular distribution of the DNA octahedral structures. The distribution of the structures (seen in green due to Streptavidin‐FITC fluorescence) in HeLa (αFR positive) and COS‐LOX‐1 (LOX‐1 positive) cells was compared to competitive ligands—anti‐FR antibodies Mab MoV19 for HeLa and ox‐LDL for COS cells. Negative control cells that are not shown here—A431 (αFR negative) and COS‐nt (LOX‐1 negative) cells showed no DNA octahedron uptake. Nuclei are visualized by DAPI (blue). Reproduced with permission.[[qv: 74d]] Copyright 2018, The Royal Society of Chemistry.
While such DNA nanostructures appear to readily internalize in cells, chemical modifications or the addition of exogenous agents such as Lipofectin62 can be adopted to further improve uptake efficacy by protecting against nuclease attack or facilitating cell membrane anchoring63, 79, 84 For example, DNA structures can be encapsulated in cationic block copolymers to create polyplexes with PEG poly‐lysine molecules.[[qv: 84b]] Other polycation agents including chitosan and linear polyethyleneimine (LPEI) were used for coating three 3D DNA origami nanostructures (previously discussed nanobottle, rod, and wireframe polyhedron)63 and were found to create polyplexes that remained structurally robust in Mg2+ depleted cell culture media for up to a week, which certainly bodes well for long‐term applications.63 Additionally, the structures remained stable in 10 U mL−1 DNaseI for at least 1 day (d) which, being an unrealistically high DNaseI concentration compared to naturally occurring amounts, can be assumed to reflect enhanced stability. Several other instances of protecting DNA structures have been demonstrated.[[qv: 84a,c–e]] Cellular uptake of DNA nanostructures, particularly in the case of immune cells, can be attenuated by lipid coating mechanisms thereby potentially mitigating unwanted immune response in organisms.79 However, what remains unclear at this point is whether what works well for in vitro cellular delivery for one structure will translate into in vivo utility for all DNA structures.
An important question also arises about whether the intracellular presence of DNA nanostructures can trigger an innate chemical response in immune cells such as dendritic cells, which are the primary line of defense in the body, or in lymphocytes. Schuller and Heidegger's work from 2011 indicates that even DNA nanostructures constructed without any immunostimulatory factors (that are known to trigger an immune response by themselves) could trigger an immune response in mouse splenocytes; the latter are a heterogeneous soup of immune cells sourced from the spleen.[[qv: 74a]] Here, DNA nanotubes (80 nm) were directly added to the cell culture plate (50 µL at 2.4 × 10⁻⁹ m, which is ≈8 µg L−1) and incubated for 18 h and the secretion of classical indications of immune activation—interleukin‐6 (IL‐6), IL‐12, and transmembrane C‐type lectin CD69—were monitored. While DNA nanotubes modified with added CpG rich ssDNA strands (contiguous Cytosine and Guanine nucleotides) sequences on the surface did trigger elevated levels of the immune markers due to the immunostimulatory properties of CpG sequences, the unmodified nanotubes were also able to induce the secretion of IL‐6 and IL‐12 but not CD69 which suggests one path of immunostimulation from among several available was activated. A similar trend was observed by Perrault and Shih upon introducing a DNA origami octahedron (50 nm; with no added CpG sequences) into mouse splenocytes (50 µg mL−1).79 On the other hand, testing the tetrahedron versus three cell‐types study by Xia et al. (discussed above) showed that tetrahedron concentrations as high as 100 × 10−9 m (≈8 µg L−1) did not elicit an immunoresponse in dendritic RAW264.7 cells after 24 h which runs counter to these studies.[[qv: 74b]] There was no apparent secretion here of IL‐6 and IL‐12 from the RAW264.7 cells in the presence of intracellular tetrahedra, nor was there any change in the levels of apoptotic‐associated proteins. Even though these studies point to a possible correlation between the size of the DNA structure and its immunostimulatory properties—80 nm nanorod and 50 nm octahedron show stimulation but not the 7 nm tetrahedron—it can only be said empirically that perhaps the size of the nanostructure is an influential factor in direct immune‐cellular stimulation because it is difficult to compare the total amount of DNA tested in each case. The frequency of occurrence of CpG sites in the DNA strands within each structure has also not been systematically quantified, which also makes it challenging to come up with an assessment of the capacity of each DNA structure to trigger an immune response. Clearly, further research is warranted to develop a better understanding of the implications of introducing DNA nanostructures into mammalian cells and organisms.
Moving onward in the uptake process, DNA‐based constructs also need to be tested within live mammalian systems for potential roles in drug delivery. In 2011, Bhatia et al. injected a small DNA icosahedron structure (10 nm; abbreviated as I) into the nematode Caenorhabditis elegans, which is a benchmark 969 cell containing model organism for preliminary in vivo and toxicity studies (Figure 5 ).[[qv: 75a]] The icosahedron was loaded with a pH sensitive fluorescent molecular cargo—FITC‐dextran (abbreviated FD10; forming an IFD10 complex)—that could illuminate the anionic ligand‐binding receptor mediated endocytic pathway (ALBR) as IFD10 was taken up into coelomocytes (specific cells that expressed ALBRs). For this, 3 × 10⁻⁶ m IFD10 (equating to 15 × 10−6 m FD10) was injected into C. elegans and observed to accumulate in endosomes and finally to lysosomes 3 h postinjection. The pH sensitive FD10s clearly indicated a reduction in pH (with fluorescence change) reflecting putative lysosomal acidification without any systemic toxicity. On the other hand, injecting free FDs led to nonspecific delivery of the particles in the entire organism. In other work with C. elegans, a simple three‐stranded dynamic pH sensing nanodevice was shown to be functionally effective.[[qv: 75b]] After these promising results, a methodology to systematically study the stability of the icosahedra and the dynamic pH sensing nanodevices in C. elegans was reported.[[qv: 75c]] Due to the high negative charge of the DNA backbone, anion ligand‐binding receptor mediated endocytosis was found to be the mode of uptake. The half‐life of each structure followed the same correlative trend that was dependent on structure size and shape—the icosahedra IFD10 half‐life was 24 h, pH sensor without ssDNA components half‐life was 11 h, and the sensor with ssDNA components showed a half‐life of 8 h.
Figure 5.
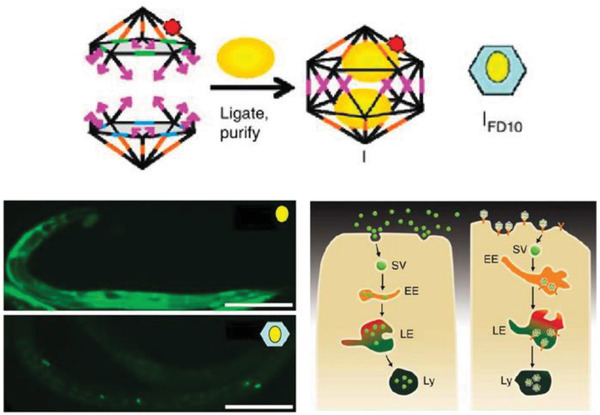
Uptake of a DNA icosahedral nanostructure in C. elegans. Top: schematic representing the structure of the DNA icosahedron and encapsulation of FD10 molecules within the structure (IFD10). Bottom: representative image of a C. elegans wild‐type specimen injected with free FD10 (upper image) and IFD10 (lower image). It can be seen that the IFD10 accumulated primarily in the coelomocytes unlike the even distribution throughout the organism in case of free FD10 molecules. Schematic showing the two pathways of endocytosis taken by free FD10 versus IFD10, respectively. EE, early endosome; LE, late endosome; Ly, lysosome; SV, spherical vesicle. Reproduced with permission.[[qv: 75a]] Copyright 2011, Springer Nature.
In 2012, a DNA tetrahedral nanostructure was tested inside a live mouse model,85 followed by different groups demonstrating uptake of DNA nanostructures in cockroaches,80, 86 and other mouse models.77, 78, 79, 81, 87 A common observation from these studies is that bare DNA nanostructures that are not labeled for targeting specific organullar sites in an animal model accumulate in the bladder for renal clearance without apparent toxicity. The choice of cockroaches as a model organism can be partially attributed to the low presence of endogenous nucleases in the insect. The cockroaches were injected with 3 pmol of DNA origami barrels, referred to as “nanorobots,” and no lethal effects were reported postinjection. The nanorobots suffered progressive disintegration with only 1% of the constituent m13 scaffold remaining intact in the DNA extracted from insects collected after 36 h.80 The nanorobots were evenly distributed throughout the body and remained so until the insects were sacrificed. In contrast, in a mouse model, a DNA octahedral structure (DNO) that was comparable in size and complexity to the nanorobot was intravenously injected and it was observed over the course of 120 min to primarily concentrate to the bladder of the animal (for renal clearance) instead of throughout the body, as discussed in Figure 6 .79 When the same DNO was coated with a lipid bilayer (E‐DNO), it demonstrated an even distribution throughout the body of the animal while un‐coated DNO (N‐DNO) accumulated in the bladder. Like the cockroach study, the bodily presence of N‐DNO did gradually decline to 20% by the time of animal sacrifice (120 min postinjection) suggesting an attack on the structural integrity of the nanostructure. Lipid‐coated E‐DNA also displayed an enhanced half‐life in the organism, which is a sign of protection against nuclease digestion—370 min compared to a 50 min half‐life for N‐DNO.
Figure 6.
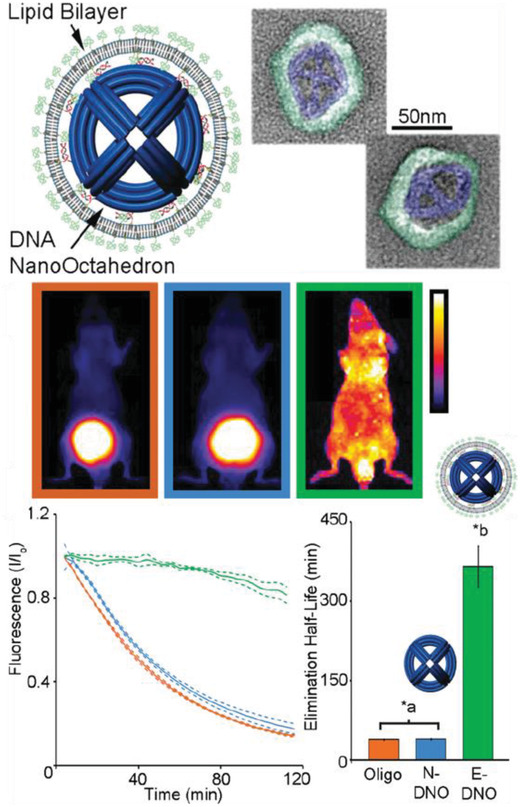
Uptake of a DNA octahedral structure (DNO) in mice. Top: schematic of a DNA origami octahedron with a lipid bilayer coat. Representative TEM images of the structure; blue indicates the lipid bilayer. Middle: whole animal optical images of the distribution of three samples within mice—a dsDNA molecule, bare DNA octahedron (N‐DNO), and lipid coated DNA octahedron (E‐DNO). Bottom: fluorescence imaging 120 min postinjection indicates E‐DNO had an even biodistribution whereas N‐DNO and dsDNA accumulated in the bladder. Estimated elimination half‐lives show significantly higher half‐life for E‐DNO (*a,b p < 0.05). Reproduced with permission.79 Copyright 2014, American Chemical Society.
It appears that DNA‐based structures can withstand the nuclease‐rich environments of cell culture, the cytoplasm, and even the blood circulation of animal models to various extents when properly designed. Transfection agents and hybrids of DNA‐lipid or DNA with appropriate chemical modifications could improve structural stability and therefore warrant more attention in developing applicable DNA nanodevices. When inside the cell, the general fate that most DNA structures face is lysosomal degradation (unless tagged for nuclear transport using nucleolin‐specific ligands as discussed in the therapy section),[[qv: 73b]] but this still can be harnessed to meet the specific goals of a targeted delivery of a drug/imaging agent or for release when degraded in the cytoplasm. Moreover, long‐term stability of DNA nanostructures in biological fluids is a useful property, in and of itself, for incorporation into assay‐based diagnostic tools.
4. DNA Nanostructures as Biomedical Sensors
Biosensors are highly desired for biomedical application beyond just diagnostic assays. The ability to visualize and measure drug concentrations at treatment sites along with physiologic state at a local cancer are among the typical capabilities desired. As mentioned, this utility is desired especially in the context of theranostics and multifunctionality which makes this development task even more challenging. However, the state of the art is not quite at the point of wholesale in vivo utility so we focus more on diagnostic utility here. Within this aspect, the sensing is almost always done by removing a biological fluid/sample (blood, serum, urine, and saliva, for instance) from the patient and then processing it.
Current challenges in generalized biosensing include sensor lifetimes, detecting fluorescence or other types of signal transduction in vivo, crosstalk in specific targeting, and most importantly, the lack of a precise means of processing myriad different biological signals into physical signals that are easily transduced outside the body. There is also often the need to block unoccupied sensor areas to reduce nonspecific attachment of other nontargeted molecules.88 Ideal biosensors allow the colocalization of biorecognition and signal transduction elements on one miniaturized platform and possess quick recognition times and low limits of detection (LOD). One approach to achieving colocalization is by using surface‐based biosensors, wherein large numbers of biorecognition and signal transduction elements are immobilized onto a physical macroscale substrate.89 A measurable signal that is monitored in this context is usually electrical, optical, or magnetic in nature. A second category of biosensors includes solution‐based sensors, wherein the output from a bulk population of sensors is measured.90
Surface‐based sensors present the technical challenge of precise top‐down fabrication of the system such that the analyte capturing components as well as the signal reading element are positioned for rapid signal transduction. In other words, building micro‐ to nanoscale circuitry for biosensing. Solution‐based sensors including those that are applied in immunoassays, cultures, and nucleic acid amplifiers are homogeneous and lend themselves to sensing in physiological conditions. In some cases they can, however, be extremely labor intensive, require sample preprocessing, and therefore may not be suitable for use in so called point‐of‐care (POC) diagnostic devices that are meant to be disseminated as rapid testing and diagnosis equipment directly at the site of the patients especially in resource‐poor locations around the world instead of in resource‐rich centralized laboratories.91 These techniques also lack the flexibility to program logic‐driven or differential diagnosis using multiple biomarkers for the definitive diagnosis of a particular disease or physiological state. Biosensors based on label‐free detection of analytes, such as surface plasmon resonance (SPR) transducers,92 rely predominantly on optical responses for detection and therefore their efficacy also heavily depends on the precise physical coupling of the optically functional elements with the analyte capture/interrogation site.91 Even surface‐based label‐free biosensors may require preprocessing of a human sample before introducing it to the detector.
Biomedical analytes that are of interest for diagnosis include nucleic acid species, proteins/peptides, and small (bio)molecules such as adenosine triphosphate (ATP) and ions. Noncoding RNA molecules particularly microRNA (miRNA), which are 22 nucleotides (nt) long sequences with critical roles in post‐transcriptional gene regulation, are tremendously useful indicators of disease onset and possess distinctive expression profiles indicative of various pathological states in the human body.93 For different cancers and other pathologies, scientists have identified associated extracellular blood circulating miRNA molecules that have shown differentiated expression levels and can act as fingerprints of these diseases. Circulating miRNA molecules can be present in minuscule quantities and the amount can vary by a factor of 100 between different miRNAs, from 10−14 m or a few thousand to 106 copies µL−1 in blood plasma.94 The current gold standard for miRNA detection is offered by traditional and newer techniques of molecular amplification or microarrays.95
One of the overarching goals in diagnostics has been to find rapid and portable alternatives to polymerase chain reaction (PCR) and other miRNA amplification methodologies owing to costly instrumentation requirements, the challenge of amplifying short sequences in critical enzyme conditions (pH and temperature), and the preclusion of any in vivo diagnostic applicability. Due to these challenges, the quantification of one miRNA marker is often not sufficient for conclusive diagnosis and multiplexing becomes necessary. Similarly, the quantitative analysis of more than one protein is also important for protein‐based biosensing and the expression profile of one blood‐based protein biomarker is also not usually conclusive. Traditionally, protein biosensing is comprised of protein recognition and capture by aptamers, enzymes, or antibodies onto a substrate followed by signal transduction.96 The engineering of precisely immobilized ligands without crosstalk on electrodes or arrays as well as multiplexing for multiple protein analytes can be a challenge without advanced bottom‐up assembly. Additionally, immunoassays are generally two‐step in nature where the analyte binds to one site and then a second detection component (e.g., a labeled antibody) binds to the analyte or primary antibody for a measurable output.91 Due to these and a plethora of similarly vexing issues, it would be of great utility to have a system that has modular analyte binding and readout components for one‐step detection as well as reduced cost associated with designing different sensors for different analytes.
Given the self‐assembling properties of DNA, its biocompatible nature, and its amenability toward easy chemical conjugation to NPs and fluorescent molecules, there is potential for addressing many of the above technological challenges. DNA‐based sensors capitalize on the bottom‐up assembly of DNA as a vehicle for the proper positioning of the sensing elements. Additionally, in some examples of diagnostic systems the various reaction mechanisms demonstrated by DNA are good tools for transducing the biological signal into a measurable signal thereby highlighting a second, more functional, role of DNA in sensors. Table 5 summarizes some representative biosensor examples that harness DNA nanotechnology capabilities. We proceed here with the discussion on current progress in DNA‐based biosensors from simple to more complex functionality. DNA biosensors designed from simple constructs such as molecular beacons have been demonstrated for several decades.97 Molecular beacons are hairpin‐loop oligonucleotides that are terminally modified with fluorescent dyes (for FRET‐based detection) and contain within the stem region of the strand a sequence that is complementary to a target nucleic acid or other type of analyte as in the case of an aptamer. This makes them somewhat cost ineffective as a new dual dye‐labeled hairpin DNA is constructed for each target analyte, as well as not conducive to multiplexing. Higher order more functional DNA nanostructures containing a substrate DNA structure, a bioreceptor for recognition, a signal transduction moiety, and with a potential role for both in vitro and in vivo biosensing are far more promising than molecular beacons.
Table 5.
DNA‐based biosensors for medical/physiologically relevant targets
| Target | Relevance | Format | Sensing mechanism | Biological sample | LOD | Notes | Ref. |
|---|---|---|---|---|---|---|---|
| Single nucleotide polymorphism | Gene mutations | DNA rectangle | AFM | Synthetic oligos | – | – | 98 |
| pH, mercury, ATP | Cancer | DNA tetrahedron + ATP aptamer | FRET | HeLa cells | 2 × 10⁻⁶ m | – | [[qv: 43a]] |
| ATP | – | DNA nanoplier + aptamer | FRET, AFM | Synthetic aptamer | 0.1 × 10⁻⁹ m | Split aptamer technique | 99 |
| Circulating tumor cells | Cancer | DNA tetrahedron + aptamer | Electrochemical aptasensor | Cell‐spiked blood sample | 5 cells mL−1 | Hybrid system using Au electrodes | 100 |
| Anti‐DNA antibodies | SLEa) | DNA rectangle, nanorod (400 nm) | Fluorimetry | Serum from SLE patients | b) | Specificity against other diseases | 101 |
| Prostate‐specific antigen | Cancer | DNA tetrahedron + HCR;c) AgNP | Electrochemical aptasensor | Human serum | 0.05 pg mL−1 | Performed superior to current methods | 102 |
| miRNA | Cancer | AuNP + DNA probe | Fluorescence quenching of AuNP | Breast cancer cells | 0.31 × 10⁻⁹ m | – | 103 |
| miRNA | Heart failure | DNA rectangle | AFM | Synthetic miRNA | – | Poor efficiency | 104 |
| miRNA | Cancer | DNA tetrahedron + ferrocene tag | Electrochemical | Synthetic miRNA | 10 × 10−12 m | – | 105 |
| miRNA | Cancer | Azo‐labeled DNA cluster (35 nm) | Enzyme‐free electrochemiluminescence | Total RNA extracted from cells | 6.6 × 10⁻¹⁵ m | The nanomachine reset system | 106 |
| Gene | Cancer | DNA tetrahedron + magnetic bead | Magnetic microparticles | Fetal calf serum | 10 × 10−15 m | Increased S/N ratio | 107 |
| PTK7 gene | Cancer | DNA nanospheres (200 nm) + lysozyme aptamer | FRET | Lysozyme, BSAd), thrombin, streptavidin | 0.63 × 10⁻⁹ m | – | [[qv: 48a]] |
| PfLDH protein | Malaria | DNA rectangle + aptamer | AFM | PfLDH protein | – | – | 108 |
| Thrombin | Thrombosis | DNA rectangle + aptamer | Microchip isotachophoresis | Thrombin‐spiked cell lysate | – | Separation of bound complex in less than 5 min and 150‐fold signal enhancement | 109 |
| Thrombin | Thrombosis | DNA 24 hb, DNA tetrahedron | Fiber optic SPR | Thrombin | 6–11 × 10−9 m | Aptamer density tested | 88 |
| Theophylline | Bronchodilator | DNA tetrahedron + aptamer | Electrochemical aptasensor | Serum | 70 × 10−9 m | Split aptamer increases sensitivity | 110 |
| Zika nucleic acid | Viral diagnosis | AgNP + DNA hairpin on DNA “nanoantenna” | Surface plasmon enhanced FRET | Serum | – | Example of optical signal amplification | 111 |
SLE, systemic lupus erythematosus
Even though no LOD was calculated, the study successfully tested the biosensor on samples derived from SLE patients
HCR, hybridization chain reaction
BSA, bovine serum albumin.
The simplest cases involve DNA‐based platforms upon which one or several target‐specific ligands are chemically positioned along with a precisely colocalized reporting system such that binding of the target molecule to the ligands creates an observable or reportable signal. The colocalized reporting system could be electrical, fluorescent, or topological. A DNA mutation sensor designed for single‐nucleotide polymorphism (SNP) detection exemplifies such a platform wherein FRET‐pair labeled DNA sequences that are complementary to a target oligo but bear each type of nucleotide polymorphism at the SNP site were arranged on a DNA‐based rectangular surface (100 nm).98 The hybridization of the target oligo to only its perfectly matched complementary sequence altered the FRET‐pair distance as well as changed the physical topology of the DNA rectangle; these two processes were visualized using fluorescence microscopy and AFM, respectively. Plasmodium falciparum lactate dehydrogenase (PfLDH), a parasite secreted biomarker that is found in elevated amounts in malaria patients, is a key target biomarker for field‐deployable rapid diagnostic tests.112 PfLDH sensing was similarly demonstrated by capturing the molecule using PfLDH‐specific aptamers on another DNA rectangle and again characterized by AFM.108 For these AFM‐based sensors, it is challenging to assess the LOD due to the small sample size that is characterized; a few hundred sensors are visualized on the AFM and observed for the presence or absence of analyte. Moreover, AFMs are expensive and complex instruments that don't lend themselves to easy POC diagnosis. However, AFM‐based sensors function as excellent characterization tools during the developmental stage of DNA‐based biosensors due to the immediate visual confirmation it offers.
Exploiting a competitive binding assay format, Domljanovic et al. used a DNA origami structure for the detection of systemic lupus erythematosus (SLE).101 One class of analytes used for the diagnosis of SLE is that of anti‐DNA antibodies which are generated and present in patients.113 These antibodies have an affinity for binding to DNA via π‐stacking interaction with the nucleotides, much like intercalating dyes such as SYBR Green, ethidium bromide, and thiazole orange do.114 To this end, two DNA origami structures, a DNA rectangle (100 nm) and a rod (400 nm), were saturated with the intercalator dye Eva Green such that the dye molecules were positioned within the base stacking of the DNA. Anti‐DNA antibodies, if present, bound to the DNA structure and consequently displaced the intercalator dye in a concentration‐dependent manner. The amount of displaced dye (seen by a change in fluorescence output) was correlated to the quantity of anti‐DNA antibody present. The samples that were tested in this example belonged to SLE patients, thereby clearly reflecting the immediate clinical significance of the technique. A comparison of this technique with enzyme‐linked immunosorbent assay (ELISA) was also performed and found to demonstrate a tenfold poorer LOD than ELISA, which is not encouraging, but with lesser cost. Prognostic levels of anti‐DNA antibodies vary drastically with time, age of person, and even the type of antibody measured, which warrants rapid and repeated testing of patients for correct assessment.113 In such cases, utilizing this test as a preliminary screening assay can be still useful in terms of cost and resource effectiveness.
Due to their defined structural properties, DNA scaffolds enable the mediation and control of the spatiotemporal distance between attached bioreceptors and reporter systems. Overcrowding of analyte reaction sites can be an issue in detection efficiency, making it important to have a means of defining the density of the sites on the surface of diagnostic sensors and arrays. In an effort to address this issue, rigid DNA hbs were designed to mediate the density of FRET‐pair labeled thrombin aptamers on a gold surface for SPR‐based sensing.88 The orientation of the hb on the gold surface—parallel or perpendicular to the gold surface—influenced the relative distance of the fluorophores from the gold surface by nearly 100 nm and the density of thrombin receptors by tenfold. However, the LOD in all cases was comparable—10 × 10−9 m which is within the reference range of physiological thrombin levels in blood clot events.115
A growing repository of DNA nanostructures are now available that show dynamic actuation and reconfigurability in response to external stimuli; this is also what helps distinguish the potential of this class of technology from most other sensor types.[[qv: 14a,46,116]] Reconfigurability enables designing distinct positive and negative states (target present or absent) in DNA‐based sensors thereby reducing signal noise commonly found in existing sensing techniques. For instance, electrochemical biosensors, wherein analyte detection is transduced into an electrical signal, when integrated with DNA structures showed enhanced signal to noise and, in some cases, amplified the signal since the probe was physically much closer to the sensing electrode.100, 102, 105, 110 Electrochemical sensors are prominent in POC diagnostics due to their instrumental simplicity and ability to be spatially multiplexed compared to ELISA and PCR, both of which also require other costly resources.117 They are also versatile and can target a range of protein, ionic, and nucleic acid‐based analytes. Sensitivities achieved by electrochemical sensors are as low as 4 × 10⁻¹⁵ m.117, 118 Epitomizing the potential available here, Liu et al. created a miRNA sensor from a DNA tetrahedron‐ferrocene electrochemical “aptasensor” (aptamer biosensor).105 A ferrocene molecule was conjugated to a stem loop DNA aptamer strand that was attached to one vertex on the DNA tetrahedron (Figure 7 A). The DNA tetrahedron, in turn, was immobilized on a gold electrode by thiol bonds such that ferrocene was positioned furthest from the gold surface. In the absence of aptamer target molecule hsa‐miR‐21, a miRNA biomarker for lung cancer, the ferrocene on the DNA tetrahedron remained sequestered from the gold electrode due to the stem loop aptamer structure. In the presence of the target miRNA the aptamer stem loop underwent reconfiguration into a linear structure that enabled ferrocene‐gold electrode coupling and a change in the overall electrical output (Figure 7B). The LOD achieved by this technique was 10 × 10−12 m, which is significantly better than many other comparative approaches.117
Figure 7.
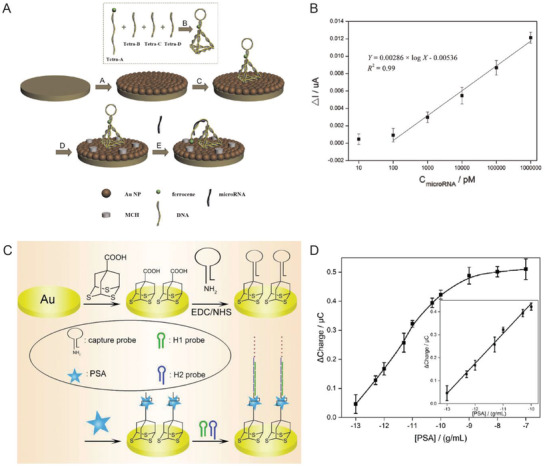
DNA‐based electrochemical biosensors. A) Schematic showing an example of a DNA tetrahedron‐electrochemical miRNA aptasensor. Gold electrode surface was first electrochemically coated with AuNPs, followed by the immobilization of a DNA tetrahedron bearing a ferrocene‐labeled DNA stem‐loop. Unoccupied AuNPs were blocked with mercaptoethanol (MCH) to mitigate nonspecific miRNA binding. MiRNA in solution hybridized with the stem‐loop structure and opened it resulting in uninhibited ferrocene‐gold electrode interaction and a change in the overall electrical output. B) The linear relationship between peak current and increasing miRNA concentration achieved through the electrochemical aptasensor. Reproduced with permission.105 Copyright 2015, Elsevier. C) Schematic of HCR‐assisted signal amplification on an electrochemical biosensor for the detection of prostate‐specific antigen (PSA). (D) Calibration plot of the PSA electrochemical biosensor showing the correlation between the net charge versus the logarithmic concentration of PSA in solution. Reproduced with permission.[[qv: 102a]] Copyright 2018, Elsevier.
Signal amplification can be embedded into biosensors using another DNA reaction mechanism discussed in Table 2 namely that of hybridization chain reaction (HCR). HCR is an enzyme‐free, isothermal DNA amplification technique where two hairpin DNA strands (referred to as fuel strands) trigger hairpin opening of one another in the presence of an initiator molecule and thereby create a rapid cascade of hybridization events.[[qv: 49b]] For a given amount of fuel strands, the longer the reaction is allowed to run the higher the signal amplification that can be achieved. In one example, a DNA tetrahedron‐based electrochemical aptasensor was modified with an aptamer specific to the prostate‐specific antigen (PSA), which is a protein secreted by epithelial cells in the prostate gland and elevated levels of this protein in the serum are used as an initial indicator of prostate cancer (Figure 7C,D).[[qv: 102a]] This system also contained an excess of two freely floating fluorescent fuel strands for HCR. PSA capture by the aptamer exposed an initiating sequence that triggered HCR on the DNA tetrahedron. Temporally longer HCRs created an amplified signal indicating the presence of PSA. The LOD achieved in this work—0.005 pg mL−1—was far superior than many other methods of PSA diagnosis. In a similar HCR approach, a detector for HepG2 liver cancer circulating tumor cells (CTCs), which are typically present in very minuscule numbers (< 3000 cells mL−1) in the bloodstream but are crucial indicators of metastasis, was engineered using a combination of a DNA tetrahedron, CTC‐specific aptamers, and fluorescent dendrimeric DNA structures for signal amplification.100 A LOD of 5 cells mL−1 could be detected with high specificity which is rather exceptional in comparison to other aptamer‐based sensing formats.
More sophisticated reconfigurability has also been embedded and harnessed in other types DNA‐based diagnostic systems. These include DNA “nanopliers” that switched from an “open” to a “closed” state upon capturing a variety of analytes and concomitantly produced a change in the fluorescent readout as well as the nanoplier topology seen under the AFM.99, 119 Analyte capture took place on the inner surface of the two arms of the DNA nanoplier using target‐specific ligands. For signal transduction, the two arms were coupled by a FRET donor‐acceptor dye pair such that a change in the state of the nanopliers from closed to open could be observed via fluorescence microscopy. In the example shown in Figure 8 , ATP sensing via the DNA nanopliers was executed by designing a split aptamer within the arms of the nanopliers.99 Each strand in the split aptamer was conjugated to an arm of the DNA nanoplier. Upon the capture of two molecules of ATP, structural reconfiguration in the split aptamer strands triggered the closing of the two arms together and a change in the overall FRET output. No LOD was specified, however, for this system.
Figure 8.
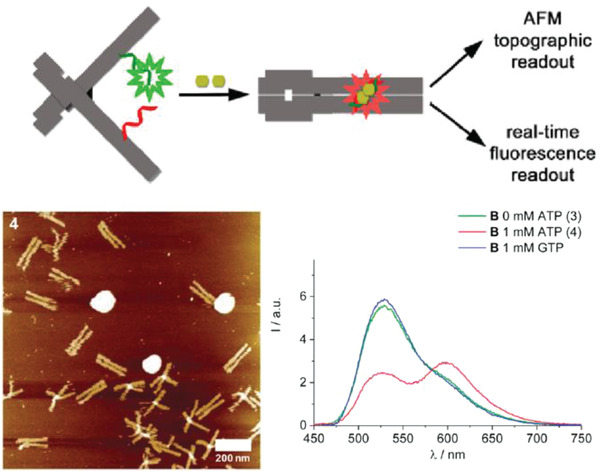
Design of an ATP DNA nanoplier aptasensor. Top: schematic showing DNA nanoplier reconfiguration driven by the capture of two ATP molecules. The inner faces of the arms contained dye‐labeled split aptamer strands (green and red), such that the binding of two ATP molecules triggered a reconfiguration from open nanoplier to a closed state. Bottom: ATP capture characterized by AFM and fluorescence microscopy, as shown in representative images here. Reproduced with permission.99 Copyright 2017, American Chemical Society.
The ability to orthogonally and uniquely address various sites on DNA nanostructures has also made it possible to develop multiplexed detection systems, such as checking for two miRNA species using Boolean logic (mathematical algebra reduced to true and false events).104 In one relevant example, a DNA rectangular platform was used to anchor DNA strands complementary to two miRNA indicators of heart failure—miR‐21 and miR‐195—such that only in the presence of both miRNA molecules did the target capture domain release a reporting signal (a biotinylated DNA oligo) that was, in turn, received by the reporter domain (streptavidin capture site) on the DNA platform (Figure 9 ).13 Streptavidin‐biotin conjugation at the reporting site on the DNA platform created a topological change seen under the AFM. The fraction of DNA platforms with the “+” topology (as shown in Figure 9b) was the reported metric. Even though no LOD was documented here as well, these two technologies are good prototypical examples that can be improved for efficiency by integrating a fluorescence readout mechanism and also highlight how the inherent modularity of DNA structures can enable clear physical separation of the detection and reporting domains for diagnosis yet still allow both to function in concert in the device.
Figure 9.
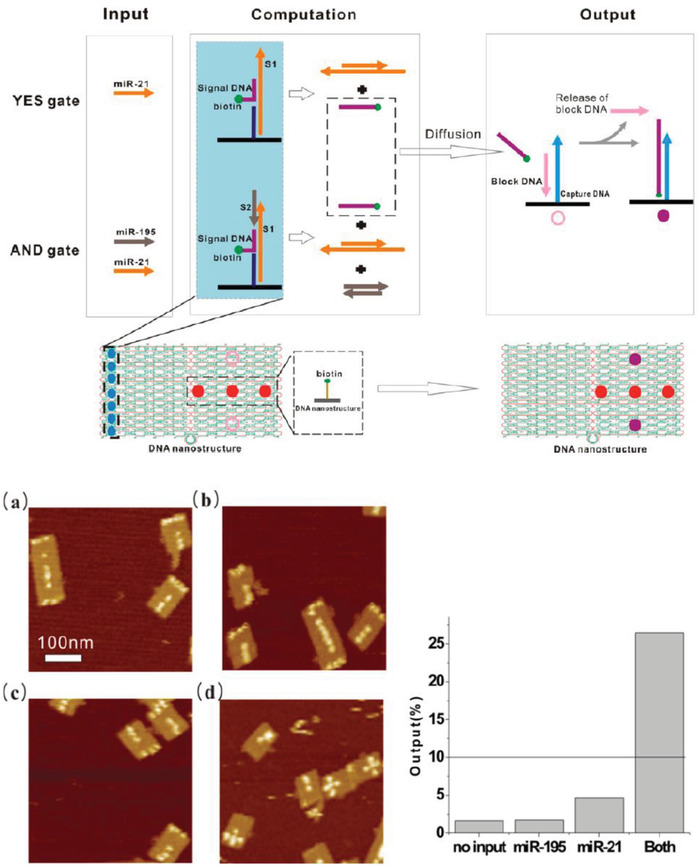
Multiplexed sensing on a DNA‐based platform. Top: working principle behind the DNA origami platform for the detection of two miRNA targets. Bottom: representative AFM images and particle count analysis indicating the presence of a) none, b) miR‐195 only, c) miR‐21 only, and d) both miRNAs. Reproduced with permission.104 Copyright 2014, American Chemical Society.
The modularity inherent to DNA nanostructures is further exemplified in the work of Pei et al. who engineered one edge of a DNA tetrahedron to “pinch” or “relax” and concomitantly alter the relative distance between a FRET‐pair only in the presence of an analyte (Figure 10 ).[[qv: 43a]] The DNA tetrahedron was modified to detect ATP, mercury ions, and pH changes either individually by engineering only one edge of the DNA tetrahedron or simultaneously using another tetrahedral edge for targeting a different analyte. The LOD observed for ATP molecule detection was 2 × 10⁻⁶ m. As proof of principle, the ATP sensing functionality of this DNA tetrahedron was also demonstrated inside HeLa cells.
Figure 10.
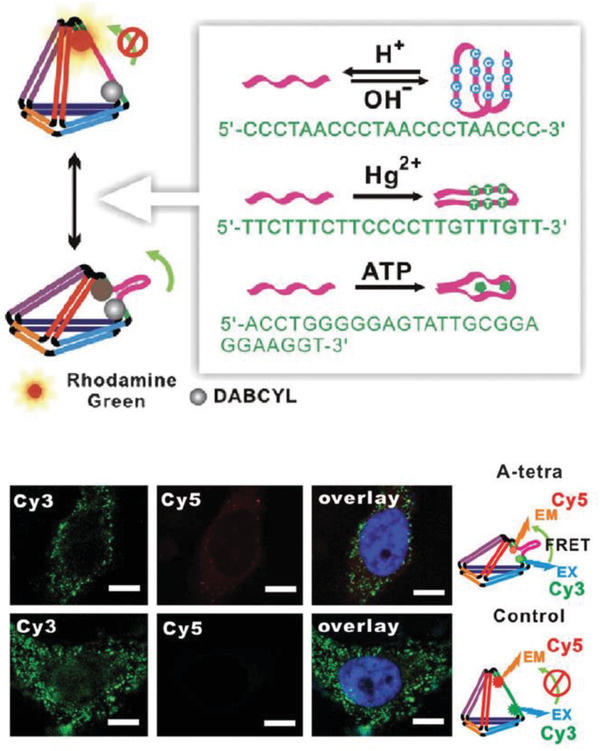
Reconfigurable DNA tetrahedron with a flexible arm containing a FRET‐labeled probe sequence. Top: design of the tetrahedron with modular probes against three different analytes—pH, mercury ions, or ATP molecules. Bottom: confocal images of the detection of intracellular ATP (top panel) using the DNA tetrahedron labeled with Cy3 and Cy5 FRET system (bottom panel; negative control). Scale bar = 20 nm. Reproduced with permission.[[qv: 43a]] Copyright 2012, John Wiley and Sons.
Fluorescence signal amplification in solution was proposed by employing “exponential” HCR to amplify signal in a label‐free miRNA detection sensor, with an estimated LOD of 0.7 × 10⁻¹⁵ m (Figure 11 A,B).[[qv: 49a]] In this work, HCR was initiated on a hairpin switch probe that bound to the target miR‐21 and consequently opened a transduction domain to which fuel hairpin strands could hybridize. The hairpin fuel strands used here contained split G‐quadruplex domains that led to the formation of the branched dendrimeric DNA nanostructure. Signal transduction was established by the addition of zinc(II)‐protoporphyrin IX as it has a high affinity for intercalating within the G quadruplex structures and also has fluorescent properties. The performance of this HCR‐dendrimeric detector in selectivity and sensitivity was comparable with real‐time PCR (RT‐PCR) in detecting miRNA from total RNA extracted from breast cancer cells thereby highlighting the potential of the design.
Figure 11.
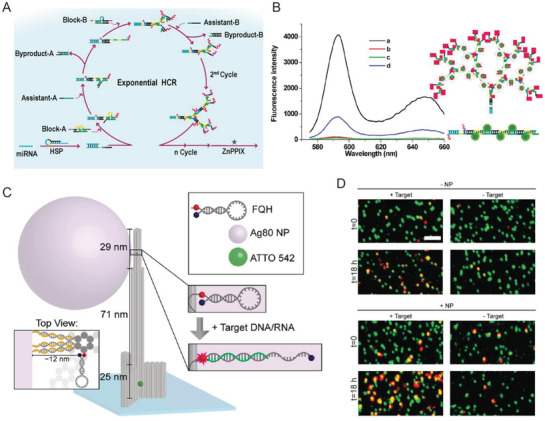
Signal amplification strategies using DNA scaffolds. A) Principle for increasing fluorescence intensity in biosensing miRNA using exponential HCR and G‐quadruplex‐ZnPPIX complex. B) Fluorescence output of the exponential HCR‐based biosensor for the detection of 1.0 × 10⁻¹² m miR‐21 in a) nonlinear HCR in the presence of 1.0 × 10⁻¹² m miR‐21; b) in the absence of miR‐21; c) only ZnPPIX; d) linear HCR in the absence of miR‐21. Reproduced with permission.[[qv: 49a]] Copyright 2018, American Chemical Society. C) Design schematic representing a DNA origami “nanoantenna” with a wide base for immobilization on a microscopy substrate. On the head of the antenna was attached a silver NP and adjacent to it a fluorescence‐quencher hairpin (FQH) designed against Zika virus nucleic acid molecules. FQH opened in the presence of target molecule to alter the fluorescence output. D) Fluorescence scans of surface‐immobilized DNA origami nanoantennas at t = 0 h (no target DNA) and t = 18 h (post adding 1 × 10⁻⁹ m target DNA). Results show green spots indicating individual DNA origami nanoantenna on the surface whereas red spots represent fluorescence from the FQH in an open stem loop in the presence of target DNA. A higher density of colocalized red–green spots in +Target+NP after 18 h indicated improved efficiency of the biosensor in the presence of NP. Scale bar = 2 µm. Reproduced with permission.111 Copyright 2017, American Chemical Society.
Biosensors with SPR as their signal transduction mechanism sometimes also rely on the precise placement of fluorescent molecules within the signal amplification “hotspot” region around metallic NPs or surfaces where the electromagnetic field enhancement is focused to be highest.92 This hotspot is created by the collective oscillation of surface electrons on the NP when excited with an incident light wave. Another optically active molecule placed within the hotspot can fluoresce with as much as a thousand‐fold enhancement in intensity, but the field enhancement effect decays rapidly with distance and with as little as a separation of ≈5 nm away from the metal surface the effect can be lost. Therefore, errors in placement on a sensor configuration can dampen the signal to noise ratio by many orders of magnitude. To this end, DNA‐based “nanoantennas” have been engineered to precisely colocalize plasmonic NPs with fluorescent target capture motifs.111 In one representative example, a rigid DNA origami hb (125 nm) was modified to attach a spherical silver NP (80 nm) and a fluorescence‐quencher labeled DNA hairpin that was complementary to the target nucleic acid analyte (Figure 11C). For detecting fluorescence via single‐molecule confocal microscopy, the nanoantenna was immobilized onto a surface using neutravidin‐biotin binding. As a prototype, the DNA hairpin was designed with complementarity targeted to a Zika virus‐associated nucleic acid molecule such that binding of the analyte opened the hairpin molecule which, in turn, altered the fluorophore‐quencher distance and the fluorescence output (Figure 11D). The nanoantenna was tested in buffer as well as heat inactivated human serum samples that were spiked with the target DNA or RNA. Overall, this DNA‐assisted SPR assay showed an approximately fivefold fluorescence enhancement over target detection using a system without NP‐assisted signal amplification.
5. DNA Nanostructures in Bioimaging
Visualizing biological molecules, particularly in their natural physiological environments at nanometer resolution, is a critical research technique as it supplies valuable information for all stages of therapeutic development. Relevant scenarios include research on animals, cellular models, single‐molecular studies, clinical testing, and the implementation of precautionary routine tests. One of the many goals of imaging is to understand relevant biological pathways and identify targets useful for diagnosis and drug delivery. The contributions made by DNA nanotechnology in bioimaging have been largely focused on facilitating in vitro and in cellulo studies, as well as in interrogating protein structure and function at the single‐molecule level. Bioimaging typically requires a means to precisely tag target molecules with optically active molecules or NPs and technology to resolve the fluorescent or bioluminescent output at the subdiffraction level is highly desired. The key advantage in such microscopy offered by DNA can be summed up in a single word—addressability. It can act as a vehicle for delivering fluorescent molecules to biological substrates with a high degree of spatiotemporal accuracy or create an addressable target site for probing biomolecules individually.
For imaging in fixed cells, Point Accumulation for Imaging in Nanoscale Topography (PAINT) super resolution microscopy offers a simplified approach to imaging wherein diffusing fluorescent dyes transiently interact with the substrate thereby illuminating the spatial properties of the sample at the focal plane.120 However, PAINT demands specific fluorescent dyes that temporarily interact with the sample via electrostatic forces, which limits the applicability of the technique.121 Additionally, achieving specificity with PAINT is challenging due to a lack of mechanisms to transiently label target components of most biological samples in an electrostatic manner. Using DNA‐DNA hybridization, it is possible to mediate such transient interactions with a higher level of specificity leading to DNA‐PAINT microscopy.121, 122 DNA‐PAINT also has considerably expanded the repository of compatible fluorescent molecules for overall PAINT imaging. To accomplish this imaging technique, dye‐conjugated DNA oligos, called imager strands, are introduced to a biological sample that has been chemically modified with partially complementary ligand‐DNA conjugates, called docking strands, for the transient binding of the imager strands onto this target sample (Figure 12 A). The phenomenon of transient binding is key for super resolution microscopy as it gives rise to a continuous replenishment of dye‐labeled imager strands from the solution thereby eliminating photobleaching while allowing stochastic subdiffraction regime imaging. The choice of ligand and DNA oligos used for designing docking strands makes it possible to target more than one subcomponent of a biological sample, such as different organelles within a cell, either with different dyes121 or with the same dye in a sequential manner as performed in another analogous technique called Exchange‐PAINT microscopy.123 A prime example of DNA‐PAINT capabilities utilizing total internal reflection fluorescence microscopy (TIRFM) was shown in HeLa cell imaging by using docking strands labeled with an antibody against beta‐tubulin (Figure 12B).121 In addition, the same cells were dual‐labeled to simultaneously visualize the mitochondria using an orthogonal antibody‐DNA docking strand. Another example highlighting this technique was shown by Schueder et al. where DNA‐ and Exchange‐PAINT techniques were coupled with spinning disc confocal microscopy for the 3D super resolution imaging of various organelles in HeLa cells.124 This work served to highlight that, with the help of orthogonal and targeted docking strands and complementary imager strands, one can create detailed “color” maps of the entire cell at a resolution that far exceeds what most current microscopes can achieve. The multiplexing ability of DNA‐PAINT can be potentially expanded even further by creating DNA origami‐based “tags” that can target diverse cellular components.[[qv: 122a]] To further minimize background signal in DNA‐PAINT, FRET has now been integrated into the technique by engineering two imager strands corresponding to one docking strand. The two imager strands are each conjugated with a donor and acceptor molecule such that the simultaneous hybridization of both imager strands on the docking strand leads to a FRET interaction.125
Figure 12.
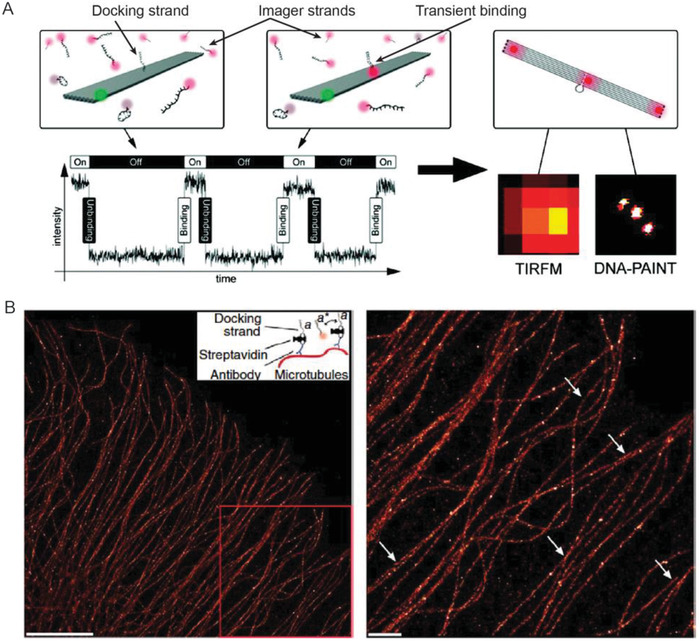
Fundamentals of DNA‐PAINT and its application. A) DNA‐PAINT strategy as shown on a DNA origami rectangular nanostructure (shown in grey). One dye (green) was immobilized on a corner of the rectangle as a marker and one docking strand extended from the center of the structure. Floating in solution are complementary imager strands with red fluorescent dyes. When an imager strand hybridized with the docking strand the fluorescence was observed under a TIRF microscope. Reproduced with permission.[[qv: 122c]] Copyright 2010, American Chemical Society. B) Implementation of the DNA‐PAINT technique to visualize microtubules inside a HeLa cell. Scale bars: left = 5 µm; right = 1 µm. Reproduced with permission.121 Copyright 2014, Springer Nature.
A third version of the DNA‐PAINT technique called quantitative PAINT (qPAINT) imaging has also been developed where known imager‐docking strand kinetics were used to quantify or count the number of target molecules on a biological surface with high accuracy.126 QPAINT capabilities illuminated the nucleoporin NUP98 protein in the ring‐shaped nuclear pore complex present on the nuclear membrane of human osteosarcoma epithelial cells; this was accomplished with the help of docking strands conjugated to monoclonal primary antibodies against NUP98. QPAINT could potentially be a great tool for comparing the differential expression of cell surface receptors on normal versus pathological cells and even visualizing their relative density in situ in order to design ligands on drug delivery carriers for improved discrimination and targeting.
Other fluorophore labels are also useful for high definition images though these may not technically be PAINT techniques. QDs are another class of fluorescent particle that are of great utility in cellular imaging.127 QDs possess excellent optical properties that are correlated to their size, and are available with high photostability and very narrow emission profiles ranging across the visible spectrum.128 With the help of docking strands targeted to diverse cellular components such as proteins and RNAs, different QDs can be delivered to these components via QD‐conjugated “imager strands.” In this case, however, the imager strands do not necessarily display transient binding properties like in the PAINT techniques. Zrazhevskiy et al. designed orthogonal docking strands targeting each to the glyceraldehyde‐3‐phosphate dehydrogenase protein (GADPH) and heat shock protein 90 (HSP90), messenger RNA (mRNA), and small‐interfering RNA (siRNA). The corresponding imager strands (fully complementary to docking strands) were conjugated with different uniquely emitting QDs such that the molecular targets were easily and simultaneously identifiable by the respective QD emission wavelength using fluorescence microscopy and hyperspectral imaging (Figure 13 ).129 QDs are also being developed as potential super resolution labels due to their blinking and ability to engage in switchable emission with photochromic FRET acceptor dyes.130
Figure 13.
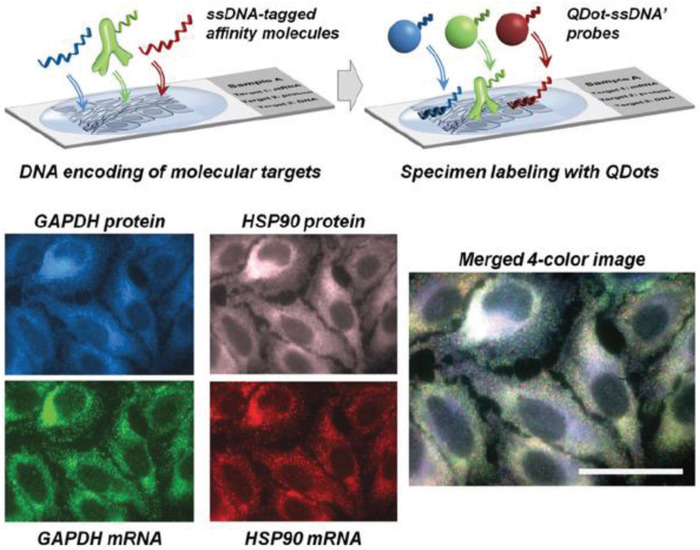
QD‐DNA multiplexed imaging of a fixed biological sample. Top: schematic depicting the labeling of different subcellular organelles using ligand‐docking strands. Corresponding imager strands were conjugated with different QDs and introduced to the sample. Bottom: orthogonal ssDNA docking strands were encoded to target various subcomponents of the sample, such as GADPH and HSP90 protein and mRNA, followed by the addition of QDs of different fluorescence wavelength and labeled with complementary imager strands. Shown here are false‐colored four hyperspectral microscopy scan images and a merged image of QD fluorescence from the four protein and mRNA subcellular components. Reproduced with permission.129 Copyright 2016, John Wiley and Sons.
The aforementioned techniques involve a two‐step process during super resolution imaging, namely, first the docking and then the imaging steps. In work by Charlotte et al., a DNA nanowire was modified with folic acid and dye‐quencher pair‐labeled DNA hairpins for intracellular imaging of miRNA (Figure 14 ).131 The DNA nanowire comprised two kinds of DNA hairpin probes arranged in a sequential chain with each labeled using a dye‐quencher pair. The hairpin probes, in response to the target miRNA, underwent reconfiguration which switched the dye from quenched (OFF) to fluorescent (ON) state. The opening of one hairpin probe triggered the opening of the next hairpin probe thereby creating a cascade of hybridization events, much like a string of lights. The folic acid molecules enabled the internalization of the DNA nanowire into cancer cells, as shown in HeLa cells, due to the higher cell membrane density of folate receptors on those cells.132 Such a DNA nanowire should, in theory, enable the visual differential quantification of miRNA in pathological versus normal cells with more analysis and appropriate use of contrast and internal standards.
Figure 14.
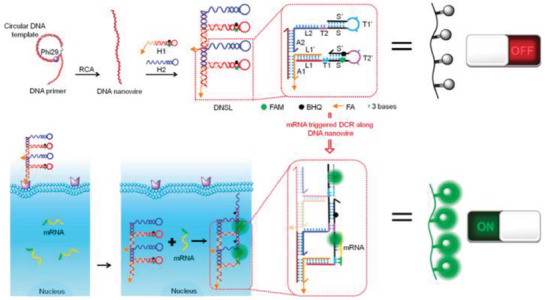
Schematic depicting folic acid‐tagged DNA nanowire for imaging miRNA inside the cell. The DNA nanowire was made of a string of hairpin probes bearing a dye‐quencher pair. In the OFF state, the fluorescence was quenched within the stem‐loop of the DNA hairpins, which opened in response to target cellular miRNA and created an amplified fluorescence signal. Reproduced with permission.131 Copyright 2018, American Chemical Society.
In vivo imaging can potentially allow concurrent diagnosis with therapeutic treatments while also replacing invasive biopsy tests with noninvasive visual evaluation of a given localized pathology. The later stages of drug development involve trials on animal model systems and is a critical stage that helps in determining the viability of proceeding with clinical trials for a drug; these tend to become extremely costly owing to the need to sacrifice multiple animals for characterization at various stages of the trial. In vivo studies on animal models could benefit significantly from imaging systems that can eliminate/reduce the need for multianimal sacrifice and make it feasible to follow treatment progression on the same animal over time.133 Current gold standards in noninvasive whole body imaging at the clinical stage include ultrasound, magnetic resonance imaging (MRI), and positron emission tomography (PET). The latter two, in particular, require intensive resources and time, as well as specialized contrast agents which, in the case of PET scans, could be radioactive. Other techniques including bioluminescence and near‐infrared (NIR) fluorescence imaging134 tend to be more limited to research applications. In this context, bioluminescence is the enzyme catalyzed emission of light (think firefly) and is accomplished by inserting a gene after a specific promoter region such that the bioluminescent protein expression is colocalized in the region of interest in an animal model. In vivo fluorescent imaging typically seeks to access the lower absorbance tissue transparency windows to achieve high depth penetration with better resolution and are thus focused on the NIR portion of the spectrum. Here biomolecules, dyes, and NPs that are known to have fluorescent properties in the infrared region (800 to > 1000 nm wavelength) are targeted to the area of interest and observed via fluorescence microscopy or other imaging techniques.134 Many dyes used for NIR fluorescence imaging, without conjugation to appropriate carriers, tend to have short retention times due to their small size and therefore undergo rapid renal removal from the body. Thus, there is a need for carriers or scaffolds that can improve targeting as well as retention in the correct targeted regions of the body.
There are some examples of DNA‐based carriers that have been demonstrated for initial in vivo imaging applications.135 Sentinel lymph nodes (SLN) are diagnostic targets of interest as indicators of metastasis since extravasated tumor cells accumulate in them as they pass through the lymphatic system. They can provide a prognosis on the metastatic state of a given solid tumor. To test utility in this context, a DNA tetrahedron was modified for in vivo imaging of SLNs in a cancer mouse model system.135 The Cy5‐labeled tetrahedron was injected subcutaneously into the SLN region of tumor‐grafted mice forepaws where it showed enhanced uptake by the tumor in comparison to normal mice. The SLNs where the dye accumulated indicated the pathway that the cancer cell would take on metastasis along with reflecting the tumor stage and level of extravasation.
High resolution imaging is not just limited to cellular studies. Drug engineering relies heavily on elucidating protein structural biology for the development of improved targets that can regulate protein activity in pathological conditions. The study of protein structure and function is constantly challenged by the difficulties in protein crystallization, immobilization, and protein handling in solution without altering their intrinsic behavior. The need for better scaffolds to interrogate protein structural biology has motivated the creation of several DNA scaffolds.[[qv: 14b,27,122b]] Molle et al. constructed a DNA platform with six DNA tethers that immobilized a single molecule of Hfq‐like protein (a 6 nm diameter hexamer that is believed to function as a bacterial RNA binding protein) for the determination of interdomain distance by implementing DNA‐PAINT imaging (Figure 15 ).27 The DNA platform played an interesting role of not only positioning the protein in a predetermined orientation but also “stretching” the protein, with the goal of adopting the concept of expansion microscopy by eliminating the need for polymer‐driven swelling of the sample, which is an enormous challenge to overcome in case of proteins due to their small size.136 To chemically attach DNA tethers to the protein domains, dibenzocycloocytne (DBCO)‐modified DNA oligonucleotides were conjugated to the azide‐modified hexameric Hfq protein. The six DNA extensions on the protein hybridized with six capture strands on the DNA platform to position the protein in a plane. Following the synthesis of this Hfq‐DNA platform complex, DNA‐PAINT super resolution microscopy illuminated the interdomain distance between two and three monomers of the protein and showed that this correlated with the theoretically known dimensions. The implementation of expansion microscopy with the help of the DNA platform resulted in the amplification of the protein size by a factor of 4.7 and allowed for the super resolution imaging of the protein. In another example, a DNA origami rectangular frame was designed to position dsDNA of two different lengths, a 64 bp and a 74 bp, to test the enzymatic activity of EcoRI methyltransferase enzyme, which is responsible for DNA methylation (Figure 16 ).[[qv: 14b]] It is known that DNA methylation by methyltransferase requires the physical bending of the dsDNA by the enzyme on the order of 55°–59°. In order to determine the effects of dsDNA rigidity on methyltransferase activity, the two dsDNA were anchored on the DNA frame to conform into tense (64‐mer) and relaxed (74‐mer) states as the width of the frame was designed to be longer than the 64‐mer but shorter than the 74‐mer. Using fast‐scan AFM and EcoRI cleavage reaction post‐methylation (where only unmethylated DNA was accessible for EcoRI‐induced cleavage) Endo et al. were able to show the enzyme's preference for the methylation of 74‐mer DNA (representing relaxed DNA) over the 64‐mer.
Figure 15.
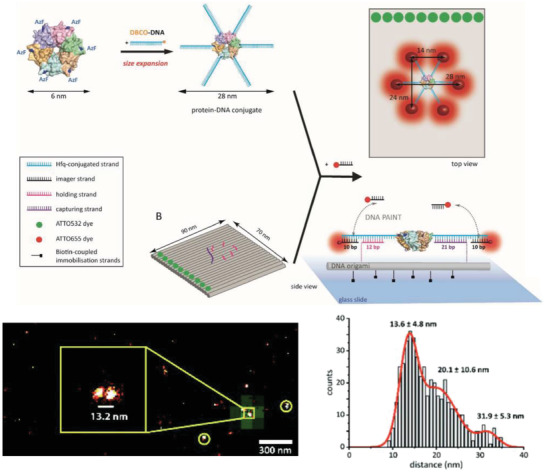
Super resolution imaging of a protein with DNA platform‐enabled expansion microscopy. Top: design strategy to anchor Hfq‐like protein onto a rectangular DNA origami substrate for DNA‐PAINT analysis. The protein was chemically conjugated to ssDNA tethers on six ends, which hybridized with short extending DNA strands on the DNA platform. The DNA tethers also contained domains to act as docking strands for imager strand binding in DNA‐PAINT. Bottom: representative results of super‐resolution DNA‐PAINT imaging of the protein‐DNA platform complex. DNA‐PAINT showed colocalized platform (green from ATTO532 dye) and the protein monomers (red from ATTO655 dye). Also shown is a histogram of the interdye distance between ATTO655 per platform to show the intermonomer distance within each protein. Reproduced with permission.27 Copyright 2018, The Royal Society of Chemistry.
Figure 16.
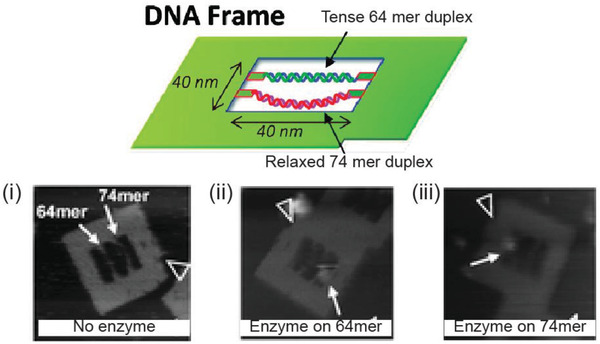
Methyltransferase characterization with a DNA frame. Top: a DNA rectangular frame designed to test the effect of DNA stretching on the functionality of enzyme methyltransferase. A 64 bp and a 74 bp dsDNA were docked within the DNA origami frame. Bottom: fast‐scan AFM images show the DNA frame i) with the two dsDNA strands, ii) with enzyme M. EcoRI bound to the 64‐mer, and iii) with enzyme bound to the 74‐mer. Reproduced with permission.[[qv: 14b]] Copyright 2010, American Chemical Society.
DNA nanostructures have also been characterized via cryo‐electron microscopy (cryo‐EM)137 and X‐ray scattering,138 which opens opportunity to host protein and RNA analytes inside DNA‐based scaffolds with precise positioning and orientation for atomic resolution imaging. Interestingly, this was one of Seeman's original motivations to begin investigating structural DNA nanotechnology and this esoteric initiative would eventually lead to this research field.139 In order to construct sophisticated DNA‐based theranostic systems, it is also important to visualize the DNA structure itself for characterization purposes and here the same techniques of DNA‐PAINT, FRET‐PAINT, and Exchange‐PAINT are quite useful.121, 124, 125, 140
6. Potential Use of DNA Nanostructures in Therapy
Therapeutic agents have to overcome more issues and challenges for utility as compared to in vivo diagnostic or imaging agents.141 Table 6 shows what DNA nanotechnology offers here in relation to some other types of nanotechnological techniques. For example, anti‐cancer drug delivery based on using these materials as scaffolds could address major challenges such as systemic toxicity, multidrug resistance (MDR), dispersed pharmacokinetics and biodistribution, and drug instability in aqueous solution.[[qv: 32a,142]] Most drugs are small in size (<10 nm) and lack the degree of permeability and retention needed to be effectively adsorbed by tumor cells, leading to rapid accumulation in the bladder for renal clearance. Small‐sized cargo for any disease target typically need larger carriers to prolong circulation within the blood stream so as to increase exposure and delivery time to the pathological tissues. For penetration into tumors, the drugs must navigate a potentially lower pH environment and the tumor vasculature, and preferentially have enhanced permeability and retention (EPR) in order to increase drug efficacy within solid tumors.143
Table 6.
Representative examples of DNA‐based structures in therapy
| Treatment class | Current NP‐based therapies | Current deficiencies | What is DNA offering | Examples | Ref |
|---|---|---|---|---|---|
| Drug delivery | NPs, liposomes, albumin bound, PEGylation | Renal clearance, low tumor penetration, system toxicity, MDR | Specificity, high tumor penetration, overcome MDR | Dox delivery using DNA structures, metal‐complex drug delivery | [[qv: 25,48a,51c,73a,76,77,81,87b,144]] |
| Protein/enzyme delivery | NPs, liposomes, albumin bound, PEGylation | Renal clearance, limited cellular internalization, stability | Specificity, cellular uptake | Thrombin delivery | [[qv: 48c,145]] |
| Immunostimulation and vaccines | Inactivated whole organisms, virus‐like particles | Low specificity, cell internalization deficiency | Vehicle to cross cell membrane | DNA triangle‐assisted delivery of CpG sequences, tetrahedral‐antigen precursor activator | [[qv: 58,74a]] |
| Gene therapy | NPs, viral capsules | Cell internalization, transport to the nucleus | Improved drug retention in cells | DNA structure‐assisted delivery of miRNA, siRNA,DNAzymes | 52, 61, 77, 146 |
| Combinatorial therapy | – | Controlled attachment of different therapeutic agents | Substrate to attach various NPs and biomolecules | DNA structure‐directed assembly of AuNR‐based photodynamic therapy | [[qv: 87a,144c,147]] |
MDR, multidrug resistance; PEG, polyethylene glycol; miRNA, microRNA; siRNA, small interfering RNA.
There are several treatment modalities in development that are predicated on incorporating nanomaterials or nanosystems that may also benefit from DNA nanotechnology. In order to appreciate what the field has to offer in this context a very brief mention of what some other nanotech‐based therapeutics currently being developed have to offer is helpful. Genetic therapy and immunotherapy are being developed as viable treatment options against several diseases such as leukemia, Parkinson's disease, and cancers. However, the bulk of their applicability largely depends on targeted delivery of nucleic acid molecules to the correct cells and protection of the nucleic acid cargo from low pH and cytoplasmic nucleases. For vaccine development, the leading carrier of immunogenic species is virus‐like particles that can be difficult to chemically modify in a consistent, reproducible, and invariant manner.148 Photodynamic therapy (PDT) is an emerging and potentially noninvasive technique wherein a photosensitive compound is accumulated at the pathogenic site and subjected to photonic energy at the appropriate sensitizing wavelength leading to the activation of photocytotoxic reactions and the destruction of surrounding tumor or pathogenic cells by short‐lived radical species that are generated during the process.149 PDT, however, requires the correct and precise application of the photosensitive molecules to the appropriate tissues in order to reduce undesirable toxicity. Moreover, most PDT delivery systems still fall short in tissue penetration, water solubility, and chemical purity. AuNPs are popular in therapeutics due to their interesting optical and thermal properties, laying the foundation for techniques such as photothermal therapy (PTT) and photoacoustic imaging/therapy (a technique that uses light‐induced shockwaves to kill tumor cells or act as a contrast agent).150 In these techniques, AuNPs help in eliminating tumors while simultaneously acting as contrast agents for imaging. PTT entails the ablation of tumor cells via SPR‐induced heating of gold nanorods (AuNRs).[[qv: 150b]] The AuNRs are injected into tumor sites and then excited with NIR laser radiation, which causes a local increase in temperature and slow degradation of the tumor. AuNP‐related agents do, however, need to be labeled with ligands complementary to cellular receptors for targeting the correct tissues and techniques of direct attachment of ligands to the AuNR surface leave much to be desired in terms of sufficient control over labeling concentration and density. Moreover, maximizing tumor penetration of the AuNR is necessary for effective treatment.
NPs have emerged as feasible candidates for the development as therapeutic carriers due to their size, potential for loading drugs as well as controlling subsequent drug release.141, 151 However, NP development has not succeeded in advancing some other desirable features for precise tagging of carriers with cell‐specific ligands to improve specificity or increase cellular and nuclear penetration via nonlysosomal routes. Based on the previous points, it is clear that DNA‐based structures have unique properties to contribute to the development of therapeutic agents; these include especially their properties for precisely anchoring other molecules, the ability to engage in multiplexing, and their potentially tunable stability in the blood and biological systems. There are promising examples demonstrating the delivery of drug molecules to cellular and animal model systems using DNA‐based nanocarriers.
Doxorubicin (Dox) is an anthracycline antibiotic that, through cell‐dependent mechanisms, initiates cell death via intercalation and interference with intrinsic cellular DNA processes by preventing a key step in RNA transcription.152 Studies have shown that different levels of intracellular Dox are correlated with initiating apoptosis (programmed cell death) within different types of cells. Even a slight decrease from optimum levels of intracellular Dox sequestration could lead to insignificant growth delays in the tumor and render the treatment unviable. In addition, Dox has poor targeting selectivity accumulating in the pericardium and can cause systemic toxicity. As one of the most commonly used cancer drugs and given its ability to intercalate with DNA and subsequently fluoresce, Dox and its derivatives have been the primary model drug in testing the applicability of DNA‐based carriers in therapeutics (Figure 17 A). Moreover, the mechanism of “loading” Dox into DNA molecules harnesses the strong intercalating property of Dox to dsDNA, hence DNA nanostructures carrying the drug can be easily synthesized by mixing the two at room temperature for at least 1 h.[[qv: 144e]] After cellular uptake within endosomes, research indicates that the DNA nanostructures (unless targeted for a different delivery pathway) undergo lysosomal acidification, during which the drug is released and it diffuses out and travels to the nucleus[[qv: 67,144b,d]] Zhao et al. showed that DNA nanostructures can host Dox molecules with tunability over the intercalation loading capacity.[[qv: 73a]] They constructed two types of 18 hb DNA nanotubes (138 nm) differing in the helical turn of the constituent DNA—one designed at 10.5 bp per turn (normal helicity of DNA) called S‐Nano and the other at 12 bp per turn called T‐Nano, the latter bearing an inherent global DNA twist, as illustrated in Figure 17B. The global twist in T‐Nano increased the intercalating capacity of the DNA, therefore the two Dox‐loaded structures showed different Dox release kinetics inside breast cancer cells. T‐Nano retained 50% Dox inside the cell whereas S‐Nano suffered loss of Dox even before cellular uptake which was attributed to diffusion. Higher retention in T‐Nano also led to higher toxicity in target cells.
Figure 17.
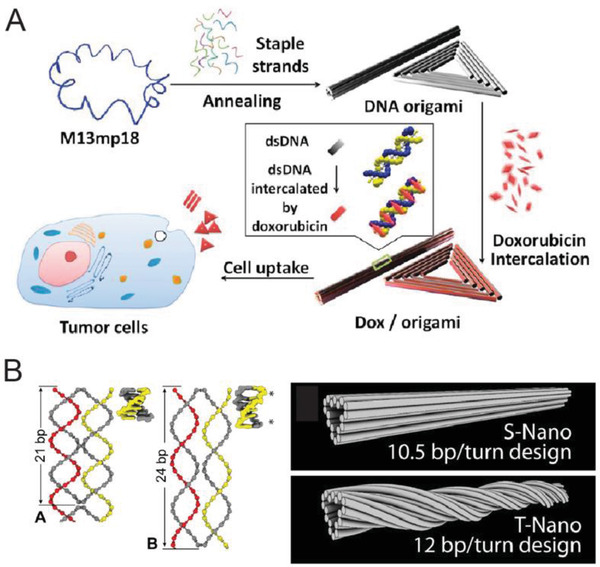
Representative DNA nanostructures in cancer drug Dox delivery. A) Schematic showing the assembly of two DNA origami constructs—nanorod and triangle—for loading Dox by intercalation and internalization by tumor cells for drug delivery. Reproduced with permission.[[qv: 144d]] Copyright 2012, American Chemical Society. B) The loading capacity of DNA origami nanostructures (such as rods) can be tuned by controlling the twist density within the structures, which is correlated to the position of crossovers inside the structure. Left panel shows two examples, A contains 21 bp and B contains 24 bp between crossovers. Shown here are designs of S‐Nano and T‐Nano constructs made using two different twist densities—S‐Nano has the traditional 10.5 bp turn−1 whereas T‐Nano has 12 bp turn−1. This change resulted in higher Dox uptake by T‐nano compared to S‐Nano. Reproduced with permission.[[qv: 73a]] Copyright 2012, American Chemical Society.
DNA nanostructures have also demonstrated higher retention in solid tumor sites within mouse model systems. For example, the biodistribution of three different DNA structures was studied in a tumor‐grafted mouse model system, a DNA triangle (120 nm), square (80 nm), and tube (380 nm), each conjugated with a QD for fluorescence‐based visualization.81 QD attachment to the DNA origami structures was executed using a biotin‐modified staple strand on the nanostructure coupled with streptavidin‐QD complexes. In each case, mice were intravenously injected with a control (free QD or QD‐labeled m13 plasmid) or a QD‐labeled DNA nanostructure and whole body fluorescence was monitored for a period of 24 h. An even distribution of fluorescence intensity was observed in all cases 1 h postinjection, but the fluorescence of the QD‐labeled nanostructures at the tumor site, particularly the DNA triangle, was nearly fivefold higher (in the case of the triangle) in the tumor site up to 24 h. Interestingly, the fluorescence intensity at the tumor site for the QD‐DNA triangle peaked at 6 h postinjection and was observed to be higher than the intensity observed at 1 h postinjection, which suggests that accumulation of QD‐DNA triangle continued to increase up to 6 h. Ex vivo imaging of the major organs after 24 h showed DNA nanostructure‐QD retention only in the liver and tumor.
Another remarkable advantage observed in DNA nanostructure‐based anti‐cancer vehicles is the potential to overcome a type of MDR in cells (Figure 18 ). One of the mechanisms through which MDR occurs during cancer treatment involves cellular efflux pathways where transmembrane pumps eject drug molecules out of the cell thereby rendering them ineffective. Certain cellular transport proteins have been implicated in pumping foreign molecules (including drugs) out of the cell, thereby manifesting drug resistance in cancer cells. Examples of such proteins include MRP1 (multidrug resistance‐associated protein 1) or P‐glycoprotein. MDR leads to patients potentially becoming unresponsive or even resistant to a whole class of drugs. Several reports have shown that Dox‐loaded DNA constructs can undergo successful uptake even in drug resistant cells.[[qv: 144b,d,f,i]] Free Dox and Dox‐loaded plasmid dsDNA were, however, unable to induce cytotoxicity in known drug resistant MCF‐7 breast cancer cells but, in contrast, Dox‐loaded DNA triangles and nanotubes stimulated cell death.[[qv: 144d]] The efficacy of such DNA structure‐mediated drug delivery to drug‐resistant cells could be explained, in part, by the circumvention of any interaction with efflux proteins which sample the cytoplasmic contents since DNA nanostructures are primarily taken up via endocytosis and remain sequestered in late endosomes and lysosomes; the latter of which tend to accumulate in a perinuclear pattern.[[qv: 144b,f]]
Figure 18.
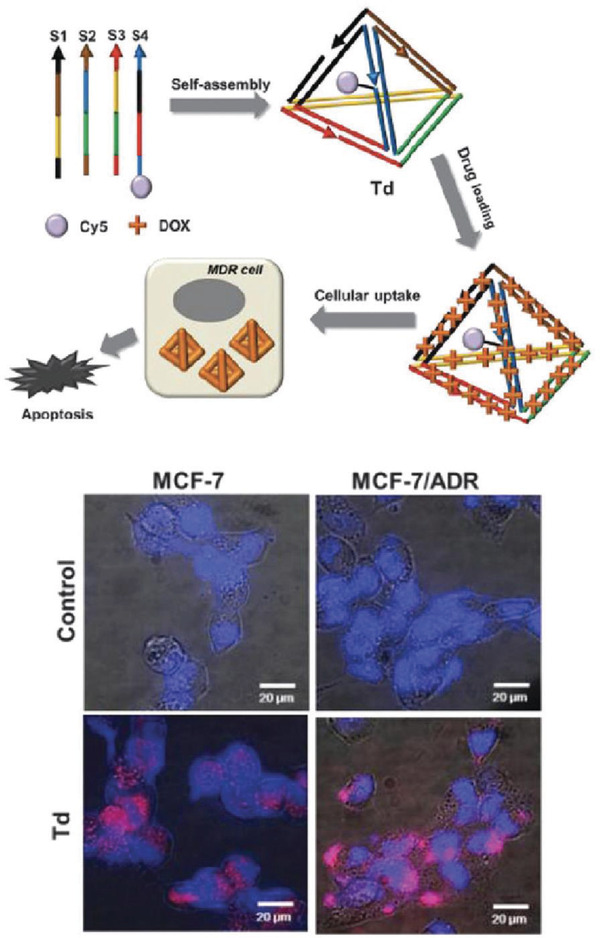
Drug delivery via DNA nanostructures to cells with MDR. Top: schematic showing a DNA tetrahedral nanostructure in the role of a carrier for the cancer drug Dox for delivery applicability to MDR cells such as MCF‐7 cells drug resistant cells. Bottom: fluorescence microscopic images of normal MCF‐7 and MCF‐7/ADR cells treated with Dox and Cy5‐labeled tetrahedron carrying Dox (Td) or not (control). Reproduced with permission.[[qv: 144f]] Copyright 2013, The Royal Society of Chemistry.
Combined with a cellular targeting ligand (much like targeted biosensing and imaging), DNA nanostructures loaded with anti‐cancer drugs have been shown to have enhanced specificity for cells displaying the cognate receptors; these are usually highly upregulated in certain tumor types. Ligands including folic acid,77, 153 peptides,25 cellular and nuclear aptamers,[[qv: 76,144e,h,154]] and other molecules[[qv: 144d]] have been chemically conjugated to the nanostructures in different numbers or even with more than one kind of ligand on the same nanostructure to increase specificity or enhance uptake in targeted cells. Lee and co‐workers optimized the efficacy of a DNA tetrahedral delivery vehicle to deliver a green fluorescent protein (GFP) gene silencing cargo to GFP‐expressing HeLa cells by testing different relative orientation and density of folate molecules (for example, close together versus far apart) on the surface of the tetrahedron, as shown in Figure 19 A. First, it was shown that conjugating more than three folate molecules on the tetrahedron did not improve the level of gene silencing. Second, of the different layouts of folate molecules that were tested, the tetrahedron delivery vehicle with low density arrangement of the folate molecules (set B in Figure 19A) showed no effect on GFP expression. These results make a noteworthy case about the importance of ligand density and layout on DNA delivery vehicles and shine a spotlight on another potentially critical design principle that may need to be made a priority for incorporation during the engineering phase of future DNA‐based therapeutic carriers.
Figure 19.
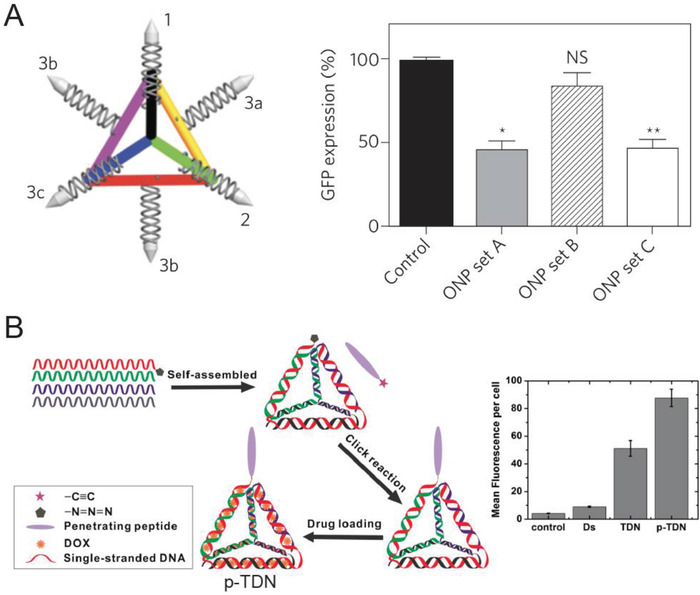
DNA tetrahedral nanostructure and example ligand attachments that may enhance target specificity. A) Schematic showing a DNA tetrahedron with various positions for folate attachment (shown as silver bullets on the vertices). Efficacy of siRNA‐mediated gene silencing of green fluorescent protein (GFP) inside cells can vary vastly by the orientation of the folate molecules—the GFP expression plot shows silencing activity of the DNA tetrahedron designed with set A (1, 2, and 3a), set B (1, 2, and 3b), or set C (1, 2, and 3c). *p < 0.018, **p < 0.019 compared with control (naked GFP siRNA). NS, not significant. Reproduced with permission.77 Copyright 2012, Springer Nature. B) Design format for a DNA tetrahedron labeled with a tumor penetrating peptide on one vertex for enhanced targeting (p‐TDN). Mean fluorescence per cell derived from flow cytometry analysis of p‐TDN internalization into cells in comparison to controls—PBS only, dsDNA, tetrahedron without peptide. Reproduced with permission.25 Copyright 2016, American Chemical Society.
In a recent example of combining a Dox‐carrying DNA nanostructure with a targeting ligand, a Dox‐loaded DNA tetrahedron was labeled at one vertex with a tumor‐penetrating peptide155 (TPP) sequence against the receptor neuropilin1, which is expressed on the cell membrane of glioblastoma and endothelial cells found on angiogenic blood vessels (Figure 19B).25 For characterizing cellular uptake efficiency, a Cy3 molecule was also attached to the tetrahedral structure. Tetrahedron without a TPP tag showed equal and nonspecific internalization in both normal (HEK293) cells and carcinogenic (U87MG human glioblastoma) cells whereas TPP‐tetrahedron showed twofold higher uptake in tumor cells. Li et al. attached the aptamer AS1411 that targets nucleolin, a nuclear transport protein overexpressed on tumor cell membranes, onto DNA tetrahedral structures and also observed enhanced uptake in breast cancer cells compared to normal cells.76 Other kinds of anti‐cancer therapies have also been integrated with DNA nanostructures. A DNA tetrahedron, also labeled with AS1411 and another aptamer targeting MUC1 transmembrane glycoprotein, was developed for delivering the anticancer metal complex—([Ir(ppy)2phen]+PF6) which is known to target tumor cell vascular mimicry.[[qv: 144h]] The combination of two instead of one or zero targeting aptamers on the DNA tetrahedral drug vehicle had higher selectivity for U251 and U87 (human osteosarcoma epithelial) cells in comparison to CHEM‐5 and HBM cells (normal gliocytes and human brain microvascular endothelial cells, respectively). In another analogous example, elevated biotin receptor expression on some tumor cells was capitalized for targeted nuclear delivery using a DNA tetrahedral vehicle (Figure 20 ).[[qv: 87b]] When the biotin‐tetrahedron loaded with a ruthenium polypyridyl metal complex (Ru) was introduced to a mixed culture of HepG2 (human hepatocellular carcinoma cells; biotin receptor positive) and NIH‐3T3 (mouse embryo fibroblast; biotin receptor negative) cells, no uptake was observed in the latter. The selectivity was exemplified by the cytotoxicity results—30% of HEPG2 cells underwent apoptosis induced by exposure to the biotin‐Ru‐tetrahedral DNA structures whereas a mere 4% of normal NIH‐3T3 cells died after 24 h of the same incubation. It is also worth highlighting that biotin, as a vitamin, is destined for nuclear delivery upon uptake by its receptor, and this property was leveraged by the biotin‐tetrahedron to deliver Ru complex to the nucleus of HEPG2 cells.
Figure 20.
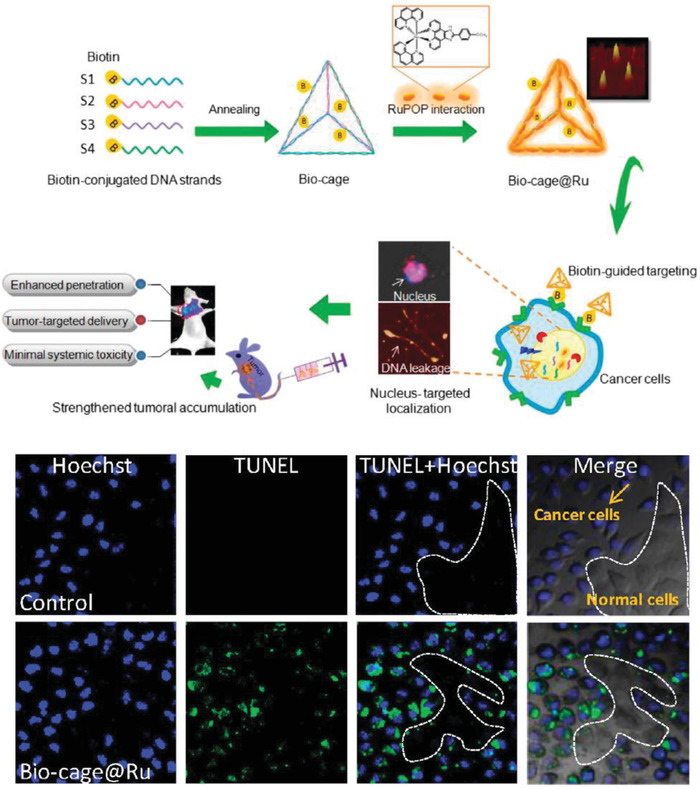
Biotin‐labeled DNA tetrahedron for selective drug delivery. Top: schematic illustrating the design, characterization by AFM, and process flow of using a DNA tetrahedron labeled with four biotin molecules for in vivo targeting. The tetrahedron was loaded with an intercalating metal complex dye (RuPOP) to form Bio‐cage@Ru. The complex was then administered to cancer cells where biotin labeling caused transport of the structures to the nucleus. The structures were also injected into mice to observe enhanced penetration, and other benefits. Bottom: representative confocal images that show selective induction of apoptosis in cancer cells (stained with TUNEL in green) but not in noncancerous cells (unstained) by Bio‐cage@Ru. Blue stain (Hoechst 33342) stains the cancer cells. Reproduced with permission.[[qv: 87b]] Copyright 2016, Elsevier.
A set of three aptamers—Sgc8c, Sgc4f, and TC01—were also used to target overexpressed receptors (e.g., tyrosine‐protein kinase PTK7 for Sgc8c) on CEM (human acute lymphoblastic leukemia) cells but absent on other cells (such as Ramos cells) using a branched DNA “nanoclaw” (Figure 21 ).154 In the DNA nanoclaw, the three aptamer sequences (functioning as its autonomous “capture toes”) are engineered to release a “barcode” oligo molecule after binding to the corresponding target cell receptor. Only the presence of a threshold quantity of barcode oligos from all three aptamer claws allowed for an “effector toe” to activate the functionality of the DNA nanoclaw, which could be potentially programmed for subsequent biosensing or therapeutic delivery utility. The DNA nanoclaw could also be programed to contain two aptamer capture toes in place of three. Although the thresholding property of the DNA nanoclaw needs further development, it is still highly promising as it could be crucial for the precise discrimination between cells that have some common receptors that are deferentially expressed.
Figure 21.
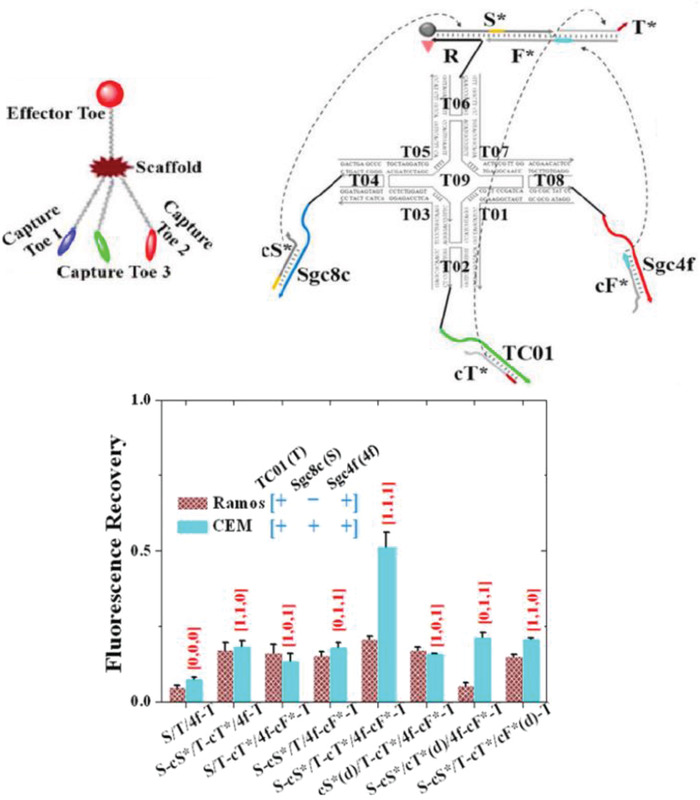
A three‐input DNA “nanoclaw.” Top: design and structure of the DNA nanoclaw. The nanoclaw contained three capture toes made of TC01, Sgc4f, and Sgc8c aptamers. In the presence of the correct cellular signals, the capture toes released barcode oligos (cT*, cF*, cS*, respectively) that interact with the effector toe and activate the nanoclaw for drug release or biosensing. Bottom: flow cytometry Cy5.5 fluorescence results of nanoclaw functionality against two cells (Ramos and CEM) that have known differences in cellular receptor makeup. X‐axis shows the various nanoclaw configurations tested, where X‐cX* indicates activation of a specific aptamer, cX*(d) represents a control in which the specific aptamer is inactivated by a fully complementary strand. X = S/T/4f. Reproduced with permission.154 Copyright 2014, American Chemical Society.
Complex DNA nanostructures naturally lend themselves to dynamic actuation as discussed previously, thus it becomes possible to create “capsules” that sequester drugs until the correct molecular signal is received to release them.[[qv: 48b,c,51c]] Arguably the most exemplary demonstration of targeted delivery in DNA nanotechnology is a DNA‐based nanorobot engineered to deliver molecular cargo to specific cells (Figure 22 ).[[qv: 48b]] This nanorobot is a reconfigurable DNA origami barrel (≈40 nm) which remained in a closed state via aptamer‐DNA hybridization and opened to release the payload in response to specific cellular membrane signals. The nanorobot was locked in the closed state by the hybridization between the aptamer strands and partially complementary ssDNA strands. The partial complementarity facilitated rapid reconfiguration of the aptamer strands when binding to appropriate cellular membrane receptors which led to opening of the nanorobot. Aptamer sequences against different cellular receptors could be integrated into the lock mechanism on the nanorobot to enhance targeting of the desired cells. Aptamer locks against platelet‐derived growth factor (PDGF), TE17, and Sgc8c that have known expression profiles on the six different cell lines were utilized. For instance, aggressive NK (natural killer) leukemia cells, expressing the cell membrane receptors PDGF and TE17, triggered the opening of nanorobots that were locked with the corresponding aptamers; this clearly exemplifies the implementation of molecular Boolean logic or information processing in targeted delivery. Judicious engineering was also implemented into the design of the nanorobot to ensure initial assembly in a closed state and a spring‐like swinging open of the nanorobot when unlocked, thereby preventing premature release and increasing the efficiency of payload delivery. The nanorobots were loaded with fluorescently labeled antibody fragments against human leukocyte antigen (HLA‐A/B/C) and were administered to different cell lines expressing different combinations of membrane receptor “keys” that could unlock or remain unreactive to the aptamer locks on the nanorobot. In the presence of the right combination of “keys,” the nanorobot opened and allowed the binding of the fluorescent‐tagged antibody fragment payload to the cell membrane as visualized by an increase in the overall fluorescent output. Critically, the ability of the nanorobot to tag the correct cell was also successfully evaluated in a mixed population of cells.
Figure 22.
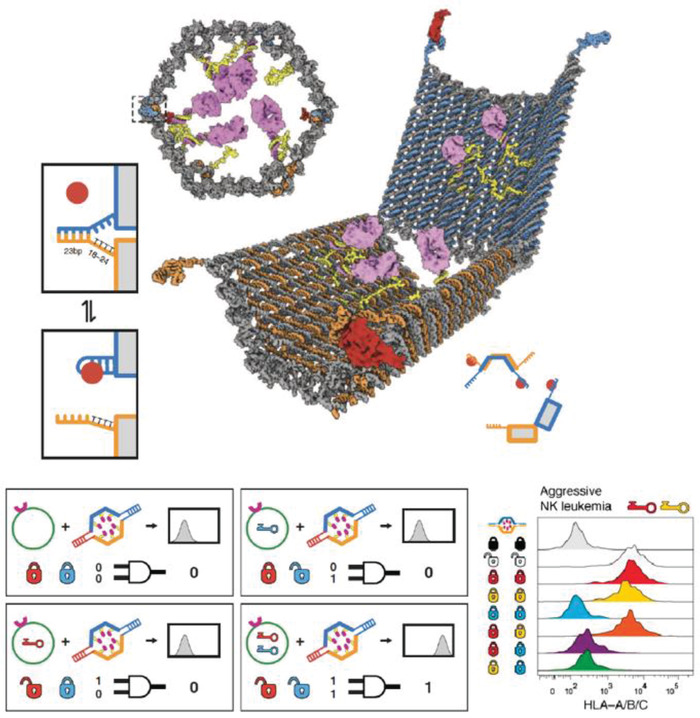
Reconfigurable DNA “nanorobot” used for controlled drug delivery. Top: design schematic of the DNA origami nanorobot in front, closed view and open view. Pink domains represent a protein payload. The aptamer lock mechanism (shown in two boxes on the left) is based on aptamer (blue) hybridization with a partially complementary strand (orange) in the closed state. In the presence of antigen “key” (shown as a red circle), the aptamer binds to the antigen, dehybridizes with the complementary strand, and consequently unlocks the nanorobot. Bottom: each nanorobot can be locked with two aptamer locks that are specific to different antigen keys. The two locks function as an AND logic gate where only in the presence of both antigen keys the nanorobot will unlock (indicated as signal 1). This was characterized by a histogram of fluorescence versus cell counts (right). Shown here are results of incubating a nanorobot loaded with fluorescent antibody fragments against human leukocyte antigen (HLA‐A/B/C) and with several different lock combinations based on three aptamers—41t, against platelet‐derived growth factor (PDGF), shown as a red lock; TE17, shown in yellow; and sgc8c, shown in blue. Black and white “locks” indicate controls of always closed and open nanorobots, respectively. Flow cytometry results (observing anti‐HLA‐A/B/C fluorescence) of incubation of the eight different nanorobots with aggressive NK leukemia cells that express antigens against PDG and TE17 aptamers. Reproduced with permission.[[qv: 48b]] Copyright 2012, American Association for the Advancement of Science.
A reconfigurable DNA origami rectangle (90 nm) “nanorobot” was also engineered for aptamer‐driven targeted delivery of thrombin molecules and tested with an in vivo mouse system (Figure 23 ).[[qv: 48c]] Here, the surface of the rectangular origami sheet was modified with four extending poly‐A sequences that hybridized with thrombin‐modified poly‐T DNA conjugates. Thrombin‐DNA conjugates were synthesized by attaching thiolated poly‐T DNA oligonucleotides to thrombin molecules via a sulfo‐SMCC (sulfosuccinimidyl‐4‐[N‐maleimidomethyl]cyclohexane‐1‐carboxylate) heterobifunctional chemical cross‐linker. After thrombin attachment to the sheet, the origami was closed and locked into a tubular state by AS1411 aptamer‐DNA hybridization. AS1411 aptamer fasteners enabled the opening of the nanorobot only in response to binding to nucleolin. The nanorobot was intravenously injected into tumor‐bearing mice and monitored for biodistribution, toxicity, and thrombosis in the tumor site. The results showed a sevenfold higher tumor accumulation than a nontargeted version of the nanorobot (which were not locked using AS1411 aptamer molecules). Thrombosis, the process of blood coagulation, especially in tumor vasculature can cause necrosis and cell death in tumor cells. The nanorobots successfully internalized within the tumor vascular endothelium cells as evidenced by the induction of thrombosis and reduction in tumor size over the course of 21 d. Nanorobot‐assisted delivery of thrombin showed higher attenuation in tumor weight than the administration of free thrombin or nontargeted nanorobots. Lastly, the work included a safety study of the thrombin‐loaded nanorobot on Bama miniature pigs that bear physiological and anatomical similarities to humans, and found the system to be safe with normal pigs.
Figure 23.
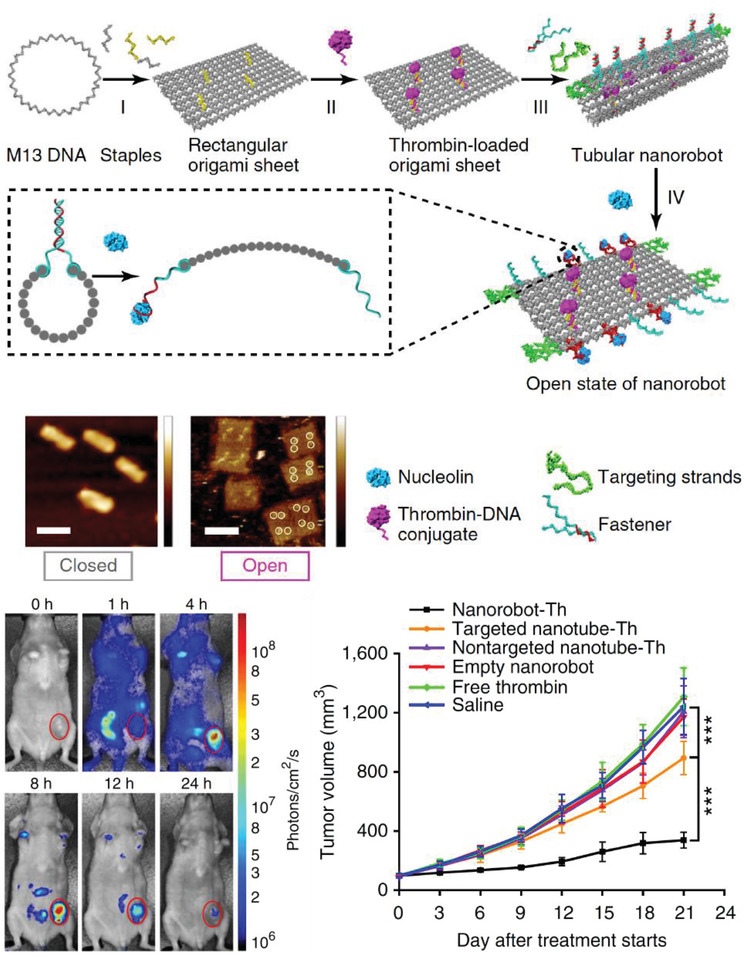
Design and characterization of a dynamic DNA origami “nanorobot” loaded with thrombin (Th) molecules within a rectangular DNA structure and locked into a tubular structure using aptamer locks. Inset shows the side view of a closed nanorobot with aptamer‐DNA duplex (called fastener), which opened in the presence of nucleolin protein into a rectangular sheet. Representative AFM images show the closed and open configurations. Scale bar = 100 nm. Whole animal optical analysis after the administration of Th‐loaded nanorobot to tumor‐bearing mice at t = 0. Tumor volume tracked over 21 d after the administration with saline, free Th, targeted empty nanorobot, nontargeted nanotube‐Th, targeted nanotube‐Th or nanorobot‐Th (nanorobot‐Th vs targeted nanotube‐Th, p = 0.00016; targeted nanotube‐Th vs saline, p = 0.00031). Reproduced with permission.[[qv: 48c]] Copyright 2018, Springer Nature.
Telomerase is an enzyme associated with aging and tumor cell transformation to an immortalized phenotype. This enzyme is overexpressed in some cancer cells where it extends the telomeric DNA repeats present at the ends of chromosomes as part of this process and it was thus targeted for suppression using a DNA cage.[[qv: 51c]] The DNA cage used in this example was an icosahedral structure (20 nm) that could open into two constituent halves initially connected by DNA‐DNA hybridization. The connecting DNA strands were designed to contain telomeric promoter and primer sequences, such that telomerase enzyme presence triggered the extension of the primer sequence causing dehybridization between the connecting strands and opening of the cage (Figure 24 A). A platinum‐NP based nanodrug—PtNP—was noncovalently encapsulated into the DNA cage and introduced to cancerous hepatic cells that were known to be cisplatin‐resistant (another platinum‐based cancer drug). No leaching of the drug through the DNA cage was observed in whole blood or serum over 24 h of extended incubation. Both normal and cancerous cells showed equal uptake of the drug‐loaded cages, perhaps due to the absence of any cellular receptor targeting ligands. However, after internalization, telomerase in the cancer cells triggered primer elongation, opening of the cages, and release of the drug. This “lock” system that responds only to telomerase ensured unchanged cell survivability in the normal cells. This is an interesting strategy to increase selectivity of drug‐delivery to a given enzyme target. However, the rate of uptake of this drug‐loaded icosahedral structure by normal cells and previously known information that drug release can take place by lysosomal degradation of DNA‐based vehicles remains a critical issue needing to be further addressed prior to translation of this system. Perhaps uptake of the icosahedral cage into cancer cells can be greatly increased compared to normal cells using targeting ligands as a potential approach to reducing dosage quantities and therefore attenuating uptake by normal cells.
Figure 24.
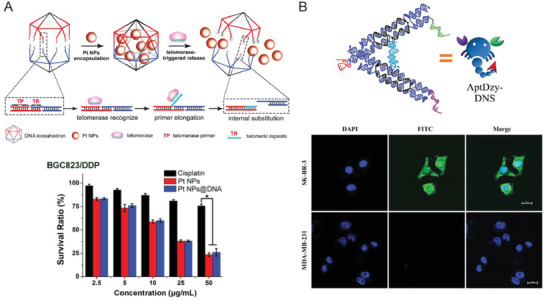
Other examples of dynamic DNA delivery vehicles. A) Top: schematic representing the design and production of telomerase‐triggered DNA icosahedral cages for the delivery of platinum‐NP (PtNP) cancer drug to cisplatin‐resistant cells. Two halves of the icosahedron were connected by dsDNA sequences that are specific to telomerase promoter and repeats. First, Pt‐NP was loaded into the cage via diffusion. After uptake by cells, telomerase enzyme bound to the promoter region and proceeded to polymerize the telomeric repeat, which lead to the cleavage of the cage and consequent release of Pt‐NP. Bottom: cytotoxicity evaluation of free cisplatin, Pt NPs and Pt NPs@DNA (icosahedron) in one type of cisplatin‐resistant cancer cells. Reproduced with permission.[[qv: 51c]] Copyright 2018, John Wiley and Sons. B) Top: design of AptDzy‐DNS “nanoscorpion,” where the stingers represent two aptamer strands for targeting SK‐BR‐3 cancer cells—anti‐nucleolin aptamer (NApt) and anti‐HER2 aptamer (HAp)—and the pincer represents HER2 mRNA cleaving DNAzyme. Bottom: confocal images show the targeted uptake of DNA nanoscorpions by SK‐BR‐3 cells (monitored by FITC fluorescence in green) and not by MDA‐MB‐231 cancer cells. DAPI (blue) was used for nucleus staining. Reproduced with permission under the terms of the Creative Commons Attribution 4.0 International License.52 Copyright 2018, the Authors. Published by Springer Nature.
For oligo‐based therapies, functional nucleic acid treatment agents can be “loaded” onto or into DNA structures using simple DNA‐RNA hybridization.61, 77, 105, 156 In this vein, a DNA tetrahedron was explored for delivering siRNA molecules using folate‐driven delivery to HeLa cells.77 siRNA function to target specific genes and knock down their expression by targeting their RNA message, thereby reducing target protein expression. In this context, a short overhanging DNA domain was designed as an extension to one DNA tetrahedron strand, to which the siRNA could hybridize. This study presented a systematic and comparative analysis of nearly 30 cell targeting ligands, as well as the effect of the relative density and orientation of folic acid molecules displayed on the DNA tetrahedral structure on its subsequent delivery efficacy (discussed previously).77 The successful reduction in GFP protein expression was also observed when the folate‐tetrahedron was used to deliver siRNA in GFP‐expressing tumor xenograft mice, both intravenously and through intratumoral injection. It is also important to state that the DNA tetrahedron‐siRNA exhibited a longer blood circulation time than the bare siRNA molecule, 24 versus 6 min, respectively.
Inducing targeted autophagy, a cellular housekeeping process of destroying and reprocessing damaged proteins and nucleic acid components for recycling, is a common anticancer treatment strategy and was the mechanism of interest in another DNA structure‐based therapeutic carrier.[[qv: 146f,156]] Du et al. investigated the signaling pathway of the gene Autophagy Related Gene 101 (ATG101) in inducing the aberrant proliferation of hypoxic‐induced human pulmonary arterial endothelial cells (HPAECs) to test the therapeutic effects of knocking down the gene and inducing apoptosis.[[qv: 146d]] Antisense RNA complementary to the ATG101 gene was embedded into a simple three‐strand DNA triangle for delivery to HPAEC cells and knockdown of the ATG101 gene. ATG101 protein expression levels decreased to 50% due to the DNA triangle assisted delivery of the antisense RNA compared to only a 25% decrease from bare RNA delivery after 48 h incubation showing higher knockout activity of the DNA triangle‐assisted delivery mechanism. Although quite promising, this example still faces all the difficulties in going from this result to a full blown targeted therapeutic.
Another type of functional nucleic acid delivered with the assistance of DNA nanostructures are DNAzymes; these are catalytic oligo‐cleaving DNA molecules. DNAzymes, typically < 20 bp long, are increasingly being considered as candidates for gene silencing as they can be custom designed to cleave specific mRNAs into fragments.157 Just like the previous examples of delivering nucleic acid therapeutics, DNAzymes can be incorporated into DNA structures by DNA hybridization as well as direct sequence integration into the scaffold itself. Figure 24B shows how a DNA “nanoscorpion” was assembled with two embedded aptamer ligands (as scorpion stingers) targeting tumor cells and a DNAzyme sequence (as the scorpion pincer).52 The nanoscorpion was tested in SK‐BR‐3 (human breast cancer) cells to cleave human epidermal growth factor (HER2) mRNA using a specific DNAzyme. Aptamers against two membrane receptors known to be overexpressed on SK‐BR‐3 cells—anti‐nucleolin aptamer and anti‐HER2 aptamer—were used as the targeting ligands on the nanoscorpion. Using a FITC tag on the structure, it was shown that the nanoscorpion successfully internalized specifically into the breast cancer cells and not in normal cells. The nanoscorpion further accumulated both in the nucleus and cytoplasm due to nucleolin‐mediated endocytosis. RT‐PCR characterization showed a reduction of HER2 mRNA expression in SK‐BR‐3 cells that were incubated with the nanoscorpion. This is an exciting DNA design combining the benefits of specific targeting of an overexpressed tumor marker with a functional therapeutic.
As mentioned, oligodeoxynucleotides (ODN) rich in CpG sequences (18–28 nt long) are well‐known immunostimulatory agents that are now being researched for their ability to stimulate immune cells for new treatment strategies such as cancer therapy, improved response to vaccines, and reduced allergic reactions.158 The ability to deliver such immunostimulatory agents also paves the way toward an improved capacity to administer vaccines using DNA nanostructures. Like other nucleic acid agents, CpG‐ODNs also require protection from nucleases for successful transfection into cells. Schuller et al. utilized a DNA origami nanotube (80 nm) as a substrate to carry via DNA‐DNA hybridization up to 62 CpG‐1826 sequences for delivery to mammalian primary splenic cells (Figure 25 A).[[qv: 74a]] CpG‐1826 is a well‐characterized 20 nt sequence known to stimulate mouse Toll‐like receptor 9 (TLR9) which is an important cell receptor on immune cells that triggers a cascade reaction leading to the secretion of proinflammatory cytokines. To monitor uptake by the cells, the nanotube and controls (such as bare CpG molecules) were also labeled with a FITC fluorescent dye. Uptake of the CpG‐nanotube was found to be over threefold higher than bare CpG molecules. A DNA tetrahedron was also modified to have CpG sequences extending from the four vertices to stimulate macrophage‐like cells, leading to higher secretion of cytokines that were indicative of an activated immune response.58
Figure 25.
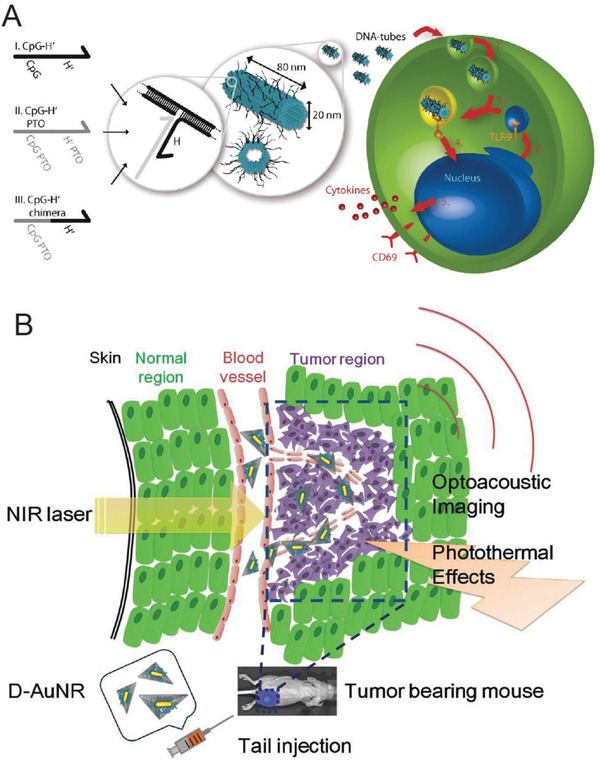
Other therapeutic applications of DNA‐based nanostructures. A) Design of a 30 hb DNA origami structure (shown in blue) with extending ssDNA sequences (black lines) for attaching CpG sequences. Three different versions of CpG strands (called CpG H's) with I) unmodified phosphate backbone, II) phosphorothioate (PTO)‐modified backbone, and III) partly PTO‐modified backbone were tested for uptake by immune cells. A schematic of uptake of the nanostructures by endocytosis, vesicle segregation by the Golgi apparatus containing the transmembrane Toll‐like receptor 9 (TLR9), endosome fusion with nanostructure and TLR9 vesicle, which lead to recognition of CpG sequences and consequent release of cytokines. Reproduced with permission.[[qv: 74a]] Copyright 2011, American Chemical Society. B) Schematic showing a triangular DNA origami structure modified with an AuNR particle using complementary ssDNA capture strands (to form DAuNRs). The DAuNRs were injected into tumor‐bearing mice by tail injection, followed by optoacoustic imaging and photothermal therapy. Reproduced with permission.147 Copyright 2016, John Wiley and Sons.
Another DNA tetrahedral structure was shown as a carrier to develop a synthetic vaccine complex.85 As a first step in developing activated T cells (which are responsible for then generating antibodies against the targeted pathogen), pathogen specific antigen has to be delivered to antigen precursor cells (APCs). For high efficacy, the antigen is coupled with adjuvants before introduction to APCs. As proof‐of‐principle, a CpG‐labeled DNA tetrahedron (which as mentioned repeatedly has already demonstrated elevated uptake efficiencies)[[qv: 74b]] was harnessed to increase the uptake of fluorescently labeled streptavidin (used as a model antigen) by RAW264.7 immune cells and a mouse model system. Results showed that, over the course of 70 d, mice injected (immunized) by tetrahedron‐loaded CpG+streptavidin developed ≥ 5x higher levels of antibodies against streptavidin than mice injected with free CpG+streptavidin.
It has also been shown that delivery of AuNRs via DNA structures for subsequent PTT applications improves cellular penetration into tumor cells.[[qv: 87a,144c,147]] In a study performed by Jiang et al., the cellular uptake of AuNRs attached to a DNA triangle (120 nm) or nanorod (380 nm) was nearly twofold higher than bare AuNRs in MCF‐7 cells[[qv: 87a]] The efficacy of photothermal‐induced cell death was also higher in the case of the DNA nanostructure‐assisted AuNR uptake, suggesting that the DNA carrier may have a role in enhancing AuNR response to light. For the latter, cell viability values dropped to 10% whereas free AuNRs caused only 50% cell death. Additionally, Du et al. organized an AuNR on a DNA triangle and intravenously injected the system in a tumor bearing mouse model for combined optoacoustic imaging (image generation from the ultrasonic waves created by the NIR‐excitation of AuNRs) and PTT (Figure 25B).147 Results indicated that DNA triangle‐AuNR constructs remained concentrated within the tumor region for longer durations (24 h) compared to bare AuNRs, which peaked around 8 h after delivery then diminished in concentration. The survival rate 30 d postinjection in mice that were treated with AuNR‐DNA triangles was 80% compared to 20% in bare AuNR treatment group. Other research has pointed to an increased adsorption of cellular proteins on DNA‐coated AuNRs which caused increased cellular uptake.159 Therefore, a comparison of plasmid DNA with various DNA nanostructures in assisting AuNR cell uptake would certainly be worth investigating in order to assess the exact role of synthetically designed DNA delivery nanodevices in this area of therapy.
Combinatorial therapies can also be explored by integrating different components onto the same DNA substrate.[[qv: 144a,160]] PDT and PTT are often traditionally combined on a joint scaffold by electrostatic interaction but suffer from instability for subsequent delivery purposes. Coupling of PDT and PTT is possible because both techniques require NIR laser power for excitation of photosensitive compounds and AuNPs, respectively. Moreover, the photosensitive compound can be quenched and, therefore, programmed to remain nontoxic by attaching it to AuNP surfaces until NIR‐triggered activation occurs. To potentially address the challenge of combining photosensitive compounds with nanomaterials, AuNRs were used as substrates for the attachment of many copies of a chlorin e6‐polyvinylpyrrolidone (Ce6‐PVP) photosensitizing molecule via a Sgc8 aptamer stem‐loop structure.160 With cells that lack the PTK7 receptor (Sgc8 target) such as Ramos cells, the aptamer‐conjugated photosensitizer remained quenched due to proximity to the AuNR and was nontoxic. However, in the presence of target cells (CEM cells) the aptamer underwent reconfiguration which increased the separation between the photosensitizer and AuNR, and unquenched the photosensitizer. Light irradiation lead to a decline in cell viability in CEM cells to 60% but Ramos cells showed normal cell viability (compared to cells that were not treated) with AuNR‐aptamer‐Ce6‐PVPs. The AuNRs here played the joint role of an imaging tool and PTT agent as supported by its DNA scaffold and delivery platform.
Such multifunctional designs or combinatorial approaches also enable implementing the properties of a theranostic system to serve as drug delivery vehicles in conjunction with biosensing and/or imaging.[[qv: 48a,144c,161]] In one relevant example, Cy5 served the role of an imaging dye, and AS1411 and MUC1 aptamers imparted targeting capability to a Dox‐loaded DNA tetrahedron for the real‐time monitoring of uptake and delivery of the structure into cancer cells.[[qv: 144g]] The Cy5 dye was conjugated to the MUC1 aptamer and the aptamer sequence itself extended from a vertex on the tetrahedron and formed a duplex with a quencher‐labeled complementary ssDNA molecule. Therefore, in the absence of MUC1‐specific cell signal, the MUC1 remained in a duplex state and Cy5 remained quenched. On binding to the cell surface of MUC1‐positive cells (MCF‐7), the aptamer underwent reconfiguration which led to the release of quencher‐labeled DNA complement and a concomitant Cy5 fluorescence recovery. The endocytic uptake of the DNA tetrahedron could be tracked using this Cy5 fluorescence. This approach has a potential benefit of differentiating between cells based on the fluorescence response to given surface receptor presence. Another approach designed for mRNA‐triggered Dox release on a folic acid‐coated AuNR‐DNA carrier, combining chemodrug‐based therapy with targeted photoacoustic therapy.[[qv: 144c]]
In contrast to employing molecular ligands for targeting, L‐DNA, the enantiomeric isoform of the natural and more predominantly occurring D‐DNA, was harnessed to develop delivery scaffolds.[[qv: 144j,k,145]] In one example, an L‐DNA tetrahedron was used as a vehicle for the delivery of three different enzymes—CASP3 protein (a protease responsible for inducing caspase‐based apoptosis), Cre recombinase (a nuclear enzyme that performs site‐specific DNA recombination), and β‐galactosidase (an enzyme that breaks down galactoside carbohydrates)—to HeLa or fibroblast cells.145 The enzymes were conjugated to streptavidin and attached to one vertex of the tetrahedron via biotin. In each case, the physiological effect of the enzyme was evaluated after cellular uptake. For example, cellular viability in the CASP3‐streptavidin‐tetrahedron treated sample was reduced to ≈25% compared to ≈75% in CASP3‐streptavidin only. The streptavidin‐tetrahedral structures were also intravenously injected into a mouse model. They were found to accumulate at the tumor site up to 4 h, followed by gradual clearance over the 24 h postinjection period, again pointing to a propensity of DNA structures to accumulate in tumors even without any targeting signals.
Oral delivery of DNA‐based drugs is usually not even contemplated due to the deleterious effects expected in the stomach and gastrointestinal tract. However, engineering of a DNA‐based therapy for oral administration is still being tested in order to enhance protection for DNA‐associated drugs that could be susceptible to degradation by the acidic stomach environment. Using an electrostatic attraction method, Baig et al. developed small drug‐loaded DNA triangles that were coated by Eudragit (a type of organic copolymer) and loaded with the drug Vildagliptin into nanospheres.162 Vildagliptin is a drug for the treatment of Type 2 diabetes that is metabolized by liver hydrolases and represents a model drug in this example. Nanospheres in the size range of 500–2000 nm were created that showed drug entrapment efficiencies up to 95% and retention of 15 h. The nanospheres also tolerated the acidic pH of the stomach and enhanced glycemic control in mice without increasing the risk of pancreatitis or pancreatic cancer.
And last, but not certainly least, there are DNA nanostructures that serve the functional role of a therapeutic agent per se rather than a carrier. For example, cell membrane rupturing NPs can induce cell death on their own when appropriately implanted.163 To this end, a 6 hb (14 nm) DNA “nanopore” with a 2 nm wide hydrophobic “belt” at one end was designed to interact with cancer cell membranes, insert, and then create a membrane‐spanning pore to trigger cell death.164 The hydrophobic belt was created by anchoring 72 molecules of charge‐neutralized ethylphosphorothioate (EP) groups. The belt replaced the surface negative charge of the DNA backbone and enabled the desired membrane‐spanning effect in the nanopore. EP‐nanopores were found to induce 20% cytotoxicity 24 h post‐transfection in HeLa cells.
7. Challenges and Outlook
The burgeoning field of biomedical applications based on DNA nanotechnology has made promising advances in the past decade with applications in sensing, diagnostic, and drug delivery as exemplified by the work discussed here. Some of the greatest achievements include the ever‐growing repository of DNA response mechanisms that allow the translation of chemical and biological signals through structural reconfiguration of oligonucleotides (Table 2). These functionalities can be leveraged to detect a wide variety of biomolecules, as stand‐alone nanosystems, or even as facilitators to existing technologies. For example, proteases, like miRNAs, have emerged as key indicators of aberrant cell behavior, particularly in various cancers. The detection of proteases is currently accomplished using classical techniques such as ELISA or proteolytic activity assays, but one promising study showed that DNA rolling circle amplification‐assembled belts can improve the sensitivity of the detection of prostate‐specific antigen via magnetic bead‐based ELISA.[[qv: 51a]] Advancing research on dynamic reconfigurable architectures, in particular, will be of importance to expand the scope of the field in healthcare.
Another great advantage of DNA nanostructures is the versatility of the DNA architecture itself. There is an almost limitless range of reconfigurable DNA structures that can be recruited to engineer biomedical systems. Moreover, these DNA nanostructures can be unlocked in response to all kinds of cellular signals and fine‐tuned to cater to a multitude of cargo loading capacities, delivery mechanisms, and combinatorial strategies. The range of actual DNA architectures that have been the focus of cellular applications are somewhat limited to the DNA tetrahedron and a few other shapes such as the DNA nanotube. The DNA tetrahedron structure is robust, requires a short annealing step to self‐assemble, yields nearly perfect formation with minimum post‐assembly purification needed, and has a growing list of comparative examples in the literature.165
The exemplary performance of DNA‐based carriers in targeted oncolytic therapies certainly warrants continuing attention as cancer drugs have high systemic toxicity and cancer cells rapidly mount challenges such as MDR. Indeed, both these issues have been examined using in cellulo and in vivo models and could be potentially overcome using designer DNA structures. Increasing the permeability of drug‐delivering vehicles to tumors is also a major challenge with a predicted median value of drug absorbance into the tumor in most oral or intravenous therapies being merely 0.7%.166 It is hoped that biocompatible DNA‐based carriers could contribute significantly to enhancing this value by exploiting targeted delivery modalities. DNA nanostructures have also shown promise in increasing tumor accessibility in imaging.
Drug delivery requires overcoming a major roadblock in the path to nuclear transport or for other targeted subcellular delivery—endosomal entrapment, which oftentimes leads to lysosomal degradation and release or removal of cargo.[[qv: 32a]] DNA nanostructures can be easily labeled with nuclear transport ligands which may offer a potential solution to the problem. However, this would still be predicated on achieving initial endosomal escape. Fortunately, much work toward this is currently underway.167 Additionally, a complex response mechanism guided by multiple carefully chosen cellular receptors can be embedded into DNA nanostructures by simultaneously using multiple targeting or recognition ligands to truly exploit the utility of DNA information processing for specific or selective targeting.47 Incorporating more complex DNA computing may pave the way toward implementing more complex smart capabilities (such as Boolean algebra) and biological information processing mechanisms (such as neural networks)168 that can potentially enhance the resolution of a targeted therapy. Specific and targeted delivery of a chemotherapeutic to a cell expressing only the right combination of cell surface markers is the primary example epitomizing this approach.154
One promising healthcare‐related area only starting to receive research attention recently is that of using DNA nanostructures as vaccine display scaffolds due to their ability to present antigenic proteins or molecules in specified 3D architectures.85 It is thought that such vaccine vectors can help create immunity to previously challenging epitopes that could not be exposed to the immune system in the correct immunoactivating configuration. Of course, there are many difficulties that need to be addressed with respect to DNA nanostructures. Despite the breadth of work performed in the purification, characterization, and analysis of DNA nanostructures, the field still faces many uncertainties in achieving 100% homogeneous and identical constructs, something that may be needed for governmental approval prior to translation as an actual therapeutic.13 There is also a need for more powerful techniques to determine structural integrity inside living systems at the molecular level in order to confidently understand the effects of nucleases, changes in pH, protein binding, and other related factors on DNA architectures. It can be inferred from the published DNA‐based delivery vehicles that perhaps biomedical applications may not require perfectly formed structures and that the current pace of development of analytical techniques in DNA nanotechnology will continue to fulfill the needs of the field. In fact, small structures such as the DNA tetrahedron and dendrimer can be assembled at µM scale without the need of further purification.[[qv: 144a,e]] However, scalability will be essential to drive the field into clinical applications because quantities produced for experimental purposes lie in the mere microgram regime. Recent technologies have made significant and promising breakthroughs in addressing the scalability challenge. The primary ingredient of DNA nanostructures is the ssDNA scaffold strand (typically the m13 plasmid in nature), producing which in large quantities has been solved by culturing m13 virus‐infected bacterial hosts in large bioreactors.169 The approach was further developed to simultaneously produce “industrial‐scale” quantities of the viral m13 ssDNA scaffold strand and staple sequences required for a DNA nanostructure.170 Eliminating the need for staple strands is another new approach wherein a single‐molecular DNA origami can be constructed using one long custom‐built ssDNA scaffold strand synthesized using PCR or in vivo.171 ssOrigami strategy also translates well with RNA‐based origami nanostructures.172 In addition, techniques in molecular modeling and dynamics must be leveraged more for improving the initial design process and envisioning how a structure responds to change in its chemical environment.[[qv: 22b]]
The next few years will tell if therapies and perhaps even theranostics based on multifunctional DNA nanostructures can translate to becoming a reality and are added to the current pharmacological catalog or rather pass into history as another interesting research focus that did not cross the “valley of death” and was supplemented by another “hot and promising” technology that will soon gain prominence.173 Despite all this, structural DNA nanotechnology itself will undoubtedly benefit and utilize the lessons learned in this and many other areas to become at the very least a powerful tool in healthcare research and bioimaging.
Conflict of Interest
The authors declare no conflict of interest.
Acknowledgements
The authors gratefully acknowledge funding from ONR, NRL, the NRL‐NSI, and a LUCI grant in support of the VBFF program through the OSD.
Biographies
Divita Mathur received her Ph.D. in bioinformatics and computational biology from Iowa State University in May 2016 under Prof. Eric Henderson and Prof. Jack Lutz. She is currently a postdoctoral fellow at the U.S. Naval Research Laboratory through the College of Science at George Mason University, where her work focuses on the design and engineering of dynamic self‐assembling DNA nanosystems for interfacing with cellular signals and templated arrangement of inorganic nanoparticles.

Igor Medintz received his Ph.D. in molecular, cellular and developmental biology from the City University of New York in 1998. He is currently the Navy's Senior Scientist for biosensors and biomaterials at the Center for Bio/Molecular Science and Engineering of the U.S. Naval Research Laboratory in Washington, D.C. His research is focused on creating light harvesting systems with DNA technology, active DNA nanostructures, and understanding biological activity at a nanoparticle interface.

Mathur D., Medintz I. L., Adv. Healthcare Mater. 2019, 8, 1801546. 10.1002/adhm.201801546
References
- 1. Nerlich B., Sci. Cult. 2008, 17, 269. [Google Scholar]
- 2.a) Jang B., Gutman E., Stucki N., Seitz B. F., Wendel‐Garcia P. D., Newton T., Pokki J., Ergeneman O., Pane S., Or Y., Nelson B. J., Nano Lett. 2015, 15, 4829; [DOI] [PubMed] [Google Scholar]; b) Ding T., Valev V. K., Salmon A. R., Forman C. J., Smoukov S. K., Scherman O. A., Frenkel D., Baumberg J. J., Proc. Natl. Acad. Sci. USA 2016, 113, 5503. [DOI] [PMC free article] [PubMed] [Google Scholar]
- 3. Wilson E. B., The Cell in Development and Inheritance, 2nd ed., Macmillan & Co., Ltd., New York: 1900. [Google Scholar]
- 4. Vries H. d., Gager C. S., Intracellular Pangenesis, Including a Paper on Fertilization and Hybridization, The Open Court Publishing Co., Chicago: 1910. [Google Scholar]
- 5. Avery O. T., Macleod C. M., McCarty M., J. Exp. Med. 1944, 79, 137. [DOI] [PMC free article] [PubMed] [Google Scholar]
- 6.a) Ribeil J. A., Hacein‐Bey‐Abina S., Payen E., Magnani A., Semeraro M., Magrin E., Caccavelli L., Neven B., Bourget P., El Nemer W., Bartolucci P., Weber L., Puy H., Meritet J. F., Grevent D., Beuzard Y., Chretien S., Lefebvre T., Ross R. W., Negre O., Veres G., Sandler L., Soni S., de Montalembert M., Blanche S., Leboulch P., Cavazzana M., N. Engl. J. Med. 2017, 376, 848; [DOI] [PubMed] [Google Scholar]; b) Hirsch T., Rothoeft T., Teig N., Bauer J. W., Pellegrini G., De Rosa L., Scaglione D., Reichelt J., Klausegger A., Kneisz D., Romano O., Seconetti A. S., Contin R., Enzo E., Jurman I., Carulli S., Jacobsen F., Luecke T., Lehnhardt M., Fischer M., Kueckelhaus M., Quaglino D., Morgante M., Bicciato S., Bondanza S., De Luca M., Nature 2017, 551, 327; [DOI] [PMC free article] [PubMed] [Google Scholar]; c) Russell S., Bennett J., Wellman J. A., Chung D. C., Yu Z. F., Tillman A., Wittes J., Pappas J., Elci O., McCague S., Cross D., Marshall K. A., Walshire J., Kehoe T. L., Reichert H., Davis M., Raffini L., George L. A., Hudson F. P., Dingfield L., Zhu X., Haller J. A., Sohn E. H., Mahajan V. B., Pfeifer W., Weckmann M., Johnson C., Gewaily D., Drack A., Stone E., Wachtel K., Simonelli F., Leroy B. P., Wright J. F., High K. A., Maguire A. M., Lancet 2017, 390, 849; [DOI] [PMC free article] [PubMed] [Google Scholar]; d) Rangarajan S., Walsh L., Lester W., Perry D., Madan B., Laffan M., Yu H., Vettermann C., Pierce G. F., Wong W. Y., Pasi K. J., N. Engl. J. Med. 2017, 377, 2519. [DOI] [PubMed] [Google Scholar]
- 7. Cech T. R., Steitz J. A., Cell 2014, 157, 77. [DOI] [PubMed] [Google Scholar]
- 8. Doudna J. A., Charpentier E., Science 2014, 346, 1258096. [DOI] [PubMed] [Google Scholar]
- 9. Nummelin S., Kommeri J., Kostiainen M. A., Linko V., Adv. Mater. 2018, 30, 1703721. [DOI] [PubMed] [Google Scholar]
- 10.a) Rothemund P. W., Nature 2006, 440, 297; [DOI] [PubMed] [Google Scholar]; b) Dietz H., Douglas S. M., Shih W. M., Science 2009, 325, 725; [DOI] [PMC free article] [PubMed] [Google Scholar]; c) Douglas S. M., Dietz H., Liedl T., Hogberg B., Graf F., Shih W. M., Nature 2009, 459, 414; [DOI] [PMC free article] [PubMed] [Google Scholar]; d) Shih W. M., Quispe J. D., Joyce G. F., Nature 2004, 427, 618. [DOI] [PubMed] [Google Scholar]
- 11.a) Ke Y. G., Ong L. L., Shih W. M., Yin P., Science 2012, 338, 1177; [DOI] [PMC free article] [PubMed] [Google Scholar]; b) Wei B., Dai M. J., Yin P., Nature 2012, 485, 623; [DOI] [PMC free article] [PubMed] [Google Scholar]; c) Mathur D., Henderson E. R., ACS Synth. Biol. 2013, 2, 180. [DOI] [PubMed] [Google Scholar]
- 12. Seeman N. C., Sleiman H. F., Nat. Rev. Mater. 2017, 3, 17068. [Google Scholar]
- 13. Mathur D., Medintz I. L., Anal. Chem. 2017, 89, 2646. [DOI] [PubMed] [Google Scholar]
- 14.a) Le J. V., Luo Y., Darcy M. A., Lucas C. R., Goodwin M. F., Poirier M. G., Castro C. E., ACS Nano 2016, 10, 7073; [DOI] [PMC free article] [PubMed] [Google Scholar]; b) Endo M., Katsuda Y., Hidaka K., Sugiyama H., J. Am. Chem. Soc. 2010, 132, 1592; [DOI] [PubMed] [Google Scholar]; c) Voigt N. V., Torring T., Rotaru A., Jacobsen M. F., Ravnsbaek J. B., Subramani R., Mamdouh W., Kjems J., Mokhir A., Besenbacher F., Gothelf K. V., Nat. Nanotechnol. 2010, 5, 200; [DOI] [PubMed] [Google Scholar]; d) Koirala D., Shrestha P., Emura T., Hidaka K., Mandal S., Endo M., Sugiyama H., Mao H., Angew. Chem., Int. Ed. 2014, 53, 8137. [DOI] [PubMed] [Google Scholar]
- 15.a) Pal S., Deng Z., Ding B., Yan H., Liu Y., Angew. Chem., Int. Ed. 2010, 49, 2700; [DOI] [PubMed] [Google Scholar]; b) Yan H., Park S. H., Finkelstein G., Reif J. H., LaBean T. H., Science 2003, 301, 1882; [DOI] [PubMed] [Google Scholar]; c) Ding B., Deng Z., Yan H., Cabrini S., Zuckermann R. N., Bokor J., J. Am. Chem. Soc. 2010, 132, 3248; [DOI] [PubMed] [Google Scholar]; d) Hung A. M., Micheel C. M., Bozano L. D., Osterbur L. W., Wallraff G. M., Cha J. N., Nat. Nanotechnol. 2010, 5, 121; [DOI] [PubMed] [Google Scholar]; e) Kuzuya A., Kimura M., Numajiri K., Koshi N., Ohnishi T., Okada F., Komiyama M., ChemBioChem 2009, 10, 1811. [DOI] [PubMed] [Google Scholar]
- 16.a) Brown C. W., 3rd, S. Buckhout‐White , Diaz S. A., Melinger J. S., Ancona M. G., Goldman E. R., Medintz I. L., ACS Sens. 2017, 2, 401; [DOI] [PubMed] [Google Scholar]; b) Klein W. P., Díaz S. A., Buckhout‐White S., Melinger J. S., Cunningham P. D., Goldman E. R., Ancona M. G., Kuang W., Medintz I. L., Adv. Opt. Mater. 2018, 6, 1700679. [Google Scholar]
- 17.a) Rajendran A., Nakata E., Nakano S., Morii T., ChemBioChem 2017, 18, 696; [DOI] [PubMed] [Google Scholar]; b) Sacca B., Niemeyer C. M., Chem. Soc. Rev. 2011, 40, 5910. [DOI] [PubMed] [Google Scholar]
- 18.a) Stojanovic M. N., Mitchell T. E., Stefanovic D., J. Am. Chem. Soc. 2002, 124, 3555; [DOI] [PubMed] [Google Scholar]; b) Ezziane Z., Nanotechnology 2006, 17, R27. [Google Scholar]
- 19.a) Proudnikov D., Mirzabekov A., Nucleic Acids Res. 1996, 24, 4535; [DOI] [PMC free article] [PubMed] [Google Scholar]; b) Zearfoss N. R., Ryder S. P., Methods Mol. Biol. 2012, 941, 181; [DOI] [PMC free article] [PubMed] [Google Scholar]; c) Smith L. M., Fung S., Hunkapiller M. W., Hunkapiller T. J., Hood L. E., Nucleic Acids Res. 1985, 13, 2399. [DOI] [PMC free article] [PubMed] [Google Scholar]
- 20. Del Castillo P., Horobin R. W., Blazquez‐Castro A., Stockert J. C., Biotech. Histochem. 2010, 85, 247. [DOI] [PubMed] [Google Scholar]
- 21. Agudelo D., Bourassa P., Berube G., Tajmir‐Riahi H. A., Int. J. Biol. Macromol. 2014, 66, 144. [DOI] [PubMed] [Google Scholar]
- 22.a) Kocabey S., Meinl H., MacPherson I. S., Cassinelli V., Manetto A., Rothenfusser S., Liedl T., Lichtenegger F. S., Nanomaterials 2014, 5, 47; [DOI] [PMC free article] [PubMed] [Google Scholar]; b) Raniolo S., Vindigni G., Ottaviani A., Unida V., Iacovelli F., Manetto A., Figini M., Stella L., Desideri A., Biocca S., Nanomedicine 2018, 14, 1181. [DOI] [PubMed] [Google Scholar]
- 23.a) Zhao W., Lin L., Hsing I. M., Bioconjugate Chem. 2009, 20, 1218; [DOI] [PubMed] [Google Scholar]; b) Kuzyk A., Schreiber R., Zhang H., Govorov A. O., Liedl T., Liu N., Nat. Mater. 2014, 13, 862; [DOI] [PubMed] [Google Scholar]; c) Klein W. P., Schmidt C. N., Rapp B., Takabayashi S., Knowlton W. B., Lee J., Yurke B., Hughes W. L., Graugnard E., Kuang W., Nano Lett. 2013, 13, 3850. [DOI] [PMC free article] [PubMed] [Google Scholar]
- 24. Boeneman K., Deschamps J. R., Buckhout‐White S., Prasuhn D. E., Blanco‐Canosa J. B., Dawson P. E., Stewart M. H., Susumu K., Goldman E. R., Ancona M., Medintz I. L., ACS Nano 2010, 4, 7253. [DOI] [PMC free article] [PubMed] [Google Scholar]
- 25. Xia Z., Wang P., Liu X., Liu T., Yan Y., Yan J., Zhong J., Sun G., He D., Biochemistry 2016, 55, 1326. [DOI] [PubMed] [Google Scholar]
- 26.a) Rosen C. B., Kodal A. L., Nielsen J. S., Schaffert D. H., Scavenius C., Okholm A. H., Voigt N. V., Enghild J. J., Kjems J., Torring T., Gothelf K. V., Nat. Chem. 2014, 6, 804; [DOI] [PubMed] [Google Scholar]; b) Goodman R. P., Erben C. M., Malo J., Ho W. M., McKee M. L., Kapanidis A. N., Turberfield A. J., ChemBioChem 2009, 10, 1551; [DOI] [PubMed] [Google Scholar]; c) Niemeyer C. M., Angew. Chem., Int. Ed. 2010, 49, 1200. [DOI] [PubMed] [Google Scholar]
- 27. Molle J., Jakob L., Bohlen J., Raab M., Tinnefeld P., Grohmann D., Nanoscale 2018, 10, 16416. [DOI] [PubMed] [Google Scholar]
- 28. Numajiri K., Yamazaki T., Kimura M., Kuzuya A., Komiyama M., J. Am. Chem. Soc. 2010, 132, 9937. [DOI] [PubMed] [Google Scholar]
- 29. Dahdah D. B., Morin I., Moreau M. J., Dixon N. E., Schaeffer P. M., Chem. Commun. 2009, 0, 3050. [DOI] [PubMed] [Google Scholar]
- 30. Sorensen R. S., Okholm A. H., Schaffert D., Kodal A. L., Gothelf K. V., Kjems J., ACS Nano 2013, 7, 8098. [DOI] [PubMed] [Google Scholar]
- 31.a) Akinc A., Zumbuehl A., Goldberg M., Leshchiner E. S., Busini V., Hossain N., Bacallado S. A., Nguyen D. N., Fuller J., Alvarez R., Borodovsky A., Borland T., Constien R., de Fougerolles A., Dorkin J. R., Narayanannair Jayaprakash K., Jayaraman M., John M., Koteliansky V., Manoharan M., Nechev L., Qin J., Racie T., Raitcheva D., Rajeev K. G., Sah D. W., Soutschek J., Toudjarska I., Vornlocher H. P., Zimmermann T. S., Langer R., Anderson D. G., Nat. Biotechnol. 2008, 26, 561; [DOI] [PMC free article] [PubMed] [Google Scholar]; b) Miller A. D., Angew. Chem., Int. Ed. 1998, 37, 1768; [Google Scholar]; c) Kataoka K., Harada A., Nagasaki Y., Adv. Drug Delivery Rev. 2001, 47, 113. [DOI] [PubMed] [Google Scholar]
- 32.a) Nunez‐Lozano R., Cano M., Pimentel B., de la Cueva‐Mendez G., Curr. Opin. Biotechnol. 2015, 35, 135; [DOI] [PubMed] [Google Scholar]; b) Niemeyer C. M., Angew. Chem., Int. Ed. 2001, 40, 4128. [DOI] [PubMed] [Google Scholar]
- 33. Sun C. Y., Qin C., Wang X. L., Su Z. M., Expert Opin. Drug Delivery 2013, 10, 89. [DOI] [PubMed] [Google Scholar]
- 34. Son K. H., Hong J. H., Lee J. W., Int. J. Nanomed. 2016, 11, 5163. [DOI] [PMC free article] [PubMed] [Google Scholar]
- 35.a) Zhang Y., Chan H. F., Leong K. W., Adv. Drug Delivery Rev. 2013, 65, 104; [DOI] [PMC free article] [PubMed] [Google Scholar]; b) Hoffman A. S., J. Controlled Release 2008, 132, 153. [DOI] [PubMed] [Google Scholar]
- 36. Kelkar S. S., Reineke T. M., Bioconjugate Chem. 2011, 22, 1879. [DOI] [PubMed] [Google Scholar]
- 37.a) Wang Z. G., Song C., Ding B., Small 2013, 9, 2210; [DOI] [PubMed] [Google Scholar]; b) Tam D. Y., Lo P. K., J. Nanomater. 2015, 2015, 1; [Google Scholar]; c) Smith D., Schuller V., Engst C., Radler J., Liedl T., Nanomedicine 2013, 8, 105; [DOI] [PubMed] [Google Scholar]; d) Okholm A. H., Kjems J., Adv. Drug Delivery Rev. 2016, 106, 183; [DOI] [PubMed] [Google Scholar]; e) Sun W., Gu Z., Biomater. Sci. 2015, 3, 1018; [DOI] [PubMed] [Google Scholar]; f) Linko V., Ora A., Kostiainen M. A., Trends Biotechnol. 2015, 33, 586; [DOI] [PubMed] [Google Scholar]; g) Ke Y., Castro C., Choi J. H., Annu. Rev. Biomed. Eng. 2018, 20, 375. [DOI] [PubMed] [Google Scholar]
- 38.a) Chang S., Kilic T., Lee C. K., Avci H., Bae H., Oskui S. M., Jung S. M., Shin S. R., Kim S. J., Nanomaterials 2018, 8, 226; [DOI] [PMC free article] [PubMed] [Google Scholar]; b) Green L. N., Amodio A., Subramanian H. K. K., Ricci F., Franco E., Nano Lett. 2017, 17, 7283; [DOI] [PubMed] [Google Scholar]; c) Chandrasekaran A. R., Rusling D. A., Nucleic Acids Res. 2018, 46, 1021. [DOI] [PMC free article] [PubMed] [Google Scholar]
- 39. Modi S., M G. S., Goswami D., Gupta G. D., Mayor S., Krishnan Y., Nat. Nanotechnol. 2009, 4, 325. [DOI] [PubMed] [Google Scholar]
- 40. Wang S., Lu S., Zhao J., Huang J., Yang X., ACS Appl. Mater. Interfaces 2017, 9, 41568. [DOI] [PubMed] [Google Scholar]
- 41.a) Ono A., Togashi H., Angew. Chem., Int. Ed. 2004, 43, 4300; [DOI] [PubMed] [Google Scholar]; b) Wang Y., Jiang L., Leng Q., Wu Y., He X., Wang K., Biosens. Bioelectron. 2016, 77, 914. [DOI] [PubMed] [Google Scholar]
- 42. Wang D., Hu Y., Liu P., Luo D., Acc. Chem. Res. 2017, 50, 733. [DOI] [PubMed] [Google Scholar]
- 43.a) Pei H., Liang L., Yao G., Li J., Huang Q., Fan C., Angew. Chem. 2012, 124, 9154; [DOI] [PubMed] [Google Scholar]; b) Hermann T., Patel D. J., Science 2000, 287, 820. [DOI] [PubMed] [Google Scholar]
- 44. Liu J., Lu Y., Nat. Protoc. 2006, 1, 246. [DOI] [PubMed] [Google Scholar]
- 45. Nicholas S., Minghui L., Shuoxing J., Omar L., Petr Š., Eddine F. N., Angew. Chem., Int. Ed. 2018, 57, 9341. [Google Scholar]
- 46. Mathur D., Henderson E. R., Sci. Rep. 2016, 6, 27413. [DOI] [PMC free article] [PubMed] [Google Scholar]
- 47. Rudchenko M., Taylor S., Pallavi P., Dechkovskaia A., Khan S., Butler V. P. Jr., Rudchenko S., Stojanovic M. N., Nat. Nanotechnol. 2013, 8, 580. [DOI] [PMC free article] [PubMed] [Google Scholar]
- 48.a) Bi S., Dong Y., Jia X., Chen M., Zhong H., Ji B., Nanoscale 2015, 7, 7361; [DOI] [PubMed] [Google Scholar]; b) Douglas S. M., Bachelet I., Church G. M., Science 2012, 335, 831; [DOI] [PubMed] [Google Scholar]; c) Li S., Jiang Q., Liu S., Zhang Y., Tian Y., Song C., Wang J., Zou Y., Anderson G. J., Han J. Y., Chang Y., Liu Y., Zhang C., Chen L., Zhou G., Nie G., Yan H., Ding B., Zhao Y., Nat. Biotechnol. 2018, 36, 258. [DOI] [PubMed] [Google Scholar]
- 49.a) Xue Q., Liu C., Li X., Dai L., Wang H., Bioconjugate Chem. 2018, 29, 1399; [DOI] [PubMed] [Google Scholar]; b) Dirks R. M., Pierce N. A., Proc. Natl. Acad. Sci. USA 2004, 101, 15275. [DOI] [PMC free article] [PubMed] [Google Scholar]
- 50. Stopar A., Coral L., Di Giacomo S., Adedeji A. F., Castronovo M., Nucleic Acids Res. 2018, 46, 995. [DOI] [PMC free article] [PubMed] [Google Scholar]
- 51.a) Yan J., Hu C., Wang P., Liu R., Zuo X., Liu X., Song S., Fan C., He D., Sun G., ACS Appl. Mater. Interfaces 2014, 6, 20372; [DOI] [PubMed] [Google Scholar]; b) Hamblin G. D., Carneiro K. M., Fakhoury J. F., Bujold K. E., Sleiman H. F., J. Am. Chem. Soc. 2012, 134, 2888; [DOI] [PubMed] [Google Scholar]; c) Ma Y., Wang Z., Ma Y., Han Z., Zhang M., Chen H., Gu Y., Angew. Chem., Int. Ed. 2018, 57, 5389. [DOI] [PubMed] [Google Scholar]
- 52. Li D., Mo F., Wu J., Huang Y., Zhou H., Ding S., Chen W., Sci. Rep. 2018, 8, 10196. [DOI] [PMC free article] [PubMed] [Google Scholar]
- 53.a) Veneziano R., Ratanalert S., Zhang K., Zhang F., Yan H., Chiu W., Bathe M., Science 2016, 352, 1534; [DOI] [PMC free article] [PubMed] [Google Scholar]; b) Han D., Jiang S., Samanta A., Liu Y., Yan H., Angew. Chem., Int. Ed. 2013, 52, 9031; [DOI] [PubMed] [Google Scholar]; c) Han D., Pal S., Nangreave J., Deng Z., Liu Y., Yan H., Science 2011, 332, 342; [DOI] [PubMed] [Google Scholar]; d) Han D. R., Pal S., Yang Y., Jiang S. X., Nangreave J., Liu Y., Yan H., Science 2013, 339, 1412; [DOI] [PubMed] [Google Scholar]; e) Hogberg B., Liedl T., Shih W. M., J. Am. Chem. Soc. 2009, 131, 9154; [DOI] [PMC free article] [PubMed] [Google Scholar]; f) Marchi A. N., Saaem I., Vogen B. N., Brown S., LaBean T. H., Nano Lett. 2014, 14, 5740; [DOI] [PubMed] [Google Scholar]; g) Yang Y., Han D. R., Nangreave J., Liu Y., Yan H., ACS Nano 2012, 6, 8209; [DOI] [PMC free article] [PubMed] [Google Scholar]; h) Zhang F., Liu Y., Yan H., J. Am. Chem. Soc. 2013, 135, 7458; [DOI] [PubMed] [Google Scholar]; i) Zhao Z., Liu Y., Yan H., Nano Lett. 2011, 11, 2997; [DOI] [PMC free article] [PubMed] [Google Scholar]; j) Zhao Z., Yan H., Liu Y., Angew. Chem., Int. Ed. 2010, 49, 1414. [DOI] [PubMed] [Google Scholar]
- 54.a) Zhang F., Nangreave J., Liu Y., Yan H., J. Am. Chem. Soc. 2014, 136, 11198; [DOI] [PMC free article] [PubMed] [Google Scholar]; b) Pinheiro A. V., Han D., Shih W. M., Yan H., Nat. Nanotechnol. 2011, 6, 763; [DOI] [PMC free article] [PubMed] [Google Scholar]; c) Feldkamp U., Niemeyer C. M., Angew. Chem., Int. Ed. 2006, 45, 1856; [DOI] [PubMed] [Google Scholar]; d) Wang P., Chatterjee G., Yan H., LaBean T. H., Turberfield A. J., Castro C. E., Seelig G., Ke Y., MRS Bull. 2017, 42, 889. [Google Scholar]
- 55. Douglas S. M., Marblestone A. H., Teerapittayanon S., Vazquez A., Church G. M., Shih W. M., Nucleic Acids Res. 2009, 37, 5001. [DOI] [PMC free article] [PubMed] [Google Scholar]
- 56.a) Castro C. E., Kilchherr F., Kim D. N., Shiao E. L., Wauer T., Wortmann P., Bathe M., Dietz H., Nat. Methods 2011, 8, 221; [DOI] [PubMed] [Google Scholar]; b) Kim D. N., Kilchherr F., Dietz H., Bathe M., Nucleic Acids Res. 2012, 40, 2862. [DOI] [PMC free article] [PubMed] [Google Scholar]
- 57. Yoo J., Sobh A. N., Li C.‐Y., Aksimentiev A., 2014.
- 58. Li J., Pei H., Zhu B., Liang L., Wei M., He Y., Chen N., Li D., Huang Q., Fan C., ACS Nano 2011, 5, 8783. [DOI] [PubMed] [Google Scholar]
- 59. Wang P., Rahman M. A., Zhao Z., Weiss K., Zhang C., Chen Z., Hurwitz S. J., Chen Z. G., Shin D. M., Ke Y., J. Am. Chem. Soc. 2018, 140, 2478. [DOI] [PMC free article] [PubMed] [Google Scholar]
- 60. Conway J. W., McLaughlin C. K., Castor K. J., Sleiman H., Chem. Commun. 2013, 49, 1172. [DOI] [PubMed] [Google Scholar]
- 61. Fakhoury J. J., McLaughlin C. K., Edwardson T. W., Conway J. W., Sleiman H. F., Biomacromolecules 2014, 15, 276. [DOI] [PubMed] [Google Scholar]
- 62. Keum J. W., Bermudez H., Chem. Commun. 2009, 7, 7036. [DOI] [PubMed] [Google Scholar]
- 63. Ahmadi Y., DeLiano E., Barisic I., Nanoscale 2018, 10, 7494. [DOI] [PubMed] [Google Scholar]
- 64. Hahn J., Wickham S. F., Shih W. M., Perrault S. D., ACS Nano 2014, 8, 8765. [DOI] [PMC free article] [PubMed] [Google Scholar]
- 65. Mei Q., Wei X., Su F., Liu Y., Youngbull C., Johnson R., Lindsay S., Yan H., Meldrum D., Nano Lett. 2011, 11, 1477. [DOI] [PMC free article] [PubMed] [Google Scholar]
- 66. Goltry S., Hallstrom N., Clark T., Kuang W., Lee J., Jorcyk C., Knowlton W. B., Yurke B., Hughes W. L., Graugnard E., Nanoscale 2015, 7, 10382. [DOI] [PMC free article] [PubMed] [Google Scholar]
- 67. Fu M., Dai L., Jiang Q., Tang Y., Zhang X., Ding B., Li J., Chem. Commun. 2016, 52, 9240. [DOI] [PubMed] [Google Scholar]
- 68.a) Surana S., Shenoy A. R., Krishnan Y., Nat. Nanotechnol. 2015, 10, 741; [DOI] [PMC free article] [PubMed] [Google Scholar]; b) Juliano R. L., Nucleic Acids Res. 2016, 44, 6518. [DOI] [PMC free article] [PubMed] [Google Scholar]
- 69. Wang Y., Ye M., Xie R., Gong S., Bioconjugate Chem. 2018, 10.1021/acs.bioconjchem.8b00749. [DOI] [PMC free article] [PubMed] [Google Scholar]
- 70. Walsh A. S., Yin H., Erben C. M., Wood M. J., Turberfield A. J., ACS Nano 2011, 5, 5427. [DOI] [PubMed] [Google Scholar]
- 71.a) Mathur D., Samanta A., Oh E., Díaz S. A., Susumu K., Ancona M. G., Medintz I. L., Chem. Mater. 2017, 29, 5762; [Google Scholar]; b) Erben C. M., Goodman R. P., Turberfield A. J., Angew. Chem., Int. Ed. 2006, 45, 7414. [DOI] [PubMed] [Google Scholar]
- 72. Fraley A. W., Pons B., Dalkara D., Nullans G., Behr J. P., Zuber G., J. Am. Chem. Soc. 2006, 128, 10763. [DOI] [PubMed] [Google Scholar]
- 73.a) Zhao Y. X., Shaw A., Zeng X., Benson E., Nystrom A. M., Hogberg B., ACS Nano 2012, 6, 8684; [DOI] [PubMed] [Google Scholar]; b) Liang L., Li J., Li Q., Huang Q., Shi J., Yan H., Fan C., Angew. Chem., Int. Ed. 2014, 53, 7745. [DOI] [PubMed] [Google Scholar]
- 74.a) Schuller V. J., Heidegger S., Sandholzer N., Nickels P. C., Suhartha N. A., Endres S., Bourquin C., Liedl T., ACS Nano 2011, 5, 9696; [DOI] [PubMed] [Google Scholar]; b) Xia K., Kong H., Cui Y., Ren N., Li Q., Ma J., Cui R., Zhang Y., Shi J., Li Q., Lv M., Sun Y., Wang L., Li J., Zhu Y., ACS Appl. Mater. Interfaces 2018, 10, 15442; [DOI] [PubMed] [Google Scholar]; c) Bastings M. M. C., Anastassacos F. M., Ponnuswamy N., Leifer F. G., Cuneo G., Lin C., Ingber D. E., Ryu J. H., Shih W. M., Nano Lett. 2018, 18, 3557; [DOI] [PubMed] [Google Scholar]; d) Raniolo S., Vindigni G., Unida V., Ottaviani A., Romano E., Desideri A., Biocca S., Nanoscale 2018, 10, 12078. [DOI] [PubMed] [Google Scholar]
- 75.a) Bhatia D., Surana S., Chakraborty S., Koushika S. P., Krishnan Y., Nat. Commun. 2011, 2, 339; [DOI] [PubMed] [Google Scholar]; b) Surana S., Bhat J. M., Koushika S. P., Krishnan Y., Nat. Commun. 2011, 2, 340; [DOI] [PubMed] [Google Scholar]; c) Surana S., Bhatia D., Krishnan Y., Methods 2013, 64, 94. [DOI] [PMC free article] [PubMed] [Google Scholar]
- 76. Li Q., Zhao D., Shao X., Lin S., Xie X., Liu M., Ma W., Shi S., Lin Y., ACS Appl. Mater. Interfaces 2017, 9, 36695. [DOI] [PubMed] [Google Scholar]
- 77. Lee H., Lytton‐Jean A. K., Chen Y., Love K. T., Park A. I., Karagiannis E. D., Sehgal A., Querbes W., Zurenko C. S., Jayaraman M., Peng C. G., Charisse K., Borodovsky A., Manoharan M., Donahoe J. S., Truelove J., Nahrendorf M., Langer R., Anderson D. G., Nat. Nanotechnol. 2012, 7, 389. [DOI] [PMC free article] [PubMed] [Google Scholar]
- 78. Jiang D., Sun Y., Li J., Li Q., Lv M., Zhu B., Tian T., Cheng D., Xia J., Zhang L., Wang L., Huang Q., Shi J., Fan C., ACS Appl. Mater. Interfaces 2016, 8, 4378. [DOI] [PubMed] [Google Scholar]
- 79. Perrault S. D., Shih W. M., ACS Nano 2014, 8, 5132. [DOI] [PMC free article] [PubMed] [Google Scholar]
- 80. Amir Y., Ben‐Ishay E., Levner D., Ittah S., Abu‐Horowitz A., Bachelet I., Nat. Nanotechnol. 2014, 9, 353. [DOI] [PMC free article] [PubMed] [Google Scholar]
- 81. Zhang Q., Jiang Q., Li N., Dai L., Liu Q., Song L., Wang J., Li Y., Tian J., Ding B., Du Y., ACS Nano 2014, 8, 6633. [DOI] [PubMed] [Google Scholar]
- 82. Ding H., Li J., Chen N., Hu X., Yang X., Guo L., Li Q., Zuo X., Wang L., Ma Y., Fan C., ACS Cent. Sci. 2018, 4, 1344. [DOI] [PMC free article] [PubMed] [Google Scholar]
- 83. Ross J. F., Chaudhuri P. K., Ratnam M., Cancer 1994, 73, 2432. [DOI] [PubMed] [Google Scholar]
- 84.a) Mikkila J., Eskelinen A. P., Niemela E. H., Linko V., Frilander M. J., Torma P., Kostiainen M. A., Nano Lett. 2014, 14, 2196; [DOI] [PubMed] [Google Scholar]; b) Agarwal N. P., Matthies M., Gur F. N., Osada K., Schmidt T. L., Angew. Chem., Int. Ed. 2017, 56, 5460; [DOI] [PubMed] [Google Scholar]; c) Ponnuswamy N., Bastings M. M. C., Nathwani B., Ryu J. H., Chou L. Y. T., Vinther M., Li W. A., Anastassacos F. M., Mooney D. J., Shih W. M., Nat. Commun. 2017, 8, 15654; [DOI] [PMC free article] [PubMed] [Google Scholar]; d) Kiviaho J. K., Linko V., Ora A., Tiainen T., Jarvihaavisto E., Mikkila J., Tenhu H., Nonappa, M. A. Kostiainen , Nanoscale 2016, 8, 11674; [DOI] [PubMed] [Google Scholar]; e) Auvinen H., Zhang H., Nonappa, A. Kopilow , Niemela E. H., Nummelin S., Correia A., Santos H. A., Linko V., Kostiainen M. A., Adv. Healthcare Mater. 2017, 6, 1700692. [DOI] [PubMed] [Google Scholar]
- 85. Liu X., Xu Y., Yu T., Clifford C., Liu Y., Yan H., Chang Y., Nano Lett. 2012, 12, 4254. [DOI] [PMC free article] [PubMed] [Google Scholar]
- 86. Arnon S., Dahan N., Koren A., Radiano O., Ronen M., Yannay T., Giron J., Ben‐Ami L., Amir Y., Hel‐Or Y., Friedman D., Bachelet I., PLoS One 2016, 11, e0161227. [DOI] [PMC free article] [PubMed] [Google Scholar]
- 87.a) Jiang Q., Shi Y., Zhang Q., Li N., Zhan P., Song L., Dai L., Tian J., Du Y., Cheng Z., Ding B., Small 2015, 11, 5134; [DOI] [PubMed] [Google Scholar]; b) Huang Y., Huang W., Chan L., Zhou B., Chen T., Biomaterials 2016, 103, 183; [DOI] [PubMed] [Google Scholar]; c) Li J., Jiang D., Bao B., He Y., Liu L., Wang X., Bioconjugate Chem. 2016, 27, 905. [DOI] [PubMed] [Google Scholar]
- 88. Daems D., Pfeifer W., Rutten I., Sacca B., Spasic D., Lammertyn J., ACS Appl. Mater. Interfaces 2018, 10, 23539. [DOI] [PubMed] [Google Scholar]
- 89.a) Noor M. O., Krull U. J., Anal. Chim. Acta 2014, 825, 1; [DOI] [PubMed] [Google Scholar]; b) Drummond T. G., Hill M. G., Barton J. K., Nat. Biotechnol. 2003, 21, 1192; [DOI] [PubMed] [Google Scholar]; c) Soleymani L., Li F., ACS Sens. 2017, 2, 458. [DOI] [PubMed] [Google Scholar]
- 90. Walper S. A., Lasarte Aragones G., Sapsford K. E., Brown 3rd C. W., Rowland C. E., Breger J. C., Medintz I. L., ACS Sens. 2018, 3, 1894. [DOI] [PubMed] [Google Scholar]
- 91. Sin M. L., Mach K. E., Wong P. K., Liao J. C., Expert Rev. Mol. Diagn. 2014, 14, 225. [DOI] [PMC free article] [PubMed] [Google Scholar]
- 92. Guo X., J. Biophotonics 2012, 5, 483. [DOI] [PubMed] [Google Scholar]
- 93.a) Ardekani A. M., Naeini M. M., Avicenna J. Med. Biotechnol. 2010, 2, 161; [PMC free article] [PubMed] [Google Scholar]; b) Kosaka N., Iguchi H., Ochiya T., Cancer Sci. 2010, 101, 2087; [DOI] [PMC free article] [PubMed] [Google Scholar]; c) Calin G. A., Croce C. M., Nat. Rev. Cancer 2006, 6, 857. [DOI] [PubMed] [Google Scholar]
- 94.a) Chen X., Ba Y., Ma L., Cai X., Yin Y., Wang K., Guo J., Zhang Y., Chen J., Guo X., Li Q., Li X., Wang W., Zhang Y., Wang J., Jiang X., Xiang Y., Xu C., Zheng P., Zhang J., Li R., Zhang H., Shang X., Gong T., Ning G., Wang J., Zen K., Zhang J., Zhang C. Y., Cell Res. 2008, 18, 997; [DOI] [PubMed] [Google Scholar]; b) Mitchell P. S., Parkin R. K., Kroh E. M., Fritz B. R., Wyman S. K., Pogosova‐Agadjanyan E. L., Peterson A., Noteboom J., O'Briant K. C., Allen A., Lin D. W., Urban N., Drescher C. W., Knudsen B. S., Stirewalt D. L., Gentleman R., Vessella R. L., Nelson P. S., Martin D. B., Tewari M., Proc. Natl. Acad. Sci. USA 2008, 105, 10513. [DOI] [PMC free article] [PubMed] [Google Scholar]
- 95.a) Moldovan L., Batte K. E., Trgovcich J., Wisler J., Marsh C. B., Piper M., J. Cell. Mol. Med. 2014, 18, 371; [DOI] [PMC free article] [PubMed] [Google Scholar]; b) Tian T., Wang J., Zhou X., Org. Biomol. Chem. 2015, 13, 2226. [DOI] [PubMed] [Google Scholar]
- 96. Leca‐Bouvier B., Blum L. J., Anal. Lett. 2005, 38, 1491. [Google Scholar]
- 97. Zheng J., Yang R., Shi M., Wu C., Fang X., Li Y., Li J., Tan W., Chem. Soc. Rev. 2015, 44, 3036. [DOI] [PMC free article] [PubMed] [Google Scholar]
- 98. Subramanian H. K., Chakraborty B., Sha R., Seeman N. C., Nano Lett. 2011, 11, 910. [DOI] [PMC free article] [PubMed] [Google Scholar]
- 99. Walter H. K., Bauer J., Steinmeyer J., Kuzuya A., Niemeyer C. M., Wagenknecht H. A., Nano Lett. 2017, 17, 2467. [DOI] [PubMed] [Google Scholar]
- 100. Sun D., Lu J., Chen D., Jiang Y., Wang Z., Qin W., Yu Y., Chen Z., Zhang Y., Sens. Actuators, B 2018, 268, 359. [Google Scholar]
- 101. Domljanovic I., Carstens A., Okholm A., Kjems J., Nielsen C. T., Heegaard N. H. H., Astakhova K., Sci. Rep. 2017, 7, 1925. [DOI] [PMC free article] [PubMed] [Google Scholar]
- 102.a) Ding S., Gu Z., Yan R., Tang Y., Miao P., Anal. Chim. Acta 2018, 1029, 24; [DOI] [PubMed] [Google Scholar]; b) Miao P., Jiang Y., Wang Y., Yin J., Tang Y., Sens. Actuators, B 2018, 257, 1021. [Google Scholar]
- 103. Zhu D., Zhao D., Huang J., Zhu Y., Chao J., Su S., Li J., Wang L., Shi J., Zuo X., Weng L., Li Q., Wang L., Nanomedicine 2018, 14, 1797. [DOI] [PubMed] [Google Scholar]
- 104. Wang D., Fu Y., Yan J., Zhao B., Dai B., Chao J., Liu H., He D., Zhang Y., Fan C., Song S., Anal. Chem. 2014, 86, 1932. [DOI] [PubMed] [Google Scholar]
- 105. Liu S., Su W., Li Z., Ding X., Biosens. Bioelectron. 2015, 71, 57. [DOI] [PubMed] [Google Scholar]
- 106. Zhang P., Jiang J., Yuan R., Zhuo Y., Chai Y., J. Am. Chem. Soc. 2018, 140, 9361. [DOI] [PubMed] [Google Scholar]
- 107. Yang X., Wen Y., Wang L., Zhou C., Li Q., Xu L., Li L., Shi J., Lal R., Ren S., Li J., Jia N., Liu G., ACS Appl. Mater. Interfaces 2017, 9, 38281. [DOI] [PubMed] [Google Scholar]
- 108. Godonoga M., Lin T. Y., Oshima A., Sumitomo K., Tang M. S., Cheung Y. W., Kinghorn A. B., Dirkzwager R. M., Zhou C., Kuzuya A., Tanner J. A., Heddle J. G., Sci. Rep. 2016, 6, 21266. [DOI] [PMC free article] [PubMed] [Google Scholar]
- 109. Mei Q., Johnson R. H., Wei X. X., Su F. Y., Liu Y., Kelbauskas L., Lindsay S., Meldrum D. R., Yan H., Nano Res. 2013, 6, 712. [Google Scholar]
- 110. Chen X., Guo Z., Tang Y., Shen Y., Miao P., Anal. Chim. Acta 2018, 999, 54. [DOI] [PubMed] [Google Scholar]
- 111. Ochmann S. E., Vietz C., Trofymchuk K., Acuna G. P., Lalkens B., Tinnefeld P., Anal. Chem. 2017, 89, 13000. [DOI] [PubMed] [Google Scholar]
- 112. Visser T., Daily J., Hotte N., Dolkart C., Cunningham J., Yadav P., Bull. W. H. O. 2015, 93, 862. [DOI] [PMC free article] [PubMed] [Google Scholar]
- 113. Pisetsky D. S., Nat. Rev. Rheumatol. 2016, 12, 102. [DOI] [PubMed] [Google Scholar]
- 114. An Y., Raju R. K., Lu T., Wheeler S. E., J. Phys. Chem. B 2014, 118, 5653. [DOI] [PubMed] [Google Scholar]
- 115. Danforth C. M., Orfeo T., Everse S. J., Mann K. G., Brummel‐Ziedins K. E., PLoS One 2012, 7, e30385. [DOI] [PMC free article] [PubMed] [Google Scholar]
- 116.a) Torelli E., Marini M., Palmano S., Piantanida L., Polano C., Scarpellini A., Lazzarino M., Firrao G., Small 2014, 10, 2918; [DOI] [PubMed] [Google Scholar]; b) Andersen E. S., Dong M., Nielsen M. M., Jahn K., Subramani R., Mamdouh W., Golas M. M., Sander B., Stark H., Oliveira C. L. P., Pedersen J. S., Birkedal V., Besenbacher F., Gothelf K. V., Kjems J., Nature 2009, 459, 73; [DOI] [PubMed] [Google Scholar]; c) Kuzuya A., Ohya Y., Acc. Chem. Res. 2014, 47, 1742; [DOI] [PubMed] [Google Scholar]; d) Mao C. D., Sun W. Q., Shen Z. Y., Seeman N. C., Nature 1999, 397, 144; [DOI] [PubMed] [Google Scholar]; e) Marras A. E., Zhou L. F., Su H. J., Castro C. E., Proc. Natl. Acad. Sci. USA 2015, 112, 713; [DOI] [PMC free article] [PubMed] [Google Scholar]; f) Nickels P. C., Hoiberg H. C., Simmel S. S., Holzmeister P., Tinnefeld P., Liedl T., ChemBioChem 2016, 17, 1093; [DOI] [PMC free article] [PubMed] [Google Scholar]; g) Ke Y. G., Meyer T., Shih W. M., Bellot G., Nat. Commun. 2016, 7, 10935. [DOI] [PMC free article] [PubMed] [Google Scholar]
- 117. Wei F., Patel P., Liao W., Chaudhry K., Zhang L., Arellano‐Garcia M., Hu S., Elashoff D., Zhou H., Shukla S., Shah F., Ho C. M., Wong D. T., Clin. Cancer Res. 2009, 15, 4446. [DOI] [PMC free article] [PubMed] [Google Scholar]
- 118. Sassolas A., Blum L. J., Leca‐Bouvier B. D., Electroanalysis 2009, 21, 1237. [Google Scholar]
- 119.a) Kuzuya A., Sakai Y., Yamazaki T., Xu Y., Komiyama M., Nat. Commun. 2011, 2, 449; [DOI] [PMC free article] [PubMed] [Google Scholar]; b) Yamazaki T., Aiba Y., Yasuda K., Sakai Y., Yamanaka Y., Kuzuya A., Ohya Y., Komiyama M., Chem. Commun. 2012, 48, 11361. [DOI] [PubMed] [Google Scholar]
- 120. Sharonov A., Hochstrasser R. M., Proc. Natl. Acad. Sci. USA 2006, 103, 18911. [DOI] [PMC free article] [PubMed] [Google Scholar]
- 121. Jungmann R., Avendano M. S., Woehrstein J. B., Dai M., Shih W. M., Yin P., Nat. Methods 2014, 11, 313. [DOI] [PMC free article] [PubMed] [Google Scholar]
- 122.a) Lin C., Jungmann R., Leifer A. M., Li C., Levner D., Church G. M., Shih W. M., Yin P., Nat. Chem. 2012, 4, 832; [DOI] [PMC free article] [PubMed] [Google Scholar]; b) Derr N. D., Goodman B. S., Jungmann R., Leschziner A. E., Shih W. M., Reck‐Peterson S. L., Science 2012, 338, 662; [DOI] [PMC free article] [PubMed] [Google Scholar]; c) Jungmann R., Steinhauer C., Scheible M., Kuzyk A., Tinnefeld P., Simmel F. C., Nano Lett. 2010, 10, 4756. [DOI] [PubMed] [Google Scholar]
- 123. Schueder F., Strauss M. T., Hoerl D., Schnitzbauer J., Schlichthaerle T., Strauss S., Yin P., Harz H., Leonhardt H., Jungmann R., Angew. Chem., Int. Ed. 2017, 56, 4052. [DOI] [PMC free article] [PubMed] [Google Scholar]
- 124. Schueder F., Lara‐Gutierrez J., Beliveau B. J., Saka S. K., Sasaki H. M., Woehrstein J. B., Strauss M. T., Grabmayr H., Yin P., Jungmann R., Nat. Commun. 2017, 8, 2090. [DOI] [PMC free article] [PubMed] [Google Scholar]
- 125. Deussner‐Helfmann N. S., Auer A., Strauss M. T., Malkusch S., Dietz M. S., Barth H. D., Jungmann R., Heilemann M., Nano Lett. 2018, 18, 4626. [DOI] [PubMed] [Google Scholar]
- 126. Jungmann R., Avendano M. S., Dai M., Woehrstein J. B., Agasti S. S., Feiger Z., Rodal A., Yin P., Nat. Methods 2016, 13, 439. [DOI] [PMC free article] [PubMed] [Google Scholar]
- 127.a) Susumu K., Field L. D., Oh E., Hunt M., Delehanty J. B., Palomo V., Dawson P. E., Huston A. L., Medintz I. L., Chem. Mater. 2017, 29, 7330; [Google Scholar]; b) Medintz I. L., Uyeda H. T., Goldman E. R., Mattoussi H., Nat. Mater. 2005, 4, 435. [DOI] [PubMed] [Google Scholar]
- 128.a) Hildebrandt N., Spillmann C. M., Algar W. R., Pons T., Stewart M. H., Oh E., Susumu K., Diaz S. A., Delehanty J. B., Medintz I. L., Chem. Rev. 2017, 117, 536; [DOI] [PubMed] [Google Scholar]; b) Petryayeva E., Algar W. R., Medintz I. L., Appl. Spectrosc. 2013, 67, 215. [DOI] [PubMed] [Google Scholar]
- 129. Zrazhevskiy P., Akilesh S., Tai W., Queitsch K., True L. D., Fromm J., Wu D., Nelson P., Stamatoyannopoulos J. A., Gao X., Angew. Chem., Int. Ed. 2016, 55, 8975. [DOI] [PMC free article] [PubMed] [Google Scholar]
- 130.a) Diaz S. A., Gillanders F., Susumu K., Oh E., Medintz I. L., Jovin T. M., Chem. ‐ Eur. J. 2017, 23, 263; [DOI] [PubMed] [Google Scholar]; b) Diaz S. A., Gillanders F., Jares‐Erijman E. A., Jovin T. M., Nat. Commun. 2015, 6, 6036; [DOI] [PubMed] [Google Scholar]; c) Yang X., Zhanghao K., Wang H., Liu Y., Wang F., Zhang X., Shi K., Gao J., Jin D., Xi P., ACS Photonics 2016, 3, 1611. [Google Scholar]
- 131. Ren K., Xu Y., Liu Y., Yang M., Ju H., ACS Nano 2018, 12, 263. [DOI] [PubMed] [Google Scholar]
- 132. Cheung A., Bax H. J., Josephs D. H., Ilieva K. M., Pellizzari G., Opzoomer J., Bloomfield J., Fittall M., Grigoriadis A., Figini M., Canevari S., Spicer J. F., Tutt A. N., Karagiannis S. N., Oncotarget 2016, 7, 52553. [DOI] [PMC free article] [PubMed] [Google Scholar]
- 133. Contag P. R., Drug Discovery Today 2002, 7, 555. [DOI] [PubMed] [Google Scholar]
- 134. Zhang X., Bloch S., Akers W., Achilefu S., Curr. Protoc. Cytom. 2012, 60, 12.27.1. [DOI] [PMC free article] [PubMed] [Google Scholar]
- 135. Kim K. R., Lee Y. D., Lee T., Kim B. S., Kim S., Ahn D. R., Biomaterials 2013, 34, 5226. [DOI] [PubMed] [Google Scholar]
- 136. Chen F., Tillberg P. W., Boyden E. S., Science 2015, 347, 543. [DOI] [PMC free article] [PubMed] [Google Scholar]
- 137. Bai X. C., Martin T. G., Scheres S. H., Dietz H., Proc. Natl. Acad. Sci. USA 2012, 109, 20012. [DOI] [PMC free article] [PubMed] [Google Scholar]
- 138.a) Fischer S., Hartl C., Frank K., Radler J. O., Liedl T., Nickel B., Nano Lett. 2016, 16, 4282; [DOI] [PMC free article] [PubMed] [Google Scholar]; b) Bruetzel L. K., Gerling T., Sedlak S. M., Walker P. U., Zheng W., Dietz H., Lipfert J., Nano Lett. 2016, 16, 4871. [DOI] [PubMed] [Google Scholar]
- 139. Seeman N. C., J. Theor. Biol. 1982, 99, 237. [DOI] [PubMed] [Google Scholar]
- 140. Green C. M., Schutt K., Morris N., Zadegan R. M., Hughes W. L., Kuang W., Graugnard E., Nanoscale 2017, 9, 10205. [DOI] [PubMed] [Google Scholar]
- 141. Blanco E., Shen H., Ferrari M., Nat. Biotechnol. 2015, 33, 941. [DOI] [PMC free article] [PubMed] [Google Scholar]
- 142. Vidimar V., Meng X., Klajner M., Licona C., Fetzer L., Harlepp S., Hebraud P., Sidhoum M., Sirlin C., Loeffler J. P., Mellitzer G., Sava G., Pfeffer M., Gaiddon C., Biochem. Pharmacol. 2012, 84, 1428. [DOI] [PubMed] [Google Scholar]
- 143. Wang A. Z., Langer R., Farokhzad O. C., Annu. Rev. Med. 2012, 63, 185. [DOI] [PubMed] [Google Scholar]
- 144.a) Zhang H., Ma Y., Xie Y., An Y., Huang Y., Zhu Z., Yang C. J., Sci. Rep. 2015, 5, 10099; [DOI] [PMC free article] [PubMed] [Google Scholar]; b) Halley P. D., Lucas C. R., McWilliams E. M., Webber M. J., Patton R. A., Kural C., Lucas D. M., Byrd J. C., Castro C. E., Small 2016, 12, 308; [DOI] [PMC free article] [PubMed] [Google Scholar]; c) Zang Y., Wei Y., Shi Y., Chen Q., Xing D., Small 2016, 12, 756; [DOI] [PubMed] [Google Scholar]; d) Jiang Q., Song C., Nangreave J., Liu X., Lin L., Qiu D., Wang Z. G., Zou G., Liang X., Yan H., Ding B., J. Am. Chem. Soc. 2012, 134, 13396; [DOI] [PubMed] [Google Scholar]; e) Chang M., Yang C. S., Huang D. M., ACS Nano 2011, 5, 6156; [DOI] [PubMed] [Google Scholar]; f) Kim K. R., Kim D. R., Lee T., Yhee J. Y., Kim B. S., Kwon I. C., Ahn D. R., Chem. Commun. 2013, 49, 2010; [DOI] [PubMed] [Google Scholar]; g) Liu X., Wu L., Wang L., Jiang W., Talanta 2018, 179, 356; [DOI] [PubMed] [Google Scholar]; h) Tian Y., Huang Y., Gao P., Chen T., Chem. Commun. 2018, 54, 9394; [DOI] [PubMed] [Google Scholar]; i) Xie X., Shao X., Ma W., Zhao D., Shi S., Li Q., Lin Y., Nanoscale 2018, 10, 5457; [DOI] [PubMed] [Google Scholar]; j) Kang J. H., Kim K. R., Lee H., Ahn D. R., Ko Y. T., Colloids Surf., B 2017, 157, 424; [DOI] [PubMed] [Google Scholar]; k) Kim K.‐R., Lee T., Kim B.‐S., Ahn D.‐R., Chem. Sci. 2014, 5, 1533. [Google Scholar]
- 145. Kim K.‐R., Hwang D., Kim J., Lee C.‐Y., Lee W., Yoon D. S., Shin D., Min S.‐J., Kwon I. C., Chung H. S., Ahn D.‐R., J. Controlled Release 2018, 280, 1. [DOI] [PubMed] [Google Scholar]
- 146.a) Jorge A. F., Avino A., Pais A., Eritja R., Fabrega C., Nanoscale 2018, 10, 7238; [DOI] [PubMed] [Google Scholar]; b) Wang D., Liu Q., Wu D., He B., Li J., Mao C., Wang G., Qian H., ACS Appl. Mater. Interfaces 2018, 10, 15504; [DOI] [PubMed] [Google Scholar]; c) Liu J., Song L., Liu S., Jiang Q., Liu Q., Li N., Wang Z. G., Ding B., Nano Lett. 2018, 18, 3328; [DOI] [PubMed] [Google Scholar]; d) Du J., Xu Z., Liu Q., Yang Y., Qian H., Hu M., Fan Y., Li Q., Yao W., Li H., Qian G., He B., Zhou D., Mao C., Wang G., ACS Appl. Mater. Interfaces 2017, 9, 42544; [DOI] [PubMed] [Google Scholar]; e) Nahar S., Nayak A. K., Ghosh A., Subudhi U., Maiti S., Nanoscale 2018, 10, 195; [DOI] [PubMed] [Google Scholar]; f) You Z., Qian H., Wang C., He B., Yan J., Mao C., Wang G., Biomaterials 2015, 67, 137. [DOI] [PubMed] [Google Scholar]
- 147. Du Y., Jiang Q., Beziere N., Song L., Zhang Q., Peng D., Chi C., Yang X., Guo H., Diot G., Ntziachristos V., Ding B., Tian J., Adv. Mater. 2016, 28, 10000. [DOI] [PubMed] [Google Scholar]
- 148. Roldao A., Mellado M. C., Castilho L. R., Carrondo M. J., Alves P. M., Expert Rev. Vaccines 2010, 9, 1149. [DOI] [PubMed] [Google Scholar]
- 149. Kwiatkowski S., Knap B., Przystupski D., Saczko J., Kedzierska E., Knap‐Czop K., Kotlinska J., Michel O., Kotowski K., Kulbacka J., Biomed. Pharmacother. 2018, 106, 1098. [DOI] [PubMed] [Google Scholar]
- 150.a) Zhang Y., Wang G., Yang L., Wang F., Liu A., Coord. Chem. Rev. 2018, 370, 1; [Google Scholar]; b) Huang X., El‐Sayed M. A., J. Adv. Res. 2010, 1, 13. [Google Scholar]
- 151. Ildiz N., Baldemir A., Altinkaynak C., Ozdemir N., Yilmaz V., Ocsoy I., Enzyme Microb. Technol. 2017, 102, 60. [DOI] [PubMed] [Google Scholar]
- 152. Jackson T. L., J. Theor. Biol. 2003, 220, 201. [DOI] [PubMed] [Google Scholar]
- 153. Ko S., Liu H., Chen Y., Mao C., Biomacromolecules 2008, 9, 3039. [DOI] [PMC free article] [PubMed] [Google Scholar]
- 154. You M., Peng L., Shao N., Zhang L., Qiu L., Cui C., Tan W., J. Am. Chem. Soc. 2014, 136, 1256. [DOI] [PMC free article] [PubMed] [Google Scholar]
- 155. Teesalu T., Sugahara K. N., Ruoslahti E., Front. Oncol. 2013, 3, 216. [DOI] [PMC free article] [PubMed] [Google Scholar]
- 156. Janku F., McConkey D. J., Hong D. S., Kurzrock R., Nat. Rev. Clin. Oncol. 2011, 8, 528. [DOI] [PubMed] [Google Scholar]
- 157. Zhou W., Ding J., Liu J., Theranostics 2017, 7, 1010. [DOI] [PMC free article] [PubMed] [Google Scholar]
- 158. Klinman D. M., Nat. Rev. Immunol. 2004, 4, 249. [DOI] [PubMed] [Google Scholar]
- 159. Giljohann D. A., Seferos D. S., Patel P. C., Millstone J. E., Rosi N. L., Mirkin C. A., Nano Lett. 2007, 7, 3818. [DOI] [PMC free article] [PubMed] [Google Scholar]
- 160. Wang J., Zhu G., You M., Song E., Shukoor M. I., Zhang K., Altman M. B., Chen Y., Zhu Z., Huang C. Z., Tan W., ACS Nano 2012, 6, 5070. [DOI] [PMC free article] [PubMed] [Google Scholar]
- 161. Hu R., Zhang X., Zhao Z., Zhu G., Chen T., Fu T., Tan W., Angew. Chem., Int. Ed. 2014, 53, 5821. [DOI] [PubMed] [Google Scholar]
- 162. Baig M. M. F. A., Khan S., Naeem M. A., Khan G. J., Ansari M. T., Biomed. Pharmacother. 2018, 97, 1250. [DOI] [PubMed] [Google Scholar]
- 163. Nel A. E., Mädler L., Velegol D., Xia T., Hoek E. M. V., Somasundaran P., Klaessig F., Castranova V., Thompson M., Nat. Mater. 2009, 8, 543. [DOI] [PubMed] [Google Scholar]
- 164. Burns J. R., Al‐Juffali N., Janes S. M., Howorka S., Angew. Chem., Int. Ed. 2014, 53, 9931. [DOI] [PMC free article] [PubMed] [Google Scholar]
- 165. Li S., Tian T., Zhang T., Cai X., Lin Y., Mater. Today 2018. [Google Scholar]
- 166. Medina‐Sanchez M., Xu H., Schmidt O. G., Ther. Delivery 2018, 9, 303. [DOI] [PubMed] [Google Scholar]
- 167. Varkouhi A. K., Scholte M., Storm G., Haisma H. J., J. Controlled Release 2011, 151, 220. [DOI] [PubMed] [Google Scholar]
- 168. Cherry K. M., Qian L., Nature 2018, 559, 370. [DOI] [PubMed] [Google Scholar]
- 169. Kick B., Praetorius F., Dietz H., Weuster‐Botz D., Nano Lett. 2015, 15, 4672. [DOI] [PMC free article] [PubMed] [Google Scholar]
- 170. Praetorius F., Kick B., Behler K. L., Honemann M. N., Weuster‐Botz D., Dietz H., Nature 2017, 552, 84. [DOI] [PubMed] [Google Scholar]
- 171. Han D., Qi X., Myhrvold C., Wang B., Dai M., Jiang S., Bates M., Liu Y., An B., Zhang F., Yan H., Yin P., Science 2017, 358, 206. [DOI] [PMC free article] [PubMed] [Google Scholar]
- 172.a) Li M., Zheng M., Wu S., Tian C., Liu D., Weizmann Y., Jiang W., Wang G., Mao C., Nat. Commun. 2018, 9, 2196; [DOI] [PMC free article] [PubMed] [Google Scholar]; b) Geary C., Rothemund P. W., Andersen E. S., Science 2014, 345, 799. [DOI] [PubMed] [Google Scholar]
- 173. Algar W. R., Susumu K., Delehanty J. B., Medintz I. L., Anal. Chem. 2011, 83, 8826. [DOI] [PubMed] [Google Scholar]