

Abstract
Background and Purpose
Individualized assessment of cytochrome P450 2D6 (CYP2D6) activity is usually performed through phenotyping following administration of a probe drug to measure the enzyme's activity. To avoid any iatrogenic harm (allergic drug reaction, dosing error) related to the probe drug, the development of non‐burdensome tools for real‐time phenotyping of CYP2D6 could significantly contribute to precision medicine. This study focuses on the identification of markers of the CYP2D6 enzyme in human biofluids using an LC‐high‐resolution mass spectrometry‐based metabolomic approach.
Experimental Approach
Plasma and urine samples from healthy volunteers were analysed before and after intake of a daily dose of paroxetine 20 mg over 7 days. CYP2D6 genotyping and phenotyping, using single oral dose of dextromethorphan 5 mg, were also performed in all participants.
Key Results
We report four metabolites of solanidine and two unknown compounds as possible novel CYP2D6 markers. Mean relative intensities of these features were significantly reduced during the inhibition session compared with the control session (n = 37). Semi‐quantitative analysis showed that the largest decrease (−85%) was observed for the ion m/z 432.3108 normalized to solanidine (m/z 398.3417). Mean relative intensities of these ions were significantly higher in the CYP2D6 normal–ultrarapid metabolizer group (n = 37) compared with the poor metabolizer group (n = 6). Solanidine intensity was more than 15 times higher in CYP2D6‐deficient individuals compared with other volunteers.
Conclusion and Implications
The applied untargeted metabolomic strategy identified potential novel markers capable of semi‐quantitatively predicting CYP2D6 activity, a promising discovery for personalized medicine.
Keywords: biomarker, CYP2D6, CYP450, metabolomics, phenotyping
Abbreviations
- AS
activity score
- CYP2D6
cytochrome P450 2D6
- PRM
parallel reaction monitoring
- UMR
urinary metabolic ratio
What is already known
CYP2D6 shows significant interindividual variability in activity due to genetic polymorphisms and environmental causes.
Current methods for CYP2D6 phenotyping require administration of xenobiotics, with all the associated risks.
What this study adds
Metabolomics reveals novel compounds, including solanidine and derivatives, as promising CYP2D6 biomarkers in humans.
Mean relative intensities decreased significantly during drug‐induced inhibition and in poor versus normal metabolizers.
What is the clinical significance
Replacing CYP2D6 probe drugs with naturally occurring biomarkers is a step forward towards personalized medicine.
This methodology eliminates risks associated with probe drugs administration and facilitates phenotyping in vulnerable populations.
1. INTRODUCTION
Interindividual and intraindividual variability in drug response can lead to insufficient therapeutic efficacy or life‐threatening adverse events (Kaddurah‐Daouk et al., 2014). In this context, precision medicine aims to improve therapeutic outcomes by integrating the entire genetic and phenotypic knowledge specifically related to an individual. Pharmacogenomics and pharmacometabolomics are both major and complementary approaches to precision medicine (Beger et al., 2016).
Pharmacogenomics is the use of patient‐specific information associated with the genome to study individual response to drugs, whereas pharmacometabolomics focuses on the metabolome (profile of low MW molecules within a biological system) (Pang et al., 2019; Schrimpe‐Rutledge et al., 2016; Wake et al., 2019). Metabolomics allows identification and understanding of pathways involved in drug–response variation (Kaddurah‐Daouk et al., 2014). It is also an important tool in the discovery of biomarkers that can be applied to personalized medicine (Ivanisevic & Thomas, 2018; Jensen et al., 2017; Villaseñor et al., 2014; Yeung, 2018). Biomarkers help monitor the evolution of a disease and the corresponding response to drugs, as well as better predict the clinical outcomes (Kohler et al., 2017). For instance, testosterone glucuronide, when normalized by glucuronide, can be used as a urinary biomarker of UDP‐glucuronosyltransferase 2B17 (UGT2B17), an androgen‐ and drug‐metabolizing enzyme, as recently shown through targeted metabolomic analysis (Zhang et al., 2020). Five ω‐ and (ω‐1)‐hydroxylated medium‐chain acylcarnitines have also been identified as novel CYP3A biomarkers using an untargeted metabolomic approach (Kim et al., 2018).
The cytochrome P450 2D6 (CYP2D6) is responsible for the metabolism of around 25% of all drugs used in clinical practice including antidepressants, analgesics, β‐adrenoceptor antagonists and antipsychotics (Gaedigk, 2013). Prescribing CYP2D6 drug substrates is often challenging for physicians because of the large variability in the activity of this enzyme. CYP2D6 is a highly polymorphic gene locus and genotyping assays can be used to predict enzyme activity (Nofziger et al., 2020). However, relying only on genotyping has several limitations. First, it does not take into account environmental factors such as concomitant medications, food intake and disease‐related factors (Gaedigk et al., 2018). Second, depending on the technology and database used, some of the rare variants may not be screened or even identified, and an allele may be erroneously categorized as functional (Gaedigk et al., 2018). Thirdly, when duplication or multiplication is detected a majority of copy number tests do not distinguish which of the two alleles has several copies (Langaee et al., 2015; Shah et al., 2016). Therefore, in clinical practice, precision medicine must rely on both real‐time phenotyping and genotyping in order to provide the best possible recommendations. Currently, CYP2D6 phenotyping requires the administration of an exogenous probe drug specifically metabolized by this isoenzyme (Magliocco et al., 2019; Samer et al., 2013). Microdosing of the probe drug and enhanced detection capacities of mass spectrometry (MS) have lowered the risk of probe‐related side effects. However, potential iatrogenic harm (allergic reaction, dosing errors) would only be totally eliminated if endogenous or food‐derived compounds were available as CYP2D6 markers (Magliocco et al., 2019; Magliocco & Daali, 2020). A recent review summarized human endogenous compounds that have been tagged as potential CYP2D6 markers (Magliocco et al., 2019). One of them stands out. It is a very promising urinary biomarker named M1 (m/z 444.3102) characterized in a non‐targeted metabolomic study (Tay‐Sontheimer et al., 2014). The origin and structural identification of this metabolite are still unknown. Some in vitro and animal studies have also demonstrated that CYP2D6 metabolizes the endocannabinoid anandamide (Snider et al., 2008).
Our main objective in this study was to explore the presence of CYP2D6 biomarkers in human urine and plasma, using an untargeted metabolomic approach. For this purpose, healthy volunteers were invited to two sessions (control vs. inhibitory). Prior to the inhibitory session, volunteers received over 7 days a daily dose of the strong CYP2D6 inhibitor paroxetine. The CYP2D6 genotype and phenotype were also integrated in the data analysis.
2. METHODS
2.1. Study design and population
This study protocol (NCT04188028) was approved by the Geneva Research Ethics Committee and the Swiss Agency for Therapeutic Products (Swissmedic). All participants provided written informed consent before inclusion. Protocol conception and trial conduct were performed in accordance with the Declaration of Helsinki ethical principles and the Good Clinical Practice guidelines of the International Congress of Harmonization.
Inclusion criteria were the following: age between 18 and 65 years, body mass index between 18 and 27 kg·m−2, reliable contraception during the whole study, including a barrier method, and CYP2D6 genotype activity score (AS) = 0 or ≥1 (Gaedigk et al., 2008). Participants with a CYP2D6 genotype AS = 0.5 (i.e. intermediate metabolizers [IM]) were not included in this study for safety reasons. Indeed, the normal metabolizers and ultrarapid metabolizers (UM) included in the before‐and‐after study analysis were all taking 20 mg of paroxetine, a dose that may cause side effects in CYP2D6 intermediate metabolizers participants (Hicks et al., 2015). Rather than give reduced doses to these volunteers, we excluded them from the study to keep the before‐and‐after analysis homogeneous. Only one participant had such a genotype and had to be excluded for these reasons.
Exclusion criteria included pregnancy/breastfeeding, any pathology, drug or food affecting CYP activity, tobacco consumption (≥10 cigarettes per day), alcohol intake 2 days prior to Session 1 and during paroxetine intake, hepatic impairment, medical history of chronic alcoholism or abuse of psychoactive drugs, regular use of psychotropic substances, drug sensitivity, psychiatric disorders and Beck score ≥ 10 (question related to suicide >0).
The study was conducted in two sessions (before‐and‐after design). Each session included the oral administration of 5‐mg dextromethorphan (BEXIN syrup, Spirig Healthcare, Egerkingen, Switzerland) to participants after an overnight fast and urine collection for 4 h following the administration of dextromethorphan for CYP2D6 phenotyping (Hu et al., 1998). For metabolomic analyses, prior to dextromethorphan administration, urine samples were also collected over a full 24‐h period and venous blood samples were collected in tubes containing EDTA (BD Vacutainer, Plymouth, UK) immediately before dextromethorphan ingestion (between 8 and 8:30 a.m.). Breakfast was served 1 h after dextromethorphan intake. No dietary restrictions or requirements were imposed on participants who consumed their free‐choice diets throughout study period. At Session 2, the study course was similar but participants were asked to take 20 mg (10 mg for poor metabolizer subjects) of paroxetine (PAROXETIN‐MEPHA, Basel, Switzerland), a time‐dependant inhibitor, every morning for 1 week (seven doses in total) with the breakfast (Storelli et al., 2019). For safety reasons, we administered a reduced dose of paroxetine (10 mg instead of 20 mg) in poor metabolizer subjects, as recommended in the Clinical Pharmacogenetics Implementation Consortium (CPIC) guidelines (Hicks et al., 2015). CYP2D6 inhibition by paroxetine is not expected to have an impact on poor metabolizer subjects because they already lack the CYP2D6 enzyme activity. Nonetheless, these subjects also received paroxetine at reduced doses as a negative control to ensure that any down‐ or up‐regulation achieved after paroxetine intake in normal metabolizer–ultrarapid metabolizers subjects was solely due to CYP2D6 inhibition and not to any other potential pharmacological effect of paroxetine. Participants were specifically asked about the time at which paroxetine tablets were taken and were asked to bring back empty blister packs to verify compliance. For women participating in the study, a pregnancy test was performed at inclusion and at each session prior to any medication administration. Plasma was obtained through centrifugation at 2750g for 10 min. All blood and urine samples were stored at −80°C until analysis.
2.2. Quantification of dextromethorphan and dextrorphan
Subsequent to chemical hydrolysis and liquid–liquid extraction (Daali et al., 2008), dextromethorphan and dextrorphan were quantified in urine by LC–tandem MS (Sciex, Darmstadt, Germany) to establish the urinary metabolic ratio dextrorphan to dextromethorphan (UMRdextrorphan/dextromethorphan).
2.3. CYP450 genotyping
Genomic DNA was extracted from whole blood (200 μl) using the QIAamp DNA Blood Mini Kit (Qiagen, Hombrechtikon, Switzerland). Fourteen CYP2D6 allelic variants were screened using the TaqMan® OpenArray® PGx Panel (Thermo Fisher Scientific, Waltham, USA). The experiment was performed on the QuantStudio 12K Flex real‐time PCR system in compliance with the manufacturer's instructions. The following mutations were considered: 2850C > T, 4180G > C, 2549delA (*3), 100C > T (*4, *10), 1846G > A (*4A), 1707delT (*6), 2935A > C (*7), 1758G > T (*8), 2613_2615delAGA (*9), 124G > A (*12), 1758G > A (*14), 1023C > T (*17), 3183G > A (*29), 2988G > A (*41).
CYP2D6 Taqman® Copy Number Assay (assay ID: Hs00010001_cn targeting exon 9, Applied Biosystems, Foster City, USA) was performed on a 7900HT Fast Real‐Time PCR System (Applied Biosystems, Thermo Fisher Scientific, CA, USA) instrument for the detection of gene deletion (*5 allele) and duplication.
CYP2D6 AS was assigned using previously developed scoring system (Gaedigk et al., 2008). Values of 0, 0.5 and 1 were assigned to the non‐functional, reduced function and fully functional alleles, respectively (Tay‐Sontheimer et al., 2014). The values for alleles with two or more gene copies were multiplied by the number of gene copies (Gaedigk et al., 2018). Summing the values of the two alleles gives the AS of a genotype (Gaedigk et al., 2018).
2.4. Untargeted metabolomics analysis by Liquid Chromatography‐High Resolution Mass Spectrometry (LC‐HRMS)
A total of 300 μl of methanol/ethanol (50:50) containing hydrocodone‐D6 and phenobarbital‐D5 at 100 ng·ml−1 (internal standards for positive and negative modes, respectively) were added to 100 μl of urine or plasma for protein precipitation. Samples were centrifuged for 20 min at 16,000g. The supernatant was then evaporated under a stream of nitrogen, reconstituted in 100 μl of methanol/water (1:9), and 5 μl were injected into the LC–MS system.
Non‐targeted metabolomics analyses were carried out using an LC system Ulimate 3000 coupled to a Q Exactive Plus system (Thermo Scientific Fisher, Bremen, Germany) (Forchelet et al., 2018; Kowalczuk et al., 2018). Separation was performed with a Kinetex® C18 column (50 × 2.1 mm, 2.6 μm) from Phenomenex (Brechbühler, Switzerland) with mobile phases consisting of water (A) and methanol (B) both containing 0.1% formic acid. The flow rate was fixed at 0.3 ml·min−1 over 13 min. Gradient programme was set as follows: 2% B (0–0.3 min), 2%–98% B (0.3–6 min), 98%–100% B (6–9 min), 100%–2% B (9–9.1 min) and 2% B (9.1–13 min). Quality controls (i.e. pooled aliquots of all clinical study samples) were included in the analytical sequence at regular intervals. Data were acquired in a full scan mode in both positive and negative polarities. The parameters were set as follows: the capillary voltage at 3.2 and 2.5 kV in positive and negative modes, respectively, sheath and auxiliary gas flow rate at 40 and 10 respectively, capillary temperature at 320°C and S‐lens RF level at 50.
2.5. Untargeted metabolomics data treatment and statistical analysis
The raw UPLC‐HRMS files were converted to .mzXML format using MSConvert (ProteoWizard 3.0, http://proteowizard.sourceforge.net/) (RRID:SCR_012056) and pre‐processed using the XCMS Online platform for features detection, chromatogram alignment, isotope annotation and data visualization (https://xcmsonline.scripps.edu) (RRID:SCR_015538).
All data transformation and statistical analyses were performed using MetaboAnalyst (https://www.metaboanalyst.ca/) (RRID:SCR_015539). Data were sum normalized, Pareto scaled and log transformed. Subsequently, features were filtered, and only those with a CV less than 20% in the QC samples were retained. Isotopes were filtered out, and finally, ions of zero intensity in >20% of all participants in both sessions were excluded (Kim et al., 2018).
Zero values were replaced by the half of the minimum value found for the corresponding hit (Xia & Wishart, 2011). Principal component analysis (PCA) was performed using QC samples to assess performance and stability of the system. Volcano plots were generated in order to filter metabolites that displayed both significant fold changes (≥1.5 or ≤0.67) and statistical significance (FDR adjusted P‐value < 0.05) between the control and the inhibition session in non‐poor metabolizer subjects (n = 37). The significant features obtained were then filtered out according to genotype: fold changes of relative intensity in the CYP2D6 normal metabolizer–ultrarapid metabolizers group (n = 37) compared with the poor metabolizer group (n = 6) ≤0.67 or ≥1.50 (FDR adjusted P‐value < 0.05) (n refers to independent values, not replicates). The data and statistical analysis comply with recommendations of the British Journal of Pharmacology on experimental design and analysis (Curtis et al., 2018).
2.6. CYP2D6 biomarkers identification
The MS/MS scanning was performed using the targeted SIM/dd‐MS2 mode on an LC system Vanquish coupled to a Q Exactive Focus system (Thermo Scientific, Bremen, Germany) and the chromatographic conditions described above. The precursors enlisted in the inclusion list were selected in the quadrupole with an isolation window of 0.4 m/z, followed by a ddMS2 scan with a similar isolation window. For both SIM and ddMS2, resolution and AGC target were set at 70,000 and 5e4, respectively. Identification was then performed using SIRIUS 4.7.4, a software that determines the most likely elemental composition of metabolites through the analysis of isotopic patterns and MS/MS fragmentation spectra, and CANOPUS, a computational tool for systematic annotation of compound chemical classes (Dührkop et al., 2019, 2021). Main metabolomics databases, LIPID MAPS® (https://www.lipidmaps.org/) (RRID:SCR_006579), METLIN (https://metlin.scripps.edu/) (RRID:SCR_010500) and HMDB (http://www.hmdb.ca/) (RRID:SCR_007712), were also used to assist in the identification of molecular structures of significant features on the basis of the available experimental data (i.e. exact MWs, molecular formulas and fragmentation patterns).
Metabolites that had a fragmentation pattern of glucuronide conjugation were enzymatically deconjugated in order to obtain the fragmentation pattern of the free form. The metabolite deconjugation system consisted of 100 μl of urine, 2.5 μl of the mixture β‐glucuronidase/arylsulfatase from Roche Diagnostics (Mannheim, Germany), 1.5 μl of acetic acid 15% in water and 10 μl of ammonium acetate buffer (1 M, pH 5.0). The mixture was incubated at 37°C overnight (Schmidt et al., 2013).
2.7. Metabolism of solanidine in human liver microsomes and recombinant CYP450s
The stock solution of solanidine from PhytoLab (Vestenbergsgreuth, Germany) was prepared at 1 mg·ml−1 in methanol. Solanidine 20 μM was then added to a reaction mixture (final volume 50 μl) containing 1 mg·ml−1 of human liver microsomes (HLM) or 100 pmol·ml−1 of CYP450 baculosomes (i.e. CYP1A2, CYP2B6, CYP2C9, CYP2C19, CYP2D6, CYP3A4 or CYP3A5) in phosphate buffer (pH 7.4, 0.1 M). Pooled human liver microsomes were obtained from Corning Gentest (Corning, NY, USA) and the baculosomes were purchased from Invitrogen, Life Technologies (Carlsbad, CA, USA). The mixture was preincubated for 3 min in a 37°C water bath, and the reaction was then initiated by the addition of a NADPH‐generating system (NADP 4 mmol·L−1, isocitrate 15 mmol·L−1, MgCl2 12.5 mmol·L−1 and isocitrate dehydrogenase 1.5 IU·ml−1 in phosphate buffer). Incubations were carried out at 37°C for 1 h and were performed in duplicates. In order to stop the reaction, 50‐μl methanol was added. The mixture was then centrifuged for 3 min at 10,000g, and the supernatant was diluted in water before being analysed in full scan mode with the same method as described above for metabolomic analysis using an LC system Vanquish coupled to a Q Exactive Focus system (Thermo Scientific, Bremen, Germany).
2.8. Parallel reaction monitoring (PRM) analysis
To improve sensitivity, validate and refine results, a semi‐quantitative method using a parallel reaction monitoring (PRM)‐based approach was developed for the hits identified in metabolomics. The chromatographic separation was performed using an LC system Vanquish coupled to a Q Exactive Focus system (Thermo Scientific, Bremen, Germany). The resolution was set at 17,500 for the fragmentation experiments with an AGC target of 5e4 and a maximum IT of 100 ms. Solanidine and the metabolite m/z 414.3366 identified in vitro were also included in the PRM analysis because they were detectable in plasma and urine samples. The normalized collision energies (NCE) values for each compound were set individually, and urinary creatinine concentration was used for data normalization of urine samples, except for solanidine metabolites that were normalized to solanidine. The preparation of urine and plasma samples as well as the chromatographic and MS conditions were identical to those of the metabolomic analyses, except that the extracts were concentrated twice (reconstitution in 50 μl of methanol/water [1:9]). Hydrocodone‐d6 at 15 ng·ml−1 was used as internal standard. In addition, urine samples were also analysed after enzymatic hydrolysis as described above to obtain the profile of the compound m/z 421.3061 (deconjugated form of m/z 597.3382). Zero values were replaced by the half of the minimum value found for the corresponding hit (Xia & Wishart, 2011).
We also verified the short‐term stability of the metabolites at two different temperatures (room temperature and +4°C) in plasma and urine samples. Stability was assessed by comparing the peak area obtained after 8 and 24 h with those obtained at time 0. Each measurement was performed in triplicate.
2.9. Statistical analysis of parallel reaction monitoring (PRM) data treatment
Comparisons of two paired and unpaired groups were performed using a Wilcoxon matched‐pairs signed rank test and Mann–Whitney test (two‐tailed), respectively. Measures of associations were established using Spearman's rank correlation. The statistical analyses were performed using GraphPad Prism 8.0.1 software (San Diego, USA) (RRID:SCR_002798). Statistical analysis was carried out only if n ≥ 5. A P‐value below 0.05 was considered statistically significant. The data and statistical analysis comply with recommendations of the British Journal of Pharmacology on experimental design and analysis (Curtis et al., 2018).
2.10. Materials
Methanol, water, acetic acid and formic acid ULC/MS grade were from Biosolve (Valkenswaard, The Netherlands). Ethanol HPLC grade was purchased from Honeywell Riedel‐de Haën (Seelze, Germany). Dextromethorphan in methanolic solution (1 mg·ml−1) was provided from Lipomed AG (Arlesheim, Switzerland). Dextrorphan tartrate, hydrocodone‐D6 and phenobarbital‐D5 in methanolic solutions (1 mg·ml−1) were purchased from Cerilliant Corporation (Round Rock, USA). Ammonium acetate, potassium phosphate dibasic, potassium phosphate monobasic, nicotinamide adenine dinucleotide phosphate (NADP), isocitric acid, magnesium chloride hexahydrate and isocitrate dehydrogenase were purchased from Sigma‐Aldrich (Buchs, Switzerland).
2.11. Nomenclature of targets and ligands
Key protein targets and ligands in this article are hyperlinked to corresponding entries in the IUPHAR/BPS Guide to PHARMACOLOGY http://www.guidetopharmacology.org and are permanently archived in the Concise Guide to PHARMACOLOGY 2019/20 (Alexander et al., 2019).
3. RESULTS
3.1. Healthy subjects
A total of 43 healthy subjects were enrolled. Forty‐two completed the study while one among the poor metabolizer subjects only attended the control session. The mean age was 24 (range 19–29) with a slightly higher proportion of females (55.8%, n = 24). Among women participants, 45.8% used oral contraceptive pill (n = 11).
3.2. CYP2D6 genotype and phenotype
Based on genotyping analyses, 6 participants were classified as poor metabolizer subjects (genetic‐predicted activity score [gAS] = 0), 33 as normal metabolizer subjects (1 ≤ gAS ≤ 2) and 4 as ultrarapid metabolizers subjects (gAS > 2) (Crews et al., 2014; Gaedigk et al., 2008) (Table S1). Urinary metabolic ratio (UMR)dextrorphan/dextromethorphan was measured to establish CYP2D6 phenotype. As illustrated in Figure S1, mean CYP2D6 activity was significantly decreased after paroxetine intake compared with the control session (P < 0.05), demonstrating effective inhibition of CYP2D6 activity by paroxetine and sample suitability for the subsequent metabolomic analyses.
3.3. Untargeted metabolomic analysis
Using untargeted metabolomic assays, the goal of this project was to identify biomarkers of CYP2D6 in urine and plasma reflecting the activity of the enzyme. Figure 1 shows the flowchart of the data analysis, from data extraction to statistical analysis. After the filtering steps, a total of 8926 and 5997 ions in plasma and urine, respectively, were processed for statistical analysis, including sum normalization, log transformation and Pareto scaling. PCA scores plot revealed a tight clustering of QC samples (Figure S2) indicating high experimental quality for both urine and plasma samples.
FIGURE 1.
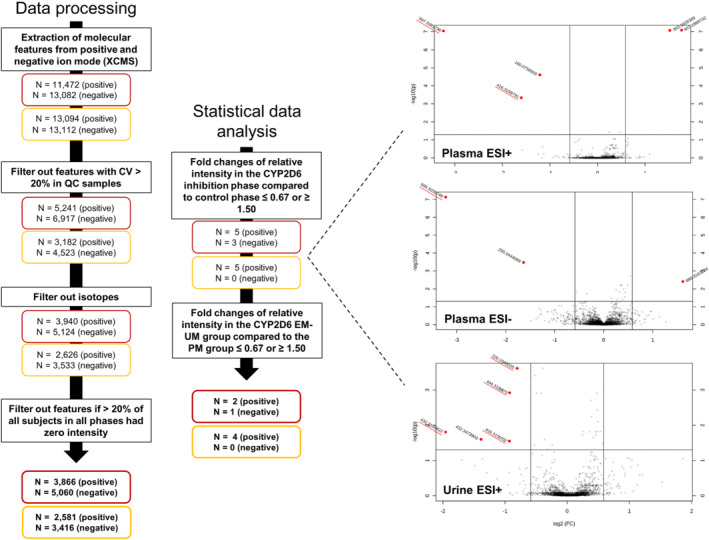
(left) Flowchart of the non‐targeted metabolomics approach to identify biomarkers reflecting CYP2D6 activity. N represents the number of metabolic features after each step with plasma biomarkers in red and urinary biomarkers in yellow. (right) Volcano plot representations obtained from the metabolomic analysis showing statistical significance against fold change between the inhibition session and the control session
As seen in Table 1, five endogenous metabolites were significantly decreased in urine and/or plasma during the CYP2D6 inhibition phase relative to baseline with the following m/z in positive mode: 220.1545, 416.3157, 432.3109, 444.3107 and 597.3382 (595.3240 in negative mode). The largest reduction was observed for the ion m/z 597.3382 that was decreased by around 87% after paroxetine intake compared with the baseline conditions. In parallel, the intensity of these features was significantly lower in poor metabolizer subjects than in normal metabolizer–ultrarapid metabolizers volunteers.
TABLE 1.
Significant hits in urine and plasma measured in full MS mode (metabolomic analyses) from volcano plots, including mean fold changes of normalized intensity in the inhibition session versus the control session and mean fold changes of normalized intensity in the poor metabolizer (PM) subjects versus the normal metabolizer (NM)– ultrarapid metabolizers (UM) subjects
| Inhibition session versus control session (n = 37) | PM subjects (n = 6) versus NM–UM subjects (n = 37) | |||||
|---|---|---|---|---|---|---|
| m/z | Retention time (min) | Ionization mode | Fold change (90% CI) | P‐value (adjusted) | Fold change (90% CI) | P‐value (adjusted) |
| Plasma | ||||||
| 416.3160 | 4.16 | + | 0.60 (0.34–0.96) | < 0.05 | 0.006 (0.005–0.008) | < 0.05 |
| 595.3240 a | 5.25 | − | 0.16 (0.10–0.23) | < 0.05 | 0.044 (0.008–0.082) | < 0.05 |
| 597.3382 a | 5.25 | + | 0.13 (0.09–0.19) | < 0.05 | 0.065 (0.020–0.114) | < 0.05 |
| Urine | ||||||
| 220.1545 | 2.51 | + | 0.54 (0.45–0.65) | < 0.05 | 0.337 (0.289–0.395) | < 0.05 |
| 416.3157 | 4.16 | + | 0.67 (0.39–1.07) | < 0.05 | 0.018 (0.007–0.032) | < 0.05 |
| 432.3109 | 4.11 | + | 0.56 (0.25–0.99) | < 0.05 | 0.009 (0.001–0.018) | < 0.05 |
| 444.3107 | 4.35 | + | 0.67 (0.38–1.05) | < 0.05 | 0.021 (0.002–0.046) | < 0.05 |
Same analyte deprotonated ([M − H]−) and protonated ([M + H]+).
3.4. Structural identification
The molecular formulas for all compounds were obtained through fragmentation and isotope pattern analysis using SIRIUS 4.7.4. Results are described in Table 2. Interestingly, all the features contain one or two nitrogen atoms.
TABLE 2.
Major MS/MS fragments of significant metabolites
| Measured [M + H]+ | Accurate [M + H]+ | Mass error (ppm) | Molecular formula | MS/MS fragments | CANOPUS (compound class prediction) |
|---|---|---|---|---|---|
| 220.1545 | 220.1543 | +0.91 | C10H21NO4 | 202.1436, 184.1331, 166.1223, 148.1119, 90.0554, 60.0451 |
Class: Fatty acyls Subclass: Fatty acids and conjugates Level 5: Amino fatty acids |
| 416.3157 | 416.3159 | −0.48 | C26H41NO3 | 342.2785, 206.1899, 126.1277, 98.0967, 81.0703, 56.0501 |
Class: Steroids and steroid derivatives Subclass: Steroidal alkaloids |
| 432.3109 | 432.3108 | +0.23 | C26H41NO4 | 358.2737, 206.1898, 126.1277, 98.0968, 81.0704, 56.0502 |
Class: Steroids and steroid derivatives Subclass: Steroidal alkaloids |
| 444.3107 | 444.3108 | −0.23 | C27H41NO4 | 370.2734, 206.1899, 126.1279, 98.0968, 81.0704, 56.0502 |
Class: Steroids and steroid derivatives Subclass: Steroidal alkaloids |
| 421.3056 a | 421.3061 | −1.19 | C24H40N2O4 | 358.2734, 147.1126, 130.0862, 91.0545, 84.0813, 81.0704 |
Class: Carboxylic and derivatives Subclass: Amino acids, peptides and analogues Level 6: Alpha amino acids and derivatives |
| 597.3382 | 597.3382 | 0.00 | C30H48N2O10 | 421.3054, 358.2734, 147.1126, 130.0862, 91.0545, 84.0813 |
Class: Carboxylic and derivatives Subclass: Amino acids, peptides and analogues Level 8: N‐acyl‐α‐amino acids |
Note: Exact mass and molecular formula obtained using SIRIUS 4.7.4. Compounds class predicted using CANOPUS.
Deconjugated form of the ion m/z 597.3382.
The compounds m/z 416.3159, 432.3108 and 444.3108 have similar fragmentation patterns, with a major fragment at 98.0967 (C6H11N). Regarding the feature m/z 444.3108, we observed the same MS/MS fingerprint described by Tay‐Sontheimer et al. (2014) for their biomarker referred to as M1 (m/z 444.3102), an unidentified compound. The CANOPUS computational tool predicted that these three features belong to the subclass of steroidal alkaloids. MS/MS fragmentation patterns are shown in Figure 2. We included solanidine, one of the most common alkaloid aglycones from Solanum species, in this figure, which shows a very similar fragmentation pattern (Shakya & Navarre, 2008). Full structural identification of the ions m/z 416.3159, 432.3108 and 444.3108 (i.e., position of hydroxylation and/or demethylation) would require isolation and purification of these compounds for NMR analyses. Starting with a total of 12 L of human urine, we attempted to extract and isolate these compounds, in particular the ion m/z 444.3108 (highest signal in urine samples in both full MS and PRM detection modes). However, the amounts extracted were insufficient to perform structural identification through NMR experiments (data not shown).
FIGURE 2.
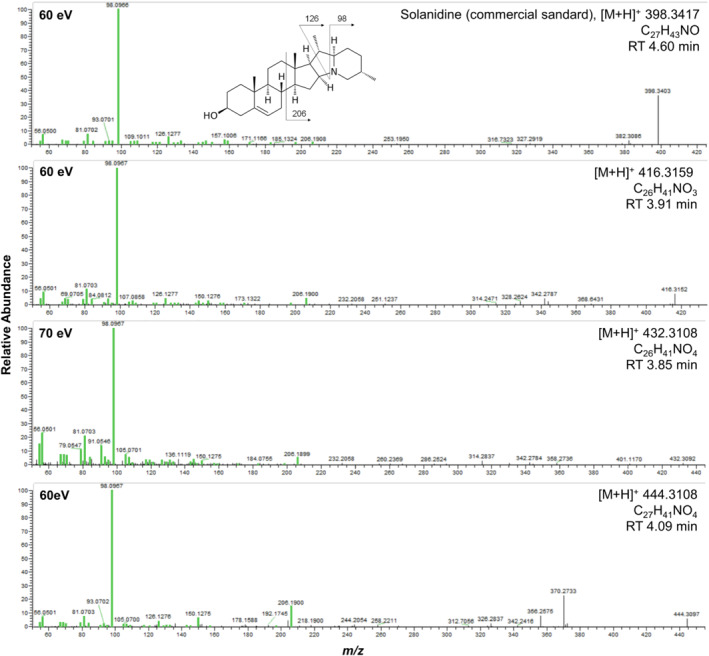
Targeted selected ion monitoring/data‐dependent‐MS2 of solanidine and the ions m/z 416.3159, 432.3108 and 444.3108 in ESI+ mode. The common fragments between the compounds are shown in green
Fragmentation trees of the ions m/z 220.1543 and 597.3382 are presented in Figures S3 and S4. Despite the prediction of the potential class of these compounds by the CANOPUS tool, we found no structural identification for these three features using the scientific literature and the HMDB, LIPID MAPS and METLIN databases.
MS/MS fragmentation of m/z 220.1543 was difficult to obtain because several compounds with close mass (i.e., m/z 220.0966 and 220.1329) co‐eluted. It is however possible to observe four losses of water (−18.0109 Da): 202.1436, 184.1331, 166.1226 and 148.1120.
At low collision energies (i.e. 10 and 20 eV), the major fragment of m/z 597.3382 was 421.3061, which corresponds to neutral loss of a glucuronide moiety. To validate the glucuronide conjugation, the feature m/z 597.3382 was also enzymatically hydrolysed prior to MS/MS fragmentation, resulting in m/z 421.3061 (−176.0321 Da). Fragmentation tree of the ions m/z 421.3061 is shown in Figure S5. Chromatograms before and after hydrolysis provided in Figure S6 confirm the presence of a glucuronide because the conjugated peak (m/z 597.3382, retention time = 4.98 min) decreased after hydrolysis, whereas the deconjugated peak (m/z 421.3061, retention time = 5.20 min) increased after the enzymatic hydrolysis and showed a higher retention time than the conjugated form. At collision energies above 20 eV, the features m/z 421.3161 and 597.3382 showed a major fragment at 84.0812 (C5H9N).
3.5. Solanidine metabolism by CYP2D6
A preliminary and simplified scheme of the metabolic pathway of solanidine is described in Figure 3. Undefined positions of hydroxylation and/or demethylation are indicated by unspecific bonds. Overall, we observed that the main isoenzymes catalysing solanidine metabolism were CYP2D6, CYP3A4 and CYP3A5 (Figure S7). The most abundant metabolite of solanidine in vitro was the ion m/z 414.3366 (addition of one hydroxyl) formed after incubation with recombinant CYP2D6 or human liver microsomes. All metabolites formed by recombinant CYP2D6 showed a major fragment at m/z 98.0967, whereas the fragmentation patterns were different for CYP3A4/5 metabolites (data not shown).
FIGURE 3.
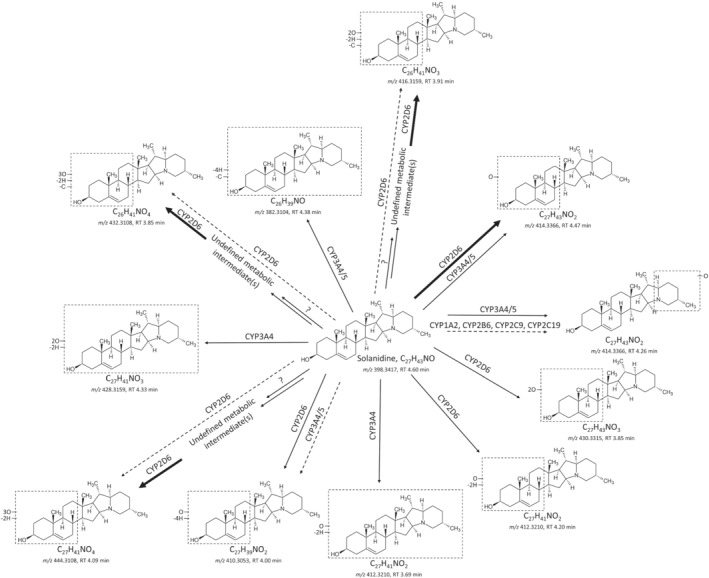
Preliminary scheme of the metabolic pathway of solanidine. Bold arrows indicate major routes. Dotted arrows indicate minor pathways. Multiple arrows indicate that the number of enzymatic steps is unknown
Despite low intensities, the ions m/z 416.3159, 432.3108 and 444.3108 were also detected in the mixture incubated specifically with CYP2D6 (Figures S7 and S8). Interestingly, in contrast to in vitro experiments, the intensities of the ions m/z 416.3159, 432.3108 and 444.3108 in the urine and blood samples were within the same range as the intensities of the metabolite m/z 414.3366 (Figure S8). Consequently, we believe that other enzymes and metabolic intermediates are likely to be involved in the biotransformation of solanidine into the ions m/z 416.3159, 432.3108 and 444.3108 as described in Figure 3.
3.6. Relative quantification using a PRM method
MS parameters were first optimized to enhance data quality using PRM mode. In order to obtain the optimal collision energy for each metabolite, the normalized collision energies were considered individually using a step of 10. The parameters used are described in Table S2. The results are presented in Table 3. Retention times obtained are slightly different from those observed in the metabolomic analysis because different instruments were used.
TABLE 3.
Significant hits in urine and plasma measured in PRM mode, including mean fold changes of intensity in the inhibition session versus the control session and mean fold changes of intensity in the poor metabolizer (PM) subjects versus the normal metabolizer (NM)–ultrarapid metabolizers (UM) subjects
| Marker | Plasma | Urine | ||||||
|---|---|---|---|---|---|---|---|---|
| Inhibition session versus control session (n = 37) | PM subjects (n = 6) versus NM–UM subjects (n = 37) | Inhibition session versus control session (n = 37) | PM subjects (n = 6) versus NM–UM subjects (n = 37) | |||||
| Fold change (90% CI) | P‐value | Fold change (90% CI) | P‐value | Fold change (90% CI) | P‐value | Fold change (90% CI) | P‐value | |
| m/z 220.1543 | Not detected in plasma | 0.62 (0.51–0.74) | < 0.05 | 0.37 (0.29–0.47) | < 0.05 | |||
| Solanidine | 4.56 (1.53–15.33) | < 0.05 | 15.77 (5.74–53.88) | < 0.05 | 3.80 (1.91–12.81) | < 0.05 | 17.27 (8.18–60.00) | < 0.05 |
| m/z 414.3366 | 1.19 (0.60–2.17) | > 0.05 | 0.006 (0.005–0.010) | < 0.05 | 1.29 (0.63–2.42) | > 0.05 | 0.007 (0.001–0.014) | < 0.05 |
| m/z 414.3366/solanidine | 0.38 (0.22–0.62) | < 0.05 | 0.0003 (0.0001–0.0005) | < 0.05 | 0.34 (0.16–0.57) | < 0.05 | 0.007 (0.001–0.014) | < 0.05 |
| m/z 416.3159 | 0.69 (0.40–1.07) | < 0.05 | 0.002 (0.002–0.003) | < 0.05 | 0.61 (0.36–0.94) | < 0.05 | 0.008 (0.003–0.013) | < 0.05 |
| m/z 416.3159/solanidine | 0.17 (0.13–0.26) | < 0.05 | 0.00003 (0.00001–0.00006) | < 0.05 | 0.25 (0.04–0.50) | < 0.05 | 0.0001 (0.0000–0.0001) | < 0.05 |
| m/z 432.3108 | Not detected in plasma | 0.50 (0.26–0.83) | < 0.05 | 0.02 (0.00–0.05) | < 0.05 | |||
| m/z 432.3108/solanidine | Not detected in plasma | 0.15 (0.07–0.27) | < 0.05 | 0.0004 (0.0001–0.0011) | < 0.05 | |||
| m/z 444.3108 | 0.60 (0.34–0.94) | < 0.05 | 0.003 (0.003–0.005) | < 0.05 | 0.64 (0.41–0.94) | < 0.05 | 0.001 (0.000–0.001) | < 0.05 |
| m/z 444.3108/solanidine | 0.21 (0.08–0.41) | < 0.05 | 0.00004 (0.00001–0.00007) | < 0.05 | 0.28 (0.10–0.53) | < 0.05 | 0.00001 (0.00000–0.00001) | < 0.05 |
| m/z 421.3062 a | Not detected in plasma | 0.35 (0.26–0.42) | < 0.05 | 0.05 (0.03–0.07) | < 0.05 | |||
| m/z 597.3382 | 0.29 (0.23–0.36) | < 0.05 | 0.04 (0.01–0.07) | < 0.05 | 0.31 (0.23–0.39) | < 0.05 | 0.04 (0.02–0.06) | < 0.05 |
Deconjugated form of the marker m/z 597.3382.
Consistent with the metabolomic analyses, we observed a significant down‐regulation after paroxetine intake compared with the control session for the markers in both urine and plasma samples (Figures 4a and 5a). The only exception was the ion m/z 414.3366, identified in vitro, which was significantly reduced in the inhibitory session versus the control session only after normalization to solanidine. As a complement to the before‐and‐after study, the markers were significantly reduced in poor metabolizer subjects compared with normal metabolizer–ultrarapid metabolizers participants (Figures 4b and 5b). Going even further, significant correlations were observed between the different biomarkers and the log(UMRdextrorphan/dextromethorphan) (Figures 4c and 5c).
FIGURE 4.
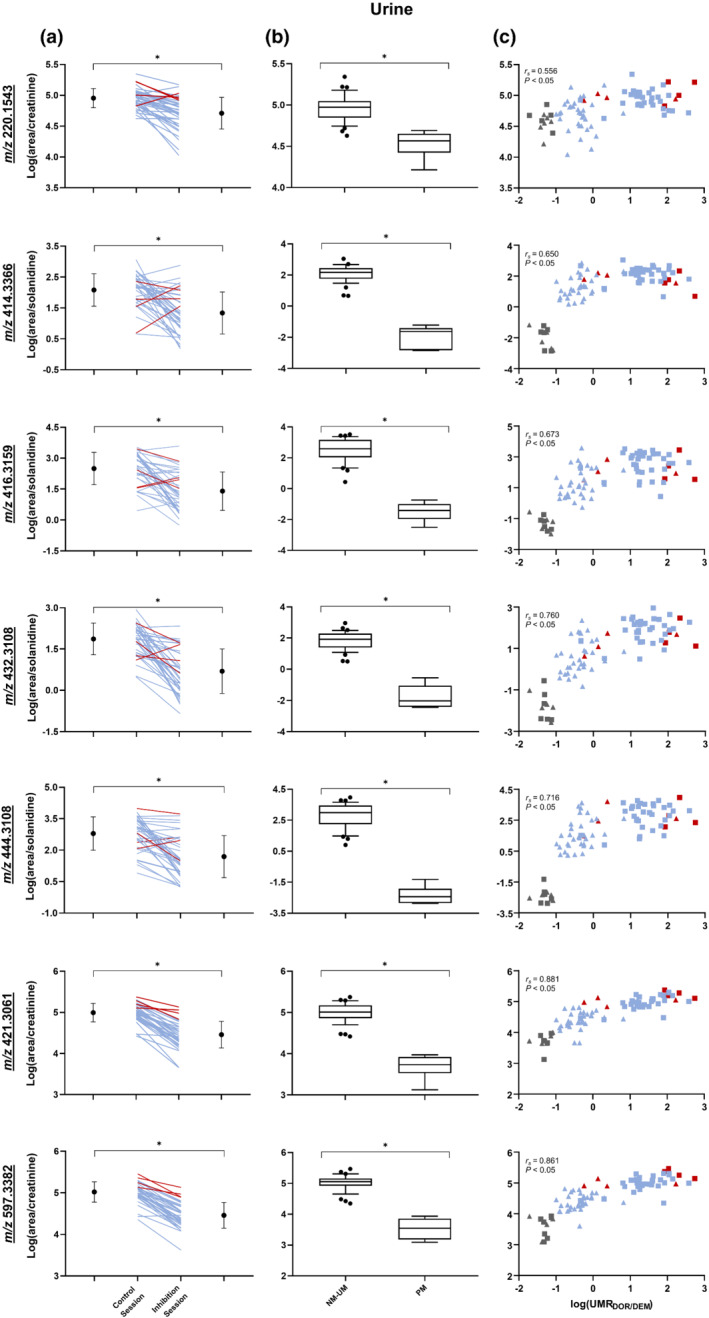
Log(area/creatinine) or log(area/solanidine) in urine of potential CY2D6 markers measured with parallel reaction monitoring (a) before and after paroxetine intake, including means and SDs on each side. Ultrarapid metabolizers (n = 4) are shown in red and normal metabolizers (n = 33) in blue. (b) Normal metabolizer (NM)–ultrarapid metabolizers (UM) subjects (n = 37) versus poor metabolizer (PM) subjects (n = 6) with whiskers indicating the 10th and 90th percentiles. (c) Correlation with log (urinary metabolic ratio (UMR) dextrorphan(DOR)/dextromethorphan(DEM)). Control session (n = 43) is represented by square, and inhibition session (n = 42) by triangle. Ultrarapid metabolizers are shown in red, normal metabolizers in blue and poor metabolizers in grey. All P < 0.05
FIGURE 5.
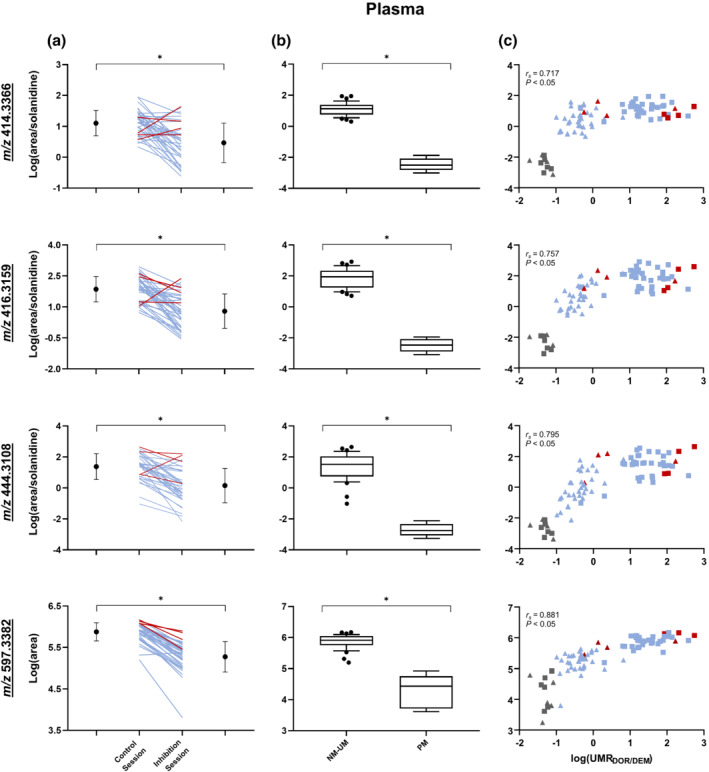
Log(area) or log(area/solanidine) in plasma of potential CY2D6 markers measured with parallel reaction monitoring (a) before and after paroxetine intake, including means and SDs on each side. Ultrarapid metabolizers (n = 4) are shown in red, and normal metabolizers (n = 33) in blue. (b) Normal metabolizer (NM)–ultrarapid metabolizers (UM) subjects (n = 37) versus poor metabolizer (PM) subjects (n = 6) with whiskers indicating the 10th and 90th percentiles. (c) Correlation with log(urinary metabolic ratio (UMR)dextrorphan(DOR)/dextromethorphan(DEM)). Control session (n = 43) is represented by square, and inhibition session (n = 42) by triangle. Ultrarapid metabolizers are shown in red, normal metabolizers in blue and poor metabolizers in grey. All P < 0.05
In line with in vitro results, solanidine was significantly higher (up to 4.56‐fold) after volunteers received a CYP2D6 inhibitor compared with the control session and higher in poor metabolizer subjects than in NM–ultrarapid metabolizers subjects (Figure 6). Solanidine was not identified in the untargeted metabolomic analysis because it was not detected in 22% and 29% of the plasma and urine samples, respectively, from all participants in both sessions. Indeed, the ions of zero intensity in >20% of all participants in both sessions were removed from the initial data analysis (see Figure 1).
FIGURE 6.
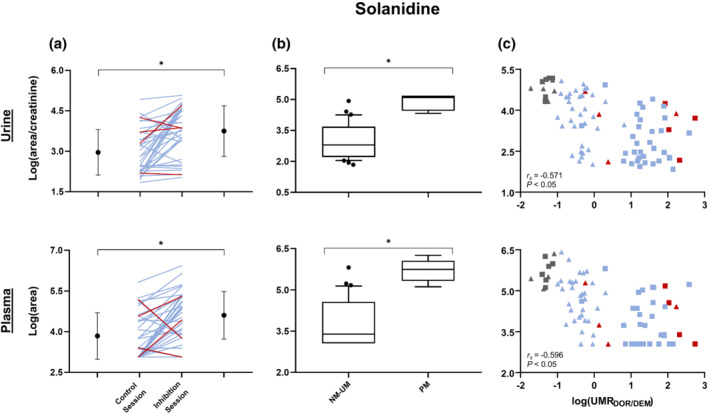
Log(area/creatinine) or log(area) in urine and plasma, respectively, of solanidine measured with parallel reaction monitoring (a) before and after paroxetine intake, including means and SDs on each side. Ultrarapid metabolizers (UM) (n = 4) are shown in red, and normal metabolizers (n = 33) in blue. (b) Normal metasbolizer (NM)–UM subjects (n = 37) versus poor metabolizer (PM) subjects (n = 6) with whiskers indicating the 10th and 90th percentiles. (c) Correlation with log(urinary metabolic ratio (UMR)dextrorphan (DOR)/dextromethorphan (DEM)). Control session (n = 43) is represented by square, and inhibition session (n = 42) by triangle. Ultrarapid metabolizers are shown in red, normal metabolizers in blue and poor metabolizers in grey. All P < 0.05
We also specifically examined data from poor metabolizer individuals regarding the features not studied in vitro (i.e. m/z 220.1543, 421.3061 and 597.3382). Indeed, these subjects do not express the CYP2D6 enzyme. Consequently, a decrease in the abundance of the identified hits in these individuals after CYP2D6 inhibition would have indicated the presence of false positives rather than changes due to CYP2D6 inhibition. Mean relative intensities of m/z 220.1543, 421.3061 and 597.3382 were unchanged in poor metabolizer subjects after paroxetine intake compared with baseline (Figure S9). Therefore, the down‐regulation observed in these features after paroxetine intake in normal metabolizer–ultrarapid metabolizers subjects was likely due to CYP2D6 inhibition alone and not to any other potential pharmacological effect of paroxetine, despite the small sample size of poor metabolizer subjects used (n = 5) to draw this conclusion.
All of the metabolites were stable at room temperature and +4°C for 24 h (peak areas at t8 and t24 were between 85% and 115% of the corresponding samples at t0), making their use readily applicable in clinical practice.
4. DISCUSSION
Metabolomics revealed five metabolites that could potentially serve as markers for monitoring CYP2D6 activity. In the normal metabolizer–ultrarapid metabolizers group, these features were significantly reduced following 7 days of paroxetine intake compared with baseline. These results were reinforced and validated by the significant reduction observed for all markers in the poor metabolizer group compared with the normal metabolizer–ultrarapid metabolizers group.
Three of these features, that is, m/z 416.3159, 432.3108 and 444.3109, were postulated as steroidal alkaloids using the tools SIRIUS and CANOPUS (Dührkop et al., 2019, 2021). These metabolites were also detected after incubation of solanidine with recombinant CYP2D6. However, they were among the metabolites with the lowest peak areas. Therefore, we hypothesized that other enzymes and metabolic intermediates are involved in the biotransformation of solanidine into the ions m/z 416.3159, 432.3108 and 444.3108. Full elucidation of the metabolic pathway needs to be investigated in further studies, including, for instance, the use of primary hepatocytes, considered as the gold standard for in vitro assays of liver metabolism (Gómez‐Lechón et al., 2003). CYP2D6 was also found as the main isoenzyme mediating the hydroxylation of solanidine into the m/z ion 414.3366). Interestingly, veratramine, another steroidal alkaloid found primarily in the medicinal plant Veratrum nigrum L., has also been identified as a CYP2D6 substrate, with hydroxyl‐veratramine being the major metabolite (Lyu et al., 2015).
Solanidine is the aglycone form of α‐solanine and α‐chaconine, two major glycoalkaloids present in potato (Solanum tuberosum) (Zhou et al., 2019). It has already been shown that solanidine is present in the serum of individuals consuming potatoes (Harvey et al., 1985). Solanidine was even detected in the serum of persons up to 3 weeks following potato avoidance programmes, indicating a long serum half‐life for this compound (Harvey et al., 1985). Claringbold et al. (1982) also demonstrated that when [3H]solanidine was administered to human volunteers through intravenous injection, radioactivity was retained in erythrocytes and the excretion rate was slow. The authors suggested that if solanidine was ingested regularly, it would accumulate (Claringbold et al., 1982). In our clinical trial, using a PRM methodology, we detected solanidine in 78% and 71% of the plasma and urine samples, respectively, of all participants in both sessions. It is likely that a selective sample preparation towards solanidine could improve detection. However, levels of solanidine and its metabolites in human urine and plasma presumably depend on potato intake. It would have been useful to know the potato consumption habits (frequency and quantity) of the participants to better understand the results and, most importantly, evaluate the clinical applicability of these biomarkers. In particular, it appears important to determine the detection times of solanidine and its metabolites in urine and plasma after potato consumption.
Solanidine metabolites were significantly lower in poor metabolizer subjects compared with normal metabolizer–ultrarapid metabolizers subjects, whereas solanidine intensity was significantly higher in poor metabolizer participants than in normal metabolizer–ultrarapid metabolizers participants (up to 17.27‐fold in urine samples). The potential long‐term toxicity consequences of such variations in solanidine levels between subjects with different CYP2D6 genotypes are unknown but need to be further investigated. Indeed, when consumed in high amounts, this compound may be toxic in humans due to inhibition of the enzyme AChE, resulting in gastrointestinal disorders or more serious effects such as heart failure or death after severe poisoning (Mensinga et al., 2005). In addition, the intake of paroxetine induced a significant increase in solanidine intensity compared with baseline (up to 4.56‐fold in plasma samples). In contrast to the ions m/z 416.3159, 432.3108 and 444.3108 (identified in the untargeted metabolomic analysis), the ion m/z 414.3366 (identified in vitro) was not significantly reduced following paroxetine administration in comparison with the control session. The elimination half‐life of the ion m/z 414.3366 is unknown, but it is possible that the duration of CYP2D6 inhibition in this study (7 days) is not long enough to reach a new steady state for this metabolite. Normalizing the intensities of the features m/z 414.3366, 416.3159, 432.3108 and 444.3108 to solanidine improves the sensitivity of all these markers to predict changes in CYP2D6 activity by correcting for intraindividual and interindividual variability. In particular, normalization to solanidine may provide more robust data because it could correct for variation from dietary habits.
Results obtained for the two other features m/z 220.1543 and 597.3382 (m/z 421.3062 when deconjugated), identified in the untargeted metabolomic analysis, were also confirmed through the targeted assay in PRM mode. These candidates were also CYP2D6‐mediated metabolites because the MS signal intensities were reduced in both poor metabolizer and post‐paroxetine participants in comparison with normal metabolizer–ultrarapid metabolizers subjects and basal conditions. Structural identification of these two features is uncertain despite the search in open‐access spectral databases and the use of the SIRIUS/CANOPUS tools. The formal identification of metabolites is one of the main challenges of untargeted metabolomics (Alonso et al., 2015; Ivanisevic & Thomas, 2018). Multiple databases have been developed and are regularly updated to help scientists with this process. However, a large proportion of the compounds, which have been revealed by untargeted metabolomic profiling, remains unidentified (Blaženović et al., 2018). No feature exhibited a profile consistent with a CYP2D6 substrate (i.e. parent molecule) for these two candidates (i.e. increased signal during the CYP2D6‐inhibited state and in normal metabolizer–ultrarapid metabolizers subjects compared with poor metabolizer subjects). The absence of a detectable CYP2D6 substrate may occur for different reasons:
Substrate concentrations may be significantly higher than metabolites levels and more substantially affected by other pathways regulating their concentrations than by variability in CYP2D6 metabolism. In such cases, no significant increase in the intensity of the precursor molecules of the ions m/z 597.3382 and 220.1543 would be detected when CYP2D6 activity is reduced by drug inhibition or by genetic polymorphisms. As an example, there is an important difference in the relative abundance of plasma 4β‐hydroxycholesterol (ng·ml−1), an endogenous CYP3A marker, compared with the parent compound cholesterol (mg·ml−1) (Gravel et al., 2019). In some studies, normalization of 4β‐hydroxycholesterol to cholesterol was shown to be as effective as plasma 4β‐hydroxycholesterol concentration alone in reflecting CYP3A activity (Gravel et al., 2019; Kasichayanula et al., 2014). Although 4β‐hydroxycholesterol concentrations depend primarily on CYP3A activity, CYP3A has no apparent impact on cholesterol levels.
The precursor molecules may be contained in the samples but at concentrations below the lower limit of detection of the analytical method (Shah et al., 2019; Taylor et al., 2013). Untargeted metabolomics operating in full scan mode provides greater metabolite coverage than targeted workflows, at the cost of lower sensitivity and specificity (Chen et al., 2020). For example, as observed in this study, the feature m/z 597.3382 was not detected in urine samples in full scan mode but was detected using PRM mode due to significantly higher sensitivity (see Table 2).
The substrates are present in the samples but are not detected due to issues related to the sample preparation/processing (Shah et al., 2019; Taylor et al., 2013). In untargeted metabolomics, non‐selective sample preparation should ideally be used in order to cover the metabolome as broadly as possible (Vuckovic, 2012). In our methodology, unselective protein precipitation was performed using ethanol/methanol (50:50). This procedure may result in the simultaneous precipitation of some metabolites, impeding their detection. In addition, unremoved compounds may lead to matrix effect, in particular ionization suppression (Fernández‐Peralbo & Luque de Castro, 2012; Wawrzyniak et al., 2018). Selective sample preparation methods, such as solid‐phase extraction or higher capacity of the LC separation, could reduce matrix effects (Wu et al., 2019).
The substrates may be present in biofluids other than urine and/or plasma. As described by Tay‐Sontheimer et al. (2014), some endogenous CYP2D6 biomarkers, such as anandamide, bufotenine or pinoline identified in vitro or in animal studies, are rather expected to be detected in specific tissues or biofluids in humans (e.g. brain or CSF).
All the features identified in this study correlated with log(UMRdextrorphan/dextromethorphan), the reference probe for CYP2D6 phenotyping. This confirms the potential ability of these compounds to accurately predict CYP2D6 activity. The best correlations were observed for the marker m/z 597.3382 in plasma and its deconjugated form m/z 421.3062 in urine (r s = 0.881). This feature (deconjugated and conjugated) was also very sensitive to CYP2D6 drug‐induced inhibition and thus appears to be a promising candidate for follow‐up studies.
Interestingly, all hits identified in this study contain at least a nitrogen element. It has been previously described that a majority of CYP2D6 substrates are lipophilic bases with a protonable nitrogen atom (Ingelman‐Sundberg, 2005). For instance, anandamide, an endogenous fatty acid amide that belongs to the class of endocannabinoids, is known to be metabolized by the CYP2D6 enzyme into 20‐hydroxyeicosatetranoic acid ethanolamide as well as 5,6‐, 8,9‐, 11,12‐ and 14,15‐epoxyeicosatrienoic acid ethanolamides as demonstrated through in vitro experiments using recombinant CYP2D6 (Farrell & Merkler, 2008; Snider et al., 2008). None of the metabolites that were previously described in literature (e.g., anandamide, pinoline and 5‐methoxy‐N,N‐dimethyltryptamine) (Magliocco et al., 2019) were detected in the current metabolomic study. Focused detection of these compounds would be more in line with a targeted metabolomic approach, which determines a predefined set of metabolites after optimization and validation of a profiling method (Roberts et al., 2012).
In summary, non‐targeted metabolomics enabled the identification of potential nitrogen‐containing CYP2D6 markers, including steroidal alkaloids, which can semi‐quantitatively predict activity of this isoenzyme. Each of these candidate biomarkers could map the functionality of this enzyme. Complete structure elucidation of the solanidine derivatives and the unidentified candidates m/z 220.5143 and 597.3382 will require complementary analytical methods such as NMR after extraction and purification of samples through preparative HPLC (Dias et al., 2016). Conveniently, all these biomarkers are present in urine. Large volumes of urine are relatively easy to obtain, which makes it an optimal starting material for purification and concentration for NMR structure identification (Whiley et al., 2019). Once the chemical structure of the metabolites m/z 220.5143 and 597.3382 is elucidated, the structure of the respective substrates could be more easily characterized. A specific sample preparation or analytical method could then possibly be developed in order to measure the metabolites along with the substrates. However, the CYP2D6‐mediated metabolites m/z 220.1543 and 597.3382 may be sufficiently robust as biomarkers for clinical CYP2D6 phenotyping, without normalization by the respective substrate levels. These hypotheses need to be further explored in future research.
Additional studies on different study populations as well as in another laboratory environment are required to validate our findings. Because of the possible accumulation of solanidine in the body and the fact that endogenous synthesis of nitrogenous steroids in humans has, to our knowledge, never been reported, we believe that solanidine and its derivatives were dietary markers from potato consumption, a very common food product in the current population. In order to validate this assumption, it appears necessary to conduct a study monitoring and varying the amount of potatoes consumed to assess the impact on solanidine and its metabolites. Once the biomarkers are fully identified and validated, prediction of CYP2D6 activity based on these candidates could greatly improve current phenotyping strategies by completely bypassing the need of administering probe drugs and thus the potential risks and limitations associated with this procedure.
AUTHOR CONTRIBUTIONS
G.M. wrote the manuscript, revised by all the authors. G.M., J.D., A.M., A.T. and Y.D. conceived and designed the clinical trial. G.M., J.D. and A.M. performed the clinical trial. G.M. and Y.G. performed CYP2D6 genotyping. G.M., N.B., T.J. and A.T. performed metabolomic analyses. G.M., L.M.Q.‐G., L.M., E.F.Q., J.‐L.W., A.T. and Y.D. worked on the structural identification of the metabolites. G.M., N.B., T.J., Y.G., A.T. and Y.D. analysed the data.
CONFLICT OF INTEREST
The authors declare no conflict of interest.
DECLARATION OF TRANSPARENCY AND SCIENTIFIC RIGOUR
This Declaration acknowledges that this paper adheres to the principles for transparent reporting and scientific rigour of preclinical research as stated in the BJP guidelines for Design and Analysis and as recommended by funding agencies, publishers and other organizations engaged with supporting research.
Supporting information
Table S1. CYP2D6 genotype distribution in the study population
Table S2. MS parameters in PRM mode and retention times of the target analytes
Figure S1. 4‐hour dextrorphan/dextromethorphan individual urinary metabolic ratios (UMRDOR/DEM) at baseline (control session) and after inhibition by paroxetine (inhibition session), following intake of dextromethorphan 5 mg per os (P < 0.05). Ultrarapid metabolizers (gAS > 2, n = 4) are shown in red and extensive metabolizers (1 ≤ gAS ≤ 2, n = 33) in blue. Error bars represent the standard deviations of log‐transformed UMRDOR/DEM.
Figure S2. Principal component analysis score plots of the quality control samples, control session samples and inhibition session samples in (a) positive ion mode, plasma (b) negative ion mode, plasma (c) positive ion mode, urine and (d) negative ion mode, urine
Figure S3. Fragmentation tree obtained in SIRIUS 4.7.4. for the precursor ion m/z 220.1543 (ESI+)
Figure S4. Fragmentation tree obtained in SIRIUS 4.7.4 for the precursor ion m/z 597.3382 (ESI+)
Figure S5. Fragmentation tree obtained in SIRIUS 4.7.4. for the precursor ion m/z 421.3061 (ESI+)
Figure S6. LC chromatograms of (a) m/z 597.3382 before enzymatic hydrolysis, (b) m/z 421.3061 before enzymatic hydrolysis, (c) m/z 597.3382 after enzymatic hydrolysis and (d) m/z 421.3061 after enzymatic hydrolysis
Figure S7. Formation of metabolites of solanidine by a panel of recombinant human cytochrome P450s and HLM. Results are expressed as the mean ± SD from two independent experiments.
Figure S8. LC chromatograms of solanidine, m/z 416.3159, m/z 432.3108, m/z 444.3108 and m/z 414.3366 after in vitro incubation of solanidine with recombinant CYP2D6, as well as in plasma and in urine
Figure S9. Log (area/creatinine) or log (area) at baseline (control session) and after inhibition by paroxetine (inhibition session) in poor metabolizer subjects (n = 5). On each side means values and standard deviations.
ACKNOWLEDGEMENTS
The authors would like to thank the Clinical Research Center of Geneva University Hospital and the Genomics Platform of iGE3 for helpful contribution. This work was supported by the Development and Research Project of the Medical Direction of the Geneva University Hospitals. Open Access Funding provided by Universite de Geneve.
Magliocco, G. , Desmeules, J. , Matthey, A. , Quirós‐Guerrero, L. M. , Bararpour, N. , Joye, T. , Marcourt, L. , Queiroz, E. F. , Wolfender, J.‐L. , Gloor, Y. , Thomas, A. , & Daali, Y. (2021). Metabolomics reveals biomarkers in human urine and plasma to predict cytochrome P450 2D6 (CYP2D6) activity. British Journal of Pharmacology, 178(23), 4708–4725. 10.1111/bph.15651
Aurélien Thomas and Youssef Daali are co‐last authors.
Funding information Geneva University Hospitals
DATA AVAILABILITY STATEMENT
The data that support the findings of this study are available from the corresponding author upon reasonable request. Some data may not be made available because of privacy or ethical restrictions.
REFERENCES
- Alexander, S. P. H. , Fabbro, D. , Kelly, E. , Mathie, A. , Peters, J. A. , Veale, E. L. , Armstrong, J. F. , Faccenda, E. , Harding, S. D. , Pawson, A. J. , Sharman, J. L. , Southan, C. , Davies, J. A. , & CGTP Collaborators (2019). The Concise Guide to PHARMACOLOGY 2019/20: Enzymes. British Journal of Pharmacology, 176, S297–S396. 10.1111/bph.14752 [DOI] [PMC free article] [PubMed] [Google Scholar]
- Alonso, A. , Marsal, S. , & Julià, A. (2015). Analytical methods in untargeted metabolomics: State of the art in 2015. Frontiers in Bioengineering and Biotechnology, 3, 23. 10.3389/fbioe.2015.00023 [DOI] [PMC free article] [PubMed] [Google Scholar]
- Beger, R. D. , Dunn, W. , Schmidt, M. A. , Gross, S. S. , Kirwan, J. A. , Cascante, M. , Brennan, L. , Wishart, D. S. , Oresic, M. , Hankemeier, T. , & Broadhurst, D. I. (2016). Metabolomics enables precision medicine: ‘A white paper, community perspective’. Metabolomics, 12, 149. 10.1007/s11306-016-1094-6 [DOI] [PMC free article] [PubMed] [Google Scholar]
- Blaženović, I. , Kind, T. , Ji, J. , & Fiehn, O. (2018). Software tools and approaches for compound identification of LC‐MS/MS data in metabolomics. Metabolites, 8, 31. 10.3390/metabo8020031 [DOI] [PMC free article] [PubMed] [Google Scholar]
- Chen, L. , Zhong, F. , & Zhu, J. (2020). Bridging targeted and untargeted mass spectrometry‐based metabolomics via hybrid approaches. Metabolites, 10, 348. 10.3390/metabo10090348 [DOI] [PMC free article] [PubMed] [Google Scholar]
- Claringbold, W. D. , Few, J. D. , & Renwick, J. H. (1982). Kinetics and retention of solanidine in man. Xenobiotica, 12, 293–302. 10.3109/00498258209052469 [DOI] [PubMed] [Google Scholar]
- Crews, K. R. , Gaedigk, A. , Dunnenberger, H. M. , Leeder, J. S. , Klein, T. E. , Caudle, K. E. , Haidar, C. E. , Shen, D. D. , Callaghan, J. T. , Sadhasivam, S. , Prows, C. A. , Kharasch, E. D. , Skaar, T. C. , & Clinical Pharmacogenetics Implementation Consortium . (2014). Clinical Pharmacogenetics Implementation Consortium guidelines for cytochrome P450 2D6 genotype and codeine therapy: 2014 update. Clinical Pharmacology and Therapeutics, 95, 376–382. 10.1038/clpt.2013.254 [DOI] [PMC free article] [PubMed] [Google Scholar]
- Curtis, M. J. , Alexander, S. , Cirino, G. , Docherty, J. R. , George, C. H. , Giembycz, M. A. , Hoyer, D. , Insel, P. A. , Izzo, A. A. , Ji, Y. , MacEwan, D. J. , Sobey, C. G. , Stanford, S. C. , Teixeira, M. M. , Wonnacott, S. , & Ahluwalia, A. (2018). Experimental design and analysis and their reporting II: Updated and simplified guidance for authors and peer reviewers. British Journal of Pharmacology, 175, 987–993. 10.1111/bph.14153 [DOI] [PMC free article] [PubMed] [Google Scholar]
- Daali, Y. , Cherkaoui, S. , Doffey‐Lazeyras, F. , Dayer, P. , & Desmeules, J. A. (2008). Development and validation of a chemical hydrolysis method for dextromethorphan and dextrophan determination in urine samples: Application to the assessment of CYP2D6 activity in fibromyalgia patients. Journal of Chromatography B, 861, 56–63. 10.1016/j.jchromb.2007.11.019 [DOI] [PubMed] [Google Scholar]
- Dias, D. A. , Jones, O. A. H. , Beale, D. J. , Boughton, B. A. , Benheim, D. , Kouremenos, K. A. , Wolfender, J. L. , & Wishart, D. S. (2016). Current and future perspectives on the structural identification of small molecules in biological systems. Metabolites, 6, 46. 10.3390/metabo6040046 [DOI] [PMC free article] [PubMed] [Google Scholar]
- Dührkop, K. , Fleischauer, M. , Ludwig, M. , Aksenov, A. A. , Melnik, A. V. , Meusel, M. , Dorrestein, P. C. , Rousu, J. , & Böcker, S. (2019). SIRIUS 4: A rapid tool for turning tandem mass spectra into metabolite structure information. Nature Methods, 16, 299–302. 10.1038/s41592-019-0344-8 [DOI] [PubMed] [Google Scholar]
- Dührkop, K. , Nothias, L.‐F. , Fleischauer, M. , Reher, R. , Ludwig, M. , Hoffmann, M. A. , Petras, D. , Gerwick, W. H. , Rousu, J. , Dorrestein, P. C. , & Böcker, S. (2021). Systematic classification of unknown metabolites using high‐resolution fragmentation mass spectra. Nature Biotechnology, 39, 462–471. 10.1038/s41587-020-0740-8 [DOI] [PubMed] [Google Scholar]
- Farrell, E. K. , & Merkler, D. J. (2008). Biosynthesis, degradation, and pharmacological importance of the fatty acid amides. Drug Discovery Today, 13, 558–568. 10.1016/j.drudis.2008.02.006 [DOI] [PMC free article] [PubMed] [Google Scholar]
- Fernández‐Peralbo, M. A. , & Luque de Castro, M. D. (2012). Preparation of urine samples prior to targeted or untargeted metabolomics mass‐spectrometry analysis. TrAC Trends in Analytical Chemistry, 41, 75–85. 10.1016/j.trac.2012.08.011 [DOI] [Google Scholar]
- Forchelet, D. , Béguin, S. , Sajic, T. , Bararpour, N. , Pataky, Z. , Frias, M. , Grabherr, S. , Augsburger, M. , Liu, Y. , Charnley, M. , Déglon, J. , Aebersold, R. , Thomas, A. , & Renaud, P. (2018). Separation of blood microsamples by exploiting sedimentation at the microscale. Scientific Reports, 8, 14101. 10.1038/s41598-018-32314-4 [DOI] [PMC free article] [PubMed] [Google Scholar]
- Gaedigk, A. (2013). Complexities of CYP2D6 gene analysis and interpretation. International Review of Psychiatry, 25, 534–553. 10.3109/09540261.2013.825581 [DOI] [PubMed] [Google Scholar]
- Gaedigk, A. , Dinh, J. C. , Jeong, H. , Prasad, B. , & Leeder, J. S. (2018). Ten years' experience with the CYP2D6 activity score: A perspective on future investigations to improve clinical predictions for precision therapeutics. Journal of Personalized Medicine, 8, 15. 10.3390/jpm8020015 [DOI] [PMC free article] [PubMed] [Google Scholar]
- Gaedigk, A. , Simon, S. D. , Pearce, R. E. , Bradford, L. D. , Kennedy, M. J. , & Leeder, J. S. (2008). The CYP2D6 activity score: Translating genotype information into a qualitative measure of phenotype. Clinical Pharmacology and Therapeutics, 83, 234–242. 10.1038/sj.clpt.6100406 [DOI] [PubMed] [Google Scholar]
- Gómez‐Lechón, M. J. , Donato, M. T. , Castell, J. V. , & Jover, R. (2003). Human hepatocytes as a tool for studying toxicity and drug metabolism. Current Drug Metabolism, 4, 292–312. 10.2174/1389200033489424 [DOI] [PubMed] [Google Scholar]
- Gravel, S. , Chiasson, J.‐L. , Gaudette, F. , Turgeon, J. , & Michaud, V. (2019). Use of 4β‐hydroxycholesterol plasma concentrations as an endogenous biomarker of CYP3A activity: Clinical validation in individuals with type 2 diabetes. Clinical Pharmacology and Therapeutics, 106, 831–840. 10.1002/cpt.1472 [DOI] [PubMed] [Google Scholar]
- Harvey, M. H. , McMillan, M. , Morgan, M. R. , & Chan, H. W. (1985). Solanidine is present in sera of healthy individuals and in amounts dependent on their dietary potato consumption. Human Toxicology, 4, 187–194. 10.1177/096032718500400209 [DOI] [PubMed] [Google Scholar]
- Hicks, J. K. , Bishop, J. R. , Sangkuhl, K. , Müller, D. J. , Ji, Y. , Leckband, S. G. , Leeder, J. S. , Graham, R. L. , Chiulli, D. L. , LLerena, A. , Skaar, T. C. , Scott, S. A. , Stingl, J. C. , Klein, T. E. , Caudle, K. E. , Gaedigk, A. , & Clinical Pharmacogenetics Implementation Consortium . (2015). Clinical Pharmacogenetics Implementation Consortium (CPIC) guideline for CYP2D6 and CYP2C19 genotypes and dosing of selective serotonin reuptake inhibitors. Clinical Pharmacology and Therapeutics, 98, 127–134. 10.1002/cpt.147 [DOI] [PMC free article] [PubMed] [Google Scholar]
- Hu, O. Y. , Tang, H. S. , Lane, H. Y. , Chang, W. H. , & Hu, T. M. (1998). Novel single‐point plasma or saliva dextromethorphan method for determining CYP2D6 activity. The Journal of Pharmacology and Experimental Therapeutics, 285, 955–960. [PubMed] [Google Scholar]
- Ingelman‐Sundberg, M. (2005). Genetic polymorphisms of cytochrome P450 2D6 (CYP2D6): Clinical consequences, evolutionary aspects and functional diversity. The Pharmacogenomics Journal, 5, 6–13. 10.1038/sj.tpj.6500285 [DOI] [PubMed] [Google Scholar]
- Ivanisevic, J. , & Thomas, A. (2018). Metabolomics as a tool to understand pathophysiological processes. In Clinical metabolomics (Vol. 1730) (pp. 3–28). Humana Press. [DOI] [PubMed] [Google Scholar]
- Jensen, B. C. , Parry, T. L. , Huang, W. , Beak, J. Y. , Ilaiwy, A. , Bain, J. R. , Newgard, C. B. , Muehlbauer, M. J. , Patterson, C. , Johnson, G. L. , & Willis, M. S. (2017). Effects of the kinase inhibitor sorafenib on heart, muscle, liver and plasma metabolism in vivo using non‐targeted metabolomics analysis. British Journal of Pharmacology, 174, 4797–4811. 10.1111/bph.14062 [DOI] [PMC free article] [PubMed] [Google Scholar]
- Kaddurah‐Daouk, R. , Weinshilboum, R. M. , & Pharmacometabolomics Research Network . (2014). Pharmacometabolomics: Implications for clinical pharmacology and systems pharmacology. Clinical Pharmacology and Therapeutics, 95, 154–167. 10.1038/clpt.2013.217 [DOI] [PubMed] [Google Scholar]
- Kasichayanula, S. , Boulton, D. W. , Luo, W.‐L. , Rodrigues, A. D. , Yang, Z. , Goodenough, A. , Lee, M. , Jemal, M. , & LaCreta, F. (2014). Validation of 4β‐hydroxycholesterol and evaluation of other endogenous biomarkers for the assessment of CYP3A activity in healthy subjects. British Journal of Clinical Pharmacology, 78, 1122–1134. 10.1111/bcp.12425 [DOI] [PMC free article] [PubMed] [Google Scholar]
- Kim, B. , Lee, J. , Shin, K.‐H. , Lee, S. , Yu, K.‐S. , Jang, I.‐J. , & Cho, J. Y. (2018). Identification of ω‐ or (ω‐1)‐hydroxylated medium‐chain acylcarnitines as novel urinary biomarkers for CYP3A activity. Clinical Pharmacology and Therapeutics, 103, 879–887. 10.1002/cpt.856 [DOI] [PubMed] [Google Scholar]
- Kohler, I. , Hankemeier, T. , van der Graaf, P. H. , Knibbe, C. A. J. , & van Hasselt, J. G. C. (2017). Integrating clinical metabolomics‐based biomarker discovery and clinical pharmacology to enable precision medicine. European Journal of Pharmaceutical Sciences, 109S, S15–S21. 10.1016/j.ejps.2017.05.018 [DOI] [PubMed] [Google Scholar]
- Kowalczuk, L. , Matet, A. , Dor, M. , Bararpour, N. , Daruich, A. , Dirani, A. , Behar‐Cohen, F. , Thomas, A. , & Turck, N. (2018). Proteome and metabolome of subretinal fluid in central serous chorioretinopathy and rhegmatogenous retinal detachment: A pilot case study. Translational Vision Science & Technology, 7, 3. 10.1167/tvst.7.1.3 [DOI] [PMC free article] [PubMed] [Google Scholar]
- Langaee, T. , Hamadeh, I. , Chapman, A. B. , Gums, J. G. , & Johnson, J. A. (2015). A novel simple method for determining CYP2D6 gene copy number and identifying allele(s) with duplication/multiplication. PLoS ONE, 10, e0113808. 10.1371/journal.pone.0113808 [DOI] [PMC free article] [PubMed] [Google Scholar]
- Lyu, C. , Zhou, W. , Zhang, Y. , Zhang, S. , Kou, F. , Wei, H. , Zhang, N. , & Zuo, Z. (2015). Identification and characterization of in vitro and in vivo metabolites of steroidal alkaloid veratramine. Biopharmaceutics & Drug Disposition, 36, 308–324. 10.1002/bdd.1942 [DOI] [PubMed] [Google Scholar]
- Magliocco, G. , & Daali, Y. (2020). Modern approaches for the phenotyping of cytochrome P450 enzymes in children. Expert Review of Clinical Pharmacology, 13, 671–674. 10.1080/17512433.2020.1779057 [DOI] [PubMed] [Google Scholar]
- Magliocco, G. , Thomas, A. , Desmeules, J. , & Daali, Y. (2019). Phenotyping of human CYP450 enzymes by endobiotics: Current knowledge and methodological approaches. Clinical Pharmacokinetics, 58, 1373–1391. 10.1007/s40262-019-00783-z [DOI] [PubMed] [Google Scholar]
- Mensinga, T. T. , Sips, A. J. A. M. , Rompelberg, C. J. M. , van Twillert, K. , Meulenbelt, J. , van den Top, H. J. , & van Egmond, H. P. (2005). Potato glycoalkaloids and adverse effects in humans: An ascending dose study. Regulatory Toxicology and Pharmacology, 41, 66–72. 10.1016/j.yrtph.2004.09.004 [DOI] [PubMed] [Google Scholar]
- Nofziger, C. , Turner, A. J. , Sangkuhl, K. , Whirl‐Carrillo, M. , Agúndez, J. A. G. , Black, J. L. , Dunnenberger, H. M. , Ruano, G. , Kennedy, M. A. , Phillips, M. S. , Hachad, H. , Klein, T. E. , & Gaedigk, A. (2020). PharmVar GeneFocus: CYP2D6. Clinical Pharmacology and Therapeutics, 107, 154–170. 10.1002/cpt.1643 [DOI] [PMC free article] [PubMed] [Google Scholar]
- Pang, H. , Jia, W. , & Hu, Z. (2019). Emerging applications of metabolomics in clinical pharmacology. Clinical Pharmacology and Therapeutics, 106, 544–556. 10.1002/cpt.1538 [DOI] [PubMed] [Google Scholar]
- Roberts, L. D. , Souza, A. L. , Gerszten, R. E. , & Clish, C. B. (2012). Targeted metabolomics. Current Protocols in Molecular Biology, 98(1), 30–32. 10.1002/0471142727.mb3002s98 [DOI] [PMC free article] [PubMed] [Google Scholar]
- Samer, C. F. , Lorenzini, K. I. , Rollason, V. , Daali, Y. , & Desmeules, J. A. (2013). Applications of CYP450 testing in the clinical setting. Molecular Diagnosis & Therapy, 17, 165–184. 10.1007/s40291-013-0028-5 [DOI] [PMC free article] [PubMed] [Google Scholar]
- Schmidt, L. , Müller, J. , & Göen, T. (2013). Simultaneous monitoring of seven phenolic metabolites of endocrine disrupting compounds (EDC) in human urine using gas chromatography with tandem mass spectrometry. Analytical and Bioanalytical Chemistry, 405, 2019–2029. 10.1007/s00216-012-6618-y [DOI] [PubMed] [Google Scholar]
- Schrimpe‐Rutledge, A. C. , Codreanu, S. G. , Sherrod, S. D. , & McLean, J. A. (2016). Untargeted metabolomics strategies‐challenges and emerging directions. Journal of the American Society for Mass Spectrometry, 27, 1897–1905. 10.1007/s13361-016-1469-y [DOI] [PMC free article] [PubMed] [Google Scholar]
- Shah, J. , Brock, G. N. , & Gaskins, J. (2019). BayesMetab: Treatment of missing values in metabolomic studies using a Bayesian modeling approach. BMC Bioinformatics, 20, 673. 10.1186/s12859-019-3250-2 [DOI] [PMC free article] [PubMed] [Google Scholar]
- Shah, R. R. , Gaedigk, A. , LLerena, A. , Eichelbaum, M. , Stingl, J. , & Smith, R. L. (2016). CYP450 genotype and pharmacogenetic association studies: A critical appraisal. Pharmacogenomics, 17, 259–275. 10.2217/pgs.15.172 [DOI] [PubMed] [Google Scholar]
- Shakya, R. , & Navarre, D. A. (2008). LC‐MS analysis of solanidane glycoalkaloid diversity among tubers of four wild potato species and three cultivars (Solanum tuberosum). Journal of Agricultural and Food Chemistry, 56, 6949–6958. 10.1021/jf8006618 [DOI] [PubMed] [Google Scholar]
- Snider, N. T. , Sikora, M. J. , Sridar, C. , Feuerstein, T. J. , Rae, J. M. , & Hollenberg, P. F. (2008). The endocannabinoid anandamide is a substrate for the human polymorphic cytochrome P450 2D6. The Journal of Pharmacology and Experimental Therapeutics, 327, 538–545. 10.1124/jpet.108.141796 [DOI] [PMC free article] [PubMed] [Google Scholar]
- Storelli, F. , Desmeules, J. , & Daali, Y. (2019). Genotype‐sensitive reversible and time‐dependent CYP2D6 inhibition in human liver microsomes. Basic & Clinical Pharmacology & Toxicology, 124, 170–180. 10.1111/bcpt.13124 [DOI] [PubMed] [Google Scholar]
- Taylor, S. L. , Leiserowitz, G. S. , & Kim, K. (2013). Accounting for undetected compounds in statistical analyses of mass spectrometry 'omic studies. Statistical Applications in Genetics and Molecular Biology, 12, 703–722. 10.1515/sagmb-2013-0021 [DOI] [PMC free article] [PubMed] [Google Scholar]
- Tay‐Sontheimer, J. , Shireman, L. M. , Beyer, R. P. , Senn, T. , Witten, D. , Pearce, R. E. , Gaedigk, A. , Gana Fomban, C. L. , Lutz, J. D. , Isoherranen, N. , Thummel, K. E. , Fiehn, O. , Leeder, J. S. , & Lin, Y. S. (2014). Detection of an endogenous urinary biomarker associated with CYP2D6 activity using global metabolomics. Pharmacogenomics, 15, 1947–1962. 10.2217/pgs.14.155 [DOI] [PMC free article] [PubMed] [Google Scholar]
- Villaseñor, A. , Ramamoorthy, A. , Silva dos Santos, M. , Lorenzo, M. P. , Laje, G. , Zarate, C. , Barbas, C. , & Wainer, I. W. (2014). A pilot study of plasma metabolomic patterns from patients treated with ketamine for bipolar depression: Evidence for a response‐related difference in mitochondrial networks. British Journal of Pharmacology, 171, 2230–2242. 10.1111/bph.12494 [DOI] [PMC free article] [PubMed] [Google Scholar]
- Vuckovic, D. (2012). Current trends and challenges in sample preparation for global metabolomics using liquid chromatography–mass spectrometry. Analytical and Bioanalytical Chemistry, 403, 1523–1548. 10.1007/s00216-012-6039-y [DOI] [PubMed] [Google Scholar]
- Wake, D. T. , Ilbawi, N. , Dunnenberger, H. M. , & Hulick, P. J. (2019). Pharmacogenomics: Prescribing precisely. The Medical Clinics of North America, 103, 977–990. 10.1016/j.mcna.2019.07.002 [DOI] [PubMed] [Google Scholar]
- Wawrzyniak, R. , Kosnowska, A. , Macioszek, S. , Bartoszewski, R. , & Jan Markuszewski, M. (2018). New plasma preparation approach to enrich metabolome coverage in untargeted metabolomics: Plasma protein bound hydrophobic metabolite release with proteinase K. Scientific Reports, 8, 9541. 10.1038/s41598-018-27983-0 [DOI] [PMC free article] [PubMed] [Google Scholar]
- Whiley, L. , Chekmeneva, E. , Berry, D. J. , Jiménez, B. , Yuen, A. H. Y. , Salam, A. , Hussain, H. , Witt, M. , Takats, Z. , Nicholson, J. , & Lewis, M. R. (2019). Systematic isolation and structure elucidation of urinary metabolites optimized for the analytical‐scale molecular profiling laboratory. Analytical Chemistry, 91, 8873–8882. 10.1021/acs.analchem.9b00241 [DOI] [PMC free article] [PubMed] [Google Scholar]
- Wu, Q. , Xu, Y. , Ji, H. , Wang, Y. , Zhang, Z. , & Lu, H. (2019). Enhancing coverage in LC–MS‐based untargeted metabolomics by a new sample preparation procedure using mixed‐mode solid‐phase extraction and two derivatizations. Analytical and Bioanalytical Chemistry, 411, 6189–6202. 10.1007/s00216-019-02010-x [DOI] [PubMed] [Google Scholar]
- Xia, J. , & Wishart, D. S. (2011). Web‐based inference of biological patterns, functions and pathways from metabolomic data using MetaboAnalyst. Nature Protocols, 6, 743–760. 10.1038/nprot.2011.319 [DOI] [PubMed] [Google Scholar]
- Yeung, P. K. (2018). Metabolomics and biomarkers for drug discovery. Metabolites, 8, 11. 10.3390/metabo8010011 [DOI] [PMC free article] [PubMed] [Google Scholar]
- Zhang, H. , Basit, A. , Wolford, C. , Chen, K.‐F. , Gaedigk, A. , Lin, Y. S. , Leeder, J. S. , & Prasad, B. (2020). Normalized testosterone glucuronide as a potential urinary biomarker for highly variable UGT2B17 in children 7–18 years. Clinical Pharmacology and Therapeutics, 107, 1149–1158. 10.1002/cpt.1764 [DOI] [PMC free article] [PubMed] [Google Scholar]
- Zhou, X. , Gao, Q. , Praticò, G. , Chen, J. , & Dragsted, L. O. (2019). Biomarkers of tuber intake. Genes & Nutrition, 14, 9. 10.1186/s12263-019-0631-0 [DOI] [PMC free article] [PubMed] [Google Scholar]
Associated Data
This section collects any data citations, data availability statements, or supplementary materials included in this article.
Supplementary Materials
Table S1. CYP2D6 genotype distribution in the study population
Table S2. MS parameters in PRM mode and retention times of the target analytes
Figure S1. 4‐hour dextrorphan/dextromethorphan individual urinary metabolic ratios (UMRDOR/DEM) at baseline (control session) and after inhibition by paroxetine (inhibition session), following intake of dextromethorphan 5 mg per os (P < 0.05). Ultrarapid metabolizers (gAS > 2, n = 4) are shown in red and extensive metabolizers (1 ≤ gAS ≤ 2, n = 33) in blue. Error bars represent the standard deviations of log‐transformed UMRDOR/DEM.
Figure S2. Principal component analysis score plots of the quality control samples, control session samples and inhibition session samples in (a) positive ion mode, plasma (b) negative ion mode, plasma (c) positive ion mode, urine and (d) negative ion mode, urine
Figure S3. Fragmentation tree obtained in SIRIUS 4.7.4. for the precursor ion m/z 220.1543 (ESI+)
Figure S4. Fragmentation tree obtained in SIRIUS 4.7.4 for the precursor ion m/z 597.3382 (ESI+)
Figure S5. Fragmentation tree obtained in SIRIUS 4.7.4. for the precursor ion m/z 421.3061 (ESI+)
Figure S6. LC chromatograms of (a) m/z 597.3382 before enzymatic hydrolysis, (b) m/z 421.3061 before enzymatic hydrolysis, (c) m/z 597.3382 after enzymatic hydrolysis and (d) m/z 421.3061 after enzymatic hydrolysis
Figure S7. Formation of metabolites of solanidine by a panel of recombinant human cytochrome P450s and HLM. Results are expressed as the mean ± SD from two independent experiments.
Figure S8. LC chromatograms of solanidine, m/z 416.3159, m/z 432.3108, m/z 444.3108 and m/z 414.3366 after in vitro incubation of solanidine with recombinant CYP2D6, as well as in plasma and in urine
Figure S9. Log (area/creatinine) or log (area) at baseline (control session) and after inhibition by paroxetine (inhibition session) in poor metabolizer subjects (n = 5). On each side means values and standard deviations.
Data Availability Statement
The data that support the findings of this study are available from the corresponding author upon reasonable request. Some data may not be made available because of privacy or ethical restrictions.