Abstract
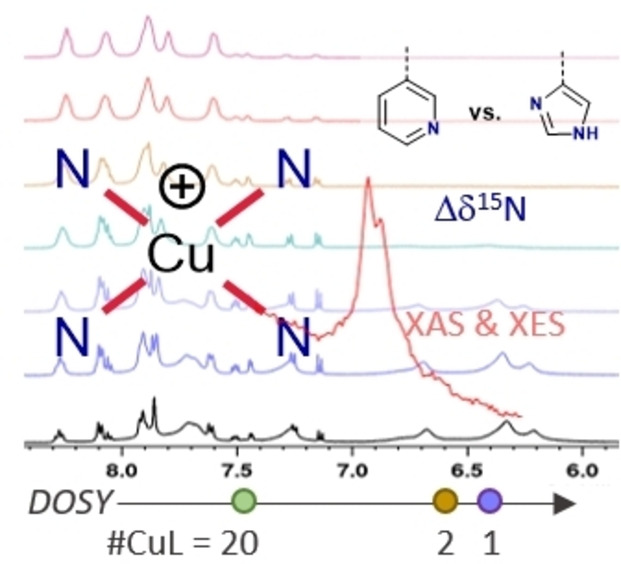
A series of Cu(I) complexes of bidentate or tetradentate Schiff base ligands bearing either 1‐H‐imidazole or pyridine moieties were synthesized. The complexes were studied by a combination of NMR and X‐ray spectroscopic techniques. The differences between the imidazole‐ and pyridine‐based ligands were examined by 1H, 13C and 15N NMR spectroscopy. The magnitude of the 15Nimine coordination shifts was found to be strongly affected by the nature of the heterocycle in the complexes. These trends showed good correlation with the obtained Cu−Nimine bond lengths from single‐crystal X‐ray diffraction measurements. Variable‐temperature NMR experiments, in combination with diffusion ordered spectroscopy (DOSY) revealed that one of the complexes underwent a temperature‐dependent interconversion between a monomer, a dimer and a higher aggregate. The complexes bearing tetradentate imidazole ligands were further studied using Cu K‐edge XAS and VtC XES, where DFT‐assisted assignment of spectral features suggested that these complexes may form polynuclear oligomers in solid state. Additionally, the Cu(II) analogue of one of the complexes was incorporated into a metal‐organic framework (MOF) as a way to obtain discrete, mononuclear complexes in the solid state.
Keywords: Aggregation, Copper, NMR spectroscopy, X-ray absorption spectroscopy, X-ray emission spectroscopy
A series of N,N,N,N Cu(I) Schiff base complexes was studied by NMR and X‐ray spectroscopic techniques. In solution, the aggregation behaviour was investigated by DOSY and variable‐temperature NMR. 15N NMR studies shed light on the Cu−N interactions in the complexes. XAS and XES, supported by DFT calculations, highlighted the complexes’ tendencies to form polynuclear species in the solid state.
Introduction
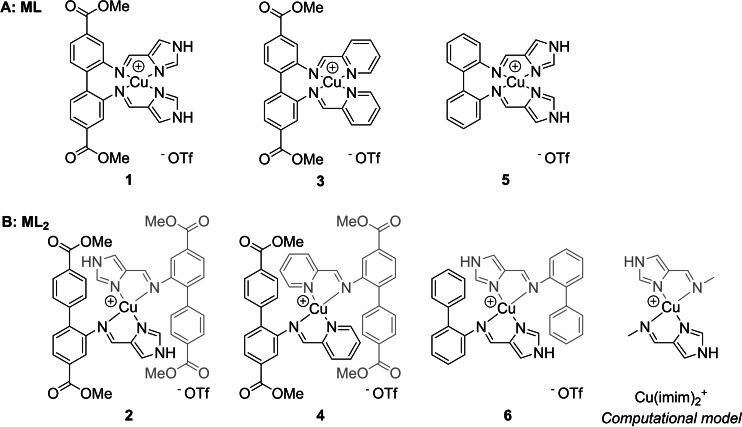
Nitrogen‐ligated copper complexes have been developed for a multitude of catalytic applications, ranging from water splitting[ 1 , 2 , 3 ] to C−X bond formation,[ 4 , 5 ] C−H activation,[ 6 , 7 , 8 , 9 , 10 , 11 ] and selective oxidations.[ 12 , 13 , 14 , 15 , 16 ] Enzymes with copper as a cofactor often combine the two latter aims and have inspired chemists to generate complexes with design elements taken from the active site of the enzyme. In this context, the histidine copper brace, a structural motif found in monooxygenases,[ 17 , 18 , 19 , 20 , 21 ] has stood model for a range of complexes with aliphatic amines, amides or imines combined with heterocycles in the ligand.[ 22 , 23 , 24 , 25 , 26 , 27 ] The majority of bioinspired copper complexes are Cu(II) species,[ 23 , 26 , 28 , 29 , 30 ] while there are fewer examples in the Cu(I) oxidation state.[ 24 , 27 , 31 ] As Cu(I) complexes are closed‐shell d10 species, the ligand field stabilization energy cannot dictate particularly favourable coordination environments for Cu(I), as it is the case for the cupric state. [32] In addition, heterocyclic copper complexes are prone to form assemblies – from simple dimers [33] to polynuclear aggregates[ 34 , 35 ] or even metal‐organic frameworks (MOFs).[ 36 , 37 ] Polynuclear oligomers have been described and studied for copper complexes of multidentate imidazole[ 38 , 39 , 40 ] or pyridine [41] ligands. The diverse coordination numbers and geometries of Cu(I) species often demand a combination of spectroscopic and theoretical tools to describe their binding mode. [42] Given that oxidation is prevented, Cu(I) complexes are readily studied in solution by NMR, unlike their paramagnetic Cu(II) analogues. A particularly powerful NMR tool to evaluate coordination complexes bearing nitrogen ligands are 15N coordination shifts; yet, they have been scarcely applied to copper compounds.[ 43 , 44 ] Although both stable isotopes of copper are NMR active nuclei, the applicability of both 63Cu and 65Cu NMR to copper complexes is limited to either highly symmetric complexes or CO‐ligated species due to the extremely broad resonances for other types of complexes.[ 45 , 46 ] Other element‐specific techniques, namely X‐ray absorption (XAS) and emission (XES) spectroscopy, [47] are better‐suited to observe the coordination centre through copper. Combined, they become particularly powerful to identify key structural features of the complexes under study. To complement, density functional theory (DFT) calculations are presented to bring an in‐depth assignment of spectral features in X‐ray absorption and emission. In this article, we present the synthesis and characterisation of new copper(I) complexes bearing either bidentate N,N Schiff base ligands or tetradentate N,N,N,N Schiff base ligands (Figure 1). The heterocycle (either imidazole or pyridine) is connected to the biphenyl backbone through an imine – creating a 1,4‐relationship between the coordinating nitrogen atoms. The biphenyl moiety of the complexes introduces a versatile backbone to tune the steric and electronic attributes of the system by established methods of organic chemistry. Notably, it introduces a possible anchor point for immobilization without strongly restraining the coordination geometry around the copper centre. Four of the herein reported complexes bear protected linker moieties in the form of methyl esters. The corresponding acids can function as linkers in metal‐organic frameworks. Through the right choice of incorporation strategy, it can be ensured that isolated copper sites are created. Thereby MOF incorporation offers a pathway to circumvent the aforementioned aggregation, a common phenomenon for both, copper(I) and copper(II) complexes. We demonstrate the feasibility of MOF incorporation by post‐synthetic linker modification for the copper(II) analogue of one of the complexes.
Figure 1.
Synthesized copper(I) complexes 1–6 and the computational model Cu(imim)2 +. A: Complexes of the type ML bearing tetradentate ligands. B: Homoleptic ML2 complexes with bidentate ligands.
The solution behaviour of the complexes was studied by a combination of NMR techniques, namely 15N NMR, diffusion ordered spectroscopy (DOSY) and variable temperature experiments. The findings on the copper ligation in solution were compared to those obtained from X‐Ray characterisation of the solid state (single crystal XRD, XAS and XES). Finally, a DFT‐assisted interpretation of the XAS and XES spectral features provides insight into the geometry around copper. Taken together the combined NMR, XRD and X‐ray spectroscopic studies highlight the complexity of polynuclear Cu(I) structures in both solid and solution states. The incorporation of the Cu(II)‐analogue of one of these complexes into a MOF provides a clear future strategy for studying copper chemistry free of the complex aggregation behaviour reported herein.
Results and Discussion
Synthesis of Cu(I) Complexes
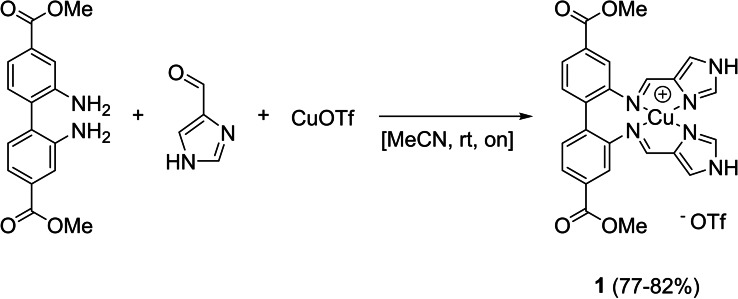
An obvious approach to obtain target 1 was to synthesize the ligand and subsequently metalate it with a Cu(I) salt. In literature, similar complexes have either been made by ligand synthesis and subsequent metalation,[ 48 , 49 , 50 ] or a one‐pot synthesis.[ 51 , 52 , 53 ] Synthesizing the ligand for 1 by acid‐catalysed condensation of 1H‐imidazole‐4‐carbaldehyde with dimethyl 2,2’‐diaminobiphenyl‐4,4’‐dicarboxylate resulted in poor yields. Therefore, condensation and metalation were attempted in one step (see Scheme 1), providing complex 1. The synthesis is an overnight reaction at ambient temperature in acetonitrile, followed by a minimalistic work‐up (filtration of the precipitated product). Complex 1 was isolated in good yields and high purity.
Scheme 1.
Synthesis of complex 1.
The complex was characterized by NMR, HRMS and elemental analysis. The 1H NMR spectrum of 1 in d6 ‐DMSO shows six resonances in the aromatic region, each integrating for two protons. Additionally, there is one resonance at 13.35 ppm (imidazole NH, two protons) and one at 3.83 ppm (methyl group, six protons). The aldehyde and NH2 resonances found in the starting materials are absent and instead, a resonance consistent with an imine was observed (8.31 ppm), correlating to a carbon resonance at 154.5 ppm in an HSQC experiment. The synthesis method depicted in Scheme 1 was extended to five more copper(I) complexes (2–6) (Figure 1). For all of them, MS showed an m/z consistent with the complex cation charged +1. The complexes were isolated in high purities (demonstrated by elemental analysis) and in fair to good yields. The resulting tetracoordinated complexes can be divided into two groups. The first group (1, 3 and 5, Figure 1A) is of the type ML, where L is a tetradentate ligand. The other group (Figure 1B) consists of complexes 2, 4 and 6. Starting from 2‐aminobiphenyls, the formation of ML2 (L being a bidentate ligand) complexes was consistently observed by NMR, MS and elemental analysis. For compounds 2 and 4, single crystal structures showed the coordination of two bidentate ligands (Figure 7, Figure S71). The preferential formation of ML2 complexes has been reported before for bi‐ and tridentate ligands that coordinate through nitrogen to copper(I).[ 54 , 55 ]
Figure 7.
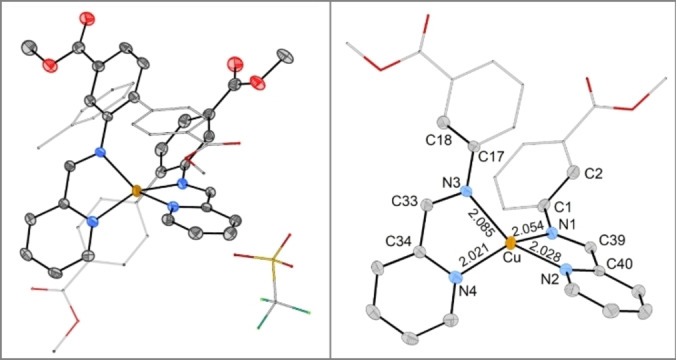
ORTEP plots of 4 (ellipsoids at 50 % probability). The asymmetric unit contains the complex cation, the non‐coordinating anion and a solvent molecule (toluene). Hydrogen atoms are omitted and parts of the structure are represented as sticks for clarity. Selected bond lengths: (Cu−N1: 2.054(2) Å; Cu−N2: 2.028(2) Å; Cu−N3: 2.085(2) Å; Cu−N4: 2.021(2) Å).
NMR Studies of Dynamic Solution Behaviour: Ligand Exchange and Aggregation
All complexes were fully characterized by NMR, albeit the solution behaviour of some caused intricate NMR spectra (see Figure 2). Intriguingly, the choice of solvent not only affected the resonances’ broadness and chemical shifts, but also the number of observable species (see below). Possible explanations for the solution behaviour are changes in ligation and/or conformation. Typical processes that induce ligation changes in copper(I) and other d10 species are solvent coordination, intermolecular ligand exchange and/or aggregation.[ 42 , 45 , 56 , 57 , 58 , 59 , 60 , 61 ] For reference purposes, the ligand of each complex was synthesized by adapting previously reported procedures for Schiff base ligands. [62]
Figure 2.
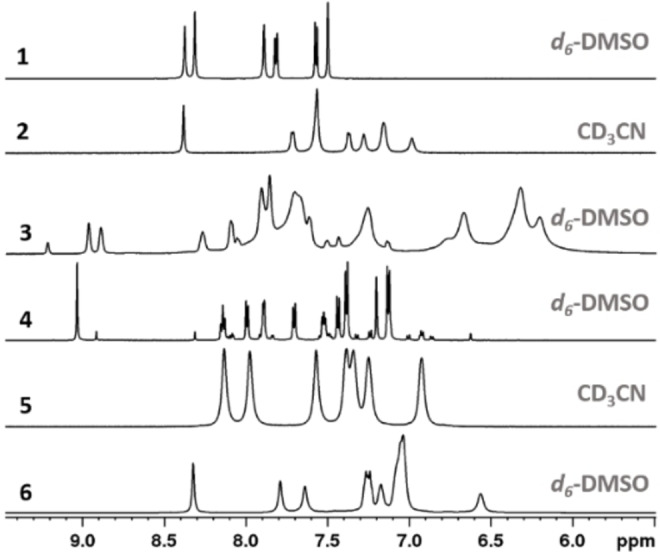
Aromatic region of the 1H NMR spectra (600 MHz, 25 °C) of the copper(I) complexes synthesized in this work.
Based on literature reports for similar ML2‐type complexes,[ 60 , 63 , 64 ] it seems likely that complexes 2, 4 and 6 are in equilibrium with an ML complex and the free ligand. However, the ligand of 4 could not be identified as (one of the) minor species in the 1H NMR spectrum of 4 in d6 ‐DMSO, while the observation of all three species (ML2, ML and free ligand) in the mass spectra of the ML2 complexes (see SI) supports the hypothesis. An NMR experiment on a sample containing both complex 2 and 4 did not only show the sum of both 1H NMR spectra, but also peaks belonging to neither parent complexes or their free ligands (see Figure S67). The formation of the new species was too fast to be followed by NMR. Cross peaks resulting from chemical exchange between these new proton signals and signals from the parent complexes were observed in the NOESY/EXSY spectrum of the mixture (see Figure S68). Based on these observations, we speculate that the new species might be a heteroleptic complex bearing one imidazole and one pyridine ligand. Concluding, ligand exchange is likely to occur, but it seems to be a rapid process on the NMR time scale that does not explain the observation of multiple species in the 1H NMR spectrum of 4 in d6 ‐DMSO.
The solution behaviour of 4 was further studied by variable temperature NMR (VT NMR). In order to lower the temperature without freezing the sample, the experiment was conducted in acetonitrile. The change of solvent altered the appearance of 4 at room temperature: Instead of multiple species, a single species with broadened peaks was observed (Figure 3, 25 °C). The sample was cooled down to −34 °C in increments of around 10 °C.
Figure 3.
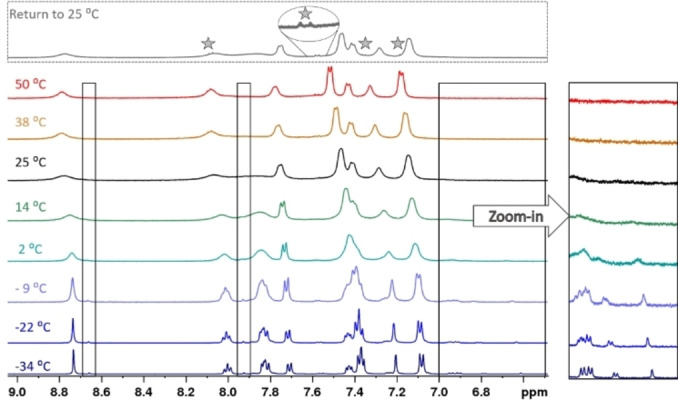
Aromatic region of the 1H NMR spectra of 4 at different temperatures (CD3CN, 500 MHz). Black boxes indicate some of the areas where the minor species is observable at low temperatures. The rightmost box is displayed with higher intensities for all spectra to improve visibility of the additional peaks. The top spectrum was recorded after the temperature experiment. It is largely consistent with the initial room temperature experiment, but traces of decomposition were observed (indicated by stars).
This resulted in narrower peaks and the evolution of additional peaks (boxes in Figure 3), similar to the room temperature measurement in d6 ‐DMSO. The species giving rise to the new peaks interconverts with the major species, as revealed by chemical exchange cross‐peaks in a NOESY/EXSY experiment (see Figures S26 and S30) conducted at the lowest temperature (−34 °C). These processes, which we were not able to identify unambiguously, were reversible: spectra acquired during step‐wise temperature increase were identical to those during the cool‐down process. Further temperature elevation above 25 °C led to peak narrowing, but minute signs of decomposition were observed. The decomposition peaks persisted upon return to room temperature (stars in the top spectrum in Figure 3). Identification of the decomposition product for 4 (and other complexes) can be found in the SI (Figure S65). Otherwise, the spectrum regained its initial appearance. In summary, ligand exchange seems to be only identifiable process for the observations made for 2, 4 and 6 in NMR.
The experiments discussed below on 1, 3 and 5 showed that for the ML complexes a different phenomenon causes their non‐trivial NMR spectra – the formation of polynuclear species. A VT NMR experiment was conducted on 3 in CD3CN, yielding spectra with severe line broadening at all temperatures (−34 °C to 50 °C, Figures S61 and S62). A separate VT NMR experiment was therefore conducted in d6 ‐DMSO (Figure 4), showing a temperature dependent equilibrium between three species at room temperature:
Figure 4.
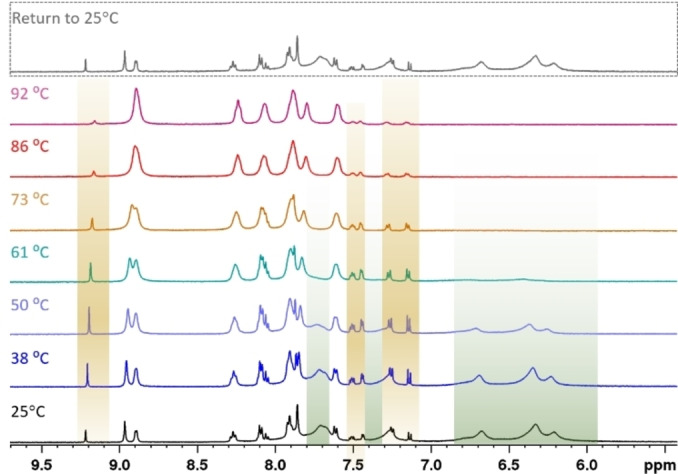
Aromatic region of the 1H NMR spectra of 3 at different temperatures (500 MHz, d6 ‐DMSO). At room temperature, three species are observable. Above 70 °C, the broad resonances of 3‐A have disappeared and only 3‐M and 3‐D remain. At the highest temperature, 3‐M dominates the spectrum. As the 25 °C spectrum after the temperature elevation (top spectrum) is equal to the initial 25 °C spectrum before the VT NMR experiment (bottom spectrum), the observed processes are reversible.
The room temperature spectrum featured two species with sharp resonances, of which the minor (3‐D) integrates roughly to a third of the major species (3‐M). Additionally, a species (3‐A) with severely broadened resonances and a considerable upfield shift is observable. In the interval from 25 °C to around 60 °C, the signal intensity of 3‐A (green highlights in Figure 4) decreases. The aggregates seem to mainly break up into dimers, as 3‐D‘s intensity gain (brown highlights in Figure 4) comes at the expense of the aggregate's intensity. As temperature is further increased, 3‐D is minimised again until the entropically favoured 3‐M dominates the spectrum at 90 °C. The changes were reversible and return to room temperature reproduced the initial room temperature spectrum. The assignment of the involved species was supported by a DOSY experiment (Figure 5), as the three species have different diffusion coefficients. 3‐M diffuses fastest, closely followed by 3‐D. On the other hand, 3‐A diffuses significantly slower. Evans et. al obtained good correlations between the molecular weight and the diffusion coefficients of small molecules without heavy atoms (not heavier than sulphur) by applying the Stokes‐Einstein‐Gierer‐Wirtz estimation (SEGWE).[ 65 , 66 ] Despite copper violating the requirement for light atoms, the diffusion coefficients calculated by this method support the assignment of monomeric and dimeric species for 3‐M and 3‐D (Figure 5). Furthermore, it allowed identifying 3‐A as higher aggregates with an estimated average composition of around twenty monomeric units.
Figure 5.
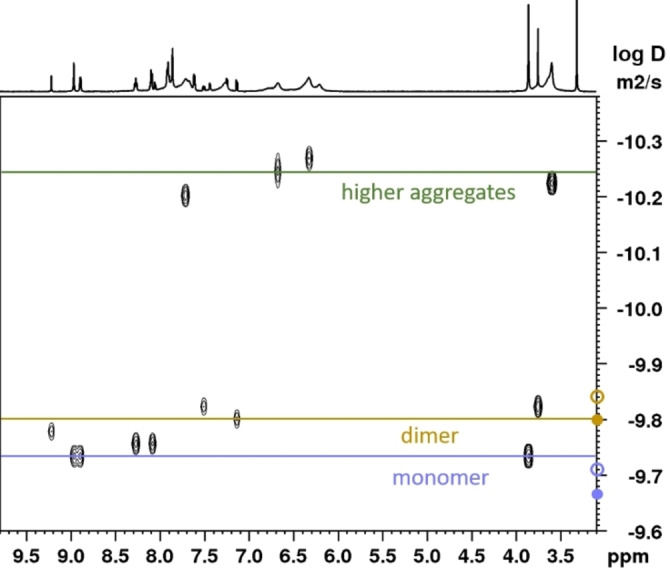
Diffusion ordered spectroscopy (DOSY) of 3 (600 MHz, d6 ‐DMSO). Circles on the y‐axis indicate calculated diffusion coefficients for the monomer and dimer (full circles for the complex cations, hollow circles for the ion pairs). The coefficients were calculated using the SEGWE D/MW calculator developed by Evans and et al.[ 65 , 66 ]
In d6 ‐DMSO, the 1H NMR spectrum of 1 shows one species alone. In CD3CN however, there were minor species observable at room temperature in addition to the major species. A VT NMR experiment, ranging from 25 °C to −34 °C, was conducted in acetonitrile, to see if aggregation behaviour could be identified for 1 (Figure 6). The additional minor species became more prominent upon temperature decrease and reached similar intensities to those of the major species at the lowest investigated temperature. As the peaks of the minor species do not increase in parallel, more than one minor species must be present. The identification of the minor species is complicated by the amount and overlap of resonances. At intermediate temperatures (2 °C and −9 °C), only one of them has risen significantly above the baseline. Therefore, we will focus our discussion on these spectra.
Figure 6.
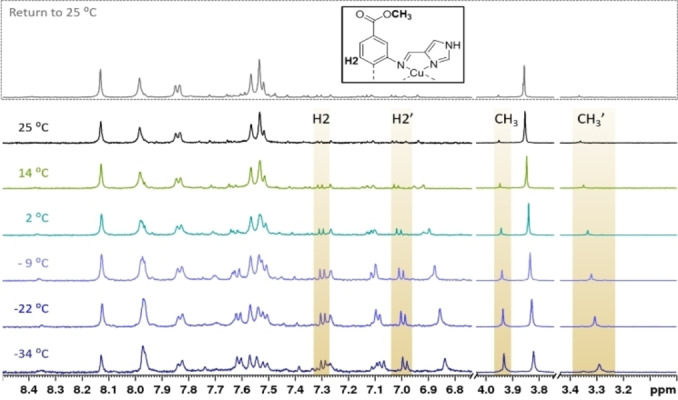
Partial 1H NMR spectra of 1 at different temperatures (500 MHz, CD3CN). One of the minor species shows two sets of signals, here highlighted for the methyl group and H2, a proton on the biphenyl backbone. As the room temperature spectrum after the temperature decrease (top spectrum) is equal to the initial room temperature spectrum before the VT NMR experiment (bottom spectrum), the observed processes are reversible.
Most of the minor species’ aromatic resonances were shifted upfield compared to those of the major species, similarly to what was seen for most of 3‐D’s aromatic resonances with respect to those of 3‐M. While 3‐D showed as many resonances as 3‐M, indicating magnetic equivalency of the resonances in the ligand, this was not observed for the minor species of 1. Instead, two sets of resonances were observed, as highlighted for the methyl group and one of the phenyl protons (H2) in Figure 6. There are literature examples of dimeric copper(I) complexes either maintaining or losing the magnetic equivalency of their tetradentate pyridine Schiff base ligands.[ 33 , 51 ] The postulation of the dimeric nature of this species is not only based on the twofold set of resonances and the upfield shifts for most aromatic resonances, but also the strong difference between the two shifts of each pair of proton resonances. This is especially pronounced for the NH proton and the methyl group. While one of the resonances has a similar shift to the corresponding resonance in the major species, the other is located further away (at −9 °C: ΔδCH3=+0.11 and −0.51; ΔδNH=+3.36 and −0.26). Solvent coordination or partial decoordination can be ruled out as the source of magnetic inequivalency by the pronounced effect on the remote methyl groups. A more likely explanation are ring currents caused by aromatic rings placed in spatial proximity by the dimerization.
A VT NMR experiment for 5 in acetonitrile revealed similar processes as seen for 1 to be operative (see Figures S63 and S64). At room temperature, one species with broad resonances was observed, but minor species were detected at temperatures below 2 °C. In d6 ‐DMSO, complex 5‘s resonances were even broader than in acetonitrile (Figure S32). Overall, the VT NMR experiments suggest dimerization and possibly even the presence of higher oligomers for 1 and 5 (see spectra at the two lowest temperatures in Figure 6). While the aggregation behaviour of 3 could be studied well by means of NMR, the low intensities of the minor species paired with the additional complexity of the 1H NMR spectra of 1 and 5 in acetonitrile at lower temperatures complicated the complete assignment of these species. The different appearances of 1, 3 and 5 in different solvents show that the aggregation behaviour is influenced by the solvent. Ouali et al. found that acetonitrile was non‐innocent in the dimerization process of a complex closely related to 3 (the imines are connected through a cyclohexyl bridge instead of the biphenyl), [67] and the same is likely for other coordinating solvents, such as DMSO. Studying the complexes’ solid behaviour allows to remove solvent effects and the interactions between complexes may be augmented by the naturally higher concentration. Despite numerous attempts, no crystals suitable for single crystal XRD could be obtained for any of the ML complexes. To gain further insights into polynuclear assemblies of 1 and 5, they were investigated through the Cu K‐edge (see below).
15N Coordination Shifts
The nitrogen shifts in NMR are good descriptors of the coordination centre in N‐ligated coordination complexes.[ 43 , 44 ] Due to the low sensitivity and natural abundance of 15N, the nitrogen shifts were determined indirectly through 1H‐15N HMBC experiments. The complexes’ 15N shifts seem to form two groups according to the heterocycle they are based on (see Table 1). The pyridine‐based complexes have upfield δ15Nimine shifts relative to the imidazole‐based compounds. The type of complex, ML or ML2, seems to have little effect on the nitrogen shifts when they bear the same heterocycle. 1, 2 and 6 have similar nitrogen NMR shifts (δ15Nimine≈−85 ppm; δ15NIM≈−171 ppm; δ15NAZ≈−205 ppm). Even though 5 was measured in another solvent (acetonitrile), the nitrogen shifts resemble those of the other imidazole‐bearing copper complexes. The pyridine‐based complexes 3‐M and 4 also have similar shifts to each other, with δ15Nimine≈−92 ppm and δ15Npyridine≈−128 ppm. However, the nitrogen shifts of 3‐D, δ15Nimine=−107.7 ppm and δ15Npyridine=−105.3 ppm, are quite different compared to those of 3‐M.
Table 1.
15N NMR shifts in ppm. The spectra are recorded in d6 ‐DMSO, unless noted otherwise. All shifts are reported relative to an external nitromethane standard. Coordination shifts Δδ15N, if obtained, are given in squared brackets. 1H‐15N HMBC spectra of complexes 1–6 and their ligands are given in the SI.
|
| ||||
|---|---|---|---|---|
|
Compound |
δ15Nimine [Δδ15Nimine] |
δ15Npyridine [Δδ15Npyridine] |
δ15NIM [Δδ15NIM] |
δ15NAZ [Δδ15NAZ] |
|
1 |
−83.2 [−13.7] |
|
−173.4 [−57.3] |
−203.7 [+7.1] |
|
2 |
−86.0 [−16.1] |
|
−171.7 [−55.2] |
−205.6 |
|
3‐M |
−89.6 [−41.7] |
−128.6 [−67.0] |
|
|
|
3‐D |
−107.7 [−59.8] |
−105.3 [−43.7] |
|
|
|
4 |
−94.0 [−46.1] |
−126.8 [−64.3] |
|
|
|
5 [a] |
−79.1 |
|
−170.5 |
−211.4 |
|
6 |
−86.1 [−21.1] |
|
−170.0 [−52.8] |
−206.1 [+3.5] |
[a] measured in acetonitrile.
The effect of the copper ligation manifests itself in the coordination shifts Δδ15N, which are calculated from the difference of the nitrogen shift in the free ligand and in the complex.[ 43 , 44 ] Coordination shifts were obtained for 1, 2, 3, 4 and 6. The ligand of 5 was not soluble in acetonitrile, while the NMR resonances of the complex were severely broadened in DMSO and methanol. As 15N NMR coordination shifts are solvent‐dependent, [68] no coordination shift was calculated.
The resonances corresponding to 3‐A are likely too broad to show defined crosspeaks in 1H‐15N HMBC, but the coordination shifts for both, 3‐M and 3‐D, were obtained. The Δδ15Nimine are −41.7 ppm for 3‐M and −59.8 ppm for 3‐D, while the Δδ15Npyridine are −67.0 ppm and −43.7 ppm respectively (Table 1). This suggests that the copper‐imine bond is strengthened at the expense of the copper‐pyridine bond upon dimerization. Van Stein et al. found Δδ15Nimine=−47.0 ppm and Δδ15Npyridine=−36.1 ppm for a closely related dimeric copper compound (the imines are connected through an ethyl bridge instead of the biphenyl) in methanol. [33] The magnitudes of the coordination shifts differ somewhat, but the greater effect on Nimine compared to Npyridine is in good agreement with 3‐D’s coordination shifts, further supporting 3‐D’s dimeric nature. Complex 4’s coordination shifts are similar to those of 3‐M, as anticipated from the similarity in absolute shifts.
The imidazole complexes have smaller Δδ15Nimine (−13.7 ppm for 1, −16.1 ppm for 2 and −21.1 ppm for 6) than the pyridine‐based complexes reported herein. The coordinating nitrogen of the imidazole is strongly affected (Δδ15NIM=−57.3 ppm for 1, Δδ15NIM=−55.2 ppm for 2 and Δδ15NIM=−52.8 ppm for 6), while the NH is barely influenced (Δδ15NAZ=+7.1 for 1 and Δδ15NAZ=+3.8 ppm for 6), consistent with this nitrogen not being involved in the coordination to copper.
Single‐Crystal XRD
It was possible to obtain crystals suitable for single crystal XRD analysis by recrystallizing 4 from MeCN/toluene (Figure 7).
The tetracoordinated environment surrounding copper is an intermediate geometry between square‐planar and tetrahedral, as determined by the structure's τ4’‐value (τ4’=0.50). τ4’ is a geometry index for tetracoordinated complexes that adapts values between 0 (square planar) and 1 (tetrahedral).[ 69 , 70 ] The imine−N−copper bonds (N1−Cu: 2.054(2) Å; N3−Cu: 2.085(2) Å) are slightly longer than the pyridine−N−copper bonds (N2−Cu: 2.028(2) Å; N4−Cu: 2.021(2) Å). These bond lengths are in very good agreement with the Δδ15N of 4, where both, imine and pyridine nitrogen, showed considerable coordination shifts, with the pyridine undergoing the larger change upon ligation. The crystal structure of 4 shows large differences between the two ligands, despite their identical connectivity. For one, the bond lengths to copper differ not only between the types of nitrogen but also between the two ligands, creating an unsymmetric environment around copper (see Figure 7, right side). The lack of symmetry is even clearer when comparing the dihedral angles between the imine and the adjacent phenyl ring, which were measured to be −27.1(4)° (C33−N3−C17−C18) and −42.8(4)° (C39−N1−C1−C2) respectively. Each pyridine ring π‐stacks with the non‐imine‐bearing phenyl ring of the other ligand in the same complex. Together with the co‐crystallisation of a solvent molecule (toluene), these interactions can account for the distortions from a symmetric arrangement of the two identical ligands around copper. Additionally, crystallisation of complex 2 from MeCN/Et2O resulted in fine needles that afforded a preliminary crystal structure (see SI for more details). The imine‐copper bonds (2.21(2) Å and 2.32(2) Å) were elongated compared to those in 4. These elongated, thus weaker, Nimine−Cu bonds in 2 compared to 4 are in line with smaller Δδ15Nimine for the imidazole‐based complexes compared to the pyridine‐based complexes. Contrarily, the imidazole‐copper bonds were 1.915(12) Å and 1.929(12) Å, so considerably shorter than the pyridine‐copper bonds in 4. The triflate counterion does not coordinate to either 2 or 4, but for 2 a hydrogen bond to the imidazole‐NH was noted.
X‐ray Absorption and Emission Spectroscopy
While 1H, 13C and 15N NMR provided structural information based on the ligands’ nuclei, X‐ray spectroscopy was employed to furnish structural insights through the selective interrogation of the Cu centre and its surrounding. Of special interest were the tetracoordinate copper imidazole complexes 1 and 5, as they could not be crystallised and their solution behaviour hinted agglomeration. While the monomers were the dominating species in solution at room temperature, a different situation might be found for the solid state, where the copper centres are in closer proximity to each other and solvent effects are absent. The Cu K‐edge X‐ray absorption spectra (XAS) for complexes 1 and 5 in solid state are shown in Figure 8.
Figure 8.
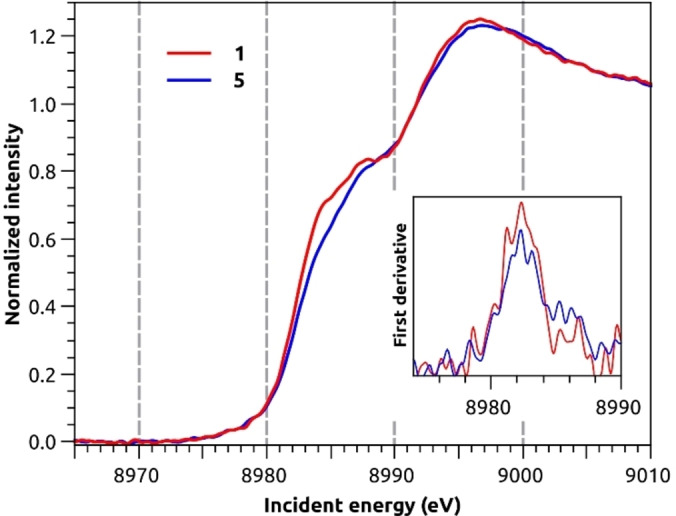
Cu K‐edge X‐ray absorption spectra of 1 (red) and 5 (blue) calibrated versus the first inflection point of Cu foil at 8980.3 eV. The first derivative (inset) highlights the first inflection point of the samples at 8982.2 eV for both.
As expected for closed‐shell d10 systems, no 1s to 3d pre‐edge feature are observed in the XAS spectra. The lowest lying transitions at 8984.5 and 8987.8 eV are attributed to dipole allowed 1s–4p transitions. These features are informative of the Cu(I) coordination symmetry based on the seminal work by Kau et al. [71] Two‐coordinate linear Cu(I) are characterized by a sharp and very intense peak at ca. 8984 eV (intensities of ca. 1 vs normalized edge jump), whereas four‐coordinate tetrahedral species give rise to much weaker rising edge features at higher energies (intensities of ca. 0.8). See SI for further information. The intensity of the rising edge features in 1 and 5 are most consistent with four‐coordinate Cu(I) complexes. [71] The position of the K‐edge taken as the first inflection point is 8982.2 eV for both complexes. Moreover, both spectra show at least two features at 8984.8 and 8988.0 eV, although in 5 the rising edge features are less intense. An intermediate feature at 8986.0 eV is more noticeable in 1 than in 5. The overall profile indicates that the Cu sites in these two complexes are tetracoordinated centres with similarly distorted geometries. To gain further insight into the coordination environment, the X‐ray emission spectra (XES) of 1 and 5 were collected and Figure 9 presents the valence‐to‐core (VtC) XES region. The VtC region is of special interest because it involves transitions from filled valence orbitals, i. e. those above Cu(3p) up to the HOMO. For this reason, it carries information on the identity of bound ligands and local geometry. [72] The Kβ2,5 features of 1 and 5 are characterized by two sharp peaks at 8973.1 and 8976.0 eV, the latter being somewhat less intense in 5. Complex 1 presents more intense shoulders at ca. 8967 and 8982 eV, which may be associated with the additional methyl ester groups in the complex. The Kβ” features, appearing at ∼8958 eV, are rather weak and broad for both complexes. The overall similarity between 1 and 5 also agrees with the findings of the 15N NMR study discussed above.
Figure 9.
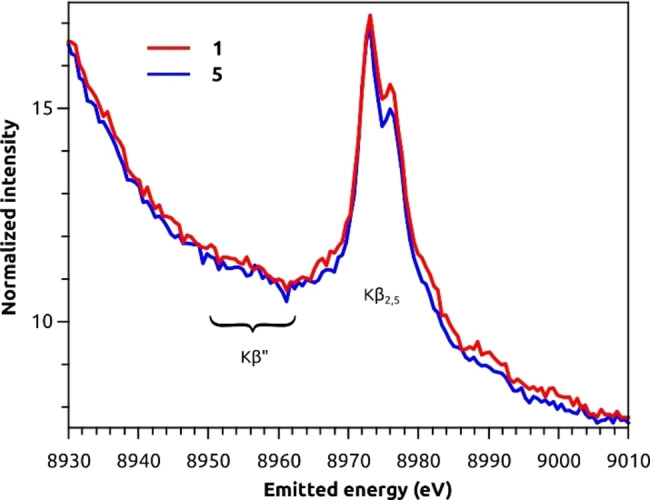
Valence‐to‐core X‐ray emission spectra of 1 (red) and 5 (blue). The intensity was normalized to the maximum of the Kβ1,3 (shown in Figure S75) and multiplied by 1000.
Calculations
Motivated by the consistent quantitative agreement between experimental and calculated VtC spectra demonstrated in previous studies,[ 72 , 73 , 74 , 75 , 76 , 77 ] calculations on DFT optimized structures were pursued. Based on the evidence from the Cu K‐edge XAS that 1 and 5 are tetracoordinated, models of the Δ atropisomer of the cations of 1 and 5 were built. The optimizations with PBE0 functional converged to two conformers: a near two‐coordinate seesaw geometry (1‐seesaw, 5‐seesaw) with two elongated Cu−Nimine bonds and a tetracoordinate near Td geometry (1‐Td, 5‐Td), see Figure S76. Key geometrical parameters are shown in Table 2. Given the small energy difference between conformers, a small model that ignores the ligand backbone and has the imine connecting to a methyl group instead was built. The structure is shown in Figure 1B and the optimized geometry is marked in red in Figure 10. With it, we investigated the flexibility of the bis(imidazole)imine moieties and the correlation with VtC XES features.
Table 2.
Key parameters of Cu(imim)2 + model, 1 and 5 obtained by DFT. Imidazole and imine nitrogens are NIM and Nimine respectively. Kβ2,5 peak intensities were taken relative to the onset intensity at 8961.1 eV in all cases.
|
|
Cu−NIM [Å][a] |
Cu−Nimine [Å][a] |
NIM−Cu−NIM’ [°] |
Nimine−Cu−Nimine’ [°] |
τ4, τ4’[b] |
Splitting of calc. Kβ2,5 peaks [eV][c] |
Intensity ratio of calc. Kβ2,5 peaks |
Relative energy[f] [kcal/mol] |
|---|---|---|---|---|---|---|---|---|
|
Cu(imim)2 + |
2.00 |
2.11 |
137 |
112 |
0.70, 0.66 |
3.7 |
0.70[d,e] |
– |
|
1‐Td |
1.93 |
2.14 |
143 |
85 |
0.63, 0.58 |
4.0 |
0.56[d] |
0.0 |
|
1‐seesaw |
1.86 |
2.41 |
176 |
68 |
0.56, 0.34 |
4.1 |
0.19[d] |
0.4 |
|
5‐Td |
1.94 |
2.13 |
140 |
87 |
0.63, 0.40 |
4.2 |
0.44[e] |
0.0 |
|
5‐seesaw |
1.86 |
2.38 |
167 |
70 |
0.57, 0.40 |
4.3 |
0.34[e] |
−1.7 |
Figure 10.
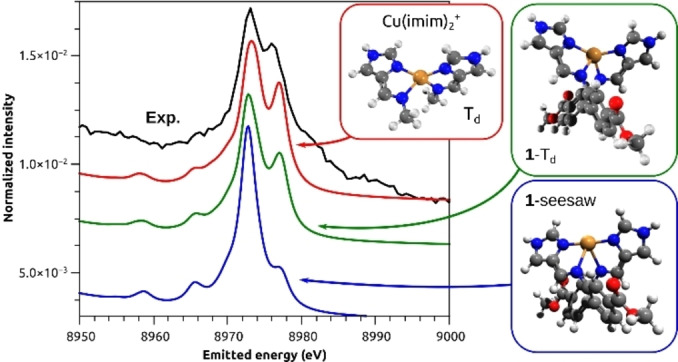
Experimental VtC XES spectrum of 1 and calculated spectra on the optimized geometries obtained at PBE0/def2‐TZVP level shown in ball‐and‐stick models. Key parameters are presented in Table 2. Calculated spectra were obtained with Lorentzian line shape on individual transitions (sticks not shown), 2.5 eV line width, shifted by 134.4 eV, scaled so that the red trace matched the intensity of the main Kβ2,5 peak and offset down to improve visualisation.
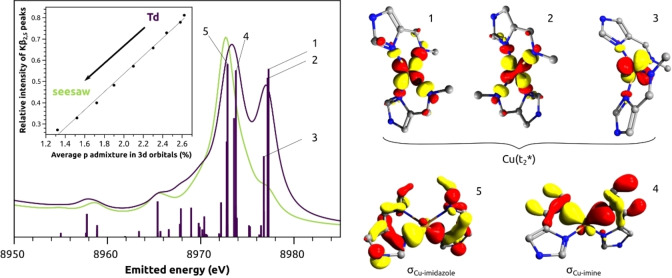
The calculated VtC XES spectrum of the small model Cu(imim)2 + in its near tetrahedral energy minimum showed the greatest similarity with the experimental spectrum (Figure 10) with respect to the relative ratio of the Kβ2,5 peaks (0.70 vs 0.75 observed experimentally) and splitting of the Kβ2,5 peaks (3.7 eV vs 2.9 eV observed experimentally). The ratio was defined as the intensity ratio between the peaks at 8976.0 eV and 8973.1, relative to the intensity at the onset 8961.1 eV. The spectrum of 1‐Td is in reasonable agreement, but the intensity ratio is lower (0.56) and the splitting is larger (4.0 eV) than the experimental values. Lastly, 1‐seesaw gave a sharp and strong Kβ2,5 with a much less intense second peak. The same trends were found for 5 as well.
Based on these findings, the actual coordination environment of 1 and 5 in solid state should approach tetrahedral with two Cu−NIM bond length on the order of 1.9–2.0 Å and two slightly longer Cu−Nimine of 2.1–2.2 Å. These bond lengths are comparable to those found in the preliminary single crystal structure of 2. Given the high similarity between all imidazole complexes found by 15N NMR, they are expected to have similar Cu−N bond lengths. The distorted Td geometry also agrees with the rising edge profile observed experimentally in the XAS, whereas a seesaw geometry would approach a two‐coordinate site and would have produced a stronger peak at lower energies.
As both, Td and seesaw geometries were found to be stable for both 1 and 5, with small relative energies between them, the existence of near degenerate conformation minima was explored. Attempts to find the minimum energy path between the two minima failed using the nudged elastic band method, [79] which converged to barrierless paths in both cases. Optimisations with B3LYP converged to only the seesaw conformer for both complexes. These findings are indicative of a shallow potential energy surface. As the PBE0 structures transition between Td and seesaw, the Cu−NIM bonds contract by 0.07 Å and the Cu−Nimine bonds expand almost four‐fold as much, by 0.27 Å.
The predicted VtC spectra of the conformers are very distinct with respect to the intensity of the high‐energy Kβ2,5 feature, which motivated further investigation of its intensity along the conformational change. As the Cu(imim)2 + model reproduces the VtC XES spectra obtained for either 1 or 5 and because their XAS spectra are similar, the simplified structure was deemed as a good representation of the imidazole‐based complexes reported herein. A series of constrained optimizations with the angle between copper and NIM varying from 137.09° (near‐Td energy minimum) to 180.0° was performed to capture the Td→seesaw transition. Figure 11 presents the energy profile along the potential energy surface scan for Cu(imim)2 +, as well as the calculated VtC XES and XAS for each point. Notably, the high‐energy Kβ2,5 peak (Figure 11b) decreases while the feature at the rising edge (Figure 11c) increases as the geometry approaches seesaw conformation.
Figure 11.
(a) Relaxed potential energy surface scan of the small model, calculated (b) VtC XES and (c) XAS spectra along the NIM‐Cu−NIM’ angle, on PBE0 geometries. The arrow indicates the trend from near tetrahedral to seesaw conformation. The energy shift in (b) is 134.4 eV and in (c) is 97.0 eV.
These results emphasize the complementary nature of the VtC XES and XAS data for assigning local site symmetry.
The role of d‐p orbital mixing for the VtC XES intensities was investigated computationally. The molecular orbitals involved in the main transitions are depicted in Figure 12. The main peak is predominantly formed by two transitions to the core hole: from Cu−NIM sigma bonding orbital (5) and from the Cu−Nimine bonding orbital (4) lying 0.9 eV above. As indicated in Table 2, the Cu−Nimine bond is considerably elongated in seesaw geometry, which decreases the intensity of transition 4, causing the main peak to shift toward lower energies, thus increasing the splitting. The fact that the Cu−Nimine bonding molecular orbital is almost 1 eV higher than the Cu−NIM counterpart indicates that the Cu−Nimine bonds are weaker. These findings are in very good agreement with the 15N NMR data, where imidazole complexes showed larger |Δδ15N| for NIM than for Nimine. More noticeably, the geometry‐sensitive high‐energy peak of the Kβ2,5 is due to emissions of filled Cu(3d) molecular orbitals (1–3), more precisely from the σ( t2*) set formed by the antibonding combination with N donor orbitals. This agrees well with our earlier observations of VtC XES of Cu(I)‐binding proteins. [74] The inset in Figure 12 shows the relative ratio of the Kβ2,5 peaks as a function of the average p contribution in all mainly 3d molecular orbitals. The correlation corroborates that the intensity mechanism of valence‐to‐1s transitions is dictated by the extent of p–d mixing of the valence orbital (3d). In the Td limit, the mixing is maximized as all 4p orbitals have the same t2 symmetry as the three 3d orbitals. The mixing deteriorates as one approaches the seesaw limit with pz becoming more antibonding and px,y set contribution to the bonding lessens. Hence, while Cu(I) complexes have no 1s‐to‐3d pre‐edge feature in the XAS, the 3d‐to‐1s feature in the VtC XES serves effectively as an “inverted pre‐edge”, as also previously observed in Zn [80] and Cu[ 74 , 81 ] and low valent Fe [82] VtC XES.
Figure 12.
Computed transition intensities for Cu(imim)2 + model in Td conformation and molecular orbitals corresponding to selected transitions. Hydrogens were omitted for clarity. The inset shows the correlation between the relative intensity of the two Kβ2,5 peaks and the average p character in the filled molecular orbital with main 3d character (HOMO to HOMO‐4). Isovalue: 0.05 e/au3.
Finally, it is worth comparing the experimental XAS and VtC XES of 1 and 5 in light of the trends obtained computationally with the small model. The lower intensity of the rising edge feature of 5 in comparison to 1 would indicate that 5 approaches the Td limit better than 1, which would imply that the high‐energy Kβ2,5 feature in the VtC XES of 5 should have been more intense than 1. However, this is not observed in the experimental spectra.
Concluding, the combination of NMR studies in solution and the X‐ray spectroscopic studies on solids for the imidazole ML complexes underlines the well‐established flexibility of Cu(I) complexes in terms of symmetry and coordination numbers. [32] For the ML complexes, this can result in the coexistence of multiple, interconverting species. In that case, some of the experimental observations are necessarily merged trends of the individual species’ behaviour. A thorough computational study involving explicit solvation effects, multiple complexes and a systematic conformational search would be needed to mirror the compounds’ intricate behaviour, but lies beyond the scope of this work. Furthermore, the concomitance of species can limit their value in catalytic studies as mechanisms may become difficult to decipher.[ 67 , 83 ] This creates an incentive to isolate the copper sites: If dimerization and oligomerisation are prevented, a more well‐defined copper site can be obtained. A possibility to achieve this spatial isolation is the incorporation into a rigid framework. The heterogenisation accompanying the incorporation of the copper complexes into a metal‐organic framework (MOF) is desirable in light of potential catalytic applications. [84]
Incorporation of Complex 1b into the MOF UiO‐67
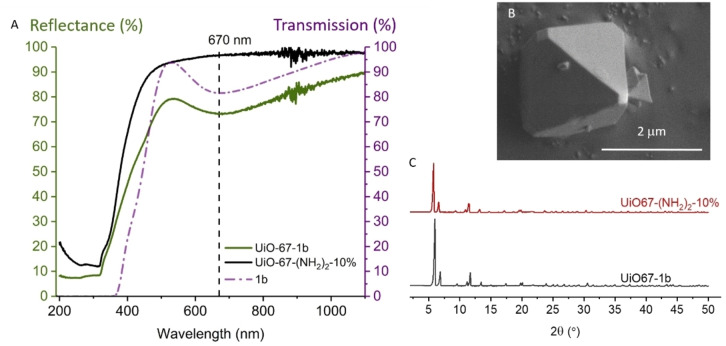
The corresponding carboxylic acids of the complexes that bear ester groups can function as linkers in metal‐organic frameworks, e. g. UiO‐67, a MOF with outstanding stability. [85] The NMR experiments reported herein were well‐suited for Cu(I) complexes in solution. The environment, and thereby the oxidation state, of the Cu centre is more challenging to control during synthesis or modification of a metal‐organic framework. Furthermore the d–d transition of Cu(II) complexes offers a convenient way to follow the incorporation of the metal by comparing the transmission spectrum of the molecular complex to the direct reflectance spectrum of the functionalised MOF. The Cu(II) analogue of 1 was synthesized from Cu(OTf)2 and characterized by elemental analysis, HRMS and UV/Vis (see SI, compound 1b). It showed an absorbance band at 670 nm (104 L ⋅ mol−1 cm−1), comparable to literature reports of similar Cu(II) complexes. [53] Due to its paramagnetic nature, complex 1b has extremely broadened peaks that merge into the baseline in 1H NMR. Complex 1b was reduced to complex 1 with ascorbic acid in an NMR experiment, showing that the synthesis yields the same ligand regardless of the oxidation state of the copper salt used (Figure S66). Taking these considerations into account, the extensibility of this work's synthesis protocol to MOF functionalisation is demonstrated by the incorporation of Cu(II) complex 1b into UiO‐67. The highly acidic conditions during MOF synthesis would result in hydrolysis of the imine bond in the ligand. Therefore, post‐synthetic linker modification (PSLM) of a MOF containing 2,2’‐diaminobiphenyl‐4,4’dicarboxylic acid (bpdc‐(NH2)2) as a linker is the most suitable method of incorporation. Additionally, PSLM ensures that only mononuclear copper sites are obtained, as the biphenyl backbone is already anchored to the framework and only one complex can form per linker. Due to the poor stability of UiO‐67‐(NH2)2, [86] that has 100 % of bpdc‐(NH2)2, the synthetic procedure was applied to UiO‐67 with mixed linkers. Literature for the related UiO‐67‐NH2 (only one amino group), found much higher stability for MOF with 20 % than for 100 % amino functionalised linker. [87] This is consistent with the observations for amino‐functionalisation of UiO‐66, which has the shorter terephthalic acid as a linker.[ 88 , 89 ] UiO‐67‐(NH2)2‐10 % was obtained following a synthetic procedure described elsewhere. [90] The 10 % amino‐functionalisation are taken from the ratio of linkers during synthesis, actual incorporation is somewhat lower (SI). The diamino‐functionalised MOF was shaken in an acetonitrile solution of 1H‐imidazole‐4‐carbaldehyde and Cu(OTf)2 overnight. After washing and drying, a light green MOF was obtained. The incorporation of the complex was confirmed by the good agreement of the UV/Vis spectra of the modified MOF and complex 1b (Figure 13A), as well as EDX, elemental analysis and TGA.
Figure 13.
Incorporation of complex 1b into UiO‐67. A. UV/Vis: DR of the mixed linker MOF (UiO‐67‐(NH2)2‐10 %; black) and the MOF after PSLM (green), resulting in the formation of complex 1b inside the MOF. The plot is overlaid with the transmission spectrum of 1b in solution (0.86 mM; purple). B. Secondary electron image of UiO‐67‐1b. C. Powder XRD of the mixed linker MOF (UiO‐67‐(NH2)2‐10 %; black) and the MOF after PSLM (UiO‐67‐1b; red).
1H NMR of the digested MOF showed the imidazole aldehyde and bpdc‐(NH2)2. The complex itself was therefore submitted to the alkaline digestion conditions and was found to hydrolyse completely. The structural integrity of the copper‐functionalised MOF UiO‐67‐1b was not compromised by the post‐synthetic linker modification, as shown by powder XRD and SEM (Figure 13B and C).
Conclusion
A series of new copper complexes was synthesized. The N,N,N,N‐coordinated copper(I) complexes were readily obtained via a one‐pot synthesis that avoids time‐consuming work‐ups and stabilizes the imine ligand. Bidentate ligands were found to form ML2 complexes, while tetradentate ligands formed ML complexes. The ligand design with ester‐substituents on the biphenyl backbone is a key feature for later incorporation of the complex into the MOF UiO‐67. Post‐synthetic linker modification is the incorporation method of choice for these complexes, as it is compatible with the synthesis protocol, the stability of the complexes and allows to form the copper complexes on spatially isolated sites.
The molecular copper complexes themselves were studied by combined multinuclear NMR techniques, elucidating their solution behaviour. For the ML2 complexes, NMR experiments suggested that they undergo ligand exchange in solution, in agreement with literature reports of Cu(I) complexes of bidentate ligands.[ 60 , 63 , 64 ] For the ML complexes, the formation of polynuclear species was studied by a combination of NMR techniques. Van Stein et al. reported a dimeric copper(I) complex of a tetradentate pyridine Schiff base ligand with a cyclohexyl backbone, [33] which Ouali et al. found to be interconverting with a monomeric complex. [67] The closely related complex 3 with a biphenyl backbone formed both, the monomeric species 3‐M and the dimeric species 3‐D. Interestingly, we also found a third coexisting species, the higher aggregate 3‐A. The temperature‐dependent interconversion of these three species was studied in d6 ‐DMSO, and the species’ identity was confirmed through diffusion ordered spectroscopy(DOSY). Unlike literature reports on copper(I) amide complexes, [35] we did not observe defined oligomers of intermediate size between dimer and higher aggregates. 1 and 5 also formed dimers and potentially further polynuclear species (from VT NMR at lower temperatures) in acetonitrile, although to a lesser extent than 3.
The nitrogen coordination shifts (δ15Ncomplex−δ15Nligand) of the complexes showed that the copper coordination environment is dictated by the heterocycle (pyridine vs imidazole). Interestingly, Δδ15N were barely affected by substitution on the phenyl rings and denticity of the ligand and the consequential ML or ML2 formulation. The coordination shifts of 3‐M and 3‐D gave a glimpse at the changes the copper centre undergoes upon dimerization: the bond with the imine is strengthened while the bond with the heterocycle is weakened. All Δδ15N were in good agreement with the bond length in the crystal structures of 2 and 4 and the computational model Cu(imim)2 +. This suggests that the crystal structures are representative for the bond lengths of the copper(I) complexes of the respective heterocycle‐Schiff base ligand. Both, single crystal XRD and Δδ15N, show a more symmetrical coordination environment for the (monomeric) pyridine complexes than the imidazole complexes. Given the good agreement of the 15N NMR experiments with the other experiments reported herein, we hope that this work encourages others to investigate more copper(I) complexes through 15N NMR spectroscopy.
The imidazole‐bearing ML complexes 1 and 5 were subjected to a combined XAS and XES study. The supporting DFT calculations converged to two structures for each mononuclear complex cation, a distorted Td and a seesaw geometry. The experimental XAS and Valence‐to‐Core XES spectra showed better agreement with 1‐Td and 5‐Td than the corresponding seesaw geometries. However, the experimental data was reproduced even more accurately by the simplified Cu(imim)2 + model. The imidazole moieties are perpendicular to each other in Cu(imim)2 +, which is a highly unfavourable conformation for monomers of 1 and 5, where the imidazole‐imine moieties are constrained by the biaryl backbone. In polynuclear species, the coordinating nitrogens do not necessarily originate from the same ligand. The good agreement between the experimental data and the Cu(imim)2 + model might therefore hint at an amplification of the polynuclear character in solid state. This is expected from the absence of solvent interactions and the naturally higher concentration of copper sites.
The combination of element‐specific techniques has allowed the notorious aggregation behaviour of copper(I) complexes to be studied. As many related complexes are studied for catalytic applications, the herein reported results underline the necessity for caution when establishing structure‐reactivity relationships from selective characterisation methods, such as single crystal structures. This work paves the way for future investigations of the complexes and the copper‐functionalised MOF as catalysts for C−H activation.
Experimental Section
Synthesis and Characterization. All syntheses involving Cu(I) species were carried out in an Ar‐filled UNIlab pro glovebox from MBraun. All solvents used were degassed with the freeze‐pump‐thaw technique (3 cycles). CuOTf, CuOTf2, the respective aldehydes, biphenyl‐2,2’‐diamine and biphenyl‐2‐amine were purchased from commercial sources and used as received. Dimethyl 2‐aminobiphenyl‐4,4’‐dicarboxylate and dimethyl 2,2’‐diaminobiphenyl‐4,4’‐dicarboxylate were synthesized according to literature.[
58
,
62
] See SI for instrumentation, as well as procedures and characterisation data for all compounds. Example (1).
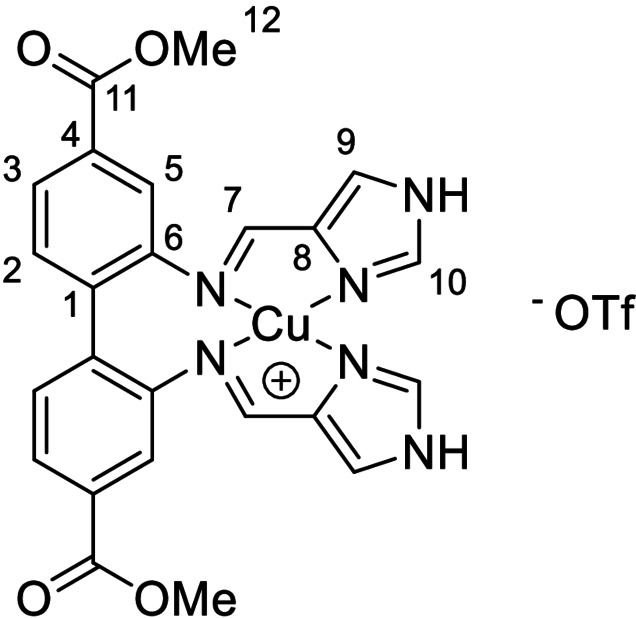
A mixture of dimethyl 2,2’‐diaminobiphenyl‐4,4’‐dicarboxylate (0.50 mmol, 150 mg), CuOTf (0.50 mmol, 106 mg, 1 equiv.) and 1H‐imidazole‐4‐carbaldehyde (1.0 mmol, 96 mg, 2 equiv.) were stirred in acetonitrile (3 mL) overnight. The solid was collected through filtration and washed with acetonitrile (2 mL) and diethyl ether (4 mL). Residual solvent was left to evaporate over night to yield 1 as an ochre solid. Yield: 77–82 %. 1H NMR (600 MHz, d6 ‐DMSO): δ=13.35 (2H, s, NH), 8.37 (2H, s, H10), 8.31 (2H, s, H7), 7.89 (2H, s, H9), 7.81 (2H, dd, 3 J H,H=7.9 Hz, 4 J H,H=1.5 Hz, H3), 7.57 (2H, d, 3 J H,H=7.9 Hz, H2), 7.49 (2H, d, 4 J H,H=1.2 Hz, H5), 3.83 ppm (6H, s, H12); 13C NMR (150 MHz, d6 ‐DMSO): δ=165.5 (C11), 154.5 (C7), 147.6 (C6), 138.7 (C10), 137.7 (C8), 133.7 (C1), 132.3 (C2), 130.0 (C4), 125.3 (C3), 123.0 (C9), 120.7 (q, 1 J C‐F=322 Hz, CF3) 120.3 (C5), 52.3 ppm (C12); 15N{1H} NMR (800 MHz, d6 ‐DMSO): δ=−83.2 (Nimine), −173.4 (NIM), −203.7 ppm (NAZ); LRMS (ESI): m/z (%): 519.083 (100), [63CuL]+, 521.082 (46) [65CuL]+; HRMS (ESI): m/z calcd for C24H20CuN6O4 +: 519.0837 [63CuL]+; found: 519.0833; elemental analysis calcd (%) for C25H20CuF3N6O7S: C 44.88, H 3.01, N 12.56; found: C, 44.57; H, 3.06; N, 12.44.
DOSY measurement. The DOSY spectrum was collected on a Bruker AVII600 with Z‐gradient probe with the stebpgp1s pulse sequence with 16 transitions. The diffusion period Δ was 90 ms and the gradient pulse duration (p30, ⋅ δ) was 2.45 ms. Spinning was off. The data were analysed using the Diffusion option in the Bruker Dynamics Center. [91] The fitting is based on user‐defined integrals and areas with signal overlap were not included for analysis (see SI). The theoretical diffusion constants were obtained through the SEGWE D/MW calculator developed and made available by Evans et. al.[ 65 , 66 ]
Single‐crystal X‐ray diffraction. Full details of the data collection, structure solution and refinement for each compound are contained in the cif files.
Deposition Numbers 2048292 (2) and 2048291 (4) contain the supplementary crystallographic data for this paper. These data are provided free of charge by the joint Cambridge Crystallographic Data Centre and Fachinformationszentrum Karlsruhe Access Structures service www.ccdc.cam.ac.uk/structures. The data are summarized in Table S3, SI.
X‐ray absorption measurements. XAS spectra were collected with an easyXES100‐extended laboratory spectrometer (easyXAFS, LLC, Seattle, USA) using a 100 W tungsten cathode source operating at 25 kV accelerating potential.[ 92 , 93 ] A circular aperture of 0.5 mm diameter was placed in front of the source to improve resolution. A helium flight path encompassing the Rowland circle area was used to reduce the X‐ray attenuation in air. A circularly bend Si(553) crystal with 1 m radius was used as monochromator. The samples were diluted to 3 % mass fraction of copper in boron nitride in a N2‐filled glovebox, ground, packed into a plastic cell (5 mm diameter, 1 mm thickness) and sealed with Kapton tape. The transmitted photons in the 8920–9200 eV range were detected by a Vortex detector. The samples were measured under constant stream of dry N2 flow to hinder permeation of air into the cells. At least ten scans were acquired consecutively with 0.1 eV step across Cu K‐edge region and spaced data points before and after for normalization. Each scan was inspected individually for radiation damage and oxidation and then averaged together. The incident flux (I0) was measured in the same way without any sample. The energy axis of all spectra was calibrated versus the first inflection point of copper foil spectrum at 8980.3 eV measured in the same conditions. The final spectra were obtained with the ln(I0/I1) relationship and normalized in the Athena software. A three‐point smoothing was applied to improve clarity, while the spectral features were neither suppressed nor introduced (see Figure S73).
Considering that 5 is more susceptible to air oxidation than 1, successive spectra of 5 were collected for longer time (Figure S74). Decay in the intensity of the rising edge feature was observed starting at the 13th scan, meaning that oxidative damage is mitigated in the first 10 scans averaged in the final spectrum.
X‐ray emission measurements. Samples for X‐ray emission spectroscopy were prepared in a N2‐filled glovebox by grinding the compounds and packing the powders into 0.5‐mm thick aluminium cells, which were sealed with 38 μm thick Kapton tape and kept in inert atmosphere until the measurement. The data were collected at the PINK tender X‐ray beamline at BESSY II synchrotron at Helmholtz‐Zetrum Berlin, during commissioning mode operation, at room temperature. The setup is the same as described previously.[ 94 , 95 ] The incoming energy was 9500 eV with a bandwidth of 95 eV, estimated flux of ∼8×10¹² photons/s, beam size of 500×30 μm (H×V). The analyser was a von Hamos with one cylindrically bent diced Si(444) crystal with 246 mm radius. The data were acquired in continuous snake‐like scan mode at 100.0 μm/s rate with 20 passes on the surface of the sample. The spectrum of each pass was compared with the previous to inspect for radiation‐induced damage. Spectra showing unaltered features were averaged and presented herein. To assure that undamaged data were collected, radiation damage was intentionally induced to provide data of damaged sample as followed by exposing single spots to 60 times longer than the data collection scans. The detector was a 1028‐pixel Eiger with 75 μm pixel size. The energy calibration was done with data collected on a CuCl sample also measured at ESRF/ID26, where the spectrometer was calibrated with a series of scattering lines across Cu XES range. A linear polynomial was fitted to correlate the energy of three VtC peaks (8972.5, 8976.4, 8981.9 eV) and Kβ1,3 (8903.2 eV) peak with the detector channel. The intensity was normalized to the Kβ1,3 maximum and multiplied by 1000.
Molecular modelling. All calculations were performed with the ORCA electronic structure package version 4.2.1. [96] Geometry optimizations were carried out using restricted density functional calculations with B3LYP[ 97 , 98 , 99 , 100 ] and PBE0[ 101 , 102 , 103 ] exchange‐correlation functionals, the Douglas‐Kroll‐Hess scalar‐relativistic all‐electron adapted versions of Aldrichs’ triple‐zeta quality basis set (def2‐TZVP), [104] resolution of identity with the general‐purpose SARC/J [105] auxiliary basis set and the chain of sphere approximations to speed up HF exchange calculation. The functionals were chosen based on literature reports [106] and the basis set due to the usual convergence with respect to the geometry at the triple zeta level. Scalar relativistic effects were included by the Douglas‐Kroll‐Hess Hamiltonian. Dispersion corrections were included by Grimme's atom‐pairwise dispersion correction with Becke‐Johnson damping.[ 107 , 108 ] The optimization thresholds were specified by the “TightOpt” keyword. Optimizations of 1 and 5 starting from a near tetrahedral initial guess converged to seesaw conformations with B3LYP, but stayed at near tetrahedral symmetry with PBE0. Optimization of the B3LYP seesaw geometries with PBE0 gave another minimum at a seesaw conformation. The energy minima were attested by the absence of imaginary vibrational modes in the Hessian calculation. Potential energy calculations were computed with relaxed surface scans along the angle formed by the binding imidazole nitrogens and Cu atom. Pre‐K‐edge X‐ray absorption spectra were calculated by time‐dependent DFT within Tamm‐Dancoff approximation with B3LYP functional on PBE0‐optimized geometries. [109] The oscillator strengths were computed based on the sum of the electric dipole, magnetic dipole and electric quadrupole contributions. The transitions were assigned based on the inspection of the natural transition orbitals. Valence‐to‐core X‐ray emission spectra were calculated on PBE0‐optimized geometries by a one‐electron DFT‐based approach [77] with BP86[ 98 , 110 , 111 ] functional and corrected for spin‐orbit coupling.[ 75 , 112 ] In this case, the core properties basis set CP(PPP) was assigned to the metal and the radial integration accuracy was increased. The SCF convergence criteria were in all cases set according to the “TightSCF” keyword. Avogadro was used to visualize structures and plot of molecular orbitals. The atomic orbital contributions to the molecular orbitals were obtained with the aid of loewdin_plotter. [113]
Conflict of interest
The authors declare no conflict of interest.
Supporting information
As a service to our authors and readers, this journal provides supporting information supplied by the authors. Such materials are peer reviewed and may be re‐organized for online delivery, but are not copy‐edited or typeset. Technical support issues arising from supporting information (other than missing files) should be addressed to the authors.
Supporting Information
Acknowledgements
The authors thank Elijah Aller for developing an adapter to fabricate sealed NMR tubes for air‐sensitive compounds to be measured in solvents with high boiling points. IG thanks Kristian Sørnes for providing dimethyl 2‐aminobiphenyl‐4,4’‐dicarboxylate. The authors thank Rafael Cortez Sgroi Pupo for synthesizing UiO‐67‐(NH2)2‐10 % and conducting the analysis of the metal‐organic frameworks. CN is grateful to Dr. Eliza Borfecchia for the fruitful scientific discussions. SAVJ and SD acknowledge the Max Planck Society for support. We thank Dr. Sergey Peredkov for XES measurements and Helmholtz‐Zentrum Berlin for providing synchrotron beam time. This project has received funding from the European Research Council (ERC) under the European Union's Horizon 2020 research and innovation program (grant agreement No 856446 (CUBE)). This work was partly supported by the Research Council of Norway through the Norwegian NMR Package in 1994 and partly supported by the Research Council of Norway through the Norwegian NMR Platform, NNP (226244/F50).
I. Gerz, S. A. V. Jannuzzi, K. T. Hylland, C. Negri, D. S. Wragg, S. Øien-Ødegaard, M. Tilset, U. Olsbye, S. DeBeer, M. Amedjkouh, Eur. J. Inorg. Chem. 2021, 2021, 4762.
Contributor Information
Prof. Serena DeBeer, Email: serena.debeer@cec.mpg.de.
Prof. Mohamed Amedjkouh, Email: mamou@kjemi.uio.no.
References
- 1. Liu S., Lei Y.-J., Xin Z.-J., Lu Y.-B., Wang H.-Y., J. Photochem. Photobiol. A 2018, 355, 141–151. [Google Scholar]
- 2. Shen J., Zhang X., Cheng M., Jiang J., Wang M., ChemCatChem 2020, 12, 1302–1306. [Google Scholar]
- 3. Garrido-Barros P., Funes-Ardoiz I., Drouet S., Benet-Buchholz J., Maseras F., Llobet A., J. Am. Chem. Soc. 2015, 137, 6758–6761. [DOI] [PubMed] [Google Scholar]
- 4. Monnier F., Taillefer M., Angew. Chem. Int. Ed. 2009, 48, 6954–6971; [DOI] [PubMed] [Google Scholar]; Angew. Chem. 2009, 121, 7088–7105. [Google Scholar]
- 5. Shafir A., Lichtor P. A., Buchwald S. L., J. Am. Chem. Soc. 2007, 129, 3490–3491. [DOI] [PubMed] [Google Scholar]
- 6. Hirano K., Miura M., Chem. Lett. 2015, 44, 868–873. [Google Scholar]
- 7. Aneeja T., Neetha M., Afsina C. M. A., Anilkumar G., RSC Adv. 2020, 10, 34429–34458. [DOI] [PMC free article] [PubMed] [Google Scholar]
- 8. Guo X.-X., Gu D.-W., Wu Z., Zhang W., Chem. Rev. 2015, 115, 1622–1651. [DOI] [PubMed] [Google Scholar]
- 9. Schönecker B., Zheldakova T., Lange C., Günther W., Görls H., Bohl M., Chem. Eur. J. 2004, 10, 6029–6042. [DOI] [PubMed] [Google Scholar]
- 10. Do H.-Q., Khan R. M. K., Daugulis O., J. Am. Chem. Soc. 2008, 130, 15185–15192. [DOI] [PMC free article] [PubMed] [Google Scholar]
- 11. Wendlandt A. E., Suess A. M., Stahl S. S., Angew. Chem. Int. Ed. 2011, 50, 11062–11087; [DOI] [PubMed] [Google Scholar]; Angew. Chem. 2011, 123, 11256–11283. [Google Scholar]
- 12. Suzuki M., Acc. Chem. Res. 2007, 40, 609–617. [DOI] [PubMed] [Google Scholar]
- 13. Schindler S., Eur. J. Inorg. Chem. 2000, 2311–2326. [Google Scholar]
- 14. Itoh S., Acc. Chem. Res. 2015, 48, 2066–2074. [DOI] [PubMed] [Google Scholar]
- 15. Lee J. Y., Peterson R. L., Ohkubo K., Garcia-Bosch I., Himes R. A., Woertink J., Moore C. D., Solomon E. I., Fukuzumi S., Karlin K. D., J. Am. Chem. Soc. 2014, 136, 9925–9937. [DOI] [PMC free article] [PubMed] [Google Scholar]
- 16. van der Vlugt J. I., Meyer F., in Organometallic Oxidation Catalysis. Topics in Organometallic Chemistry (Eds.: Meyer F., Limberg C.), Springer, Berlin, Heidelberg, 2007, pp. 191–240. [Google Scholar]
- 17. Quinlan R. J., Sweeney M. D., Leggio L. L., Otten H., Poulsen J.-C. N., Johansen K. S., Krogh K. B. R. M., Jørgensen C. I., Tovborg M., Anthonsen A., Tryfona T., Walter C. P., Dupree P., Xu F., Davies G. J., Walton P. H., PNAS 2011, 108, 15079–15084. [DOI] [PMC free article] [PubMed] [Google Scholar]
- 18. Hemsworth G. R., Taylor E. J., Kim R. Q., Gregory R. C., Lewis S. J., Turkenburg J. P., Parkin A., Davies G. J., Walton P. H., J. Am. Chem. Soc. 2013, 135, 6069–6077. [DOI] [PMC free article] [PubMed] [Google Scholar]
- 19. Aachmann F. L., Sørlie M., Skjåk-Bræk G., Eijsink V. G. H., Vaaje-Kolstad G., PNAS 2012, 109, 18779–18784. [DOI] [PMC free article] [PubMed] [Google Scholar]
- 20. Cao L., Caldararu O., Rosenzweig A. C., Ryde U., Angew. Chem. Int. Ed. 2018, 57, 162–166; [DOI] [PMC free article] [PubMed] [Google Scholar]; Angew. Chem. 2018, 130, 168–172. [Google Scholar]
- 21. Ross M. O., MacMillan F., Wang J., Nisthal A., Lawton T. J., Olafson B. D., Mayo S. L., Rosenzweig A. C., Hoffman B. M., Science 2019, 364, 566–570. [DOI] [PMC free article] [PubMed] [Google Scholar]
- 22. Garcia-Bosch I., Synlett 2017, 28, 1237–1243. [Google Scholar]
- 23. Concia A. L., Beccia M. R., Orio M., Ferre F. T., Scarpellini M., Biaso F., Guigliarelli B., Réglier M., Simaan A. J., Inorg. Chem. 2017, 56, 1023–1026. [DOI] [PubMed] [Google Scholar]
- 24. Garcia-Bosch I., Siegler M. A., Angew. Chem. Int. Ed. 2016, 55, 12873–12876; [DOI] [PubMed] [Google Scholar]; Angew. Chem. 2016, 128, 13065–13068. [Google Scholar]
- 25. Elwell C. E., Gagnon N. L., Neisen B. D., Dhar D., Spaeth A. D., Yee G. M., Tolman W. B., Chem. Rev. 2017, 117, 2059–2107. [DOI] [PMC free article] [PubMed] [Google Scholar]
- 26. Fukatsu A., Morimoto Y., Sugimoto H., Itoh S., Chem. Commun. 2020, 56, 5123–5126. [DOI] [PubMed] [Google Scholar]
- 27. Bete S. C., Würtele C., Otte M., Chem. Commun. 2019, 55, 4427–4430. [DOI] [PubMed] [Google Scholar]
- 28. Donoghue P. J., Gupta A. K., Boyce D. W., Cramer C. J., Tolman W. B., J. Am. Chem. Soc. 2010, 132, 15869–15871. [DOI] [PMC free article] [PubMed] [Google Scholar]
- 29. Muthuramalingam S., Maheshwaran D., Velusamy M., Mayilmurugan R., J. Catal. 2019, 372, 352–361. [Google Scholar]
- 30. Neira A. C., Martínez-Alanis P. R., Aullón G., Flores-Alamo M., Zerón P., Company A., Chen J., Kasper J. B., Browne W. R., Nordlander E., Castillo I., ACS Omega 2019, 4, 10729–10740. [DOI] [PMC free article] [PubMed] [Google Scholar]
- 31. Ramírez E., Hossain M. K., Flores-Alamo M., Haukka M., Nordlander E., Castillo I., Eur. J. Inorg. Chem. 2020, 2798–2808. [Google Scholar]
- 32. Carvajal M. A., Novoa J. J., Alvarez S., J. Am. Chem. Soc. 2004, 126, 1465–1477. [DOI] [PubMed] [Google Scholar]
- 33. Van Stein G. C., Van Koten G., Vrieze K., Brevard C., Inorg. Chem. 1984, 23, 4269–4278. [Google Scholar]
- 34. Nierengarten H., Rojo J., Leize E., Lehn J.-M., Dorsselaer A. V., Eur. J. Inorg. Chem. 2002, 573–579. [Google Scholar]
- 35. Sung S., Braddock D. C., Armstrong A., Brennan C., Sale D., White A. J. P., Davies R. P., Chem. Eur. J. 2015, 21, 7179–7192. [DOI] [PMC free article] [PubMed] [Google Scholar]
- 36. Eddaoudi M., Sava D. F., Eubank J. F., Adil K., Guillerm V., Chem. Soc. Rev. 2014, 44, 228–249. [DOI] [PubMed] [Google Scholar]
- 37. Hou Y.-L., Li S.-X., Sun R. W.-Y., Liu X.-Y., Ng S. W., Li D., Dalton Trans. 2015, 44, 17360–17365. [DOI] [PubMed] [Google Scholar]
- 38. Sunatsuki Y., Motoda Y., Matsumoto N., Coord. Chem. Rev. 2002, 226, 199–209. [Google Scholar]
- 39. Higa T., Moriya M., Shimazaki Y., Yajima T., Tani F., Karasawa S., Nakano M., Naruta Y., Yamauchi O., Inorg. Chim. Acta 2007, 360, 3304–3313. [Google Scholar]
- 40. Alves W. A., Cerchiaro G., Paduan-Filho A., Tomazela D. M., Eberlin M. N., Da Costa Ferreira A. M., Inorg. Chim. Acta 2005, 358, 3581–3591. [Google Scholar]
- 41. Potts K. T., Keshavarz M., Tham K. F. S., Abruna H. D., Arana C. R., Inorg. Chem. 1993, 32, 4422–4435. [Google Scholar]
- 42. He C., Zhang G., Ke J., Zhang H., Miller J. T., Kropf A. J., Lei A., J. Am. Chem. Soc. 2013, 135, 488–493. [DOI] [PubMed] [Google Scholar]
- 43. Pazderski L., in Annual Reports on NMR Spectroscopy (Ed.: Webb G. A.), Academic Press, London, 2013, pp. 33–179. [Google Scholar]
- 44. Pazderski L., in Annual Reports on NMR Spectroscopy (Ed.: Atta-ur-Rahman), Academic Press, London, 2020, pp. 151–284. [Google Scholar]
- 45. Gschwind R. M., Chem. Rev. 2008, 108, 3029–3053. [DOI] [PubMed] [Google Scholar]
- 46. Kujime M., Kurahashi T., Tomura M., Fujii H., Inorg. Chem. 2007, 46, 541–551. [DOI] [PubMed] [Google Scholar]
- 47. Kowalska J. K., Lima F. A., Pollock C. J., Rees J. A., DeBeer S., Isr. J. Chem. 2016, 56, 803–815. [Google Scholar]
- 48. Schnödt J., Manzur J., García A.-M., Hartenbach I., Su C.-Y., Fiedler J., Kaim W., Eur. J. Inorg. Chem. 2011, 1436–1441. [Google Scholar]
- 49. Seth D. K., Bhattacharya S., Polyhedron 2011, 30, 2438–2443. [Google Scholar]
- 50. Lagerspets E., Lagerblom K., Heliövaara E., Hiltunen O.-M., Moslova K., Nieger M., Repo T., J. Mol. Catal. 2019, 468, 75–79. [Google Scholar]
- 51. Hamblin J., Childs L. J., Alcock N. W., Hannon M. J., J. Chem. Soc. Dalton Trans. 2002, 164–169. [Google Scholar]
- 52. Tanaka T., Sunatsuki Y., Suzuki T., Inorg. Chim. Acta 2020, 502, 119373. [Google Scholar]
- 53. Mimura M., Matsuo T., Nakashima T., Matsumoto N., Inorg. Chem. 1998, 37, 3553–3560. [DOI] [PubMed] [Google Scholar]
- 54. Becker J., Gupta P., Angersbach F., Tuczek F., Näther C., Holthausen M. C., Schindler S., Chem. Eur. J. 2015, 21, 11735–11744. [DOI] [PubMed] [Google Scholar]
- 55. Lerch M., Weitzer M., Stumpf T.-D. J., Laurini L., Hoffmann A., Becker J., Miska A., Göttlich R., Herres-Pawlis S., Schindler S., Eur. J. Inorg. Chem. 2020, 3143–3150. [Google Scholar]
- 56. Schober K., Zhang H., Gschwind R. M., J. Am. Chem. Soc. 2008, 130, 12310–12317. [DOI] [PubMed] [Google Scholar]
- 57. Ay S., Ziegert R. E., Zhang H., Nieger M., Rissanen K., Fink K., Kubas A., Gschwind R. M., Bräse S., J. Am. Chem. Soc. 2010, 132, 12899–12905. [DOI] [PubMed] [Google Scholar]
- 58. Hylland K. T., Øien-Ødegaard S., Heyn R. H., Tilset M., Eur. J. Inorg. Chem. 2020, 3627–3643. [Google Scholar]
- 59. Hylland K. T., Gerz I., Wragg D. S., Øien-Ødegaard S., Tilset M., Eur. J. Inorg. Chem. 2021, 1869–1889. [DOI] [PMC free article] [PubMed] [Google Scholar]
- 60. Herzigkeit B., Flöser B. M., Engesser T. A., Näther C., Tuczek F., Eur. J. Inorg. Chem. 2018, 3058–3069. [Google Scholar]
- 61. Forte G., Oliveri I. P., Consiglio G., Failla S., Bella S. D., Dalton Trans. 2017, 46, 4571–4581. [DOI] [PubMed] [Google Scholar]
- 62. Hylland K. T., Øien-Ødegaard S., Tilset M., Eur. J. Org. Chem. 2020, 4208–4226. [Google Scholar]
- 63. Lennox A. J. J., Fischer S., Jurrat M., Luo S.-P., Rockstroh N., Junge H., Ludwig R., Beller M., Chem. Eur. J. 2016, 22, 1233–1238. [DOI] [PubMed] [Google Scholar]
- 64. Zhang Y., Heberle M., Wächtler M., Karnahl M., Dietzek B., RSC Adv. 2016, 6, 105801–105805. [Google Scholar]
- 65. Evans R., Deng Z., Rogerson A. K., McLachlan A. S., Richards J. J., Nilsson M., Morris G. A., Angew. Chem. Int. Ed. 2013, 52, 3199–3202; [DOI] [PubMed] [Google Scholar]; Angew. Chem. 2013, 125, 3281–3284. [Google Scholar]
- 66. Evans R., Dal Poggetto G., Nilsson M., Morris G. A., Anal. Chem. 2018, 90, 3987–3994. [DOI] [PubMed] [Google Scholar]
- 67. Ouali A., Taillefer M., Spindler J.-F., Jutand A., Organometallics 2007, 26, 65–74. [Google Scholar]
- 68. Kleinmaier R., Arenz S., Karim A., Carlsson A.-C. C., Erdélyi M., Magn. Reson. Chem. 2013, 51, 46–53. [DOI] [PubMed] [Google Scholar]
- 69. Rosiak D., Okuniewski A., Chojnacki J., Polyhedron 2018, 146, 35–41. [Google Scholar]
- 70. Okuniewski A., Rosiak D., Chojnacki J., Becker B., Polyhedron 2015, 90, 47–57. [Google Scholar]
- 71. Kau L. S., Spira-Solomon D. J., Penner-Hahn J. E., Hodgson K. O., Solomon E. I., J. Am. Chem. Soc. 1987, 109, 6433–6442. [Google Scholar]
- 72. Pollock C. J., DeBeer S., Acc. Chem. Res. 2015, 48, 2967–2975. [DOI] [PubMed] [Google Scholar]
- 73. Cutsail G. E., Gagnon N. L., Spaeth A. D., Tolman W. B., DeBeer S., Angew. Chem. Int. Ed. 2019, 58, 9114–9119; [DOI] [PMC free article] [PubMed] [Google Scholar]; Angew. Chem. 2019, 131, 9212–9217. [Google Scholar]
- 74. Martin-Diaconescu V., Chacón K. N., Delgado-Jaime M. U., Sokaras D., Weng T.-C., DeBeer S., Blackburn N. J., Inorg. Chem. 2016, 55, 3431–3439. [DOI] [PMC free article] [PubMed] [Google Scholar]
- 75. Lassalle-Kaiser B., Boron T. T., Krewald V., Kern J., Beckwith M. A., Delgado-Jaime M. U., Schroeder H., Alonso-Mori R., Nordlund D., Weng T.-C., Sokaras D., Neese F., Bergmann U., Yachandra V. K., DeBeer S., Pecoraro V. L., Yano J., Inorg. Chem. 2013, 52, 12915–12922. [DOI] [PMC free article] [PubMed] [Google Scholar]
- 76. Alonso-Mori R., Kern J., Sokaras D., Weng T.-C., Nordlund D., Tran R., Montanez P., Delor J., Yachandra V. K., Yano J., Bergmann U., Rev. Sci. Instrum. 2012, 83, 073114. [DOI] [PMC free article] [PubMed] [Google Scholar]
- 77. Lee N., Petrenko T., Bergmann U., Neese F., DeBeer S., J. Am. Chem. Soc. 2010, 132, 9715–9727. [DOI] [PubMed] [Google Scholar]
- 78. Yang L., Powell D. R., Houser R. P., Dalton Trans. 2007, 955–964. [DOI] [PubMed] [Google Scholar]
- 79. Koistinen O.-P., Ásgeirsson V., Vehtari A., Jónsson H., J. Chem. Theory Comput. 2019, 15, 6738–6751. [DOI] [PubMed] [Google Scholar]
- 80. McCubbin Stepanic O., Ward J., Penner-Hahn J. E., Deb A., Bergmann U., DeBeer S., Inorg. Chem. 2020, 59, 13551–13560. [DOI] [PMC free article] [PubMed] [Google Scholar]
- 81. Lim H., Baker M. L., Cowley R. E., Kim S., Bhadra M., Siegler M. A., Kroll T., Sokaras D., Weng T.-C., Biswas D. R., Dooley D. M., Karlin K. D., Hedman B., Hodgson K. O., Solomon E. I., Inorg. Chem. 2020, 59, 16567–16581. [DOI] [PMC free article] [PubMed] [Google Scholar]
- 82. Delgado-Jaime M. U., DeBeer S., Bauer M., Chem. Eur. J. 2013, 19, 15888–15897. [DOI] [PubMed] [Google Scholar]
- 83. Berg R., Straub B. F., Beilstein J. Org. Chem. 2013, 9, 2715–2750. [DOI] [PMC free article] [PubMed] [Google Scholar]
- 84. Bavykina A., Kolobov N., Khan I. S., Bau J. A., Ramirez A., Gascon J., Chem. Rev. 2020, 120, 8468–8535. [DOI] [PubMed] [Google Scholar]
- 85. Cavka J. H., Jakobsen S., Olsbye U., Guillou N., Lamberti C., Bordiga S., Lillerud K. P., J. Am. Chem. Soc. 2008, 130, 13850–13851. [DOI] [PubMed] [Google Scholar]
- 86. Ko N., Hong J., Sung S., Cordova K. E., Park H. J., Yang J. K., Kim J., Dalton Trans. 2015, 44, 2047–2051. [DOI] [PubMed] [Google Scholar]
- 87. Rasero-Almansa A. M., Corma A., Iglesias M., Sánchez F., ChemCatChem 2014, 6, 3426–3433. [Google Scholar]
- 88. Chavan S. M., Shearer G. C., Svelle S., Olsbye U., Bonino F., Ethiraj J., Lillerud K. P., Bordiga S., Inorg. Chem. 2014, 53, 9509–9515. [DOI] [PubMed] [Google Scholar]
- 89. Kleist W., Jutz F., Maciejewski M., Baiker A., Eur. J. Inorg. Chem. 2009, 3552–3561. [Google Scholar]
- 90.G. Kaur, Optimization of UiO-67 Type Metal-Organic Frameworks for Catalysis, PhD Thesis, Oslo University, 2020.
- 91.“Non-Frequency Dimension NMR Analysis Software | Bruker,” can be found under https://www.bruker.com/en/products-and-solutions/mr/nmr-software/dynamics-center.html, 2021.
- 92. Seidler G. T., Mortensen D. R., Remesnik A. J., Pacold J. I., Ball N. A., Barry N., Styczinski M., Hoidn O. R., Rev. Sci. Instrum. 2014, 85, 113906. [DOI] [PubMed] [Google Scholar]
- 93. Jahrman E. P., Holden W. M., Ditter A. S., Mortensen D. R., Seidler G. T., Fister T. T., Kozimor S. A., Piper L. F. J., Rana J., Hyatt N. C., Stennett M. C., Rev. Sci. Instrum. 2019, 90, 024106. [DOI] [PubMed] [Google Scholar]
- 94. Levin N., Peredkov S., Weyhermüller T., Rüdiger O., Pereira N. B., Grötzsch D., Kalinko A., DeBeer S., Inorg. Chem. 2020, 59, 8272–8283. [DOI] [PMC free article] [PubMed] [Google Scholar]
- 95. Mathe Z., Stepanic O. M., Peredkov S., DeBeer S., Chem. Sci. 2021, 12, 7888–7901. [DOI] [PMC free article] [PubMed] [Google Scholar]
- 96. Neese F., Wiley Interdiscip. Rev.: Comput. Mol. Sci. 2018, 8, e1327. [Google Scholar]
- 97. Lee C., Yang W., Parr R. G., Phys. Rev. B 1988, 37, 785–789. [DOI] [PubMed] [Google Scholar]
- 98. Becke A. D., Phys. Rev. A 1988, 38, 3098–3100. [DOI] [PubMed] [Google Scholar]
- 99. Becke A. D., J. Chem. Phys. 1993, 98, 5648–5652. [Google Scholar]
- 100. Stephens P. J., Devlin F. J., Chabalowski C. F., Frisch M. J., J. Phys. Chem. 1994, 98, 11623–11627. [Google Scholar]
- 101. Perdew J. P., Wang Y., Phys. Rev. B 1992, 45, 13244–13249. [DOI] [PubMed] [Google Scholar]
- 102. Perdew J. P., Burke K., Ernzerhof M., Phys. Rev. Lett. 1996, 77, 3865–3868. [DOI] [PubMed] [Google Scholar]
- 103. Perdew J. P., Ernzerhof M., Burke K., J. Chem. Phys. 1996, 105, 9982–9985. [Google Scholar]
- 104. Weigend F., Ahlrichs R., Phys. Chem. Chem. Phys. 2005, 7, 3297–3305. [DOI] [PubMed] [Google Scholar]
- 105. Weigend F., Phys. Chem. Chem. Phys. 2006, 8, 1057–1065. [DOI] [PubMed] [Google Scholar]
- 106. Johansson A. J., Blomberg M. R. A., Siegbahn P. E. M., Inorg. Chem. 2006, 45, 1491–1497. [DOI] [PubMed] [Google Scholar]
- 107. Grimme S., Ehrlich S., Goerigk L., J. Comput. Chem. 2011, 32, 1456–1465. [DOI] [PubMed] [Google Scholar]
- 108. Grimme S., Antony J., Ehrlich S., Krieg H., J. Chem. Phys. 2010, 132, 154104. [DOI] [PubMed] [Google Scholar]
- 109. DeBeer George S., Petrenko T., Neese F., J. Phys. Chem. A 2008, 112, 12936–12943. [DOI] [PubMed] [Google Scholar]
- 110. Vosko S. H., Wilk L., Nusair M., Can. J. Phys. 1980, 58, 1200–1211. [Google Scholar]
- 111. Perdew J. P., Phys. Rev. B 1986, 33, 8822–8824. [DOI] [PubMed] [Google Scholar]
- 112. Beckwith M. A., Roemelt M., Collomb M.-N., DuBoc C., Weng T.-C., Bergmann U., Glatzel P., Neese F., DeBeer S., Inorg. Chem. 2011, 50, 8397–8409. [DOI] [PubMed] [Google Scholar]
- 113.“ORCA / orca-helpers,” can be found under https://gitlab.gwdg.de/orca-helpers/orca-helpers, 2021.
Associated Data
This section collects any data citations, data availability statements, or supplementary materials included in this article.
Supplementary Materials
As a service to our authors and readers, this journal provides supporting information supplied by the authors. Such materials are peer reviewed and may be re‐organized for online delivery, but are not copy‐edited or typeset. Technical support issues arising from supporting information (other than missing files) should be addressed to the authors.
Supporting Information


