

Abstract
Protein–protein interactions (PPIs) are essential in understanding numerous aspects of protein function. Here, we significantly scaled and modified analyses of the recently developed all‐vs‐all sequencing (AVA‐Seq) approach using a gold‐standard human protein interaction set (hsPRS‐v2) containing 98 proteins. Binary interaction analyses recovered 20 of 47 (43%) binary PPIs from this positive reference set (PRS), comparing favorably with other methods. However, the increase of 20× in the interaction search space for AVA‐Seq analysis in this manuscript resulted in numerous changes to the method required for future use in genome‐wide interaction studies. We show that standard sequencing analysis methods must be modified to consider the possible recovery of thousands of positives among millions of tested interactions in a single sequencing run. The PRS data were used to optimize data scaling, auto‐activator removal, rank interaction features (such as orientation and unique fragment pairs), and statistical cutoffs. Using these modifications to the method, AVA‐Seq recovered >500 known and novel PPIs, including interactions between wild‐type fragments of tumor protein p53 and minichromosome maintenance complex proteins 2 and 5 (MCM2 and MCM5) that could be of interest in human disease.
1. INTRODUCTION
Understanding protein–protein interactions (PPIs) by uncovering interacting regions and active sites have been essential for advancing many biological fields. Knowing a protein's functional partner allows for drug discovery innovation by interrogating active sites and interaction interfaces for clinically relevant inhibitors. Additionally, when researchers can connect or extend protein interaction networks, they can utilize new information to predict the function of unknown genes.
Many methods were developed to determine protein partners. 1 The yeast two‐hybrid (Y2H) method revolutionized how interacting partners could be determined, 2 opening the way for systematic, proteome‐scale binary interaction mapping for human and model organisms. 3 , 4 , 5 , 6 , 7 , 8 , 9 Since then, many advancements in binary interaction mapping have been added to the conversation with no single method being superior to all others—meaning no one method can determine all or most PPIs without systematic bias. A recent manuscript 10 illustrates the complexities of the PPI process by utilizing a human positive reference set (hsPRS‐v2) that contained 60 human interacting protein pairs. At best, using one method in isolation could determine 33% of the hsPRS‐v2, and using 10 versions of four assays could recover 63% of interactions. 10 Importantly, Choi and colleagues confirm the significance that assay configuration and orientation have on interaction screening. This means fusions to different individual DNA‐binding domains (DBD) or other transcriptional activation domains (AD) to reconstitute transcription factor activity can have nonoverlapping results or unforeseen bias. To make up for this bias, the screening area is increased by at least two‐fold to ensure proper coverage of the interaction space. Multiple methods that incorporate different assay configurations and fusion partner orientations will need to be employed to gain significant coverage of the interactome in question to achieve maximal detection of binary interactions. Our all‐vs‐all sequencing (AVA‐Seq) method was developed to help fill this gap in the protein interaction field.
AVA‐Seq is a novel way to screen PPIs quickly and cost‐effectively. It was designed to screen fragmented proteins against itself (or an alternative library) and simultaneously incorporate high sensitivity and multiple orientations with next‐generation sequencing (NGS). AVA‐Seq merges both the “bait” and “prey” plasmids from traditional two‐hybrid assays by inserting protein fragments in a convergent fusion on one plasmid called pAVA. This means both the DBD (lambda CI) and AD (RNAp) have protein fragments fused on their C‐termini, but they are translating toward each other in a convergent orientation with a stretch of stop codons separating their products. Having both protein fragments on the same plasmid has several advantages. First, it increases the transformation efficiency since only one plasmid needs to be incorporated into the cell. This efficiency is further enhanced as we are using a bacterial system rather than a yeast‐based system. Second, the selection process can be significantly improved as the information of which protein fragments interact is retained. Because of this, we can perform the selection process in liquid culture rather than needing to identify individual colonies. Further, information about which “bait” and “prey” interact is retained, so the fragment fusions are now amenable to NGS technologies.
Our initial AVA‐Seq study using six human proteins was encouraging. 11 However, scaling‐up the method for future large‐scale studies required significant modification. It was vital to put the AVA‐Seq system in the context of other methods by using a gold‐standard set of interactions allowing for the potential use of AVA‐Seq in large‐scale interaction mapping projects. To that end, the AVA‐Seq system was applied on a subset of the hsPRS‐v2 proteins, a gold‐standard collection of human PPIs. The hsPRS‐v2 was used to modify the AVA‐Seq method and facilitate analyses in the context of millions of possible interactions, which was not possible in past studies. Here, we present the required changes to the method regarding sequencing depth, auto‐activator removal, open reading frame (ORF) filtering, fragment sizes, data scaling, interaction quality filtering, and calling, all of which are essential to understand AVA‐Seq in the context of a well‐characterized set of interactions.
2. MATERIAL AND METHODS
2.1. Reagents, strains, media, and plasmids
The hsPRS‐v2 and human random reference set (hsRRS‐v2) were supplied in Gateway vectors. 10 Each gene (Supplementary Table 1) was amplified individually using 1–5 ng DNA with primers sitting ~140 bp upstream and downstream of the gene. Minimal selection media, validation reporter cells, and plasmid descriptions are listed. 11 Transformation of the final pAVA constructs into validation reporter cells did not exceed 2 ng to ensure multiple plasmids were not incorporated into a single cell. 12 AVA‐Seq plasmids are readily available from Addgene.org. All reagents are consistent with Andrews et al., 2019, unless stated otherwise.
2.2. Library construction, screening, and DNA sequencing
The method for library construction was similar to previously published 11 with only slight modifications. Briefly, the 98 proteins used in this study were polymerase chain reaction (PCR) amplified, quantified, and split into two pools of 20 nM each. Both pENTR221 and pDONR223 plasmids were amplified using M13 forward and reverse Gateway primers which sit just up and downstream of the gene of interest (5′‐CCC AGT CAC GAC GTT GTA AAA CG‐3′ and 5′‐GTA ACA TCA GAG ATT TTG AGA CAC‐3′). Positive reference set (PRS) Batch 1 contained 39 proteins (22 PPIs), and Batch 2 contained 41 proteins (25 PPIs). Each batch contained nine proteins representing six random reference set (RRS) protein pairs that are expected not to interact (Supplementary Table 1). (Note: A few proteins are involved in both RRS and PRS interactions.) Each pool was sheared into ~500 bp fragments and processed as indicated in Andrews et al. with the following changes. 11 Each sample included a positive (LGF2‐Gal11p; 1:107 dilution) and negative control (Gal11p‐LGF2[fs]; 1:107 dilution) spiked in. Paired fragments in the pAVA vector were transformed into the reporter strain, and nine replicates were created. These nine replicates were divided into three groups containing three replicates for 0, 2, and 5 mM 3‐AT selection conditions and grown for 9 h at 37 °C. DNA from the growth was extracted, and libraries were generated using standard protocols. Samples were sequenced on an Illumina NovaSeq with paired 150 base pair reads according to the manufacturer's recommended protocol.
2.3. Primary data analysis
FASTQ files from the sequencers were analyzed as described previously. 11 Briefly, paired‐sequence reads were translated in‐frame with the appropriate fusion protein (lambda cI or RNAP) from the pAVA construct. Translated sequences were matched to a database of PRS proteins using the rapid protein aligner (DIAMOND), 13 and the start point in the protein was noted. Paired sequences that both matched in‐frame and with a PRS protein were kept. In‐frame fragment pairs were then collated, and each time the exact pair with the same protein and start point was observed in a separate read pair, the count was incremented. Counts for each of the fragment pairs across all nine replicates (3 × 0 mM, 3 × 2 mM, 3 × 5 mM 3‐AT) were placed in a table for statistical analysis.
2.4. Auto‐activator removal
When screening such large numbers of possible interactors, the chance of including a systematic auto‐activator increases, that is, a protein fragment, biologically relevant or not, that interacts with the system rather than the protein it is being tested against. Removing fragments that could interact with the system proteins RNAP (AD) and lambda cI (DBD) was necessary. This issue was less evident in smaller‐scale studies with AVA‐Seq. Here, residual out‐of‐frame fragments from the ORF selection process provided an opportunity. All in‐frame fragments fused to RNAP were searched for interactions with more than three out‐of‐frame fragments fused to lambda cI. These are suspected to be due to the RNAP‐fused fragments interacting directly with lambda cI rather than the connected fragment. The exact process was repeated for in‐frame fragments fused to lambda cI that interacted with more than three RNAP‐fused out‐of‐frame fragments. The value of three fragments or more was selected based on the average number of interactions a fragment had from the data. Only fragments with more than three interactions were removed from the 2 mM 3‐AT conditions analysis, the less stringent selective condition. Few fragments had more than one interaction in 5 mM 3‐AT conditions that a trend could not be observed for excessive interactions with out‐of‐frame fragments.
2.5. Scaling of data
Aside from scaling data based on variable read counts across the replicates, analysis of the raw data revealed multiple fragment pairs that would rise to thresholds indicating an interaction in the 5 mM but not in the less stringent 2 mM 3‐AT conditions. Closer inspection of the data showed standard RNA‐seq algorithms called multiple negative interactions, that is, fragment pairs that decreased in proportion from 0 mM to 2 mM 3‐AT. An analysis across the entire data set revealed this trend, especially in 2 mM 3‐AT, where potentially thousands of fragment pairs might interact in the pool. Without sufficient sequencing depth, it gives the impression that total screened pairs were decreasing in proportion. This depth was less of an issue in the more selective 5 mM 3‐AT conditions where fewer fragment pairs interacted, causing sequencing reads to distribute across fewer interacting pairs. Therefore, the read counts in 2 mM and 5 mM were scaled to have constant screened fragments across all replicates.
To scale the data, fragments with more than 10 counts per replicate were considered sufficient sampling levels. Two different distributions of fragments were observed when comparing average values from 2 mM (or 5 mM) to 0 mM 3‐AT. Distributions centered below 1 (the value of counts is minor in 2 mM or 5 mM than in 0 mM) were set as deriving from the screened fragments. For each library, the mean of the distribution of average values in 2 mM or 5 mM with respect to 0 mM was used as a reference level and assigned values of 1. All counts values in 2 and 5 mM were scaled according to these factors.
2.6. Statistical analysis
Growth in 2 mM or 5 mM 3‐at as detected by scaled read count values compared to 0 mm was considered a potential PPI signal. The statistical significance of differential growth was evaluated from three replicates in each growth condition. For differential growth analysis, only those fragment pairs with at least 10 counts per million across all replicates were taken. The R package edgeR 14 was utilized to identify fragment pairs that showed a statistical increase in selective conditions (2 mM or 5 mM 3‐AT) over background (0 mM 3‐AT). Internally, edgeR performs normalization of the counts values to adapt for varying sequencing depths as represented by differing library sizes. A negative binomial model is fitted to determine differential growth using Fisher's exact test for significance testing, which computes p value and the adjusted p values (false discovery rate [FDR]) for each protein fragment pair. Upon further analysis, fragment pairs that had log fold change (logFC) > 1 and FDR < 0.1 in the presence of 3‐AT when compared with 0 mM 3‐AT were considered as possible interactions.
2.7. Interaction filtering
For the test of binary interactions, no filtering was applied beyond the test of statistical significance to mimic a true binary test condition better. For all‐vs‐all analysis, more stringent filters were applied to remove interactions with low support. The all‐vs‐all analysis required the following to report a PPI: multiple fragments in either orientation, logFC >1 and FDR < 0.1, or one fragment in either orientation with a logFC >3 and an FDR < 0.01.
2.8. Analysis of interaction space coverage
Since AVA‐Seq works with fragments, the total space between two proteins as a matrix of dimensions m × n was considered, where m represents the length of the first protein in amino acids and n represents the length of the other protein in amino acids. Whenever fragments from a pair were tested, the part of the matrix corresponding to the amino acid area would be considered covered. In the case of complete protein–protein space coverage, there would be enough fragments from both proteins to cover the space in the whole matrix. Otherwise, the covered matrix's corresponding percentage would be considered a percentage of the tested area between those two proteins. Data were then plotted according to the orientation of the fragments (AD or DBD associated).
3. RESULTS
3.1. Overview of the AVA‐Seq method
The goal of this manuscript was to scale‐up AVA‐Seq while allowing a comparison to other methods in its ability to recover binary interactions. To do so, we utilized the hsPRS‐v2 and hsRRS‐v2 interaction libraries. 10 Most applications of the hsPRS‐v2 and hsRRS‐v2 utilize full‐length proteins with a form of Y2H. The number of RRS interactions in each experiment would be set to zero threshold. Meaning all “real” or positive interactions would need to be above this RRS threshold to be considered significant. For example, when screening the hsPRS‐v2, Choi and colleagues utilized 10 versions of four assays to offer a fair comparison between many different methods. However, we did not use the PRS or RRS in a conventional way.
An essential difference is we utilized a library of protein fragments for each hsPRS‐v2 protein rather than full‐length proteins. Figure 1 illustrates the method approach for this study. First, two separate pools of PRS proteins were made from the hsPRS‐v2 library (Supplementary Table 1). “PRS Batch 1” contained 39 PRS proteins and 9 RRS protein pairs selected at random with the assumption they do not interact, while “PRS Batch 2” contained 41 PRS proteins and 9 RRS proteins. These proteins were chosen to maximize the protein pairs and minimize the number of proteins needed in each batch, meaning there are multiple proteins involved in multiple interactions. Some of the interacting proteins also overlap with proteins in the RRS. Both batches were prepared as separate experiments (meaning no cross‐interactions between batches would be detected) but processed in parallel. Briefly and as described in Andrews et al., 11 the specific proteins for each batch (Supplementary Table 1), including selected RRS proteins, were pooled separately, sheared, size selected, and ligated into pBORF‐AD and pBORF‐DBD. After selecting ORFs, fragments were amplified, “stitched” together using overlap extension PCR, and ligated into pAVA for screening. Screening consisted of triplicate samples grown under varying selective media (0 mM, 2 mM, and 5 mM 3‐AT). Then, the surviving plasmids were sequenced using NGS to detect differential growth among the various conditions. Two separate transformation and screening events were conducted for each PRS Batch (i.e., Batch 1A and 1B and should be considered biological replicates as the plasmids came from the same DNA pool but were transformed separately). Data analysis for PRS Batch 1 and 2 was performed identically but separately since the protein pools are unique (Figure 1B). For each batch, the expected binary interactions for hsPRS‐v2 were determined (Supplementary Table 2), and a cumulative table of all‐vs‐all interactions (PRS Batch 1 and 2 combined) was populated (Figure 1B, Supplementary Table 3).
FIGURE 1.

Method schematic. (A) PRS Batch 1 (39 proteins) and Batch 2 (41 proteins) were treated as separate experiments and processed in parallel (Supplementary Table 1). First, the proteins were pooled, sheared, size selected, and ligated into pBORF‐AD and pBORF‐DBD. After selecting the open reading frame (ORF), fragments were amplified, “stitched” together using overlap extension PCR, and ligated into pAVA for screening. For each PRS batch, two separate screenings (A and B) were conducted, and the data generated were pooled during analysis. (B) Data analysis for Batch 1 and 2 was performed identically but separately since the protein pools are unique. Here, a graphical representation of criteria used for analysis along with several recovered PPIs is shown. For each batch, the expected binary interactions were determined (Table 1 and Supplementary Table 2), and a cumulative table of all‐vs‐all interactions (Batch 1 and 2) were populated (Supplementary Table 3). Batch 1 and 2 included an additional nine RRS proteins for control. Different FDR and logFC requirements were utilized at other steps of the data analysis process. These steps are color‐coded, with blue being the least stringent and orange being the most rigorous criteria to define an interaction. DBD, DNA‐binding domains; PCR, polymerase chain reaction; PRS, positive reference set; RRS, random reference set
An essential aspect of AVA‐Seq, especially as pools of test fragments are scaled‐up, is the ORF filtering. As the number of proteins tested in a pool increases, the screening area increases by a factor of 36 (6 × 6 possible reading frames), making the likelihood of both fragments being in Frame 1 to be 2.7% without ORF filtering. With this study, nearly 80% of the fragments associated with DBD and AD have been enriched for Frame 1 (data not shown). After “stitching” the DBD and AD fragments together, 64% of convergently fused fragments generated were in Frame 1. ORF filtering readily allowed greater than three‐fold coverage of the interaction space in a short amount of time without exhausting resources. One benefit of using fragments over full‐length proteins is in the context of an auto‐activating protein, meaning not all fragments from a protein might auto‐activate the system by interacting with RNAP (AD) or lambda cI (DBD). Therefore, only the in‐frame fragments that interact with multiple out‐of‐frame fragments need to be removed as these are suspected to be possible examples of auto‐activation. 15 , 16 Here, 13 fragments fused to RNAP and interacted with more than 3 out‐of‐frame fragments fused to lambda cI were removed. These are suspected of interacting with lambda cI and auto‐activate. Similarly, 21 fragments were removed that auto‐activate by interaction with RNAP. These analyses were only conducted on 2 mM conditions as the 5 mM conditions did not show significant numbers of auto‐activators.
3.2. Analysis of sequence data
A necessary change that was required to the AVA‐Seq analysis method resulted from scaling‐up batch size and sequencing read numbers as would be applied in a large‐scale interaction mapping project. While the concept of deep sequencing to identify count differences in various conditions has been used in many methods, these analyses methods, such as RNA‐seq, have different data assumptions. These assumptions may be correct for smaller AVA‐Seq projects with very few expected interactions. However, a detailed investigation of the data set consistently showed decreased sequencing read counts of many tested fragment pairs between 0 mM to 2 mM 3‐AT conditions and a smaller decline from 0 mM to 5 mM 3‐AT. Potential interactions between thousands of fragment pairs in 2 mM 3‐AT, the less selective condition, distribute a significant portion of the sequencing reads across more fragment pairs, causing sequences from the screened fragment pairs to decrease in overall proportion. Under standard assumptions, this would result in a “negative” interaction being observed, that is, a decrease in sequence counts from a protein pair under selective conditions versus nonselective conditions. We work under the assumption that an increase in selective conditions would result in very few true “negative”/repulsive interactions or interactions leading to the lethality of the host bacteria. Instead, the fact that this happened on a large scale in 2 mM (the less selective conditions) suggests it may result from sequence reads being distributed across numerous protein pairs that can grow under these selective conditions. The noninteracting pairs are then left with a deficit of sequence reads. To address this, data were scaled appropriately based on multiple factors, as discussed below (see Section 2). Scaling consistently decreased the numbers of “negative” interacting fragment pairs by shifting them toward either no interaction or interaction (Supplementary Figure 1, Supplementary Table 4) and increased overall numbers of interacting fragment pairs (Supplementary Table 5). This indicates that scaling had the intended effect on negative interactors and concurrently resulted in fragment pairs that fell below FC due to low read counts in selective conditions correctly being scaled to the point of being called interacting. Furthermore, the removal of auto‐activators became necessary with the large numbers of screened fragments. The use of residual out‐of‐frame fragments is a novel approach to identifying potential auto‐activators of the system and is discussed below.
For each protein pair tested, the percentage of the total possible test space covered by at least one fragment from each protein was documented and plotted in Figure 2 (RRS proteins were processed separately, Supplementary Figures 2 and 3). Orientation of the fragment pairings with respect to the AD or the DBD is illustrated in Figure 2; 73.2% and 69.7% of the total possible search space were covered by at least one in‐frame fragment for both Batch 1 and 2, respectively. While the total percentage of the possible search space covered by at least one in‐frame fragment is high, it is apparent some proteins have coverage in one orientation but not the other (i.e., IFG2 and MAFG in PRS Batch 1; Figure 2). Moreover, ORF filtering yielded inadequate coverage or complete absence of proteins <~300 amino acids in length. Indeed, only 25% of known interactions (PRS pair) involving one protein of 300 amino acids or less were recovered. In this study, the average full‐length of known interacting proteins that the AVA‐Seq method recovered were 534 amino acids. The average full‐length protein for known protein interactions that were not detected in this study but had at least one protein fragment pair with the expected interacting partner was 339 amino acids. This is likely because fragments were size selected for approximately 450 base pairs (150 amino acids), which may reduce the chances of capturing multiple fragments without stop codons when ORF filtering is applied. Yet, for proteins with a length greater than 300 amino acids, 75% of interactions were captured. This argues for the sensitivity of the AVA‐Seq system when the conditions are right. Specifically, the span and depth of coverage of a protein by tested fragments are important and likely affected by length when ORF filtering is used. Figure 3 aims to address the influence protein length has on whether the known protein interaction pair (PRS pairs) will be detected as an interaction with our system. Protein pairs with at least one short protein were less likely to have a known interaction detected in the system (Figure 3A). That is, when the expected interacting proteins have full lengths >434.7 amino acids, on average, there is a significantly higher chance of detecting the interaction when compared to predicted interacting pairs, which did not show an interaction (mean full length of 245.7 amino acids; p value = 4.40411 × 10⁻⁵). Likewise, as the number of unique fragments that represents the expected interaction increases relative to minimum protein length (depth of coverage), there is a statistically significant increase in detecting the interaction (p value = 9.0144 × 10⁻⁷; Figure 3B). This improvement in detecting an interaction by deeper coverage is not due to simply increased chances of detecting a random interaction and is discussed below. To investigate whether the bias against detecting interactions from pairs with at least one shorter full‐length protein was not due to an inherent bias of the system against shorter proteins, the full length of the protein was plotted versus the depth of coverage by fragments (Figure 3C). As Figure 3A,B suggests, likely, expected interactions (as part of the hsPRS‐v2 library) were not detected simply because shorter proteins were less likely to have sufficient depth of coverage. That is, they might have a single fragment covering most of the length of the protein (Figure 2A,B), but multiple fragments appear to be beneficial in detecting an interaction, and these only increase with the length of the protein.
FIGURE 2.
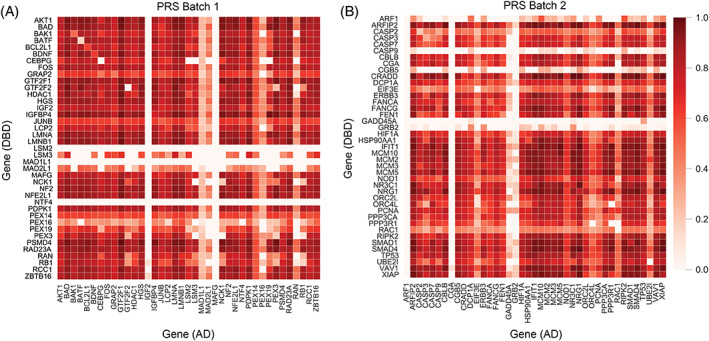
Heat maps of gene coverage. (A) Positive reference set (PRS) Batch 1 (39 × 39 proteins). (B) PRS Batch 2 (41 × 41proteins). Color scale indicates percent gene coverage in a specific orientation (AD or DBD associated), with 1 being 100% coverage of the protein interaction space and 0 representing 0% coverage. Random reference set (RRS) proteins are not included. AD, Activation domains; DBD, DNA‐binding domains
FIGURE 3.

Influence of protein length versus interaction on the PRS protein pairs. This study utilizes 47 pairs of proteins known to interact (a subset of the hsPRS‐v2 library). This figure characterizes these well‐studied positive reference interactions in the context of the AVA‐Seq method. (A) Individual protein length in amino acids of proteins used in this study categorized into expected interaction not detected (blue; mean 245.7; n = 27) or expected interaction detected (red; mean 434.7; n = 20; t = 4.524, df = 45). p value < .0001 indicated. (B) The minimum number of relative fragment starting points divided by protein length in amino acids versus expected interaction not detected (blue; mean 0.03088; n = 27) or expected interaction detected (red; mean 0.1211; n = 20; t = 5.689; df = 45). p value < .0001 indicated. (C) The number of protein fragments per protein length (in amino acids) plotted against the minimum protein length in the expected interacting pair. Blue dots represent expected interaction not detected, and red dots represent expected interaction detected. AVA‐Seq, All‐vs‐all sequencing; PRS, positive reference set
3.3. Binary interactions
AVA‐Seq recovered 20 of the 47 (42.55%) PPIs tested from the hsPRS‐v2 (Table 1). Of the 20 binary expected interactions detected using AVA‐Seq, a few hundred fragments passed filtering, whereas a few thousand did not, attesting to the system's selectivity. Of the 20 hsPRS‐v2 pairs that AVA‐Seq detected as domain‐domain interactions, five were not captured by other assays 10 (Table 1). Additionally, at least two phosphorylation‐dependent protein interactions (TP53:UBE2I and SMAD1:SMAD4) were recovered, highlighting the ability to identify potentially novel interaction regions between proteins, which typically require a posttranslational modification and are not feasible to detect with a bacteria system. Why this is possible is not yet clear but will be of interest in future investigations.
TABLE 1.
Detected binary PPI recovered from hsPRS‐v2
| Protein 1 | Protein 2 | Recovered by other methods 10 | |
|---|---|---|---|
| 2 | LMNA | LMNB1 | * |
| 5 | LCP2 | GRAP2 | * |
| 6 | BAK1 | BCL2L1 | * |
| 11 | PSMD4 | RAD23A | * |
| 15 | MAFG | NFE2L1 | * |
| 27 | MCM2 | MCM3 | * |
| 28 | AKT1 | PDPK1 | * |
| 30 | NF2 | HGS | * |
| 31 | TP53 | UBE2I | * |
| 32 | HIF1A | TP53 | * |
| 34 | SMAD1 | SMAD4 | * |
| 35 | CEBPG | FOS | * |
| 37 | SMAD4 | DCP1A | * |
| 40 | NR3C1 | HSP90AA1 | * |
| 46 | LMNA | RB1 | * |
| 49 | ORC2L | MCM10 | |
| 51 | HDAC1 | ZBTB16 | |
| 52 | XIAP | CASP3 | |
| 55 | RIPK2 | NOD1 | |
| 59 | MCM2 | MCM5 |
Note: The protein interaction pair numbering in the left‐most column and protein naming are according to Choi et al. 10 The asterisk (*) denotes that the PPI was recovered using a method published in Choi et al. The last five without an asterisk are interactions recovered uniquely by AVA‐Seq.
Abbreviations: AVA‐Seq, All‐vs‐all sequencing; hsPRS‐v2, human positive reference set; PPI, protein–protein interaction.
As mentioned above, there was a clear trend for detecting interactions where one of the interacting partners was >350 amino acids. While the average full‐length protein in the study was 534 amino acids, in the case of the 27 binary interactions that were not detected, 23 (85%) contained one partner with a full length less than 350 amino acids.
3.4. Sensitivity and selectivity of AVA‐Seq system
The sensitivity of AVA‐Seq was controlled on a fundamental level by the addition of a known protein‐interacting pair in the pAVA vector (LGF2‐Gal11p). This control was added to each library at the screening stage (see Section 2) and showed consistently strong results in both 2 and 5 mM conditions with an average logFC and average FDR of 7.09 and 1.76 × 10⁻¹³, respectively.
The selectivity of a particular system is tested when all permutations are considered, such as an all‐vs‐all screen. Under these conditions, potentially millions of pair‐wise interactions are tested, and the chance for significant numbers of random interactions increases unless the correct selection criteria are applied. In some cases, single proteins were represented by hundreds of fragments that were screened against thousands of fragments from all other proteins. The primary statistical cutoffs using a log2 FC (logFC) of 1 and FDR of 0.1 are selective and resulted in 2606 unique fragment pairs called interacting from a total of 283 676 screened fragments. That is, 0.91% of the total fragments considered for statistical testing were involved in an interaction.
Furthermore, the data were searched for evidence that fragments called interacting were not simply random representations of all screened fragments. Multiple approaches were employed to find proof that recovered interacting fragments represent “real” and relevant interactions. We aimed to identify fragments that overlap known interaction domains, interact with fragments that lay outside of screened fragment peaks, and interact with more localized fragments than random fragments. We would expect these characteristics to represent interacting fragments covering an actual interacting domain. First, evidence for fragments identified as interacting in the system and overlapped with previously identified interacting regions was identified. For example, fragments called significant in the system for the HGS|NF2 interaction were plotted (Figure 4). In both the HGS and NF2 examples, the fragments that were enriched under selective pressure indicate an interaction (red trace) and align well to the interacting regions from the literature 17 , 18 , 19 (gray shaded box[es] in Figure 4A,B). The exact interacting fragment pairs between the two proteins are highlighted in Figure 4C,D, and all fragment pairs (called interacting or noninteracting) are listed in Supplemental Table 6. The interacting fragment clustering indicates a highly selective screening method, especially given the thousands of protein fragment pairs that did not pass filtering criteria as an interaction (Supplemental Table 6). These fragments, however, were only recovered in the less stringent, 2 mM 3‐AT, inhibitor conditions potentially indicating transient or weak protein contact points. The observation that the screened fragment pairs (Figure 4A; blue trace) appear to be bimodal or have two separate populations is likely due to the three BSTX1 restriction sites in the HGS protein (residues 370, 371, and 693). In most interaction pairs, the data often indicate regions of proteins with extremely high counts of fragments paired with other proteins, but did not yield any called as interacting, confirming the interaction pair is not simply random fragment pairs that pass the filtering criteria.
FIGURE 4.

Selectivity of fragment interaction. Panels A and B illustrate the selectivity of the interacting fragments between HGS and NF2 genes. The blue traces (A and B) represent the number of screened fragments (left y‐axis) versus fragment start point, while the red traces (A and B) represent interacting fragments (right y‐axis) versus fragment start point. The gray shaded regions in A and B highlight the expected interaction region of HGS with NF2 from the literature. 18 Panels C and D illustrate the fragment pairings between HGS and NF2 along with logFC and FDR, respectively. (E) The average fragment distance in amino acids (aa) plotted against the average protein length. Protein fragments utilized in this plot were associated with proteins that had at least two interacting start points fragments with at least one other interacting partner. The average distance of interacting starting points was then computed. (F) Paired t test for data in the panel (t = 10.84; df = 40). FC, Fold change; FDR, false discovery rate
As a follow‐up and to demonstrate that interacting protein fragments are not simply randomly drawn from screened fragments, the average gap between fragment start points for screened fragments were compared to those of interacting fragments. The goal was to show the localization of interacting fragments is not random across the protein but more likely to be localized, assuming there is one interacting domain. Figure 4E plots full‐length protein >450 amino acids (~3× average fragment size) versus average distance between fragments in amino acids. Unique interacting fragment pairs (where at least one of the fragment's start points was different) were extracted from the all‐vs‐all data, and the distance between their start points was averaged. The data for random (noninteracting) fragments were generated using random starting points picked 1000 times. The R 2 values for the random and interacting starting points were 0.9917 and 0.4961, respectively. This was not an unexpected screening event, as evidenced by the poor linear fit of the interacting fragment start points. The offset observed between the interacting and random start points is dependent on the length of the fragment used. In our study, we used a fragment length of ~450 bp; however, if we were to double this to a length of 900 bp, there would be an increased chance of capturing the interacting region in each fragment. Additionally, the analysis in Figure 4E does not account for the three‐dimensional space that proteins occupy, meaning you could certainly have two protein fragments interacting and are in proximity in three‐dimensional space, but when they are represented linearly, they appear far apart. Figure 4F plots data from Figure 4E using the paired t test, indicating a statistically significant p value < .0001.
The tested set included randomly selected protein pairs (RRS) for which no evidence of interaction has been reported. 10 Normally, the threshold for determining the percentage of PRS detection is set at a zero RRS detection of pairs of full‐length proteins. 10 However, in our application of the interaction library, it does not seem feasible to do this as the interactions we are detecting are significant and reproducible. Six of the 12 RRS protein pairs did not interact in our system, and the remaining 6 showed statistical significance using the same criteria as the binary interactions (logFC > 1, FDR < 0.1; Figure 1B; Supplementary Figures 2 and 3). Five of the six RRS interacting pairs had more than one fragment pair, and one pair survived the stringent 5 mM 3‐AT growth conditions, which indicates a strong interaction in our system. These interactions need to be investigated further to understand if they are biologically relevant or if domains interacted due to being surface exposed due to the fragmented approach used here.
3.5. Considering the RRS interactions in the context of AVA‐Seq
This is the first time AVA‐Seq has been explicitly tested with a more extensive set of expected noninteractors. It revealed essential modifications necessary for the analysis of large‐scale fragment interactions. Though the system generates millions of pairs that are expected not to interact, a direct test with randomly selected proteins is interesting. Six pairs of RRS protein interactions were included in each PRS batch (Supplementary Table 1). The RRS results are typically used as a threshold, meaning that any interaction detected in the PRS be stronger (above the threshold) when compared to the most robust RRS interaction.
The table of 584 all‐vs‐all interactions has 5 RRS interactions and 16 PRS interactions which were recovered (Figure 1B; Supplementary Table 2). Upon applying even more stringent criteria, 584 interactions reduce to 431, and subsequently, the PRS interactions reduce from 16 to 12 (out of 47), and the RRS interactions reduce from 5 to 2 (out of 12; Figure 1B). The more stringent filters effectively require “stronger” interactions that either passed in the 5 mM 3‐AT conditions or had higher significance in the 2 mM conditions. The fact that two of the RRS met these conditions means that the interactions are reproducible in the system while possibly not biologically relevant. If the number of RRS is reduced to 0 simply on the criteria of “stronger interaction,” the resulting data might not always be a proxy for a biologically relevant interaction. With the knowledge that interaction strength/reproducibility in an in vitro system may not automatically equate to biological relevance, we recommend that future studies provide tables of reasonable cutoffs and all data so each investigator can decide on thresholds appropriately, that is, a strength of the various levels of interaction quality information obtained from AVA‐Seq.
We realize our method is a nontraditional use of the PRS and RRS, making it difficult to compare directly to other studies of the same gold‐standard interaction set. However, we are confident that our system is detecting interactions reproducibly across a range of strengths and believe the user can filter the data based on what their needs may be. Specifically, our use of fragments over full‐length proteins may cause interactions of domains (both biologically relevant and irrelevant) to be detected. Additional stringency measures could also be applied, such as increasing 3‐AT concentrations or using multiple reporters to generate an interaction score or confidence score. 20
3.6. All‐vs‐all analysis on data set meant for binary tests
Due to the inherent design of AVA‐Seq, novel interactions were detected between hsPRS‐v2 proteins outside the simple binary tests. In the context of an all‐vs‐all analysis of the data, the search space of interactions is dramatically increased, and therefore, more stringent criteria need to be applied. An inexhaustive list of known PPIs was identified using this approach (Table 2) and many novel interactions (selected interactions listed in Table 3). These interactions are supported by multiple criteria, which gives great confidence to the robustness of the interaction data, at least in the context of this in vitro screen. These criteria include fragments with similar start positions, fragments being both AD and DBD associated, interactions detected under both 2 mM and 5 mM 3‐AT selective pressure, and interactions being detected in multiple unique transformation events. A total of 901 PPIs were detected with any form of evidence; however, applying simple criteria requiring multiple fragments or fragments in both orientations (see Section 2) reduced this to 584 interactions among the PRS and RRS proteins (Figure 1B). The same criteria applied to the binary interactions reduced those from 20 detected to 16 (a 20% loss of known interactions). The 901 PPIs detected in the all‐vs‐all data are 37%, while the 584 PPIs are 24% of 2451 possible interactions given the batch sizes of 48 and 50 proteins (including RRS proteins; total possible interactions calculated using [n × (n + 1)/2] + n). Other studies conducted with AVA‐Seq on randomly selected proteins have shown the expected scale‐free nature of the proteins, with most proteins having few interacting partners (unpublished data). However, in this study, we did not observe a scale‐free network. We observed a steady decrease in interacting partners (Supplementary Figure 4), indicating this may be due to the nonrandom selection of the PRS proteins.
TABLE 2.
Known interactions detected using all‐vs‐all
| Previously known protein–protein interactions confirmed in this study | ||||||||||
|---|---|---|---|---|---|---|---|---|---|---|
| Protein 1 | Protein 2 | Orient 1 | Orient 2 | 2 mM | 5 mM | logFCmax | FDRmin | #Libs | #uniqFragPairs | Reference |
| MCM5 | MCM3 | 31 | 5 | 19 | 17 | 6.47421451 | 3.12E‐09 | 2 | 29 | 26 , 27 |
| MCM2 | MCM10 | 5 | 7 | 10 | 2 | 3.62060897 | 7.00E‐05 | 2 | 11 | 28 |
| MCM2 | MCM3 | 56 | 5 | 38 | 23 | 3.0538095 | 1.64E‐13 | 2 | 46 | 26 , 28 |
| ORC2L | MCM3 | 2 | 5 | 5 | 2 | 3.69014656 | 0.00897978 | 1 | 7 | 29 , 30 |
| FOS | LMNA | 14 | 7 | 19 | 2 | 6.34040694 | 2.21E‐235 | 1 | 15 | 31 |
| HSP90AA1 | HSP90AA1 | 4 | 4 | 6 | 2 | 9.03727216 | 1.25E‐12 | 1 | 6 | 32 |
| HSP90AA1 | TP53 | 2 | 2 | 4 | 0 | 3.54728603 | 2.84E‐29 | 2 | 4 | 32 |
| CASP3 | XIAP | 2 | 0 | 1 | 1 | 4.71341933 | 6.82E‐21 | 1 | 1 | 33 , 34 , 35 |
| XIAP | RIPK2 | 1 | 0 | 1 | 0 | 2.62693776 | 0.07813117 | 1 | 1 | 4 , 36 |
| RIPK2 | Nod1 | 1 | 0 | 1 | 0 | 2.02393071 | 0.06723463 | 1 | 1 | 37 |
| NOD1 | HSP90AA1 | 5 | 0 | 4 | 1 | 5.39888581 | 0.01624673 | 1 | 4 | 38 |
| NOD1 | XIAP | 3 | 0 | 3 | 0 | 3.15614296 | 0.01775524 | 1 | 3 | 36 |
Note: Selected known interactions from the combined all‐vs‐all data from Batch 1 and Batch 2, including RRS proteins. This list is a subset of Supplementary Table 3.
Abbreviations: FC, Fold change; FDR, false discovery rate; RRS, random reference set.
TABLE 3.
Novel interactions detected using all‐vs‐all
| Novel protein–protein interactions with multiple criteria | |||||||||
|---|---|---|---|---|---|---|---|---|---|
| Protein 1 | Protein 2 | Orient 1 | Orient 2 | 2 mM | 5 mM | logFCmax | FDRmin | #Libs | #uniqFragPairs |
| SYCE1 | ARFIP2 | 3 | 3 | 4 | 2 | 3.81180044 | 4.26E‐08 | 1 | 5 |
| PDE4D | ORC2L | 2 | 3 | 3 | 2 | 4.19890427 | 0.00022584 | 2 | 4 |
| PDE4D | ERBB3 | 1 | 6 | 5 | 2 | 3.77056145 | 1.60E‐05 | 2 | 6 |
| PDE4D | MCM3 | 4 | 10 | 11 | 3 | 4.43184888 | 0.00031729 | 2 | 12 |
| SMAD1 | MCM2 | 6 | 6 | 9 | 3 | 5.19962407 | 0.00317224 | 2 | 10 |
| SMAD1 | MCM3 | 25 | 1 | 16 | 10 | 5.5137314 | 1.62E‐10 | 1 | 19 |
| IFIT1 | MCM5 | 9 | 1 | 8 | 2 | 5.59073478 | 6.75E‐53 | 2 | 5 |
| IFIT1 | MCM3 | 7 | 1 | 5 | 3 | 3.50753705 | 2.23E‐11 | 1 | 7 |
| DCP1A | MCM2 | 13 | 11 | 21 | 3 | 3.37901756 | 1.15E‐08 | 1 | 22 |
| DCP1A | MCM3 | 58 | 1 | 28 | 31 | 3.82553839 | 1.36E‐08 | 2 | 44 |
| NOD1 | MCM3 | 21 | 1 | 13 | 9 | 3.70163743 | 8.11E‐23 | 1 | 16 |
| NOD1 | MCM10 | 3 | 1 | 2 | 2 | 5.23560434 | 0.00116406 | 1 | 3 |
| NOD1 | MCM2 | 7 | 5 | 9 | 3 | 6.95460138 | 3.61E‐50 | 1 | 9 |
| TP53 | MCM3 | 26 | 1 | 15 | 12 | 5.4781251 | 3.80E‐09 | 2 | 16 |
| TP53 | MCM2 | 3 | 2 | 5 | 0 | 4.47863022 | 0.01130445 | 1 | 5 |
| TP53 | MCM5 | 5 | 2 | 5 | 2 | 3.13064009 | 7.52E‐07 | 2 | 6 |
Note: Selected novel interactions from the combined all‐vs‐all data from Batch 1 and Batch 2, including RRS proteins. This list is a subset of Supplementary Table 3.
Abbreviations: FC, Fold change; FDR, false discovery rate; RRS, random reference set.
The hsPRS‐v2 is enriched with proteins found in cancer pathways. Supplementary Figure 4 shows the top seven proteins have >30 protein partners as indicated by values on the far‐left x‐axis. These top proteins have twofold to threefold more interactions when compared to the median value of 12 interactions. Some of these top proteins include DNA replication proteins such as MCM2, MCM3, MCM5, and TP53. Figure 5 highlights several proteins that interacted with MCM3 and their fragment location regarding the MCM3 sequence. Due to the shearing process (before assembly of the protein fragment pairs into the pAVA vector), all screened fragments of MCM3 share a similar profile with minor deviations in the scale. For clarity, one representative trace (shown in black) is shown with reference to the left y‐axis. The interacting fragment's location and abundances from selected proteins (colored lines) are shown with reference to the right y‐axis. In general, all nine proteins interact with two regions of the MCM3 sequence. The first is the region between 200 and 300 aa, and the second is a larger area of approximately 600 and 750 aa. The first region is surrounded by four BstX1 restriction sites (as indicated by arrows), limiting the MCM3 sequence coverage in the regions just before and after these sites (residues 1 to 165 and 335 to ~425).
FIGURE 5.

Overlay of selected protein fragments with MCM3. Top: One representative trace (shown in black) is shown with reference to the left y‐axis. The location of interacting fragments and abundance from selected proteins (colored lines) are shown with reference to the right y‐axis. BstX1 restriction sites are indicated with a black arrow (residues 165, 302, 335, and 399). MCM3 phosphorylation sites include S112, S160, T198, S292, T383, S535, S672, T674, S711, T722, and S728 (iupred.elte.hu). 25 Bottom: IUPred score is shown for the primary sequence of MCM3. 21 A score closer to 1.0 indicates a region of high disorder, and a score closer to 0.0 indicates less disorder. For simplicity, the x‐axis for the bottom graph uses the same amino acid numbering as the top graph
The bottom portion of Figure 5 illustrates the predicted disordered region of the MCM3 C‐terminus. The IUPred score is a prediction of protein disorder based on primary amino acid sequence. 21 A score closer to 1.0 indicates a highly disordered region, while a score closer to 0.0 indicates less disordered. There seems to be a strong correlation between interacting protein fragments and higher disorder. In Figure 5, the interacting protein fragments between MCM3 and MCM2, MCM5, TP53, ORC2L, ORC4L, NOD1, PCNA, UBC9, and DCP1A show significant clustering at the C‐terminal region of MCM3. Additionally, Supplemental Figure 5 highlights the clustering of MCM2, MCM3, and MCM5 fragments to the N‐terminal disordered region of ORC2L (~1–250 aa). Further work is needed to understand the implications of this correlation fully and is of extreme interest in our ongoing work.
4. DISCUSSION
The AVA‐Seq system takes advantage of NGS to significantly increase either the breadth or resolution of a PPI screen, providing evidence for domain–domain level interaction information. However, the challenges of scaling the system for multiple millions of tested interactions in a single batch of sequencing are evident, especially in the analysis. Using a gold‐standard protein reference set allowed us to modify the methods of analysis to address these issues and compare the outcome to other systems. Here, AVA‐Seq recovered 20 of 47 PPIs, with 5 (25%) of these binary interactions unique to the AVA‐Seq method. 10 It is highly likely the assay properties of AVA‐Seq enrich for PPIs would not usually be “detectable” using existing two‐hybrid assays, particularly those relying on the expression of full‐length proteins. 22 This is likely due to the fusion of smaller protein fragments that are either easier to express or are more exposed relative to a full‐length protein. A small percentage of the human interactome comprises very stable and functionally conserved interactions. 5 Because AVA‐Seq was able to recover unique interactions, this method may have an advantage for screening intrinsically disordered proteins. For example, AVA‐Seq has dual orientation fusions built into the design. This aspect alone should increase detection sensitivity by at least 1.3‐fold within a single assay. 10 Additionally, Choi and colleagues expanded on the idea that permuting the experimental conditions has added benefits. Using 10 versions of four assays, Choi et al. demonstrated 63% recovery of PPIs using hsPRS‐v2 as a standard. 10 Since AVA‐Seq uses fragmented proteins rather than full‐length proteins, having a PPI requirement to have more than one fragment start point and appear in both orientations has significant added value when determining novel interactions or increasing the resolution of a protein interaction site.
For the all‐vs‐all data, a large fraction of all combinations, 37% with minimal filtering and 24% with expanded filtering, were recovered as having some evidence for interacting. While this fraction is high with respect to other studies, it is essential to note that the proteins used here are not randomly selected but may be more biased toward proteins that interact with many partners. Typically, proteins with connectivity above a certain threshold are removed, but that was not possible, given the steady decrease trend in a plot of protein connectivity rather than a clear inflection point. Rather than interpreting this as a lack of specificity, we consider that the nonrandom selection of the PRS proteins may contribute, but further investigation will be necessary. Indeed, new studies with randomly selected proteins have shown a normal connectivity plot with expected inflection points, allowing a cutoff of possibly “sticky” proteins (personal communication).
In the novel set of interactions, several were of interest to human disease. Specifically, the TP53|MCM5 23 and TP53|MCM2 24 proteins have been associated previously. Interestingly, both were associated with TP53 gain‐of‐function mutations, and, at least in the case of the MCM2 interaction, wild‐type interactions were not consistently detected. The gain‐of‐function mutations may increase the strength of the interaction to a level that in vitro systems could detect even though the interaction would not be observed under wild‐type conditions; however, the AVA‐Seq method, utilizing small protein fragments with multiple start and stop fusions, was able to detect the interactions. Even though the TP53 used in this study contains P72R and P278A point mutations, not all fragments necessarily span these mutations. While a few of the fragment pairs between TP53|MCM5 and TP53|MCM2 did include a P278A mutation which is part of the hsPRS‐v2 template for TP53, significant interactions were also detected with TP53 fragment, which did not have this portion of the protein sequence. There were no noticeable differences between fragment pairs containing or lacking the P278A mutation in terms of the strength of the interaction. While interactions were detected between fragments of wild‐type TP53|MCM5 even in the more stringent 5 mM 3‐AT conditions and TP53|MCM2 had interactions only in the 2 mM condition, these interacting pairs hint that interactions between wild‐type TP53 and MCM proteins are likely. A future study could utilize the AVA‐Seq system to look at gain‐of‐function mutations versus wild‐type to see if the mutation(s) does indeed simply increase the strength of the interaction rather than create it de novo.
As with any method, some limitations exist, and the key is to adapt the method most effectively to each type of study. Here, the AVA‐Seq method was adapted to a much larger set of possible interactors. This is key to its potential use in whole‐genome interaction mapping. Challenges from pooling thousands of potential interactors on a sequencing run were addressed. Removal of fragments that auto‐activate the system was implemented using a novel approach based on residual out‐of‐frame fragments. Other challenges include instances where there is an indicated interaction in 5 mM but not in 2 mM selection media despite 2 mM being the less selective condition. A significant modification was the scaling of the 2 mM data to address many of these.
Furthermore, it is possible that deeper sequencing of 2 mM replicates, when compared to 5 mM replicates, may be necessary as there are significantly more interactions that occur under the less stringent 2 mM selection. Because of this, the question remains what depth of sequencing is needed for the 2 mM replicates. It is clear from these data the more unique fragments a protein has increased the chance of detecting an interaction. This notion helps reiterate that more fragments overlapping a given area not only increases chances of detecting an interaction but also increases the resolution of the protein interaction region with a given protein or set of proteins. Notably, these are not just a function of increased random fragment pairs being detected as interactions, but rather the system remains selective, as discussed below. Another exciting question uncovered was regarding the feasibility of ORF filtering with short proteins. As indicated in Figure 3, there is a significantly higher chance to detect a protein interaction if both proteins are longer because of the increased probability that ORF selection produces more overlapping fragments for those proteins. There are several potential ways to mitigate these effects in future studies. First, for more focused protein network studies, such as this, smaller shearing (i.e., 250–300 base pair instead of 450 base pair) with no ORF filtering would allow for smaller proteins to make it into the final fragment pool and eliminate one source of bias. The benefit of this system is tested fragments are C‐terminal to the fusion proteins allowing the testing of fragments that include stop codons. Another option would be to synthesize gene fragments of the proteins eliminating the need for ORF filtering. Although the ORF filtering is essential to reduce the screening area when screening large protein pools (unpublished data), there may be significant value in terms of interaction resolution in generating protein fragment libraries that have not been subjected to ORF filtering offer a higher depth of fragment coverage. It is worth noting that previous work identified different populations of interacting fragment start points when comparing ORF filtered fragments to those which were not. 11 Limitations exist regarding the fragment length amendable to NGS technology.
About 850–900 base pair libraries can consistently be paired‐end sequenced using Illumina technology, limiting individual fragments to approximately 450 base pairs. As with any bacterial system used to express human proteins, interactions requiring one or more posttranslational modifications will likely be missed. However, in the context of this study, two PPIs were recovered, which are dependent on a posttranslational modification. Further research is needed to see if the interacting fragments line up with those identified in the literature. Lastly, using short reads, the likely endpoint of the fragment is estimated based on the size‐selected library length. However, this could be improved in the future by paired‐end sequencing all fragments before the stitch PCR process to identify the start and stop points for all fragments. It would be rare that two fragments would have the same start point in a gene, which would serve as an index to look up points.
CONFLICT OF INTERESTS
The authors declare there are no competing interests.
AUTHOR CONTRIBUTIONS
Stephanie Schaefer‐Ramadan and Joel A. Malek conceived the idea and designed the study. Stephanie Schaefer‐Ramadan and Nayra M. Al‐Thani performed experiments. Stephanie Schaefer‐Ramadan, Nayra M. Al‐Thani, and Yasmin A. Mohamoud collected the data. Stephanie Schaefer‐Ramadan, Jovana Aleksic, Nayra M. Al‐Thani, David E. Hill, and Joel A. Malek analyzed the data. Stephanie Schaefer‐Ramadan, David E. Hill, and Joel A. Malek provided critical insight. Stephanie Schaefer‐Ramadan, Jovana Aleksic, David E. Hill, and Joel A. Malek wrote the manuscript.
PEER REVIEW
The peer review history for this article is available at https://publons.com/publon/10.1002/prot.26288.
Supporting information
Appendix S1: Supporting Information
Supplementary Table 3 List of all significant interactions detected in this study.
Supplementary Table 4. List of all screened fragment pairs between HGS and NF2.
ACKNOWLEDGMENTS
We thank the members of the WCM‐Q Genomics Core for the preparation of DNA libraries and data collection. We appreciate the fruitful discussion and comments provided by Dr. Marc Vidal during the preparation of this manuscript and for providing access to the hsPRS‐v2 and hsRRS‐v2 libraries used in this study. This research was supported by funding from Qatar Foundation to Weill Cornell Medicine in Qatar in the form of the BMRP2 grant.
Schaefer‐Ramadan S, Aleksic J, Al‐Thani NM, Mohamoud YA, Hill DE, Malek JA. Scaling‐up a fragment‐based protein–protein interaction method using a human reference interaction set. Proteins. 2022;90(4):959‐972. doi: 10.1002/prot.26288
Funding information Weill Cornell Medicine in Qatar; Qatar Foundation
DATA AVAILABILITY STATEMENT
Sequences were deposited to the Sequence Read Archive of NCBI under the bioproject ID PRJNA756122.
REFERENCES
- 1. Miura K. An overview of current methods to confirm protein‐protein interactions. Protein Pept Lett. 2018;25:728‐733. [DOI] [PMC free article] [PubMed] [Google Scholar]
- 2. Fields S, Song OK. A novel genetic system to detect protein‐protein interactions. Nature. 1989;340:245‐246. doi: 10.1038/340245a0 [DOI] [PubMed] [Google Scholar]
- 3. Li S, Armstrong CM, Bertin N, et al. A map of the Interactome network of the Metazoan C. elegans. Science. 2004;303:540‐543. [DOI] [PMC free article] [PubMed] [Google Scholar]
- 4. Rolland T, Taşan M, Charloteaux B, et al. A proteome‐scale map of the human interactome network. Cell. 2014;159:1212‐1226. [DOI] [PMC free article] [PubMed] [Google Scholar]
- 5. Luck K, Kim DK, Lambourne L, et al. A reference map of the human binary protein interactome. Nature. 2020;580:402‐408. doi: 10.1038/s41586-020-2188-x [DOI] [PMC free article] [PubMed] [Google Scholar]
- 6. Giot L, Bader JS, Brouwer C, et al. A protein interaction map of Drosophila melanogaster. Science. 2003;302:1727‐1736. [DOI] [PubMed] [Google Scholar]
- 7. Rual JF, Venkatesan K, Hao T, et al. Towards a proteome‐scale map of the human protein‐protein interaction network. Nature. 2005;437:1173‐1178. [DOI] [PubMed] [Google Scholar]
- 8. Yu H, Braun P, Yildirim MA, et al. High‐quality binary protein interaction map of the yeast interactome network. Science. 2008;322:104‐110. doi: 10.1126/science.1158684 [DOI] [PMC free article] [PubMed] [Google Scholar]
- 9. Braun P, Carvunis A, Charloteaux B, et al. Evidence for network evolution in an Arabidopsis Interactome map. Science. 2011;333:601‐607. [DOI] [PMC free article] [PubMed] [Google Scholar]
- 10. Choi SG, Olivet J, Cassonnet P, et al. Maximizing binary interactome mapping with a minimal number of assays. Nat Commun. 2019;10:3907. [DOI] [PMC free article] [PubMed] [Google Scholar]
- 11. Andrews SS, Schaefer‐Ramadan S, Al‐Thani NM, Ahmed I, Mohamoud YA, Malek JA. High‐resolution protein–protein interaction mapping using all‐versus‐all sequencing (AVA‐Seq). J Biol Chem. 2019;294:11549‐11558. [DOI] [PMC free article] [PubMed] [Google Scholar]
- 12. Goldsmith M, Kiss C, Bradbury ARM, Tawfik DS. Avoiding and controlling double transformation artifacts. Protein Eng, Des Sel. 2007;20:315‐318. doi: 10.1093/protein/gzm026 [DOI] [PubMed] [Google Scholar]
- 13. Buchfink B, Xie C, Huson DH. Fast and sensitive protein alignment using DIAMOND. Nat Methods. 2015;12:59‐60. [DOI] [PubMed] [Google Scholar]
- 14. Robinson MD, McCarthy DJ, Smyth GK. Edge R: a bioconductor package for differential expression analysis of digital gene expression data. Bioinformatics. 2010;26:139‐140. [DOI] [PMC free article] [PubMed] [Google Scholar]
- 15. Singh R, Dangol S, Jwa NS. Yeast two‐hybrid system for dissecting the rice MAPK interactome. Methods Mol Biol. 2014;1171:195‐216. doi: 10.1007/978-1-4939-0922-3_16 [DOI] [PubMed] [Google Scholar]
- 16. Wagemans J, Lavigne R. Identification of protein‐protein interactions by standard gal 4p‐based yeast two‐hybrid screening. Methods Mol Biol. 2015;1278:409‐431. doi: 10.1007/978-1-4939-2425-7_27 [DOI] [PubMed] [Google Scholar]
- 17. Sun CX, Halpek C, Scoles DR, et al. Functional analysis of the relationship between the neurofibromatosis 2 tumor suppressor and its binding partner, hepatocyte growth factor‐regulated tyrosine kinase substrate. Hum Mol Genet. 2002;11:3167‐3178. doi: 10.1093/hmg/11.25.3167 [DOI] [PubMed] [Google Scholar]
- 18. Scoles DR, Huynh DP, Chen MS, Burke SP, Gutmann DH, Pulst SM. The neurofibromatosis 2 tumor suppressor protein interacts with hepatocyte growth factor‐regulated tyrosine kinase substrate. Hum Mol Genet. 2000;9:1567‐1574. doi: 10.1093/hmg/9.11.1567 [DOI] [PubMed] [Google Scholar]
- 19. Gutmann DH, Haipek CA, Burke SP, Sun CX, Scoles DR, Pulst SM. The NF2 interactor, hepatocyte growth factor‐regulated tyrosine kinase substrate (HRS), associates with merlin in the “open” conformation and suppresses cell growth and motility. Hum Mol Genet. 2001;10:825‐834. [DOI] [PubMed] [Google Scholar]
- 20. Braun P, Tasan M, Dreze M, et al. An experimentally derived confidence score for binary protein‐protein interactions. Nat Methods. 2009;6:91‐97. [DOI] [PMC free article] [PubMed] [Google Scholar]
- 21. Erdos G, Pajkos M, Dosztányi Z. IUPred3: prediction of protein disorder enhanced with unambiguous experimental annotation and visualization of evolutionary conservation. Nucleic Acids Res. 2021;49:W297‐W303. [DOI] [PMC free article] [PubMed] [Google Scholar]
- 22. Boxem M, Maliga Z, Klitgord N, et al. A protein domain‐based Interactome network for C. elegans early embryogenesis. Cell. 2008;134:534‐545. [DOI] [PMC free article] [PubMed] [Google Scholar]
- 23. Zhao M, Wang T, Zhen C, et al. Abstract 5289: gain‐of‐function mutant p53 predisposes head and neck keratinocytes and squamous cell carcinoma cells to replicative stress and genomic instability through minichromosome maintenance complex component 5. Mol Cell Biol. 2019;79:5289‐5289. [Google Scholar]
- 24. Qiu W‐G, Polotskaia A, Xiao G, et al. Identification, validation, and targeting of the mutant p53‐PARP‐MCM chromatin axis in triple negative breast cancer. NPJ Breast Cancer. 2017;3:1. [DOI] [PMC free article] [PubMed] [Google Scholar]
- 25. Fei L, Xu H. Role of MCM2‐7 protein phosphorylation in human cancer cells. Cell Biosci. 2018;8:43. [DOI] [PMC free article] [PubMed] [Google Scholar]
- 26. Kneissl M, Pütter V, Szalay AA, Grummt F. Interaction and assembly of murine pre‐replicative complex proteins in yeast and mouse cells. J Mol Biol. 2003;327:111‐128. [DOI] [PubMed] [Google Scholar]
- 27. Havugimana PC, Hart GT, Nepusz T, et al. A census of human soluble protein complexes. Cell. 2012;150:1068‐1081. [DOI] [PMC free article] [PubMed] [Google Scholar]
- 28. Ramachandran N. Self‐assembling protein microarrays. Science. 2004;305:86‐90. [DOI] [PubMed] [Google Scholar]
- 29. Wu G, Feng X, Stein L. A human functional protein interaction network and its application to cancer data analysis. Genome Biol. 2010;11:R53. [DOI] [PMC free article] [PubMed] [Google Scholar]
- 30. Schaarschmidt D. Human mcm proteins at a replication origin during the G1 to S phase transition. Nucleic Acids Res. 2002;30:4176‐4185. [DOI] [PMC free article] [PubMed] [Google Scholar]
- 31. Ivorra C, Kubicek M, González JM, et al. A mechanism of AP‐1 suppression through interaction of c‐Fos with Lamin a/C. Genes Dev. 2006;20:307‐320. [DOI] [PMC free article] [PubMed] [Google Scholar]
- 32. Park SJ, Borin BN, Martinez‐Yamout MA, Dyson HJ. The client protein p53 adopts a molten globule‐like state in the presence of Hsp 90. Nature Struct Mol Biol. 2011;18:537‐541. [DOI] [PMC free article] [PubMed] [Google Scholar]
- 33. Tsang AHK, Lee YIL, Ko HS, et al. S‐nitrosylation of XIAP compromises neuronal survival in Parkinson's disease. Proc Natl Acad Sci U S A. 2009;106:4900‐4905. [DOI] [PMC free article] [PubMed] [Google Scholar]
- 34. Takahashi R, Deveraux Q, Tamm I, et al. A single BIR domain of XIAP sufficient for inhibiting caspases. J Biol Chem. 1998;273:7787‐7790. [DOI] [PubMed] [Google Scholar]
- 35. Riedl SJ, Renatus M, Schwarzenbacher R, et al. Structural basis for the inhibition of caspase‐3 by XIAP. Cell. 2001;104:791‐800. [DOI] [PubMed] [Google Scholar]
- 36. Krieg A, Correa RG, Garrison JB, et al. XIAP mediates NOD signaling via interaction with RIP2. Proc Natl Acad Sci U S A. 2009;106:14524‐14529. [DOI] [PMC free article] [PubMed] [Google Scholar]
- 37. Manon F, Favier A, Núñez G, Simorre JP, Cusack S. Solution structure of NOD1 CARD and mutational analysis of its interaction with the CARD of downstream kinase RICK. J Mol Biol. 2007;365:160‐174. [DOI] [PubMed] [Google Scholar]
- 38. Hahn JS. Regulation of Nod1 by Hsp90 chaperone complex. FEBS Lett. 2005;579:4513‐4519. [DOI] [PubMed] [Google Scholar]
Associated Data
This section collects any data citations, data availability statements, or supplementary materials included in this article.
Supplementary Materials
Appendix S1: Supporting Information
Supplementary Table 3 List of all significant interactions detected in this study.
Supplementary Table 4. List of all screened fragment pairs between HGS and NF2.
Data Availability Statement
Sequences were deposited to the Sequence Read Archive of NCBI under the bioproject ID PRJNA756122.