Abstract
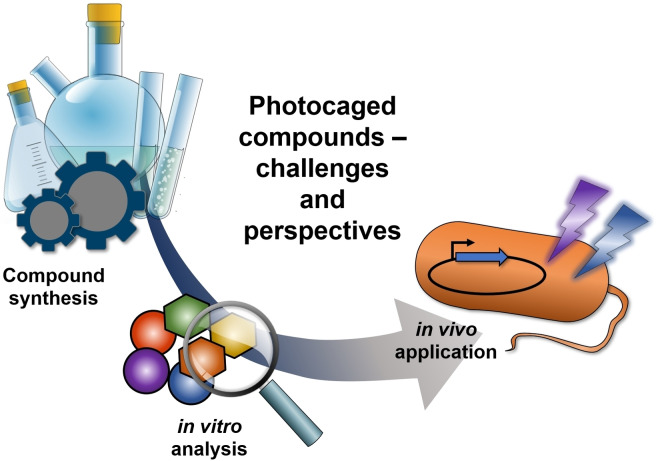
Photocaged compounds are applied for implementing precise, optochemical control of gene expression in bacteria. To broaden the scope of UV‐light‐responsive inducer molecules, six photocaged carbohydrates were synthesized and photochemically characterized, with the absorption exhibiting a red‐shift. Their differing linkage through ether, carbonate, and carbamate bonds revealed that carbonate and carbamate bonds are convenient. Subsequently, those compounds were successfully applied in vivo for controlling gene expression in E. coli via blue light illumination. Furthermore, benzoate‐based expression systems were subjected to light control by establishing a novel photocaged salicylic acid derivative. Besides its synthesis and in vitro characterization, we demonstrate the challenging choice of a suitable promoter system for light‐controlled gene expression in E. coli. We illustrate various bottlenecks during both photocaged inducer synthesis and in vivo application and possibilities to overcome them. These findings pave the way towards novel caged inducer‐dependent systems for wavelength‐selective gene expression.
Keywords: caged compounds, gene expression, optogenetics, photochemistry, synthetic biology
Novel optochemical tools for controlling gene expression in E. coli were investigated. Six photocaged carbohydrates with redshifted absorption and a photocaged salicylic acid derivative were synthesized, photochemically characterized and applied in vivo for light‐mediated target gene expression. The potential challenges during the establishment of a new optochemically controllable system and sufficient solutions are discussed in detail.
Introduction
Gene expression is a fundamental biological process which needs to be tightly controlled both in vivo and for biotechnological applications. Light provides an orthogonal, external, easily tuneable stimulus with high spatiotemporal resolution and thus constitutes an ideal signal for this purpose. [1] In the recent past, light‐controlled gene expression has been established in form of two concepts either by employing light‐sensitive proteins or light‐activatable (bio)molecules. [2] Mostly, genetically encoded light‐sensitive photoreceptors, which have their natural origin in plants or fungi (e. g. LOV domains, phytochromes or other photosensory proteins), are used to construct recombinant control elements applicable for activating or repressing transcription.[ 1b , 3 ] In contrast, light‐activatable molecules consist of a bioactive component and a photoremovable protecting group, retaining it in an inactive state until irradiation with a certain wavelength restores its bioactivity by photochemically initiated covalent bond cleavage. [4] Different types of biomolecules as nucleic acids, peptides or small inducer molecules can be targeted with this method to achieve light‐regulated gene expression.[ 1b , 5 ] However, there is still a limited number of small molecule‐inducible gene expression systems available, which have been addressed by light‐regulation. Most of them were targeted in eukaryotic cells by ecdysone, [6] doxycycline, [7] tamoxifen, [8] cyclofen‐OH, [9] methionine, [10] and copper. [11] Isopropyl β‐d‐1‐thiogalactopyranoside (IPTG, 1 a), [12] erythromycin [13] and a variety of carbohydrates (arabinose (2 a), [14] glucose, galactose, rhamnose, lactose) [15] were employed in bacteria, viz. Escherichia coli. Among them, only photocaged IPTG derivatives were recently applied to alternative production hosts, namely Corynebacterium glutamicum, [16] Pseudomonas putida, [17] and Bacillus subtilis. [17]
A photocaged compound has to fulfil different requirements: It should offer strong absorption (ϵ) at the desired wavelength, a high quantum yield ( ) and efficiency (ϵ ) of the corresponding photoreaction, as well as a low background activity prior to irradiation. Furthermore, it must be non‐toxic and stable as well as soluble in the targeted media. [18] The application of photocaged small inducer molecules in bacteria is challenging: Cultivation of bacteria usually occurs at elevated temperatures (30–37 °C), requires long cultivation conditions (≥24 h), and, most notably, a variety of different degrading enzymes are present, which are unique for each cultivation host. Therefore, even marginal instability of photocaged inducer molecules can lead to a significant expression level even in an unirradiated sample. An effective light‐controllable expression system thus requires a low basal expression, a broad dynamic range, and gradual controllability of the expression rate. [19] As not every photocaged inducer is suitable for every application, it is worthwhile to examine the pitfalls in the design of these light‐responsive compounds. In this study, we describe the synthesis of new representatives of the well‐established class of photocaged carbohydrates featuring redshifted absorption, and the exploration of non‐carbohydrate responsive promoter systems for light‐mediated control of gene expression in E. coli.
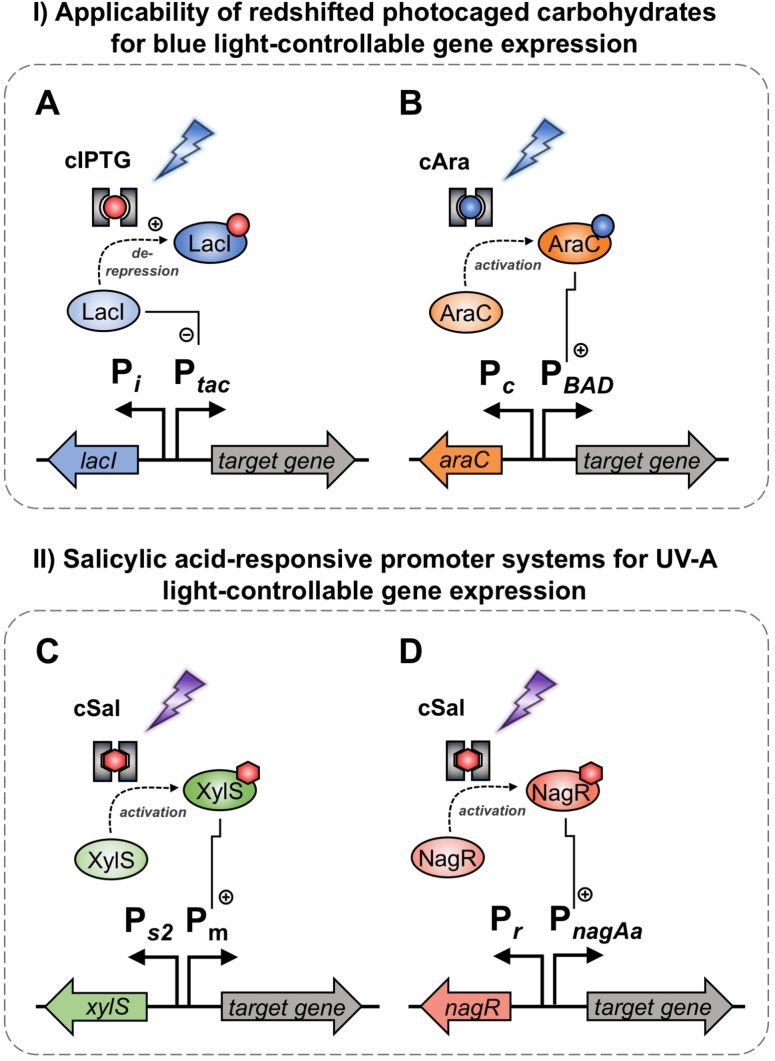
A bathochromic absorption shift of a photocaged compound should provide enhanced bio‐applicability as the irradiation is less likely to be absorbed by cellular components and thus avoids cell damage or even death. [20] This also leads to improved flexibility regarding the irradiation period and intensity. Contrary to eukaryotes,[ 8a , 9a , 9c , 21 ] photocaged small molecule inducers cleavable with light of >400 nm wavelength and at short irradiation time have not been used for bacteria. As many well‐established bacterial promoter systems such as the P T7 /LacI‐, P lac/tac /LacI or P BAD /AraC regulatory systems are inducible by the addition of carbohydrates (Figure 1A, B), [22] a photocaged carbohydrate with redshifted absorption appears as a promising target for synthesis and in vivo evaluation as an optochemical inducer in E. coli. In addition, we tested different types of linkages in photocaged inducers.
Figure 1.
Promoter systems for optogenetic control of target gene expression used in this study. Firstly, the applicability of photocaged carbohydrates for controlling gene expression with blue light (flash symbol) was evaluated. For induction with photocaged IPTG (cIPTG, red dot with grey frame), the well‐established P tac /LacI promoter system (A) was chosen, in which the P tac promoter is subject to regulation by the LacI activator protein. Upon binding of a suited inducer such as IPTG (red dot), LacI undergoes a conformational change leading to the dissociation from the operator region and thus, de‐repression of transcription. For induction with photocaged arabinose (cAra, blue dot with grey frame), the P BAD /AraC promoter system (B) was applied, which is positively regulated by the activator protein AraC upon l‐arabinose (blue dot) binding. As a second step, salicylic acid‐responsive promoter systems were for the first time evaluated for photo‐controllable gene expression using photocaged salicylic acid derivatives (cSal, red hexagon with grey frame). For this purpose, the P m /XylS regulatory system was applied, which is positively controlled by the activator protein XylS in the presence of salicylic acid (red hexagon). Furthermore, the P nagAa /NagR regulon was evaluated, which is also positively regulated by its activator protein NagR in the presence of salicylic acid (red hexagon).
Beside the above‐mentioned IPTG‐ or arabinose‐inducible expression systems, benzoate‐based systems find increasing applications for controlling heterologous gene expression. [23] Thus, in a second part, a novel photocaged salicylic acid derivative was used to demonstrate the challenging choice of a suitable promoter system. Besides the photocaged compound synthesis and in vitro characterization, we evaluated both the P m /XylS and the P nagAa /NagR expression systems (Figure 1C, D) for their usability for light‐mediated control of gene expression in E. coli and proved the applicability of the latter in combination with photocaged salicylic acid. In conclusion, we illustrate several drawbacks in the synthesis of functional photocaged inducers and their applications and show possibilities to overcome them.
Results and Discussion
Photocaged carbohydrates with redshifted absorption
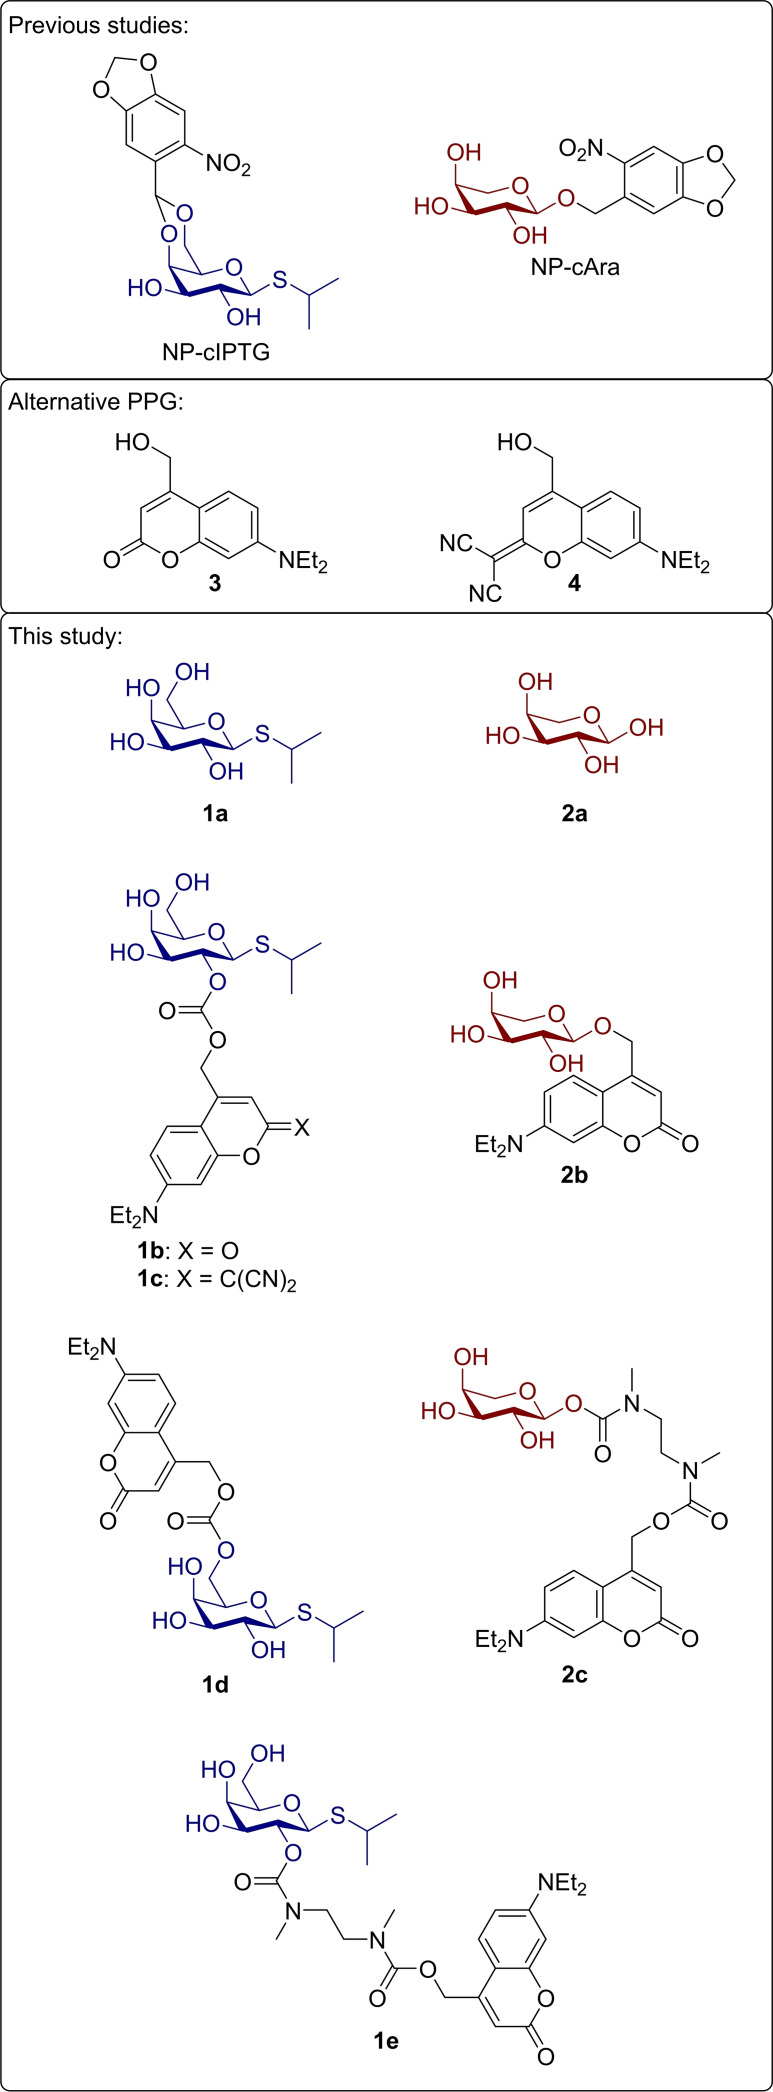
Selection and design of target structures: So far, only ortho‐nitrobenzyl derived protected carbohydrates have been reported as inducer molecules and tested for controlling gene expression. Besides this photolabile protecting group (PPG), coumarin derivatives offer similar advantages such as a high biocompatibility, a comparatively fast and easy chemical synthesis, but in contrast, their maximum absorption wavelength can be modified by small structural changes.[ 18 , 24 ] Therefore, we chose the 7‐diethylaminocoumarin 3 regarding wavelength‐selective applications and the dicyanocoumarin 4 with the hope of orthogonal applications, as this modification grants an even more pronounced bathochromic shift (Figure 2). [25]
Figure 2.
Photocaged carbohydrates deployed in previous publications,[ 12c , 14 ] alternative photolabile protecting groups 3 and 4 serving as starting point and targeted photocaged inducer molecules 1 b–e and 2 b–c based on the effector molecules 1 a and 2 a potentially suitable for bathochromically shifted irradiation.
Different strategies exist for the introduction of photolabile protecting groups onto reactive groups of the effector molecules, which have been reviewed before. [24] They are always dependent on the functional groups provided by the effector molecules and whether a modification of this moiety is blocking its biological function. [26] We choose a pair of carbohydrates [IPTG (1 a) and arabinose (2 a)] which only provide hydroxy groups. Therefore, one is limited towards utilising acetals, ethers, carbonates, or carbamates (when combined with a self‐immolative spacer) as linkage. IPTG (1 a) and arabinose (2 a) were chosen as targets, since for both molecules, light‐controlled gene expression systems have already been established. Furthermore, they provide three different types of hydroxy groups, which differ in their reactivity, namely a primary, a secondary and an anomeric hydroxy group. Based on the results of previous publications, acetals were excluded as linkage. For coumarins, a six‐membered‐ring acetal, which represents the leading motive in nitrobenzyl derivatives of IPTG, would most likely not be photolysable due to a particularly high stability, which was reported by Lin and Lawrence. [27] Photolysis could be achieved exclusively through the reduction of electron‐density in the six‐membered ring acetal by addition of an ester moiety. [28]
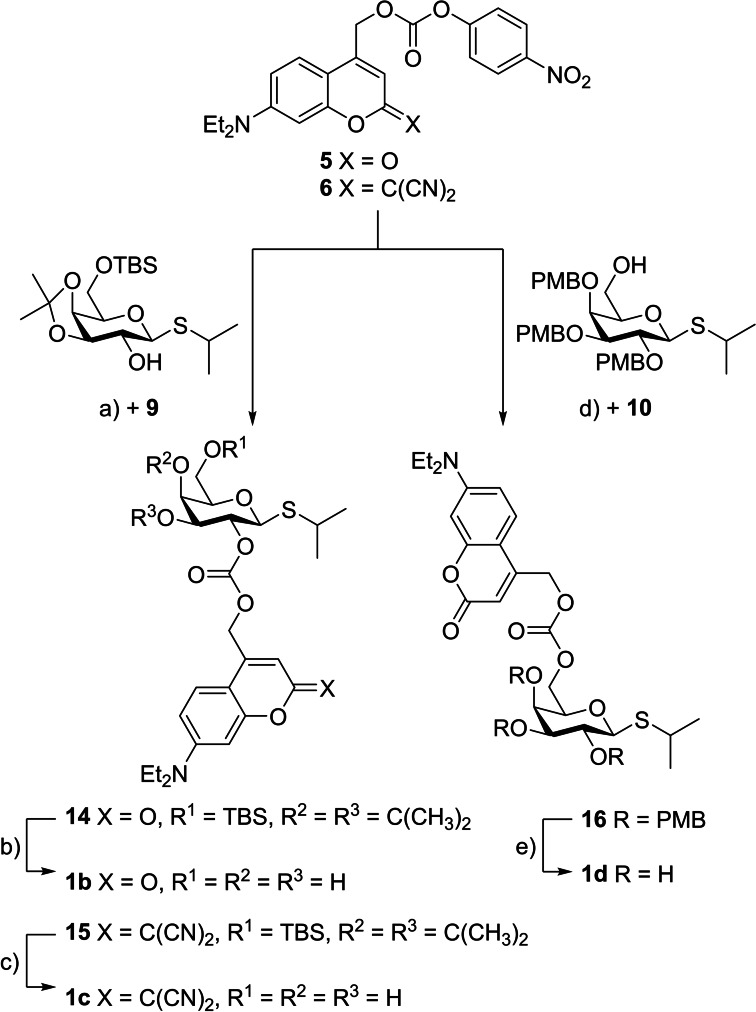
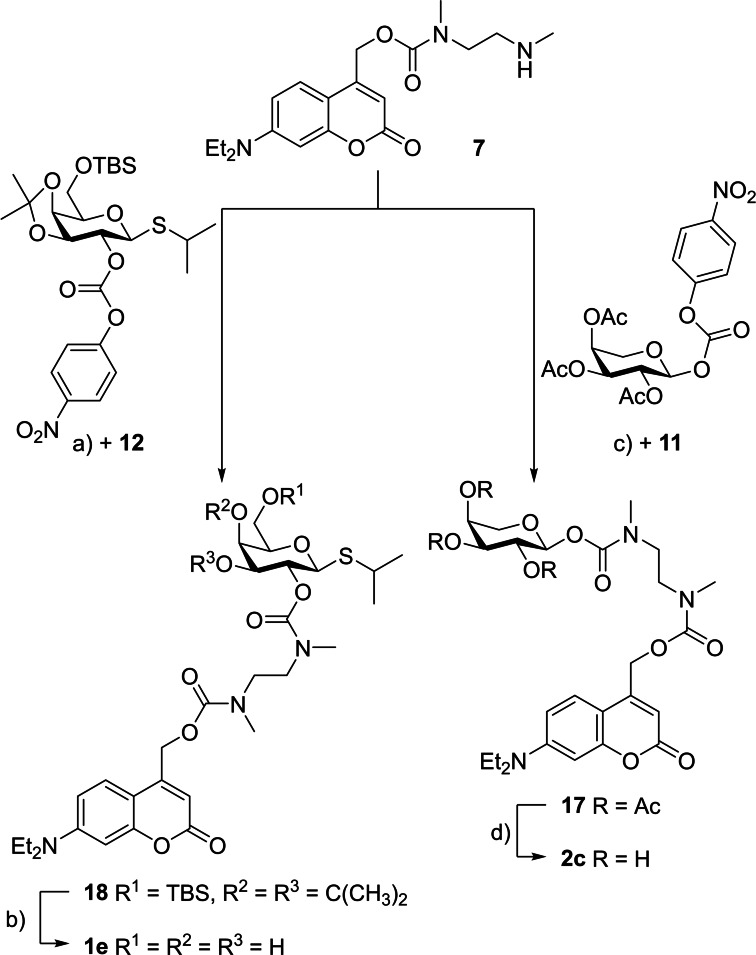
Synthesis of target structures. Overall, six photocaged carbohydrates bearing different photolabile protecting groups (1 b–e, 2 b–c) were synthesized. They all originated from the well‐established coumarin motive tethered via ether, carbonate, or carbamate moieties. Synthesis procedures for all starting materials are described in the Supporting Information. These include the synthesis routes towards coumarins 3 as well as 5–7, which were obtained following previously published procedures, and synthesis routes towards the protected carbohydrates 8–12.
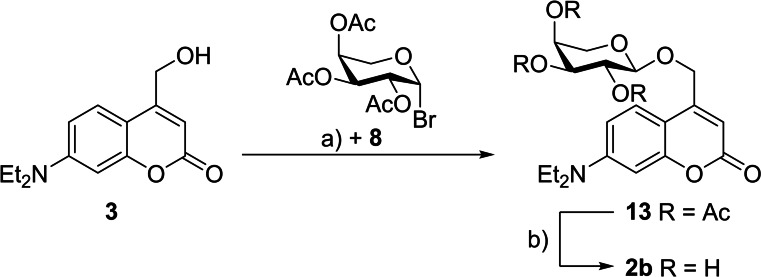
The first synthesis was performed in analogy to previously published photocaged carbohydrates.[ 14 , 15 ] Therefore, ether 13 was prepared via a Koenigs‐Knorr‐type reaction of coumarin 3 and 2,3,4‐tri‐O‐acetyl‐β‐l‐arabinopyranosyl bromide (8) (59 % yield). In the following deprotection the acetate‐protecting groups were removed under basic conditions by addition of ammonia in methanol to give photocaged arabinose 2 b (Scheme 1) in a quantitative yield.
Scheme 1.
Synthetic scheme for preparation of photocaged arabinose 2 b. Reagents and conditions: a) AgOTf, CH2Cl2, RT, 22 h, 59 %; b) NH3 in MeOH (7 m), MeOH, RT, quant.
The carbonates 14 and 15 were prepared with the protected carbohydrate 9 by reaction with the activated coumarin carbonates 5 and 6, respectively, with yields ranging from 77 % to 96 %. The activated carbonate 5 was analogously converted with the protected carbohydrate 10 into carbonate 16 (66 % yield) (Scheme 2). To access the photocaged carbohydrates 1 b, 1 c and 1 d, the carbonates 14, 15, and 16 were deprotected with trifluoroacetic acid (TFA) (78–96 % yield). Finally, the carbamates 17 and 18 were synthesized by addition of the coumarin amine 7 to the activated carbohydrate derivatives 11 as well as 12 in the presence of N,N‐diisopropylethylamine (DIPEA) and 4‐dimethylaminopyridine (DMAP) with yields ranging from 85 % to 97 % (Scheme 3). After deprotection with TFA or else ammonia in methanol, the products 2 c and 1 e were obtained in high (86 %) to quantitative yields. The purity of all synthesized photocaged carbohydrates was confirmed by 1H‐, 13C‐NMR, HRMS and HPLC (for detailed synthesis procedures see Supporting Information).
Scheme 2.
Synthetic scheme for preparation of photocaged IPTG 1 b, 1 c and 1 d. Reagents and conditions: a) DMAP, CH2Cl2, RT, 20 h, 77–96 %; b) TFA, H2O, CH2Cl2, 0 °C, 10 min, 96 %; c) TFA, H2O, CH2Cl2, 0 °C, 10 min, 92 %; d) DMAP, CH2Cl2, RT, 20 h, 66 %; e) TFA, H2O, CH2Cl2, 0 °C→RT, 1 h, 78 %.
Scheme 3.
Synthetic scheme for preparation of photocaged arabinose 2 c and photocaged IPTG 1 e. Reagents and conditions: a) DIPEA, DMAP, CH2Cl2, RT, 24 h, 97 %; b) TFA, H2O, 0 °C, 10 min, quant.; c) DIPEA, DMAP, CH2Cl2, RT, 24 h, 85 %; d) NH3 in MeOH (7 m), MeOH, RT, 86 %.
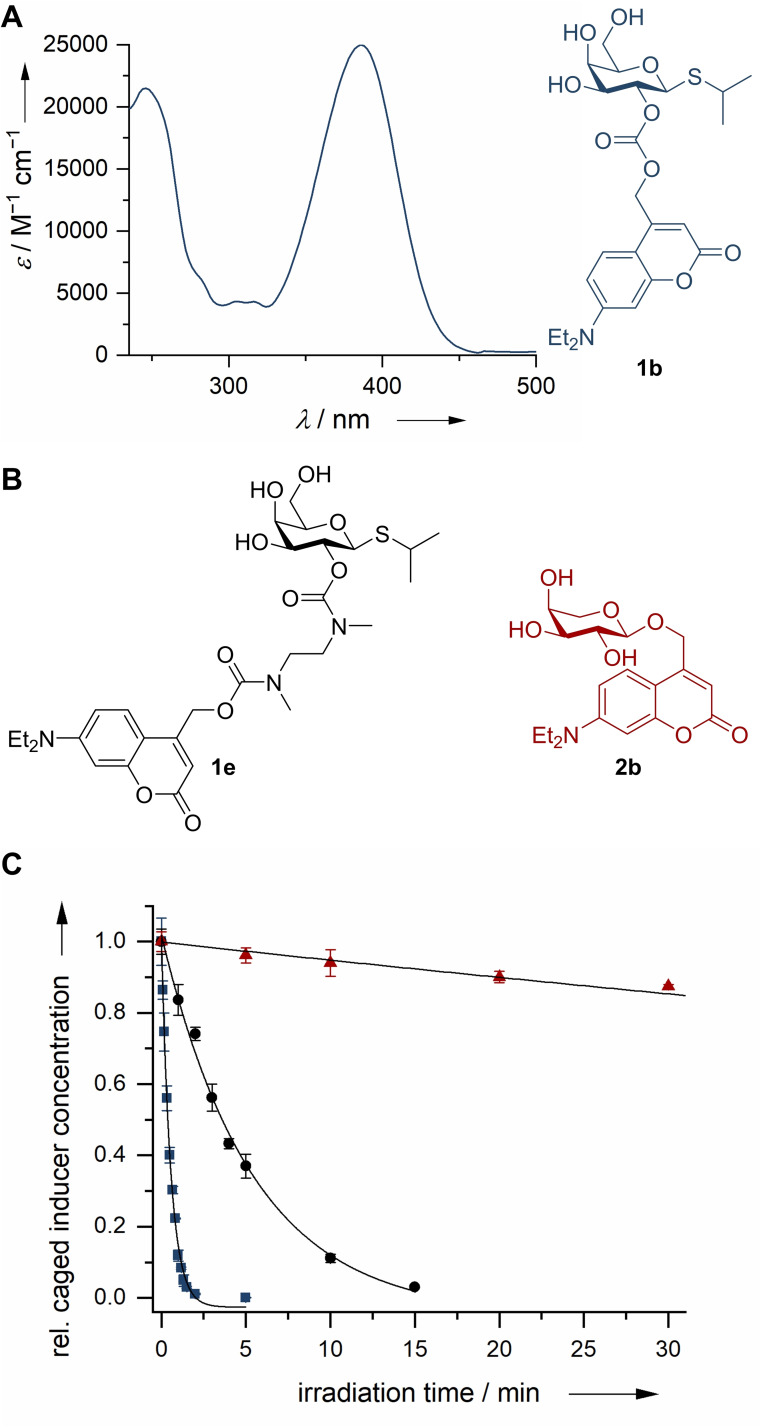
In vitro characterization of target structures: Initially the photochemical and photophysical properties of the photocaged carbohydrates were determined in vitro (Table 1). Previously published photocaged carbohydrates showed absorption maxima in the range of 336–358 nm.[ 14 , 15 , 17 ] In contrast, the absorption maxima (λmax) of compounds 1 b+d and 2 b–c are redshifted by at least 28–50 nm and show peak at ∼386 nm (Figure 3A). An exception is the photocaged IPTG 1 c, which showed an additional strong bathochromic shift of ∼100 nm to an absorption maximum at 488 nm, due to the introduction of the dicyanomethylene group (Figures S1–6). Additionally, the molar extinction coefficients (ϵ) of the novel photocaged carbohydrates 1 b–d and 2 b–c proved to be adequately high for efficient photolysis even upon irradiation with wavelengths up to 430 nm (Table 1). Especially carbonate 1 c shows interesting parameters for orthogonal uncaging due to its strongly redshifted absorption maximum and its comparatively low molar extinction coefficient at 375 nm (ϵ=1300 m −1 cm−1). Uncaging quantum yields (φ u) and the resulting photolytic efficiency (ϵφ u) were in the range of previously reported coumarins. [29]
Table 1.
Spectral and (photo‐)chemical properties of photocaged carbohydrates 1 b–e and 2 b–c.
|
Compound |
λ max [a] [nm] |
ϵ(375)[b] [m −1 cm−1] |
ϵ(405)[b] [m −1 cm−1] |
ϵ(430)[b] [m −1 cm−1] |
S [c] [%] |
φ u(λ irr)[d] |
ϵφ u(λirr ) [m −1 cm−1] |
|---|---|---|---|---|---|---|---|
|
2 b [e] |
388 |
8100 |
7100 |
2600 |
94 |
4.51×10⁻⁴ (405) |
4 (405) |
|
1 b [f] |
386 |
22900 |
18000 |
4000 |
88 |
3.20×10⁻² (375) |
687 (375) 120 (430) |
|
1 c [f] |
488 |
1700 |
2900 |
7900 |
70 |
2.35×10⁻² (430) |
34 (375) 158 (430) |
|
1 d [f] |
386 |
11000 |
8700 |
1900 |
100 |
3.46×10⁻² (375) |
330 (375) |
|
1 e [f] |
386 |
15900 |
12000 |
2300 |
95 |
1.01×10⁻² (430) |
159 (375) 23 (430) |
|
2 c [f] |
385 |
13100 |
9500 |
1700 |
100 |
1.33×10⁻² (430) |
17 (430) |
[a] Long‐wavelength absorption maxima. [b] ϵ(λ irr)=Molar extinction coefficient at irradiation wavelength λirr. [c] S=Stability against hydrolysis in the dark after 24 h (in % of remaining compound). [d] φ u(λ irr)=Uncaging quantum yield determined at irradiation wavelength λirr. [e] Measured in H2O/DMSO 99 : 1. [f] Measured in Tris buffer (20 mm, pH=7.5)/MeCN 1 : 1.
Figure 3.
A) Exemplary absorption spectrum of photocaged inducer molecule 1 b. B) Molecular structures of photocaged inducer molecules 1 b, 1 e and 2 b. C) Comparison of decay of photocaged inducer molecules 1 b, 1 e and 2 b after irradiation at 405 nm. Ether 2 b (red triangles), Carbonate 1 b (blue squares), Carbamate 1 e (black circle).
A look at the decay curves of compounds 2 b, 1 b und 1 e after irradiation at 405 nm (determined by HPLC) as well as hydrolysis in the dark allows to compare the applicability of the different linkages (Figure 3C). The ether 2 b was resilient against hydrolysis in the dark but showed only tenuous photolysis after irradiation. Thus, about 90 % of the photocaged compound 2 b remained unreacted after irradiation for 30 min. This can be explained by the low pKb value of the released anion, since the stabilization of the released anion is crucial for the heterolytic bond cleavage mechanism and the prevention of non‐productive ion‐recombination. [30] For a thorough evaluation, it was nonetheless included in the in vivo experiments. The carbonate 1 b showed the fastest decay after irradiation with complete release of the inducer in under 2 min. A stability comparison of photocaged IPTG 1 b and 1 d displayed that even though they only differ in their linkage position (2‐OH vs. 6‐OH), compound 1 d shows almost no hydrolysis, whereas compound 1 b is not entirely stable (Table 1). The carbonate 1 c, bearing the dicyano group, demonstrated the highest hydrolysis rate in the dark with only 70 % of starting material remaining after 24 h without irradiation. This can be explained by a reduced electron density at the carbonate moiety, which should facilitate hydrolysis. Differences in carbonate stability have been reported before. [31] Considering the diverging stabilities in vitro, carbonate 1 d appears to exhibit the best properties for the in vivo experiments.
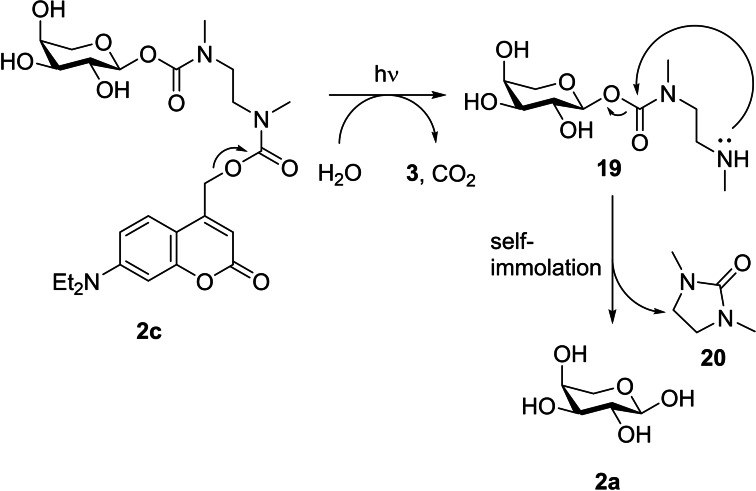
The carbamate 1 e was stable against hydrolysis in the dark as well and released the self‐immolative spacer nearly completely after irradiation for 15 min. Overall, carbamate 2 c displayed similar properties and its exemplary uncaging cascade is shown in Scheme 4. After irradiation, the heterolytic cleavage leads to decarboxylation subsequently exposing the amine group of the spacer. The intermediate 19 should undergo intramolecular 5‐exo‐trig cyclization to form the five‐membered cyclic urea‐derivative 20 (self‐immolation) and release the inducer 2 a. [32] In literature the release of a carbohydrate by the N,N′‐dimethylethylenediamine linker has been reported with a release efficiency of up to 60 % after 2 h. [33] HPLC analysis of the carbamates 1 e and 2 c could only confirm the successful uncaging and therefore the release of an ethylenediamine‐inducer intermediate, but not the following self‐immolation step. Accordingly, this step was monitored via ESI‐MS (Figures S24–25) confirming that after irradiation the corresponding intermediate was formed. For compound 1 e the intermediate refused to under‐go self‐immolation, whereas for compound 2 c a decrease of intermediate 19 was monitored. Nonetheless, both carbamates were tested in vivo as well to confirm the in vitro results. The detailed uncaging kinetics (Figures S8–13; Table S3) and stability measurements (Figure S22) of all synthesized photocaged carbohydrates are shown in the Supporting Information.
Scheme 4.
Representative release cascade after irradiation of compound 2 c in aqueous media.
Photocaged carbohydrates for light‐controlled gene expression: Next, the synthesized photocaged carbohydrates were tested for their applicability for light‐mediated induction of gene expression in the well‐established expression host E. coli. In the following experiments, we firstly used the strain E. coli Tuner (DE3), as this strain offers a passive IPTG uptake due to a deletion of the lacY gene encoding the lactose permease and thus a homogeneous and precisely controllable reporter gene expression.[ 12c , 34 ] Furthermore, the expression plasmid pRhotHi‐lacI‐eYFP harbouring the eyfp reporter gene under the control of the well‐established P T7 /LacI promoter system was used, as this regulatory system was proven to provide both tightly regulated and gradually controllable target gene expression.[ 12a , 17 , 34 ] Secondly, for arabinose‐inducible gene expression, the previously published strain E. coli LMG194 was chosen, since it bears the Δara714 deletion, which encompasses most of the araBAD operon, and thus is not able to metabolise arabinose. [35] This allows for using lower inducer concentrations in comparison to the strain E. coli Tuner (DE3). [34] Additionally, the expression plasmid pBTBX‐2‐mCherry harbouring the mCherry gene under the control of the well‐known P BAD promoter was used, since this system was repeatedly applied for tight and gradually controllable gene expression in E. coli.[ 14 , 34 , 36 ]
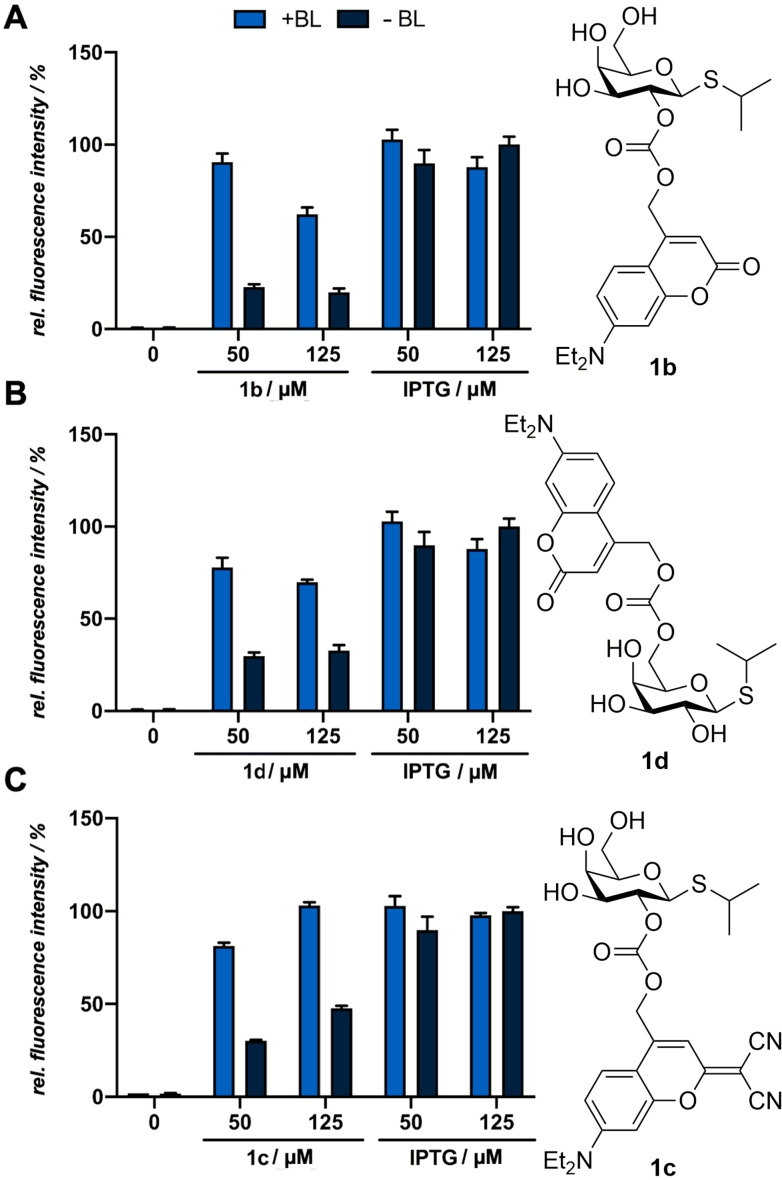
As a first step, all relevant photocaged inducers were evaluated with respect to their biotoxicity. For this purpose, the biomass of cultures supplemented with a respective compound were compared to uninduced cultures, as well as to cultures induced with the conventional inducer (Figure S26 A–D). The measurements did not reveal any negative effect of photocaged derivatives on the growth of the cultures, so that a biotoxicity can be precluded. Subsequently, the usability and induction strength of photocaged IPTG 1 b was compared with photocaged IPTG 1 d (Figure 4A, B) under illumination with visible light. Here, both caged IPTG variants led to eYFP fluorescence intensities between 60 and 90 % in comparison to cultures, which were equimolarly induced with conventional IPTG (1 a). Furthermore, it can be seen that 50 μm caged IPTG is sufficient for a pronounced target gene expression in both cases since an increased compound concentration led to a decreased induction strength with comparable or even higher signals in the dark controls. Contrary to expectations resulting from the in vitro stability data, photocaged IPTG 1 b is more stable under in vivo conditions compared to photocaged IPTG 1 d. This could be explained by an improved stability towards esterases, since the linkage is tethered at a secondary alcohol whereby it could be sterically more difficult to access. Subsequently, we evaluated the photocaged IPTG 1 c regarding its applicability for light‐controlled gene expression (Figure 4C). The in vivo experiments revealed that photocaged IPTG 1 c showed between 80 % and 100 % induction strength in comparison to cultures induced with equimolar concentrations of conventional IPTG (1 a). Although the use of 125 μm led to higher induction levels, the dark control cultures showed increased fluorescence signals in comparison to the cultures induced with 50 μm, which probably is caused by instability effects in the cultivation medium or hydrolysis by host‐specific enzymes. Hence, the use of lower caged IPTG concentrations again seems to be favourable as it leads to a sufficiently high induction strength, but lower induction levels in the unexposed cultures.
Figure 4.
Normalized in vivo eYFP fluorescence intensity of E. coli Tuner (DE3)/pRhotHi‐2‐lacI‐eYFP expression cultures supplemented with 50 μm and 125 μm of the photocaged compounds 1 b (A), 1 d (B) or 1 c (C). All cultures were incubated in the dark for 20 h in LB medium at 30 °C. Induction of reporter gene expression was performed after 2.5 h by blue light exposure at 447 nm (+BL; ∼10 mW cm−2) for 10 min [1 b, 1 c, 1 d or by the addition of respective amounts of conventional IPTG (1 a)]. In vivo fluorescence intensities were determined by using a Tecan Microplate Reader (eYFP: λex=488 nm, λem=527 nm), normalized to cell densities and are shown in relation to the respective fluorescence intensities of a culture kept in the dark (‐BL). Values are means of triplicate measurements. Error bars indicate the respective standard deviations.
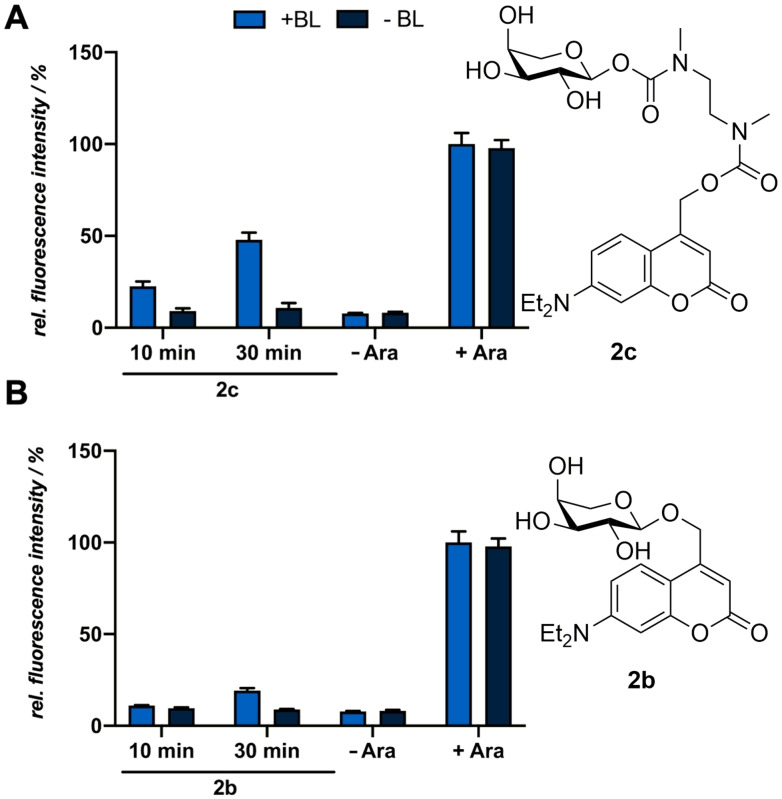
Since carbonates are known to be more susceptible to hydrolysis than carbamates we also tested the compounds 1 e and 2 c as an alternative. [37] However, as previously implied by the in vitro measurements, no light‐mediated induction could be observed for compound 1 e due to the insufficient release of the inducer by the self‐immolative spacer (Figure S27). The experiment was performed under suitable conditions for the release such as elevated temperatures (37 °C), a polar solvent and a slightly basic pH‐value (pH=7.4) as it is known that the self‐immolation is affected by these external parameters. [32] Compound 2 c, in contrast, demonstrated a superior applicability as it led to mCherry fluorescence intensities of ∼50 % in comparison to cultures which were equimolarly induced with conventional arabinose (2 a) (Figure 5A). This difference in reactivity can be explained by the higher acidity of the anomeric hemiacetal OH group [38] and the subsequently improved stabilization of the resulting anion. This underlines that the self‐immolation proceeds when the released carbohydrate anion possesses a sufficiently high pKb value. The low fluorescence intensities of cultures in the dark reveal a pronounced in vivo stability of the carbamates 1 e and 2 c. The in vivo applicability of compound 2 b was investigated as well, but it caused only a marginal increase in fluorescence (Figure 5B).
Figure 5.
Normalized in vivo mCherry fluorescence intensity of E. coli LMG194/pBTBX‐2‐mCherry expression cultures supplemented with 50 μm of the photocaged arabinose variants 2 c (A) and 2 b (B). All cultures were incubated in the dark for 20 h in LB medium at 37 °C and light‐mediated induction of reporter gene expression was performed after 2.5 h by blue light exposure at 447 nm (+BL; ∼10 mW cm−2) for 10 or 30 min or the addition of respective amounts of conventional arabinose (2 a). In vivo fluorescence intensities were determined by using a Tecan Microplate Reader (mCherry: λex=580 nm, λem=610 nm), normalized to cell densities and are shown in relation to the respective fluorescence intensities of a culture induced with conventional arabinose (2 a) and exposed to blue light for 30 min. Values are means of triplicate measurements. Error bars indicate the respective standard deviations.
In summary, novel photocaged IPTG and arabinose variants with bathochromically shifted absorption maxima could be synthesized. The in vivo application in E. coli demonstrated that these compounds, and particularly the photocaged IPTG variants 1 b and 1 c, are sufficiently stable and lead to a pronounced induction response upon illumination.
Salicylic acid‐responsive promoter systems for light‐controlled gene expression: After extending the repertoire of photocaged carbohydrates towards compounds possessing bathochromically shifted absorption maxima, we attempted to expand the photocaged inducer toolbox by using photocaged aromatic compounds instead of carbohydrates for light‐mediated control of gene expression. Several well‐established and suitable promoter systems can be induced with aromatic compounds such as toluene, anthranilic acid or benzene, proved valuable for transcriptional control in various bacterial hosts.[ 23a , 39 ] We therefore choose salicylic acid (21) as an inducer molecule and evaluated two promoter systems for their suitability for light‐mediated gene expression in E. coli Tuner (DE3). Notably, like all enterobacteria, E. coli typically favours simple carbon sources like sugars over complex carbohydrates or aromatic compounds and therefore does not possess specific transporters for salicylic acid (21). Uptake solely occurs via passive diffusion processes. [40] We used the P m /XylS expression system (Figure 1C), which originates from the P. putida TOL meta operon for the degradation of benzoates. In a first step, an inducer, e. g., m‐toluic or salicylic acid, [41] interacts with the XylS regulatory protein, which subsequently initiates gene transcription from its associated promotor P m . Applicability of this regulatory system for transcriptional regulation of gene expression was demonstrated in well‐established bacteria such as E. coli or P. putida.[ 34 , 42 ] Thus, we used the expression strain E. coli Tuner (DE3) carrying the plasmids pM117‐R45T‐GFPmut3 or pM‐R45T‐GFPmut3 harbouring the gene gfpmut3 under the control of the P m M1‐17 or the native P m promoter, respectively (Table S1). The promoter P m M1‐17 is a high‐level expression variant of the native P m promoter.[ 23b , 36 ] To enable a promiscuous induction with diverse benzoate derivatives, in particular salicylic acid (21) and m‐toluic acid, a XylS regulator protein carrying the mutation R45T was used.[ 41 , 43 ] As a second alternative, we evaluated the P nagAa /NagR regulatory system from Comamonas testosteroni GZ42 (Figure 1D). [44] This system originally belongs to the nag operon allowing for naphthalene utilization and is based on the LysR‐type transcriptional regulator NagR, which activates its associated promoter P nagAa upon addition of the inducer salicylic acid (21). [45] In recent years, this system was frequently used for target gene expression in different bacterial hosts such as E. coli, P. putida or Pseudomonas taiwanensis. [46] The expression system of choice in our study was the strain E. coli Tuner (DE3) carrying the plasmid pBNTmcs‐mCherry‐Km, which harbours the mCherry‐encoding reporter gene under the control of the P nagAa /NagR system (Table S1).
Selection and design of target structure: Since the P m /XylS as well as the P nagAa /NagR promoter systems can both be activated by salicylic acid (21), we focused on the synthesis of a photocaged salicylic acid (cSal). For the initial setup of this new photocaged inducer class and to fulfil the previously stated properties for application in cell cultivation media, a reliable and established photocage was chosen and for simplicity no additional modifications were made for release at wavelengths above 400 nm. Therefore, the 4,5‐bis(carboxymethoxy)‐2‐nitrobenzyl protecting group (BC) was selected, which is photo‐activatable at around 375 nm and readily soluble in aqueous buffer. To ensure the required high stability, an ether bond was chosen as linkage rendering it resistant against esterases and hydrolysis. Hence, the BC‐cSal (22 a) and its corresponding sodium salt 22 b were synthesized (Figure 6).
Figure 6.
Targeted photocaged salicylic acids 22 a and 22 b.
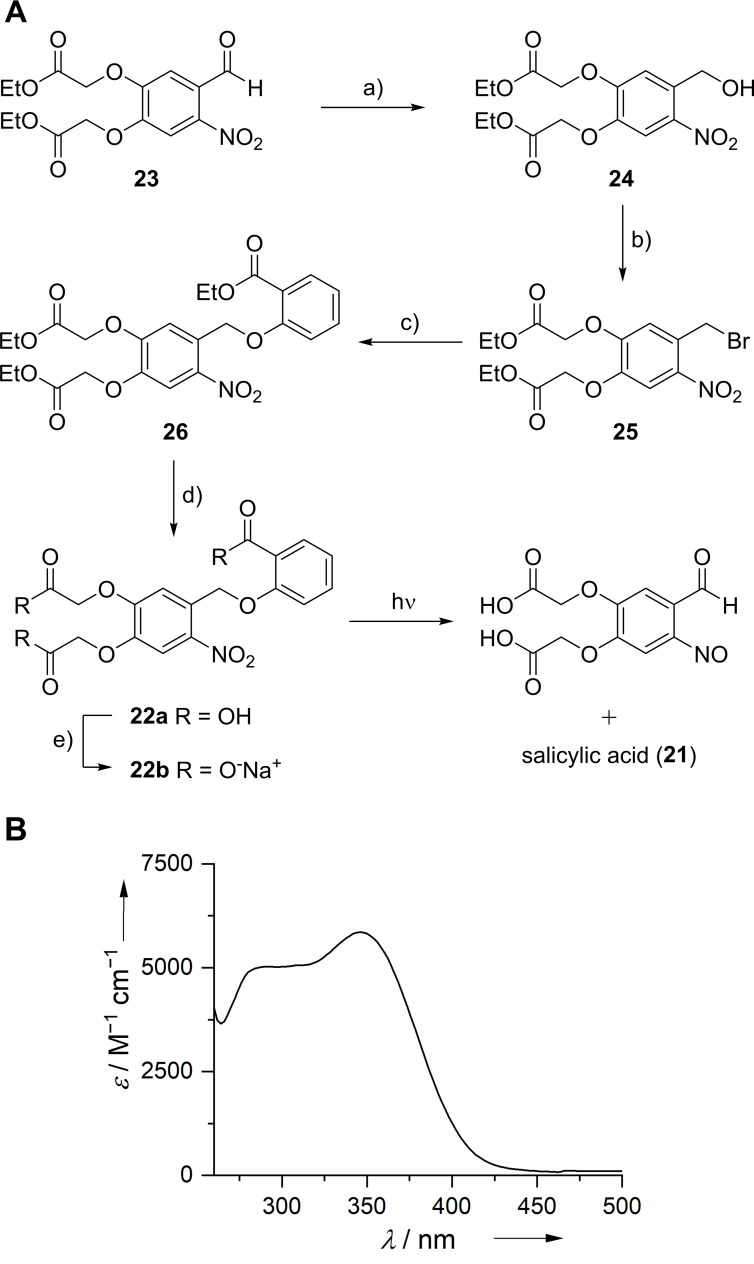
Synthesis of target structure: Starting from 4,5‐bis‐(ethoxycarbonylmethoxy)‐2‐nitrobenzaldehyde (23), which was obtained following a previously reported procedure,[ 17 , 47 ] 2‐O‐[4,5‐bis(carboxymethoxy)‐2‐nitrobenzyl]salicylic acid (BC‐cSal, 21) was synthesized in a four‐step reaction (Scheme 5, yield over four steps: 59 %). The aldehyde 23 was reduced with sodium borohydride to give the 2‐nitrobenzylalcohol derivative 24, which was converted into the corresponding bromide 25 via the Appel reaction. [48] O‐Alkylation of ethyl salicylate with the bromide 25 resulted in formation of the photocaged ethyl salicylate 26. The subsequent deprotection under basic conditions and elevated temperature yielded the target structure BC‐cSal (22 a), which could be further converted to the corresponding sodium salt 22 b.
Scheme 5.
A) Synthetic scheme for preparation of BC‐cSal (22 a) and BC‐cSal*Na (22 b). Reagents and conditions: a) NaBH4, CH2Cl2, EtOH, AcOH, 0 °C, 3 h, 73 %; b) CBr4, PPh3, CH2Cl2, 0 °C→RT, 6 h, 96 %; c) ethyl salicylate, K2CO3, acetone, RT, 2 d, 92 %; d) KOH (0.2 m), MeOH, 60 °C, 4 h, 92 %; e) NaOH (0.2 m), MeOH, RT, 5 min, quant. B) Absorption spectrum of compound 22 a.
In vitro characterization of target structure: The absorption spectrum of BC‐cSal (22 a) shows a maximum (λmax) at 346 nm in sodium phosphate buffer (0.1 m, pH=7.4) with a molar extinction coefficient (ϵ) of 5900 m −1 cm−1 (Scheme 5B; Figure S7). Upon irradiation for 15 min with UV‐A light (375 nm) salicylic acid (21) was completely released from BC‐cSal (22 a) with a quantum yield (φ u) of 7.68×10⁻³ in sodium phosphate buffer (0.1 m, pH=7.4) (Figure S14; Table S3). The solubility was sufficient (∼3 mm) for the intended application and could be further improved when converted to its sodium salt form 22 b (>100 mm). HPLC monitoring of a 0.5 mm solution in sodium phosphate buffer (0.1 m, pH=7.4) over 24 h showed no significant decrease in concentration of BC‐cSal (22 a), indicating an adequate in vitro stability (Figure S23).
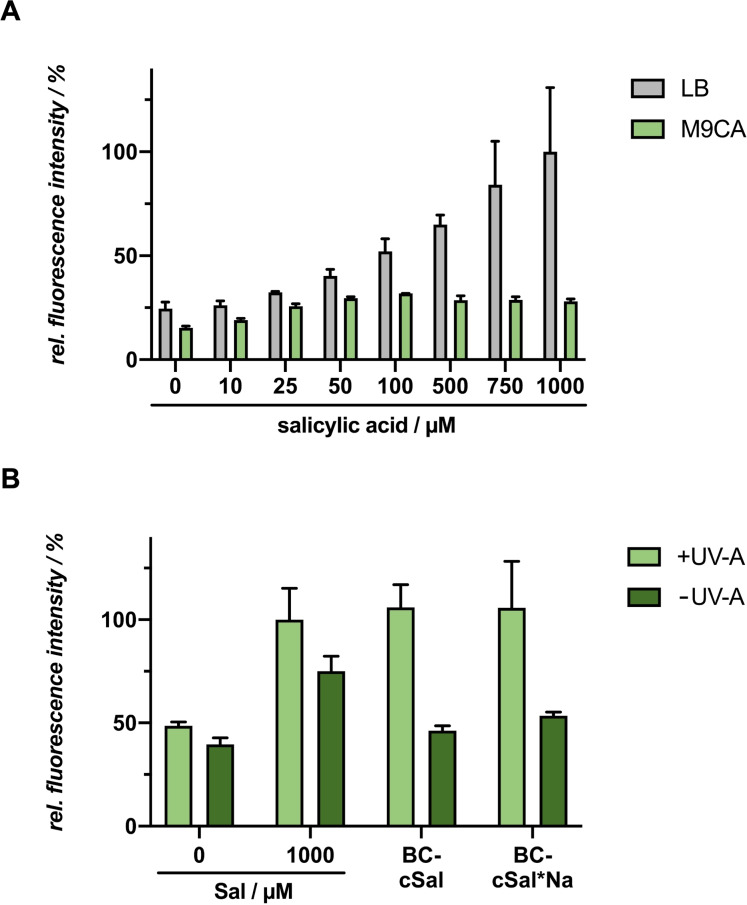
In vivo application of novel photocaged salicylic acid derivatives in E. coli : We analyzed whether the novel caged salicylate derivative BC‐cSal (22 a) in its acid form is suitable for light‐controlled induction of gene expression in the common expression host E. coli. For this purpose, first both the P m and the P m M1‐17 ‐based expression systems were tested for sufficient GFPmut3 reporter gene expression upon addition of increasing salicylic acid (21) concentrations in complex but undefined LB medium as well as in synthetic and defined M9CA‐Gly minimal medium. As shown in Figure 7A, the salicylic acid‐mediated induction of GFPmut3 production worked well in M9CA‐Gly medium. However, the induction response is drastically decreased in LB medium, presumably caused by changing pH values during cultivation and the resulting dissociation state of the inducer. [23a] Furthermore, it could be seen that nearly no increase in induction response could be obtained with Sal concentrations over 250 μm, which was also shown by Binder et al. [34] and that, contrary to past studies, [36] both promoter variants showed almost identical fluorescence levels. As a second step, the in vivo toxicity of the novel photocaged salicylic acid variants were evaluated by comparing the biomass of cultures supplemented with caged Sal with both uninduced cultures and cultures induced with conventional salicylic acid (Figure S26E). It could be seen that none of the derivatives had a negative influence on bacterial growth, thus no toxicity effect could be detected. For induction with the caged Sal variant BC‐cSal (22 a), the induction response at both caged inducer concentrations was comparable with conventional salicylate (Figure 7B). Without UV‐A light exposure, no fluorescence increase could be detected, which illustrates the in vivo stability of this variant. However, the fluorescence level of the control without inducer was significantly increased in comparison to the control in the dark.
Figure 7.
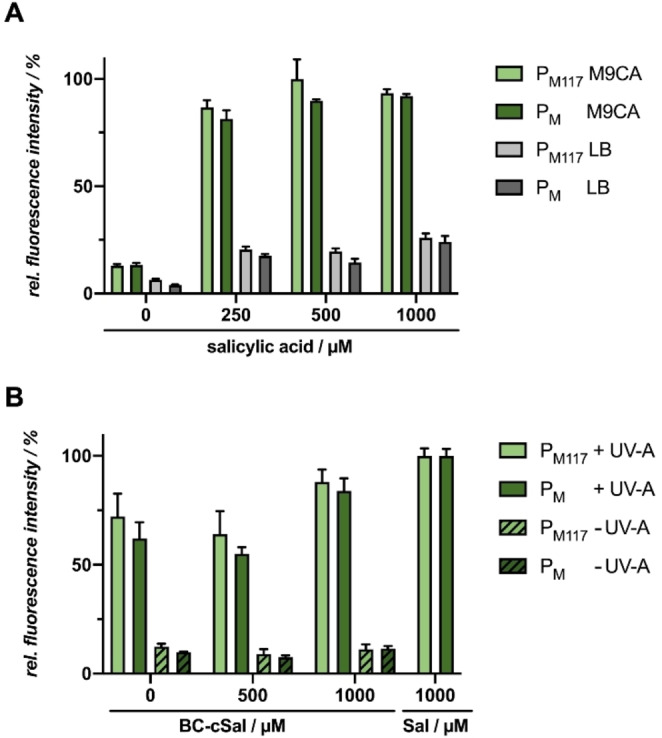
Light‐controlled gene expression in E. coli Tuner (DE3)/pM117(pM)‐R45T‐GFPmut3 using BC‐cSal (22 a). A) In vivo GFPmut3 fluorescence (λex=508 nm, λem=532 nm) of E. coli cultures grown in LB medium (grey) or M9CA minimal medium (green) at 30 °C after 20 h (stationary growth phase). Induction was performed after 6 h with salicylic acid (21) concentrations ranging from 0 to 1000 μm. B) In vivo GFPmut3 fluorescence (λex=508 nm, λem=532 nm) of E. coli cultures grown in M9CA minimal medium at 30 °C and supplemented with 500 μm or 1000 μm of BC‐cSal (22 a) is shown in relation to a 0 and 1000 μm salicylic acid (Sal) control after 20 h (stationary growth phase). Induction was performed after 6 h via UV‐A light exposure at 365 nm (∼1 mW cm−2) for 30 min or the addition of 1000 μm salicylic acid (Sal). In vivo fluorescence intensities were normalized to cell densities and values are means of individual biological triplicates. Error bars indicate the respective standard deviations.
As the UV‐A light exposure was the only modified parameter, we analyzed the influence of UV‐A light on this expression system without addition of an inducer (Figure 8A). Surprisingly, upon increasing exposure time, the GFP expression levels for both promoter variants increased likewise nearly reaching the fluorescence level of the control culture, where 1000 μm salicylate was added for induction of reporter gene expression. This unexpected effect could be elucidated further in order to achieve a more precisely tuneable, gradual induction process mandatory for the potential use of this system as a stand‐alone regulator element. To check whether this effect is associated with the transcriptional regulator XylS or can also be observed independently, we performed the same experiment with ΔXylS plasmid variants for both promoters (Figure 8B).
Figure 8.
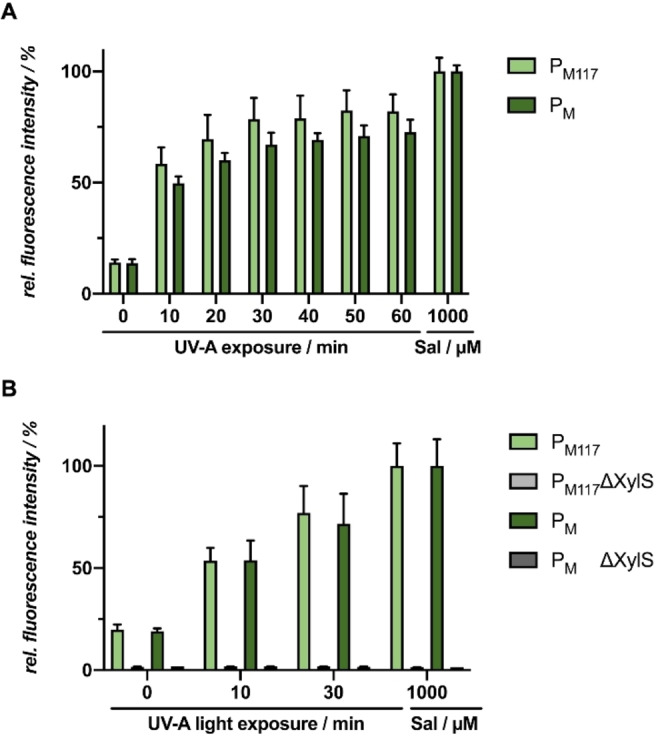
Light‐controlled gene expression in E. coli Tuner(DE3)/pM117‐R45T‐GFPmut3 or pM‐R45T‐GFPmut3 using UV‐A light. A) In vivo GFPmut3 fluorescence (λex=508 nm, λem=532 nm) of E. coli cultures illuminated with UV‐A light for different exposure time is shown in relation to a salicylic acid control (Sal). Induction was performed after 6 h via UV‐A light exposure at 365 nm (∼1 mW cm−2) or the addition of 1000 μm Sal. B) In vivo GFPmut3 fluorescence of E. coli cultures harbouring plasmid with both XylS gene and, as a negative control, a xylS gene deletion (ΔXylS) plasmid variant and illuminated with UV‐A light for 10–30 min is shown in relation to a 1000 μm salicylic acid control (Sal). Induction was performed after 6 h via UV‐A light exposure at 365 nm (∼1 mW cm−2) or the addition of 1000 μm Sal. In vivo fluorescence intensities were normalized to cell densities and values are means of individual biological triplicates. Error bars indicate the respective standard deviations.
After illumination with UV‐A light for 10 to 30 min, GFPmut3 production could only be observed when XylS is present, while cultures harbouring the expression plasmid with ΔXylS variant exhibited almost no fluorescence. These findings indicate that there might be a connection between the UV‐A light as an environmental factor and the XylS‐dependent signal transduction. The expression of the XylS protein, which belongs to the XylS/AraC regulator family, [49] is naturally stimulated by two different promoters, the Ps2 and the Ps1. The Ps2 promoter induces low constitutive expression of xylS [50] and is σ32‐dependent during exponential growth phase and σS (or σ38)‐dependent in early stationary phase and thereafter. [51] Beyond that, xylS expression is also induced by the master regulator XylR from the σ54‐dependent promoter Ps1, [50] which, in contrast to Ps2, is controlled by catabolite repression. [52] Under the influence of UV‐A light, the heat shock sigma factor RpoH (σ32) as well as the common stress sigma factor RpoS (σ38) might be upregulated in E. coli, even though σ38 is generally known to be active during stationary phase. [53] Those two sigma factors might stimulate the Ps2 promoter resulting in a hyperproduction of XylS, which in turn would lead to the induction of the P m promoter even in absence of the effector molecule. [54] Hence, the observed results indicate that this promoter system is unsuitable for the application of photocaged inducer molecules, as the use of UV‐light is indispensable for the uncaging process. However, the P m /XylS system allows for gradually controlling gene expression by light that does not require a chemical inducer, even though it still needs to be characterized in more detail prior to its actual application.
As the above used P m /XylS‐based expression system led to an induction of gene expression upon illumination with UV‐A light in E. coli, we tested the P nagAa /NagR system, which can similarly be induced with salicylic acid, and thus might be alternatively applicable for BC‐cSal‐mediated light control of gene expression in E. coli. Firstly, the P nagAa ‐based expression system was tested for sufficient mCherry reporter gene expression in the strain E. coli Tuner (DE3)/pBNTmcs‐mCherry‐Km upon addition of increasing salicylic acid (21) concentrations (0–1000 μm) in complex LB medium as well as in synthetic M9CA‐Gly minimal medium (Figure 9A). Interestingly, a sufficient induction strength could only be observed in LB medium, while M9CA medium led to minor fluorescent levels. Hence, further experiments were performed with LB medium. Secondly, the usability of the novel photocaged salicylic acid derivative BC‐cSal (22 a) as well as its respective sodium salt form 22 b was analyzed. The sodium salt form 22 b allows for an increased solubility in the cultivation medium and eliminates the need to dissolve the substance in organic solvents such as ethanol or DMSO before use. The sodium salt variant 22 b indeed exhibited an improved solubility in comparison to the conventional acid form, which had to be pre‐solved in DMSO, and was nearly equally stable under dark/non‐induced conditions (Figure 9B). Furthermore, both BC‐cSal variants led to comparably high fluorescence levels as the culture induced with conventional salicylic acid (21). However, to increase the responsiveness of the system, the basal activity and the overall expression level need to be optimized. This could be done, for example, by directed promoter mutagenesis or by the supplementary addition of 4‐nitrobenzoate to the cultivation medium, as described previously.[ 45a , 55 ]
Figure 9.
Light‐controlled gene expression in E. coli Tuner (DE3)/pBNTmcs‐mCherry‐Km using novel caged salicylic acid derivatives. A) In vivo mCherry fluorescence (λex=580 nm, λem=610 nm) of E. coli cultures grown in LB medium (light green) or M9CA‐Gly minimal medium (dark green) at 30 °C after 20 h (stationary growth phase). Induction was performed after 2 h with salicylic acid (19) concentrations ranging from 0 to 1000 μm. B) In vivo mCherry fluorescence (λex=580 nm, λem=610 nm) of E. coli cultures grown in LB medium at 30 °C and supplemented with 1000 μm of BC‐cSal (22 a) and BC‐cSal sodium salt (BC‐cSal*Na, 22 b) is shown in relation to control cultures, where reporter gene expression was not induced (0 μm) or induced by adding 1000 μm salicylic acid (Sal) after 20 h (stationary growth phase). Induction was performed after 2 h via UV‐A light exposure at 365 nm (∼1 mW cm−2) for 30 min or the addition conventional inducer (Sal). In vivo fluorescence intensities were normalized to cell densities and values are means of triplicate measurements. Error bars indicate the respective standard deviations.
Conclusions
We have synthesized a variety of coumarin‐caged carbohydrates and evaluated their photochemical and photophysical properties with respect to their applicability for light‐controlled gene expression in bacteria. Of the various types of linkages tested, only the carbonates 1 b and 1 c as well as the carbamate 2 c proved to be suitable with some restrictions. For carbonates, concentrations must be low to reduce the influence of hydrolysis in the dark and esterase cleavage. Despite these limitations photocaged IPTG 1 b and 1 c are decent aspirants for optochemical applications requiring bathochromically shifted excitation. We demonstrated that even though the photolysis of the hydrolysis‐stable carbamates 1 e and 2 c proceeds in a suitable timeframe, the released spacer tethered to the investigated carbohydrates refused to undergo self‐immolation for compound 1 e where it was linked to the 2‐OH group of IPTG. When tethered to the anomeric OH group of arabinose 2 a as in compound 2 c the self‐immolation was successful.
Secondly, we evaluated the newly synthesized salicylic acid‐based caged compound BC‐cSal (22 a) as well as its sodium salt derivative 22 b for their use as optochemical on‐switch. Two salicylic acid‐inducible promoter systems were chosen that should enable light‐mediated induction of gene expression in E. coli. The P m /XylS system, which was tested first, exhibited auto‐induction effects caused by UV‐A light exposure even without BC‐cSal (22 a). Although this fact renders the use of this system unfeasible in combination with photocaged inducers, it represents a promising regulatory system that might be gradually addressable exclusively with UV‐A light and will be further investigated in future studies. The second P nagAa /NagR system proved suitable for the use of photocaged salicylic acid 22 a, although the responsiveness of the system needs to be improved by reducing the basal activity and by increasing the induction strength. Hence, these results indicate that the applicability of each host and system has to be evaluated with respect to potential side effects caused by UV‐A light exposure itself and its interplay with additional factors such as media composition.
In summary, these results highlight the importance of a photocaged compound toolbox that can be used to address the different demands of varying organisms and expression systems. Moreover, the redshifted variants and the expansion of the available promoter systems addressable by light‐activatable inducer molecules pave the way towards a combination of multiple optochemical inducers with diverging absorption maxima for control of complex biosynthetic pathways in a multi‐chromatic fashion.
Experimental Section
Synthesis of photocaged compounds: Details on the synthesis and characterization of the photocaged compounds 1 b–e, 2 b–c and 22 a–b are provided in the Supporting Information.
Determination of photon flux density: The photon flux density (qn,p) of each light source of the LUMOS 43 (375 nm, 405 nm, 430 nm) was measured by ferrioxalate actinometry following a standard protocol. [56] The obtained values are summarized in Table S3.
Irradiation experiments: For the photocaged compound 1 b–e and 2 c a 0.5 mm solution in Tris buffer (20 mm, pH=7.5)/MeCN 1 : 1 was prepared. For the photocaged compounds 2 b respectively 21 a 0.5 mm solution in H2O or else sodium phosphate buffer (100 mm, pH=7.4) was prepared. In a cuvette 1 mL of this solution was irradiated at room temperature using the LUMOS 43 (375 nm, 405 nm, or 430 nm) for a definite time. The sample was then analyzed by reversed‐phase HPLC Jasco HPLC system [column: Hyperclone 5 μ ODS (C18) 120 (Phenomenex)]. For each photocaged compound, the procedure was repeated for different irradiation times. The decrease of concentration was measured by an UV detector. [15]
Determination of uncaging quantum yields: The uncaging quantum yield ( u) for the release of the inducer molecules is defined by Equation 1.
| (1) |
Values for the photocaged compounds 1 b–e, 2 b–c and 21 were calculated in accordance with a standard method using Equation 2., [57]
| (2) |
The term (dn/dt) refers to the decay rate of the photocaged compound (mol s −1 ), q n,p to the photon flux density (mol s −1 ) and A is the absorbance at the excitation wavelength λ.
Hydrolytic stability: For the determination of the hydrolytic stability, a freshly prepared 0.5 mm solution of the photocaged compounds 1 b–e and 2 c in Tris buffer (20 mm, pH=7.5)/MeCN 1 : 1 as well as 2 b respectively 21 in H2O or sodium phosphate buffer (100 mm, pH=7.4) were stored in the dark at room temperature. Samples were removed after 0 and 24 h and analyzed by reversed‐phase HPLC.
Bacterial strains and plasmids: For all cloning procedures, the E. coli strain DH5α [58] was used, while the E. coli strain Tuner (DE3) (Novagen) was applied for the expression studies. All E. coli strains were grown on LB agar plates or in liquid LB medium (Luria/Miller, Carl Roth®) or M9CA‐Gly minimal medium [34] at 37 °C if not stated otherwise and all media were supplemented with kanamycin (50 μg mL−1) for strain maintenance if appropriate.
All bacterial strains and plasmids used in this study are listed in Table S1, Supporting Information.
Plasmid construction: All recombinant DNA techniques were conducted as described by Sambrook et al. [59] For construction of the expression vector pM‐R45T‐GFPmut3, which offers a benzoate induction with a broader inducer spectrum, the previously described R45T mutation[ 41 , 43 ] was introduced to the XylS activator protein via overlap extension PCR [60] using oligos 1–4 (Table S1, Supporting Information). The resulting PCR product was SalI/ SacI digested and inserted into the likewise hydrolyzed target plasmid pSB‐M‐2‐g [36] via ligation, yielding the final plasmid pM‐R45T‐GFPmut3. For construction of the expression plasmid pBNTmcs‐mCherry‐Km, the mcherry reporter gene was extracted out of the plasmid pJT'Tmcs‐mCherry [61] via EcoRI/ XbaI digestion and inserted into the likewise hydrolyzed target plasmid pBNTmcs(t)‐Km. [46b] The plasmid pBTBX‐2‐mCherry was constructed using the In‐Fusion® HD Cloning Plus kit (Takara Bio Europe, St Germain en Laye, France). For this purpose, the plasmid backbone of pBTBX‐2 was amplified by PCR using oligos 5 and 6 (pBTBX‐2 was a gift from Ryan Gill, Addgene plasmid # 26068). The mcherry reporter gene was extracted out of the plasmid pJT'Tmcs‐mCherry [61] using oligos 7 and 8 (containing homologous sequences suitable for integration into the amplified pBTBX‐2 plasmid backbone) and the plasmid pJT'Tmcs‐mCherry as template. Finally, both fragments were assembled using the In‐Fusion® cloning reaction mix as indicated by the supplier. Correct nucleotide sequences of all constructs were confirmed by Sanger sequencing (Eurofins Genomics, Germany).
Expression cultures for novel photocaged IPTG and arabinose variants: All E. coli cultures were grown in 48‐well Flowerplates® in a ThermoMixer C (Eppendorf, Germany) (800 μL LB medium, 1200 rpm, 30 or 37 °C) in the dark for 20 h and previously inoculated with a cell density corresponding to an optical density of 0.05 at 580 nm if not stated otherwise. Induction was performed after 2.5 h by blue light exposure at 447 nm (∼10 mW cm−2) for 10 min or the addition of respective amounts of conventional IPTG (1 a) or arabinose (2 a). The LED diodes exhibit an emission range of 410–500 nm and an emission maximum at 447 nm (LUXEON Z Color Line (LXZ1‐PR01) Royal Blue, Lumileds, USA; for an emission spectrum see data sheet available at the manufactures website https://lumileds.com/products/color‐leds/luxeon‐z‐colors/). In vivo eYFP or mCherry fluorescence intensities were determined using a Tecan Microplate Reader (λex=488 nm, λem=527 nm or λex=580 nm, λem=610 nm, respectively), normalized to cell densities and are shown in relation to the respective fluorescence intensities of a culture induced with conventional IPTG (1 a) or arabinose (2 a).
Expression cultures for novel cSal variants: All E. coli cultures were grown in 48‐well Flowerplates® in a ThermoMixer C (Eppendorf, Germany) (800 μL LB medium or M9CA‐Gly minimal medium, 1200 rpm, 30 °C) in the dark for 20 h. Previously, expression cultures were inoculated with a cell density corresponding to an optical density of 0.01 (P m and P M1‐17 promoter system) or 0.05 (P nagAa promoter system) at 580 nm if not stated otherwise. Induction was performed after 6 or 2 h by UV‐A light exposure at 365 nm (∼1 mW cm−2) for 30 min or the addition of respective amounts of conventional salicylic acid. The UV‐A lamp exhibits an emission range of 320–400 nm and an emission maximum at 365 nm (VL‐315.BL 45‐W lamp, Vilber Lourmat, Germany). In vivo GFPmut3 or mCherry fluorescence intensities were determined using a Tecan Microplate Reader (λex=488 nm, λem=527 nm or λex=580 nm, λem=610 nm, respectively), normalized to cell densities and are shown in relation to the respective fluorescence intensities of a culture induced with conventional salicylic acid.
Conflict of interest
The authors declare no conflict of interest.
Supporting information
As a service to our authors and readers, this journal provides supporting information supplied by the authors. Such materials are peer reviewed and may be re‐organized for online delivery, but are not copy‐edited or typeset. Technical support issues arising from supporting information (other than missing files) should be addressed to the authors.
Supporting Information
Acknowledgements
The work was supported by grants from the Bioeconomy Science Center, the scientific activities of the Bioeconomy Science Center were financially supported by the Ministry of Culture and Science of the German federal state of North Rhine‐Westphalia MKW within the framework of the NRW Strategieprojekt BioSC (no. 313/323‐400‐00213). Open Access funding enabled and organized by Projekt DEAL.
F. Hogenkamp, F. Hilgers, N. L. Bitzenhofer, V. Ophoven, M. Haase, C. Bier, D. Binder, K.-E. Jaeger, T. Drepper, J. Pietruszka, ChemBioChem 2022, 23, e202100467.
Contributor Information
Dr. Thomas Drepper, Email: T.Drepper@fz-juelich.de.
Prof. Dr. Jörg Pietruszka, Email: J.Pietruszka@fz-juelich.de.
References
- 1.
- 1a. Drepper T., Krauss U., Meyer zu Berstenhorst S., Pietruszka J., Jaeger K.-E., Appl. Microbiol. Biotechnol. 2011, 90, 23–40; [DOI] [PubMed] [Google Scholar]
- 1b. Hartmann D., Smith J. M., Mazzotti G., Chowdhry R., Booth M. J., Biochem. Soc. Trans. 2020, 48, 1645–1659. [DOI] [PMC free article] [PubMed] [Google Scholar]
- 2. Hamouri F., Zhang W., Aujard I., Le Saux T., Ducos B., Vriz S., Jullien L., Bensimon D., in Methods Enzymol., Vol. 624 (Ed.: Deiters A.), Academic Press, 2019, pp. 1–23. [DOI] [PubMed] [Google Scholar]
- 3.
- 3a. Ziegler T., Möglich A., Front. Mol. Biosci. 2015, 2, 30; [DOI] [PMC free article] [PubMed] [Google Scholar]
- 3b. Liu Z., Zhang J., Jin J., Geng Z., Qi Q., Liang Q., Front. Microbiol. 2018, 9; [DOI] [PMC free article] [PubMed] [Google Scholar]
- 3c. Hughes R. M., Crit. Rev. Biochem. Mol. Biol. 2018, 53, 453–474. [DOI] [PubMed] [Google Scholar]
- 4. Adams S. R., Tsien R. Y., Annu. Rev. Physiol. 1993, 55, 755–784. [DOI] [PubMed] [Google Scholar]
- 5. Deiters A., Curr. Opin. Chem. Biol. 2009, 13, 678–686. [DOI] [PMC free article] [PubMed] [Google Scholar]
- 6. Lin W., Albanese C., Pestell R. G., Lawrence D. S., Chem. Biol. 2002, 9, 1347–1353. [DOI] [PubMed] [Google Scholar]
- 7.
- 7a. Sauers D. J., Temburni M. K., Biggins J. B., Ceo L. M., Galileo D. S., Koh J. T., ACS Chem. Biol. 2010, 5, 313–320; [DOI] [PubMed] [Google Scholar]
- 7b. Cambridge S. B., Geissler D., Calegari F., Anastassiadis K., Hasan M. T., Stewart A. F., Huttner W. B., Hagen V., Bonhoeffer T., Nat. Methods 2009, 6, 527–531; [DOI] [PubMed] [Google Scholar]
- 7c. Cambridge S. B., Geissler D., Keller S., Cürten B., Angew. Chem. Int. Ed. 2006, 45, 2229–2231; [DOI] [PubMed] [Google Scholar]; Angew. Chem. 2006, 45, 2287–2289. [Google Scholar]
- 8.
- 8a. Wong P. T., Roberts E. W., Tang S., Mukherjee J., Cannon J., Nip A. J., Corbin K., Krummel M. F., Choi S. K., ACS Chem. Biol. 2017, 12, 1001–1010; [DOI] [PMC free article] [PubMed] [Google Scholar]
- 8b. Faal T., Wong P. T., Tang S., Coulter A., Chen Y., Tu C. H., Baker J. R., Choi S. K., Inlay M. A., Mol. BioSyst. 2015, 11, 783–790; [DOI] [PubMed] [Google Scholar]
- 8c. Inlay M. A., Choe V., Bharathi S., Fernhoff N. B., Baker J. R., Weissman I. L., Choi S. K., Chem. Commun. 2013, 49, 4971–4973; [DOI] [PMC free article] [PubMed] [Google Scholar]
- 8d. Link K. H., Shi Y., Koh J. T., J. Am. Chem. Soc. 2005, 127, 13088–13089; [DOI] [PMC free article] [PubMed] [Google Scholar]
- 8e. Shi Y., Koh J. T., ChemBioChem 2004, 5, 788–796. [DOI] [PubMed] [Google Scholar]
- 9.
- 9a. Gorka A. P., Yamamoto T., Zhu J., Schnermann M. J., ChemBioChem 2018, 19, 1239–1243; [DOI] [PMC free article] [PubMed] [Google Scholar]
- 9b. Sinha D. K., Neveu P., Gagey N., Aujard I., Benbrahim-Bouzidi C., Le Saux T., Rampon C., Gauron C., Goetz B., Dubruille S., Baaden M., Volovitch M., Bensimon D., Vriz S., Jullien L., ChemBioChem 2010, 11, 653–663; [DOI] [PubMed] [Google Scholar]
- 9c. Fournier L., Gauron C., Xu L., Aujard I., Le Saux T., Gagey-Eilstein N., Maurin S., Dubruille S., Baudin J.-B., Bensimon D., Volovitch M., Vriz S., Jullien L., ACS Chem. Biol. 2013, 8, 1528–1536. [DOI] [PubMed] [Google Scholar]
- 10. Kusen P. M., Wandrey G., Probst C., Grünberger A., Holz M., Meyer zu Berstenhorst S., Kohlheyer D., Büchs J., Pietruszka J., ACS Chem. Biol. 2016, 11, 2915–2922. [DOI] [PubMed] [Google Scholar]
- 11. Kusen P. M., Wandrey G., Krewald V., Holz M., zu Berstenhorst S. M., Büchs J., Pietruszka J., J. Biotechnol. 2017, 258, 117–125. [DOI] [PubMed] [Google Scholar]
- 12.
- 12a. Wandrey G., Bier C., Binder D., Hoffmann K., Jaeger K.-E., Pietruszka J., Drepper T., Büchs J., Microb. Cell Fact. 2016, 15, 1–16; [DOI] [PMC free article] [PubMed] [Google Scholar]
- 12b. Binder D., Probst C., Bier C., Loeschcke A., Grünberger A., BIOspektrum 2015, 21, 612–615; [Google Scholar]
- 12c. Binder D., Grünberger A., Loeschcke A., Probst C., Bier C., Pietruszka J., Wiechert W., Kohlheyer D., Jaeger K.-E., Drepper T., Integr. Biol. 2014, 6, 755–765; [DOI] [PubMed] [Google Scholar]
- 12d. Young D. D., Deiters A., Angew. Chem. Int. Ed. 2007, 46, 4290–4292; [DOI] [PubMed] [Google Scholar]; Angew. Chem. 2007, 119, 4368–4370. [Google Scholar]
- 13. Gardner L., Zou Y., Mara A., Cropp T. A., Deiters A., Mol. BioSyst. 2011, 7, 2554–2557. [DOI] [PubMed] [Google Scholar]
- 14. Binder D., Bier C., Grünberger A., Drobietz D., Hage-Hülsmann J., Wandrey G., Büchs J., Kohlheyer D., Loeschcke A., Wiechert W., Jaeger K.-E., Pietruszka J., Drepper T., ChemBioChem 2016, 17, 296–299. [DOI] [PubMed] [Google Scholar]
- 15. Bier C., Binder D., Drobietz D., Loeschcke A., Drepper T., Jaeger K.-E., Pietruszka J., Synthesis 2017, 49, 42–52. [Google Scholar]
- 16.
- 16a. Binder D., Frohwitter J., Mahr R., Bier C., Grünberger A., Loeschcke A., Peters-Wendisch P., Kohlheyer D., Pietruszka J., Frunzke J., Jaeger K.-E., Wendisch V. F., Drepper T., Appl. Environ. Microbiol. 2016, 82, 6141–6149; [DOI] [PMC free article] [PubMed] [Google Scholar]
- 16b. Burmeister A., Akhtar Q., Hollmann L., Tenhaef N., Hilgers F., Hogenkamp F., Sokolowsky S., Marienhagen J., Noack S., Kohlheyer D., Grünberger A., ACS Synth. Biol. 2021, 10, 1308–1319. [DOI] [PubMed] [Google Scholar]
- 17. Hogenkamp F., Hilgers F., Knapp A., Klaus O., Bier C., Binder D., Jaeger K.-E., Drepper T., Pietruszka J., ChemBioChem 2021, 22, 539–547. [DOI] [PMC free article] [PubMed] [Google Scholar]
- 18. Klán P., Šolomek T., Bochet C. G., Blanc A., Givens R., Rubina M., Popik V., Kostikov A., Wirz J., Chem. Rev. 2013, 113, 119–191. [DOI] [PMC free article] [PubMed] [Google Scholar]
- 19. Kent R., Dixon N., Trends Biotechnol. 2020, 38, 316–333. [DOI] [PubMed] [Google Scholar]
- 20. Olejniczak J., Carling C.-J., Almutairi A., J. Controlled Release 2015, 219, 18–30. [DOI] [PubMed] [Google Scholar]
- 21. Goegan B., Terzi F., Bolze F., Cambridge S., Specht A., ChemBioChem 2018, 19, 1341–1348. [DOI] [PubMed] [Google Scholar]
- 22.
- 22a. Terpe K., Appl. Microbiol. Biotechnol. 2006, 72, 211–222; [DOI] [PubMed] [Google Scholar]
- 22b. Gräslund S., Nordlund P., Weigelt J., Hallberg B. M., Bray J., Gileadi O., Knapp S., Oppermann U., Arrowsmith C., Hui R., Ming J., dhe-Paganon S., Park H.-w., Savchenko A., Yee A., Edwards A., Vincentelli R., Cambillau C., Kim R., Kim S.-H., Rao Z., Shi Y., Terwilliger T. C., Kim C.-Y., Hung L.-W., Waldo G. S., Peleg Y., Albeck S., Unger T., Dym O., Prilusky J., Sussman J. L., Stevens R. C., Lesley S. A., Wilson I. A., Joachimiak A., Collart F., Dementieva I., Donnelly M. I., Eschenfeldt W. H., Kim Y., Stols L., Wu R., Zhou M., Burley S. K., Emtage J. S., Sauder J. M., Thompson D., Bain K., Luz J., Gheyi T., Zhang F., Atwell S., Almo S. C., Bonanno J. B., Fiser A., Swaminathan S., Studier F. W., Chance M. R., Sali A., Acton T. B., Xiao R., Zhao L., Ma L. C., Hunt J. F., Tong L., Cunningham K., Inouye M., Anderson S., Janjua H., Shastry R., Ho C. K., Wang D., Wang H., Jiang M., Montelione G. T., Stuart D. I., Owens R. J., Daenke S., Schütz A., Heinemann U., Yokoyama S., Büssow K., Gunsalus K. C., Nat. Methods 2008, 5, 135–146;18235434 [Google Scholar]
- 22c. Samuelson J. C., in Heterologous Gene Expression in E. coli: Methods in Molecular Biology (Methods and Protocols), Vol. 705 (Eds.: Evans J. T., Xu M. Q.), Humana, 2011. [Google Scholar]
- 23.
- 23a. Brautaset T., Lale R., Valla S., Microb. Biotechnol. 2009, 2, 15–30; [DOI] [PMC free article] [PubMed] [Google Scholar]
- 23b. Bakke I., Berg L., Aune T. E. V., Brautaset T., Sletta H., Tøndervik A., Valla S., Appl. Environ. Microbiol. 2009, 75, 2002–2011. [DOI] [PMC free article] [PubMed] [Google Scholar]
- 24. Hansen M. J., Velema W. A., Lerch M. M., Szymanski W., Feringa B. L., Chem. Soc. Rev. 2015, 44, 3358–3377. [DOI] [PubMed] [Google Scholar]
- 25. Fournier L., Aujard I., Le Saux T., Maurin S., Beaupierre S., Baudin J. B., Jullien L., Chem. Eur. J. 2013, 19, 17494–17507. [DOI] [PubMed] [Google Scholar]
- 26. Deiters A., ChemBioChem 2010, 11, 47–53. [DOI] [PMC free article] [PubMed] [Google Scholar]
- 27. Lin W., Lawrence D. S., J. Org. Chem. 2002, 67, 2723–2726. [DOI] [PubMed] [Google Scholar]
- 28. Laguerre A., Hauke S., Qiu J., Kelly M. J., Schultz C., J. Am. Chem. Soc. 2019, 141, 16544–16547. [DOI] [PMC free article] [PubMed] [Google Scholar]
- 29. Weinstain R., Slanina T., Kand D., Klán P., Chem. Rev. 2020, 120, 13135–13272. [DOI] [PMC free article] [PubMed] [Google Scholar]
- 30. Schmidt R., Geissler D., Hagen V., Bendig J., J. Phys. Chem. A 2007, 111, 5768–5774. [DOI] [PubMed] [Google Scholar]
- 31. Suzuki A. Z., Watanabe T., Kawamoto M., Nishiyama K., Yamashita H., Ishii M., Iwamura M., Furuta T., Org. Lett. 2003, 5, 4867–4870. [DOI] [PubMed] [Google Scholar]
- 32. Alouane A., Labruère R., Le Saux T., Schmidt F., Jullien L., Angew. Chem. Int. Ed. 2015, 54, 7492–7509; [DOI] [PubMed] [Google Scholar]; Angew. Chem. 2015, 127, 7600–7619. [Google Scholar]
- 33. Wang R., Cai K., Wang H., Yin C., Cheng J., Chem. Commun. 2018, 54, 4878–4881. [DOI] [PMC free article] [PubMed] [Google Scholar]
- 34. Binder D., Probst C., Grünberger A., Hilgers F., Loeschcke A., Jaeger K.-E., Kohlheyer D., Drepper T., PLoS One 2016, 11, e0160711. [DOI] [PMC free article] [PubMed] [Google Scholar]
- 35. Guzman L. M., Belin D., Carson M. J., Beckwith J., J. Bacteriol. 1995, 177, 4121–4130. [DOI] [PMC free article] [PubMed] [Google Scholar]
- 36. Balzer S., Kucharova V., Megerle J., Lale R., Brautaset T., Valla S., Microb. Cell Fact. 2013, 12, 26. [DOI] [PMC free article] [PubMed] [Google Scholar]
- 37. Noguchi M., Skwarczynski M., Prakash H., Hirota S., Kimura T., Hayashi Y., Kiso Y., Bioorg. Med. Chem. 2008, 16, 5389–5397. [DOI] [PubMed] [Google Scholar]
- 38.
- 38a. Feng S., Bagia C., Mpourmpakis G., J. Phys. Chem. A 2013, 117, 5211–5219; [DOI] [PubMed] [Google Scholar]
- 38b. Dimakos V., Taylor M. S., Chem. Rev. 2018, 118, 11457–11517. [DOI] [PubMed] [Google Scholar]
- 39. Nikel P. I., de Lorenzo V., Metab. Eng. 2018, 50, 142–155. [DOI] [PubMed] [Google Scholar]
- 40.
- 40a. Basu A., Shrivastava R., Basu B., Apte S. K., Phale P. S., J. Bacteriol. 2007, 189, 7556; [DOI] [PMC free article] [PubMed] [Google Scholar]
- 40b. Ramos J. L., Marqués S., Timmis K. N., Annu. Rev. Microbiol. 1997, 51, 341–373. [DOI] [PubMed] [Google Scholar]
- 41. Ramos J. L., Stolz A., Reineke W., Timmis K. N., Proc. Natl. Acad. Sci. USA 1986, 83, 8467–8471. [DOI] [PMC free article] [PubMed] [Google Scholar]
- 42.
- 42a. Gawin A., Valla S., Brautaset T., Microb. Biotechnol. 2017, 10, 702–718; [DOI] [PMC free article] [PubMed] [Google Scholar]
- 42b. Calero P., Jensen S. I., Nielsen A. T., ACS Synth. Biol. 2016, 5, 741–753; [DOI] [PubMed] [Google Scholar]
- 42c. Nikel P. I., de Lorenzo V., Metab. Eng. 2013, 15, 98–112. [DOI] [PubMed] [Google Scholar]
- 43. Ramos J. L., Michan C., Rojo F., Dwyer D., Timmis K., J. Mol. Biol. 1990, 211, 373–382. [DOI] [PubMed] [Google Scholar]
- 44. Hüsken L., Beeftink R., de Bont J., Wery J., Appl. Microbiol. Biotechnol. 2001, 55, 571–577. [DOI] [PubMed] [Google Scholar]
- 45.
- 45a. Jones R. M., Britt-Compton B., Williams P. A., J. Bacteriol. 2003, 185, 5847–5853; [DOI] [PMC free article] [PubMed] [Google Scholar]
- 45b. Fuenmayor S. L., Wild M., Boyes A. L., Williams P. A., J. Bacteriol. 1998, 180, 2522 S. L. [DOI] [PMC free article] [PubMed] [Google Scholar]; Fuenmayor, Wild M., Boyes A. L., Williams P. A., J. Bacteriol. 1998, 180, 2522–2530. [DOI] [PMC free article] [PubMed] [Google Scholar]
- 46.
- 46a. Meijnen J.-P., de Winde J. H., Ruijssenaars H. J., Appl. Environ. Microbiol. 2008, 74, 5031; [DOI] [PMC free article] [PubMed] [Google Scholar]
- 46b. Verhoef S., Ballerstedt H., Volkers R. J. M., de Winde J. H., Ruijssenaars H. J., Appl. Microbiol. Biotechnol. 2010, 87, 679–690; [DOI] [PMC free article] [PubMed] [Google Scholar]
- 46c. Meijnen J.-P., Verhoef S., Briedjlal A. A., de Winde J. H., Ruijssenaars H. J., Appl. Microbiol. Biotechnol. 2011, 90, 885–893; [DOI] [PMC free article] [PubMed] [Google Scholar]
- 46d. Wierckx N. J. P., Ballerstedt H., de Bont J. A. M., Wery J., Appl. Environ. Microbiol. 2005, 71, 8221–8227; [DOI] [PMC free article] [PubMed] [Google Scholar]
- 46e. Lee J. H., Mitchell R. J., Gu M. B., J. Biotechnol. 2007, 131, 330–334; [DOI] [PubMed] [Google Scholar]
- 46f. Lenzen C., Wynands B., Otto M., Bolzenius J., Mennicken P., Blank L. M., Wierckx N., Front. Bioeng. Biotechnol. 2019, 7, 130. [DOI] [PMC free article] [PubMed] [Google Scholar]
- 47. Ni J., Auston D. A., Freilich D. A., Muralidharan S., Sobie E. A., Kao J. P. Y., J. Am. Chem. Soc. 2007, 129, 5316–5317. [DOI] [PMC free article] [PubMed] [Google Scholar]
- 48. Appel R., Angew. Chem. Int. Ed. 1975, 14, 801–811; [Google Scholar]; Angew. Chem. 1975, 87, 863–874. [Google Scholar]
- 49.
- 49a. Gallegos M.-T., Michán C., Ramos J. L., Nucleic Acids Res. 1993, 21, 807–810; [DOI] [PMC free article] [PubMed] [Google Scholar]
- 49b. Ramos J. L., Rojo F., Zhou L., Timmis K. N., Nucleic Acids Res. 1990, 18, 2149–2152. [DOI] [PMC free article] [PubMed] [Google Scholar]
- 50. Gallegos M.-T., Marqués S., Ramos J. L., J. Bacteriol. 1996, 178, 2356–2361. [DOI] [PMC free article] [PubMed] [Google Scholar]
- 51.
- 51a. Marqués S., Gallegos M.-T., Ramos J. L., Mol. Microbiol. 1995, 18, 851–857; [DOI] [PubMed] [Google Scholar]
- 51b. Tanaka K., Takayanagi Y., Fujita N., Ishihama A., Takahashi H., Proc. Natl. Acad. Sci. USA 1993, 90, 3511–3515; [DOI] [PMC free article] [PubMed] [Google Scholar]
- 51c. Marqués S., Manzanera M., González-Pérez M.-M., Gallegos M.-T., Ramos J. L., Mol. Microbiol. 1999, 31, 1105–1113. [DOI] [PubMed] [Google Scholar]
- 52. Duetz W. A., Marqués S., de Jong C., Ramos J. L., van Andel J. G., J. Bacteriol. 1994, 176, 2354–2361. [DOI] [PMC free article] [PubMed] [Google Scholar]
- 53.
- 53a. Grossman A. D., Straus D. B., Walter W. A., Gross C. A., Genes Dev. 1987, 1, 179–184; [DOI] [PubMed] [Google Scholar]
- 53b. Loewen P. C., Hu B., Strutinsky J., Sparling R., Can. J. Microbiol. 1998, 44, 707–717; [DOI] [PubMed] [Google Scholar]
- 53c. Hengge-Aronis R., Microbiol. Mol. Biol. Rev. 2002, 66, 373–395. [DOI] [PMC free article] [PubMed] [Google Scholar]
- 54.
- 54a. Inouye S., Nakazawa A., Nakazawa T., J. Bacteriol. 1987, 169, 3587–3592; [DOI] [PMC free article] [PubMed] [Google Scholar]
- 54b. Mermod N., Ramos J. L., Bairoch A., Timmis K. N., Mol. Gen. Genet. 1987, 207, 349–354; [DOI] [PubMed] [Google Scholar]
- 54c. Spooner R. A., Lindsay K., Franklin F. C. H., J. Gen. Microbiol. 1986, 132, 1347–1358. [DOI] [PubMed] [Google Scholar]
- 55. Lönneborg R., Brzezinski P., BMC Biochem. 2011, 12, 49. [DOI] [PMC free article] [PubMed] [Google Scholar]
- 56.
- 56a. Parker C. A., Bowen E. J., Proc. R. Soc. London Ser. A 1953, 220, 104–116; [Google Scholar]
- 56b. Hatchard C. G., Parker C. A., Bowen E. J., Proc. R. Soc. London Ser. A 1956, 235, 518–536; [Google Scholar]
- 56c. Kuhn H. J., Braslavsky S. E., Schmidt R., Pure Appl. Chem. 2004, 76, 2105–2146. [Google Scholar]
- 57. Braslavsky S. E., Pure Appl. Chem. 2007, 79, 293–465. [Google Scholar]
- 58. Hanahan D., J. Mol. Biol. 1983, 166, 557–580. [DOI] [PubMed] [Google Scholar]
- 59. Sambrook J., Fritsch E. F., Maniatis T., Molecular Cloning: A Laboratory Manual, Cold Spring Harbor Laboratory Press, Cold Spring Harbor, NY, 1989. [Google Scholar]
- 60. Urban A., Neukirchen S., Jaeger K.-E., Nucleic Acids Res. 1997, 25, 2227–2228. [DOI] [PMC free article] [PubMed] [Google Scholar]
- 61. Burmeister A., Hilgers F., Langner A., Westerwalbesloh C., Kerkhoff Y., Tenhaef N., Drepper T., Kohlheyer D., von Lieres E., Noack S., Grünberger A., Lab Chip 2019, 19, 98–110. [DOI] [PubMed] [Google Scholar]
Associated Data
This section collects any data citations, data availability statements, or supplementary materials included in this article.
Supplementary Materials
As a service to our authors and readers, this journal provides supporting information supplied by the authors. Such materials are peer reviewed and may be re‐organized for online delivery, but are not copy‐edited or typeset. Technical support issues arising from supporting information (other than missing files) should be addressed to the authors.
Supporting Information


