Abstract
It is well known that lithium reacts violently with water under the release of molecular hydrogen and the formation of lithium hydroxide. In this work, the initial mechanisms for the surface reactions of metallic lithium with water from the gas phase were investigated by means of periodic density functional theory calculations. For this purpose, adsorption/absorption structures and diffusion and dissociation processes of hydrogen, OH, and H2O on low‐index metallic lithium surfaces were investigated. Through thermodynamic and kinetic considerations, negatively charged centers on the surface were identified as the origin of hydrogen formation. The strikingly low reaction barriers for the reaction at these centers implied a self‐supporting effect of hydrogen evolution and the associated lithium degradation.
Keywords: batteries, degradation, density functional theory, lithium, surface chemistry
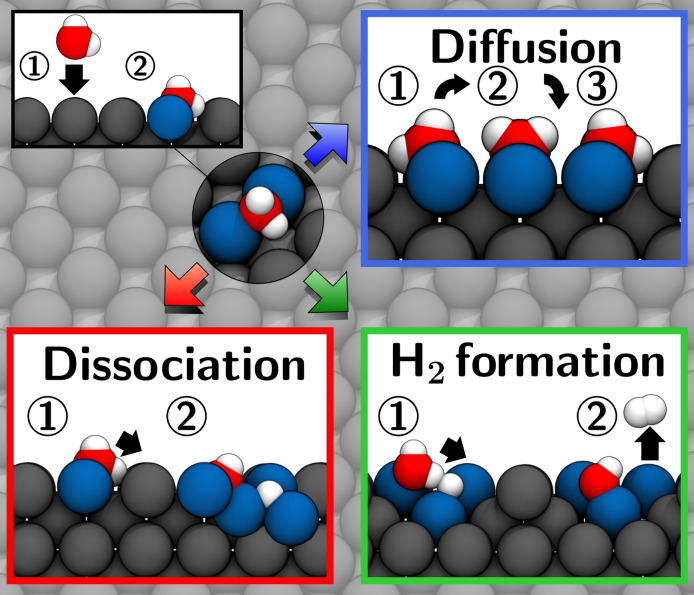
Keep dry: For metallic lithium anodes, the violent reaction with water is associated with a reduction in battery performance and represents a potential safety hazard. Using first‐principle calculations, the fundamental surface reactions of lithium with H2O are investigated, yielding significant insights into the initial reaction mechanisms.
Introduction
Having been used in a wide range of electronic applications since 1991, [1] lithium‐ion batteries (LIBs) have successfully penetrated the automotive sector in the last decade, thus paving the way for the transition to electromobility on a large scale. In order to continue mass market penetration in the automotive sector, it is mandatory to further advance the optimization and development of new generations of batteries towards competitive alternatives to fossil fuels by significantly increasing the batteries’ energy densities and maintaining a high safety standard.[ 2 , 3 , 4 ] Since using Li‐ions for energy storage is currently a very promising technology in terms of energy and power density, numerous approaches are aiming to improve the volumetric and gravimetric energy densities of anode and cathode materials. Thus, further developments of LIBs (e. g., through the use of high‐capacity conversion materials) are all realized within the rocking‐chair technology, which is based on the exchange of lithium ions between two intercalation/conversion materials.[ 5 , 6 , 7 , 8 , 9 ] While maintaining the necessary safety standards, the search for new candidates for energy storage in electromobility is not limited to the prevailing rocking‐chair technology but must also consider alternative battery concepts. As metallic lithium promises a particularly high energy density[ 7 , 9 , 10 ] [low specific weight of 0.53 g cm−3 and high standard electrode potential of −3.04 V vs. standard hydrogen electrode (SHE)], it is considered to be the “holy grail” among anode materials. Due to its outstanding features, the metallic lithium anode is therefore one of the key components of several innovative battery architectures at the moment.[ 11 , 12 , 13 , 14 , 15 , 16 , 17 , 18 , 19 ] Unfortunately, despite its excellent properties, metallic lithium is extremely difficult to handle, as its chemical nature causes several complications.[ 7 , 9 , 20 ] While problems of the lithium anode, such as plating and dendrite growth, are related to poorly understood, non‐uniform deposition processes of metallic lithium, the extremely high reactivity of lithium already poses challenges both during production and cell operation. Inside a battery, the reactivity of lithium is expressed in particular by the decomposition of the electrolyte to form a solid electrolyte interphase (SEI) as soon as the lithium anode comes into contact with an organic electrolyte.[ 21 , 22 , 23 , 24 , 25 , 26 ] The reactivity of lithium, however, is already evident outside the battery, as it can undergo various reactions in contact with the atmosphere under the formation of stable salts. The instability of pure lithium against atmospheric molecules, such as oxygen,[ 27 , 28 , 29 , 30 , 31 ] nitrogen,[ 32 , 33 ] and carbon dioxide, [31] during processing is therefore already a factor, which makes inert conditions imperative during production.
In both cases, the degradation is associated with a loss of active material, leading to a lower cell performance. As lithium reacts violently with water, under the formation of hydrogen and lithium hydroxide, [29] the degree of humidity in the environment is particularly important for lithium degradation. Due to an extreme vulnerability to even minor impurities of water at the ppm level, [34] an exposure of the highly sensitive lithium surface to even tiny amounts of moisture already leads to reduced performance and lifetime during cell manufacturing. Within a battery, water can reach the lithium anode not only via moisture from the atmosphere (e. g., if there is a defect in the battery), but also via traces in the electrolyte and cathode, which often have a hygroscopic character. [35] The components of a battery can therefore already be the source of a considerable quantity of water within the cell. At the lithium anode, water impurities can decisively influence the anode's surface and interface properties by either reacting with the SEI, which (due to its composition of salts) often has a hygroscopic character, or directly through the reduction at the metal anode. Through the reaction of lithium with water and the resulting products, a variety of compounds (e. g., hydrides, oxides, and hydroxides) can form on the anode surface. Although the interaction between lithium and atmospheric impurities consequently has a crucial impact on the interface of the lithium metal anode, little is known about the exact processes of water‐induced lithium corrosion on an atomic level. This is mainly due to the high reactivity of metallic lithium, as the investigation of adsorption processes and reactions with contaminants are experimentally difficult to access. In order to gain insights into the initial stages and mechanisms of water‐driven lithium corrosion, we present in the current work periodic density functional theory (DFT) calculations on thermodynamic stabilities as well as diffusion and dissociation processes of hydrogen, hydroxide, and water on metallic lithium surfaces. First, we investigated the interaction of monoatomic hydrogen with low‐index lithium surfaces by considering structural changes and binding energies, as well as diffusion and dissociation processes of monoatomic and molecular hydrogen on Li(100). Afterward, we investigated the fundamental diffusion and dissociation properties of OH and H2O on Li(100) and further reaction mechanisms that can provide information on hydrogen evolution on metallic lithium.
Computational Details
Periodic DFT calculations have been performed using the Vienna ab initio simulation package (VASP).[ 36 , 37 , 38 ] The core electrons were described through projector augmented‐wave (PAW) potentials as implemented in VASP, with valence states of 2s for lithium and hydrogen and 2s2p for oxygen. The plane wave energy cutoff was set to 400 eV. Exchange and correlation effects have been taken into account through the generalized gradient approximation (GGA) in the form suggested by Perdew, Burke, and Ernzerhof (PBE). [39] The metallic lithium surfaces were calculated on (5×5) and (4×8) surface unit cells for Li(100) and Li(110) with eleven layers each, and a (4×6) surface unit cell with seventeen layers for Li(111). In all cases, the Monkhorst‐Pack [40] sampling with a k‐point mesh density of at least 0.15 Å−1 was used. For all surface slabs, the lowest two layers have been fixed to the calculated lattice constant of bcc‐lithium present in the space group Im m (α=3.441 Å).[ 41 , 42 ] The remaining surface layers and the respective adsorbates were allowed to fully optimize their geometries, until the force‐convergence criterion of 0.005 eV Å−1 was met. Each supercell employed a 15 Å vacuum region normal to the surfaces. Binding energies were referenced to molecule of the respective gas phase molecule [Eq. 1]:
| (1) |
Here, is the total energy of the gas phase molecule and molecule the zero‐point energy correction, which was calculated within the harmonic approximation. For the adsorption of hydrogen was calculated through Equation 2:
| (2) |
where is the total energy of the surface slab+adsorbates and the total energy of the surface slab. Analogously, was calculated with Equation 3:
| (3) |
Due to the instability of the OH molecule in gas phase, the reference for the OH adsorption was expressed through the energies of gas phase H2 and H2O [Eq. 4]:
| (4) |
For the adsorbed molecules, the ZPE on the surface was also taken into account. The energy barriers for diffusion and dissociation processes were determined using the climbing‐image nudged‐elastic‐band method (CI‐NEB)[ 43 , 44 ] with a total number of seven images. The initial diffusion pathways were created by a linear interpolation between initial and final states, and the forces were allowed to relax until the force convergence criterion of 0.01 eV Å−1 was met. The transition states were confirmed through the presence of only one imaginary frequency.
While the local maxima of a many‐electron systems charge distribution occur in most cases only at the positions of nuclei, it has been shown that clusters of alkali metals often exhibit non‐nuclear maxima. The widely used localized charge partitioning according to Bader divides the electron cloud into non‐overlapping compartments, which are separated by zero‐flux surfaces and ideally contain only one nucleus.[ 45 , 46 ] Due to non‐atomic Bader compartments in materials with non‐nuclear attractors, a Bader partitioning in such cases does not correspond to a division into atomic electron distributions, resulting in undefined net atomic charges. Taking into account nuclear and valence electrons, the net atomic charges were therefore assigned via density‐derived electrostatic and chemical (DDEC6) atomic population analysis, as it also provides trustworthy results even for materials with non‐nuclear attractors.[ 47 , 48 ]
Results and Discussion
Hydrogen adsorption/absorption energies
Since the moisture‐induced corrosion of metallic lithium occurs through the cleavage of water molecules, we first investigated the interaction between monoatomic hydrogen and low‐index lithium surfaces Li(100), Li(110), and Li(111). For the purpose of characterizing the effects of monoatomic hydrogen adsorption on the structure and stability of the lithium surfaces, we have examined the adsorption/absorption on the highly symmetric sites above and below the surfaces (i. e., subsurface). As can be seen in Figure 1, the interaction of monoatomic hydrogen and metallic lithium led to the formation of cluster‐like structures. An analogous formation of well‐defined cluster structures on lithium has already been observed for oxygen in our previous studies. [49] In particular, adsorption at the corresponding top positions of all surfaces has shown a strong tendency to form square‐pyramidal complexes in which the surrounding lithium atoms are pulled out of the surface plane. The binding energies in Table 1 show that almost all investigated structures are thermodynamically stable with respect to the respective clean lithium surfaces and molecular H2 (in the gas phase). With a binding energy of 0.27 eV, Li(100)−Htop turned out to be the only unstable structure, that is, H‐adsorption from H2 is not likely. However, with atomic hydrogen as a reference, the Li(100)−Htop structure had a binding energy of −1.86 eV. Although the thermodynamically least favored structure, hydrogen in Li(100)−Htop had a similar five‐fold, square‐pyramidal, coordination as in Li(100)−Hhollow, which (with −0.67 eV) is the most stable structure on Li(100). In comparison to Li(100)−Hhollow, Li(100)−Hbridge had an almost identical binding energy of −0.64 eV. In this structure, hydrogen is surrounded by four lithium atoms in a tetrahedral arrangement, which was the lowest coordination for hydrogen in this study. With a very low energy difference of 0.03 eV, Li(100)−Hhollow and Li(100)−Hbridge were nearly degenerate. The subsurface and subbridge positions correspond to absorption sites under the Li(100) surface. The Li(100)−Hsubbridge was by 0.12 eV less stable than Li(100)−Hbridge. As hydrogen has been positioned below the surface in Li(100)−Hsubbridge, it is arranged in an octahedral, sixfold coordination, which was the highest coordination in this study. This coordination was also adopted in Li(100)−Hsubsurface, which had a binding energy of −0.49 eV. Interestingly enough, hydrogen in Li(100)−Hsubbridge and Li(100)−Hsubsurface is connected to the same number of lithium atoms as in rock‐salt structured lithium hydride (LiH), which crystallizes in the cubic space group at ambient temperatures and pressures. The geometries of Li(100)−Hsubsurface and Li(100)−Hsubbridge thus already showed structural similarities to those in LiH, where a periodic mixture of edge‐ and corner‐sharing Li/H octahedra builds up the crystal structure. With a small difference of only 0.04 eV compared to the subsurface, the subbridge is the most stable position below the Li(100) surface. However, adsorption on the surface into Li(100)−Hhollow is still by 0.15 eV more stable than below in the Li(100)−Hsubbridge. Hydrogen adsorption in the hollow and long‐bridge position on Li(110) resulted in the formation of the same structure, which in the following will only be referred to as Li(110)−Hlong‐bridge. With a binding energy of −0.75 eV, the Li(110)−Hlong‐bridge is the most stable structure on Li(110). Here the absorbed hydrogen is once again located in a square pyramidal cluster. Although hydrogen occupied the same five‐fold, square pyramidal coordination in the Li(110)−Htop structure, the adsorption on the top site was by 0.54 eV less stable than into the long‐bridge. With a binding energy of −0.21 eV, the Li(110)−Htop is thus the least stable structure on Li(110). Li(110)−Hshort‐bridge, where hydrogen was found in a tetrahedral coordination below the surface, has a binding energy of −0.49 eV. Absorption into the Li(110)−Hsubsurface structure resulted in a binding energy of −0.58 eV, making it the most stable structure under the Li(110) surface. In Li(110)−Hsubsurface hydrogen is surrounded by six lithium atoms in an octahedral fashion. Compared to the thermodynamically most preferred Li(110)−Hlong‐bridge, the storage of hydrogen below the surface was therefore only 0.17 eV less favorable. On Li(100) and Li(110) the respective lithium environment enforced the formation of similar coordination geometries for hydrogen.
Figure 1.
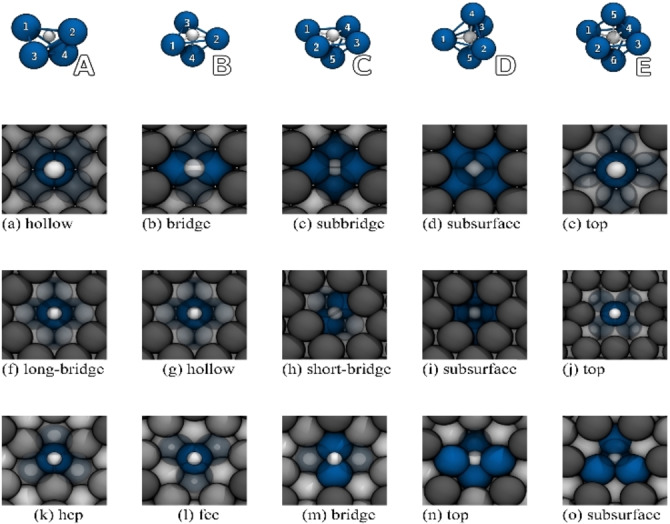
Surface structures of absorbed hydrogen on different adsorption sites on the low‐index surfaces (a–e) Li(100), (f–j) Li(110), and (k–o) Li(111). Lithium atoms of different layers are portrayed in different shades of gray. Hydrogen is shown in white and the coordinating lithium atoms in blue. The graphic above is an exemplary depiction of the different cluster‐like coordinations, which were formed on the absorption of hydrogen on the different lithium surfaces.
Table 1.
Binding energies per atom on the Li(100), Li(110), and Li(111) surface.
|
(hkl) |
Adsorption site |
E bind,H [a] [eV] |
Type |
Q DDEC6,H [b] [e atom−1] |
|---|---|---|---|---|
|
Li(100) |
hollow |
−0.67 |
C |
−0.58 |
|
bridge |
−0.64 |
A |
−0.67 |
|
|
subbridge |
−0.52 |
E |
−0.64 |
|
|
subsurface |
−0.48 |
E |
−0.62 |
|
|
top |
0.27 |
C |
−0.59 |
|
|
Li(110) |
hollow |
−0.75 |
C |
−0.60 |
|
long‐bridge |
−0.75 |
C |
−0.60 |
|
|
short‐bridge |
−0.49 |
A |
−0.72 |
|
|
subsurface |
−0.58 |
E |
−0.63 |
|
|
top |
−0.21 |
C |
−0.58 |
|
|
Li(111) |
hcp |
−0.89 |
B |
−0.66 |
|
fcc |
−0.59 |
B |
−0.67 |
|
|
bridge |
−0.78 |
A |
−0.66 |
|
|
subsurface |
−0.49 |
C |
−0.67 |
|
|
top |
−0.78 |
D |
−0.63 |
The hexagonal packing of the Li(111) surface layer atoms, on the other hand, permitted the formation of trigonal pyramidal clusters on the adsorption at hcp and fcc, and a trigonal bipyramidal cluster for hydrogen below the Li(111) surface in the subsurface position. For Li(111), hcp adsorption has the strongest binding (−0.89 eV). Despite comparable coordination geometries, the absorption of hydrogen in Li(111)−Hhcp was by 0.30 eV preferred compared to Li(111)−Hfcc. With respect to Li(111)−Hhcp, the incorporation of hydrogen below the surface into the Li(111)−Hsubsurface is by 0.40 eV less stable. On Li(111) adsorption at the bridge position again resulted in a fourfold coordinated tetrahedral environment, and when deposited on the top position on Li(111), the hydrogen atom slipped into a five‐fold, square‐pyramidal configuration. The configurations Li(111)−Hbridge and Li(111)−Htop each had a binding energy of −0.78 eV and were with a difference of 0.11 eV compared to Li(111)−Hhcp the second most stable structures on Li(111). Due to lithium's low standard electrode potential, it was not surprising that adsorption/absorption occurred under the transfer of a high amount of negative charge to the hydrogen atom. As can be seen in Table 1, an DDEC6 analysis for the absorption complexes revealed that the charge of hydrogen at the metallic lithium surfaces is in a comparable order of magnitude to that within bulk‐lithium‐hydride in its rock salt phase (the DDEC6 net‐charge for hydrogen in LiH bulk was +0.78 e atom−1).
Under the inclusion of the surrounding lithium atoms, atomic hydrogen thus forms negatively charged, hydride‐like centers on the lithium, which are also thermodynamically stable below the surface. With its concentrated negative charge, the absorbed monoatomic hydrogen consequently represents a potential target for intermolecular interactions.
Mobility of hydrogen on Li(100) and Li(bcc)
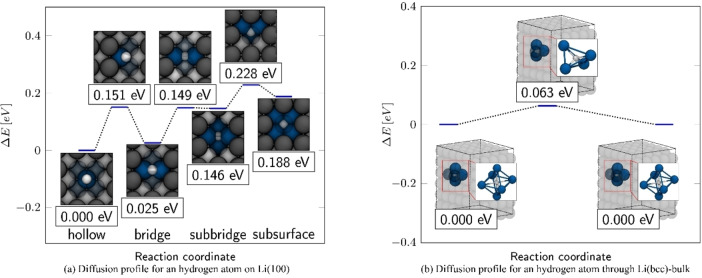
Our investigations on Li(100) have shown that absorption in the hollow and bridge positions is almost degenerate, and that H adsorption below the surface is by only 0.14 eV less stable than on the surface. To evaluate the mobility of hydrogen on the surface and the embedding under the surface, the energy barriers for diffusion of a hydrogen adatom between hollow, bridge, and subsurface were determined. The energy profile for monoatomic surface diffusion is given in Figure 2a, where the energies of the transition states are related to the energy of the most stable Li(100)−Hhollow structure. As can be seen from the diffusion barriers in Table 2, the movement of an adsorbed hydrogen atom is associated with low diffusion barriers. Starting from the hollow position, hydrogen can diffuse almost unhindered into the bridge position with a barrier of only 0.151 eV. With 0.126 eV for the reverse process, diffusion from the bridge to a more stable, neighboring hollow position is even easier. In the transition state, hydrogen is surrounded (in a trigonal fashion) by two lithium atoms from the surface and one from the second layer. Moving from the tetrahedron‐like environment of the bridge position on the surface, hydrogen could penetrate into the surface by diffusing into the subbridge position. The entry into the subbridge position possesses a low barrier of merely 0.124 eV. Interestingly, with a small barrier of only 0.003 eV the reverse process of the subbridge into the bridge position is almost barrier‐free. Diffusion from subbridge into subsurface occurred via a barrier of 0.082 eV within a tetrahedral‐coordinated transition state. The reverse diffusion into the subbridge position is correspondingly lower with 0.040 eV. Although the positions above the Li(100) surface were thermodynamically more stable, storage of hydrogen in the bulk material is in principle possible from a thermodynamic point of view, due to extremely low barriers. We therefore investigated the diffusion of hydrogen within the bulk material, where the hydrogen atom can occupy octahedral cavities, which are basically a continuation of the subbridge/subsurface adsorption sites of Li(100). Here, in the transition state for the diffusion between the cavities, hydrogen is again surrounded by four lithium atoms and assumes a tetrahedron‐like geometry. With a low barrier of 0.063 eV, atomic hydrogen can therefore not only migrate almost freely on the surface layer and penetrate the lattice by overcoming a modest activation barrier, but also shows a very high degree of mobility in the bulk material. In order to evaluate the presence of atomic hydrogen, we have studied the dissociation of molecular hydrogen on Li(100). As can be seen in Figure 3 and Table 3, molecular hydrogen adsorbs only weakly with a binding energy of only −0.03 eV on the top position of Li(100). The low binding energy is also expressed by a comparatively low charge of 0.06 e per molecule, which is transferred from lithium to the adsorbed H2 molecule. With 0.76 Å, the bond length is also close to that of an isolated molecule (dH2=0.75 Å). From the top position, a pathway was found, where molecular hydrogen dissociated into two adjacent bridge positions. The dissociation takes place via a transition state, which lies 0.271 eV above the adsorbed hydrogen on the top position. In this transition state, molecular hydrogen has an increased bond length of 0.88 Å and lies transversely in the corner of a hollow position.
Figure 2.
Energy profiles for the diffusion of a hydrogen atom on the Li(100) surface and in the bulk material. The energy profile in (a) shows the diffusion pathway on Li(100) from a hollow site into a neighboring subsurface position, by crossing an adjacent bridge and subbridge position. The framed values indicate the relative energy in eV, which were related to the most stable hollow structure. The energy profile for the diffusion of a hydrogen atom through the Li(bcc)‐bulk structure is shown in (b). In bulk‐lithium hydrogen diffuses from an octahedrally‐coordinated environment via a tetrahedral transition state to an equivalent octahedrally‐coordinated. Shown are the structures of the octahedrally coordinated initial and final configurations, as well as the tetrahedral transition state. The framed values indicate relative energies related to the octahedrally coordinated structure.
Table 2.
ΔE for and ΔE back barriers for the respective backward and forward diffusion/dissociation processes of hydrogen on the Li(100) surface and in Li(bcc) bulk.
|
Process |
ΔE for [eV] |
ΔE back [eV] |
|||
|---|---|---|---|---|---|
|
Li(100)−Hhollow |
|
Li(100)−Hbridge |
0.151 |
0.126 |
|
|
Li(100)−Hbridge |
|
Li(100)−Hsubbridge |
0.124 |
0.003 |
|
|
Li(100)−Hsubbridge |
|
Li(100)−Hsubsurface |
0.082 |
0.040 |
|
|
Li(100)−H2,top |
|
Li(100)−Hbridge,bridge |
0.271 |
1.444 |
|
|
Li(bcc)−Hbulk,1 |
|
Li(bcc)−Hbulk,2 |
0.063 |
0.063 |
|
Figure 3.
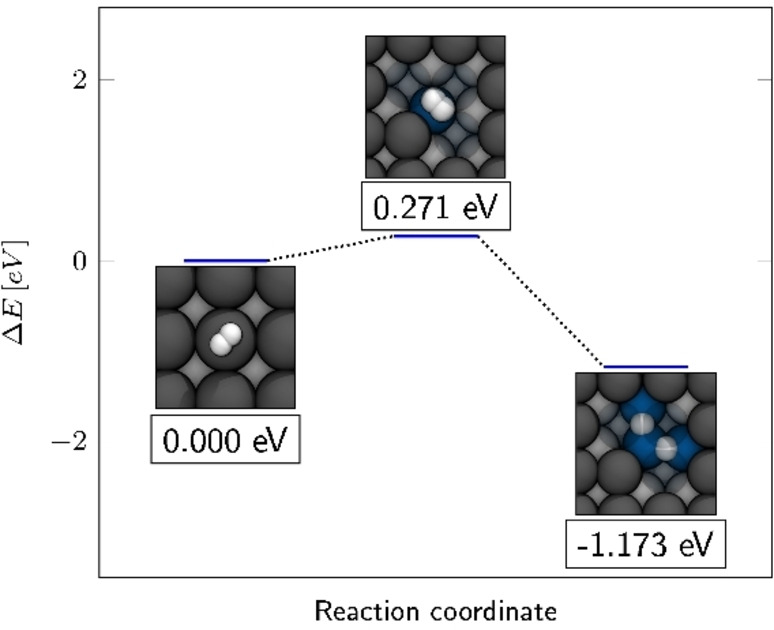
Energy profile for the dissociation of molecular hydrogen into two adjacent bridge positions on Li(100). The framed values indicate the relative energy related to the Li(100)‐H2 adsorption complex.
Table 3.
Binding energies per molecule on Li(100). The energies were related to the respective molecular species in the gas phase.
|
|
Adsorption site |
E bind,mol [eV] |
Q DDEC6,H [e atom−1] |
|
|---|---|---|---|---|
|
Li(100)−H2 |
top |
−0.03 |
Ha: 0.03 |
Hb: 0.03 |
|
Li(100)−OH |
hollow |
−2.08 |
O: −0.96 |
H: 0.33 |
|
bridge |
−2.02 |
O: −1.03 |
H: 0.33 |
|
|
top |
−0.96 |
O: −1.01 |
H: −0.34 |
|
|
sidebridge |
−2.06 |
O: −1.09 |
H: −0.34 |
|
|
sidehollow |
−2.09 |
O: −1.03 |
H: −0.32 |
|
|
Li(100)−H2O |
bridge |
−0.78 |
O: −0.77 |
Hup: 0.26 |
|
|
|
|
Hdown: 0.28 |
|
Dissociation leads to a structure, which is by 1.173 eV more stable than the initial structure.
As the partially negatively charged, monoatomic hydrogen absorbate has high mobility on the lithium surface and in the bulk material it can rush over (and through) the material until it encounters other surface contaminants with which it can interact. Molecular H2 exhibits a low dissociation barrier but may also desorb readily due to its weak binding to the Li(100) surface.
Mobility and dissociation of OH on Li(100)
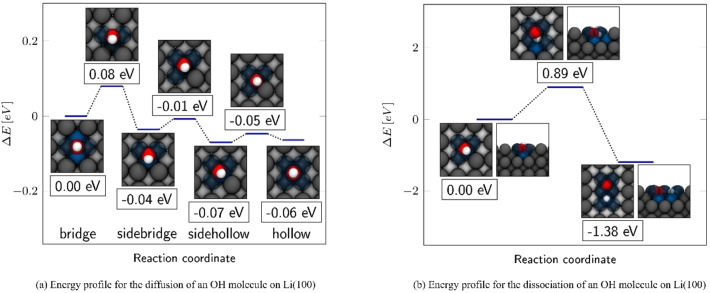
To examine the essential interactions between lithium and an OH molecule, individual OH molecules were placed on the high symmetrical hollow, bridge, and top adsorption sites of Li(100). Here, too, the formation of the top structure takes place by tearing out the four surrounding lithium atoms out of the surface plane. By investigating the energy profile for the diffusion of an OH molecule between bridge and hollow, two further local minima could be identified. In the following, these two minima are referred to as sidebridge and sidehollow. Together with hollow, bridge, and top structures, they are shown in Figure 4. Overall, with a binding energy of −0.96 eV, the top position is by far the least favorable site for the OH absorption. Except for Li(100)−OHtop, the other absorption structures exhibit very small energy differences, as can be seen from the binding energies in Table 3. Unsurprisingly, the small energy differences are accompanied by an extremely flat energy profile with low diffusion barriers, which is shown in Figure 5a. The energy barriers for the diffusion and dissociation of OH as well as water are summarized in Table 4. After Li(100)−OHtop, the Li(100)−OHbridge structure is the least stable structure, with a binding energy of −2.02 eV. In this configuration, the OH molecule is coordinated by a total of four lithium atoms. The diffusion into the 0.04 eV more stable sidebridge proceeds via a barrier of 0.08 eV. Here, the OH molecule changes its configuration from a fourfold to a threefold lithium coordination. Although the barrier for the reverse process is with 0.12 eV remarkably low, the process for the diffusion into the sidehollow position is preferred, with an even lower barrier of only 0.03 eV. In the sidehollow position, the OH molecule is surrounded by a total of four lithium atoms. From this position, the OH molecule could either diffuse back into the 0.03 eV less stable sidebridge via a barrier of 0.06 eV, or into the hollow position with a barrier of only 0.02 eV. In the hollow position, the OH molecule is surrounded by six lithium atoms. The hollow position is energetically nearly equal to the sidehollow, as they differ by only 0.01 eV. The low energy differences between the individual structures and the flat diffusion profile demonstrate an almost barrier‐free transition between the structures and a high mobility of the OH molecule on Li(100). The investigation of various processes for the decomposition of the OH molecule using the CI‐NEB (climbing image‐nudged elastic band) method has shown that a dissociation into oxygen and hydrogen from one of the considered absorption compounds is preceded by a diffusion into the sidehollow site. Here, the geometry of the sidehollow allows a simple dissociation of the H‐atom into the 1.84 Å distant bridge position. In comparison, the closest unoccupied bridge position is 2.01 Å apart from the hydrogen atom in the sidebridge site. The actual dissociation process is therefore observed after the diffusion into the sidehollow. The dissociation of the OH molecule takes place through the release of the hydrogen atom into an adjacent hollow position via a barrier of 0.89 eV as shown in Figure 5b. Particularly noteworthy is the high energy difference of 1.38 eV between the absorbed OH molecule and the dissociated complex. Despite a comparably high barrier, splitting of the OH molecule on the surface is thus (thermodynamically) associated with a high energy gain. The high energy difference is a result of hydrogen and oxygen atoms forming very stable complexes in their respective hollow configurations.
Figure 4.
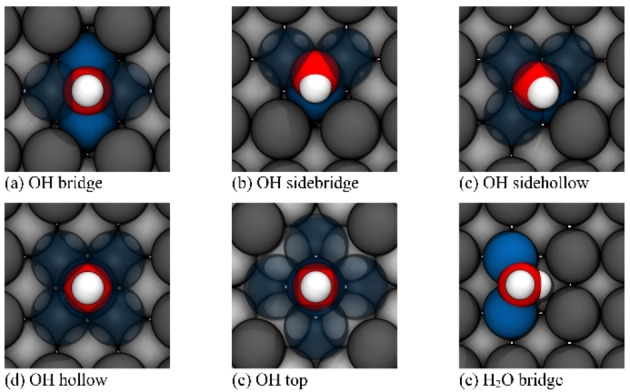
Top view of (a–e) the different absorption complexes of a OH molecule and (f) the adsorption structure of H2O in on Li(100). Hydrogen is shown in white, oxygen in red, and the coordinating lithium atoms in blue.
Figure 5.
(a) Energy profile for the diffusion of an OH molecule on Li(100), which shows the transition from an OH‐molecule in the bridge position towards the hollow site. In this diffusion process the OH molecule passes through two local minima, which have been labeled as sidebridge and sidehollow. The framed values indicate the relative energy, which was related to the initial bridge structure. (b) Energy profile for the dissociation of an OH molecule on Li(100). The pathway shows an OH molecule in the sidehollow position releasing its hydrogen atom to the opposite bridge position. The framed values indicate the relative energies, which are related to the undissociated OH sidehollow absorption complex.
Table 4.
ΔE for and ΔE back barriers for the respective backward and forward diffusion, dissociation, and reaction processes of OH and H2O molecules on Li(100).
|
Process |
ΔE for [eV] |
ΔE back [eV] |
|||
|---|---|---|---|---|---|
|
Li(100)−OHbri. |
|
Li(100)−OHsidebri. |
0.08 |
0.12 |
|
|
Li(100)−OHsidebri. |
|
Li(100)−OHsidehol. |
0.03 |
0.06 |
|
|
Li(100)−OHsidehol. |
|
Li(100)−OHhol. |
0.02 |
0.01 |
|
|
Li(100)−OHsidehol. |
|
Li(100)−Ohol.+Hhol. |
0.89 |
2.27 |
|
|
Li(100)−OHsidehol.+Hbri. |
|
Li(100)−Ohol.+H2,top |
0.40 |
0.61 |
|
|
Li(100)−H2Obri.,1 (flip‐bridge) |
|
Li(100)−H2Obri.,2 |
0.05 |
0.05 |
|
|
Li(100)−H2Obri.,1 (twist) |
|
Li(100)−H2Obri.,2 |
0.14 |
0.14 |
|
|
Li(100)−H2Obri.,1 (flip‐top) |
|
Li(100)−H2Obri.,2 |
0.15 |
0.15 |
|
|
Li(100)−H2Obri. |
|
Li(100)−OHsidebri.+Hbri. |
0.22 |
2.11 |
|
|
Li(100)−H2Obri.+Hbri. |
|
Li(100)−OHsidebri.+H2,top |
0.06 |
0.66 |
|
Through the attraction of the surrounding surface atoms, OH molecules form stable absorption complexes on the lithium surface, which lie in a similar stability range. Here, the low barriers for the diffusion allow an almost unhindered movement of the OH molecule through the lithium surface. The dissociation of the OH molecule itself is exothermic, but the cleavage is associated with a (comparatively) high reaction barrier.
Mobility and dissociation of water on Li(100)
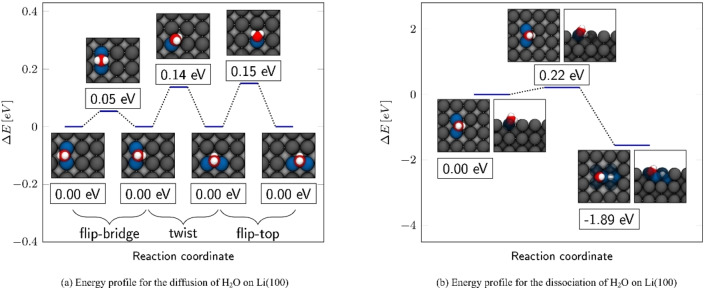
On Li(100), the water molecule adsorbs on the bridge position (as shown in Figure 4f), where it adsorbs with a binding energy of −0.77 eV. In this structure, one hydrogen (Hup) is directed away from the surface while the other one (Hdown) points to a hollow position on Li(100). The O−H bond length to Hup is with 0.98 Å very close to the bond length of 0.97 Å in the isolated water molecule. In contrast, the O−H bond length to Hdown was slightly stretched to a value of 1.02 Å. Compared to the isolated molecule, the H−O−H angle of the adsorbed water has widened slightly from 104.48 to 106.93°. Although both hydrogen atoms in the adsorbed water molecule are partially positively charged, the net charge for Hdown is with e atom−1 slightly lower than the 0.37 e atom−1 of Hup. The smaller positive charge of Hdown can be explained by the proximity to the reducing lithium surface, which already could have increased its electron density. This can also be seen in Figure 7h, where an increase of the electron density was noticed in front of the Hdown atom. As in isolated water, oxygen was with −0.78 e atom−1 partially negatively charged. Here, the water molecule is slightly tilted in such a way that one hydrogen atom is minimally closer to the lithium surface. The positive interaction energies of two water molecules in the Supporting Information indicate repulsive interactions at lower coverages, due to the water molecules attracting the lithium of their bridge positions, which causes a slight tension on the surface. Like the OH molecule, water also showed a pronounced mobility on Li(100). As shown in Figure 6a the diffusion from one bridge position to another took place by either “flip” or “twist” mechanisms. The reversal of a water molecule on a bridge position from one side to the other via the flip mechanism is nearly unhindered, as the barrier for this process is merely 0.05 eV high. Diffusion between two adjacent bridge positions via the twist mechanism followed a path with a barrier of 0.14 eV. In the flip‐top mechanism, the water molecule moved out of the bridge position over an adjacent top position into another adjoining bridge position with a barrier of 0.15 eV.
Figure 7.
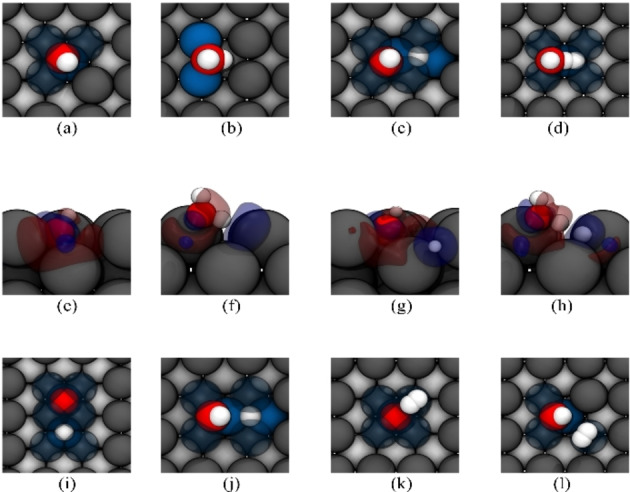
(a,b) Top view of the undissociated adsorption/absorption complexes of OH and H2O on Li(100) and (c,d) the respective complexes in the presence of a hydrogen atom. (e–h) Charge density difference isosurfaces of the corresponding undissociated structures. Blue regions indicate an increase and red regions a decrease of electron density. (i,j) Top view of the dissociated OH and water molecule on Li(100) and (k,l) corresponding structures in the presence of the generated H2 molecule.
Figure 6.
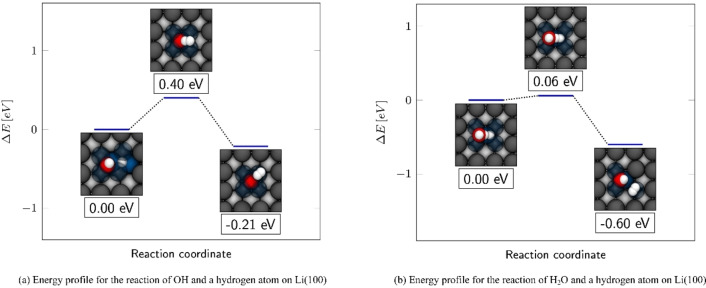
Energy profile showing the hydrogen evolution through the reaction of a hydrogen atom in the bridge position (a) with a OH molecule and (b) with a H2O molecule on Li(100). Both profiles show the dissociation of the respective molecule under the release of one of their hydrogen atoms towards the adsorbed hydrogen atom. The framed relative energies are related to the respective undissociated structures.
The dissociation of the water molecule on the bridge position took place via the release of Hdown into the opposite, unoccupied bridge position. In this process, the water molecule decomposed into a OH molecule in the sidebridge configuration and a hydrogen atom in the opposite bridge position. In Figure 6b it can be seen from the depictions in the energy profile, that hydrogen was released in a tilting movement of water towards the bridge position. In comparison to the OH dissociation, the water decomposition is characterized by a particularly low barrier of 0.22 eV. The dissociated structure is −1.89 eV more stable than the water adsorption complex. This high gain in stability illustrates the strongly exothermic nature of the lithium/water reaction.
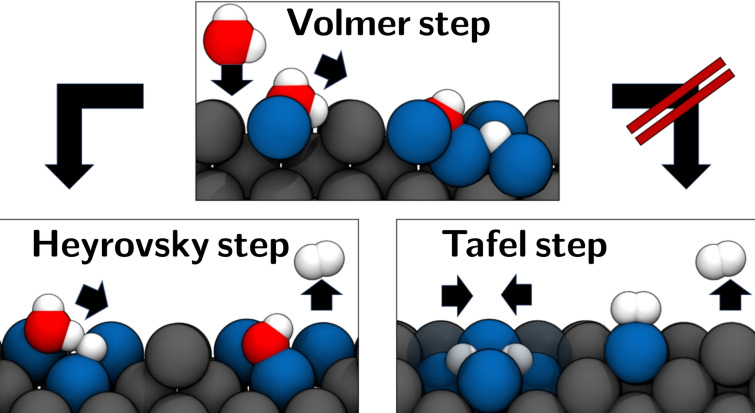
Like adsorbed hydrogen atoms and OH molecules, water can advance to other species on the surface due to its high mobility on Li(100) and react with them even before its dissociation. However, the low dissociation barrier of water shows that dissociation of the water molecule under the formation of an adsorbed hydrogen atom Had and an OH molecule can occur similar to the Volmer process[ 50 , 51 , 52 ] in alkaline medium even without additional adsorbates [Eq. 5]:
| (5) |
Hydrogen evolution on Li(100)
A complete reaction of water with lithium leads to the formation of LiOH and H2. Evidently, the remaining hydrogen atom must recombine with another hydrogen atom for H2 evolution to occur. So far, our studies on the diffusion of different species have suggested a high mobility on Li(100) due to low diffusion barriers, and a low barrier for the dissociation of water. Due to the high mobility it is therefore likely that the different species can meet on the surface, leading to the evolution of molecular hydrogen in case of suitable encounters. In the following, we have considered the development of H2 through an absorbed hydrogen atom, which either recombines with either an adsorbed OH or water molecule. In addition, we have also considered the recombination of two absorbed hydrogen atoms. The latter process effectively corresponds to the reversal of the energy profile for the hydrogen dissociation in Figure 3. For the recombination of a H atom with a OH molecule, atomic hydrogen Hbridge was positioned in the bridge position in front of an OH molecule in the sidehollow, as shown in Figure 7c. The distance between HOH in the OH molecule and the absorbed Hbridge was 2.83 Å. Figure 7g shows that the positively charged HOH stands directly opposite to the partially negatively charged Hbridge. The respective DDEC6 charges were 0.36 e atom−1 for HOH and −0.72 e atom−1 for Hbridge. In the final structure in Figure 7k the hydrogen molecule was located on the corner atom of an absorbed oxygen atom, which was absorbed in the hollow position. The adsorption energy of H2 on the oxygen absorption complex was with −0.03 eV equally low as on pure lithium. The recombination of Hbridge and HOH to molecular hydrogen took place as shown in Figure 8a via a barrier of 0.40 eV. Thus, the barrier for the recombination was by 0.49 eV lower than the decomposition of the OH molecule on the lithium surface. From a thermodynamic point of view, the formation of H2 through OH and absorbed hydrogen resulted in a stability gain. Since the adsorbed H2 molecule had a negligibly low adsorption energy, the final structure was mainly stabilized through a Li(100)−Ohollow complex. The hydrogen evolution through the water molecule was investigated with the structure shown in Figure 7d. In this configuration, the hydrogen atom Hbridge was absorbed laterally from the normal bridge position and shifted towards the adsorbed water molecule on the opposite bridge position. The distance between Hbridge and the downward‐facing hydrogen atom Hwater of the adsorbed water molecule was therefore only 1.29 Å. Analogous to the corresponding OH structure, a partially positively charged Hwater and a partially negatively charged Hbridge were located opposite to each other in this structure. For Hwater and Hbridge net charges of 0.31 e/atom and −0.56 e atom−1 were found, respectively. In the final structure in Figure 7l the OH molecule was in the sidebridge configuration and the hydrogen molecule with only −0.02 eV weakly bound to an opposing top position. Remarkable was the extremely low barrier of 0.06 eV for the dissociation of the water molecule under the formation of molecular hydrogen. This barrier was thus 0.16 eV lower as the already low barrier for the pure dissociation of the water molecule. As can be seen in the supporting information, the analogous process with an H atom on the side also exhibits with 0.14 eV a lower barrier for the cleavage of water. The thermodynamic gain in stability of 0.60 eV was in this case also mainly due to the formation of a Li(100)−OHsidebridge complex. Compared to the simple cleavage of H2O and OH, the recombination processes showed significantly lower barriers. An analysis of the charge distribution has shown that this can be explained by the fact that during recombination a negatively charged hydrogen faced a partially positively charged hydrogen in the molecule, as it is shown in Figure 7g,h. Both during hydrogen development via an OH or water molecule, a thermodynamic driving force exists via the formation of stable surface complexes. Investigating the energy path for the H2 dissociation from Figure 3 clarifies that the recombination of two absorbed hydrogen atoms is unlikely.
Figure 8.
Energy profile of hydrogen evolution through the reaction (a) of a hydrogen atom in the bridge position with a OH molecule and (b) with a H2O molecule on Li(100). Both profiles show the dissociation of the respective molecule under the release of one of their hydrogen atoms towards the adsorbed hydrogen atom. The framed relative energies are related to the respective undissociated structures.
A hydrogen evolution reaction (HER) through absorbed hydrogen atoms Hab according to a homolytic, Tafel‐like mechanism[ 50 , 51 , 52 ] can therefore be excluded as main mechanism for the HER [Eq. 6]:
| (6) |
Instead of the Tafel process, a Heyrovsky‐like step according to Equation (7) turns out to be the decisive process for the H2 development on Li100:
| (7) |
During initial degradation, the recombination reactions of OH or water with an adsorbed hydrogen can therefore be seen as the cause of the HER.
Due to the low reaction barrier of the recombination reactions, it is likely that the partially negatively charged hydrogen centers can be regarded as reaction centers of hydrogen development. Therefore, an increased hydrogen concentration on the surface (e. g., due to the preceding cleavage of OH or water molecules) would result in an enhanced hydrogen evolution.
Conclusion
In this work, we performed periodic density functional theory calculations to investigate the basic principles of water‐induced lithium corrosion. The studies on the interaction between monoatomic hydrogen and the low‐index surfaces Li(100), Li(110), and Li(111) have shown that hydrogen absorbs under the formation of cluster‐like structures under a high negative charge transfer from lithium to the absorbate. Given the low differences in binding energy for different adsorption sites on and below the surface, our studies have shown that diffusion of hydrogen on Li(100) and in Li(bcc) bulk is characterized by high mobility. While monoatomic hydrogen is absorbed by the lithium surface, molecular hydrogen is only weakly adsorbed on the top position on Li(100) without significant charge transfer.
The investigation of OH adsorption on Li(100) has shown that OH forms clusters, which are extremely stable from a thermodynamic point of view. Except for the Li(100)−OHtop structure (which still has a high binding energy of −0.96 eV) all OH absorption complexes exhibit very low energy differences and consequently shallow diffusion profiles with low barriers. Likewise, water molecules can move with a high mobility, via “flip” or “twist” mechanisms. Starting from a Li(100)−H2Obridge structure, a dissociation is possible according to a Volmer‐like mechanism via the release of a hydrogen atom to an adjacent bridge position via a barrier of only 0.22 eV. Compared to OH, water is thermodynamically less stable (due to a much lower binding energy) and shows a significantly lower dissociation barrier. By forming different surface clusters on Li(100), the cleavage of the investigated molecules leads in all cases to a considerable gain in stability. From a thermodynamic point of view, the recombination of two absorbed hydrogen atoms via a Tafel process can therefore be excluded as a major source for hydrogen evolution, as illustrated in Figure 9. Due to the surface clusters that are formed next to the weakly adsorbed H2 molecule, the H2 development via recombination of a hydrogen atom with either an OH or water molecule, on the other hand, leads to a gain in stability. Here, the barriers for hydrogen development analogous to the Heyrovsky mechanism in alkaline medium via OH or water are considerably lower than the corresponding simple dissociation processes. The reason for the lower barriers can be found in the fact that the negatively charged hydrogen adsorbates are opposed to a partial positively charged hydrogen when they encounter an OH or water molecule on Li(100). The strong lowering of the dissociation barrier implies that there is a self‐supporting effect for the cleavage of OH and water molecules when more hydrogen adsorbates are present on the lithium surface (i. e., higher coverages). Due to the lower reaction barrier, water is to be seen as the main source of the hydrogen evolution reaction.
Figure 9.
Schematic representation of the steps in the HER on Li(100). In a Volmer‐like step, a water molecule adsorbs on the lithium surface and dissociates to form an adsorbed hydrogen atom and OH molecule. Analogous to the Heyrovsky mechanism in alkaline medium, another water molecule attacks the adsorbed hydrogen atom in the next step, forming an OH and H2 molecule. In comparison, a recombination of two adsorbed hydrogen atoms according to the Tafel mechanism is unlikely.
By breaking down the initial water‐induced corrosion into individual steps, the foundation for a more systematic approach to the development of the metallic lithium anode may be facilitated. While most approaches to protect and delay water‐induced corrosion of the anode follow the strategy of keeping the reactants away from the surface through low levels of humidity and/or coating of the surface, the identification of the negatively charged hydrogen adsorbates as reaction centers may offer an additional means of control. Since these centers are crucial components in the Heyrovsky‐type cleavage, new design principles could aim at chemically or sterically blocking the negatively charged hydrogen centers from further reacting. As fundamental experimental studies have already shown, the presence of water can have a significant effect on the reaction of lithium with other atmospheric gases such as O2 or N2.[ 28 , 29 , 53 ] In particular, the formation of Li3N must be mentioned here, which is highly enhanced by the presence of water. [53] Since the respective degradation mechanisms with water are not known, further studies on water‐induced degradation can possibly help to clarify these mechanisms and thus enable a more controlled pretreatment.
While solvent effects are irrelevant during cell production, they have a decisive effect within a battery. However, a more advanced simulation should be carried out with the aid of an explicit solvent model since the decomposition of the electrolyte will have a decisive influence on the course of the reaction.
Conflict of interest
The authors declare no conflict of interest.
Supporting information
As a service to our authors and readers, this journal provides supporting information supplied by the authors. Such materials are peer reviewed and may be re‐organized for online delivery, but are not copy‐edited or typeset. Technical support issues arising from supporting information (other than missing files) should be addressed to the authors.
Supporting Information
Acknowledgements
This work was supported by the German Research Foundation (DFG) under Project ID 390874152 (POLiS Cluster of Excellence) as well as the priority program SPP‐2248. The authors acknowledge support by the High Performance and Cloud Computing Group at the Zentrum fur Datenverarbeitung of the University of Tübingen, the state of Baden‐Württemberg through bwHPC and the German Research Foundation (DFG) through grant no INST 37/935‐1 FUGG. Open Access funding enabled and organized by Projekt DEAL.
M. van den Borg, D. Gaissmaier, D. Fantauzzi, E. Knobbe, T. Jacob, ChemSusChem 2022, 15, e202101765.
References
- 1. Armand M., Tarascon J., Nature 2008, 451, 652–657. [DOI] [PubMed] [Google Scholar]
- 2. Varzi A., Raccichini R., Passerini S., Scrosati B., J. Mater. Chem. A. 2016, 4, 17251–17259. [Google Scholar]
- 3. Andre D., Kim S., Lamp P., Lux S. F., Maglia F., Paschos O., Stinaszny B., J. Mater. Chem. A 2015, 3, 6709–6732. [Google Scholar]
- 4. Janek J., Zeier W., Nat. Energy 2016, 1, 16141. [Google Scholar]
- 5. Mizushima K., Jones P. C., Wiseman P. J., Goodenough J. B., Solid State Ionics 1981, 3–4, 171–174. [Google Scholar]
- 6. Guyomard D., Tarascon J. T., Adv. Mater. 1994, 6, 408–412. [Google Scholar]
- 7. Winter M., Besenhard J. O., Spahr M. E., Novak P., Adv. Mater. 1998, 10, 725–763. [Google Scholar]
- 8. Scrosati B., Garche J., J. Power Sources 2010, 195, 2419–2430. [Google Scholar]
- 9. Tarascon J., Armand M., Nature 2001, 414, 359–367. [DOI] [PubMed] [Google Scholar]
- 10. Winter M., Z. Phys. Chem. 2009, 223, 1395–1406. [Google Scholar]
- 11. Rauth R. D., Abraham K. M., Pearson G. F., Surprenant J. K., J. Electrochem. Soc. 1979, 126, 523–526. [Google Scholar]
- 12. Manthiram A., Fu Y., Chung S. H., Zu C., Su Y., Chem. Rev. 2014, 114, 11751–11787. [DOI] [PubMed] [Google Scholar]
- 13. Yang Y., McDowell M. T., Jackson A., Cha J. J., Hong S. S., Cui Y., Nano Lett. 2010, 10, 1486–1491. [DOI] [PubMed] [Google Scholar]
- 14. Song M.-K., Cairns E. J., Zhang Y., Nanoscale 2013. 5, 2186–2204. [DOI] [PubMed] [Google Scholar]
- 15. McCloskey B. D., Bethune D. S., Shelby R. M., Girishkumar G., Luntz A. C., J. Phys. Chem. Lett. 2011, 2, 1161–1166. [DOI] [PubMed] [Google Scholar]
- 16. Padbury R., Zhang X., J. Power Sources 2011, 196, 4436–4444. [Google Scholar]
- 17. Bruce P. G., Freuenberger S. A., Hardwick L. J., Tarascon J. M., Nat. Mater. 2012, 11, 19–29. [DOI] [PubMed] [Google Scholar]
- 18. Read J., J. Electrochem. Soc. 2002, 149, A1190–A1195. [Google Scholar]
- 19. Christensen J., Albertus P., Sanchez-Carrera R. S., Lohman T., Kozinsky B., Liedtke R., Ahmed J., Kojic A., J. Electrochem. Soc. 2012, 59, R1–R30. [Google Scholar]
- 20. Takehara Z., J. Power Sources 1997, 8, 82–86. [Google Scholar]
- 21. Aurbach D., Zaban A., J. Electroanal. Chem. 1993, 348, 155–179. [Google Scholar]
- 22. Aurbach D., Gofer Y., Lu A. S. Z., Chusid O., Gizbar H., Cohen Y., Ashkenazi V., Moshkovich M., Turgemann R., Levi E., J. Power Sources 2001, 97–98, 28–32. [Google Scholar]
- 23. Becking J., Gröbmeyer A., Kolek M., Rodehorst U., Schulze S., Winter M., Bieker P., Stan M. C., Adv. Mater. Interfaces 2017, 4, 1700166. [Google Scholar]
- 24. Peled E., J. Electrochem. Soc. 1979, 126, 2047–2051. [Google Scholar]
- 25. Aurbach D., Markovsky B., Shechter A., Ein-Eli Y., Cohen H., J. Electrochem. Soc. 1996, 143, 3809–3820. [Google Scholar]
- 26. Peled E., Golodnitsky D., Ardel G., J. Electrochem. Soc. 1997, 144, L208, 1997. [Google Scholar]
- 27. Johnson E. K., Hubbard W. N., J. Chem. Thermodyn. 1975, 7, 781–786. [Google Scholar]
- 28. Hoenigmann J., Keil R., Surf. Sci. 1984, 18, 207–222. [Google Scholar]
- 29. Zavadil K., Armstrong N., Surf. Sci. 1990, 230, 47–60. [Google Scholar]
- 30. Takeshita H., Watanabe H., J. Nucl. Mater. 1993, 207, 92–97. [Google Scholar]
- 31. Zhuang G., Chen Y., Ross P. N. J., Surf. Sci. 1998, 418, 139–149. [Google Scholar]
- 32. Wen M. W. Z., Liu Y., Wang X., Huang L., J. Power Sources 2011, 196, 8091–8097. [Google Scholar]
- 33. Harry K. J., Hallinan D. T., Parkinson D. Y., MacDowell A. A., Balsara N. P., Nat. Mater. 2014, 13, 69–73. [DOI] [PubMed] [Google Scholar]
- 34. Aurbach D., Weissman I., Zaban A., Chusid O., Electrochim. Acta 1994, 39, 57–71. [Google Scholar]
- 35. Aurbach D., Weissman I., Zaban A., Dan P., Electrochim. Acta 1999, 45, 1135–1140. [Google Scholar]
- 36. Kresse G., Furthmüller J., Comput. Mater. Sci. 1996, 6, 15–50. [Google Scholar]
- 37. Kresse G., Furthmüller J., Phys. Rev. B 1996, 54, 169–185. [DOI] [PubMed] [Google Scholar]
- 38. Kresse G., Hafner J., Phys. Rev. B 1993, 47, 558–561. [DOI] [PubMed] [Google Scholar]
- 39. Perdew J. P., Burke K., Ernzerhof M., Phys. Rev. Lett. 1996, 77, 3865–3868. [DOI] [PubMed] [Google Scholar]
- 40. Monkhorst H. J., Pack J. D., Phys. Rev. B 1976, 13, 5188–5192. [Google Scholar]
- 41. Gaissmaier D., Fantauzzi D., Jacob T., J. Chem. Phys. 2019, 150, 041723. [DOI] [PubMed] [Google Scholar]
- 42. Gaissmaier D., v d Borg M., Fantauzzi D., Jacob T., ChemSusChem 2019, 13, 771–783. [DOI] [PMC free article] [PubMed] [Google Scholar]
- 43. Henkelman G., Jonsson H., J. Chem. Phys. 2000, 113, 9978–9985. [Google Scholar]
- 44. Henkelman G., Uberuaga B. P., Jonsson H., J. Chem. Phys. 2000, 113, 9901–9904. [Google Scholar]
- 45. Henkelman G., Arnaldsson A., Jonsson H., Comput. Mater. Sci. 2006, 36, 354–360. [Google Scholar]
- 46. Bader R., Atoms in Molecules: A Quantum Theory, Oxford University Press, Oxford: 1990. [Google Scholar]
- 47. Manz T. A., Limas N. G., RSC Adv. 2016, 6, 47771–47801. [Google Scholar]
- 48. Limas N. G., Manz T. A., RSC Adv. 2016, 6, 45727–45747. [Google Scholar]
- 49. v d Borg M., Gaissmaier D., Knobbe E., Fantauzzi D., Jacob T., Appl. Surf. Sci. 2021, 555, 149447. [Google Scholar]
- 50. Wei J., Zhou M., Long A., et al., Nano-Micro Lett. 2018, 10, 75. [DOI] [PMC free article] [PubMed] [Google Scholar]
- 51. Skúlason E., Proc. Comput. Sci. 2015, 51, 1887–1896. [Google Scholar]
- 52. Safizadeh F., Ghali E., Houlachi G., Int. J. Hydrogen Energy 2015, 40, 256–274. [Google Scholar]
- 53. Markowitz M. M., Boryta D. A., J. Chem. Eng. Data 1962, 7, 586–591. [Google Scholar]
Associated Data
This section collects any data citations, data availability statements, or supplementary materials included in this article.
Supplementary Materials
As a service to our authors and readers, this journal provides supporting information supplied by the authors. Such materials are peer reviewed and may be re‐organized for online delivery, but are not copy‐edited or typeset. Technical support issues arising from supporting information (other than missing files) should be addressed to the authors.
Supporting Information


