

Abstract
A strong metal–support interaction (SMSI) type catalyst has been synthesized and applied to a molten hydroxide direct carbon fuel cell (MHDCFC) to enhance the reaction activity of the anode carbon fuel through the interaction between the metal Ni and the support CeO2. Two catalysts have been prepared by a direct precipitation method (denoted NiO@CeO2) and a hydrothermal method (denoted NiO-CeO2), which are reduced by H2 to obtain Ni@CeO2 and Ni-CeO2, respectively. X-ray photoelectron spectroscopy (XPS), Raman, and temperature-programmed hydrogen reduction (H2-TPR) analysis results show that there are obvious oxygen vacancies and a Ni-O-Ce interface structure in NiO-CeO2 and Ni-CeO2, which is induced by the interaction between Ni and CeO2. The calculation results of current density and power density show that the performance of the MHDCFC is significantly improved in the presence of Ni-CeO2. The function fitting curves of the logarithm of the reaction rate constant (ln k) and the reciprocal of the temperature (1/T) show that the slope of the curve is decreased significantly after the addition of Ni-CeO2. In combination with density functional theory (DFT), the anode carbon reaction path is simulated in the MHDCFC, and the calculation results show that the reaction energy for the anodic carbon to generate carbon dioxide is decreased by 1.03 eV in the presence of Ni-CeO2.
1. Introduction
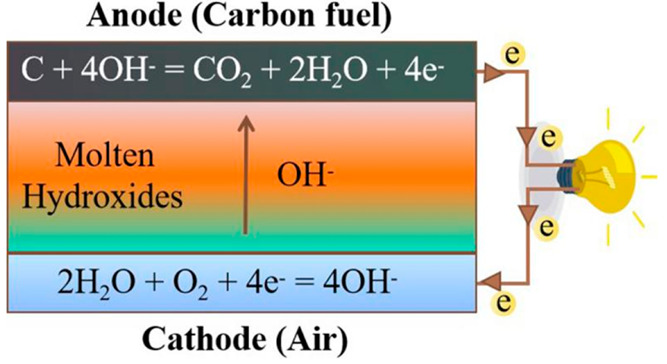
The operational principle of the molten hydroxide direct carbon fuel cell (MHDCFC) is that carbon fuel releases electrons, electrons enter the cathode through the external circuit, H2O and O2 gain electrons and react to form OH–, and OH– enters the anode through electrolyte and reacts with carbon to generate CO2 and H2O. The schematic diagram of the MHDCFC is shown in Scheme 1. The reaction process is not restricted by a Carnot cycle, and the theoretical conversion rate can reach 100%.1−3 In comparison with other fuel cells, MHDCFCs have some advantages, such as high ionic conductivity,4 high carbon oxidation activity,5,6 and low operating temperature.
Scheme 1. Schematic Diagram of MHDCFC.
The current research on MHDCFCs mainly includes the structure of MHDCFCs, the operating conditions of MHDCFCs, the effects of different kinds of carbon fuels on the cell performance, and the influence of catalysts on the performance of MHDCFCs. Zecevic et al.7,8 developed a fourth-generation MHDCFC and studied the influence of different cathode current collectors on the performance of MHDCFCs; the maximum power density of the cell was 57 mW cm–2 when the cathode material was nickel foam lined steel 1018 at 630 °C. Guo et al.9 designed different electrode structures and tested the effects of different anode and cathode structures on the performance of the MHDCFCs; the highest power density was 34 mW cm–2 when the anode was a “tea-bag” (TBA) made from nickel mesh and the cathode was an annular tube at 550 °C. Hao et al.10 researched the influence of the biomass pyrolysis temperature on the performance of biomass fuel cells; the cell fed with PP biochar pellets obtained from fast pyrolysis at 800 °C (PP-800) achieved the highest PPD of 76.6 mW cm–2 at 400 °C. Zecevic et al.7 studied the effects of different air flow rates (0.7, 1.4, and 1.9 L min–1) and temperatures (600 and 630 °C) on the performance of the MHDCFC; when the temperature was 630 °C and the ventilation rate was 1.9 L min–1, the battery performance was optimal. Kacprzak et al.11 researched the influences of different operating temperatures and electrolyte compositions on the performance of the MHDCFC; the maximum power density of the cell was 41.7 mW cm–2 when the electrolyte was KOH/NaOH (1/1 mol %) at 400 °C. Guo et al.9 tested the performance of the MHDCFC at different temperatures and electrolyte compositions. The Zhu team12−14 used a variety of carbon fuels and compared their effects. The devices were prepared by different pretreatment methods to determine the performance of the DCFC; the maximum power densities of the cell were 18, 48, and 83 mW cm–2 at different temperatures (600, 700, and 800 °C), respectively. Halouani15,16 tested the performance of the DCFC by using burned almond shell activated carbon as the anode carbon fuel. The Kacprzak17 team compared the influence of nine different anode carbon fuels on the MHDCFC performance. The values of Pmax decreased depending on the fuel type in the following order: raw hard coal > commercial biochar > carbon black > laboratory charred biomass > graphite. The maximum power density of MHDCFC was 40 mW cm–2 at 450 °C. Guo et al.18 studied the influences of a variety of carbon fuels as anodes on the performance of cells; the maximum power density of the cell was 50.6 mW cm–2 at 500 °C. The resultant peak power densities, Pmax, for ARP8, AC (C-3014), PP8, PB, and ARB were 273 mW (50.6 mW cm–2), 251 mW (46.5 mW cm–2), 198 mW (mW cm–2), 165 mW (30.6 mW cm–2), and 148 mW (27.4 mW cm–2), respectively. Hao et al.19 tested the feasibility of pine bark pellets and their pyrolyzed biochar pellets as fuel sources in the MHDCFC; the maximum power density of the cell was 45 mW cm–2 at 450 °C. However, we tried to add catalysts to improve the electrochemical performance of the MHDCFC. It was found that CeO2 showed good stability and catalytic activity in the MHDCFC by using CeO2 to catalyze carbon oxidation; the maximum power density of the MHDCFC was 47.1 mW cm–2 at 450 °C.20
Metals and support interactions, especially a strong metal–support interaction (SMSI), are widely considered to play a important role in catalyzing some important chemical reactions. In 1978, Tauster et al. described the SMSI for the first time; the catalysts were prepared by impregnating TiO2 with metal salt solutions of the appropriate concentrations in a ratio of 0.25 cm3 per g of TiO2. The results showed that the metal is well dispersed by the interaction between noble metals and TiO2.21 The metal–support interaction in that work was achieved by physical coating/encapsulation of Pt nanoparticles covered by oxide overlayers, which is known as the classic SMSI. These coverings play the role of a physical barrier to stabilize metal nanoparticles by preventing migration. In addition to TiO2-supported Pt catalysts, many other reducible oxides and metals have also been found to have SMSIs, including CeO2, Nb2O5, Ta2O5, and V2O3 with Pt, Pd, Ir, Cu, Ru, and Ni nanoparticles after a reduction treatment with H2,22−28 where the H2 can activate the oxide surface and accelerate the migration of oxidized species to cover metal nanoparticles.29 After the SMSI formation, geometric and electronic effects were observed on the metal nanoparticles,30−33 involving the encapsulated metal nanoparticles with oxide overlayers, with electronic interactions between the oxide overlayers and the metal nanoparticles. These geometric and electronic effects are also considered to be characteristics of SMSIs and strongly influence their catalytic activity. SMSI catalysts have been widely used in important chemical reactions, including combustion reactions,34,35 water–gas conversion reactions,36 CO oxidations,33 carbon dioxide methanations,27 and methane dry reforming28 due to their strong stability, sintering resistance, and high catalytic activity in a high-temperature environment.
In this work, the prepared catalyst materials were applied to the MHDCFC system to promote the carbon oxidation reaction through the interaction between the metal Ni and the support CeO2, to improve the electrochemical performance of the cell. It is proved that NiO-CeO2 (which was prepared by a hydrothermal method) and Ni-CeO2 (obtained from NiO-CeO2 that was reduced by H2) have obvious SMSI characteristics by XRD, HRTEM, RAMAN, H2-TPR, and XPS analysis methods. The electrochemical test results show that NiO-CeO2 and Ni-CeO2 made a significant improvement to the performance of the cell. The relationship between ln k (logarithm of the reaction rate constant) and 1/T (reciprocal of the temperature) can be calculated by the electrode reaction kinetics and the Arrhenius equation. The results show that NiO-CeO2 and Ni-CeO2 can reduce the energy required for the reaction in the cell; this was determined by a least-squares method to fit the data of reaction rate constants and temperatures. We calculated the energy of the reaction with density functional theory (DFT), and the results showed that the energy of the reaction decreased significantly in the presence of NiO-CeO2 and Ni-CeO2, which was consistent with the experimental results.
2. Experimental Section
2.1. Chemicals
Ce(NO3)3·6H2O (AR, Shanghai Aladdin Biochemical Technology Co., Ltd.), Ni(NO3)2·6H2O (AR, Shanghai Aladdin Biochemical Technology Co., Ltd.), NH3·H2O (AR, Sinopharm Chemical Corp.), NaOH (AR), and KOH (AR) were used.
2.2. Catalyst Preparation
2.2.1. Synthesis of Catalysts NiO@CeO2 and Ni@CeO2
Ce(OH)3 and Ni(OH)2 were synthesized via precipitation. A 4.34 g portion of Ce(NO3)3·6H2O was dissolved in 20 mL of distilled water, and then 1.12 mL of a NH3·H2O solution (0.49 mol L–1) was added to the Ce(NO3)3·6H2O aqueous solution to form the light yellow gelatinous insoluble Ce(OH)3. A 4.36 g portion of Ni(NO3)2·6H2O was dissolved in 30 mL of distilled water, and then 1.12 mL of a NH3·H2O solution (0.49 mol L–1) was added to the Ni(NO3)2·6H2O aqueous solution to form the light green insoluble Ni(OH)2. The light green insoluble and light yellow gel-like insoluble materials were immediately mixed, and the mixture was stirred evenly, centrifuged, and dried at 70 °C for 12 h. NiO@CeO2 was obtained when the mixture was calcined at 500 °C under anN2 atmosphere for 5 h. Ni@CeO2 was obtained when NiO@CeO2 was annealed in H2–Ar (10–90%) at 500 °C for 2 h.
2.2.2. Synthesis of Catalysts NiO-CeO2 and Ni-CeO2
Ni(OH)2-Ce(OH)3 was synthesized by a hydrothermal method. A 4.34 g portion of Ce(NO3)3·6H2O was dissolved in 20 mL of distilled water, and then 1.12 mL of a NH3·H2O solution (0.49 mol L–1) was added to the Ce(NO3)3·6H2O aqueous solution to form the light yellow gelatinous insoluble Ce(OH)3. A 4.36 g portion of Ni(NO3)2·6H2O was dissolved in 30 mL of distilled water, and then 1.12 mL of a NH3·H2O solution (0.49 mol·L–1) was added to the Ni(NO3)2·6H2O aqueous solution to form the light green insoluble Ni(OH)2. The light green insoluble and light yellow gel-like insoluble materials were immediately mixed, and the mixture was stirred evenly. The mixture was placed in a reaction kettle with a PTFE tank for 1 h at 120 °C and then centrifuged and dried at 70 °C for 12 h. NiO-CeO2 was obtained when the mixture was calcined at 500 °C under a N2 atmosphere for 5 h. Ni-CeO2 was obtained when NiO-CeO2 was annealed in H2/Ar (10%/90%) at 500 °C for 2 h.
2.3. Characterization
The XRD measurements of power materials were performed by using a Rigaku XRD Smart-lab instrument with Cu Kα radiation (λ = 0.15418 nm). The XRD values were obtained at 2θ = 10–90° with a 0.02° step size. The crystallite size was calculated using the Scherrer equation
where λ is the X-ray wavelength, K is the particle shape factor, and the β is the full width at half-maximum of the peak at the angle θ. Scanning electron microscope (SEM) images of the materials was obtained with a FEI F50 instrument with an accelerating voltage of 10 kV. Transmission electron microscopy (TEM), high-resolution transmission electron microscopy (HRTEM), and element mapping were conducted on a FEG-TEM instrument (JEM-2100F, JEOL, Japan) operated at 200 kV. XPS (X-ray photoelectron spectroscopy) tests were performed on a ESCALAB 250Xi3030708 probe apparatus using a band-pass energy of 30 eV and a 500 μm diameter X-ray spot size. Thermo-Fisher Avantage software was used to process the data. Raman spectra were collected on a RENISHAW invia Raman microscope with 532 nm laser excitation. Temperature-programmed hydrogen reduction (H2-TPR) tests were performed on a Xianquan TP-5080 adsorption apparatus. In H2-TPR, samples (50 mg) were heated from 30 to 800 °C with a heating rate of 10 °C/min under 30 mL/min of flowing 10% H2/90% N2.
2.4. Catalytic Tests
The improvement effects of the synthesized materials (NiO@CeO2, Ni@CeO2, NiO-CeO2, and Ni-CeO2) on the electrochemical performance of the MHDCFC were tested in a molten hydroxide direct carbon fuel cell reactor. A 0.3 g portion of the synthesized material and 2 g of activated carbon were evenly mixed with a mortar and put into a Cu-Ni alloy mesh (diameter 1 cm); the mixture was used as the anode of the MHDCFC. Activated carbon was prepared from lignite, and the specific processing process was reported in our previous work.20 Solid KOH/NaOH (1/1 mol %) was placed in the reaction device and heated. The anode and cathode were placed in the reaction device, and the change in the battery open-circuit voltage versus time was tested, when the temperature was increased to 450 °C. The polarization curve (linear sweep voltammetry) of the MHDCFC was tested when the open-circuit voltage was stabilized with time (∼2 h). The power density of the MHDCFC was calculated from the voltage and current density
where i is the current density, I is the current, and A is the anode surface area.
where P is the power density and U is the voltage.
2.5. First-Principles Calculations
All calculations were based on density functional theory (DFT) in conjunction with the projector-augmented-wave (PAW) potential as implemented by the Vienna ab initio simulation package (VASP). The cutoff energy for the plane-wave basis set was 500 eV, and the first Brillouin zone was sampled with a 5 × 5 × 1 Monkhorst–Pack grid. All atomic positions were fully relaxed until the force was less than 0.02 eV/Å, and the criterion for the total energy was 10–5 eV. A vacuum space of 20 Å along the direction was used to decouple possible periodic interactions. The C (2s, 2p), O (2s, 2p), Ni (3p, 3d, 4s), and Ce (4f, 5s, 5p, 5d, 6s) electrons were treated as valence states.
3. Results and Discussion
3.1. Structural and Morphological Characterizations of Catalysts
The mixed oxide NiO@CeO2 was prepared by a coprecipitation method, and NiO-CeO2, which is the CeO2 modified by nano NiO, was obtained bya hydrothermal reaction. The XRD patterns of NiO@CeO2 and NiO-CeO2 are shown in Figure 1c,e, respectively. The diffraction peaks of NiO@CeO2 at 28.6, 33.1, 47.7, 56.6, 59.3, 69.7, 77.4, 79.5, and 88.7° show cerianite-like phases (JCPDS 43-1002), and the diffraction peaks at 37.3, 43.3, 62.9, and 75.5° correspond to the crystal phase of NiO (JCPDS 44-1159). The particle size of NiO@CeO2 was calculated (∼26.2 nm) by the Scherrer formula. Similarly, the diffraction peaks of NiO-CeO2 at 28.5, 33.1, 47.5, 56.5, 59.1, 69.6, 77.0, 79.3, and 88.6° are cerianite-like phases (JCPDS 43-1002), while the diffraction peaks at 37.2, 43.2, and 63.0° correspond to the crystal phase of NiO (JCPDS 44-1159). The particle size of NiO-CeO2 by the Scherrer formula is ∼14.8 nm. Then the mixed oxide NiO@CeO2 was reduced at 500 °C to obtain a mixture of Ni nanoparticles and CeO2 under an H2 atmosphere, and NiO-CeO2 was reduced to obtain the CeO2 phase modified by Ni nanoparticles under the same conditions. For the reduced materials, XRD showed that the NiO phase disappeared, and three new diffraction peaks were observed at 44.4, 51.7, and 76.3°, which are attributed to the Ni phase (JCPDS 04-0850). In addition to the Ni phase, the cerianite-like phases are also observed, as shown in Figure 1d,f.
Figure 1.
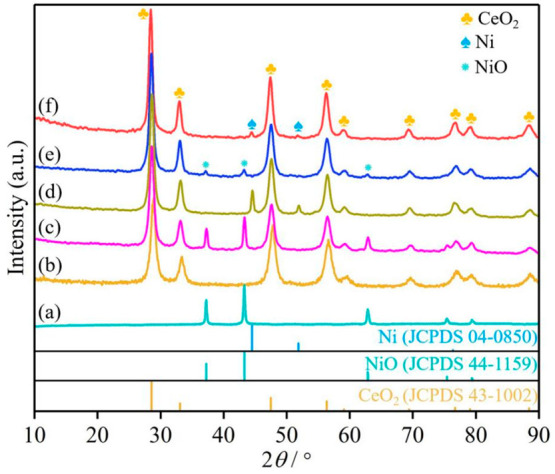
XRD patterns of the catalysts (a) NiO, (b) CeO2, (c) NiO@CeO2, (d) Ni@CeO2, (e) NiO-CeO2, and (f) Ni-CeO2.
The XRD patterns of Ni-CeO2 with different Ni/Ce molar ratios (Figure S1) show that there is no obvious characteristic peak of Ni when the Ni content is low. However, the characteristic peak of Ni is obvious when the Ni/Ce mole ratio reached 1.5. This can be attributed to the fact that Ni is coated by CeO2 and that there is almost no Ni deposition on CeO2 surface. The material photos (Figure S1) show that the color of the material changes from earthy yellow to black with an increase in Ni content. The content of Ni in the material was determined by ICP (Table S1). Raman spectra show an obvious D band (Figure S2a) when Ni is added, in comparison with the Raman spectra of CeO2, and the relative intensity ratio of D peak and F2g peak is increased (Figure S2b) with an increase in Ni content. These results demonstrate the introduction of Ni into the material Ni-CeO2. Ni@CeO2 has a more obvious diffraction peak of the Ni phase in comparison with Ni-CeO2, as shown in Figure 1. It can be attributed to the structure of Ni-CeO2, which is a Ni nanocluster structure coated with CeO2, while Ni@CeO2 is a mixture of Ni clusters and CeO2, with many Ni clusters being distributed on the surface.
The morphology and structural characteristics of NiO-CeO2, Ni-CeO2, and Ni@CeO2 were further studied by TEM and HRTEM (Figure 2). TEM and HRTEM images of NiO-CeO2 and Ni-CeO2 are shown in Figure 2. NiO nanoparticles are observed to be highly dispersed in the lamellar CeO2 (Figure 2a1,a2). The HRTEM image of NiO-CeO2 (Figure 2a3) shows that the CeO2 phase is anchored on the surface of NiO nanoparticles, where the 0.217 nm lattice fringe corresponds to the {012} crystal plane of the NiO phase and the 0.307 nm lattice fringe corresponds to the {111} crystal plane of the CeO2 phase. The Ni-CeO2 material that is obtained by H2 reduction shows better dispersion (Figure 2b1,b2). It can be seen that Ni nanoparticles are distributed in the lamellar CeO2 (Figure 2b1,b2). The HRTEM image of Ni-CeO2 (Figure 2b3) shows that the CeO2 phase is anchored on the surface of Ni nanoparticles, where the lattice fringe of 0.201 nm corresponds to the {111} crystal plane of the Ni phase and the lattice fringe of 0.307 nm corresponds to the {111} crystal plane of the CeO2 phase. The TEM-EDS image of Ni-CeO2 also shows the distribution of a large amount of Ni in the material (Figure S3). TEM and HRTEM images of Ni@CeO2 show that the material is a mixture of CeO2 and Ni (Figure S4). It is obvious that CeO2 flakes are scattered in the material (Figure S4a,b). The HRTEM image of Ni@CeO2 (Figure S4c) also shows a mixture of CeO2 and Ni, where the lattice fringe of 0.201 nm corresponds to the {111} crystal plane of the Ni phase and the lattice fringe of 0.307 nm corresponds to the {111} crystal plane of the CeO2 phase. The results show that the material (Ni@CeO2) prepared by a precipitation method is a mixture of CeO2 and Ni. The surface Ni content of Ni@CeO2 is higher in comparison with Ni-CeO2, as determined from the SEM-EDS results (Figure S5), where Ni-CeO2 and Ni@CeO2 were prepared by using the same Ni/Ce mole ratio. These results are consistent with the XRD results. In summary, the above structural characteristics indicate that an SMSI of the Ni-CeO2 catalyst can be successfully synthesized by a hydrothermal method.
Figure 2.

TEM and HRTEM images of the catalysts (a) NiO-CeO2 and (b) Ni-CeO2.
3.2. Evaluation of the Catalytic Behavior
It has been found in previous research that CeO2 has excellent catalytic activity in the MHDCFC.20 In this study, the effects of several different additives (NiO@CeO2, Ni@CeO2, NiO-CeO2, Ni-CeO2) on the performance of the cell based on CeO2 were determined. It was found that NiO-CeO2 and Ni-CeO2 have better promoting effects by comparing the effects of different additives on the performance of MHDCFC (Figure 3). The maximum power density of the MHDCFC could reach 56.3 mW cm–2 when Ni-CeO2 was added (Figure 3a). The stability and service life of the MHDCFC were tested with and without Ni-CeO2, respectively (Figure 3b).
Figure 3.

Electrochemical performance of the cell in a NaOH/KOH (mole ratio 50%/50%) electrolyte: (a) voltage (V)–current density (I)–power density (P) curves of various catalysts; (b) amperometric i–t curves at 400 °C.
The results show that the MHDCFC has better stability (∼15 h), a higher current density (83.2 mA cm–2), and a longer service life (∼26 h) when Ni-CeO2 is added. Moreover, it takes less time for MHDCFC to stabilize after adding Ni-CeO2 (Figure S6). The loss of MHDCFC performance due to anodic damage can be seen from the embedded electrode photograph (Figure 3b). The effects of different Ni/Ce mole ratios for Ni-CeO2 and different Ni-CeO2 contents on electrochemical performance of MHDCFC were studied (Figure S6). The electrochemical performance of MHDCFC is improved with an increase in Ni content (Figure S7a). The values of maximum power density and limiting current density of the MHDCFC reached the maximum when the Ni/Ce mole ratio was 1.5, and the electrochemical performance of MHDCFC did not change significantly when the Ni/Ce mole ratio reached 2. The cell’s performance obviously improved with an increase in the Ni-CeO2 content, and the optimal performance was obtained when the Ni-CeO2 content reached 15% from test results of different Ni-CeO2 contents (Figure S7b). However, the maximum power density of the cell decreased when the Ni-CeO2 content was 20%, which can be attributed to the reduction of electrode conductivity caused by too much Ni-CeO2 content.20
3.3. Strong Metal–Support Interaction (SMSI) between Ni and CeO2
Figure 4 shows the Raman spectra of different materials. It can be seen that the Raman spectra of NiO-CeO2 and Ni-CeO2 mainly include a CeO2 fluorite phase with a strong F2g band (461 cm–1) and weak bands at 226, 554, and 635 cm–1 (Figure 4e,f), because of a second-order transverse acoustics (2TA) mode and defect induction (D). For the Raman signal of CeO2, the F2g model is inherent to CeO2 at 461 cm–1, and the D-defect model is caused by the defect site in the lattice at 554 cm–1, which is a Frenkel type oxygen vacancy generated by the migration of oxygen anions from tetrahedral sites to octahedral sites.27,37 In addition, the apparent band at 635 cm–1 cannot be attributed to NiO (520 cm–1) (Figure 4b) or other Ni oxides (400, 500, 560, and 730 cm–1)38 but can be attributed to the asymmetric Ni-O-Ce structure formed by an SMSI between Ni and CeO2.27,34,39 The broad NiO signal at approximately 520 cm–1 cannot be well detected, because of a shadowing effect by the long tail of the first-order CeO2 peak.40,41 Ni@CeO2 and NiO@CeO2 do not show an obvious oxygen deficiency (D model), and a weak band appears at 607 cm–1 (Figure 4c,d), which can be attributed to a weak interaction between Ni and CeO2. The intensity ratio ID/IF2g represents the corresponding concentration of oxygen vacancies in the CeO2 lattice. INi-O-Ce/IF2g indicates the relative density of interface bonding. The intensity ratio ID/IF2g shows that Ni-CeO2 (0.6) and NiO-CeO2 (0.7) had higher oxygen vacancy concentrations. In combination with the electrochemical performance of the MHDCFC, the oxygen vacancy is involved in the carbon oxidation process. However, the oxygen vacancy concentration of NiO-CeO2 is slightly higher than that of Ni-CeO2, indicating that there is no practical relationship between the carbon oxidation activity and the oxygen vacancy concentration. Therefore, it is once again proved that the decisive step occurs at the Ni site rather than the oxygen vacancy. On the other hand, the bonding density of the Ni-O-Ce interface directly reflects the chemical interaction of SMSI between Ni and the CeO2 support. Ni-CeO2 and NiO-CeO2 shows an obvious Ni-O-Ce signal in comparison with Ni@CeO2 and NiO@CeO2; thus Ni and the CeO2 support form an SMSI in the prepared Ni-CeO2 and NiO-CeO2 materials.
Figure 4.
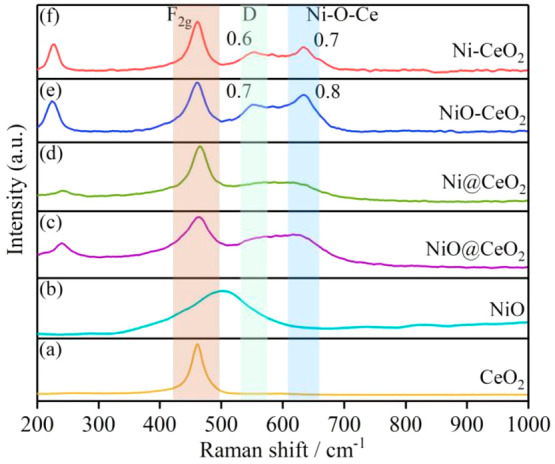
Raman spectra of the catalysts. (a) CeO2, (b) NiO, (c) NiO@CeO2, (d) Ni@CeO2, (e) NiO-CeO2, and (f) Ni-CeO2.
The temperature-programmed hydrogen reduction (H2-TPR) results for NiO-CeO2, Ni-CeO2, Ni@CeO2, and NiO@CeO2 are shown in Figure 5. There is an obvious characteristic peak at 322 °C and shoulder peaks and weak peaks at 166, 225, 514, and 784 °C in the H2-TPR profile of NiO-CeO2. The shoulder peak at 166 °C can be attributed to the reduction of adsorbed oxygen28,34 and Ni species (very small NiO crystallites or Ni-O-Ce). The peak at 225 °C can be attributed to the reduction of small NiO crystallites or Ni-O-Ce, and the peak at 332 °C can be attributed to the reduction of NiO. The peak at 784 °C is attributed to the reduction of CeO2, and the reduction peak obtained at temperatures higher than 700 °C is ascribed to the reduction of bulk Ce4+ to Ce3+.41,42 The shoulder peak of the Ni-CeO2 H2-TPR profile at 166 °C is attributed to the reduction of adsorbed oxygen, and the characteristic peak at 207 °C is attributed to the reduction of Ni species, which can only be Ni-O-Ce. This further demonstrates the chemical interaction between the metal Ni and the support CeO2. The shoulder peak of the Ni@CeO2 H2-TPR profile at 199 °C is attributed to the reduction of adsorbed oxygen, and the characteristic peak at 286 °C is attributed to the reduction of Ni species. The reduction peaks of NiO@CeO2 at 282 and 387 °C can be attributed to the reduction of Ni species. The peak at 282 °C can be attributed to the reduction of small NiO crystallites or the reduction of Ni-O-Ce formed by the weak interaction of NiO and CeO2, and the peak at 387 °C can be attributed to the reduction of NiO.
Figure 5.
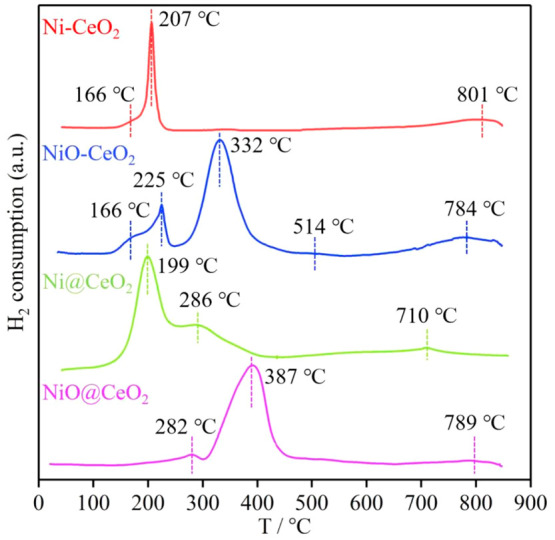
H2-TPR profiles of Ni-CeO2, NiO-CeO2, Ni@CeO2, and NiO@CeO2.
It can be seen from the H2-TPR profile that a shoulder peak appears in NiO-CeO2 and the reduction temperatures corresponding to the peaks are lower than those of NiO@CeO2. The order of reduction temperature of Ni species from low to high is Ni-CeO2 < Ni@CeO2 < NiO-CeO2 < NiO@CeO2. On the one hand, because the particle size of Ni@CeO2 is larger, it requires a higher reduction temperature.8−10 The particle size of Ni@CeO2 is larger than that of Ni-CeO2 by examining the particle size distribution by TEM (Figure 2 and Figure S4). In addition, the loosened Ce–O bond closely binds to the Ni species to form Ni-O-Ce, which is more easily reduced in H2. The same results have been observed in related studies of Au/CeO2 and Ru-CeO2.34,43
The XPS spectra of all samples include Ce 3d, Ni 2p, and O 1s peaks according to the XPS survey spectra of the different materials (Figure S8). Figure 6 presents the XPS spectra of Ce 3d, Ni 2p, and O 1s of the samples NiO@CeO2, NiO-CeO2, Ni@CeO2, and Ni-CeO2. Cerium compounds have XPS spectra with rather complex features due to numerous initial and 4f electronic configurations.37,42 The 3d spectrum that is registered for pure CeO2 can be resolved into three 3d3/2–3d5/2 spin–orbit doublets (denoted uv, u″v″, and u‴v‴, respectively).42,44,45Figure 6a presents Ce 3d spectra of different samples. The Ce 3d spectra of all samples (NiO@CeO2, NiO-CeO2, Ni@CeO2, and Ni-CeO2) can be identified by eight peaks from the pairs of spin–orbit doublets through a deconvolution method, six peaks of which arise from Ce4+ contributions (at ∼882.3, ∼888.5, ∼898.2, ∼900.8, ∼907.2, and and ∼916.5 eV) and two peaks at ∼885.3 and ∼902.7 eV from Ce3+ contributions.12 Therefore, the relative abundance of the Ce3+ species of each sample has been estimated (8.7%, 13.3%, 11.4% and 14.2%) by considering the deconvoluted peaks of Ce 3d binding energies for NiO@CeO2, NiO-CeO2, Ni@CeO2, and Ni-CeO2, respectively. As a result, the intensity of the Ce3+ peak for Ni-CeO2 is greater than those of the other samples, which can be attributed to the chemical SMSI between Ni and the CeO2 support. From XPS spectra of all samples, Ce species mainly exist in the Ce4+ oxidation state in all samples, and Ce3+ induces the formation of oxygen vacancies in the material, which are essential for absorption/dissociation of oxygen molecules during the oxidation reaction.
Figure 6.

XPS spectra of (a) Ce 3d, (a1) NiO@CeO2, (a2) NiO-CeO2, (a3) Ni@CeO2, (a4) Ni-CeO2. (b) Ni 2p, (b1) NiO@CeO2, (b2) NiO-CeO2, (b3) Ni@CeO2, (b4) Ni-CeO2. (c) O 1s, (c1) NiO@CeO2, (c2) NiO-CeO2, (c3) Ni@CeO2, and (c4) Ni-CeO2.
Figure 6b presents Ni 2p spectra of the different samples. The Ni 2p spectra of Ni@CeO2 and Ni-CeO2 exhibit two Ni 2p1/2 peaks (879.4 and 872.2 eV) and two 2p3/2 peaks (861.4 and 855.1 eV), which can be assigned to Ni0 (2p1/2, 2p3/2) and Ni2+ (2p1/2), respectively. The Ni 2p spectra of NiO@CeO2 and NiO-CeO2 exhibit two Ni 2p1/2 peaks (879.1 and 873.8 eV) and three 2p3/2 peaks (860.9, 855.7, and 853.7 eV), which can be assigned to Ni2+ (2p1/2 and 2p3/2). The Ni2+ (2p1/2) peak of Ni@CeO2 and Ni-CeO2 can be attributed to the SMSI (Ce-O-Ni) of between Ni and the CeO2 support. The O 1s spectra for all samples present three states of surface oxygen (Figure 6c). The binding energy of ∼529.3 eV is denoted as Oα, which is characteristic of lattice oxygen. The peak at ∼531.7 eV is assigned to oxide defects or surface oxygen ions (Oβ) with low coordination.
3.4. Role of NiOx-CeO2 in the MHDCFC
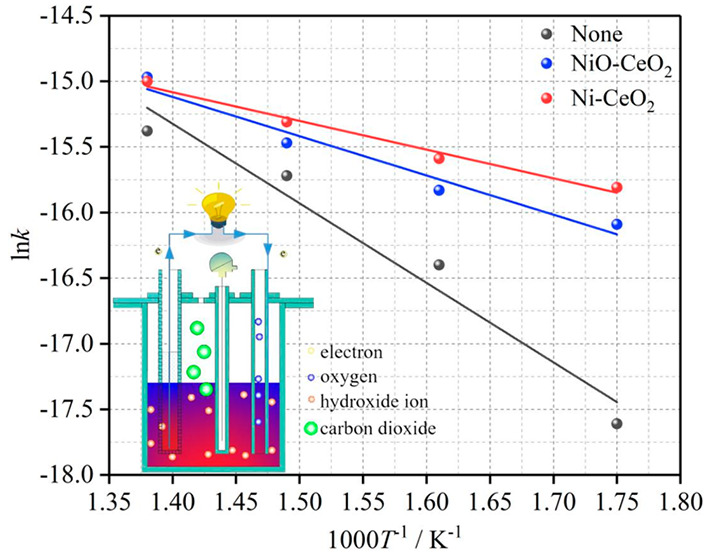
The relationships between the temperature and current density in the presence of different catalysts are shown in Figure 7a,b at 0.4 and 0.6 V, respectively. The current density of the cell is significantly improved at the same temperature in the presence of NiO-CeO2 and Ni-CeO2. The function relationship between ln k and 1/T can be confirmed, according to the electrode reaction kinetics υ = i/nFA (where υ is the reaction rate, i is the current, n is the number of transferred electrons, F is the Faraday constant, and A is the electrode surface area) and the Arrhenius equation. The images corresponding to the function can be obtained by fitting the data, which are given in Figure 7c,d, respectively. As can be seen from Figure 7c,d, the slope of the function image (ln k–1/T) obviously decreases after NiO-CeO2 and Ni-CeO2 are added. The MHDCFC exhibits greater current density when Ni-CeO2 is added in comparison to NiO-CeO2 (Figure 7a,b). This fully demonstrates that the energy required for the oxidation reaction of the anodic activated carbon fuel is obviously decreased by adding NiO-CeO2 and Ni-CeO2 and the Ni-CeO2 showed a more obvious catalytic activity in comparison to NiO-CeO2.
Figure 7.

Function relationship between of current density and 1/T with and without catalysts at 0.4 V (a) and 0.6 V (b), respectively. Function fitting images of ln k and 1000/T at 0.4 V (c) and 0.6 V (d).
The conventional detection methods are not practical to apply in the MHDCFC, because they require high temperature and are strongly corrosive. In order to fully prove the effect of NiOx-CeO2 in the MHDCFC, the mechanism of action of NiOx-CeO2 was researched in the MHDCFC. Herein, we apply the spin-polarized DFT+U approach to investigate the dissociative adsorption of OH– on Ni deposited on stoichiometric and reduced CeO2 surfaces.
In combination with Raman, H2-TPR, and XPS analysis results, it can be found that an oxygen vacancy and the interface structure Ni-O-Ce are generated due to the interaction between Ni and CeO2. Therefore, we built model diagrams of Ni-CeO2 and NiO-CeO2, as shown in Figure 8a,b, respectively. The valence state of Ni is 0 in Ni-CeO2 and +2 in NiO-CeO2. In this work, we speculated the possible reaction process of C in MHDCFC and conducted DFT calculations; the calculation results are shown in Figure 8c. The binding between C and OH– is very weak and C → CO2 is difficult because of a large energy barrier.2,20,46 The energy barrier of the reaction with the addition of Ni-CeO2 and NiO-CeO2 is significantly lower than that without the addition according to Figure 8c. Therefore, the interaction between Ni and CeO2 can more effectively reduce the energy barrier of the C reaction in the MHDCFC. The results are consistent with the experimental results, which shown in Figure 7.
Figure 8.

(a) Molecular structure of Ni-CeO2. (b) Molecular structure of NiO-CeO2. (c) Reaction energy profile for C → CO2 with and without Ni-CeO2 and NiO-CeO2, respectively. The structures shown on the left and right of the reaction pathways correspond to the side views of the optimized initial (molecularly adsorbed) and final (dissociated) states used in the search of the transition state (Figure S4). Obulk denotes bulk oxygen atoms and Os surface oxygen atoms.
4. Conclusion
Two kinds of catalysts (denoted NiO@CeO2 and NiO-CeO2) have been prepared by a precipitation method and a hydrothermal method, which are reduced by H2 to give Ni@CeO2 and Ni-CeO2, respectively. The results of material analyses and characterizations (XRD, XPS, TEM, HRTEM, Raman and H2-TPR) show that NiO-CeO2 and Ni-CeO2 exhibit classic SMSI catalyst characteristics. The electrochemical measurement results also demonstrate that the limiting current density and maximum power density of the MHDCFC obviously increase when NiO-CeO2 and Ni-CeO2 are added. The electrochemical performance of the cell has the most significant improvement in the presence of Ni-CeO2, and the power density (56.3 mW cm–2) of the MHDCFC is 1.6 times that of the MHDCFC without Ni-CeO2 (34.8 mW cm–2). The results of chronoamperometry show that the MHDCFC can run for 26 h after adding Ni-CeO2, at which point the anode collector is corroded. A combination including XRD, HRTEM, Raman, H2-TPR, and XPS verifies that the interaction between the metal Ni and the support CeO2 in Ni-CeO2 is obviously strengthened. The strong Ni-CeO2 interaction results in more oxygen vacancies (Ov) and more Ov-Ce3+ sites and Ni-Ov-Ce interface sites, which provide the necessary reactive sites for carbon oxidation. The ln k–1/T results show that the energy required for the oxidation reaction of anodic carbon fuel decreased significantly with the addition of Ni-CeO2 in the MHDCFC. DFT calculation results also demonstrate that the energy required for carbon oxidation to produce carbon dioxide is significantly reduced with the addition of Ni-CeO2, which is 1.03 eV lower than that without the addition of Ni-CeO2
Acknowledgments
This work was supported by the National Natural Science Foundation of China (No. 21566030), the Ministry of Science, and Technology China-South Africa Joint Research Program (No. CS08-L15), the Project of Inner Mongolia Education Department (NJZY089), the Natural Science Foundation of Inner Mongolia (2015MS0205), and cthe reative talents team of the “Prairie Talent” engineering industry and the “Prairie Talent” of the Department of Inner Mongolia Party Committee.
Supporting Information Available
The Supporting Information is available free of charge at https://pubs.acs.org/doi/10.1021/acsomega.2c02479.
XRD patterns and photographs of Ni-CeO2 with different Ni/Ce ratios, mass contents of Ni in different samples, Raman spectra of Ni-CeO2 samples with different Ni/Ce ratios, TEM-EDS image of Ni-CeO2, TEM and HRTEM images of Ni@CeO2, SEM and EDS spectral diagrams of Ni@CeO2 and Ni-CeO2, chronopotentiometry curves with and without Ni-CeO2, electrochemical performance of MHDCFC with different Ni/Ce ratios and Ni-CeO2 contents, and XPS survey spectra of different materials (PDF)
The authors declare no competing financial interest.
Supplementary Material
References
- Haynes C. Clarifying reversible efficiency misconceptions of high temperature fuel cells in relation to reversible heat engines. J. Power Sources 2001, 92, 199–203. 10.1016/S0378-7753(00)00541-3. [DOI] [Google Scholar]
- Cooper J. F.; Selman J. R. Analysis of the carbon anode in direct carbon conversion fuel cells. Int. J. Hydrogen Energy 2012, 37, 19319–19328. 10.1016/j.ijhydene.2012.03.095. [DOI] [Google Scholar]
- Kacprzak A.; Kobyłecki R.; Włodarczyk R.; Bis Z. Efficiency of non-optimized direct carbon fuel cell with molten alkaline electrolyte fueled by carbonized biomass. J. Power Sources 2016, 321, 233–240. 10.1016/j.jpowsour.2016.04.132. [DOI] [Google Scholar]
- Eberz A.; Franck E. U. High pressure electrolyte conductivity of the homogeneous, fluid water-sodium hydroxide system to 400 °C and 3000 bar. Berichte der Bunsengesellschaft für Physikalische Chemie 1995, 99, 1091–1103. 10.1002/bbpc.199500039. [DOI] [Google Scholar]
- Hérold C.; Hérold A.; Lagrange P. New synthesis routes for donor-type graphite intercalation compounds. J. Phys. Chem. Solids 1996, 57, 655–662. 10.1016/0022-3697(96)00329-0. [DOI] [Google Scholar]
- Hérold C.; Hérold A.; Lagrange P. Ternary graphite intercalation compounds associating an alkali metal and an electronegative element or radical. Solid State Sci. 2004, 6, 125–138. 10.1016/j.solidstatesciences.2003.10.007. [DOI] [Google Scholar]
- Zecevic S.; Patton E. M.; Parhami P. Carbon-air fuel cell without a reforming process. Carbon 2004, 42, 1983–1993. 10.1016/j.carbon.2004.03.036. [DOI] [Google Scholar]
- Zecevic S.; Patton E. M.; Parhami P. Direct electrochemical power generation from carbon in fuel cells with molten hydroxide electrolyte. Chem. Eng. Commun. 2005, 192, 1655. 10.1080/009864490896241. [DOI] [Google Scholar]
- Guo L.; Calo J. M.; Dicocco E.; Bain E. J. Development of a Low Temperature, Molten Hydroxide Direct Carbon Fuel Cell. Energy Fuel. 2013, 27, 1712–1719. 10.1021/ef302100h. [DOI] [Google Scholar]
- Hao W. B.; Luo P.; Wu Z. Q.; Mi Y. L.; Gao Z. The effect of biomass pyrolysis temperature on the performance of biochar-fed molten hydroxide direct carbon fuel cells. Biomass Bioenerg. 2021, 150, 106122. 10.1016/j.biombioe.2021.106122. [DOI] [Google Scholar]
- Kacprzak A.; Kobylecki R.; Bis Z. Influence of temperature and composition of NaOH-KOH and NaOH-LiOH electrolytes on the performance of a direct carbon fuel cell. J. Power Sources 2013, 239, 409–414. 10.1016/j.jpowsour.2013.03.159. [DOI] [Google Scholar]
- Li X.; Zhu Z. H.; Marco R. D.; Dicks A.; Bradley J.; Liu S.; Lu G. Q. Factors that determine the performance of carbon fuels in the direct carbon fuel cell. Int. Eng. Chem. Res. 2008, 47, 9670–9677. 10.1021/ie800891m. [DOI] [Google Scholar]
- Li X.; Zhu Z. H.; Marco R. D.; Bradley J.; Dicks A. Modification of coal as a fuel for the direct carbon fuel cell. J. Phys. Chem. A 2010, 114, 3855–3862. 10.1021/jp9062719. [DOI] [PubMed] [Google Scholar]
- Li X.; Zhu Z. H.; Chen J. L.; Marco R. D.; Dicks A.; Bradley J.; Lu G. Q. Surface modification of carbon fuels for direct carbon fuel cells. J. Power Sources 2009, 186, 1–9. 10.1016/j.jpowsour.2008.09.070. [DOI] [Google Scholar]
- Elleuch A.; Boussetta A.; Yu J. S.; Halouani K.; Li Y. D. Experimental investigation of direct carbon fuel cell fueled by almond shell biochar: Part I. Physicochemical characterization of the biochar fuel and cell performance examination. Int. J. Hydrogen Energy 2013, 38, 16590–16604. 10.1016/j.ijhydene.2013.08.090. [DOI] [Google Scholar]
- Elleuch A.; Boussetta A.; Halouani K.; Li Y. D. Experimental investigation of direct carbon fuel cell fueled by almond shell biochar: Part II. Improvement of cell stability and performance by a three-layer planar configuration. Int. J. Hydrogen Energy 2013, 38, 16605–16614. 10.1016/j.ijhydene.2013.07.061. [DOI] [Google Scholar]
- Kacprzak A.; Kobylecki R.; Wlodarczyk R.; Bis Z. The effect of fuel type on the performance of a direct carbon fuel cell with molten alkaline electrolyte. J. Power Sources 2014, 255, 179–186. 10.1016/j.jpowsour.2014.01.012. [DOI] [Google Scholar]
- Guo L.; Calo J. M.; Kearney C.; Grimshaw P. The anodic reaction zone and performance of different carbonaceous fuels in a batch molten hydroxide direct carbon fuel cell. Appl. Energy 2014, 129, 32–38. 10.1016/j.apenergy.2014.05.005. [DOI] [Google Scholar]
- Hao W. B.; Luo P.; Wu Z. Q.; Sun G. X.; Mi Y. L. Feasibility of pine bark pellets and their pyrolyzed biochar pellets as fuel sources in molten hydroxide direct carbon fuel cells. Energy Fuel. 2020, 34, 16756–16764. 10.1021/acs.energyfuels.0c03171. [DOI] [Google Scholar]
- Li X. F.; Dong Y. X.; Liu X. H.; Li L. J.; Gao Y. F.; Cao Z. Z.; Liu J. R. Catalytic action of rare earth oxide (La2O3, CeO2, Pr6O11) on electrochemical oxidation of activited carbon in molten KOH-NaOH. J. Rare Earth 2021, 40, 1083–1090. 10.1016/j.jre.2021.07.002. [DOI] [Google Scholar]
- Tauster S. J.; Fung S. C.; Garten R. L. Strong metal-support interactions. Group 8 noble metals supported on titanium dioxide. J. Am. Chem. Soc. 1978, 100, 170–175. 10.1021/ja00469a029. [DOI] [Google Scholar]
- Lunkenbein T.; Schumann J.; Behrens M.; Schlögl R.; Willinger M. G. Formation of a ZnO overlayer in industrial Cu/ZnO/Al2O3 catalysts induced by strong metal-support interactions. Angew. Chem., Int. Ed. 2015, 54, 4544–4548. 10.1002/anie.201411581. [DOI] [PubMed] [Google Scholar]
- Li S. W.; Xu Y.; Chen Y. F.; Li W. Z.; Lin L. L.; Li M. Z.; Deng Y. C.; Wang X. P.; Ge B. H.; Yang Ce.; Yao S. Y.; Xie J. L.; Li Y. W.; Liu X.; Ma D. Tuning the selectivity of catalytic carbon dioxide hydrogenation over iridium/cerium oxide catalysts with a strong metal-support interaction. Angew. Chem., Int. Ed. 2017, 56, 10761–10765. 10.1002/anie.201705002. [DOI] [PubMed] [Google Scholar]
- Strayer M. E.; Binz J. M.; Tanase M.; Shahri S. M. K.; Sharma R.; Rioux R. M.; Mallouk T. E. Interfacial bonding stabilizes rhodium and rhodium oxide nanoparticles on layered Nb oxide and Ta oxide supports. J. Am. Chem. Soc. 2014, 136, 5687–5696. 10.1021/ja412933k. [DOI] [PubMed] [Google Scholar]
- Xu M.; Yao S. Y.; Rao D.; Niu Y. M.; Liu N.; Peng M.; Zhai P.; Man Y.; Zheng L. R.; Wang B.; Zhang B. S.; Ma D.; Wei M. Insights into interfacial synergistic catalysis over Ni@TiO2-x catalyst toward water-gas shift reaction. J. Am. Chem. Soc. 2018, 140, 11241–11251. 10.1021/jacs.8b03117. [DOI] [PubMed] [Google Scholar]
- Ito S.; Chibana C.; Nagashima K.; Kameoka S.; Tomishige K.; Kunimori K. CO hydrogenation over RhVO4/SiO2, Rh/V2O3 and Rh/SiO2 catalysts: reduction and regeneration of RhVO4. Appl. Catal. A-Gen. 2002, 236, 113–120. 10.1016/S0926-860X(02)00283-1. [DOI] [Google Scholar]
- Guo Y.; Mei S.; Yuan K.; Wang D. J.; Liu H. C.; Yan C. H.; Zhang Y. W. Low-Temperature CO2 methanation over CeO2-supported Ru single atoms, nanoclusters, and nanoparticles competitively tuned by strong metal-support interactions and H-spillover effect. ACS Catal. 2018, 8, 6203–6215. 10.1021/acscatal.7b04469. [DOI] [Google Scholar]
- Löfberg A.; Caballero J. G.; Kane T.; Rubbens A.; Duhamel L. J. Ni/CeO2 based catalysts as oxygen vectors for the chemical looping dry reforming of methane for syngas production. Appl. Catal., B 2017, 212, 159–174. 10.1016/j.apcatb.2017.04.048. [DOI] [Google Scholar]
- Wang L. X.; Wang L.; Meng X. J.; Xiao F. S. New strategies for the preparation of sinter-resistant metal-nanoparticle-based catalysts. Adv. Mater. 2019, 31, 1901905. 10.1002/adma.201901905. [DOI] [PubMed] [Google Scholar]
- Wang L.; Zhang J.; Zhu Y. H.; Xu S. D.; Wang C. T.; Bian C. Q.; Meng X. J.; Xiao F. S. Strong metal-support interactions achieved by hydroxide-to-oxide support transformation for preparation of sinter-resistant gold nanoparticle catalysts. ACS Catal. 2017, 7, 7461–7465. 10.1021/acscatal.7b01947. [DOI] [Google Scholar]
- Corma A.; Serna P.; Concepción P.; Calvino J. J. Transforming nonselective into chemoselective metal catalysts for the hydrogenation of substituted nitroaromatics. J. Am. Chem. Soc. 2008, 130, 8748–8753. 10.1021/ja800959g. [DOI] [PubMed] [Google Scholar]
- Liu X. Y.; Liu M. H.; Luo Y. C.; Mou C. Y.; Lin S. D.; Cheng H. K.; Chen J. M.; Lee J. F.; Lin T. S. Strong metal-support interactions between gold nanoparticles and ZnO nanorods in CO oxidation. J. Am. Chem. Soc. 2012, 134, 10251–10258. 10.1021/ja3033235. [DOI] [PubMed] [Google Scholar]
- Tang H. L.; Liu F.; Wei J. K.; Qiao B. T.; Zhao K. F.; Su Y.; Jin C.; Li L.; Liu J. J.; Wang J.; et al. Ultrastable hydroxyapatite/titanium-dioxide-supported gold nanocatalyst with strong metal-support interaction for carbon monoxide oxidation. Angew. Chem., Int. Ed. 2016, 128, 10764–10769. 10.1002/ange.201601823. [DOI] [PubMed] [Google Scholar]
- Huang H.; Dai Q. G.; Wang X. Y. Morphology effect of Ru/CeO2 catalysts for the catalytic combustion of chlorobenzene. Appl. Catal., B 2014, 158–159, 96–105. 10.1016/j.apcatb.2014.01.062. [DOI] [Google Scholar]
- Kayama T.; Yamazaki K.; Shinjoh H. Nanostructured ceria-silver synthesized in a one-pot redox reaction catalyzes carbon oxidation. J. Am. Chem. Soc. 2010, 132, 13154–13155. 10.1021/ja105403x. [DOI] [PubMed] [Google Scholar]
- Xu M.; He S.; Chen H.; Cui G.; Zheng L.; Wang B.; Wei M. TiO2–x-modified Ni nanocatalyst with tunable metal-support interaction for water-gas shift reaction. ACS Catal. 2017, 7, 7600–7609. 10.1021/acscatal.7b01951. [DOI] [Google Scholar]
- Wu Z. L.; Li M. J.; Howe J.; Meyer H. M.; Overbury S. H. Probing defect sites on CeO2 nanocrystals with well-defined surface planes by raman spectroscopy and O2 adsorption. Langmuir 2010, 26, 16595–16606. 10.1021/la101723w. [DOI] [PubMed] [Google Scholar]
- Mendoza L.; Baddour-Hadjean R.; Cassir M.; Pereira-Ramos J. P. Raman evidence of the formation of LT-LiCoO2 thin layers on NiO in molten carbonate at 650 °C. Appl. Surf. Sci. 2004, 225, 356–361. 10.1016/j.apsusc.2003.10.026. [DOI] [Google Scholar]
- Wang F.; Li C. M.; Zhang X. Y.; Wei M.; Evans D. G.; Duan X. Catalytic behavior of supported Ru nanoparticles on the {1 0 0}, {1 1 0}, and {1 1 1} facet of CeO2. J. Catal. 2015, 329, 177–186. 10.1016/j.jcat.2015.05.014. [DOI] [Google Scholar]
- Dharmaraj N.; Prabu P.; Nagarajan S.; Kim C. H.; Park J. H.; Kim H. Y. Synthesis of nickel oxide nanoparticles using nickel acetate and poly(vinylacetate) precursor. Mater. Sci. Eng. B-Adv. 2006, 128, 111–114. 10.1016/j.mseb.2005.11.021. [DOI] [Google Scholar]
- Fang W. H.; Pirez C.; Paul S.; Capron M.; Jobic H.; Dumeignil F.; Jalowiecki-Duhamel L. Room temperature hydrogen production from ethanol over CeNixHzOy nano-oxyhydride catalysts. ChemCatChem. 2013, 5, 2207–2216. 10.1002/cctc.201300087. [DOI] [Google Scholar]
- Jalowiecki-Duhamel L.; Zarrou H.; D’Huysser A. Hydrogen production at low temperature from methane on cerium and nickel based mixed oxides. Int. J. Hydrogen Energy 2008, 33, 5527–5534. 10.1016/j.ijhydene.2008.07.031. [DOI] [Google Scholar]
- Si R.; Flytzani-Stephanopoulos M. Shape and crystal-plane effects of nanoscale ceria on the activity of Au-CeO2 catalysts for the water-gas shift reaction. Angew. Chem., Int. Ed. 2008, 47, 2884–2887. 10.1002/anie.200705828. [DOI] [PubMed] [Google Scholar]
- Piumetti M.; Bensaid S.; Russo N.; Fino D. Nanostructured ceria-based catalysts for soot combustion: Investigations on the surface sensitivity. Appl. Catal., B 2015, 165, 742–751. 10.1016/j.apcatb.2014.10.062. [DOI] [Google Scholar]
- Shahed S. M. F.; Hasegawa T.; Sainoo Y.; Watanabe Y.; Isomura N.; Beniya A.; Hirata H.; Komeda T. STM and XPS study of CeO2(111) reduction by atomic hydrogen. Surf. Sci. 2014, 628, 30–35. 10.1016/j.susc.2014.05.008. [DOI] [Google Scholar]
- Cooper J. F.; Selman J. R. Electrochemical oxidation of carbon for electric power generation: A review. ECS Trans. 2009, 19, 15–25. 10.1149/1.3220176. [DOI] [Google Scholar]
Associated Data
This section collects any data citations, data availability statements, or supplementary materials included in this article.