

Abstract
Objective
Randomized clinical trials have shown that aerobic exercise attenuates motor symptom progression in Parkinson's disease, but the underlying neural mechanisms are unclear. Here, we investigated how aerobic exercise influences disease‐related functional and structural changes in the corticostriatal sensorimotor network, which is involved in the emergence of motor deficits in Parkinson's disease. Additionally, we explored effects of aerobic exercise on tissue integrity of the substantia nigra, and on behavioral and cerebral indices of cognitive control.
Methods
The Park‐in‐Shape trial is a single‐center, double‐blind randomized controlled trial in 130 Parkinson's disease patients who were randomly assigned (1:1 ratio) to aerobic exercise (stationary home trainer) or stretching (active control) interventions (duration = 6 months). An unselected subset from this trial (exercise, n = 25; stretching, n = 31) underwent resting‐state functional and structural magnetic resonance imaging (MRI), and an oculomotor cognitive control task (pro‐ and antisaccades), at baseline and at 6‐month follow‐up.
Results
Aerobic exercise, but not stretching, led to increased functional connectivity of the anterior putamen with the sensorimotor cortex relative to the posterior putamen. Behaviorally, aerobic exercise also improved cognitive control. Furthermore, aerobic exercise increased functional connectivity in the right frontoparietal network, proportionally to fitness improvements, and it reduced global brain atrophy.
Interpretation
MRI, clinical, and behavioral results converge toward the conclusion that aerobic exercise stabilizes disease progression in the corticostriatal sensorimotor network and enhances cognitive performance. ANN NEUROL 2022;91:203–216
An increasing number of studies suggest that motor symptoms associated with Parkinson's disease (PD) can be improved through physical exercise. We recently completed a clinical trial showing attenuated motor symptom progression in PD following an aerobic exercise intervention (Park‐in‐Shape trial). 1 Similar findings were observed in a clinical trial that investigated exercise dosage in de novo PD (SPARX trial). 2 These two studies provide strong clinical evidence that exercise can alleviate motor symptoms in PD. However, the cerebral mechanisms underlying this effect remain unclear. Here, we investigated the effect of aerobic exercise on cerebral changes using longitudinal, multimodal magnetic resonance imaging (MRI) in a predefined and unselected subset of individuals from the Park‐in‐Shape trial. We tested the hypothesis that aerobic exercise slows the natural circuit‐level progression of PD.
PD is characterized by progressive loss of dopaminergic cells in the substantia nigra and dopamine depletion in the striatum, which lead to dysfunction in corticostriatal networks that are essential for control of movement and cognition. 3 In early PD, the posterior putamen is heavily affected by dopamine depletion, whereas the anterior putamen is relatively spared. 4 , 5 , 6 Using resting‐state functional MRI, we previously showed that PD is associated with a shift in corticostriatal functional connectivity: cortical sensorimotor regions that normally communicate with the posterior putamen in healthy individuals rely more on the anterior putamen in PD patients. 7 Similar adaptive changes have been observed in healthy LRRK2 mutation carriers at risk of developing PD, indicating that reorganization of corticostriatal function may be involved in compensating for posterior striatal dopamine depletion in early PD. 8 Aerobic exercise may influence clinical disease progression by sustaining or enhancing this form of adaptive neuroplasticity. This hypothesis is grounded in data from animal models of PD showing that physical exercise improves dopaminergic function in the striatum. 9 Accordingly, a recent clinical trial in PD patients showed that 3 months of aerobic exercise increased reward‐related activity and dopamine release in the anterior striatum, 10 suggesting that aerobic exercise may strengthen anterior striatal function. However, it remains unknown whether this strengthening effect is accompanied by a shift in the balance of corticostriatal sensorimotor connectivity away from the posterior putamen. Furthermore, exercise‐related effects on corticostriatal connectivity may depend on structural changes upstream from the striatum, that is, in the sensorimotor cortex and in the substantia nigra. Additionally, aerobic exercise may also improve nonmotor processes, such as cognitive control, which PD patients may use to manage resources limited by motor dysfunction. 3 To explore this possibility, we tested for exercise‐related effects on behavioral and cerebral indices of cognitive control, using an oculomotor task that is sensitive to executive dysfunction in PD, 11 as well as measures of resting‐state functional connectivity in 3 cortical networks known to be involved in cognitive control. 12
Patients and Methods
Participants
We included 57 of the original 130 participants of the Park‐in‐Shape trial, which is a single‐center, prospective, double‐blind, randomized, placebo‐controlled trial evaluating the effect of aerobic exercise versus an active control (stretching) on symptom progression in PD. 1 All participants were assessed off medication (ie, >12 hours since last dopaminergic medication dose). The final sample size was predetermined by available budget and reflects an unselected sample formed from the first consecutive MRI‐compatible participants who volunteered for this imaging study after inclusion in the larger Park‐in‐Shape trial. Participants were informed that the study would compare the effects of two home‐based exercise programs on PD symptoms, brain function, and eye movements, and that they would be randomly assigned to one of two intervention groups (1:1 ratio). Participants remained blinded to the alternative intervention, and assessors remained blinded to intervention assignment. Debriefing showed that 93% of patients remained blinded until after the intervention. Full debriefing followed publication of the clinical findings. 1 Before randomization, all eligible participants of the Park‐in‐Shape trial were invited to simultaneously participate in this imaging study. Randomization in the original trial was independent of participation in this present study. 26 participants were assigned to the aerobic exercise group and 31 participants to the stretching group (see Fig 1; Table 1). Further details on dropouts and exclusions can be found in the protocol and primary report of the Park‐in‐Shape trial. 1 , 13 Additional exclusion criteria specific to this imaging study were use of antidepressants, history of epilepsy, structural brain abnormalities (eg, stroke, traumatic defects, large arachnoid cysts), brain surgery, claustrophobia, implanted electrical devices (eg, pacemaker, deep brain stimulator, neurostimulator), metal implants (eg, prosthetics, metal plates), and pregnancy. Written informed consent was obtained from all participants. The trial protocol was approved by the medical ethical committee of Arnhem‐Nijmegen. Assessments were performed at the Donders Center for Cognitive Neuroimaging in Nijmegen, the Netherlands between January 20, 2016 and June 1, 2018. The trial ended after assessment of all included participants. The Park‐in‐Shape trial has been registered at the Dutch Trial Register (NTR4743).
FIGURE 1.
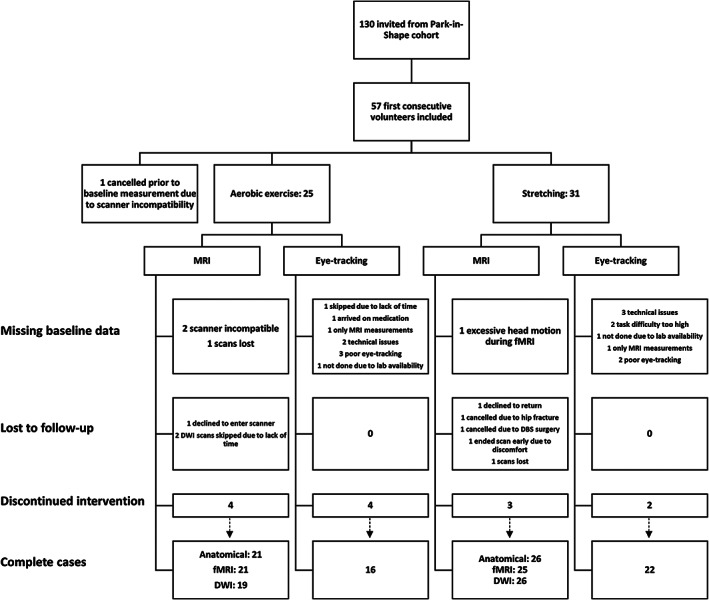
Trial profile flowchart diagram. DWI = diffusion‐weighted imaging; fMRI = functional MRI; MRI = magnetic resonance imaging.
TABLE 1.
Demographic Characteristics and Clinical Measurements at Baseline
| Aerobic Exercise | Active Control | t/χ2/F a | |
|---|---|---|---|
| Participants | 26 | 31 | |
| Age, yr | 58.9 (8.9) | 59.8 (10.1) | p > 0.05 |
| Sex, M/F | 20/6 | 17/14 | p = 0.082 |
| Disease duration, mo | 44.4 (38.2) | 47.5 (32.9) | p > 0.05 |
| Handedness, R/L | 25/1 | 26/5 | p > 0.05 |
| Most affected side, R/L | 13/13 | 14/17 | p > 0.05 |
| Years of education | 14.9 (4.9) | 16.9 (5.6) | p > 0.05 |
| Baseline MDS‐UPDRS‐III | 30.2 (11.4) | 26.7 (15.5) | p > 0.05 |
| Baseline VO2max | 28.2 (7.1) | 26.7 (6.3) | p > 0.05 |
| Baseline TAP | −4.1 (12.4) | −4.5 (13.6) | p > 0.05 |
| Baseline MoCA | 26.5 (2.2) | 26.4 (2.6) | p > 0.05 |
| Completed intervention, yes/no | 20/6 | 26/5 | p > 0.05 |
| Time spent exercising, min | 1,860 (1,182) | NA | NA |
| Time spent exercising within target HRZ, min | 1,427 (988) | NA | NA |
| Between‐session difference (Δ, follow‐up − baseline) in clinical measurements | |||
| Δ Off‐state MDS‐UPDRS‐III | 0 (9.3) | 2.83 (8.6) | p > 0.05 |
| Δ On‐state VO2max | 1.86 (3.3) | −0.2 (4.1) | p = 0.052 |
| Δ TAP | 0.09 (9.3) | −0.84 (11.2) | p > 0.05 |
| Δ MoCA | −1.2 (3) | −0.6 (2.9) | p > 0.05 |
Total sample size varies slightly per test, given that 5 participants (2 exercise, 3 control) had at least 1 missing data point.
F = female; HRZ = heart rate zone; L = left; M = male; MDS‐UPDRS‐III = Movement Disorders Society Unified Parkinson's Disease Rating Scale; MoCA = Montreal Cognitive Assessment; NA = not applicable; R = right; TAP = Test of Attentional Performance; VO2max = maximal oxygen consumption.
Values are given as mean (standard deviation).
Intervention
The aerobic exercise intervention involved cycling on a stationary bike with “exergaming” features, whereas the active control intervention involved stretching, flexibility, and relaxation exercises. Both interventions took place in the participants' own homes 3 times per week for 30 to 45 minutes over 6 months. Participants in the aerobic exercise intervention were instructed to cycle at 50 to 80% of heart rate reserve. Intensity of exercise increased progressively during each session, beginning with a short warmup to get the participant into the target heart rate zone and ending with a cool‐down period. The stretching routine of the active control intervention was varied every 2 to 4 weeks to prevent loss of motivation. 1
Image Processing
Resting‐State Functional MRI
Image acquisition parameters can be found in Supplementary Table SS1. Preprocessing and statistical analysis of MRI data were done using FMRIB Software Library (FSL) 14 and involved motion correction, smoothing to 6mm full width at half maximum, removal of motion‐related variance using ICA‐AROMA, 15 nuisance regression of average cerebrospinal fluid and white matter time series together with 24 motion derivatives, and high‐pass filtering (>0.007Hz). Resting‐state networks were generated using Group ICA (FSL‐MELODIC), 16 which decomposed MRI data from all subjects and all sessions into 20 components. From these components, we selected sensorimotor (see Fig 2A), left frontoparietal, right frontoparietal, and executive control networks (see Fig 2D) based on previous literature. 17
FIGURE 2.
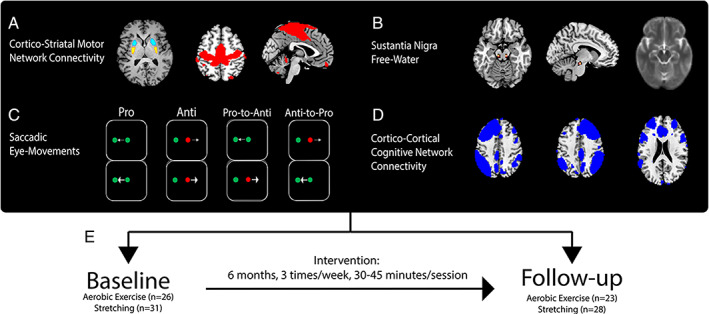
Methods. (A) Bilateral seed regions in posterior (yellow) and anterior (cyan) putamen and the sensorimotor network (red). (B) Average b0 image (right) and heat map (left) showing overlap between masks in posterior substantia nigra. (C) Conditions of the oculomotor cognitive control task. (D) Cognitive control networks (blue; left and right frontoparietal and executive control networks). (E) Longitudinal design.
To test the hypothesis that aerobic exercise shifts the balance of corticostriatal sensorimotor connectivity from posterior to anterior striatum, we quantified functional connectivity between different striatal subregions and the sensorimotor network (ie, region of interest). Striatal seed regions (putamen, caudate nucleus, and nucleus accumbens) were generated by using FSL‐FIRST 18 to perform subcortical segmentation on preintervention subject‐specific structural scans. 7 , 8 The putamen was split into posterior and anterior sections at the anterior commissure (see Fig 2A; 4mm gap). 7 , 8 Average regional time series were used as regressors in a seed‐based multiple‐regression analysis (functional connectivity) for each session. 7 , 8 Global signal was included as a covariate to correct for non‐neuronal noise. 19
To test the hypothesis that aerobic exercise influences brain networks involved in cognitive control, we quantified functional connectivity within 3 networks: left and right frontoparietal networks and the executive control network (see Fig 2D). 17 Dual regression was used to derive subject‐ and session‐specific spatial maps of functional connectivity between individual voxels and each network. 20
FSL‐SIENA 21 was used to minimize between‐session differences in normalizations. Each participant's 2 anatomical images were aligned to each other and resampled into halfway space. Twenty‐one halfway anatomical images from each group were selected, nonlinearly registered (FSL‐FNIRT 22 ) to Montreal Neurological Institute (MNI) space with the MNI152 2mm 6th generation asymmetrical template (FSL's default) as the reference image, and averaged to create an unbiased study‐specific T1‐weighted anatomical template. Nonlinear registrations to MNI space were subsequently estimated and applied to all halfway anatomical images with the study‐specific anatomical template as the reference image. These nonlinear registrations were initiated with linear registrations (FSL‐FLIRT 23 ) from native functional space to halfway anatomical space and used to normalize beta images of functional connectivity in a single interpolation step.
Voxel‐Based Morphometry and Global Brain Atrophy
FSL‐VBM 24 was used to generate normalized, modulated, and smoothed gray matter images. T1‐weighted images in halfway space were brain‐extracted and segmented into gray matter before being normalized to the study‐specific anatomical MNI template defined above through nonlinear registration. The resulting images were then averaged and flipped along the x‐axis to create a symmetric, study‐specific gray matter template to which native gray matter images were nonlinearly registered. Resulting images were then modulated to compensate for the nonlinear component of the normalization and smoothed to 10mm full width at half maximum. Additionally, estimates of global percentage‐based volume change were calculated using FSL‐SIENA. 21
Posterior Substantia Nigra Free Water
Diffusion‐weighted data were preprocessed using the Donders Institute Diffusion Imaging toolbox (https://github.com/marcelzwiers/didi). Raw data were denoised through overcomplete local principal component analysis. 25 Signal dropout due to cardiac and head motion were corrected using the PATCH method. 26 Scans were corrected for signal distortions resulting from eddy currents and subject motion, including rotation of b vectors. Free water maps were calculated as done before. 27 Mean b0 and free water images were normalized to the study‐specific template using the same procedure as above. Masks of the posterior substantia nigra were manually drawn on normalized b0 images for each participant and session in accordance with previous work, 28 and used to extract free water values (see Fig 2B).
Oculomotor Cognitive Control Task
Directly after scanning, participants performed a validated oculomotor task shown to be sensitive to executive dysfunction in PD (see Fig 2C). 11 Participants were instructed to fixate on a centrally presented cue whose color (green or red) indicated whether to make a saccade toward (pro) or away (anti) from a peripherally presented cue. For each trial, there was a 33% chance that the color of the central cue would switch from pro to anti, or from anti to pro, requiring participants to occasionally update their response strategy within single trials. Switches of central cue color could occur at different onsets (−200 milliseconds, −100 milliseconds, 0 milliseconds, or +100 milliseconds) relative to the onset of the peripheral cue (switch time). Participants performed between 2 and 4 blocks consisting of 192 trials each, with 16 trials for each switch time. Participants practiced the task by performing 100 prosaccade trials followed by 100 antisaccade trials, separated into 2 consecutive blocks, at the beginning of the behavioral session.
Saccades were performed with respect to a stimulus appearing 10° to the left or right of a fixation point. An Eyelink 1000 (SR Research, Ottawa, Ontario, Canada) was used to monitor gaze position at 1,000Hz. Before each block of trials, participants performed a 9‐point calibration. Head position was maintained by a chin rest. At the onset of a trial, a central 1° fixation point was displayed for 900 milliseconds after fixation point gaze was acquired. The stimulus then appeared pseudorandomly at 10° to the left or right of central fixation. Participants were required to look toward the stimulus as soon as it appeared and to hold their gaze there for 160 milliseconds (a limit of 1,000 milliseconds was imposed for gaze to be acquired). Subsequently, the screen was diffusely illuminated for 600 milliseconds before the next fixation stimulus appeared. Participants without usable baseline data were deemed unlikely to contribute usable data at follow‐up and were therefore not required to perform the task for a second time.
Clinical Measurements
Clinical assessments were performed at baseline and follow‐up to measure motor symptoms (Movement Disorders Society Unified Parkinson's Disease Rating Scale [MDS‐UPDRS‐III]), cognitive function (Montreal Cognitive Assessment [MoCA]), executive function (Test of Attentional Performance [TAP]), fitness (maximal oxygen consumption [VO2max]), and exercise intensity (minutes spent exercising within target heart rate zone). MDS‐UPDRS‐III subscores were calculated for bradykinesia–rigidity (17 scores; items 3–9, 14), tremor (10 scores; items 15–18), 32 and axial (5 scores; items 1, 9, 10, 12, 13) 33 symptoms.
Statistical Analyses
Cerebral Effects of Aerobic Exercise
All statistical analyses followed the intention‐to‐treat principle and included participants who completed baseline MRI assessments, regardless of intervention completion. Multiple imputation was used to replace missing values at follow‐up for measurements not requiring voxelwise analysis. Change over time, calculated as the difference between sessions (delta: follow‐up – baseline), was the outcome measure in all MRI modalities. Analyses of resting‐state functional connectivity, gray matter volume, and global brain atrophy included 46 participants (exercise, n = 21; stretching, n = 25). For voxelwise analyses, change over time was encoded as the difference between session‐specific beta images, which were calculated for each individual. For the primary analysis of corticostriatal connectivity, differential changes in regional connectivity were encoded as the difference between anterior and posterior putamen delta images (ie, anterior change – posterior change) at the individual level. The resulting delta images of functional connectivity and gray matter volume were subjected to 1‐way analyses of covariance (ANCOVAs; random‐effects analyses) testing effects of group (aerobic exercise vs stretching) on change over time. Nonparametric permutation testing (FSL‐randomise; 5,000 permutations), 29 incorporating threshold‐free cluster enhancement, 30 was used to correct for familywise error (p < 0.05) within the search volume (whole brain, region of interest). Significant between‐group differences in change over time were followed with post hoc 1‐way ANCOVAs performed separately on delta images for each group. Finally, time points were analyzed separately to verify that group differences in change over time were driven by effects at follow‐up rather than at baseline. Effects of group on percentage‐based volume change was tested with a 1‐way ANCOVA in SPSS (IBM, Armonk, NY). Baseline MDS‐UPDRS‐III total score was modeled as a covariate of no interest in all analyses. The analysis of posterior substantia nigra free water included 53 participants (exercise, n = 22; stretching, n = 31) after multiple imputation of follow‐up data for 8 participants (aerobic exercise, n = 3; stretching, n = 5). Effects of group on change in posterior substantia nigra free water was tested with a 1‐way ANCOVA in SPSS. MDS‐UPDRS‐III total score and free water at baseline were modeled as covariates of no interest.
Effect of Aerobic Exercise on Cognitive Control
The final sample size for analyses of oculomotor behavior was 38 participants (exercise, n = 16; stretching, n = 22). Our primary outcome measure for this analysis was saccade direction error rate (% incorrect). Direction errors refer to trials in which the primary saccade was in the incorrect direction relative to the final color of the fixation point. Saccade reaction time (change in horizontal eye position exceeding the mean ± 3 times the standard deviation) and amplitude (of the primary saccade) were used as additional outcomes. For each measure, we performed a 4‐way repeated measures analysis of variance in SPSS with time (baseline, follow‐up), condition (pro, anti), and switch time (nonswitch, −200 milliseconds, −100 milliseconds, 0 milliseconds, +100 milliseconds) as within‐group factors and group (exercise, stretching) as a between‐group factor. 11 Post hoc tests of simple interaction effects were performed with t tests.
Brain–Behavior Correlations
Bivariate Pearson correlations were used to explore the clinical relevance of changes in functional connectivity and antisaccade performance in the aerobic exercise group. Spearman correlations were used for non‐normally distributed variables. Change in corticostriatal sensorimotor connectivity was correlated with change in motor symptom severity, defined as MDS‐UPDRS‐III total score and subscores. Change in right frontoparietal network connectivity and antisaccade error rate were correlated with change in TAP, MoCA, and axial 34 , 35 motor scores, and with each other. We also correlated changes in functional connectivity and antisaccade performance with exercise intensity and changes in fitness, which was significantly improved in the larger Park‐in‐Shape trial. 1
Sensitivity Analysis
Group comparisons were reperformed following the as‐treated principle (ie, after excluding participants who did not complete the intervention). For imaging analyses, 4 participants in the aerobic exercise group (n = 17) and 3 participants in the stretching group (n = 22) were excluded. For the oculomotor task analyses, 4 participants from the aerobic exercise group (n = 12) and 2 participants from the stretching group (n = 20) were excluded. Additionally, inverse probability weights were derived from a logistic regression predicting missingness of baseline and follow‐up data to account for dropout. 31 Intervention group, MoCA, and MDS‐UPDRS‐III total score were modeled as predictors. Significant predictors were retained through forward selection at p < 0.1.
Corrections for Multiple Comparisons
Conservative familywise error corrections were applied in all voxelwise analyses. There were no corrections for multiple outcomes, as this study primarily aimed to provide a comprehensive and exploratory overview of the cerebral effects of aerobic exercise in PD. 36
Results
Effects of Aerobic Exercise on Corticostriatal Connectivity in the Sensorimotor Network
The aerobic exercise group showed a significantly larger posterior‐to‐anterior shift in corticostriatal sensorimotor connectivity compared to the stretching group. Functional connectivity of the anterior putamen, relative to posterior putamen, increased in 4 clusters in the right primary motor cortex, primary somatosensory cortex, and premotor cortex (anterior > posterior putamen, aerobic exercise > stretching, follow‐up > baseline; see Table 2, Fig 3). Separate post hoc analyses for anterior and posterior putamen showed that the between‐group difference in change over time was significant only for the posterior putamen; in the aerobic exercise group compared to the stretching group, functional connectivity was reduced with 2 clusters in the right primary somatosensory and premotor cortices (stretching > aerobic exercise, follow‐up > baseline; see Fig 3B). Specifically, the stretching group, but not the aerobic exercise group, showed a significant increase in functional connectivity between the posterior putamen and 2 clusters in the right primary motor and somatosensory cortices (follow‐up > baseline). Separate session‐specific post hoc analyses confirmed that the effects reported above were present at follow‐up, but not at baseline. Specifically, at follow‐up, functional connectivity of the anterior putamen, relative to posterior putamen, was increased for the aerobic exercise group compared to the stretching group in the right and left premotor cortices (anterior > posterior putamen, aerobic exercise > stretching; see Table 2, Fig 3A). The outcome of the sensitivity analysis can be found in Table 2.
TABLE 2.
Effects of aerobic exercise on corticostriatal functional connectivity.
| Anatomical label | BA (cluster probability) | p‐value (FWE‐corrected) | Cluster extent (voxels) | Max t‐value | MNI: X,Y,Z | Hedge's g (95% CI) | |||
|---|---|---|---|---|---|---|---|---|---|
| Sensorimotor network (functional connectivity) | |||||||||
| Corticostriatal balance (AP>PP) | |||||||||
| Aerobic>Stretching, T2>T1 | |||||||||
| Right M1 | BA4p (54%) | .042a | 29 | 3.6 | 38,‐26,50 | 1.12 [.5,1.73] | |||
| Right M1 | BA4p (32%) | .039a | 28 | 3.9 | 22,‐32,64 | 1.23 [.59,1.84] | |||
| Right S1 | BA3b (52%) | .033a | 26 | 4 | 40,‐16,48 | 1.13 [.51,‐1.74] | |||
| Right PMC | BA6 (86%) | .023a | 26 | 4.7 | 32,‐20,72 | 1.33 [.69,1.96] | |||
| Aerobic>Stretching, T2 | |||||||||
| Right PMC | BA6 (29%) | <.001* | 1225 | 6.3 | 32,‐22,72 | 1.5 [.94,2.14 | |||
| Left PMC | BA6 (57%) | .038a | 27 | 3.9 | ‐40,‐14,58 | 1.2 [.58,1.82] | |||
| Left M1 | BA4p (43%) | .047b | 14 | 3.4 | ‐32,‐26,56 | .94 [.33,1.54] | |||
| Aerobic>Stretching, T1 | |||||||||
| Ns. | |||||||||
| Stretching, T1>T2 | |||||||||
| Right M1 | BA4a (35%) | .05b | 8 | 4 | 20,‐28,64 | .85 [.4,1.32] | |||
| Right M1 | BA4p | .056b | 2 | 4.3 | 36,‐28,48 | .79 [.35,1.25] | |||
| Posterior putamen (PP) | |||||||||
| Stretching>Aerobic, T2>T1 | |||||||||
| Right S1 | BA3b (47%) | .018* | 197 | 4.2 | 44,‐24,48 | 1.16 [.53,1.77] | |||
| Right PMC | BA6 (73%) | .037a | 12 | 4 | 36,‐20,72 | 1.13 [.51,1.74] | |||
| Stretching>Aerobic, T2 | |||||||||
| Right PMC | BA6 (27%) | .002* | 2054 | 4.6 | 26,‐32,64 | 1.36 [.71,1.99] | |||
| Left M1 | BA4a (33%) | .039a | 21 | 3.6 | ‐12,‐42,66 | 1.11 [.49,1.72] | |||
| Stretching>Aerobic, T1 | |||||||||
| Ns. | |||||||||
| Stretching, T2>T1 | |||||||||
| Right M1 | BA4p (34%) | .039a | 25 | 4 | 22,‐30,64 | .88 [.37,1.27] | |||
| Right S1 | BA1 (98%) | .041a | 21 | 4.2 | 40,‐36,64 | .83 [.39,1.5] | |||
| Anterior putamen (AP) | |||||||||
| Ns. | |||||||||
Note. Superscript symbols denote significance of clusters after analyses according to the as‐treated principle (*=p<.05, a=p<.1, b=p>.1). Hedge's g was calculated from z‐statistical values averaged within each cluster for each participant. Abbreviations: Brodmann area (BA). Family‐wise error (FWE). Montreal Neurological Institute (MNI). Premotor cortex (PMC). Primary somatosensory (S1) and motor (M1) cortex. Baseline (T1). Follow‐up (T2).
FIGURE 3.

Motor‐related effects of aerobic exercise. (A) Group differences in the balance of corticostriatal sensorimotor connectivity. (B) Group differences in connectivity between posterior putamen and sensorimotor cortex. (C) Change in connectivity between subregions of the putamen and Brodmann area (BA) 3b. Lower and upper whiskers of bar graphs correspond to the first and third quantiles, and extend from the hinge to the largest or smallest value no further than 1.5 × interquartile range (outlying data points beyond this range are plotted individually). Imaging results are displayed at p < 0.05, familywise error (fwe)‐corrected, overlaid on a study‐specific anatomical Montreal Neurological Institute template. *p < 0.05. AP = anterior putamen; PP = posterior putamen; T1 = baseline; T2 = follow‐up; Δ = follow‐up – baseline.
Effects of Aerobic Exercise on Brain Structure
The aerobic exercise group had significantly lower change in global percentage‐based volume compared to the stretching group (group: F 1,46 = 4.1, p = 0.049, η2 p = 0.87; Fig 4A; reduced global percentage‐based volumes in the stretching group were significant: t 24 = 3.8, p = 0.001, g = 0.6). Exclusion of noncompliant participants did not alter the significance of the group effect. There were no effects of exercise on local gray matter volume (FSL‐VBM), or on free water in the posterior substantia nigra (p = 0.2; see Fig 4B). A post hoc analysis of longitudinal free water increases (follow‐up > baseline) collapsed across intervention groups revealed no significant change (p = 0.8).
FIGURE 4.
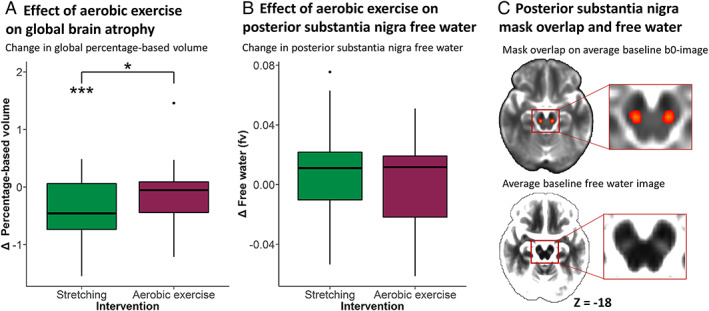
Effect of aerobic exercise on global brain atrophy and substantia nigra free water. (A) Group difference in percentage‐based global brain volume. (B) Group difference in posterior substantia nigra free water. (C) Heat map (upper) of substantia nigra masks overlaid on an average b0 image. Yellow indicates high overlap between masks, red indicates partial overlap. Average free water image (lower) shows hyperintense values in the posterior substantia nigra. Lower and upper whiskers of bar graphs correspond to the first and third quantiles and extend from the hinge to the largest or smallest value no further than 1.5 × interquartile range (outlying data points beyond this range are plotted individually). *p < 0.05, ***p < 0.001. fv = fractional volume; Δ = follow‐up – baseline.
Effects of Aerobic Exercise on Behavioral Performance in a Cognitive Control Task
Saccade Error Rates
The aerobic exercise group had significantly greater changes in error rates depending on condition, as compared to the stretching group (group × time × condition interaction: F 1,36 = 4.2, p = 0.046, η2 p = 0.11). This effect remained significant after correcting for years of education. There was no higher order interaction with switch time. Post hoc analyses, collapsed across switch time, indicated a trend toward improved antisaccade error rates in the aerobic exercise group, but not in the stretching group (group × time interaction for antisaccades: F 1,36 = 3.95, p = 0.055, η2 p = 0.1; Fig 5A; reduced error rates in the aerobic exercise group were significant: t 15 =2.52, p = 0.024, g = 0.53). The group × time × condition effect was nonsignificant (p = 0.2) in the as‐treated analysis.
FIGURE 5.
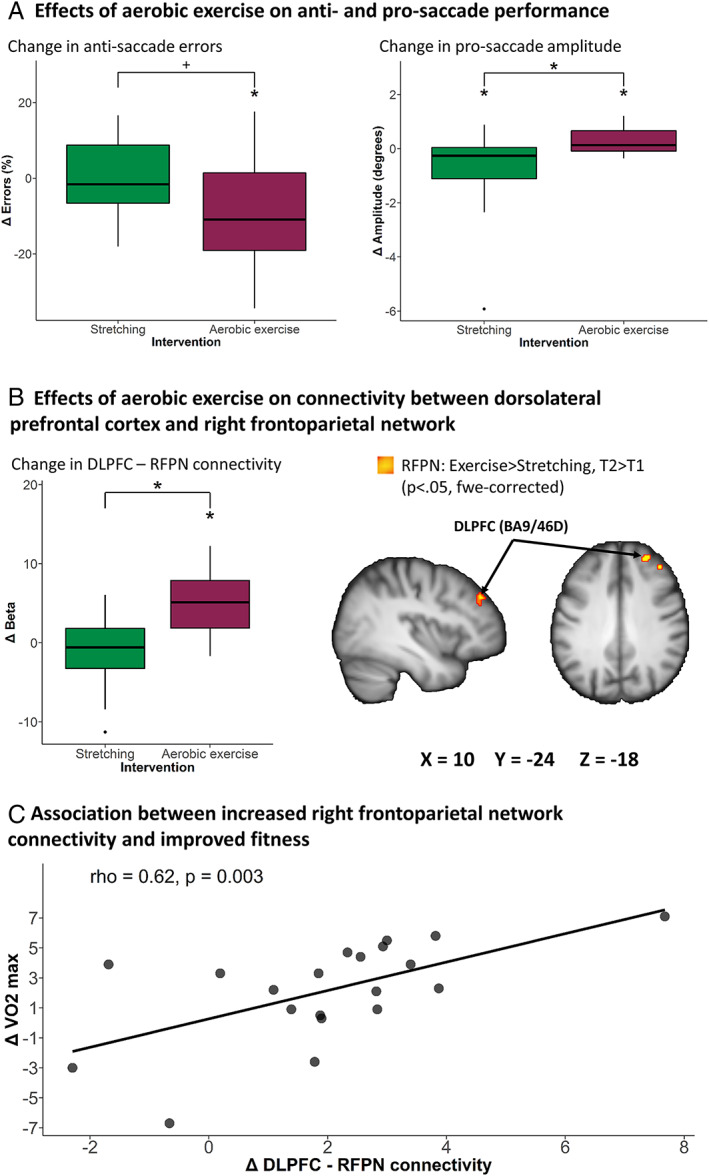
Cognitive control‐related effects of aerobic exercise. (A) Group difference in antisaccade error rate and prosaccade amplitude. (B) Group differences in right frontoparietal network connectivity. (C) Correlation between change in fitness and right frontoparietal network connectivity. Lower and upper whiskers of bar graphs correspond to the first and third quantiles and extend from the hinge to the largest or smallest value no further than 1.5 × interquartile range (outlying data points beyond this range are plotted individually). Imaging results are displayed at p < 0.05, familywise error (fwe)‐corrected, overlaid on a study‐specific anatomical Montreal Neurological Institute template. +p = 0.055, *p < 0.05. BA = Brodmann area; DLPFC = dorsolateral prefrontal cortex; RFPN = right frontoparietal network; rho = Spearman correlation coefficient; T1 = baseline; T2 = follow‐up; VO2max = maximal oxygen consumption.
Saccade Reaction Times
We collapsed across switch times due to missing data points (excessively high error rates in some participants) on some conditions. There were no significant main effects or interactions involving time or group (p > 0.15) on saccade reaction time.
Saccade Amplitudes
The aerobic exercise group had significantly greater change in amplitudes depending on condition, as compared to the stretching group (group × time × condition interaction: F 1,36 = 7.7, p = 0.009, η2 p = 0.18; see Fig 5A). Again, there was no 4‐way interaction with switch time. Post hoc analyses, collapsed across switch time, showed that prosaccade amplitudes worsened in the stretching group, and improved in the aerobic exercise group (group × time interaction for prosaccades: F 1,36 = 6.9, p = 0.013, η2 p = 0.19). Prosaccade amplitudes decreased in the stretching group (t 21 = 2.3, p = 0.03, g = 0.47) and increased in the aerobic exercise group (t 15 = 2.2, p = 0.048, g = 0.51). The group × time × condition interaction remained significant in the as‐treated analysis.
Inverse Probability Weighted Analyses of Oculomotor Performance
MDS‐UPDRS‐III total score was a trend‐level predictor of data missingness in a logistic regression (odds ratio = 1.04, p = 0.054, 95% confidence interval = 0.1–1.09). Patients with missing data (n = 19) had higher MDS‐UPDRS‐III total score at baseline than patients who had complete data (n = 38; t 55 = 2, p = 0.046, g = 0.57). Linear mixed‐effects models incorporating inverse probability weighting were therefore used to reassess the 3 analyses above. All reported effects remained significant, and no new results were obtained.
Effects of Aerobic Exercise on Functional Connectivity in Cognitive Control Networks
The behavioral findings above suggest that aerobic exercise improved (oculomotor) cognitive control in PD, as compared to stretching. When testing for effects within cognitive control networks, we found that the aerobic exercise group had a significantly larger change in functional connectivity within the right frontoparietal network (aerobic exercise > stretching, follow‐up > baseline; see Table 3, Fig 5B). For the aerobic exercise group, but not for the stretching group, there was a significant increase in connectivity between the right frontoparietal network and 2 clusters located in the dorsolateral prefrontal cortex (follow‐up > baseline). The between‐group difference in connectivity change remained significant after correcting for years of education. There were no significant group differences at baseline nor at follow‐up. There were no significant group differences in connectivity change in the remaining networks. The outcome of the sensitivity analysis can be found in Table 3.
TABLE 3.
Effects of aerobic exercise on frontoparietal network functional connectivity.
| Anatomical label | BA (cluster probability) | p‐value (FWE‐corrected) | Cluster extent (voxels) | Max t‐value | MNI: X,Y,Z | Hedge's g (95% CI) | |||
|---|---|---|---|---|---|---|---|---|---|
| Right frontoparietal network (functional connectivity) | |||||||||
| Aerobic>Stretching, T2>T1 | |||||||||
| Right DLPFC | Area 9/46D (24%) | .027* | 109 | 4.6 | 32,48,40 | 1.29 [.65,1.91] | |||
| Aerobic>Stretching, T2 | |||||||||
| Ns. | |||||||||
| Aerobic>Stretching, T1 | |||||||||
| Ns. | |||||||||
| Aerobic, T2>T1 | |||||||||
| Right DLPFC | Area 9/46D (19%) | .003* | 221 | 5.8 | 32,48,40 | .88 [.39,1.4] | |||
| Right DLPFC | Area 46 (25%) | .018* | 89 | 4.5 | 24,62,16 | .65 [.19,1.13] | |||
Note. Superscript symbols denote significance of clusters after analyses according to the as‐treated principle (*=p<.05). Hedge's g was calculated from z‐statistical values averaged within each cluster for each participant. Abbreviations: Brodmann area (BA). Family‐wise error (FWE). Montreal Neurological Institute (MNI). Dorsolateral prefrontal cortex (DLPFC). Baseline (T1). Follow‐up (T2).
Brain–Behavior Correlations
In the larger Park‐in‐Shape trial, aerobic exercise improved total MDS‐UPDRS‐III and fitness (VO2max).1 Here, increased frontoparietal network connectivity was associated with improved fitness (rho = 0.62, p = 0.003, n = 21; see Fig 5C). This association remained significant in the as‐treated analysis.
Discussion
We investigated the systems‐level cerebral changes associated with aerobic exercise in PD, compared to an active control condition (stretching), using a longitudinal design to assess the effects of intervention against ongoing disease progression. Our primary aim was to investigate whether aerobic exercise shifts the balance of corticostriatal sensorimotor connectivity in PD from the posterior putamen toward the anterior putamen. In support of this, we found that aerobic exercise caused a relative posterior‐to‐anterior shift in corticostriatal sensorimotor connectivity, attenuating an opposite longitudinal increase in posterior putamen connectivity, which occurred in the stretching group. Our secondary aims were to explore exercise‐related changes on localized and global brain volume, substantia nigra tissue integrity, and behavioral and cerebral indices of cognitive function. We found that aerobic exercise reduced global brain atrophy and improved cognitive control, but that it did not influence substantia nigra tissue integrity or localized gray matter volume. Specifically, aerobic exercise reduced antisaccade error rates, increased prosaccade amplitudes (both common deficits in PD 37 ), and increased functional connectivity between the right dorsolateral prefrontal cortex and the right frontoparietal network. Furthermore, greater increases in right frontoparietal network connectivity were associated with greater improvements in fitness. Taken together, these findings suggest that aerobic exercise stimulates functional and structural neuroplasticity in both motor and cognitive brain networks in PD. These findings fit with data from animal models of PD, where aerobic exercise stimulated protective and restorative forms of neuroplasticity in the sensorimotor network. 9 We extend those data to PD patients and show that exercise may benefit brain networks outside the motor domain.
Effects of Aerobic Exercise on the Corticostriatal Sensorimotor Network
As hypothesized, aerobic exercise led to a posterior‐to‐anterior shift in the balance of corticostriatal sensorimotor connectivity. Post hoc analyses suggest that this effect was (primarily) driven by increased connectivity with the posterior putamen in the stretching group. These cerebral findings mirror the clinical results of the Park‐in‐Shape 1 and SPARX 2 trials, where motor symptom progression was observed only in the control groups, and animal work demonstrating neuroprotective effects on various molecular and cellular processes related to PD. 38 It might be argued that the observed longitudinal increase in posterior putamen connectivity in the stretching group contradicts previous cross‐sectional studies showing reduced connectivity between posterior putamen and sensorimotor cortex in PD. 7 , 39 However, it is likely that the balance of connectivity between anterior and posterior putamen is what is ultimately important for motor behavior, given that these regions are interconnected through nigrostriatonigral connections, 40 and that connectivity between sensorimotor cortex and putamen subregions is organized along a caudorostral gradient. 41 Further research, involving comparisons between PD patients and healthy controls, will be needed to clarify how PD alters corticostriatal connectivity over time.
Structural Effects of Aerobic Exercise
Brain atrophy is a primary pathological hallmark of PD 42 and is associated with progression of motor and cognitive symptoms. 43 Here, brain atrophy worsened over time in the stretching group, in line with previous longitudinal investigations of structural alterations in early stage PD showing decreased gray matter volume 44 and reduced cortical thickness. 45 These structural alterations do not simply reflect cellular degeneration, but could also result from changes in several other tissue properties, such as dendritic density, synaptic density, and glial cell structure. Although aerobic exercise is unlikely to reverse the effects of cell loss, it may contribute to maintaining structural integrity of the cortex by attenuating pathological changes across the whole brain. 46 We did not observe localized structural effects of aerobic exercise, in contrast to previous interventions involving motor skill learning. 47 , 48
We found no effect of aerobic exercise on the structural integrity of the posterior substantia nigra, using free water imaging as an index of structural damage. 28 This may suggest that dopaminergic cell degeneration has already progressed to a point where neuroprotection is no longer possible. 6 Alternatively, 6 months of follow‐up may not be long enough to detect changes in nigral pathology. Accordingly, we failed to detect significant increases in substantia nigra free water in the stretching group, and for all participants collapsed across groups, whereas previous studies found increased substantia nigra free water in PD patients who were followed for >1 year. 28 Longer follow‐up periods in combination with larger sample sizes may be necessary to demonstrate these effects.
Effects of Aerobic Exercise on Cognitive Control: Saccadic Performance and Frontoparietal Connectivity
Aerobic exercise improved cognitive control, as indexed by an oculomotor task known to be sensitive to executive deficits in PD. 11 , 37 The larger Park‐in‐Shape trial failed to find effects of aerobic exercise on cognitive performance using traditional pen‐and‐paper tests. 1 These tests may lack the sensitivity required for detecting subtle effects of interventions. Future studies on intervention‐related effects may benefit from adopting tightly controlled tasks with fine‐grained continuous metrics of cognitive performance, as afforded by the oculomotor task used in this study. Patients with usable baseline oculomotor data tended to have lower MDS‐UPDRS‐III scores, which may limit the generalizability of our findings toward less severe PD. We accounted for this bias through inverse probability weighted analyses. 31
We found that the dorsolateral prefrontal cortex contributed more strongly to connectivity within the right frontoparietal network in exercising PD patients, and that this was associated with fitness improvements. This is consistent with previous work showing beneficial effects of fitness on brain health and cognition. 46 The dorsolateral prefrontal cortex has been strongly implicated in the maintenance of behavioral goals and in adjusting cognitive control based on task demands. 49 Enhancing the influence that this region has on activity in the right frontoparietal network may facilitate switching from impaired automatic motor responses to less severely affected goal‐directed motor strategies, thereby enabling PD patients to partially overcome motor dysfunction. 3
Therapeutic Implications and Limitations of This Study
Current therapies for treating PD symptoms, such as deep brain stimulation and pharmacological dopamine replacement, have primarily focused on temporarily restoring function in the corticostriatal sensorimotor network. However, achieving any lasting restoration of function in this network may be difficult, given the extent of nigrostriatal cell loss that is already present at clinical onset. 6 Our study suggests that a viable alternative to influence clinical decline may be to focus on maintaining corticostriatal sensorimotor function against disease progression and to strengthen compensatory cognitive processes. The larger Park‐in‐Shape trial was powered to detect changes in global motor symptom progression, 1 whereas our study was primarily powered to detect changes in brain function and structure. This resulted in a smaller sample size that may help to explain why we failed to relate our imaging findings to global motor progression. It should also be noted that connectivity changes and motor symptom progression are highly complex measurements that aggregate multiple domains (eg, functional specialization of brain regions and subsets of symptoms at the clinical level). These measurements may not map onto each other in a linear fashion. Additionally, exercise‐related attenuation of motor progression may result from complex interactions between several changes in brain function and structure. Further research involving more fine‐grained investigations of functional connectivity 41 in combination with stratification of patient cohorts 50 may aid the detection of such a mapping.
Voxelwise analyses in this study were constrained to complete cases and did not account for dropout. To our knowledge, there are no validated methods that correct for missing data in such analyses. The number of patients lost to follow‐up were comparable between intervention groups, indicating equal risk of patient dropout.
Our study aimed to provide a comprehensive description of cerebral changes following aerobic exercise in PD by analyzing multiple outcomes. We applied conservative corrections for multiple comparisons at the level of voxels in our MRI analyses, but did not correct for multiple outcome measures. This was done to retain maximal statistical power at the expense of an elevated risk of obtaining false positive results. 36 Independent replication will therefore be required. We note that all reported effects follow expected and interpretable patterns that are consistent with each other, and with the main findings of the Park‐in‐Shape trial, which reduces the likelihood of false positives. 51
Conclusions
Together with clinical results from the Park‐in‐Shape trial, 1 our results suggest that aerobic exercise stabilizes motor progression and enhances cognitive performance in individuals with PD by stimulating functional and structural plasticity in corticostriatal sensorimotor and cognitive control networks.
Author Contributions
B.R.B., N.v.d.K., N.D.V., I.T., and I.C. contributed to the conception and design of the study; M.E.J., R.C.G.H., N.D.V., N.v.d.K., I.C., and E.K. contributed to the acquisition and analysis of data; M.E.J. and R.C.G.H. drafted the text and prepared the figures.
Potential Conflicts of Interest
Nothing to report.
Supporting information
TABLE S1. Scan Acquisition Parameters
Acknowledgments
This study was supported by ZonMw (Netherlands Organization for Health Research and Development) and BikevoorParkinson. The Center of Expertise for Parkinson and Movement Disorders was supported by a center of excellence grant of the Parkinson's Foundation. We thank all the participants who took part in the study; P. Gaalman for his support during the setup of the study and during acquisition of the imaging data; and ZonMW and BikevoorParkinson for funding this study. The funders had no role in the design and conduct of the study; collection, management, analysis, and interpretation of the data; or in the preparation and submission of the manuscript.
References
- 1. van der Kolk NM, de Vries NM, Kessels RPC, et al. Effectiveness of home‐based and remotely supervised aerobic exercise in Parkinson's disease: a double‐blind, randomised controlled trial. Lancet Neurol 2019;4422:1–11. [DOI] [PubMed] [Google Scholar]
- 2. Schenkman M, Moore CG, Kohrt WM, et al. Effect of high‐intensity treadmill exercise on motor symptoms in patients with De Novo Parkinson disease. JAMA Neurol 2018;75:219–226. [DOI] [PMC free article] [PubMed] [Google Scholar]
- 3. Redgrave P, Rodriguez M, Smith Y, et al. Goal‐directed and habitual control in the basal ganglia: implications for Parkinson's disease. Nat Rev Neurosci 2010;11:760–772. [DOI] [PMC free article] [PubMed] [Google Scholar]
- 4. Cools R. Dopaminergic modulation of cognitive function‐implications for L‐DOPA treatment in Parkinson's disease. Neurosci Biobehav Rev 2006;30:1–23. [DOI] [PubMed] [Google Scholar]
- 5. Kish SJ, Shannak K, Hornykiewicz O. Uneven pattern of dopamine loss in the striatum of patients with idiopathic Parkinson's disease. N Engl J Med 1988;318:876–880. [DOI] [PubMed] [Google Scholar]
- 6. Kordower JH, Olanow CW, Dodiya HB, et al. Disease duration and the integrity of the nigrostriatal system in Parkinson's disease. Brain 2013;136:2419–2431. [DOI] [PMC free article] [PubMed] [Google Scholar]
- 7. Helmich RC, Derikx LC, Bakker M, et al. Spatial remapping of cortico‐striatal connectivity in Parkinson's disease. Cereb Cortex 2010;20:1175–1186. [DOI] [PubMed] [Google Scholar]
- 8. Helmich RC, Thaler A, Van Nuenen BFL, et al. Reorganization of corticostriatal circuits in healthy G2019S LRRK2 carriers. Neurology 2015;84:399–406. [DOI] [PMC free article] [PubMed] [Google Scholar]
- 9. Petzinger GM, Fisher BE, McEwen S, et al. Exercise‐enhanced neuroplasticity targeting motor and cognitive circuitry in Parkinson's disease. Lancet Neurol 2013;12:716–726. [DOI] [PMC free article] [PubMed] [Google Scholar]
- 10. Sacheli MA, Neva JL, Lakhani B, et al. Exercise increases caudate dopamine release and ventral striatal activation in Parkinson's disease. Mov Disord 2019;34:1891–1900. [DOI] [PubMed] [Google Scholar]
- 11. Cameron IGM, Watanabe M, Pari G, Munoz DP. Executive impairment in Parkinson's disease: response automaticity and task switching. Neuropsychologia 2010;48:1948–1957. [DOI] [PubMed] [Google Scholar]
- 12. Laird AR, Fox PM, Eickhoff SB, et al. Behavioral interpretations of intrinsic connectivity networks. J Cogn Neurosci 2011;23:4022–4037. [DOI] [PMC free article] [PubMed] [Google Scholar]
- 13. van der Kolk NM, Overeem S, de Vries NM, et al. Design of the Park‐in‐Shape study: a phase II double blind randomized controlled trial evaluating the effects of exercise on motor and non‐motor symptoms in Parkinson's disease. BMC Neurol 2015;15:1–12. [DOI] [PMC free article] [PubMed] [Google Scholar]
- 14. Smith SM, Jenkinson M, Woolrich MW, et al. Advances in functional and structural MR image analysis and implementation as FSL. Neuroimage 2004;23:S208–S219. [DOI] [PubMed] [Google Scholar]
- 15. Pruim RHR, Mennes M, van Rooij D, et al. ICA‐AROMA: a robust ICA‐based strategy for removing motion artifacts from fMRI data. Neuroimage 2015;112:267–277. [DOI] [PubMed] [Google Scholar]
- 16. Beckmann CF, DeLuca M, Devlin JT, Smith SM. Investigations into resting‐state connectivity using independent component analysis. Philos Trans R Soc Lond B Biol Sci 2005;360:1001–1013. [DOI] [PMC free article] [PubMed] [Google Scholar]
- 17. Smith SM, Fox PT, Miller KL, et al. Correspondence of the brain's functional architecture during activation and rest. Proc Natl Acad Sci 2009;106:13040–13045. [DOI] [PMC free article] [PubMed] [Google Scholar]
- 18. Patenaude B, Smith SM, Kennedy DN, Jenkinson M. A Bayesian model of shape and appearance for subcortical brain segmentation. Neuroimage 2011;56:907–922. [DOI] [PMC free article] [PubMed] [Google Scholar]
- 19. Power JD, Mitra A, Laumann TO, et al. Methods to detect, characterize, and remove motion artifact in resting state fMRI. Neuroimage 2014;84:320–341. [DOI] [PMC free article] [PubMed] [Google Scholar]
- 20. Beckmann C, Mackay C, Filippini N, Smith SM. Group comparison of resting‐state FMRI data using multi‐subject ICA and dual regression. Neuroimage 2009;47:S148. [Google Scholar]
- 21. Smith SM, Zhang Y, Jenkinson M, et al. Accurate, robust, and automated longitudinal and cross‐sectional brain change analysis. Neuroimage 2002;17:479–489. [DOI] [PubMed] [Google Scholar]
- 22. Andersson JLR, Jenkinson M, Smith S. Non‐linear registration, aka spatial normalisation. FMRIB Technial report TR07JA2. Oxford, UK: 22: Oxford Centre for Functional Magnetic Resonance Imaging of the Brain, Department of Clinical Neurology, Oxford University , 2007. [Google Scholar]
- 23. Jenkinson M, Bannister P, Brady M, Smith S. Improved optimization for the robust and accurate linear registration and motion correction of brain images. Neuroimage 2002;17:825–841. [DOI] [PubMed] [Google Scholar]
- 24. Douaud G, Smith S, Jenkinson M, et al. Anatomically related grey and white matter abnormalities in adolescent‐onset schizophrenia. Brain 2007;130:2375–2386. [DOI] [PubMed] [Google Scholar]
- 25. Manjón JV, Coupé P, Concha L, et al. Diffusion weighted image denoising using overcomplete local PCA. PLoS One 2013;8:e73021. [DOI] [PMC free article] [PubMed] [Google Scholar]
- 26. Zwiers MP. Patching cardiac and head motion artefacts in diffusion‐weighted images. Neuroimage 2010;53:565–575. [DOI] [PubMed] [Google Scholar]
- 27. Pasternak O, Sochen N, Gur Y, et al. Free water elimination and mapping from diffusion MRI. Magn Reson Med 2009;62:717–730. [DOI] [PubMed] [Google Scholar]
- 28. Burciu RG, Ofori E, Archer DB, et al. Progression marker of Parkinson's disease: a 4‐year multi‐site imaging study. Brain 2017;140:2183–2192. [DOI] [PMC free article] [PubMed] [Google Scholar]
- 29. Winkler AM, Ridgway GR, Webster MA, et al. Permutation inference for the general linear model. Neuroimage 2014;92:381–397. [DOI] [PMC free article] [PubMed] [Google Scholar]
- 30. Smith SM, Nichols T. Threshold‐free cluster enhancement: addressing problems of smoothing, threshold dependence and localisation in cluster inference. Neuroimage 2009;44:83–98. [DOI] [PubMed] [Google Scholar]
- 31. Seaman SR, White IR. Review of inverse probability weighting for dealing with missing data. Stat Methods Med Res 2013;22:278–295. [DOI] [PubMed] [Google Scholar]
- 32. Stebbins GT, Goetz CG, Burn DJ, et al. How to identify tremor dominant and postural instability/gait difficulty groups with the movement disorder society unified Parkinson's disease rating scale: comparison with the unified Parkinson's disease rating scale. Mov Disord 2013;28:668–670. [DOI] [PubMed] [Google Scholar]
- 33. Lau B, Meier N, Serra G, et al. Axial symptoms predict mortality in patients with Parkinson disease and subthalamic stimulation. Neurology 2019;92:e2559–e2570. [DOI] [PMC free article] [PubMed] [Google Scholar]
- 34. Domellöf ME, Elgh E, Forsgren L. The relation between cognition and motor dysfunction in drug‐naive newly diagnosed patients with Parkinson's disease. Mov Disord 2011;26:2183–2189. [DOI] [PubMed] [Google Scholar]
- 35. Takakusaki K, Okumura T. Neurobiological basis of controlling posture and locomotion. Adv Robot 2008;22:1629–1663. [Google Scholar]
- 36. Bender R, Lange S. Adjusting for multiple testing—when and how? J Clin Epidemiol 2001;54:343–349. [DOI] [PubMed] [Google Scholar]
- 37. Pretegiani E, Optican LM. Eye movements in Parkinson's disease and inherited parkinsonian syndromes. Front Neurol 2017;8:1–7. [DOI] [PMC free article] [PubMed] [Google Scholar]
- 38. Svensson M, Lexell J, Deierborg T. Effects of physical exercise on neuroinflammation, neuroplasticity, neurodegeneration, and behavior. Neurorehabil Neural Repair 2015;29:577–589. [DOI] [PubMed] [Google Scholar]
- 39. Ruppert MC, Greuel A, Tahmasian M, et al. Network degeneration in Parkinson's disease: multimodal imaging of nigro‐striato‐cortical dysfunction. Brain 2020;143:944–959. [DOI] [PubMed] [Google Scholar]
- 40. Haber SN, Fudge JL, McFarland NR. Striatonigrostriatal pathways in primates form an ascending spiral from the Shell to the dorsolateral striatum. J Neurosci 2000;20:2369–2382. [DOI] [PMC free article] [PubMed] [Google Scholar]
- 41. Marquand AF, Haak KV, Beckmann CF. Functional corticostriatal connection topographies predict goal‐directed behaviour in humans. Nat Hum Behav 2017;1:1–9. [DOI] [PMC free article] [PubMed] [Google Scholar]
- 42. Braak H, Del Tredici K, Rüb U, et al. Staging of brain pathology related to sporadic Parkinson's disease. Neurobiol Aging 2003;24:197–211. [DOI] [PubMed] [Google Scholar]
- 43. Filippi M, Sarasso E, Piramide N, et al. Progressive brain atrophy and clinical evolution in Parkinson's disease. Neuroimage Clin 2020;28:102374. [DOI] [PMC free article] [PubMed] [Google Scholar]
- 44. Tessa C, Lucetti C, Giannelli M, et al. Progression of brain atrophy in the early stages of Parkinson's disease: a longitudinal tensor‐based morphometry study in de novo patients without cognitive impairment. Hum Brain Mapp 2014;35:3932–3944. [DOI] [PMC free article] [PubMed] [Google Scholar]
- 45. Uribe C, Segura B, Baggio HC, et al. Progression of Parkinson's disease patients' subtypes based on cortical thinning: 4‐year follow‐up. Parkinsonism Relat Disord 2019;64:286–292. [DOI] [PubMed] [Google Scholar]
- 46. Stimpson NJ, Davison G, Javadi A‐H. Joggin’ the noggin: towards a physiological understanding of exercise‐induced cognitive benefits. Neurosci Biobehav Rev 2018;88:177–186. [DOI] [PubMed] [Google Scholar]
- 47. Sehm B, Taubert M, Conde V, et al. Structural brain plasticity in parkinson's disease induced by balance training. Neurobiol Aging 2014;35:232–239. [DOI] [PubMed] [Google Scholar]
- 48. Draganski B, Gaser C, Busch V, et al. Changes in grey matter induced by training. Nature 2004;427:311–312. [DOI] [PubMed] [Google Scholar]
- 49. Ptak R. The frontoparietal attention network of the human brain: action, saliency, and a priority map of the environment. Neuroscientist 2012;18:502–515. [DOI] [PubMed] [Google Scholar]
- 50. Marquand AF, Wolfers T, Mennes M, et al. Beyond lumping and splitting: a review of computational approaches for stratifying psychiatric disorders. Biol Psychiatry Cogn Neurosci Neuroimaging 2016;1:433–447. [DOI] [PMC free article] [PubMed] [Google Scholar]
- 51. Feise RJ. Do multiple outcome measures require p‐value adjustment? BMC Med Res Methodol 2002;2:8. [DOI] [PMC free article] [PubMed] [Google Scholar]
Associated Data
This section collects any data citations, data availability statements, or supplementary materials included in this article.
Supplementary Materials
TABLE S1. Scan Acquisition Parameters