

Abstract
In vitro models of human liver functions are used across a diverse range of applications in preclinical drug development and disease modeling, with particular increasing interest in models that capture facets of liver inflammatory status. This study investigates how the interplay between biophysical and biochemical microenvironment cues influence phenotypic responses, including inflammation signatures, of primary human hepatocytes (PHH) cultured in a commercially available perfused bioreactor. A 3D printing-based alginate microwell system was designed to form thousands of hepatic spheroids in a scalable manner as a comparator 3D culture modality to the bioreactor. Soft, synthetic extracellular matrix (ECM) hydrogel scaffolds with biophysical properties mimicking features of liver were engineered to replace polystyrene scaffolds, and the biochemical microenvironment was modulated with a defined set of growth factors and signaling modulators. The supplemented media significantly increased tissue density, albumin secretion, and CYP3A4 activity but also upregulated inflammatory markers. Basal inflammatory markers were lower for cells maintained in ECM hydrogel scaffolds or spheroid formats than polystyrene scaffolds, while hydrogel scaffolds exhibited the most sensitive response to inflammation as assessed by multiplexed cytokine and RNA-seq analyses. Together, these engineered 3D liver microenvironments provide insights for probing human liver functions and inflammatory response in vitro.
Keywords: Liver, hepatocytes, tissue engineering, spheroids, cell-matrix interactions, hydrogel, biomaterials
Graphical Abstract
Physiologically relevant human liver models are critical tools in drug development and disease modeling, yet there remains a need for models that better differentiate between healthy and perturbed states. This study presents strategies for engineering perturbation-responsive 3D human liver models. Modulating the cellular microenvironment using biomaterials and media additives enhanced culture function, lifespan, and magnitude of responsiveness to inflammatory stimuli.
1. Introduction
The liver is the largest solid organ in the body and is responsible for hundreds of functions, including nutrient and xenobiotic/drug metabolism, serum protein production, nutrient storage, and immune system response.[1] Models of these processes in both healthy and diseased states, as well as their responses to therapeutic interventions, are of intense interest in drug discovery and development.[2–4] The increasing commercial availability and utility of human donor liver cells are driving the advancement of in vitro models of human liver, supplementing animal models that fail to capture the full complexity of human liver phenotypes.[3–5] An ever-growing number of in vitro liver model applications involve aspects of liver immune responses.[6–9] Such responses are mediated not just by cells classically associated with the immune system but also by hepatocytes and other non-parenchymal cells, which all produce immune-modulating signaling molecules. It is thus crucial to consider how the in vitro microenvironment regulates the potential for hepatocytes and other cell types to respond to perturbations, which may then in turn influence other metabolic[6], toxicity[10], and disease phenotypes[11–13]. Cells cultured in a state associated with high baseline inflammation signatures may show suppressed responses to external perturbations compared to those in a more physiologically quiescent state. In this study, we engineered and characterized human liver models that allow wider differentiation between perturbed and quiescent states than existing commonly used 3D models.
In vitro human liver models span a spectrum from 2D monolayers suitable for short-term assays to perfused 3D models incorporating multiple cell types that retain many liver functions over weeks.[5,14,15] These models are also on a spectrum of scalability in terms of cell mass, culture volume, and suitability for analyses requiring 500,000+ cells (mesoscale).[16,17] The more complex and/or mesoscale models are inherently more costly and lower throughput, but their relatively high information content is a desirable tradeoff for some applications.[18–22]
Here we focus on designing and implementing biochemical and biophysical modulation strategies to illuminate the landscape of inflammatory status and phenotypic functions of primary human hepatocytes cultured in accessible 3D “mesoscale” culture formats: 1) static spheroidal aggregates and 2) 3D tissue-like aggregates on a microperfused scaffold. For perfusion cultures, we used a commercially-available microphysiological systems (MPS) platform referred to as the LiverChip (CN BioInnovations; see Methods), which has been well-characterized for applications in drug metabolism, toxicity, and disease phenotypes.[6,19,23–25] The LiverChip is amenable to applications benefitting from the mesoscale (0.5 – 2 M) cells, such as liver metastasis[26,27] and molecular assays such as phosphoproteomics, Assay for Transposase-Accessible Chromatin using sequencing (ATACseq), and Chromatin Immunoprecipitation Sequencing (ChIPseq) for low-affinity transcription factors, and for analyzing super-enhancers.[28] We focus on two main biomaterials design principles for modulating hepatic behavior in a mesoscale format: 1) promoting 3D structures with a high degree of cell-cell contact, for either culturing in static mode or as an alternative to single cells for seeding the bioreactor and 2) establishing physiological cell and extracellular matrix (ECM) biomimetic interactions. We focus here on hepatocyte-only cultures, as standardized lots of non-parenchymal cell types are less commonly available, and some of their functions can be provided in surrogate form through biochemical modulators.
We compare 3D hepatocyte cultures in the LiverChip bioreactor to static culture in spheroids, as spheroids exhibit high retention of hepatocyte function and show utility in numerous assays.[29–33] Spheroids are commercially available[34] and can be produced readily scale using various low-attachment formats. Several cell-conservative aggregation technologies, including hanging drop plates[35] or microwells[36], produce spheroids in quantities suitable for microscale in vitro studies but are challenging to scale to the numbers needed for mesoscale assays (eg. ATACseq, ChIPSeq of low-affinity transcription factors) or for seeding the LiverChip. Furthermore, we were interested in comparing the behavior of tissue structures formed by seeding the Liverchip with single cells or pre-aggregated cells, as well as allowing comparison of static spheroids to perfused LiverChip culture with comparable scale, oxygenation, and cell/volume ratios. We therefore developed a process for the production of hundreds of relatively small (~130 µm) hepatic spheroids in standard cell culture plates, leveraging a previously-described approach employing alginate microwells [37], but altering the design based on computational modeling of oxygen diffusion and consumption by human hepatocytes and employing a 3D printing-based process to create molds.
While the microwell aggregation approach enabled modulation of cell-cell biophysical interactions at the time of seeding the LiverChip scaffold, we also developed a synthetic ECM hydrogel to modulate the biomechanics of cell-scaffold interactions during perfusion culture. The LiverChip platform supports programmable microperfusion of 3D liver tissue-like aggregates cultured on a removable scaffold.[38,39] The commercial system employs a collagen-coated polystyrene scaffold comprising a thin disc with circular channels to allow for hepatocyte culture exposed to continual perfused flow (Figure 1A). The presence of flow, cell-scaffold, and cell-media interactions are critical parameters in determining the long-term viability and phenotype (Figure S1A). We previously demonstrated that moderately stiff polyethylene glycol (PEG)-diacrylate-based hydrogel scaffolds, lacking any specific cell interaction motifs, reduced baseline inflammatory signatures of freshly isolated human hepatocytes co-cultured with non-parenchymal cells in the LiverChip compared to polystyrene, enabling quiescence of tumor cells seeded into the tissue.[26,40] This previous diacrylate-based gel system was still more than two orders of magnitude stiffer (~300kPa) than physiological liver ranges (~1kPa) and relied on non-specific adsorption of proteins to engender cell adhesion. Here, we investigated an alternate PEG-based hydrogel scaffold approach, leveraging a multi-arm PEG functionalized with adhesion peptides and crosslinked with a polypeptide[41] to yield gels with comparable mechanical properties to liver. Thiol-norbornene light-initiated crosslinking via polypeptide dithiol crosslinkers allowed for precise geometric control through micromolding techniques in addition to the fast generation of a uniform gel.[42,43]
Figure 1. Engineering 3D Hepatic Liver Models Using a Perfused Bioreactor and 3D-Printing Based Alginate Microwells.
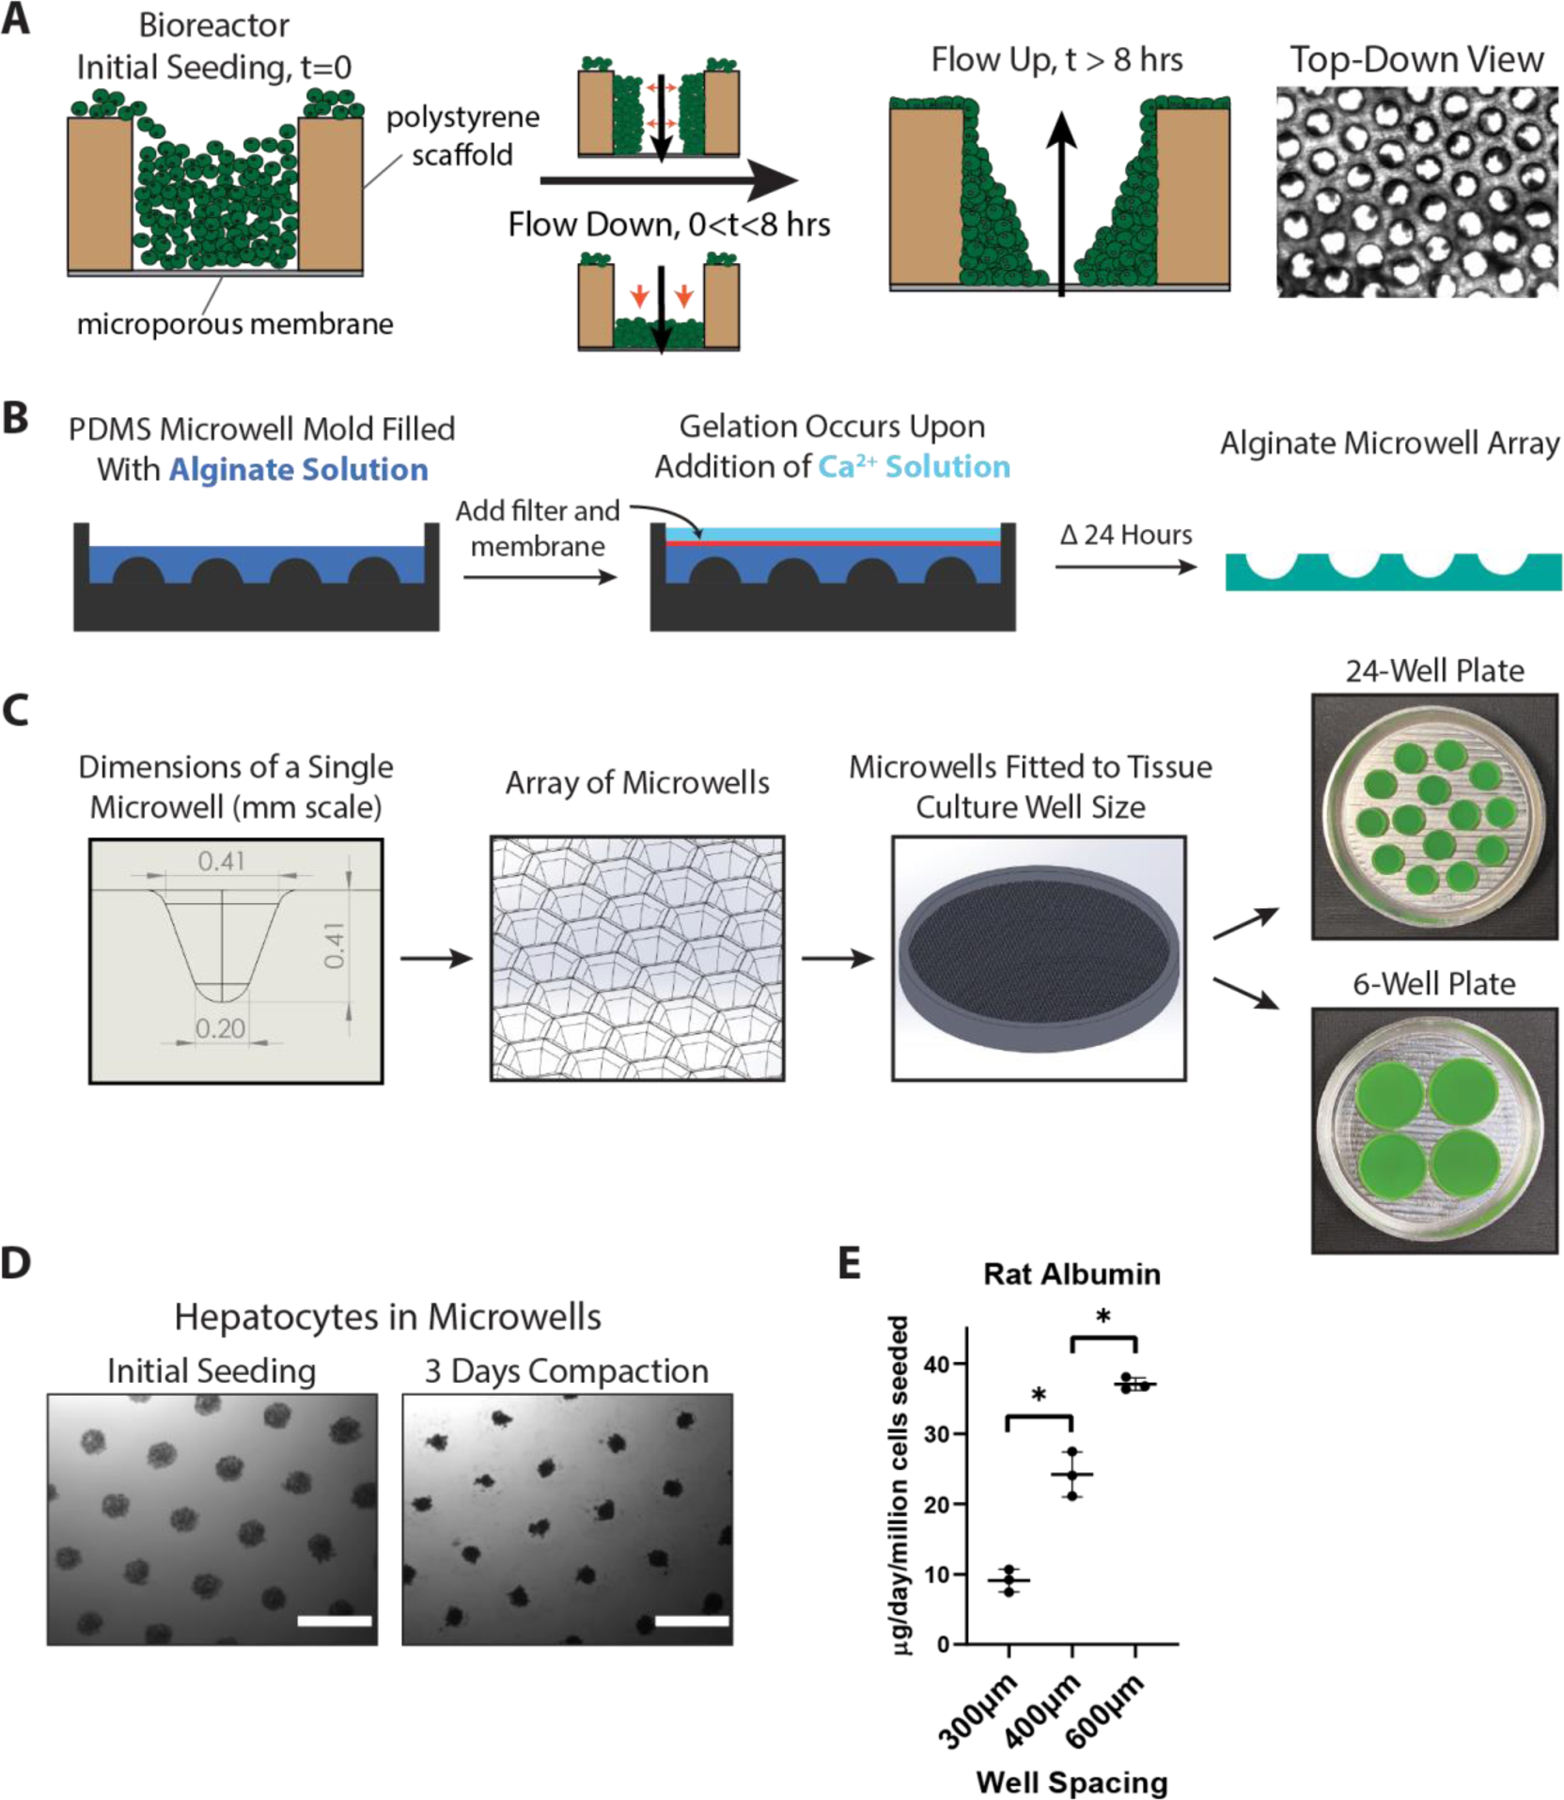
A) Overview of hepatocyte seeding in the perfused LiverChip bioreactor. After seeding cells into wells in a polystyrene scaffold, flow is activated in the downward direction, which pushes cells to the bottom and sides of the flow channel. After 8 hours of attachment, flow is reversed in the upward direction to remove unattached cells and to even out the flow profile. B) Workflow for forming alginate microwells: a reverse-mold PDMS well is filled with alginate precursor, followed by the addition of a filter and dialysis membrane on top. Calcium chloride solution is added to initiate crosslinking, and after 24 hours the alginate can be manipulated and placed in a tissue culture plate. C) Dimensions and schematic of a single microwell patterned into an array that is 3D-printed to the size of a 24-well or 6-well plate. Multiple fitted well arrays are patterned into an aluminum base for PDMS casting. D) Hepatocytes form aggregated spheroids within 3 days. Scale bar = 500μm. E) Rat hepatocyte spheroids cultured in alginate microwells with variable spacing size showed higher albumin production with wider spacing. *p<0.05, N=3.
We then investigated both of these culture formats in the context of biochemical modulation of the microenvironment using a combination of growth factors, along with small molecules forskolin and DAPT, for creating an enhanced liver culture medium (eLCM). We investigated the interplay between 3D culture formats and culture medium cues on phenotypic behaviors (albumin production and CYP450 activity) and probed outcomes mechanistically using a combination of multiplex cytokine measurements, observation of YAP/TAZ nuclear localization, and RNA-Seq analysis.[13,44–46] As the growth factors induced a robust inflammatory response, we found that PEG hydrogel scaffolds showed the most significant degree of differentiation between the basal state and the inflammatory stimulated state. At the same time, spheroids had a low inflammation basal state but a weaker response. The outcome of these analyses yields new insights into a set of accessible hepatocyte culture technologies useful for building more complex mesoscale disease models.
2. Results
2.1. Engineering a Scalable 3D Alginate Microwell Aggregation System
We first sought to create a hepatic spheroid generation system that could be easily scalable and with parameters customized specifically for liver spheroids. We adapted an alginate microwell system based on previous strategies that allowed the generation of hundreds to thousands of uniform spheroids but modifying the mold manufacturing method and design to accommodate oxygen-sensitive hepatic spheroids (Figure 1B).[36,37,47] To accommodate a target spheroid size of ~100–150 um diameter (~200–500 cells), comparable to other studies[48–50], we designed microwells approximately 400μm deep and spaced 600μm apart, patterned in an array adaptable to a standard 24-well or 6-well plate size (Figure 1C). Inverted PDMS molds were first cast from a 3D-printed master mold, a method that allowed rapid prototyping and precise control of well dimensions and spacing. Alginate solution was poured into the mold, and then a porous filter and dialysis membrane are laid on top of the solution (Figure 1B). Once the alginate gelled by the addition of calcium chloride solution, the microwells could be easily handled due to their bonding to the filter. The alginate molds are then released from the filter and placed into a standard tissue culture plate well, with 24-well plates and 6-well plates holding approximately 600 and 3000 spheroids, respectively. In turn, alginate can be dissolved with alginate lyase or chelating solutions (e.g. EDTA, sodium citrate) to harvest spheroids for downstream applications.[37,51]
Microwell arrays were seeded by adding a suspension of hepatocytes in culture media approximating ~200 cells per well to yield aggregates of a target diameter of ~130 um; i.e., large enough to foster cell-cell interactions but small enough to minimize diffusion gradients of oxygen and macromolecules and to facilitate confocal imaging of entire spheroids without histological sectioning. Other literature reports employ cell numbers in the 200–1500 per spheroid range[30,50]. Hepatocytes can contain thousands of mitochondria per cell, and inadequate oxygenation drastically influences viability and functionality.[52–54] Models of optimal spheroid size have estimated that oxygen diffusion limitations typically arise when spheroids reach 200–300μm.[55–57] As such, we aimed to create spheroids within this diameter range for oxygenation, handling, and cell conservation. Primary human hepatocytes (PHHs) readily aggregated within 3 days of seeding in the microwells (Figure 1D and Figure S1D), with similar morphological compaction behavior to previously published studies.[30] Due to the flexibility of 3D printing, the well size and spacing can be modified to accommodate for metabolic requirements of the spheroids. We found that spacing was important, especially when we prototyped the design with freshly isolated rat hepatocytes, which in general are more metabolically active than PHHs, especially within the first few days of isolation.[52,57,58] Increasing spacing size increased albumin secretion of rat hepatocytes, indicating that spheroids were more functional when spaced further apart, indicating that closer spacing may have caused diffusion limitations (Figure 1E). Using a live imaging microscope to quantify the compaction behavior of the cells, we saw that for both rat and human hepatocytes, there was a steady and monotonic decrease in aggregate diameter over time that slowly leveled off, corresponding to aggregation behavior we and others have previously observed (Figure S1B).[59–61] Using our average spheroid size (~130µm), media height (~1.9mm), and previously measured human hepatic oxygen consumption rates[62], we computationally modeled steady-state oxygen tension with different well spacings, showing that there is indeed a potential for hypoxic environments at spacings 400µm and below (Figure S1C).
Using this microwell format, we evaluated 6 different PHH donors according to their spheroid-forming properties (Figure S1D) and resulting function (albumin production and CYP3A4 activity) in 9 days of culture (Figure S1E-F). PHH from different donors showed a wide range of aggregation and functional behaviors. For some donors (Hu8280 and TVR), spheroids were pulled out of microwells by contractile cellular networks formed between adjacent microwells. These lots tended to have high albumin production but low CYP3A4 activity. We further evaluated these same 6 donor lots in the perfused 3D LiverChip bioreactor (Figure S1E-F). Interestingly, the donor lots exhibited different rank orders of performance in LiverChip format compared to static spheroid culture. The variation in culture performance of CYP3A4 activity and albumin among different donors in divergent culture formats highlighted the need to prescreen donors directly in desired 3D settings for phenotypes of interest, especially as commercial datasheets tend to show limited metrics. Among these 6 lots, the most consistently balanced for CYP3A4 activity and albumin production in both formats was Hu8196, which we used for subsequent experiments in this study.
We compared our alginate microwell system to three commercially available spheroid generation platforms that have been previously used for primary hepatic spheroids: Aggrewell 400, Aggrewell 800, and round-bottom 96-well low attachment plates.[30,50,63,64] Following protocols previously published for these other platforms, we seeded 1500 cells per spheroid for the 96 well plate format and 120,000 cells total for the alginate microwell arrays and Aggrewell plates (all in 24 well format), yielding cell/medium ratios of ~7.5–15cells/μL for typical 96-well plate spheroids[30] compared to 300–400 cells/μL for the 24-well plate microwells, and 375cells/μL for the LiverChip[23]. Given the order of magnitude differences, it was more accessible to use the microwell array system as a comparison to LiverChip or other mesoscale 3D bioreactor metrics. Each platform formed spheroids that lasted for 15 days of culture (Figure S2A). There was a noticeable amount of spheroid loss over time in the Aggrewell plates due to their shallow and flat geometry causing spheroids to be displaced out of wells through plate handling and media change steps, whereas alginate microwell spheroids were mainly retained (Figure S2B). This spheroid loss corresponded to lower absolute Aggrewell 400/800 albumin timecourse and day 11 CYP3A4 activity values, while alginate microwells showed both high and stable albumin values and the highest CYP3A4 activity value (~31pmol/hr/106 cells seeded compared to ~20pmol/hr/106 cells for round bottom plates and ~8.7–12pmol/hr/106 cells for Aggrewells.) (Figure S2C-D). Round bottom 96-well spheroids, which contain a single large (1500 cells) spheroid per well, peaked in albumin secretion at day 5, followed by a rapid decline and remained at a stable but low value past day 9 (Figure S2C). However, the 96-well spheroids still showed robust CYP3A4 activity (~20pmol/hr/106 cells seeded) compared to their low albumin, potentially indicating a more perivenous phenotype than the other microwell formats due to the higher amount of cells per spheroid leading to lower local oxygen tension.[65] Taken together, this comparison showed that hepatic spheroids generated with alginate microwells are comparable to commercial platforms, but demonstrate higher albumin and CYP3A4 metrics, reduced spheroid loss, and are suitable as a long term static culture format.
2.2. Engineering a Synthetic ECM Hydrogel Scaffold for 3D Perfusable Liver Bioreactor Culture
While static spheroid cultures are amenable for various screening and modeling assays, there are many applications where modeling a larger mesoscale tissue mass sustained by perfusion-enhanced mixing and molecular transport is beneficial.[16,66] We thus investigated the influence of scaffold properties on phenotype and molecular signaling properties by developing a synthetic extracellular matrix (ECM) mimicking hydrogel for the LiverChip bioreactor and comparing it to the provided standard polystyrene scaffold. Based on previous work[26,40], we reasoned that a synthetic hydrogel ECM with biomechanical properties more comparable to liver, along with cell-interactive motifs, would provide a favorable microenvironment for cryopreserved hepatocytes. A desired outcome of implementing synthetic ECM hydrogel scaffolds is to not only reduce the baseline production of inflammatory markers by hepatocytes compared to when cultured on polystyrene but also allow a greater range of inflammatory responses to be observed on perturbation (Figure S3A). In addition, the mesoscale, perfusable flow channels enable the formation of larger viable hepatic tissue structures than static spheroid culture. We used an 8-arm norbornene-activated PEG macromer (PEG-Nb), which allowed for a wide range of crosslinking densities and adhesion peptide concentrations (Figure 2). The peptide crosslinker contains a previously characterized short peptide sequence degradable by Sortase A (LPRTG) – which was used to dissolve the gel for downstream cell isolation (see Methods) – but does not contain a cell-degradable sequence in order to preserve the long-term structural integrity of the gel.[67] Upon addition of photoinitiator and UV light, the precursor components are converted to networked gel in a one-pot reaction incorporating adhesion peptides and crosslinker. The scaffold was created in a process that simultaneously created flow channels and bonded the scaffold firmly to the filter, using a casting mold of polydimethylsiloxane (PDMS) patterned with gold to block UV light penetration in the regions of the channels (Figure 2B, Figure S3B). The hydrogel channel geometry was designed to allow for mesoscale tissue aggregation and maximize the area available for tissue incorporation (Figure 2C).
Figure 2. Design of PEG Hydrogel Scaffolds Tuned for Perfused Liver Culture.
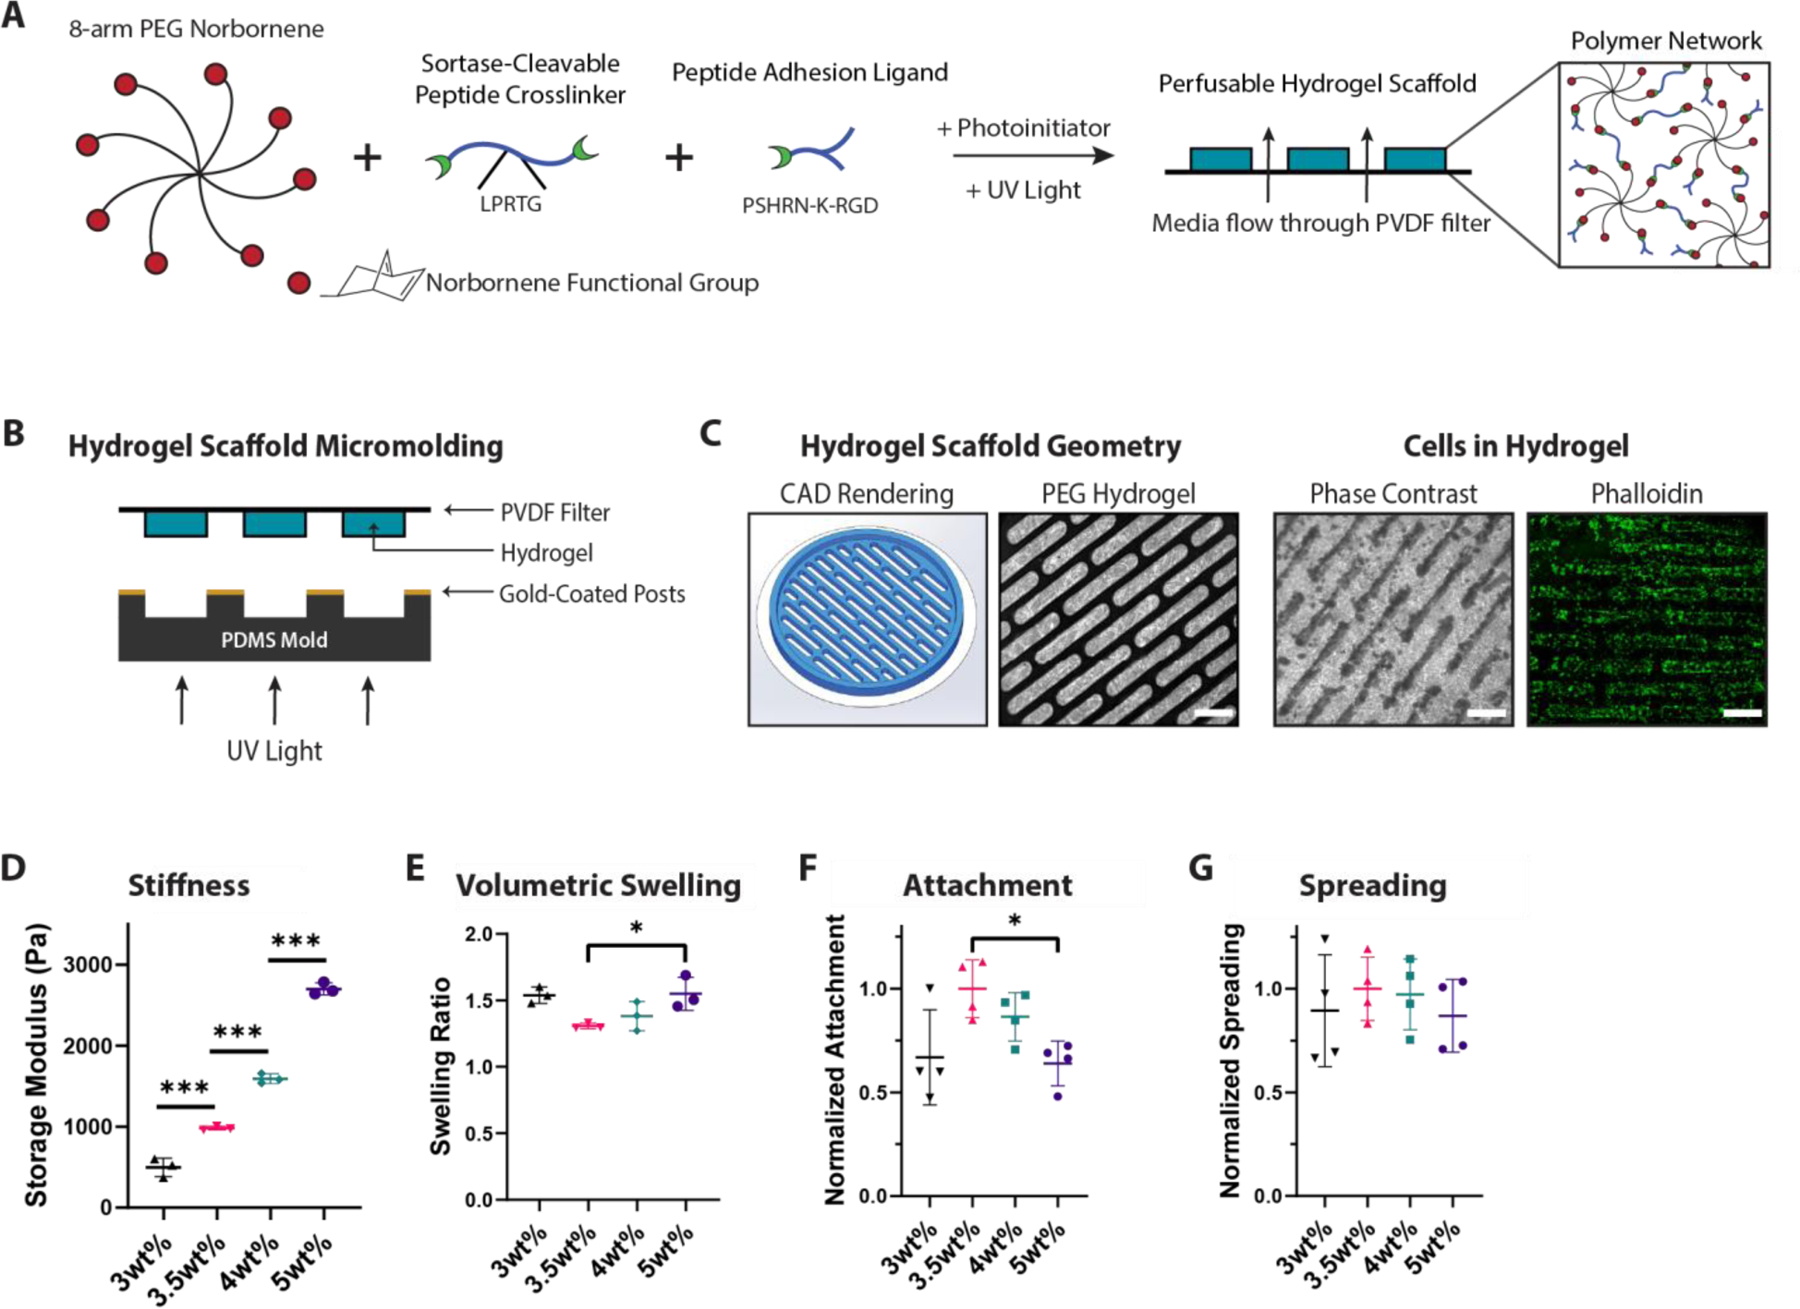
A) Schematic of PEG hydrogel components: an 8-arm PEG norbornene-functionalized (PEG-Nb) macromer is combined with a sortase-cleavable dithiol crosslinker and cell-adhesive peptide (PSHRN-K-RGD) and polymerized into a network using UV light and photoinitiator lithium phenyl-2,4,6-trimethylbenzoylphosphinate (LAP) B) Schematic of micromolding method used to create perfusable channels. The geometric structure is controlled using gold-coated posts, which block UV light during hydrogel polymerization. C) Scaffold images from left to right: computer-designed scaffold rendering, hydrogel without cells stained with trypan blue, hydrogel with cells after 11 days, F-actin (phalloidin, green) staining of cells in hydrogel. Scale bar = 1mm. D) Gel stiffness and E) swelling values in micromolded PEG-Nb hydrogel scaffolds with increasing PEG-Nb macromer wt%. Stiffness exhibits an expected linear trend, while swelling is minimized and attachment is maximized at 3.5wt%. *p<0.05, ***p<0.001, N=3. F) Hepatocyte attachment and G) hepatocyte spreading metrics in micromolded PEG-Nb hydrogel scaffolds with increasing PEG-Nb macromer wt%. Hepatocyte spreading does not significantly differ between gel formulations. Attachment and spreading are normalized to 3.5wt% PEG formulation. *p<0.05, N=4.
Exploiting the modularity of the PEG system, we tuned the gel properties to achieve near-physiological stiffness and minimal swelling. Liver stiffness is heterogeneous and dependent on the measurement method, though values generally range around the order of 1–2 kPa for healthy liver.[68–70] 2D culture substrates with values above this range are associated with liver stellate cells transforming into myofibroblasts and dedifferentiation of hepatocytes in short-term culture.[71–73] To generate a wide range of scaffold stiffnesses, we varied the wt% of PEG-Nb while maintaining a constant crosslinking ratio. As expected, increasing PEG polymer content monotonically increases stiffness, from ~500 Pa to ~2700 Pa across the range 3–5 wt% PEG-Nb (Figure 2D), thus spanning a range associated with healthy to fibrotic liver. Hydrogel swelling was a second critical issue to consider, as swelling greater than ~ 1.5x distorts channel geometry, reduces available tissue volume, and may create excessive stresses that lead to delamination from the filter. Hydrogels with a desirable range of mechanical properties exhibited swelling in the range 1.3–1.5 fold, with a minimum at 3.5 wt% and increasing as PEG content is increased or decreased while maintaining 50% crosslinking and 2mM nominal PHSRN-K-RGD fibronectin-mimic cell adhesion peptide (Figure 2E). With the range of acceptable macromer and crosslinking parameters defined by swelling analysis, we then characterized hepatocellular attachment as a function of gel composition and mechanical properties. First, varying bulk macromer wt%, an optimal hepatocyte attachment is observed at 3.5wt%, keeping 50% crosslinking and 2mM nominal PHSRN-K-RGD, with no differences in spreading across gel formulations (Figure 2F–G). As this bulk gel formulation also had minimal swelling and physiological stiffness, it affirmed the suitability of this system for liver culture. Next, investigating cell-adhesive ligand composition, we anticipated that incorporating a diverse adhesive peptide mix at relatively high concentrations would maximally engage integrins and enhance hepatocyte attachment. Based on our previous work and composition of the liver ECM[74–76], we tested PHSRN-K-RGD at increasing concentrations as well as collagen I-derived peptide GFOGER (Figure S3C). When we varied PHSRN-K-RGD concentration across a nominal range of 1–3 mM, there were no significant differences in the number of hepatocytes attached, in contrast to attachment of iPSC-derived endothelial cells, a control cell type that we have previously shown to respond to a variety of gel adhesion peptides (Figure S3C-D).[77] In all gels we observed hepatocytes retaining a more rounded and clustered morphology compared to the more spread cobblestone shape for typical 2D culture, with an approximately 60% attachment efficiency for 3.5wt% gels compared to polystyrene (Figure S3E).
From these studies, we determined that a 2mM nominal PHSRN-K-RGD concentration was sufficient for hepatocyte attachment to the gels. However, the relatively poor performance of GFOGER was surprising, as dried collagen and collagen gel are standard coatings in hepatocyte culture formats, and GFOGER supports other epithelial cells in the context of a PEG gel crosslinked with a Michael addition process.[78,79] We hypothesized that the differential effect compared to other PEG hydrogel systems may be due to its complex interaction with other components in the gel, especially the peptide crosslinker, in the context of a 1-pot UV-initiated crosslinking process. When we replaced the peptide crosslinker with a dithiol PEG crosslinker of similar length, GFOGER supported hepatocyte attachment comparable to PHSRN-K-RGD (Figure S3D). We then evaluated compound adsorption behavior of the finalized PEG scaffold in the LiverChip bioreactor, demonstrating 5–10% changes to compound concentrations after 48 hours of circulation, a result matching polystyrene scaffolds[23,25] except for propranolol, a lipophilic compound that had 18.8% adsorption change at 100nM concentration, a percentage change still low enough to be controllable for in metabolic studies (Figure S3F). In summary, our gel system was optimized for moldability, swelling, and adhesivity, systematically narrowing down the range of parameters to identify a combination most suitable for perfused hepatocyte culture (Figure S3G).
2.3. Comparative Functional Performance and Morphological Characteristics of PHHs in Spheroid and Perfused MPS platforms
We assessed hepatic spheroids generated from alginate microwells and hepatocytes cultured on micromolded PEG hydrogels in the perfused MPS platform for 15 days, comparing to the commercially available polystyrene scaffold for the platform, across metrics of albumin secretion rate and CYP450 3A4 activity from rat hepatocytes and cryopreserved PHHs. For these studies, we used previously published and commercially available, fully defined serum-free media containing no growth factors or small-molecules (see Methods). However, for PHHs, we replaced the commonly used dexamethasone supplement with 100nM hydrocortisone, a physiologically-relevant concentration, in order to preserve inflammatory responses.[6,80] Albumin secretion rates (normalized by the number of cells seeded) by rat hepatocytes maintained in either spheroid or PEG-scaffold formats showed an initial increase over the first week of culture, followed by a decline to similar levels by day 15, while cells maintained in the polystyrene scaffold were initially greater than in the PEG scaffolds but exhibited monotonic decline over 15 days, reaching a similar value to those in PEG scaffolds around day 5 and declining more rapidly thereafter (Figure 3A). Although we did not assay cell numbers in the various culture formats in the first few days after initial seeding, our interpretation of the relatively lower rates of albumin production in perfused PEG gel scaffolds compared to spheroids was due to washout of cells post-seeding in the PEG scaffolds. This interpretation is supported by images of the 2D hepatocytes showing a rounder morphology and reduced attachment efficiency compared to polystyrene in the 2D assay (Figure S3E).
Figure 3: Characterization of Microwell and PEG Systems for Long Term 3D Liver Culture.
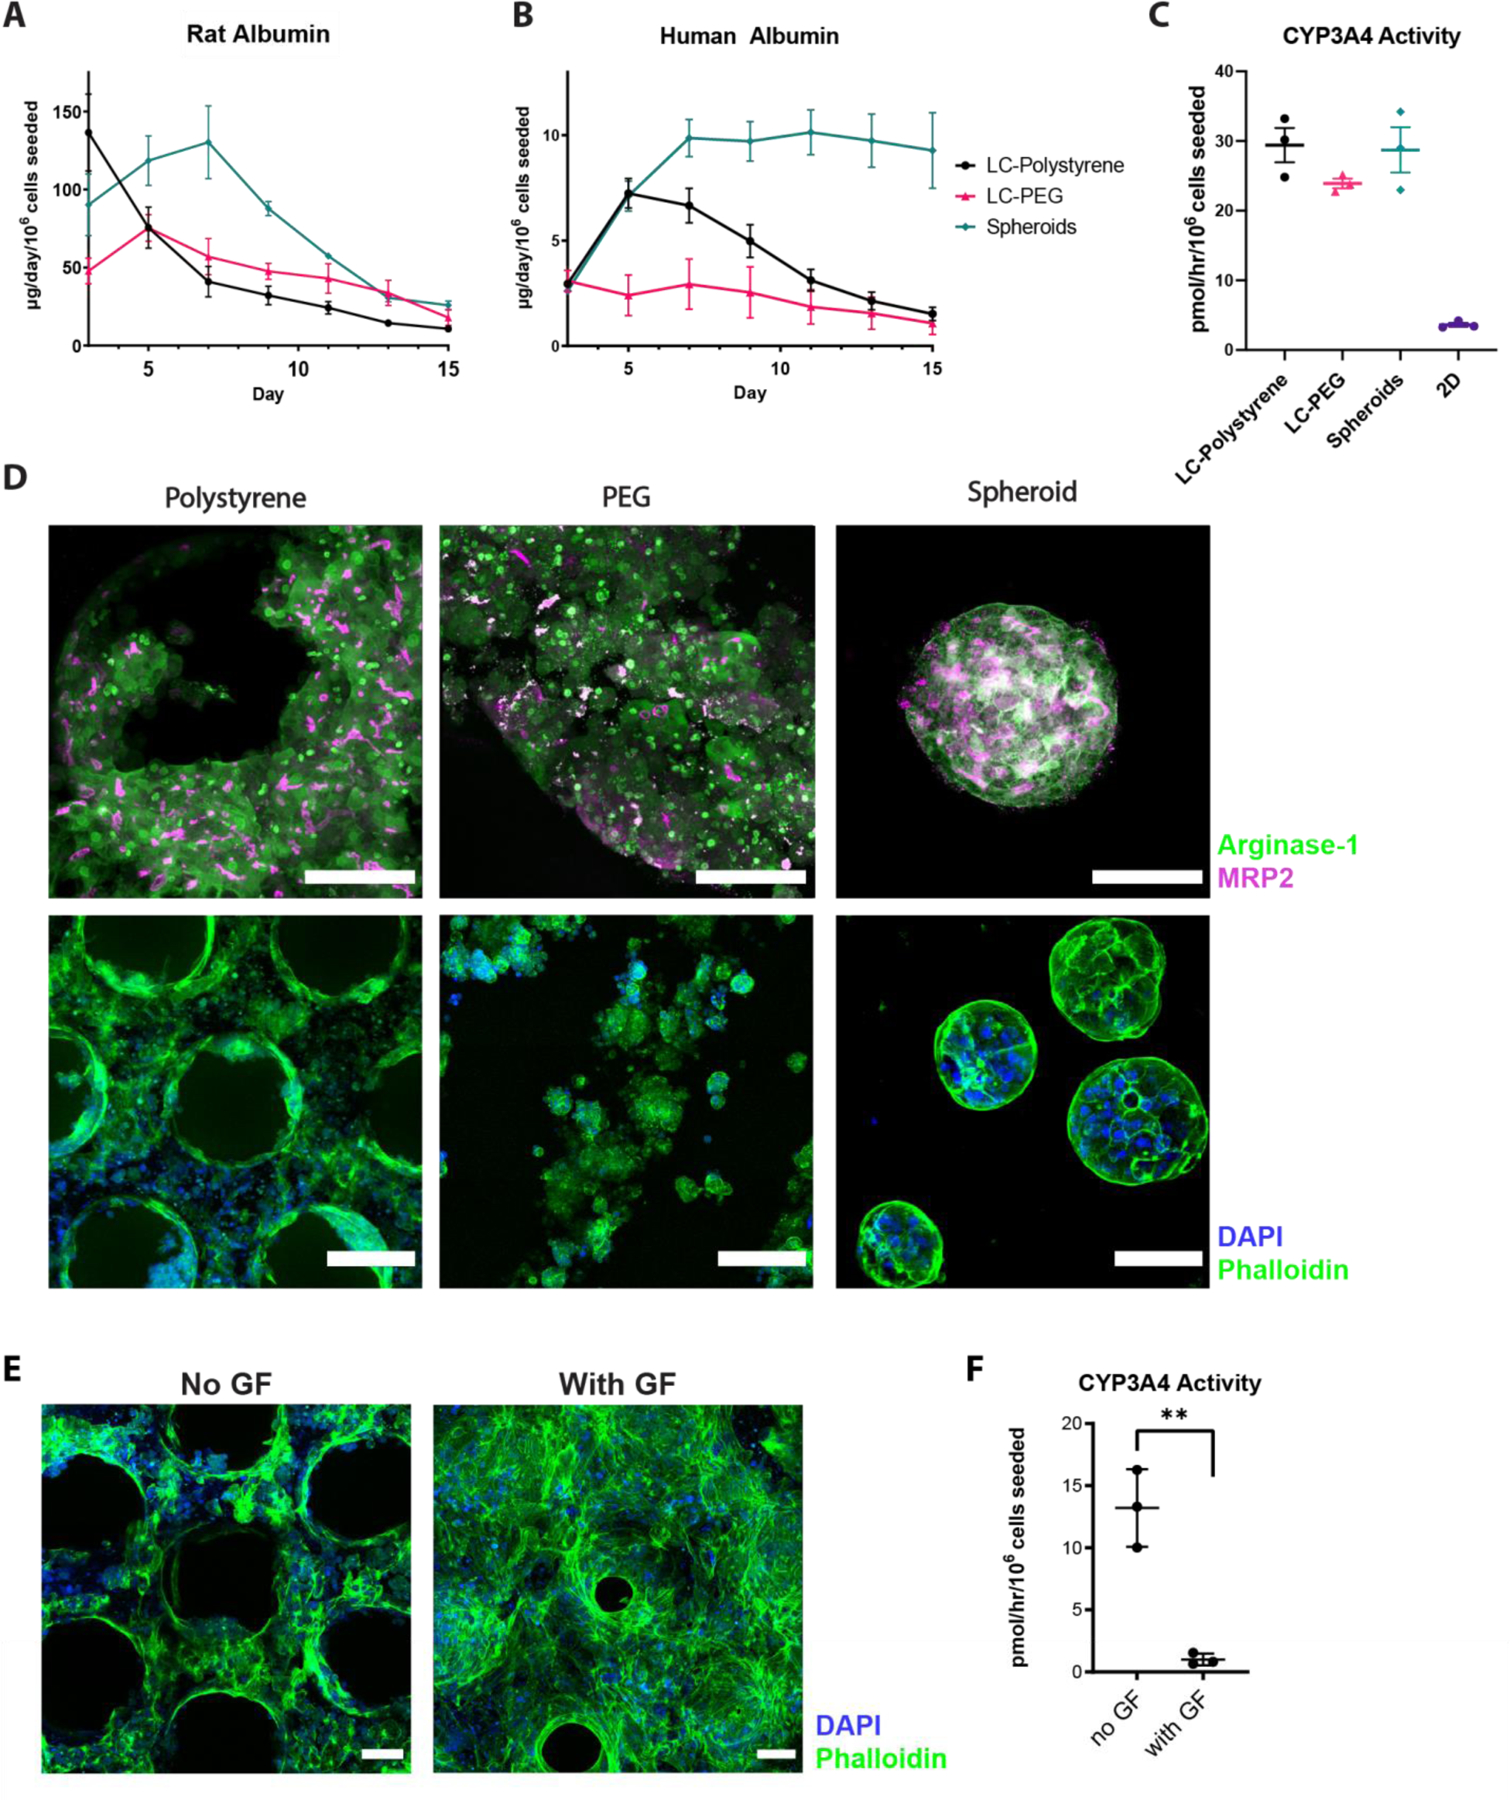
A) Rat and B) primary human hepatocyte albumin secretion time-courses over 15 days of culture. Three different culture conditions were compared: LiverChip polystyrene (LC-Polystyrene, black), LiverChip PEG hydrogel (LC-PEG, red), and microwell aggregated spheroids (Spheroids, green). C) CYP3A4 activity on day 11 in human hepatocytes compared across 3D cultures as well as 2D culture. D) Morphological comparison between polystyrene, PEG, and spheroid cultures using immunofluorescence (IF) staining. Top row: arginase (green) and MRP2 (magenta) markers, maximum projected 200µm z-stacks. Scale bar = 100μm. Bottom row: nuclei (blue) and F-actin (green) markers in wider view. Scale bar = 200μm for Polystyrene and PEG, Scale bar = 100μm for spheroids. E) Morphological IF comparison between human hepatocytes with standard and growth-factor supplemented medias on the Liverchip polystyrene scaffold, stained for nuclei (DAPI, blue) and F-actin (phalloidin, green). Scale bar = 100μm. F) CYP3A4 activity in human hepatocytes on Liverchip polystyrene (day 15) with standard hepatocyte culture media and growth-factor supplemented media. **p<0.01, N=3 all graphs.
Human albumin production rates more than doubled over the first week of culture for cells maintained in static spheroid culture and remained high with no noticeable loss of spheroids through media change. In contrast, rates for cells maintained in perfused polystyrene scaffolds in the MPS platform peaked in the first week and declined, and those in PEG scaffolds showed a modest, monotonic decline from initial values (Figure 3B). The peak and then decline for PHH maintained in the standard polystyrene scaffolds is donor-dependent, as we have also observed an increase with sustained albumin production over 2 weeks[24] or a peak with a more modest decline[19]. Our interpretation here, as above, is that the decrease in albumin production is due to a loss of cells, which is likely gradual in the polystyrene scaffold and more immediate in the PEG scaffolds. Even though hepatocytes attach to the PEG scaffold in a static 2D assay, the relative lack of spreading compared to the collagen-coated polystyrene suggest that the adhesion strength in the after attachment is not as strong as it is to collagen-coated polystyrene, causing some cells to wash out when the flow is reversed (Figure 1A). This interpretation for both scaffolds is supported by the measured DNA content of the static spheroid cultures at the completion of the experiment – they were almost double the value of LiverChip cultured scaffolds, for both PEG and polystyrene (Figure S4A). Albumin time courses for the three platforms normalized to their measured DNA content show values for both PEG and polystyrene scaffolds in the Liverchip were comparable to each other in the later time period (Figure S4A). LDH exponentially decreased and stabilized post day 5 of seeding for all platforms (Figure S4B), suggesting it takes about a week after initial seeding for hepatic tissue to stabilize in the bioreactor and become suitable for perturbation experiments. Cell loss in the LiverChip bioreactor is most likely highest at early timepoints, as no observable cell debris is found at later timepoints when supernatant is centrifuged, though some was seen in the first two media changes (not shown). The relatively lower throughput of mesoscale 3D culture formats precludes assaying cell numbers at multiple time points throughout extended culture periods, though relative timecourse trends are informative and sacrificial endpoint normalization can be used as a slightly more comparable measure of cross-platform hepatocyte performance. However, most applications of complex 3D cultures formats involve high information content analyses often involving approaches such as we describe next (RNA-seq and multiplex cytokine analysis) which provide functional normalization at the time points of their measurement.
In contrast to the albumin production rates, which were maintained at greater values in the spheroid format, CYP3A4 activities measured on day 11 and normalized to the initial number of cells seeded were comparable for all 3D culture configurations and were much greater compared to 2D polystyrene (~20–30 vs. 3 pmol/hr/106 cells seeded) (Figure 3C). If normalized by DNA content, apparent CYP450 activity values in perfused culture are ~2-fold greater than those in spheroid culture, an outcome that may be influenced by enhanced molecular transport in perfusion flow.
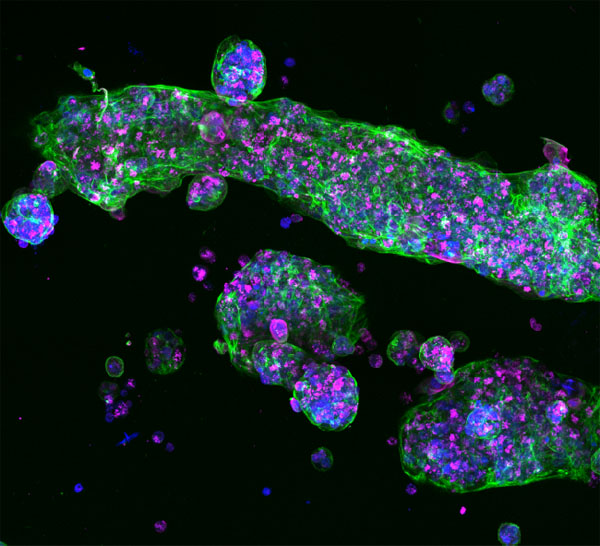
We then evaluated common hepatic morphological markers using immunofluorescence (IF) imaging. Hepatocytes stained robustly for arginase-1, a cytoplasmic hepatocyte marker (Figure 3D), as well as CYP3A4 and albumin (Figure S4C).[81] In PEG scaffolds and spheroids, and dense tissue regions of PS scaffolds, MRP2 was present, indicating the formation of polarized tissue and the development of bile canaliculi, similar to previously published spheroid sections and liver organoids.[30,82] An additional characterization advantage of PEG over polystyrene is its sectionability – generating 10μm H&E slices of the scaffold allowed detailed visualization of hepatocytes in the scaffold, demonstrating the formation of tissue similar to spheroid sections (Figure S3H).[30]
In summary, although some cells appear to be lost early on in the PEG scaffolds, those that are retained have a more 3D tissue-like architecture than those in the standard polystyrene scaffold, and appear to retain function (steady albumin and high degree of CYP450 activity), suggesting that they may have a more quiescent base state that might show an enhanced response to inflammation compared to cells in polystyrene. We thus investigated the relative inflammation responses in different culture formats.
2.4. Modulation of Tissue Formation, Albumin Secretion, and Metabolic Activity by Growth Factors, Forskolin and DAPT
Incorporation of non-parenchymal cells (NPC: Kupffer cells, stellate cells, and endothelial cells) into hepatocyte cultures is desirable for some applications, for example, those involving inflammation and fibrosis.[23,83] Such applications may particularly benefit from the soft PEG-based scaffolds, as stellate cells are known to become activated on stiff surfaces.[72] While the inclusion of NPCs is beyond the scope of this study, we investigated the response of the system to culture media formulated to support co-cultures of hepatocytes and NPCs, which typically require additional growth factors or 5–10% serum[84], which contains variable amounts of growth factors, lipids, and hormones, beyond those in the standard hepatocyte media, at least in early stages of culture. Commonly used growth factors implicated to support multiple liver cell types (hepatocytes and NPCs) include epithelial growth factor (EGF), hepatocyte growth factor (HGF), and basic fibroblast growth factor (FGFb).[85] In addition, while hepatocytes typically express low levels of insulin growth factor (IGF) receptors, they are upregulated and responsive to IGF-1 upon inflammatory or damage response and are critical to NPCs.[86]
When four growth factors (EGF, HGF, IGF-1, FGFb) were supplemented to the commercial, serum-free culture media, we observed a much denser tissue structure in the Liverchip (Figure 3E). This increase in tissue density was accompanied by an increase in albumin secretion (Figure S4D). However, this increase in albumin was paired with a decrease in CYP3A4 activity (Figure 3F). This phenomenon of reciprocal regulation of albumin production and CYP3A4 activity by medium supplements may arise due to interplay of these factors with the relatively low concentration of cortisol compared to traditional culture media.[87] While the growth factors may enhance tissue formation in hepatocyte-only cultures and thereby stabilize albumin production, they may also induce wound healing and inflammatory cytokines such as IL-6, a known transcriptional repressor of CYP450.[6,88,89] In addition, EGF has been previously implicated in the suppression of CYP3A4 gene expression.[90] Indeed, the production of several cytokines and chemokines, including IL-6, IL-8, and IL17A, were increased in cultures supplemented with additional growth factors (Figure S4E). This increase was not linear for these measured factors (for example, the shift from undetectable to ~20pg/mL IL-17A along with a range of 3–5 fold differences in other measured growth factors), and thus it is unlikely that the results can readily be explained by differences in total cell mass.
While a regenerative culture medium, in the absence of non-parenchymal cells, can negatively affect metabolic activity by suppressing CYP450 transcription and other hepatic gene signatures, and possibly through other mechanisms such as reactive oxygen species, such effects can be mitigated by using small-molecule inducers and inhibitors.[6,88] Small molecule cocktails or small molecules paired with growth factors have been successfully used to maintain hepatic differentiation, expand primary hepatocytes, and differentiate hepatic organoids.[82,91–93] Xiang et al. utilized a combination of five small molecules to sustain hepatic function in 2D for months.[91] Notably, when we added a subset of these molecules, CAMP activator forskolin and Notch inhibitor DAPT, to the growth factor supplemented culture, we observed an enhancement in CYP3A4 activity, with both being effective individually (not shown) or in combination. We term the combination of growth factors and small molecule supplemented media enhanced liver culture media (eLCM). Similar to growth factors alone, eLCM cultures in the Liverchip platform showed a clear increase in tissue density in both polystyrene and PEG scaffolds (Figure 4A). In all three culture platforms, eLCM greatly enhanced both the albumin secretion timecourse and CYP3A4 metabolic activity (Figure 4B-C). Thus, this defined, serum-free media helps develop in vitro hepatic tissue, increases the time period of stable culture, and maintains critical hepatic metabolic functions.
Figure 4. Growth Factors and Small Molecules Improve Liver Culture Performance While Increasing Inflammatory Response.
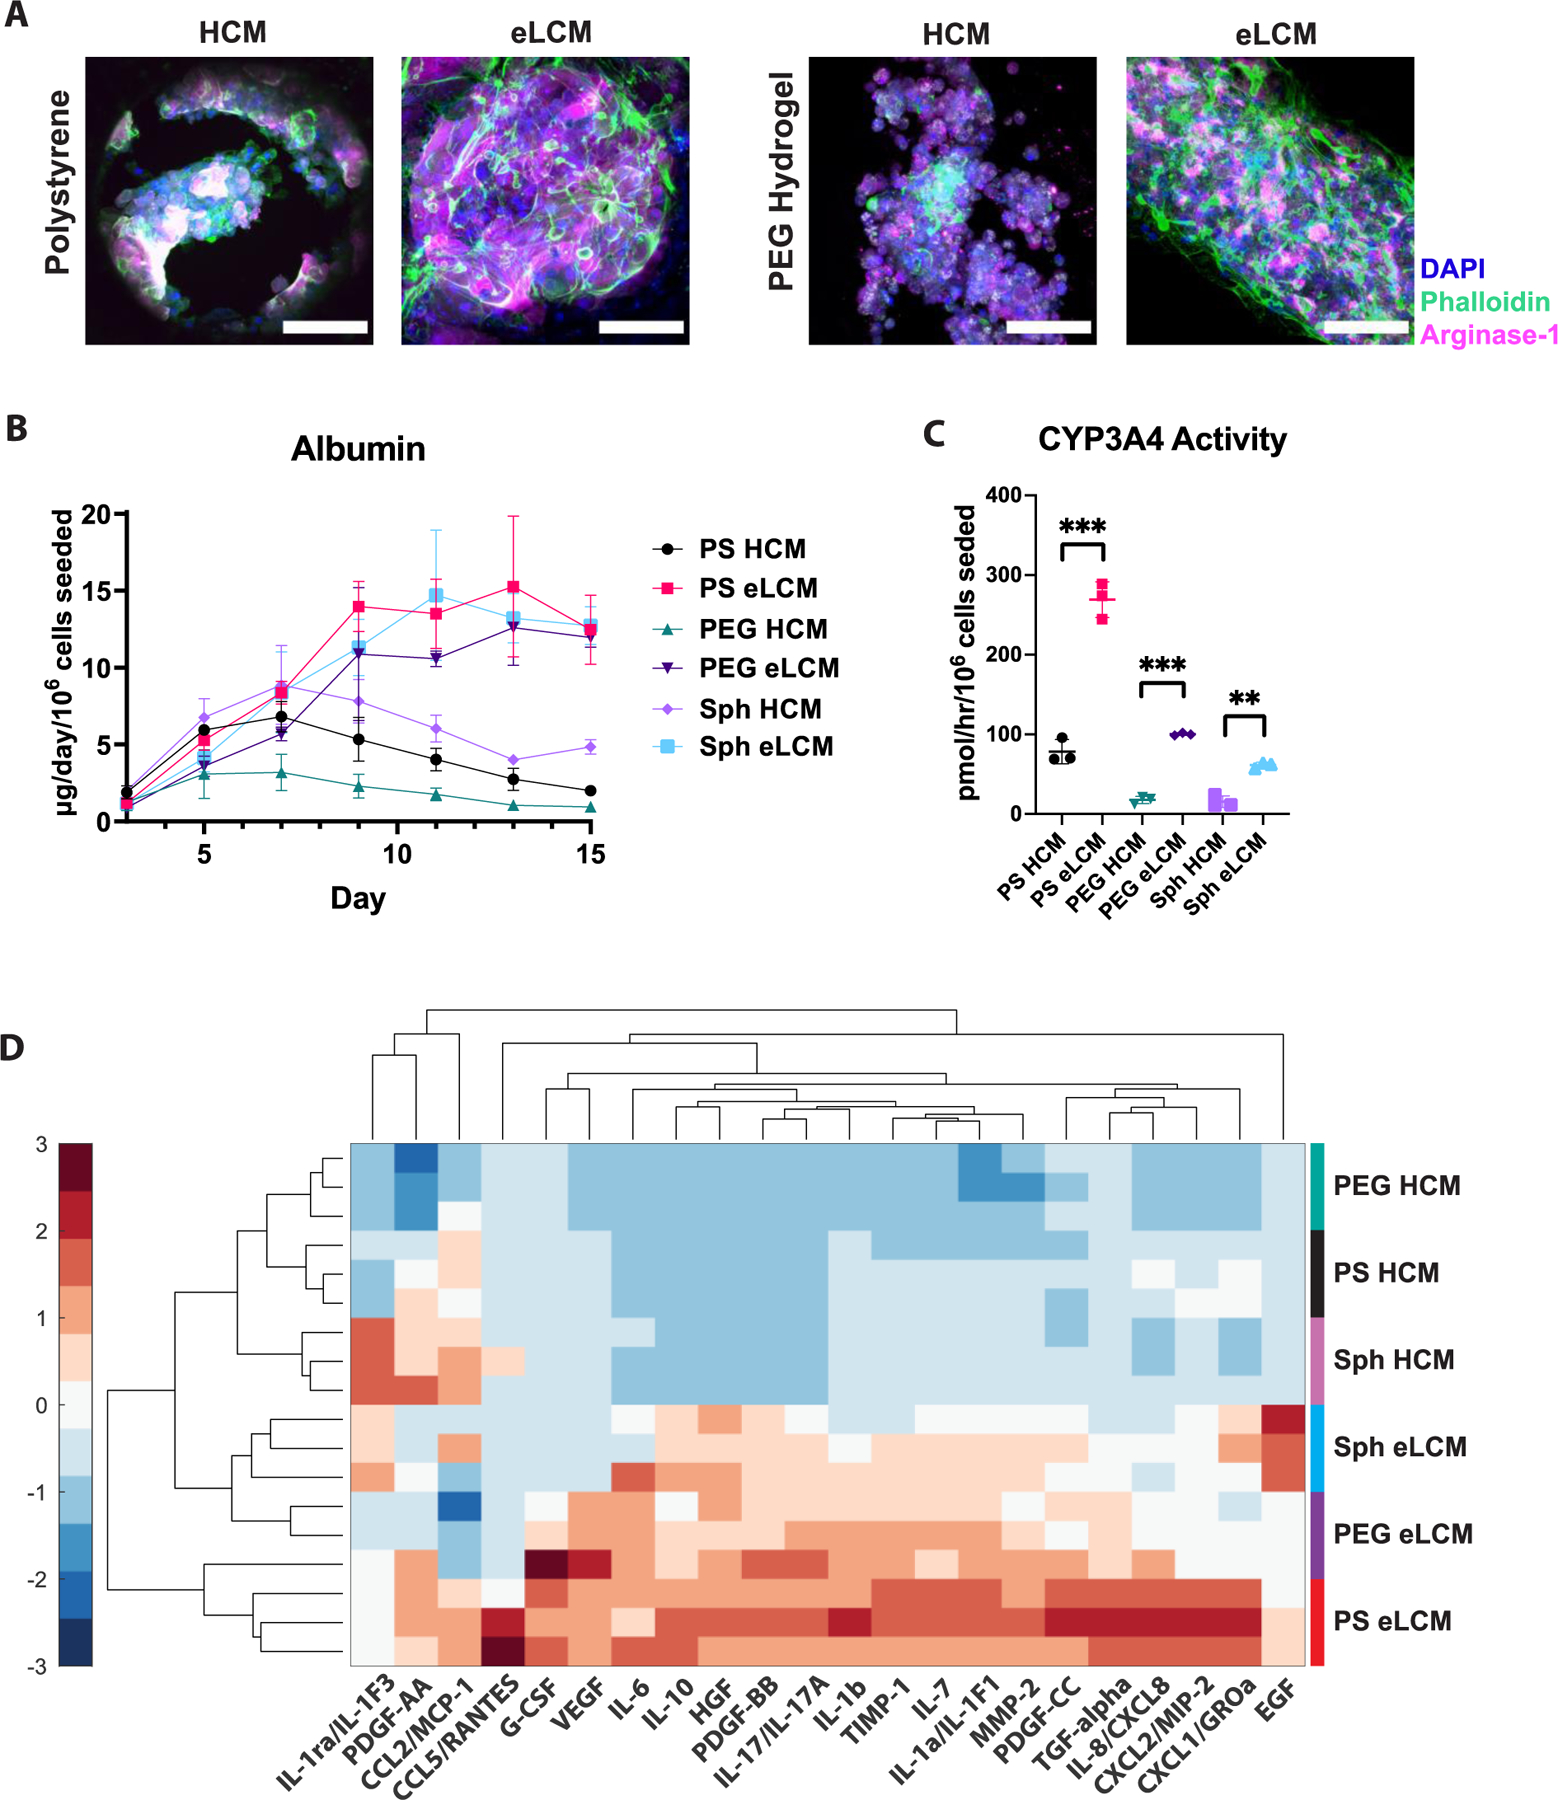
A) Z-stack projected confocal immunofluorescence (IF) images of LiverChip polystyrene (left) and PEG (right) hydrogel scaffolds in the absence or presence of growth factors and small molecules (hepatocyte culture medium (HCM) and enhanced liver culture medium (eLCM), respectively) stained for nuclei (DAPI, blue), F-actin (phalloidin, green), and arginase-1 (magenta). Scale bar = 100μm. B) Albumin timecourse comparison in Liverchip polystyrene (PS), PEG hydrogel scaffolds, and spheroids (Sph) in the absence (HCM) or presence of growth factors and small molecules (eLCM). C) CYP3A4 comparison of PS, PEG, Sph conditions with HCM or eLCM. **p<0.01, ***p<0.001, N=3 for all graphs. D) Heatmap of hepatocyte-secreted cytokines/chemokines/growth factors (C/C/GF) with different scaffolds and media culture conditions (rows), grouped together by hierarchical clustering. C/C/GF concentrations are z-scored across conditions (columns). N=3 for each condition, with colored vertical bars right of the heatmap showing the groupings.
2.5. Assessing Scaffold Influence on Inflammatory Phenotypes Induced by Growth-Factor Supplemented Media
The canonical metrics of albumin production and CYP450 activity offer only coarse-grain insights into liver function. We anticipated that the biophysical environment of the culture format may also regulate basal production of inflammatory markers (cytokines/chemokines/growth factors “C/C/GF”), due to differential cell-matrix interactions regulated at least in part through the YAP/TAZ mechanotransduction pathway. YAP and TAZ transcriptional regulators typically remain sequestered in the cytoplasm until activating signals, including mechanotransductive stimuli, translocate these proteins into the nucleus to activate downstream pathways related to inflammation and regeneration, with stiffer matrices typically inducing more pro-inflammatory phenotypes.[94] As spheroids in alginate have no cell-adhesive surfaces, there is theoretically little external mechanotransductory sensing, though it is possible that cell-produced ECM may create a mechanotransducing microenvironment. We hypothesized that the relatively soft PEG scaffolds would elicit cell phenotypes between scaffold-free spheroids and stiff polystyrene, starting at a lower baseline inflammation similar to spheroids but providing a permissive environment to respond more robustly to inflammation cues due to their ability to strongly signal through YAP/TAZ (Fig S3A). We thus measured a panel of 22 C/C/GF using the multiplexed magnetic-bead Luminex platform on day 11 of culture, comparing PS, PEG, and spheroid platforms cultured with base hepatocyte culture media (HCM) or enhanced liver culture media with growth factors and small molecules (eLCM).
When conditions and growth factors were hierarchically clustered together in a heatmap (Figure 4D), each HCM and eLCM condition clustered together, with different scaffold conditions showing distinct inflammatory signatures that were also apparent using principal component analysis (PCA) (Figure S5A-B). Several C/C/GF, including MMP-2, TIMP-1, and IL-7, were significantly upregulated from HCM media in all scaffold conditions, with polystyrene as the most upregulated condition, followed by PEG and spheroids (Figure S5C). Notably, several other C/C/GFs do not show this trend. For example, IL-10, typically categorized as an anti-inflammatory cytokine, shows an approximately equal increase for PEG and spheroids, MCP-1 chemokine slightly decreases with eLCM except for polystyrene, and PDGF-AA significantly increases only for PEG scaffolds. IL-1ra, which in HCM media conditions is highest in spheroids, shows a PS>PEG>Sph pattern with eLCM. Taken together, these data show that PS, PEG, and spheroids exhibit distinct inflammation upregulation patterns. In addition, these non-linear responses indicate that these phenotypic differences cannot be solely attributed to differences in tissue volume or viability between each culture condition. This is further supported by the differential scaffold responses as well as the RNA-Seq data in the following sections.
2.6. Assessment of Differential Scaffold Response Indicates Fundamental Differences in Inflammatory State Due to Yap Nuclear Localization
Whereas comparisons of absolute concentrations of C/C/GF between scaffold conditions provides some insights into HCM and eLCM modulation of inflammatory phenotypes, comparison on the basis of fold change differences between eLCM and HCM conditions within each culture scaffold condition reinforces that production of C/C/GF is regulated in part by the biophysical microenvironment (Figure 5A). The eLCM medium elicited the greatest fold-change increase above HCM for the PEG scaffold condition, while spheroids exhibited the least amount of stimulatory effect from media. This separation was apparent in PCA space, with a highly distinct cytokine upregulation signature for PEG (Fig S6A-B). Several inflammation-associated C/C/GF, including IL-6, IL-8, IL-10, VEGF, MMP-2, and TIMP-1 showed the highest upregulation in PEG (Figure 5B). There were still C/C/GF that had a higher response in polystyrene, such as in PDGF-CC and others where all conditions were equally upregulated, such as CXCL1. Interestingly, EGF, which is added to the eLCM as a supplement, was depleted more robustly in PEG scaffold culture than in other conditions, being reduced from the nominal 5ng/mL to about ~0.9ng/mL, compared to spheroids (4.4ng/mL) and polystyrene (2ng/mL) (Table S1). The combined fold-change and absolute measurement of the cytokine data indicated that the PEG scaffold, while having the lowest basal “inflammatory signature” (Figure 4D), was the most responsive to cues in the eLCM.
Figure 5. C/C/GF Reveals Inflammation Differences Correlating to the Degree of YAP Nuclear Localization in Platform Responses to eLCM Media.
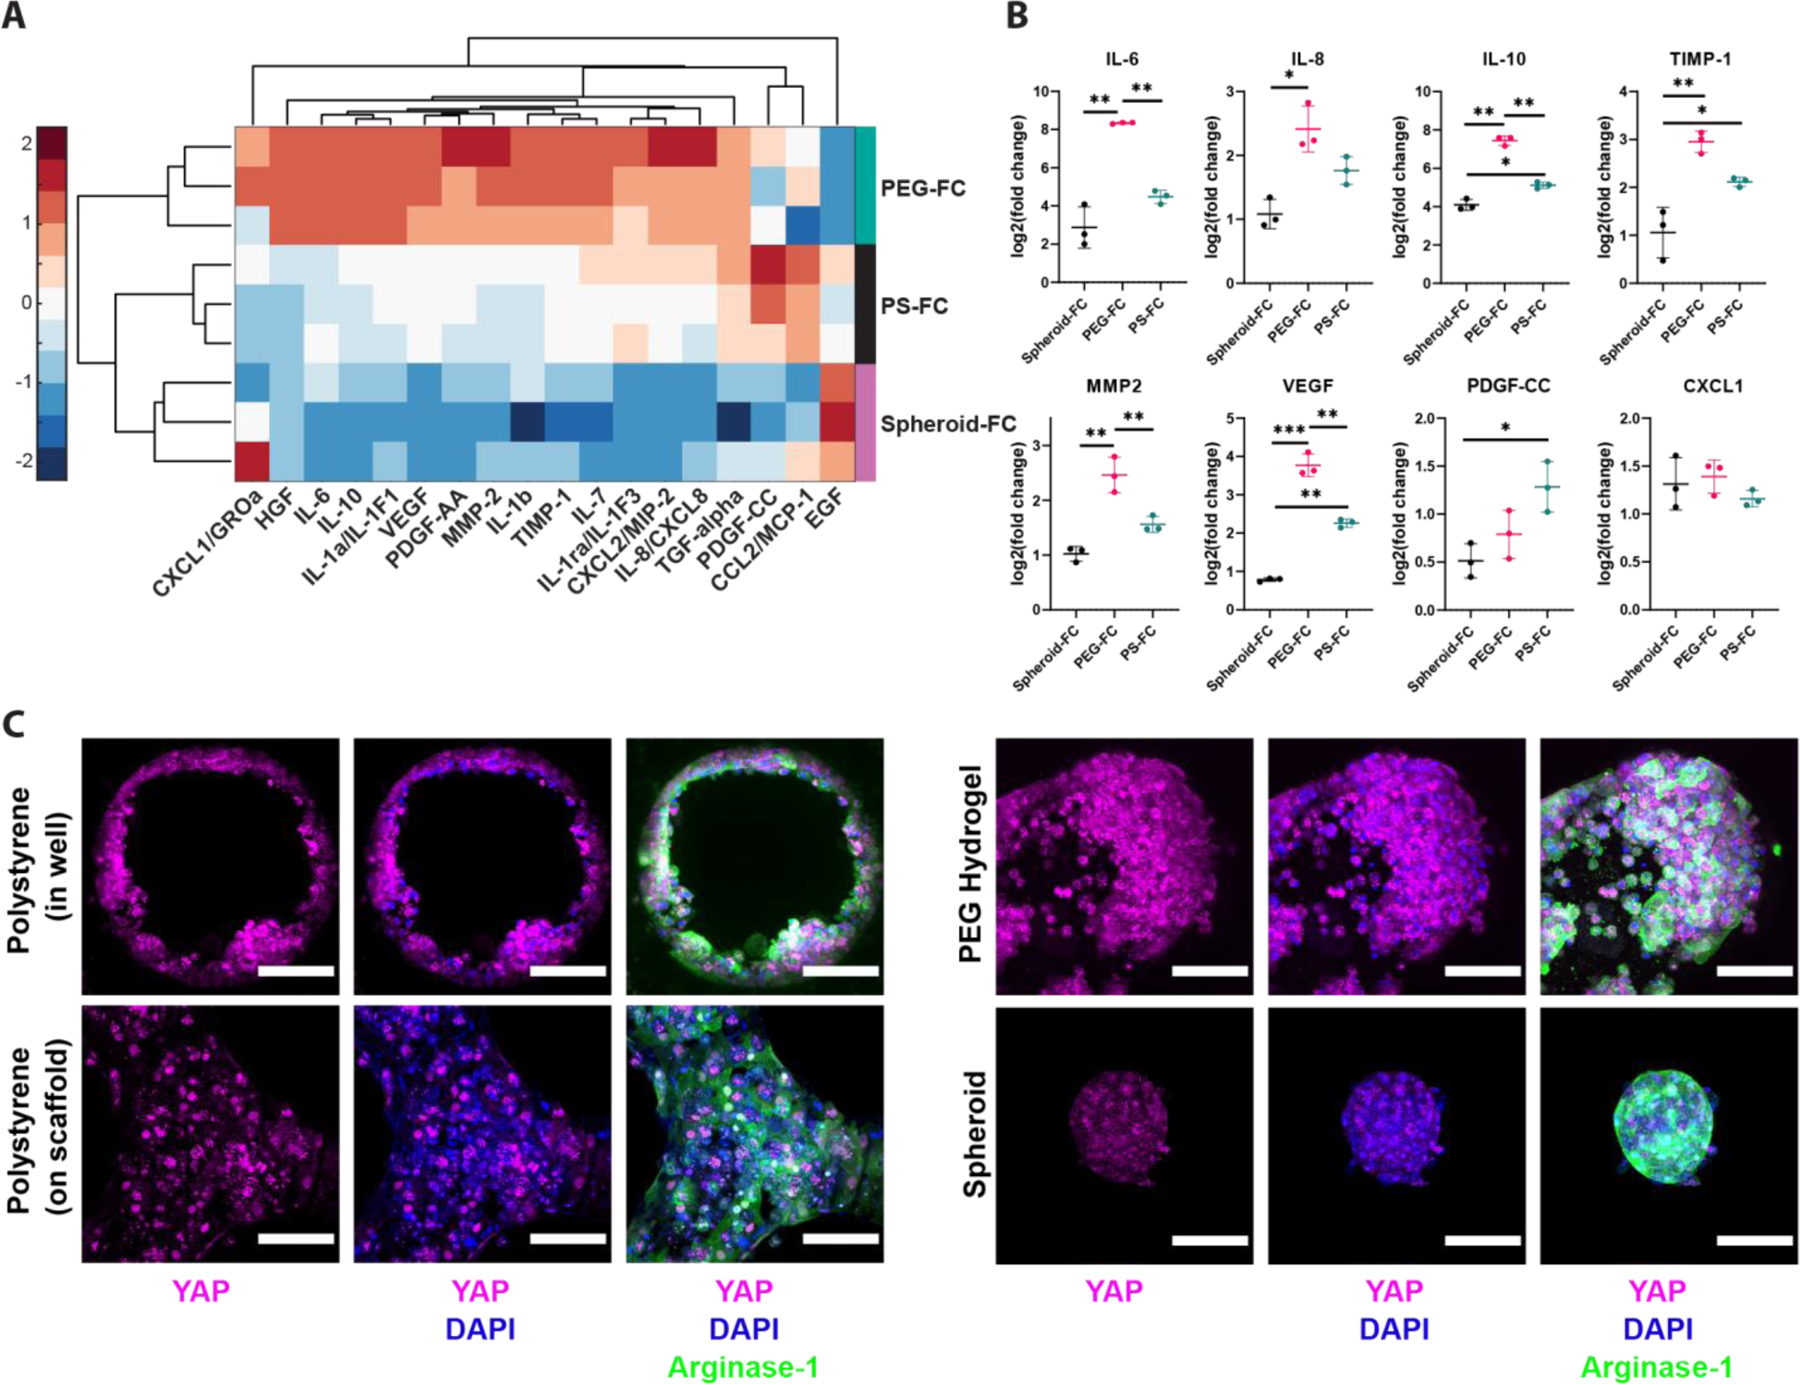
A) Heatmap of cytokine/chemokine/growth factor (C/C/GF) fold changes (FCs) based on polystyrene, PEG, and spheroid cultured with enhanced liver culture medium (eLCM) normalized to the average of their regular hepatocyte culture medium (HCM) condition. N=3 replicates per condition. Vertical bars to the right of the heatmap show culture condition groups. Log2(Fold Change (FC)) values were z-scored across conditions to better visualize contrasts between conditions. B) Selected individual log2(FC) plots showing differential responses of C/C/GF secretion as a function of the culture condition. *p<0.05, **p<0.01, ***p<0.001, N=3 all graphs. C) Z-stack projected immunofluorescence (IF) imaging of YAP (magenta), nuclei (DAPI, blue), and cytoplasm (Arginase-1, green) in HCM media. Left: hepatocytes in polystyrene scaffolds in LiverChip both inside perfused channels (top) and the interstitial space between channels on top of the scaffold (bottom). Right: hepatocytes in PEG scaffolds (top) and as spheroids (bottom). YAP nuclear localization is most apparent in cells on top of the polystyrene scaffold.
These disparate outcomes in different biophysical environments implicated YAP/TAZ mechanotransduction as a mechanistic regulator. Hence, we performed IF staining for YAP nuclear localization in each culture scaffold at baseline in HCM (Figure 5C). There was significant spatial heterogeneity in polystyrene cultures, as hepatocytes on top of the scaffold were directly contacting a large area of polystyrene, and thus had high observed nuclear YAP, while hepatocytes directly inside perfused circular channels had a mosaic of yap distribution that was not as strongly nuclear-localized. We also saw YAP in the nuclei of PEG scaffolds, but there was much more cytoplasmic 3D area with diffuse YAP signal, while spheroids stained weakly for YAP and did not show signs of apparent nuclear localization. Imaging of YAP in scaffolds cultured with eLCM media showed brighter overall YAP signal in all platforms, but similar trends across scaffolds (Figure S6C). Taken together, the multiplexed cytokine measurements and YAP imaging showed the fundamental differences in response between polystyrene, PEG, and spheroid scaffold microenvironments, and indicated that the biophysical features of PEG foster relatively greater cell responsiveness to alterations in the biochemical microenvironment. Such greater responsiveness to the biochemical environment might be valuable in applications involving nuanced changes that would be masked otherwise.
2.7. RNA-Seq Analysis of Scaffold Response to Media Shows Unique Scaffold Pathway Enrichments
To illuminate additional features of the interplay between the biophysical microenvironment and the response to eLCM media, we performed bulk RNA-seq on PS, PEG, and spheroid cultures. In PCA space, eLCM conditions were closer together than the HCM conditions, with the media stimulus appearing to separate along PC2 (Figure 6A). Culture format (bioreactor vs. spheroids) was distinguished along PC1, and stimulated conditions separated most distinctly on PC3, which still explained a relatively significant 11.9% variance, incorporating the expression of 10,806 protein-coding transcripts with >1cpm across all samples (Figure S7A). Volcano plots of differentially expressed genes (DEGs) for each eLCM culture compared to the corresponding HCM culture showed distinct sets of up and down-regulated DEGs in each platform (Figure 6B). For both polystyrene and PEG, fibrinogen genes (FG-A,B,C) were highly upregulated. Acute phase C-reactive protein and serum amyloid A1, A2 were among the most upregulated DEGs in the polystyrene scaffold condition, while a variety of metabolic enzyme genes (CYP2C9, 2C8, 2A6, UGT1A1) were prominent in the PEG scaffold condition. Spheroids showed an increase in matrix secretion, notably laminin (LAMB1), procollagen (PLOD2), and mucin (MUC13), indicating that spheroids without scaffold cues were stimulated to secrete their own ECM.
Figure 6. RNA-Seq Reveals Transcriptional Pathway Differences in Platform Responses to eLCM Media.
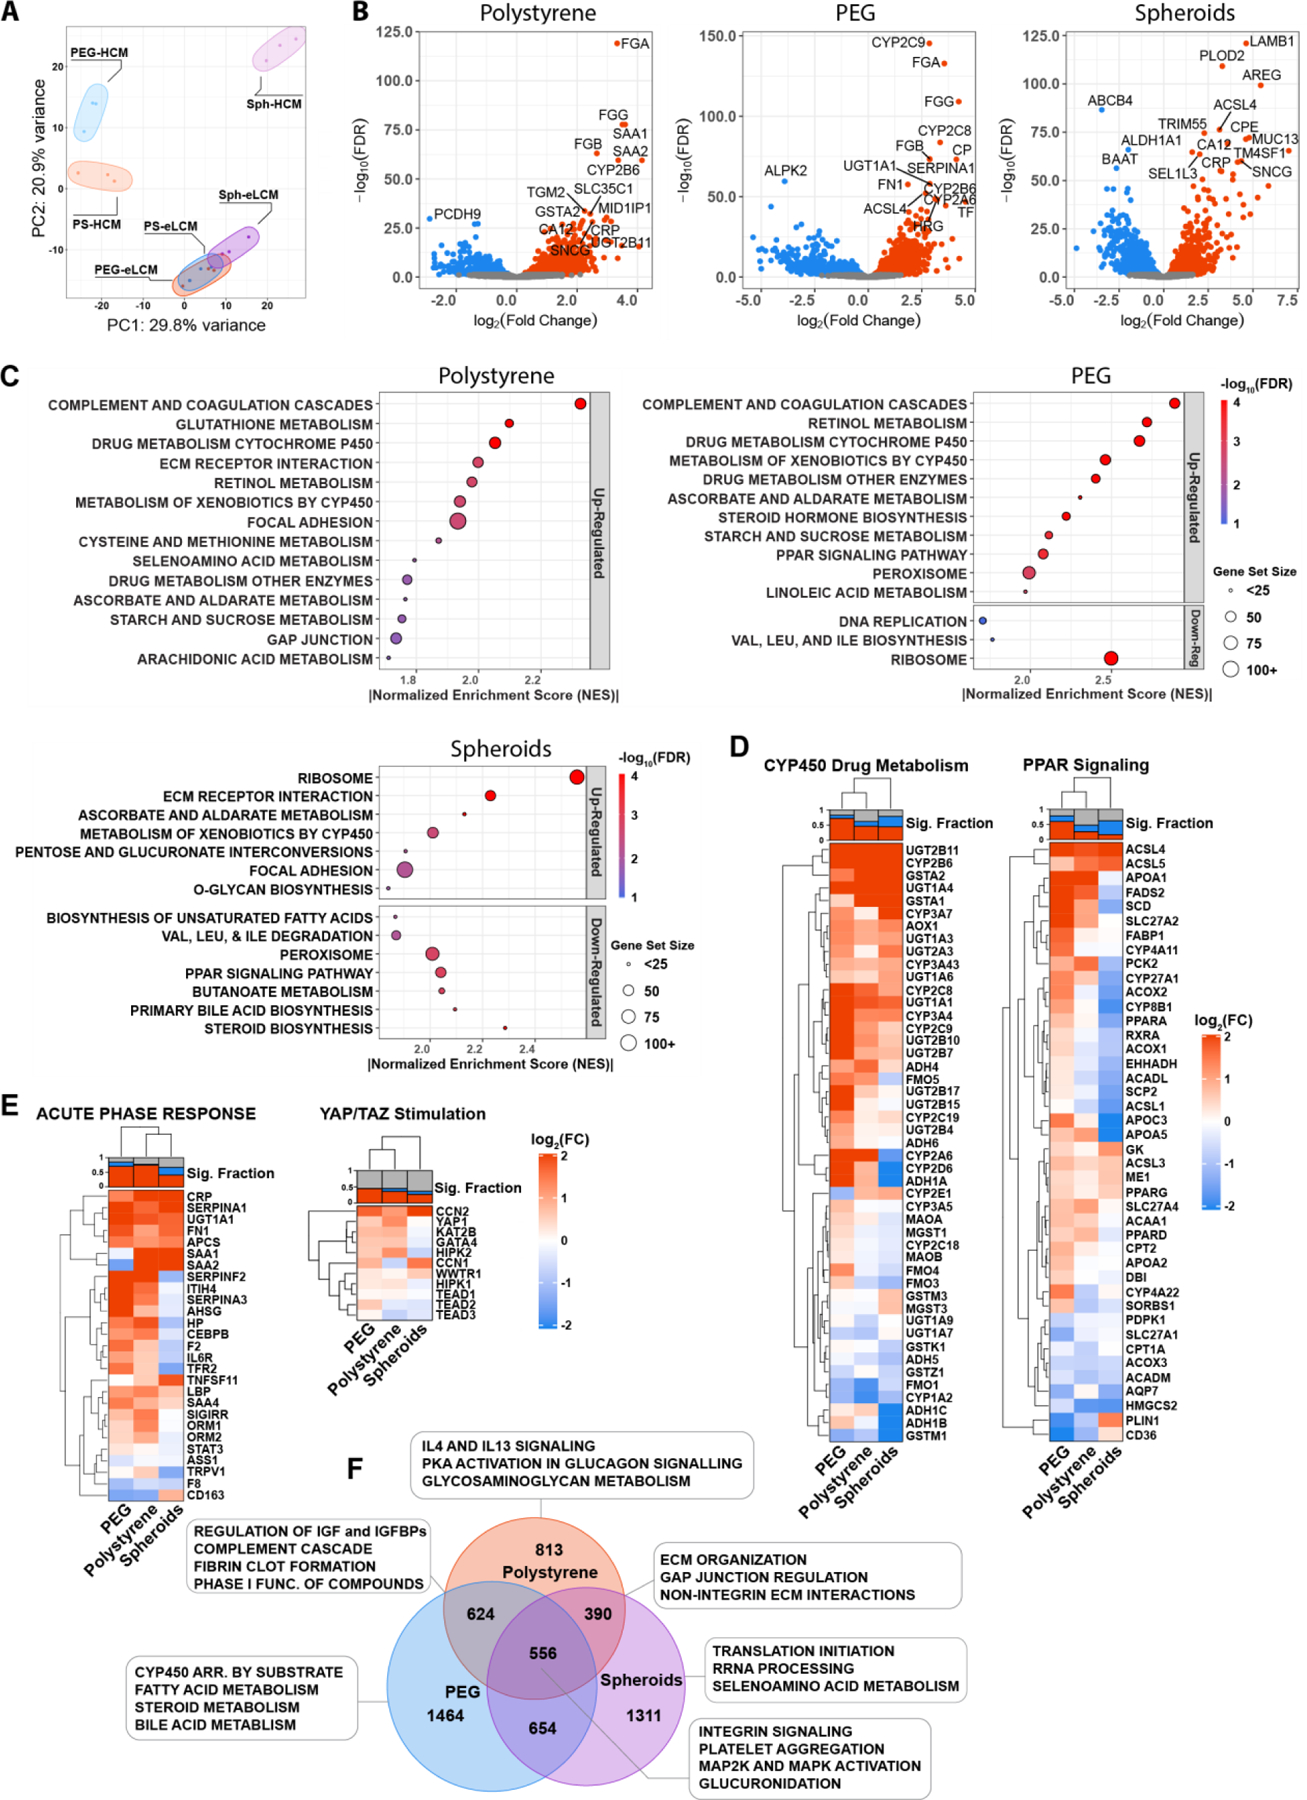
A) RNA-Seq of culture platforms cultured with HCM or eLCM plotted in principle component space (PC1 and PC2). Each colored circle contains 3 biological replicates. B) Volcano plots of polystyrene (PS), PEG, and spheroid (Sph) cultures showing differentially expressed genes (DEGs) upregulated in eLCM (red) or HCM (blue). Top 15 most significant genes are labeled. C) Gene Set Enrichment Analysis (GSEA) dot plots of PS, PEG, and Sph culture platforms upregulated in eLCM normalized to HCM, run using the curated MSigDB KEGG database. The size of each dot corresponds to the size of the gene set, and the color corresponds to the false discovery rate (FDR). D-E) Heat map of DEGs for PS, PEG, and Sph derived from gene sets using D) KEGG-GSEA and E) genes associated with acute phase response and YAP/TAZ. All DEGs are for conditions cultured in eLCM normalized to HCM. Top bar plot above each heatmap shows the fraction of significantly upregulated (red), downregulated (blue), or nonsignificant (grey) genes in each column. F) Venn diagram of unique and overlapping differentially expressed genes, with each culture platform in eLCM culture normalized to HCM culture. Boxed terms show corresponding unique and overlapping terms as determined by GSEA/MSigDB-Reactome database.
To translate these expression profiles into higher-level pathways, we used gene set enrichment analysis (GSEA) using the Molecular Signatures (MSigDB) KEGG database to examine enriched sets that were up and down-regulated when cultured with eLCM compared to HCM (Figure 6C).[95] Both polystyrene and PEG were highly enriched for complement and coagulation cascades, which included many inflammation-associated genes, as well as metabolism-associated pathways, especially cytochrome P450 drug metabolism. Notably, PEG had the most amount of highly enriched terms (normalized enrichment score > 2), including metabolic pathways and uniquely the Peroxisome Proliferator-Activated Receptor (PPAR) signaling pathway, a set of metabolic regulators that modulate lipid homeostasis and has an established association with NASH and diabetes.[19,96–98] Spheroids were most enriched in ribosomal-related proteins, as well as ECM proteins. Notably for spheroids, there were also a significant set of terms that were down-regulated, including bile acid and steroid biosynthesis and the PPAR signaling pathway. Having found these enriched terms, we then examined the corresponding gene sets as heatmaps of individual genes (Figure 6D). We again observed that PEG scaffolds had an increased number of DEGs associated with CYP450 drug metabolism, while spheroids had a larger set of downregulated genes. Notably, we saw that all scaffold conditions downregulated CYP1A2, though a broader set of CYP450s were upregulated. Additionally, PEG had the highest fraction of significantly upregulated genes associated with PPAR signaling, while spheroids had a set of significantly downregulated associated genes, including PPARα and PPARδ, despite all conditions having upregulated PPARγ.
We then examined acute phase response genes and YAP/TAZ stimulation associated genes (Figure 6E). As expected, both PEG and polystyrene had a high number of upregulated acute phase genes. Notably however, PEG did not show upregulation of SAA-1,2. YAP-associated gene upregulation appeared more complex, with both PEG and polystyrene having more upregulated genes compared to spheroids. YAP1 was most upregulated in polystyrene, while downstream CCN1 and CCN2 genes appeared to be more upregulated in PEG and spheroids. These heatmaps highlight the complexities of the downstream pathways associated with YAP, and particularly their myriad forms of control and inhibition with long term growth-factor supplemented media.[94]
We did a similar analysis comparing across platforms in eLCM media, which supported the conclusions drawn from the within-scaffold comparison, though spheroids in eLCM showed strong expression of ECM-interacting genes (Figure S7B-E). Finally, we rendered a more direct visualization of the unique and overlapping enriched terms in a Venn diagram, with the numbers showing the overlapping DEGs (Figure 6F). PEG and spheroids had thousands of unique DEGs, highlighting their distinctive platform responses. We then examined terms using the Reactome database in GSEA, which has a larger and more nuanced set of curated terms than KEGG. PEG had unique metabolic enrichment, whereas polystyrene and spheroids overlapped in ECM-associated interactions. Taken together, this transcriptomic analysis across culture conditions and media highlights the complexity of cell-matrix interactions for liver models, particularly in inflammatory response and metabolic signaling. PEG scaffolds were unique in their significant upregulation of both inflammatory and metabolic-associated pathways, while spheroids showed limitations in their ability to respond to similar cues.
3. Discussion
In this study, we engineered accessible biomaterials-based technologies to modulate the biophysical microenvironment of human liver cells cultured in 3D at the mesoscale, delineated features that enhance long-term hepatocellular function, and further investigated how these biophysical features interplay with biochemical modulation of the microenvironment. We first focused on improving technologies for mesoscale hepatic spheroid generation and culture as an accessible high-performance standard for static culture (compared to various 2D culture configurations) to use as a static culture comparison against mesoscale MPS liver platforms. As we had previously observed that primary rat hepatocytes showed superior function in an early version of the Liverchip when seeded as 3-day spheroidal aggregates compared to single cells[38], we also investigated the role of pre-aggregation on the behavior of primary cryopreserved human hepatocytes using the microwell array to form aggregates. While we observed improved 3D tissue morphogenesis in the bioreactor, it did not lead to significant improvement of canonical functional metrics (not shown), and therefore was not deemed as practical a step as simply using the spheroid platform for mesoscale comparisons.
Formation of hepatic spheroids results in physiological morphological features, including hepatocyte polarization and bile canaliculi formation.[99,100] There are extensive contacts between hepatocytes in the liver, comprising of several junction complexes and mechanotransducive proteins that play critical roles in maintaining cytochrome P450 gene expression.[101] In scaling the spheroid production, we considered oxygen diffusion to the spheroids as a major design criterion in the spacing of the spheroids in the microwell array. Hepatocytes can contain thousands of mitochondria per cell, and inadequate oxygenation and nutrient delivery drastically influence viability and functionality.[52–54] We found that combining 3D-printing technology with micromolding allowed for rapid prototyping and precise specification of mold geometry to mitigate diffusion limitations as determined via computational modeling while maximizing spheroid production in standard 24-well or 6-well plates.In adapting a synthetic PEG ECM hydrogel to form the scaffold using a peptide crosslinker, we explored the physiological parameter space of material properties, evaluating formulations with low stiffness and swelling that were also amenable to incorporation of cell-interactive peptides.[102] Polyethylene glycol (PEG) provides a highly attractive hydrogel building block due to its biocompatibility, hydrophilicity, and modularity.[103] An extensive set of chemistries can add to the functionality of the PEG macromer, from pH-modulated Michael addition to light-initiated step-growth polymerization that enhance the utility and characterizability of these systems for 3D cell culture.[42,67,79,103–105] In particular, hydrogel stiffness has been investigated for decades for its influence on cellular behavior, including the formation of focal adhesions, differentiation, and inflammatory response.[106–109] Studies have shown that liver cells alter their phenotype and gene expression over a range of physiological stiffnesses.[73,110–116] While it is difficult to decouple stiffness from other hydrogel properties such as porosity, nanoscale ligand density, and swelling, many phenotypic behaviors correlate with ECM stiffness in ways that motivate using it as a metric here. We explored the physiological parameter space of material properties, evaluating formulations with low stiffness and swelling that were also amenable to the incorporation of cell-interactive peptides. Interestingly, hepatocyte attachment in a 2D screening assay appeared to be locally optimal in our formula space using fibronectin mimic PHSRN-K-RGD rather than collagen mimic GFOGER, a surprising finding given the propensity of hepatocytes to attach to a variety of Type I collagen substrates. This outcome may arise from biophysical gel properties, such as hydrophobicity, related to our particular peptide-based crosslinker.[104] Hepatocyte attachment to the synthetic ECM hydrogel in the screening assay was reduced compared to attachment on collagen, with attached cells attaining a more rounded morphology. While this morphology has favorable implications for retaining quiescence, compared to polystyrene, it also appears to contribute to cell loss under perfusion conditions. Whether the cell loss offsets the benefits of the mechanically compliant microenvironment depend on the application in a user-defined manner. Further exploration of biomaterials parameter space may yield a composition that improves cell retention while retaining other desirable features.
With the goal of both eventually incorporating NPCs and improving hepatic tissue morphology and function, we explored the effect of supplementing growth factors in our culture platforms. We found that supplementing growth factors alone improved overall tissue density and albumin secretion profiles but suppressed CYP3A4 metabolic activity, corresponding to previously observed results and in parallel with an increase in the production of inflammatory cytokines known to suppress CYP450 activity.[88–90] This reciprocal regulation of higher albumin coupled with lower CYP450 activity may not be typically reported for other in vitro platforms due to the common use of dexamethasone in most culture media, which highly suppresses the inflammatory response and stabilizes CYP3A4 expression and overall cell viability.[87,117] As inflammatory-mediated hepatic responses influence myriad outcomes of in vitro assays, including those for drug toxicity and disease models, we used physiologically-relevant hydrocortisone levels to provide a permissive environment for physiological inflammation responses.[6,10,80] To restore hepatocyte metabolic function while preserving the tissue-enhancing qualities of growth factors, we then created an enhanced liver culture medium (eLCM) that includes growth factors with small-molecule additives forskolin, a cAMP activator and inducer of liver metabolic functions[118,119], and DAPT, which inhibits the Notch pathway.[120,121] The eLCM media demonstrated the benefits of growth-factor addition, such as enhanced tissue formation and albumin secretion, while showing high metabolic activity. A potential mechanism for the inductive potential of the small molecules may be their ability to suppress nitric oxide production, which is known to inhibit P450 isoform activity and is enhanced by inflammatory cues.[88,122,123] Both cAMP activation[124] and Notch suppression[125] lower nitric oxide levels, which may contribute to raising CYP3A4 activity. However, as seen from the RNA-Seq analysis, metabolic genes were also differentially and unevenly affected on a transcriptomic scale, highlighting the multi-faceted regulatory pathways governing hepatic metabolism.
The addition of small molecules combined with the growth factor media may be considered a strategy to reestablish tissue morphology and canonical functions in vitro, overcoming the artificially stressed and metabolically disrupted state of isolated and cryopreserved primary human hepatocytes.[2] We sought to more fully characterize media response in the context of each scaffold culture condition. While we observed no significant differences from the addition of small molecules compared to growth factors alone, more in-depth studies would be needed to characterize the phenotype of eLCM hepatocytes in various contexts. We investigated the interplay between 3D culture formats and culture medium cues on phenotypic behaviors (albumin production and CYP450 activity), probing outcomes mechanistically using a combination of multiplex cytokine analysis, analysis of YAP nuclear localization and RNA-Seq.[13,44–46] Notably, we saw the highest amount of inflammation-associated C/C/GFs in polystyrene scaffolds, followed by PEG and then spheroids. However, the fold change response from non-inflamed to the inflamed state was highest in PEG scaffolds. Meanwhile, spheroids were not as responsive despite starting from a similar low inflammation state in HCM media compared to PEG. In our observation of YAP nuclear localization, we observed a higher degree of nuclear YAP in hepatocytes on top of the polystyrene scaffolds, primarily due to the high available surface area of stiff polystyrene in-between the flow channels that promoted attachment and spreading.
RNA-Seq analysis of the culture conditions and their response to media further revealed specific gene and pathway differences and were consistent with scaffold differences in cytokine production and YAP cellular localization measured at the protein level. We saw several unique enriched pathways in the PEG scaffold corresponding to metabolic upregulation. These metabolic changes included enrichment of PPAR signaling, which indicated changes to lipid metabolism due to media.[96] Of note is that most standard culture media are enriched with supraphysiological levels of nutrients, including glucose and insulin, which may exacerbate inflammatory or “diabetic” phenotypes. Future development of such disease models will require the further development and characterization of productive media with more physiological ranges for glucose and insulin.[126,127] Examining YAP/TAZ-associated stimulation on the pathway level revealed a more complex picture of activation, with polystyrene having the highest YAP1 upregulation but the downstream genes CCN1 and CCN2 were slightly more upregulated in PEG and spheroids. As upregulation indicates a response range, this may be due to the already high basal upregulation of these genes in the HCM polystyrene culture state. Because YAP/TAZ is at the nexus of Hippo, Wnt, Notch, TGFβ, and many other pathways, it can be challenging to assess in complex 3D models.[94,128,129] It has been demonstrated that liver organoids grown in synthetic matrices are highly sensitive to a range of physiological stiffnesses related to the activation of YAP, indicating that control of this pathway may have implications in their maturation and function.[115,130] Evolving technologies such as spatial and single-cell transcriptomics may better illuminate these dynamic and heterogeneous phenotypes in future studies.
The accessible technologies developed in this investigation provide a basis for future studies of more complex disease and culture models. For example, spheroids and PEG scaffolds may be employed to study inflammatory-associated diseases such as NASH or diabetic liver, which has previously been challenging to investigate due to the supraphysiological concentration of glucose and insulin in standard media that can alter basal hepatic phenotype and metabolism.[19,20,127,131] NASH in particular adopts an inflammatory phenotype that may be more accurately modeled and characterized using non-inflammatory scaffold strategies, as it has proven to be a challenging phenotype to fully capitulate with current in vitro methodologies, though more recent 3D models show much more promise than 2D systems.[18,64,132–137] However, there is a potential for additional systems-level insights provided by mesoscale 3D liver technologies that allow larger differentiation between basal, healthy states and highly inflamed disease states.
The eLCM supplemented culture media not only has uses in long-term culture but may also be useful in short-term establishment of tissue from the initial seeding stage. Additionally, the formulation may be tailored to incorporate multiple cell types, as endothelial, stromal, and immune cells all play a crucial role in establishing the physiological liver phenotype but are challenging to incorporate with hepatocytes for extended periods with current serum-free, defined media formulations. The timing of the small molecules should be optimized by desired phenotype, such as using forskolin to enhance hepatic metabolism when necessary, while DAPT may be selectively used prevent dedifferentiation or over-growth of certain stromal cell types that rely on the Notch pathway.[138] However, since Notch is implicated in NASH phenotypes, including lipid accumulation and fibrosis, DAPT would most likely need to be withdrawn after the establishment of functional tissue to induce a stronger response.[139,140] The additional incorporation of NPCs along with conditions of physiological or high glucose, insulin, and free fatty acid (FFA) supplemented media would allow us to differentiate functional markers of insulin clearance, glucose uptake, inflammatory response, and transcriptomics in a disease model of NASH / diabetes. Taken together, we envision the utility of these technologies as modular platforms for the establishment of functional tissue with robust inflammatory response potential. This study provides tools, engineering principles, and phenotypic responses currently lacking in other accessible models. The combination of media and scaffold technologies developed in this work will help enable the future development of mesoscale perfused liver models incorporating multiple cell types to potentially capture a wider and more accurate range of physiologically relevant responses.
4. Methods
3D-Printing of Microwells:
The microwell design and patterning was done using Solidworks (Dassault Systems). The 6-well design contains ~3000 microwells and the 24-well design contains ~600 microwells. The CAD file was then used to create a 3D print using MicroFine Green resin (Protolabs). An aluminum base was manufactured by CNC machining (Protolabs) to accommodate multiple 3D printed molds. 3D printed molds were glued onto the aluminum base to create the master mold. Sylgard 184 (Dow Corning) was mixed in a 10:1 base to curing ratio, degassed, and poured onto the master mold. The master mold was degassed further, with manual pipetting to remove small bubbles trapped in the wells. The PDMS was cured overnight at 60°C and autoclaved. Immediately before alginate molding, PDMS reverse molds were plasma treated (Harrick Plasma Cleaner) for 90s and submerged in water to preserve hydrophilicity.
Alginate Molding:
Pronova Ultrapure MVG alginate (Novamatrix) was diluted to a 2.5wt/wt% solution in UltraSaline A (Lonza) and mixed continuously on a shaker for several hours until fully dissolved. Alginate, PDMS reverse molds in water, 90mm Durapore PVDF 22µm pore size filter (Sigma), and 6000–8000 MWCO cellulose dialysis tubing (Fisher 211526) were autoclaved and placed in a tissue culture hood. PDMS molds were removed from water, dried using an aspirator, and then placed in a 150mm culture dish (Corning). 800µL (6-well) or 400µL (24-well) alginate was pipetted using a wide pore tip into the PDMS molds, using a smaller tip to puncture bubbles. The PVDF filter was laid on top of the molds, followed by the dialysis membrane. A 60mm culture dish was used to fully flatten the membrane. 60mM calcium chloride solution in water was added on top of the membrane such that there was full coverage, followed by weighing down of the membrane by the culture dish. After 4 hours, the 60mm culture dish and dialysis membrane were removed and additional calcium chloride solution was added to ensure full coverage of the surface. The 150mm culture dish was then left in CaCl2 solution overnight to ensure full crosslinking. To harvest the alginate, tweezers were used to gently lift the PVDF filter. Adequately formed alginate molds were lifted from the filter using flat tipped tweezers, then placed into the appropriately sized tissue culture dish. Molds are stored in 1.8mM calcium chloride in UltraSaline A (Lonza) until use.
Hydrogel Materials:
PEG hydrogels were formed as a one-pot synthesis UV-initiated reaction. 20k MW, 8-arm PEG-Norbornene with tripentaerthyritol core (JenKem 8ARM(TP)-NB) at was mixed with the following: Peptides (Boston Open Labs): Ac-PHSRNGGGK-(Ac-GGGERCG)-GGRGDSPY-CONH2 (PHSRN-K-RGD), Ac)GGYGGGPG(GPP)5GFOGER(GPP)5GPC(Am) (GFOGER), (Ac)KKGCRE-TLQPVYEYMVGV(Am) (Fn binder), GCRE-ISAFLGIPFAEPPMGPRRFLPPEPKKP(Am) (Basement membrane binder). Photoinitiator: Lithium phenyl-2,4,6-trimethylbenzoylphosphinate (LAP) (Sigma Aldrich). Crosslinker: (Ac)GCRE-LPRTG-GERCG(Am) (LG) crosslinker (Boston Open Labs) or 2k MW, 2-arm PEG-dithiol (Creative PEGWorks). Peptide components were dissolved in water then sterile-filtered. Concentration was determined using Ellman’s assay (ThermoFisher 22582) to measure the concentration of cysteine thiols in solution. The remainder of the gel mix contained 10X PBS (Invitrogen AM9624) diluted to 1X concentration and water. The final gel micromolded for the LiverChip contained 3.5%(w/w) PEG, 2mM PHSRN-K-RGD (nominal, not accounting for swelling), 0.1%(w/w) LAP, 1X PBS, and a 1:2 crosslinker thiol:norbornene ratio.
Hydrogel Micromolding:
A master mold was designed using SolidWorks (Dassault Systems) and machined from aluminum (MIT machine shop). PDMS (Dow Corning Sylgard 184 Elastomer Kit) was cured in the mold in the standard 10:1 base to curing ratio at 60oC for at least 24 hours. The PDMS was then rinsed in baths of trimethylamine, ethyl acetate, and acetone for 2 hours each to remove unreacted monomers.[141] Raised features in the inverse mold that formed the flow channels were metalized by first plasma-treating the surface with oxygen for 30s (AutoGlow, Glow Research), then overlaying a stainless steel mask (PCB Unlimited) and sputtering a 20nm/200nm Cr/Au layer using electron beam evaporation (AJA international). The metalized inverse molds were gently rinsed with water, dried, and air plasma treated (Harrick Plasma Cleaner) for 45s immediately before casting the PEG precursor solution. 30uL of precursor solution was added to each PDMS mold well. A polyvinylidene fluoride (PVDF) membrane filter with 5 μm pore size (Millipore SVLP04700) was laid on top of the mold, then placed under a UV lamp (PK50 Omnicure Series 2000). UV exposure was for 45s at 100mW/cm2, calibrated by an intensity meter (Dymax Corp Accu-Cal-50). Following polymerization, scaffolds were released and punched with a 3/8’’ hole punch (C.S. Osborne) and stored in 1X PBS. For microscope visualization without cells, the hydrogel scaffold was incubated with trypan blue dye for 5min and then inverted.
Human Hepatocyte Culture:
Cryopreserved human hepatocytes were purchased from Thermo Fisher (Hu8196) unless otherwise noted and cultured according to manufacturer’s recommendations. Hepatocytes were thawed with 50mL of cryopreserved hepatocyte recovery medium (Thermo Fisher), centrifuged at 100g for 8 minutes, then resuspended in warm Williams E with 5% FBS, 4 µg/ml insulin, 2 mM GlutaMax, 15 mM HEPES, and 1% penicillin–streptomycin (seeding medium supplement; Thermo Fisher) with the addition of 100nM hydrocortisone (Sigma Aldrich). Viable cells were quantified using trypan blue exclusion assay, and hepatocytes were seeded in different culture formats (LiverChip, spheroids, or 2D). After 24 hours, the medium was replaced with Williams E containing 6.25 µg/ml insulin, 6.25 µg/ml transferrin, 6.25 µg/ml selenious acid, 1.25 mg/ml bovine serum albumin, 5.25 µg/ml linoleic acid, 2 mM GlutaMax, 15 mM HEPES, and 0.5% penicillin–streptomycin (hepatocyte maintenance supplement; Thermo Fisher) and 100nM hydrocortisone (Sigma Aldrich). The medium was changed every 48 hours after the first day of culture. The medium samples were aliquoted and stored at −80°C before analysis.
Hepatocyte Seeding On Alginate Molds:
Alginate molds are rinsed several times with Williams E media, followed by incubation in hepatocyte seeding medium overnight. Before cell seeding, the mold surface is fully dried, followed by addition of a small amount of medium at the very edge of the wall to mitigate wetting effects. 400µm (6-well) or 75µL (24-well) suspended hepatocytes were added to the wells in a spiral pattern such that approximately 200 hepatocytes are in each well with even coverage. After waiting 5min for hepatocytes to fall into the wells, 24-well plates are gently centrifuged at 50g for 2min. 6-well plated alginate deformed too much with centrifugation, and thus were left sitting for 10min instead. Excess media was removed followed by addition of fresh 800µL (6-well) or 300µL (24-well) seeding media to ensure full coverage of the spheroids with a low liquid height.
LiverChip Assembly and Culture:
The LiverChip system (CN BioInnovations), a micromachined precursor platform to the current disposable PhysioMimix platform, was manually assembled by manufacturer’s recommended instructions. After assembly, wells were wetted and primed for flow with 1 wt/vol% bovine serum albumin (BSA) in phosphate buffered saline (PBS). After at least 4 hours of priming at 1 μL/s flow rate, a wide-bore pipette tip was used to remove any remaining large bubbles. The scaffolds were then placed into the channel wells and fastened with a retaining ring. The BSA solution was replaced with cell seeding medium by aspirating all media from the channels down to retaining ring level, followed by flushing of the bottom channel through addition of 400uL medium on the scaffold side and reverse pumping until the medium reached the retaining ring again. 1.4mL seeding medium was added to each channel and primed at 1 μL/s flow for at least 1hr before cell seeding. High impact polystyrene scaffolds (CN BioInnovations) were wetted in 70% EtOH, rinsed in phosphate buffered saline (PBS) (Thermo Fisher), coated with 30 μg/mL rat tail collagen type I (Gibco A1048301) for 2 hours, then dried before placing into the LiverChip. Hepatocytes were seeded using a wide-bore pipet according to manufacturer instructions. The seeding medium was replaced after 24 hours with maintenance medium followed by medium changes every other day. Each well was seeded with either 3×10⁵ rat hepatocytes or 6×10⁵ human hepatocytes in a 400uL volume. After flowing down briefly, an additional 1mL volume of seeding media was added. Flow direction was set to flow down at 1μL/s for 8hrs before reversing in direction to even the flow profile and to remove non-adhered cells.
Supplemented Culture Media:
Base hepatocyte culture medium (HCM) is comprised of Williams E containing 6.25µg/ml insulin, 6.25µg/ml transferrin, 6.25µg/ml selenious acid, 1.25mg/ml bovine serum albumin, 5.25µg/ml linoleic acid, 2mM GlutaMax, 15mM HEPES, and 0.5% penicillin–streptomycin (hepatocyte maintenance supplement; Thermo Fisher) and 100nM hydrocortisone (Sigma Aldrich). For enhanced liver culture media (eLCM), the growth factor cocktail was comprised of 5ng/mL EGF, 5ng/mL HGF, 5ng/mL FGFb, and 15ng/mL IGF-1 (Peprotech). 0.75U/mL heparin sulfate (Sigma) was added to stabilize the FGFb. Small molecules comprised of 20µM forskolin and 5µM DAPT (STEMCELL Technologies) were then added to the media. All supplemented media was added after day 1 of hepatocyte culture.
Immunofluorescence Imaging:
Scaffolds and spheroids were fixed in 4%(v/v) paraformaldehyde (Electron Microscopy Sciences) in PBS for 30minutes at 37°C. The samples were washed in PBS with 0.1M glycine followed by 24hr of blocking with a solution of PBS, 0.5%(w/v) BSA, 0.2% (v/v) Triton X-100, 0.05%(v/v) Tween-20, and 0.05%(w/v) sodium azide (IF washing solution) and 5% goat serum. Post blocking, samples were incubated overnight with primary antibodies (see Supplemental Methods, Supporting Information) in blocking solution, followed by 3X washes in IF washing solution. Secondaries (AlexFluor high cross absorbed, Thermo Fisher, 1:200 dilution) were then added for 3hr at room temperature in blocking solution, again washing with IF solution. DAPI and phalloidin in PBS were then added in specified conditions, followed by another rinse in PBS. For large tissue samples, Ce3D tissue clearing was used after initial staining to improve clarity and imaging depth.[142] Briefly, stained samples were incubated overnight in PBS with 0.2%(v/v) Triton X-100 and 0.5%(v/v) thioglycerol, followed by 24 hours of incubation in Ce3D clearing solution. Histodenz (Sigma) was dissolved at 86%(w/v) in N-methylacetamide (Sigma) melted and diluted to 40%(v/v) in PBS. 0.1%(v/v) Triton X-100 and 0.5%(v/v) thioglycerol were added to the final solution. Following staining and clearing, non-spheroid samples were placed on No.0 glass coverslips (Mattek), then held down with glass coverslips with the edges sealed with vacuum grease (Dow Corning). Spheroids were pipetted onto glass coverslips outlined with a hydrophobic barrier pen (Vector Labs), then sealed with a glass coverslip and nail polish. Samples were then imaged with a Zeiss LSM 880 confocal microscope at 25X or 20X magnification.
Albumin ELISA:
Albumin secretion in collected media supernatant was measured using a rat or human ELISA quantitation set (Bethyl laboratories). Samples were diluted according to manufacturer’s instructions to fall within the quantitation curve (approximately 1:500 for rat / 1:100 for human). 100μL of diluted sample was added along with provided albumin standards to a 96-well antibody-coated clear-bottom assay plate for 1 hr. The plate was washed 3X with Wash Buffer, then incubated with capture antibody for 1 hr. After an additional 3X washes, TMB One Component Substrate (Bethyl) was added for 10min and stopped with 0.18M H2SO4. Absorbance at 450m was measured using a SpectraMax i3x Microplate Reader (Molecular Devices). Absorbance values were quantified by 5-point logistic regression in MATLAB (modified from: Giuseppe Cardillo (2020). Five parameters logistic regression (https://github.com/dnafinder/logistic5), GitHub.) using the standard concentration curve then normalized by media volume, culture time, and initial number of cells seeded.
CYP activity assay:
CYP enzyme activity was measured using a P450-Glo kit with Luciferin-IPA substrate (Promega). The substrate was diluted 1:1000 in maintenance medium and added to hepatocytes with a complete medium change. After ~90min of incubation at 37oC, the media was collected. Standards were prepared from luciferin salt (Promega) and used to quantify the samples. 50μL of samples and standards was added along with detection reagent to a 96-well white opaque-bottom plate. The plate was covered and incubated for 20min at room temperature before reading on a SpectraMax i3x plate reader with luminescence detection cartridge (Molecular Devices). Luminescence values were quantified using the manufacturer’s recommended standard curve generated with beetle luciferin (Promega) then normalized by compound incubation time, media volume, and initial number of cells seeded.
Luminex Cytokine Measurements:
Cell supernatants were analyzed using a custom Luminex panel from R&D Systems. Samples were processed according to the manufacturer’s instructions adapted to a 384-well plate.[143] Briefly, samples were diluted by 2 and 50-fold in technical duplicates on the plate. Samples were mixed with magnetic capture beads overnight, followed by plate washing, addition of detection beads, washing, Streptavidin-PE, and final washing. Plates were run on the FLEXMAP 3D (BioRad) with parameters specified by the panel kit manufacturer. Raw MFI values were fitted to standard curves using 5-point logistic regression with xPONENT software (Luminex Corp).
Cytokine Data Analysis:
Downstream data analysis exported from xPONENT was performed using MATLAB 2020a with Bioinformatics Toolbox (MathWorks). Sample technical replicates were averaged, and the lowest dilution was generally used for all cytokines/chemokines/growth factors (C/C/GF). When the measured value exceeded the top standard curve, the lower 50-fold dilution value was used instead. No 50-fold dilution values exceeded the top standard value. When the measured value fell below the lowest standard, the concentration was linearly interpolated between the blank and the lowest standard MFI values, provided that the value was 4 standard deviations above background wells.[27,144,145] If all samples contained low values below the lowest standard, the cytokine was excluded from further analysis. For heatmap visualization and principal component analysis, C/C/GFs were z-scored across samples. Hierarchical clustering was done using Euclidean distance. For fold change samples, non-stimulated C/C/GFs with very low expression (>50% of samples below the lowest standard or any sample measuring 0 concentration) were removed from the analysis. For principal component plots, error ellipses were drawn using the error ellipse function (AJ Johnson (2020). error_ellipse, MATLAB Central File Exchange).
RNA Extraction and Processing:
Before extraction, PEG scaffold samples were dissolved with 25µM sortase pentamutant + 18mM GGG added to HCM for 5min.[67,146] Cells were pelleted to the bottom of centrifugation tubes at 50g for 2min before removing the supernatant. Polystyrene samples were directly removed from the bioreactor and placed in collection tubes. Alginate microwells were dissolved with AlgiMatrix dissolving buffer (ThermoFisher), and the cell pellet was centrifuged at 50g for 2min, washed with sodium citrate solution, and spun down a second time to ensure full removal of alginate. Samples were then submerged in Tri-Reagent (Zymo Research) and lysed using 0.1mm zirconium beads with the BeadBug homogenizer (Benchmark Scientific) for 3×10s. The samples were then extracted using the Direct-Zol RNA microprep kit (Zymo Research) according to manufacturer’s instructions and checked for concentration and quality on NanoDrop. Samples were stored at −80oC. Total RNA was then analyzed and quantified using the Fragment Analyzer (Advanced Analytical), and Illumina libraries were prepared with SMARTer Stranded Total RNA-Seq Kit v2 - Pico Input Mammalian (Takara Bio). The resulting libraries were quantified using the Fragment Analyzer and qPCR before being sequenced using an Illumina HiSeq 2000 (Illumina). 40–50 nt single-end reads with an average depth of 15–20 million or 5 million reads per sample were sequenced.
RNA-seq Data Analysis:
Reads were aligned against Ensembl GRCh38.p13 annotation using STAR v2.7[147] and gene expression was then quantitated using RSEM v. 1.3[148] based on parameters specified in Trapecar et al.[149] Transcript abundances were pooled into gene-level estimates using tximport.[150] Count data was filtered for chromosomal protein-coding genes with abundance greater or equal to 3 counts per million in all samples and replicates. Regularized log (rlog) transformation and differential gene analysis of count data was performed using DESeq2 in R.[151] The rlog-transformed data was used to visualize samples in PCA space. For differentially expressed genes, read counts across conditions were modeled based on a negative binomial distribution and a Wald test was used to test for differential expression. Fold-changes, p-values and Benjamin-Hochberg-adjusted p-values (BH) were reported for each protein-coding gene. Sequences and counts are stored under: GSE166256.
Gene Set Enrichment Analysis[95]:
GSEA v4.1 was run on results from DESeq2 using “stat” (Wald’s test value) column to pre-rank genes with 1000 permutations. Gene sets with nominal p-value <0.05 and q-value <0.1 were considered significant. GSEA was run on the curated KEGG database from MSigDB for the dot plots, and the curated Reactome database for the Venn diagram. To select genes from the heatmap, gene set lists were downloaded from the MSigDB database and trimmed so only have significant DEGs for at least one condition. Heatmaps were generated using Complex Heatmap[152] while other plots were generated using ggplot[153] and ggforce (https://github.com/thomasp85/ggforce) in R. The Venn diagram was created based using BioVenn.[154] Full code to generate data from the RNA-Seq analysis in this paper can be found at: https://github.com/ajwang3/WangHydrogel-RNASeq
Statistical Analysis:
Statistical significance was assessed using one-way ANOVA with Tukey’s multiple hypothesis correction in GraphPad Prism 8.4. The mean of each sample was compared to the mean of every other sample in each graph. Summary data are presented as mean +/− SD. N≥3 for all tested conditions. *p<0.05, **p<0.01, ***p<0.001
Supplementary Material
Acknowledgements
We thank members of the Griffith and Lauffenburger labs, as well as Amanda Clark, Alan Wells, and Donna Stoltz from the University of Pittsburgh for helpful discussions. We also thank Christine Ivashchenko for additional feedback on the manuscript.
This work was supported by funding from NIH R01EB010246, NIH UH2TR000496, NIH T32GM008334, NIH T32ES007020, Amgen, the DARPA Microphysiological Systems Program (W911NF-12–2-0039), NSF CBET-0939511 and the MIT Center for Environmental Health Sciences (NIH P30-ES002109). We thank the MIT UROP office for financial support to A.A., and the Koch Institute Swanson Biotechnology Center and the MIT BioMicro Center for use of core facilities.
Footnotes
Supporting Information
Supporting Information is available from the Wiley Online Library or from the author.
Conflicts of Interest
The authors declare no conflicts of interest.
Contributor Information
Alex J Wang, Biological Engineering Department, Massachusetts Institute of Technology, 77 Massachusetts Avenue, Cambridge, MA, 02139, USA.
Allysa Allen, Biological Engineering Department, Massachusetts Institute of Technology, 77 Massachusetts Avenue, Cambridge, MA, 02139, USA.
Marianna Sofman, Biological Engineering Department, Massachusetts Institute of Technology, 77 Massachusetts Avenue, Cambridge, MA, 02139, USA.
Pierre Sphabmixay, Mechanical Engineering Department, Massachusetts Institute of Technology, 77 Massachusetts Avenue, Cambridge, MA, 02139, USA; Whitehead Institute for Biomedical Research, 455 Main Street, Cambridge, MA, 02142, USA.
Ece Yildiz, Biological Engineering Department, Massachusetts Institute of Technology, 77 Massachusetts Avenue, Cambridge, MA, 02139, USA; Institute of Bioengineering, School of Life Science, École Polytechnique Fédérale de Lausanne, Route Cantonale, 1015 Lausanne, Switzerland.
Linda G. Griffith, Biological Engineering Department, Massachusetts Institute of Technology, 77 Massachusetts Avenue, Cambridge, MA, 02139, USA; Center for Gynepathology Research, Massachusetts Institute of Technology, 77 Massachusetts Avenue, Cambridge, MA, 02139, USA.
References
- [1].Arias IM, Alter HJ, Boyer JL, Cohen DE, Shafritz DA, Thorgeirsson SS, Wolkoff AW, Eds., The Liver: Biology and Pathobiology, 6th ed., Wiley, 2020. [Google Scholar]
- [2].Godoy P, Hewitt NJ, Albrecht U, Andersen ME, Ansari N, Bhattacharya S, Bode JG, Bolleyn J, Borner C, Böttger J, Braeuning A, Budinsky R. a., Burkhardt B, Cameron NR, Camussi G, Cho CS, Choi YJ, Craig Rowlands J, Dahmen U, Damm G, Dirsch O, Donato MT, Dong J, Dooley S, Drasdo D, Eakins R, Ferreira KS, Fonsato V, Fraczek J, Gebhardt R, Gibson A, Glanemann M, Goldring CEP, Gómez-Lechón MJ, Groothuis GMM, Gustavsson L, Guyot C, Hallifax D, Hammad S, Hayward A, Häussinger D, Hellerbrand C, Hewitt P, Hoehme S, Holzhütter HG, Houston JB, Hrach J, Ito K, Jaeschke H, Keitel V, Kelm JM, Kevin Park B, Kordes C, Kullak-Ublick G. a., Lecluyse EL, Lu P, Luebke-Wheeler J, Lutz A, Maltman DJ, Matz-Soja M, McMullen P, Merfort I, Messner S, Meyer C, Mwinyi J, Naisbitt DJ, Nussler AK, Olinga P, Pampaloni F, Pi J, Pluta L, Przyborski S. a., Ramachandran A, Rogiers V, Rowe C, Schelcher C, Schmich K, Schwarz M, Singh B, Stelzer EHK, Stieger B, Stöber R, Sugiyama Y, Tetta C, Thasler WE, Vanhaecke T, Vinken M, Weiss TS, Widera A, Woods CG, Xu JJ, Yarborough KM, Hengstler JG, Arch. Toxicol 2013, 87, 1315. [DOI] [PMC free article] [PubMed] [Google Scholar]
- [3].Weaver RJ, Blomme EA, Chadwick AE, Copple IM, Gerets HHJJ, Goldring CE, Guillouzo A, Hewitt PG, Ingelman-Sundberg M, Jensen KG, Juhila S, Klingmüller U, Labbe G, Liguori MJ, Lovatt CA, Morgan P, Naisbitt DJ, Pieters RHHH, Snoeys J, van de Water B, Williams DP, Park BK, Nat. Rev. Drug Discov 2019, 1. [DOI] [PubMed]
- [4].Zhou Y, Shen JX, Lauschke VM, Front. Pharmacol 2019, 10, 1. [DOI] [PMC free article] [PubMed] [Google Scholar]
- [5].LeCluyse EL, Witek RP, Andersen ME, Powers MJ, Crit. Rev. Toxicol 2012, 42, 501. [DOI] [PMC free article] [PubMed] [Google Scholar]
- [6].Long TJ, Cosgrove PA, Dunn RT, Stolz DB, Hamadeh H, Afshari C, McBride H, Griffith LG, Drug Metab. Dispos 2016, 44, 1940. [DOI] [PMC free article] [PubMed] [Google Scholar]
- [7].Saile B, Ramadori G, Z Gastroenterol 2007, 45, 77. [DOI] [PubMed] [Google Scholar]
- [8].Smalling RL, Delker DA, Zhang Y, Nieto N, Mcguiness MS, Liu S, Friedman SL, Hagedorn CH, Wang L, Am. J. Physiol. - Gastrointest. Liver Physiol 2013, 305, 364. [DOI] [PMC free article] [PubMed] [Google Scholar]
- [9].Shaw PJ, Ganey PE, Roth RA, Toxicol. Sci 2010, 118, 7. [DOI] [PMC free article] [PubMed] [Google Scholar]
- [10].Cosgrove BD, King BM, Hasan MA, Alexopoulos LG, Farazi PA, Hendriks BS, Griffith LG, Sorger PK, Tidor B, Xu JJ, Lauffenburger DA, Toxicol. Appl. Pharmacol 2009, 237, 317. [DOI] [PMC free article] [PubMed] [Google Scholar]
- [11].Mooring M, Fowl BH, Lum SZC, Liu Y, Yao K, Softic S, Kirchner R, Bernstein A, Singhi AD, Jay DG, Kahn CR, Camargo FD, Yimlamai D, Hepatology 2019, 71, 1813. [DOI] [PMC free article] [PubMed] [Google Scholar]
- [12].Dooley S, Ten Dijke P, Cell Tissue Res 2012, 347, 245. [DOI] [PMC free article] [PubMed] [Google Scholar]
- [13].Hagenbeek TJ, Webster JD, Kljavin NM, Chang MT, Pham T, Lee HJ, Klijn C, Cai AG, Totpal K, Ravishankar B, Yang N, Lee DH, Walsh KB, Hatzivassiliou G, De La Cruz CC, Gould SE, Wu X, Lee WP, Yang S, Zhang Z, Gu Q, Ji Q, Jackson EL, Lim DS, Dey A, Sci. Signal 2018, 11. [DOI] [PubMed]
- [14].Ebrahimkhani MR, Neiman JAS, Raredon MSB, Hughes DJ, Griffith LG, Adv. Drug Deliv. Rev 2014, 69–70, 132. [DOI] [PMC free article] [PubMed] [Google Scholar]
- [15].Huang D. (Danielle), Gibeley SB, Xu C, Xiao Y, Celik O, Ginsberg HN, Leong KW, Adv. Funct. Mater 2020, 30, 1909553. [DOI] [PMC free article] [PubMed] [Google Scholar]
- [16].Stokes CL, Cirit M, Lauffenburger DA, CPT Pharmacometrics Syst. Pharmacol 2015, 4, 559. [DOI] [PMC free article] [PubMed] [Google Scholar]
- [17].Sudo R, Organogenesis 2014, 10, 216. [DOI] [PMC free article] [PubMed] [Google Scholar]
- [18].Mukherjee S, Zhelnin L, Sanfiz A, Pan J, Li Z, Yarde M, McCarty J, Jarai G, Am. J. Transl. Res 2019, 11, 1531. [PMC free article] [PubMed] [Google Scholar]
- [19].Kostrzewski T, Cornforth T, Snow SA, Ouro-Gnao L, Rowe C, Large EM, Hughes DJ, World J. Gastroenterol 2017, 23, 204. [DOI] [PMC free article] [PubMed] [Google Scholar]
- [20].Feaver RE, Cole BK, Lawson MJ, Hoang SA, Marukian S, Blackman BR, Figler RA, Sanyal AJ, Wamhoff BR, Dash A, JCI Insight 2016, 1, 1. [DOI] [PMC free article] [PubMed] [Google Scholar]
- [21].Norona LM, Nguyen DG, Gerber DA, Presnell SC, LeCluyse EL, Toxicol. Sci 2016, 154, 354. [DOI] [PMC free article] [PubMed] [Google Scholar]
- [22].Busche M, Tomilova O, Schütte J, Werner S, Beer M, Groll N, Hagmeyer B, Pawlak M, Jones PD, Schmees C, Becker H, Schnabel J, Gall K, Hemmler R, Matz-Soja M, Damm G, Beuck S, Klaassen T, Moer J, Ullrich A, Runge D, Schenke-Layland K, Gebhardt R, Stelzle M, Lab Chip 2020, 20, 2911. [DOI] [PubMed] [Google Scholar]
- [23].Rubiano A, Indapurkar A, Yokosawa R, Miedzik A, Rosenzweig B, Arefin A, Moulin CM, Dame K, Hartman N, Volpe DA, Matta MK, Hughes DJ, Strauss DG, Kostrzewski T, Ribeiro AJS, Clin. Transl. Sci 2020, cts. 12969. [DOI] [PMC free article] [PubMed]
- [24].Chen WLK, Edington C, Suter E, Yu J, Velazquez JGJJGJJ, Velazquez JGJJGJJ, Shockley M, Large EM, Venkataramanan R, Hughes DJ, Stokes CL, Trumper DL, Carrier RL, Cirit M, Griffith LG, Lauffenburger DA, Biotechnol. Bioeng 2017, 114, 2648. [DOI] [PMC free article] [PubMed] [Google Scholar]
- [25].Tsamandouras N, Kostrzewski T, Stokes CL, Griffith LG, Hughes DJ, Cirit M, J. Pharmacol. Exp. Ther 2017, 360, 95. [DOI] [PMC free article] [PubMed] [Google Scholar]
- [26].Clark AM, Wheeler SE, Young CL, Stockdale L, Shepard Neiman J, Zhao W, Stolz DB, Venkataramanan R, Lauffenburger D, Griffith L, Wells A, Lab Chip 2017, 17, 156. [DOI] [PMC free article] [PubMed] [Google Scholar]
- [27].Clark AM, Kumar MP, Wheeler SE, Young CL, Venkataramanan R, Stolz DB, Griffith LG, Lauffenburger DA, Wells A, Mol. Cell. Proteomics 2018, 17, 619. [DOI] [PMC free article] [PubMed] [Google Scholar]
- [28].Kidder BL, Hu G, Zhao K, Nat. Immunol 2011, 12, 918. [DOI] [PMC free article] [PubMed] [Google Scholar]
- [29].Messner S, Agarkova I, Moritz W, Kelm JM, Arch. Toxicol 2013, 87, 209. [DOI] [PMC free article] [PubMed] [Google Scholar]
- [30].Bell CC, Hendriks DFGG, Moro SMLL, Ellis E, Walsh J, Renblom A, Fredriksson Puigvert L, Dankers ACAA, Jacobs F, Snoeys J, Sison-Young RL, Jenkins RE, Nordling Å, Mkrtchian S, Park BK, Kitteringham NR, Goldring CEPP, Lauschke VM, Ingelman-Sundberg M, Sci. Rep 2016, 6, 25187. [DOI] [PMC free article] [PubMed] [Google Scholar]
- [31].Yuasa C, Tomita Y, Shono M, Ishimura K, Ichihara A, J. Cell. Physiol 1993, 156, 522. [DOI] [PubMed] [Google Scholar]
- [32].Li AP, Colburn SM, Beck DJ, Vitr. Cell. Dev. Biol. - Anim 1992, 28, 673. [DOI] [PubMed] [Google Scholar]
- [33].Tasnim F, Singh NH, Tan EKF, Xing J, Li H, Hissette S, Manesh S, Fulwood J, Gupta K, Ng CW, Xu S, Hill J, Yu H, Sci. Rep 2020, 10, 1. [DOI] [PMC free article] [PubMed] [Google Scholar]
- [34].Baze A, Parmentier C, Hendriks DFG, Hurrell T, Heyd B, Bachellier P, Schuster C, Ingelman-Sundberg M, Richert L, Tissue Eng. - Part C Methods 2018, 24, 534. [DOI] [PubMed] [Google Scholar]
- [35].Kelm JM, Timmins NE, Brown CJ, Fussenegger M, Nielsen LK, Biotechnol. Bioeng 2003, 83, 173. [DOI] [PubMed] [Google Scholar]
- [36].Fukuda J, Nakazawa K, Biomicrofluidics 2011, 5. [DOI] [PMC free article] [PubMed]
- [37].Rossen NS, Anandakumaran PN, zur Nieden R, Lo K, Luo W, Park C, Huyan C, Fu Q, Song Z, Singh-Moon RP, Chung J, Goldenberg JE, Sampat N, Harimoto T, Bajakian DR, Gillette BM, Sia SK, iScience 2020, 23, 101052. [DOI] [PMC free article] [PubMed] [Google Scholar]
- [38].Powers MJ, Domansky K, Kaazempur-Mofrad MR, Kalezi A, Capitano A, Upadhyaya A, Kurzawski P, Wack KE, Stolz DB, Kamm R, Griffith LG, Biotechnol. Bioeng 2002, 78, 257. [DOI] [PubMed] [Google Scholar]
- [39].Domansky K, Inman W, Serdy J, Dash A, Lim MHM, Griffith LG, Lab Chip 2010, 10, 51. [DOI] [PMC free article] [PubMed] [Google Scholar]
- [40].Neiman JAS, Raman R, Chan V, Rhoads MG, Raredon MSB, Velazquez JJ, Dyer RL, Bashir R, Hammond PT, Griffith LG, Biotechnol. Bioeng 2015, 112, 777. [DOI] [PMC free article] [PubMed] [Google Scholar]
- [41].Brown A, He H, Trumper E, Valdez J, Hammond P, Griffith LG, Biomaterials 2020, 243, 119921. [DOI] [PMC free article] [PubMed] [Google Scholar]
- [42].Fairbanks BD, Schwartz MP, Halevi AE, Nuttelman CR, Bowman CN, Anseth KS, Adv. Mater 2009, 21, 5005. [DOI] [PMC free article] [PubMed] [Google Scholar]
- [43].Lin CC, Ki CS, Shih H, J. Appl. Polym. Sci 2015, 132, 1. [DOI] [PMC free article] [PubMed] [Google Scholar]
- [44].Yimlamai D, Christodoulou C, Galli GG, Yanger K, Pepe-Mooney B, Gurung B, Shrestha K, Cahan P, Stanger BZ, Camargo FD, Cell 2014, 157, 1324. [DOI] [PMC free article] [PubMed] [Google Scholar]
- [45].Pepe-Mooney BJ, Dill MT, Alemany A, Ordovas-Montanes J, Matsushita Y, Rao A, Sen A, Miyazaki M, Anakk S, Dawson PA, Ono N, Shalek AK, van Oudenaarden A, Camargo FD, Cell Stem Cell 2019, 25, 1. [DOI] [PMC free article] [PubMed] [Google Scholar]
- [46].Dupont S, Morsut L, Aragona M, Enzo E, Giulitti S, Cordenonsi M, Zanconato F, Le Digabel J, Forcato M, Bicciato S, Elvassore N, Piccolo S, Nature 2011, 474, 179. [DOI] [PubMed] [Google Scholar]
- [47].Takebe T, Sekine K, Kimura M, Yoshizawa E, Ayano S, Koido M, Funayama S, Nakanishi N, Hisai T, Kobayashi T, Kasai T, Kitada R, Mori A, Ayabe H, Ejiri Y, Amimoto N, Yamazaki Y, Ogawa S, Ishikawa M, Kiyota Y, Sato Y, Nozawa K, Okamoto S, Ueno Y, Taniguchi H, Cell Rep 2017, 21, 2661. [DOI] [PubMed] [Google Scholar]
- [48].Stevens KR, Ungrin MD, Schwartz RE, Ng S, Carvalho B, Christine KS, Chaturvedi RR, Li CY, Zandstra PW, Chen CS, Bhatia SN, Nat. Commun 2013, 4. [DOI] [PMC free article] [PubMed]
- [49].Takebe T, Zhang B, Radisic M, Cell Stem Cell 2017, 21, 297. [DOI] [PubMed] [Google Scholar]
- [50].Chen AX, Chhabra A, Song HGHG, Fleming HE, Chen CS, Bhatia SN, Adv. Funct. Mater 2020, 1910442, 1. [DOI] [PMC free article] [PubMed] [Google Scholar]
- [51].Yamada M, Utoh R, Ohashi K, Tatsumi K, Yamato M, Okano T, Seki M, Biomaterials 2012, 33, 8304. [DOI] [PubMed] [Google Scholar]
- [52].Kidambi S, Yarmush RS, Novik E, Chao P, Yarmush ML, Nahmias Y, Proc. Natl. Acad. Sci. U. S. A 2009, 106, 15714. [DOI] [PMC free article] [PubMed] [Google Scholar]
- [53].Jin Y, Kim J, Lee JS, Min S, Kim S, Ahn D-HH, Kim Y-GG, Cho S-WW, Adv. Funct. Mater 2018, 28, 1. [Google Scholar]
- [54].Guo R, Xu X, Lu Y, Xie X, Sci. Rep 2017, 7, 1. [DOI] [PMC free article] [PubMed] [Google Scholar]
- [55].Grimes DR, Kelly C, Bloch K, Partridge M, Soc JR Interface 2014, 11. [DOI] [PMC free article] [PubMed]
- [56].Mueller-Klieser W, Biophys. J 1984, 46, 343. [DOI] [PMC free article] [PubMed] [Google Scholar]
- [57].Glicklis R, Merchuk JC, Cohen S, Biotechnol. Bioeng 2004, 86, 672. [DOI] [PubMed] [Google Scholar]
- [58].Rotem A, Toner M, Tompkins RG, Yarmush ML, Biotechnol. Bioeng 1992, 40, 1286. [DOI] [PubMed] [Google Scholar]
- [59].Powers MJ, Janigian DM, Wack KE, Baker CS, Stolz DB, Griffith LG, Tissue Eng 2002, 8, 499. [DOI] [PubMed] [Google Scholar]
- [60].Tsai A-C, Liu Y, Yuan X, Ma T, Tissue Eng. Part A 2015, 21, 1705. [DOI] [PMC free article] [PubMed] [Google Scholar]
- [61].Kyffin JA, Sharma P, Leedale J, Colley HE, Murdoch C, Harding AL, Mistry P, Webb SD, Toxicol. Vitr 2019, 55, 160. [DOI] [PMC free article] [PubMed] [Google Scholar]
- [62].Sphabmixay P, Raredon MSB, Wang AJ-S, Lee H, Hammond PT, Fang NX, Griffith LG, Biofabrication 2021, 13, 045024. [DOI] [PubMed] [Google Scholar]
- [63].Siltanen C, Diakataou M, Lowen J, Haque A, Rahimian A, Stybayeva G, Revzin A, Acta Biomater 2017, 50, 428. [DOI] [PMC free article] [PubMed] [Google Scholar]
- [64].Kozyra M, Johansson I, Nordling Å, Ullah S, Lauschke VM, Ingelman-Sundberg M, Sci. Rep 2018, 8, 1. [DOI] [PMC free article] [PubMed] [Google Scholar]
- [65].Halpern KB, Shenhav R, Matcovitch-Natan O, Tóth B, Lemze D, Golan M, Massasa EE, Baydatch S, Landen S, Moor AE, Brandis A, Giladi A, Stokar-Avihail A, David E, Amit I, Itzkovitz S, Nature 2017, 542, 1. [DOI] [PMC free article] [PubMed] [Google Scholar]
- [66].Maass C, Stokes CL, Griffith LG, Cirit M, Integr. Biol 2017, 9, 290. [DOI] [PMC free article] [PubMed] [Google Scholar]
- [67].Valdez J, Cook CD, Ahrens CC, Wang AJ, Brown A, Kumar M, Stockdale L, Rothenberg D, Renggli K, Gordon E, Lauffenburger D, White F, Griffith L, Biomaterials 2017, 130, 90. [DOI] [PMC free article] [PubMed] [Google Scholar]
- [68].Yin M, Glaser KJ, Manduca A, Mounajjed T, Malhi H, Simonetto DA, Wang R, Yang L, Mao SA, Glorioso JM, Elgilani FM, Ward CJ, Harris PC, Nyberg SL, Shah VH, Ehman RL, Radiology 2017, 284, 694. [DOI] [PMC free article] [PubMed] [Google Scholar]
- [69].Desai SS, Tung JC, Zhou VX, Grenert JP, Malato Y, Rezvani M, Español-Suñer R, Willenbring H, Weaver VM, Chang TT, Hepatology 2016, 64, 261. [DOI] [PMC free article] [PubMed] [Google Scholar]
- [70].Venkatesh SK, Yin M, Ehman RL, J. Magn. Reson. Imaging 2013, 37, 544. [DOI] [PMC free article] [PubMed] [Google Scholar]
- [71].Wells RG, Hepatology 2008, 47, 1394. [DOI] [PubMed] [Google Scholar]
- [72].Wells RG, J. Clin. Gastroenterol 2005, 39, 158. [DOI] [PubMed] [Google Scholar]
- [73].Caliari SR, Perepelyuk M, Cosgrove BD, Tsai SJ, Lee GY, Mauck RL, Wells RG, Burdick JA, Sci. Rep 2016, 6, 1. [DOI] [PMC free article] [PubMed] [Google Scholar]
- [74].Reid LM, Fiorino AS, Sigal SH, Brill S, Holst PA, Hepatology 1992, 15, 1198. [DOI] [PubMed] [Google Scholar]
- [75].Martinez-Hernandez a, Amenta PS, FASEB J 1995, 9, 1401. [DOI] [PubMed] [Google Scholar]
- [76].Cordero-Espinoza L, Huch M, J. Clin. Invest 2018, 128, 85. [DOI] [PMC free article] [PubMed] [Google Scholar]
- [77].He H, Sofman M, Wang AJS, Ahrens CC, Wang W, Griffith LG, Hammond PT, Biomacromolecules 2020. [DOI] [PubMed]
- [78].Ajoudanian M, Enomoto K, Tokunaga Y, Minami H, Chung S, Tanishita K, Kamm RD, Sudo R, Biofabrication 2019, 11. [DOI] [PubMed] [Google Scholar]
- [79].Hernandez-Gordillo V, Kassis T, Lampejo A, Choi GH, Gamboa ME, Gnecco JS, Brown A, Breault DT, Carrier R, Griffith LG, Biomaterials 2020, 254, 120125. [DOI] [PMC free article] [PubMed] [Google Scholar]
- [80].Sarkar U, Rivera-Burgos D, Large EM, Hughes DJ, Ravindra KC, Dyer RL, Ebrahimkhani MR, Wishnok JS, Griffith LG, Tannenbaum SR, Drug Metab. Dispos 2015, 43, 1091. [DOI] [PMC free article] [PubMed] [Google Scholar]
- [81].Yan BC, Gong C, Song J, Krausz T, Tretiakova M, Hyjek E, Al-Ahmadie H, Alves V, Xiao SY, Anders RA, Hart JA, Am. J. Surg. Pathol 2010, 34, 1147. [DOI] [PMC free article] [PubMed] [Google Scholar]
- [82].Hu H, Gehart H, Artegiani B, LÖpez-Iglesias C, Dekkers F, Basak O, van Es J, Chuva de Sousa Lopes SM, Begthel H, Korving J, van den Born M, Zou C, Quirk C, Chiriboga L, Rice CM, Ma S, Rios A, Peters PJ, de Jong YP, Clevers H, Cell 2018, 175, 1591. [DOI] [PubMed] [Google Scholar]
- [83].van Grunsven LA, Adv. Drug Deliv. Rev 2017, 121, 133. [DOI] [PubMed] [Google Scholar]
- [84].Hurrell T, Kastrinou-Lampou V, Fardellas A, Hendriks DFG, Nordling Å, Johansson I, Baze A, Parmentier C, Richert L, Ingelman-Sundberg M, Cells 2020, 9. [DOI] [PMC free article] [PubMed] [Google Scholar]
- [85].Michalopoulos GK, Bhushan B, Nat. Rev. Gastroenterol. Hepatol 2020, 1. [DOI] [PubMed]
- [86].Adamek A, Kasprzak A, Int. J. Mol. Sci 2018, 19. [Google Scholar]
- [87].Michalopoulos GK, Bowen WC, Mule K, Luo J, Gene Expr 2003, 11, 55. [DOI] [PMC free article] [PubMed] [Google Scholar]
- [88].Morgan ET, Goralski KB, Piquette-Miller M, Renton KW, Robertson GR, Chaluvadi MR, Charles KA, Clarke SJ, Kacevska M, Liddle C, Richardson TA, Sharma R, Sinal CJ, In Drug Metabolism and Disposition, 2008. [DOI] [PubMed]
- [89].Dickmann LLJL, Patel SSKS, Rock DA, Wienkers LC, Slatter JG, Drug Metab. Dispos … 2011, 39, 1415. [DOI] [PubMed] [Google Scholar]
- [90].Hendriks DFG, Vorrink SU, Smutny T, Sim SC, Nordling Å, Ullah S, Kumondai M, Jones BC, Johansson I, Andersson TB, Lauschke VM, Ingelman-Sundberg M, Clin. Pharmacol. Ther 2020, 108, 844. [DOI] [PubMed] [Google Scholar]
- [91].Xiang C, Du Y, Meng G, Yi LS, Sun S, Song N, Zhang X, Xiao Y, JieWan J, Yi Z, Liu Y, Xie B, Wu M, Shu J, Sun D, Jia J, Liang Z, Sun D, Huang Y, Shi Y, Xu J, Lu F, Li C, Xiang K, Yuan Z, Lu S, Deng H, Science (80-. ) 2019, 364, 399. [DOI] [PubMed] [Google Scholar]
- [92].Huch M, Gehart H, Van Boxtel R, Hamer K, Blokzijl F, Verstegen MMA, Ellis E, Van Wenum M, Fuchs SA, De Ligt J, Van De Wetering M, Sasaki N, Boers SJ, Kemperman H, De Jonge J, Ijzermans JNM, Nieuwenhuis EES, Hoekstra R, Strom S, Vries RRG, Van Der Laan LJW, Cuppen E, Clevers H, Cell 2015, 160, 299. [DOI] [PMC free article] [PubMed] [Google Scholar]
- [93].Peng WC, Logan CY, Fish M, Anbarchian T, Aguisanda F, Álvarez-Varela A, Wu P, Jin Y, Zhu J, Li B, Grompe M, Wang B, Nusse R, Cell 2018, 175, 1607. [DOI] [PMC free article] [PubMed] [Google Scholar]
- [94].Hansen CG, Moroishi T, Guan KL, Trends Cell Biol 2015, 25, 499. [DOI] [PMC free article] [PubMed] [Google Scholar]
- [95].Subramanian A, Tamayo P, Mootha VK, Mukherjee S, Ebert BL, Gillette MA, Paulovich A, Pomeroy SL, Golub TR, Lander ES, Mesirov JP, Proc. Natl. Acad. Sci. U. S. A 2005, 102, 15545. [DOI] [PMC free article] [PubMed] [Google Scholar]
- [96].Wang Y, Nakajima T, Gonzalez FJ, Tanaka N, Int. J. Mol. Sci 2020, 21. [DOI] [PMC free article] [PubMed]
- [97].Esler WP, Bence KK, Metabolic Targets in Nonalcoholic Fatty Liver Disease, Vol. 8, Elsevier Inc, 2019, pp. 247–267. [DOI] [PMC free article] [PubMed] [Google Scholar]
- [98].Ryaboshapkina M, Hammar M, Sci. Rep 2017, 7, 1. [DOI] [PMC free article] [PubMed] [Google Scholar]
- [99].Abu-Absi SF, Friend JR, Hansen LK, Hu WS, Exp. Cell Res 2002, 274, 56. [DOI] [PubMed] [Google Scholar]
- [100].Williams CM, Mehta G, Peyton SR, Zeiger AS, Van Vliet KJ, Griffith LG, Tissue Eng. Part A 2011, 17, 1055. [DOI] [PMC free article] [PubMed] [Google Scholar]
- [101].Hughes RC, Stamatoglou SC, J. Cell Sci 1987, 1987, 273. [DOI] [PubMed] [Google Scholar]
- [102].Caliari SR, Burdick JA, Nat. Methods 2016, 13, 405. [DOI] [PMC free article] [PubMed] [Google Scholar]
- [103].Lutolf MP, Hubbell JA, Biomacromolecules 2003, 4, 713. [DOI] [PubMed] [Google Scholar]
- [104].Cook CD, Hill AS, Guo M, Stockdale L, Papps JP, Isaacson KB, Lauffenburger DA, Griffith LG, Integr. Biol 2017, 9, 271. [DOI] [PMC free article] [PubMed] [Google Scholar]
- [105].Patterson J, Hubbell JA, Biomaterials 2010, 31, 7836. [DOI] [PubMed] [Google Scholar]
- [106].Yeh YC, Ling JY, Chen WC, Lin HH, Tang MJ, Sci. Rep 2017, 7. [DOI] [PMC free article] [PubMed] [Google Scholar]
- [107].Kong HJ, Polte TR, Alsberg E, Mooney DJ, Proc. Natl. Acad. Sci 2005, 102, 4300. [DOI] [PMC free article] [PubMed] [Google Scholar]
- [108].Caliari SR, Vega SL, Kwon M, Soulas EM, Burdick JA, Biomaterials 2016, 103, 314. [DOI] [PMC free article] [PubMed] [Google Scholar]
- [109].Caliari SR, Perepelyuk M, Soulas EM, Lee GY, Wells RG, Burdick JA, Integr. Biol 2016, 8, 720. [DOI] [PMC free article] [PubMed] [Google Scholar]
- [110].Deegan DB, Zimmerman C, Skardal A, Atala A, Shupe TD, J. Mech. Behav. Biomed. Mater 2016, 55, 87. [DOI] [PubMed] [Google Scholar]
- [111].Cozzolino AM, Noce V, Battistelli C, Marchetti A, Grassi G, Cicchini C, Tripodi M, Amicone L, Stem Cells Int 2016, 2016. [DOI] [PMC free article] [PubMed] [Google Scholar]
- [112].Kourouklis AP, Kaylan KB, Underhill GH, Biomaterials 2016, 99, 82. [DOI] [PubMed] [Google Scholar]
- [113].Xia T, Zhao R, Liu W, Huang Q, Chen P, Waju YN, Al-ani MK, Lv Y, Yang L, J. Cell. Physiol 2018, 233, 6996. [DOI] [PubMed] [Google Scholar]
- [114].Natarajan V, Berglund EJ, Chen DX, Kidambi S, RSC Adv 2015, 5, 80956. [DOI] [PMC free article] [PubMed] [Google Scholar]
- [115].Sorrentino G, Rezakhani S, Yildiz E, Nuciforo S, Heim MH, Lutolf MP, Schoonjans K, Nat. Commun 2020, 11, 3416. [DOI] [PMC free article] [PubMed] [Google Scholar]
- [116].Cosgrove BD, Mui KL, Driscoll TP, Caliari SR, Mehta KD, Assoian RK, Burdick JA, Mauck RL, Nat. Mater 2016, 15, 1297. [DOI] [PMC free article] [PubMed] [Google Scholar]
- [117].Godoy P, Lakkapamu S, Schug M, Bauer A, Stewart JD, Bedawi E, Hammad S, Amin J, Marchan R, Schormann W, MacCoux L, Von Recklinghausen I, Reif R, Hengstler JG, Biol. Chem 2010, 391, 73. [DOI] [PubMed] [Google Scholar]
- [118].Sidhu JS, Omiecinski CJ, J. Pharmacol. Exp. Ther 1996, 276. [PubMed]
- [119].Ogawa S, Surapisitchat J, Virtanen C, Ogawa M, Niapour M, Sugamori KS, Wang S, Tamblyn L, Guillemette C, Hoffmann E, Zhao B, Strom S, Laposa RR, Tyndale RF, Grant DM, Keller G, Development 2013, 140, 3285. [DOI] [PMC free article] [PubMed] [Google Scholar]
- [120].Wang T, Chen T, Liang HY, Yan HT, Lin N, Liu LY, Luo H, Huang Z, Li NL, Liu WH, Tang LJ, Cell Tissue Res 2014, 357, 173. [DOI] [PubMed] [Google Scholar]
- [121].Chen Y, Zheng S, Qi D, Zheng S, Guo J, Zhang S, Weng Z, PLoS One 2012, 7. [DOI] [PMC free article] [PubMed]
- [122].Alexander B, Nutrition 1998, 14, 376. [DOI] [PubMed] [Google Scholar]
- [123].Liu ZZ, Cui S, Billiar TR, Dorko K, Halfter W, Geller DA, Michalopoulos G, Beger HG, Albina J, Nussler AK, J. Leukoc. Biol 1996, 60, 382. [DOI] [PubMed] [Google Scholar]
- [124].Harbrecht BG, Taylor BS, Xu Z, Ramalakshmi S, Ganster RW, Geller DA, J. Surg. Res 2001, 99, 258. [DOI] [PubMed] [Google Scholar]
- [125].El-Sehemy A, Chang AC, Azad AK, Gupta N, Xu Z, Steed H, Karsan A, Fu YX, Cell. Signal 2013, 25, 2780. [DOI] [PubMed] [Google Scholar]
- [126].Cantor JR, Abu-Remaileh M, Kanarek N, Freinkman E, Gao X, Louissaint A, Lewis CA, Sabatini DM, Cell 2017, 169, 258. [DOI] [PMC free article] [PubMed] [Google Scholar]
- [127].Davidson MD, Pickrell J, Khetani SR, Toxicology 2021, 449, 152662. [DOI] [PMC free article] [PubMed] [Google Scholar]
- [128].Azzolin L, Panciera T, Soligo S, Enzo E, Bicciato S, Dupont S, Bresolin S, Frasson C, Basso G, Guzzardo V, Fassina A, Cordenonsi M, Piccolo S, Cell 2014, 158, 157. [DOI] [PubMed] [Google Scholar]
- [129].Totaro A, Castellan M, Di Biagio D, Piccolo S, Trends Cell Biol 2018, 28, 560. [DOI] [PMC free article] [PubMed] [Google Scholar]
- [130].Ye S, Boeter JWB, Mihajlovic M, Steenbeek FG, Wolferen ME, Oosterhoff LA, Marsee A, Caiazzo M, Laan LJW, Penning LC, Vermonden T, Spee B, Schneeberger K, Adv. Funct. Mater 2020, 30, 2000893. [DOI] [PMC free article] [PubMed] [Google Scholar]
- [131].Davidson MD, Ballinger KR, Khetani SR, Sci. Rep 2016, 6, 1. [DOI] [PMC free article] [PubMed] [Google Scholar]
- [132].Ouchi R, Togo S, Kimura M, Shinozawa T, Koido M, Koike H, Thompson W, Karns RA, Mayhew CN, McGrath PS, McCauley HA, Zhang R-RR, Lewis K, Hakozaki S, Ferguson A, Saiki N, Yoneyama Y, Takeuchi I, Mabuchi Y, Akazawa C, Yoshikawa HY, Wells JM, Takebe T, Cell Metab 2019, 30, 374. [DOI] [PMC free article] [PubMed] [Google Scholar]
- [133].Lasli S, Kim HJ, Lee KJ, Suurmond CAE, Goudie M, Bandaru P, Sun W, Zhang S, Zhang N, Ahadian S, Dokmeci MR, Lee J, Khademhosseini A, Adv. Biosyst 2019, 1900104, 1. [DOI] [PMC free article] [PubMed] [Google Scholar]
- [134].Gori M, Simonelli MC, Giannitelli SM, Businaro L, Trombetta M, Rainer A, PLoS One 2016, 11. [DOI] [PMC free article] [PubMed] [Google Scholar]
- [135].Oseini AM, Cole BK, Issa D, Feaver RE, Sanyal AJ, Hepatol. Int 2018, 12, 6. [DOI] [PMC free article] [PubMed] [Google Scholar]
- [136].Cole BK, Feaver RE, Wamhoff BR, Dash A, Expert Opin. Drug Discov 2018, 13, 193. [DOI] [PubMed] [Google Scholar]
- [137].Müller FA, Sturla SJ, Curr. Opin. Toxicol 2019, 16, 9. [Google Scholar]
- [138].He Y, Zou L, Exp. Ther. Med 2019, 18, 1884. [DOI] [PMC free article] [PubMed] [Google Scholar]
- [139].Zhang M, Wu P, Li M, Guo Y, Tian T, Liao X, Tan S, Biochem. Biophys. Res. Commun 2021, 547, 131. [DOI] [PubMed] [Google Scholar]
- [140].Zhu C, Kim KJ, Wang X, Bartolome A, Salomao M, Dongiovanni P, Meroni M, Graham MJ, Yates KP, Diehl AM, Schwabe RF, Tabas I, Valenti L, Lavine JE, Pajvani UB, Sci. Transl. Med 2018, 10, 1. [DOI] [PMC free article] [PubMed] [Google Scholar]
- [141].Vickers JA, Caulum MM, Henry CS, Anal. Chem 2006, 78, 7446. [DOI] [PubMed] [Google Scholar]
- [142].Li W, Germain RN, Gerner MY, Proc. Natl. Acad. Sci 2017, 201708981.
- [143].Tang H, Panemangalore R, Yarde M, Zhang L, Cvijic ME, J. Biomol. Screen 2016, 21, 548. [DOI] [PubMed] [Google Scholar]
- [144].Breen EJ, Tan W, Khan A, Sci. Rep 2016, 6, 1. [DOI] [PMC free article] [PubMed] [Google Scholar]
- [145].Croghan W, Egeghy PP, In Presented at Southeastern SAS User Group, 2003.
- [146].Dorr BM, Ham HO, An C, Chaikof EL, Liu DR, Proc. Natl. Acad. Sci 2014, 111, 13343. [DOI] [PMC free article] [PubMed] [Google Scholar]
- [147].Dobin A, Davis CA, Schlesinger F, Drenkow J, Zaleski C, Jha S, Batut P, Chaisson M, Gingeras TR, Bioinformatics 2013, 29, 15. [DOI] [PMC free article] [PubMed] [Google Scholar]
- [148].Li B, Dewey CN, BMC Bioinformatics 2011, 12, 323. [DOI] [PMC free article] [PubMed] [Google Scholar]
- [149].Trapecar M, Communal C, Velazquez J, Maass CA, Huang YJ, Schneider K, Wright CW, Butty V, Eng G, Yilmaz O, Trumper D, Griffith LG, Cell Syst 2020, 10, 223. [DOI] [PMC free article] [PubMed] [Google Scholar]
- [150].Soneson C, Love MI, Robinson MD, F1000Research 2016, 4, 1521. [DOI] [PMC free article] [PubMed] [Google Scholar]
- [151].Love MI, Huber W, Anders S, Genome Biol 2014, 15, 550. [DOI] [PMC free article] [PubMed] [Google Scholar]
- [152].Gu Z, Eils R, Schlesner M, Bioinformatics 2016, 32, 2847. [DOI] [PubMed] [Google Scholar]
- [153].Wickham H, ggplot2: Elegant Graphics for Data Analysis, Springer International Publishing, Cham, 2016. [Google Scholar]
- [154].Hulsen T, de Vlieg J, Alkema W, BMC Genomics 2008, 9, 488. [DOI] [PMC free article] [PubMed] [Google Scholar]
Associated Data
This section collects any data citations, data availability statements, or supplementary materials included in this article.