

Abstract
Background:
During the second stage of labor, the maternal pelvic floor muscles undergo repetitive stretch loading as uterine contractions and strenuous maternal pushes combined to expel the fetus, and it is not uncommon that these muscles sustain a partial or complete rupture. It has recently been demonstrated that soft tissues, including the anterior cruciate ligament and connective tissue in sheep pelvic floor muscle, can accumulate damage under repetitive physiological (submaximal) loads. It is well known to material scientists that this damage accumulation can not only decrease tissue resistance to stretch but also result in a partial or complete structural failure. Thus, we wondered whether certain maternal pushing patterns (in terms of frequency and duration of each push) could increase the risk of excessive damage accumulation in the pelvic floor tissue, thereby inadvertently contributing to the development of pelvic floor muscle injury.
Objective:
This study aimed to determine which labor management practices (spontaneous vs directed pushing) are less prone to accumulate damage in the pelvic floor muscles during the second stage of labor and find the optimum approach in terms of minimizing the risk of pelvic floor muscle injury.
Study Design:
We developed a biomechanical model for the expulsive phase of the second stage of labor that includes the ability to measure the damage accumulation because of repetitive physiological submaximal loads. We performed 4 simulations of the second stage of labor, reflecting a directed pushing technique and 3 alternatives for spontaneous pushing.
Results:
The finite element model predicted that the origin of the pubovisceral muscle accumulates the most damage and so it is the most likely place for a tear to develop. This result was independent of the pushing pattern. Performing 3 maternal pushes per contraction, with each push lasting 5 seconds, caused less damage and seemed the best approach. The directed pushing technique (3 pushes per contraction, with each push lasting 10 seconds) did not reduce the duration of the second stage of labor and caused higher damage accumulation.
Conclusion:
The frequency and duration of the maternal pushes influenced the damage accumulation in the passive tissues of the pelvic floor muscles, indicating that it can influence the prevalence of pelvic floor muscle injuries. Our results suggested that the maternal pushes should not last longer than 5 seconds and that the duration of active pushing is a better measurement than the total duration of the second stage of labor. Hopefully, this research will help to shed new light on the best practices needed to improve the experience of labor for women.
Keywords: finite element method, low-cycle fatigue failure, management of labor, pelvic floor muscle, vaginal delivery, second stage of labor, maternal pushes
1. Introduction
Human vaginal delivery is a complex event, often involving a tight fit between the fetus and birth canal, and never without risk. Maternal pelvic floor damage in the form of partial or complete tears of the levator ani muscles is still occurring, especially in first-time mothers during a difficult delivery67. This injury has been well documented whether to the left, right, or both pubovisceral muscles (PVMs) near their origin on either side of the pubic symphysis, with a prevalence ranging between 13% and 41%16,19–21,30,45,48,65. Lying near vital structures in a relatively inaccessible location deep within the pelvis, these injuries are not amenable to surgical repair. Women with this injury are at an increased risk of developing pelvic floor disorders later in life38 including pelvic organ prolapse and urinary incontinence, both of which can significantly affect the quality of life and require surgery5,10,38. As such, there is room for improving the management of labor to provide more satisfactory outcomes for the mother.
Recently, it has been shown that highly specialized collagenous tensile structures, such as the anterior cruciate ligament (ACL), can tear under repetitive submaximal loading8,41,77. With each loading cycle, such as landing from a strenuous jump, the origin of the ACL showed accumulation of microdamage at the collagen fibril and fiber levels17, suggesting that microdamage can accumulate there and, if allowed to continue, can eventually cause a complete structural failure. Although the ACL can, of course, rupture under a single supramaximal load, it can also fail under a series of submaximal loads that in isolation would never cause failure. This type of injury is called a material fatigue failure. Motivated by these results, we performed a systematic review of the musculoskeletal literature74 and found that repetitive submaximal loading was reported at the musculotendinous junction of rabbit leg muscles, with histologically detectable microdamage accumulation44,50,69,72. From observational studies, indirect evidence suggested material fatigue failure as a possible damage mechanism in the tendon and at the musculotendinous junction74. This is because several nonimpact and nontraumatic injuries were reported within a cohort represented by professional and recreational athletes or people strongly engaged in sports activities, where strenuous repetitive movements are often performed without adequate rest.
Based on both the ACL data8,41,77 and indirect evidence found on our systematic review74, we developed a laboratory study to test the hypothesis that damage could accumulate at the origin of the PVM because of repetitive submaximal loadings. Using sheep as an animal model, we applied 60 loading cycles at a 60% ultimate displacementa and found microdamage in the muscle, near the musculotendinous junction injury, in the form of elongated and crimped muscle fibers and individual muscle fiber rupture (Figure 1). No visible tear was seen macroscopically; however, there was a visible permanent deformation in all specimens, averaging approximately 50% strain. Moreover, this damage accumulation was sufficient to affect the mechanical properties, in the absence of a complete tear, as captured by the strain-stress response75.
Figure 1 –
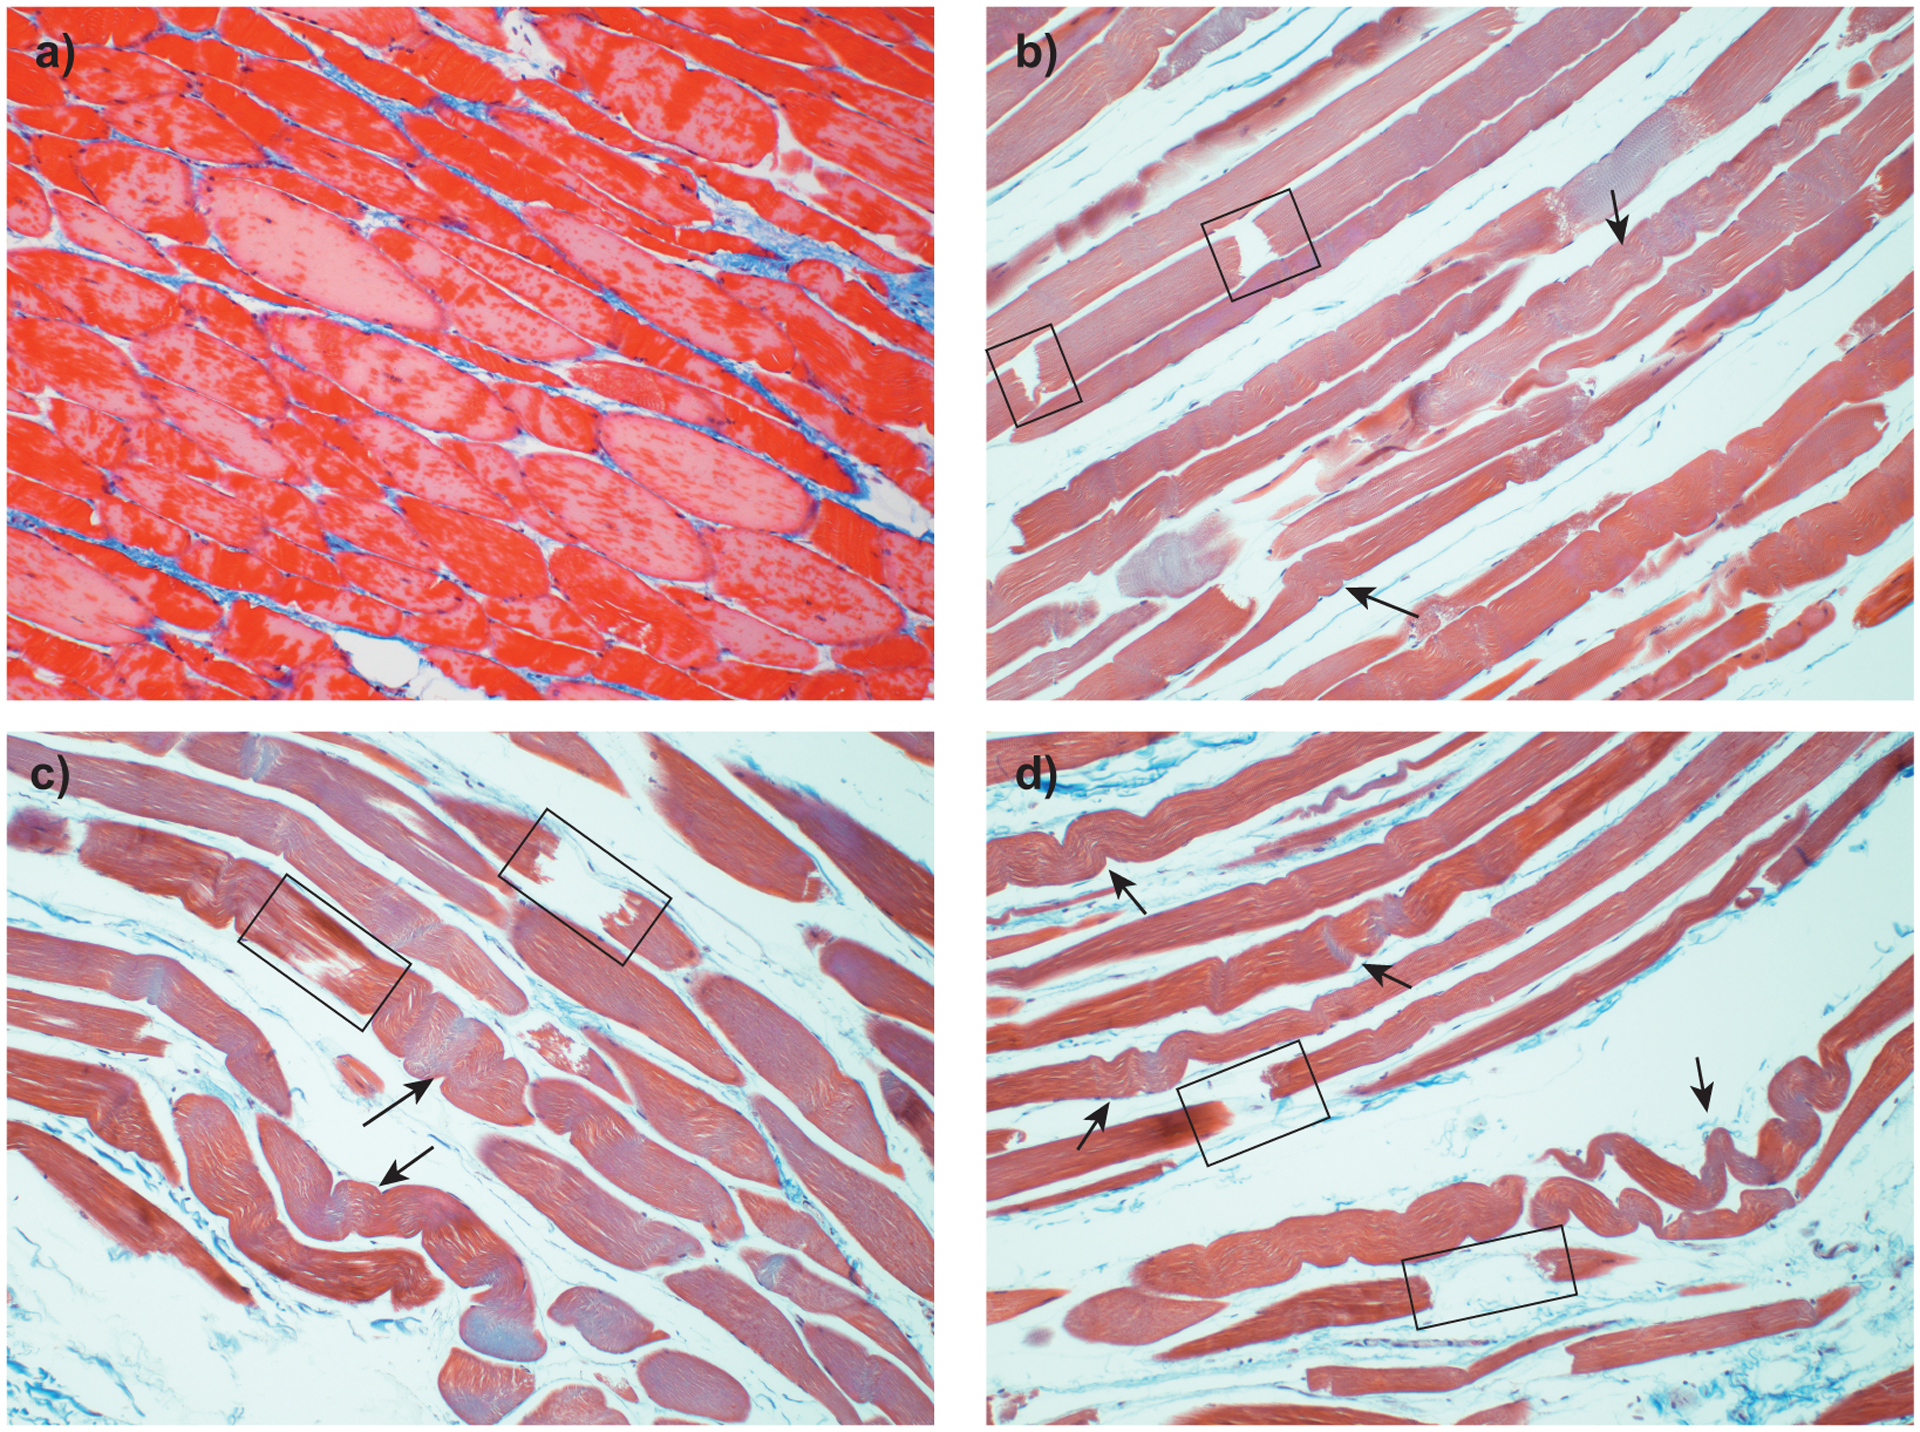
Histological appearance of ovine pelvic floor muscle-tendon sections stained with Masson’s Trichrome stain. Comparison between an untested control, a), and fatigue-tested specimens (b-c) (60 cycles at between 45% and 60% failure displacement75). Fatigued specimens show elongated and deformed muscle fibers (arrows), individual fiber rupture (square) and increased interstitial spaces75.
During vaginal delivery, the second stage of labor commences during complete cervical dilation after which active maternal pushing can be used to augment each uterine contraction to facilitate the delivery14. It is a common practice for the midwife or clinician to direct these efforts by instructing the mother when to begin the “active” stage of labor and thereupon to inhale deeply and to push with a closed glottis for 10 seconds, 2 to 3 times during each uterine contraction. This extended use of the Valsalva maneuver was popularized in the 1950s to accelerate the second stage of labor to avoid the need for forceps, which were in common use at the time36. A popular alternative method is spontaneous pushing, which is carried out naturally by the woman according to her desire to push down progressively. There is no deep breathing, and it starts only when the full uterine contraction is well established4,36. Generally, 3 to 5 pushes occur near the peak uterine contraction for 3 to 5 seconds with approximately 2-second breathing between efforts4,23,60,63, although 1 bigger push near the peak of the contraction is also used39. Despite the directed pushing being the most common, it is not yet clear what the best pushing technique is. A summary of several studies that compare maternal and fetal outcomes for directed pushing and spontaneous pushing groups is shown in Table 1. Overall, these studies have suggested that spontaneous pushing is not detrimental, although it seemed to cause longer mean second stages of labor. However, it is not clear whether directed pushing is detrimental or not, with some studies showing no substantial differences and other studies finding unfavorable outcomes. All these studies involved small sample sizes, which limited the generalizability of the results. Finally, in a review including 21 studies comparing spontaneous vs directed pushing, Lemos et al37 concluded that “there is no conclusive evidence to support or refute any specific style” and that “further properly well-designed randomized controlled trials, addressing clinically important maternal and neonatal outcomes are required to add evidence-based information to the current knowledge.”
Table 1-.
Summary of observational studies that compared maternal and fetal outcomes for directed and spontaneous pushing groups. POPQ: Pelvic Organ Prolapse Quantification
| Study Design | Number of Participants | Main Outcomes | |
|---|---|---|---|
| Schaffer et al63 | Randomized trial | 128 |
|
| Araujo et al4 | Clinical trial | 62 |
|
| Yeates and Roberts80 | Pilot study | 10 |
|
| Paine and Tinker53 | Clinical Trial | 30 |
|
| Sampselle and Hines62 | Retrospective study | 39 |
|
| Thomson70 | Randomized controlled trial | 32 |
|
| Barnett and Humenick6 | Pilot study | 10 |
|
| Koyucu and Demirci34 | Randomized prospective study | 80 |
|
We demonstrated earlier that the most commonly injured structure in the levator ani muscles has the potential to accumulate fatigue damage under repeated submaximal loading cycles consistent with the combination of the uterine contraction augmented by strenuous maternal pushing74–76. Thus, we wondered whether certain maternal pushing patterns could influence the prevalence of PVM tears. Our goal was to analyze the results of 4 different pushing methods to determine whether there is optimum management for labor that reduces the chance of a PVM tear because of material fatigue. A biomechanical approach was chosen to test this idea. Several finite element methods of the second stage of labor have already been developed to analyze factors, such as the pelvic floor strain40,55, episiotomy51,52, fetal head flexion54, duration of the second stage of labor73, fetal presentation56 and fetal head molding49. These models were developed to answer specific research questions, simplifying factors that do not strongly impact each research question. As such, material properties, such as viscoelastic effects, were often neglected40,51,52,54,55 (with exception of Vila Pouca et al73 and Moura et al49 who included viscoelastic effects to be able to analyze the influence of the duration of the second stage of labor). Moreover, none of these models included the ability to cyclically accumulate damage, an effect we have recently demonstrated can occur in collagenous and muscular tissues74,75. This is the main difference between the previous work and the finite element model applied in this work as it, for the first time, includes this ability to cyclically accumulate damage. In addition, it also includes viscoelasticity. Although an engineering approach inherently simplifies the problem, it also has the advantage of eliminating unwanted factors, which helps to achieve a baseline understanding of the problem. Moreover, it is a tool that can be used to better define the methodology of future clinical trials by helping to establish a more insightful hypothesis. The main questions we addressed were as follows: “Does the duration and frequency of maternal pushing influence the accumulation of damage near the origin of the PVM?” and “What frequency and duration of the maternal pushes minimize the risk of PVM tear?”
In light of our recent findings74–76, our working hypothesis was that the maternal pushes influence PVM damage accumulation and that shorter pushes may be beneficial for the mother.
2. Material and methods
To achieve our goal, we developed a simplified finite element model of the second stage of labor during vaginal delivery. It incorporated 3-dimensional (3D) geometric models of the pelvic floor muscles and fetus and a user-defined material model to better reproduce pelvic floor muscle behavior. Different maternal pushing profiles were simulated to find the optimal management of labor concerning maternal pelvic floor health. The simulations were performed using Abaqus finite element software (version 2018; Dassault Systèmes) with an implicit solver (Abaqus/Standard).
2.1. Geometry model and Boundary Conditions
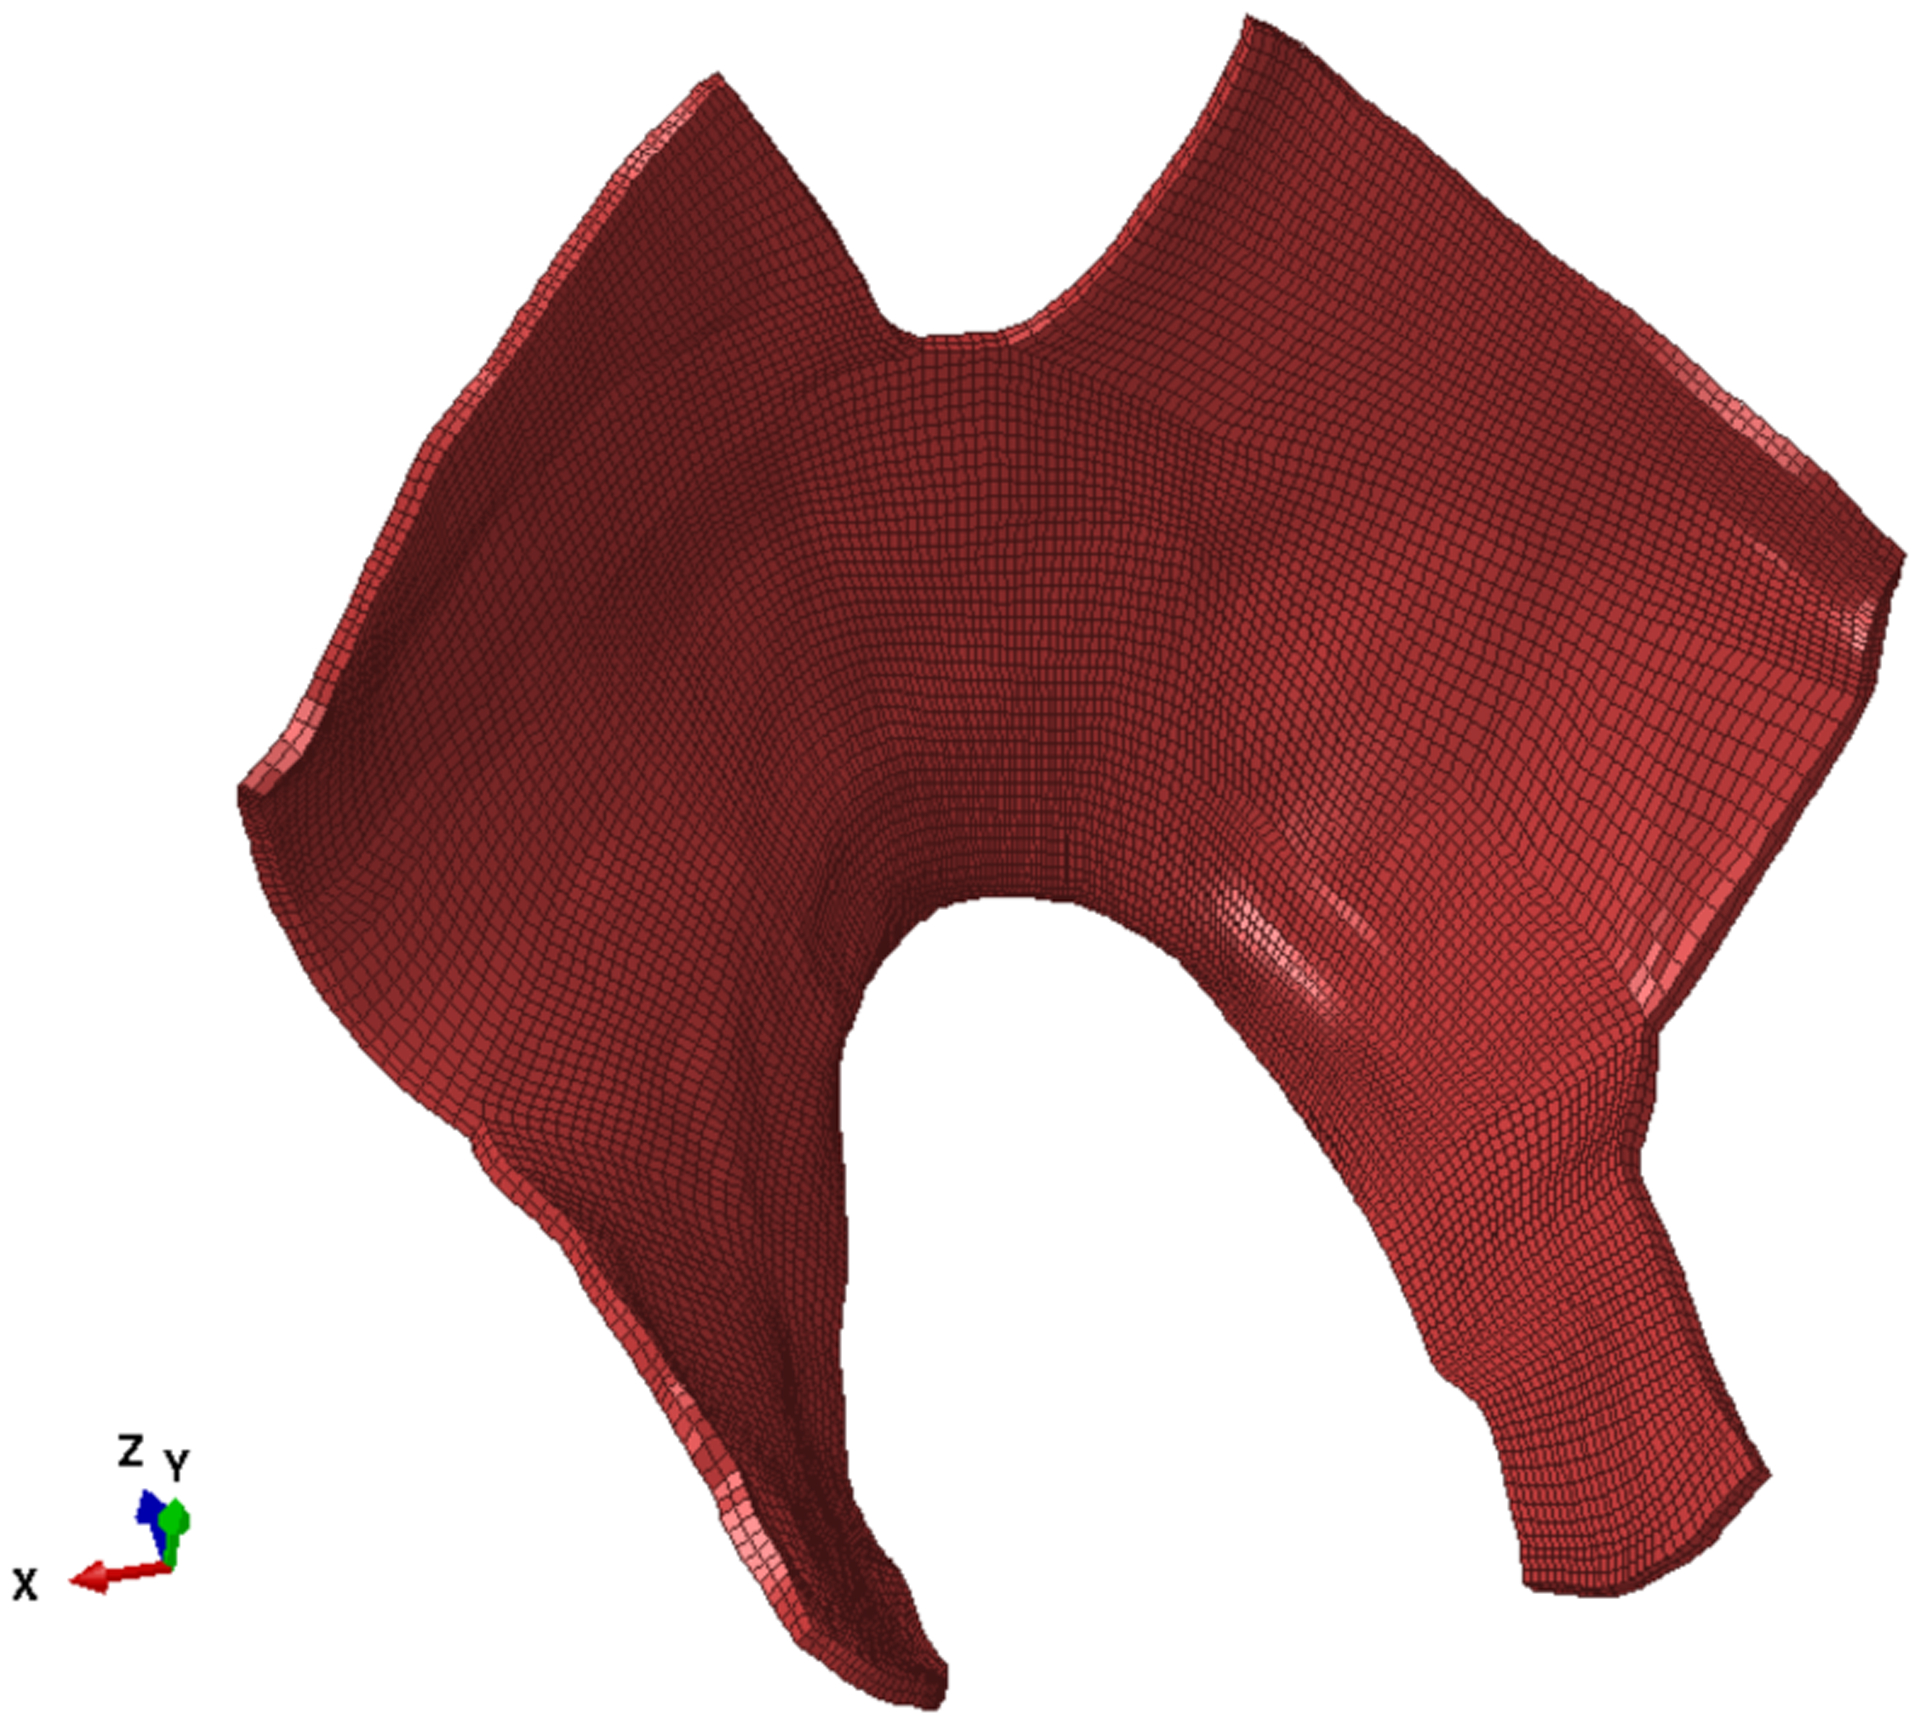
The 3D finite element model of the levator ani muscles was created on the basis of a geometric data point set acquired from a female cadaver measurement by Janda et al28. The creation of this geometry is described in Parente et al55. Briefly, the geometric point set was used to define a 3D surface, which was extruded to define a volumetric 3D finite element mesh. For the thickness, a constant value of 2 mm was assumed55. Figure 2a shows this geometric model, which includes the levator ani muscles modeled as 1 structure. A schematic representation of the PVM is shown in Figure 2a with highlighted edges (in green) that were fixed. The main dimensions are described in Figure 2b along with the fiber directions of the model, which were defined on the basis of the literature29. We noted that the area of the model hiatus was set to 32 cm2 at the initial stage of the simulation (corresponding to the beginning of the second stage of labor) to be representative of pregnancy-induced changes and complete dilation by the beginning of the second stage of labor. This value ranged between 15 and 57 cm2, which was reported in late pregnancy66,79.
Figure 2–
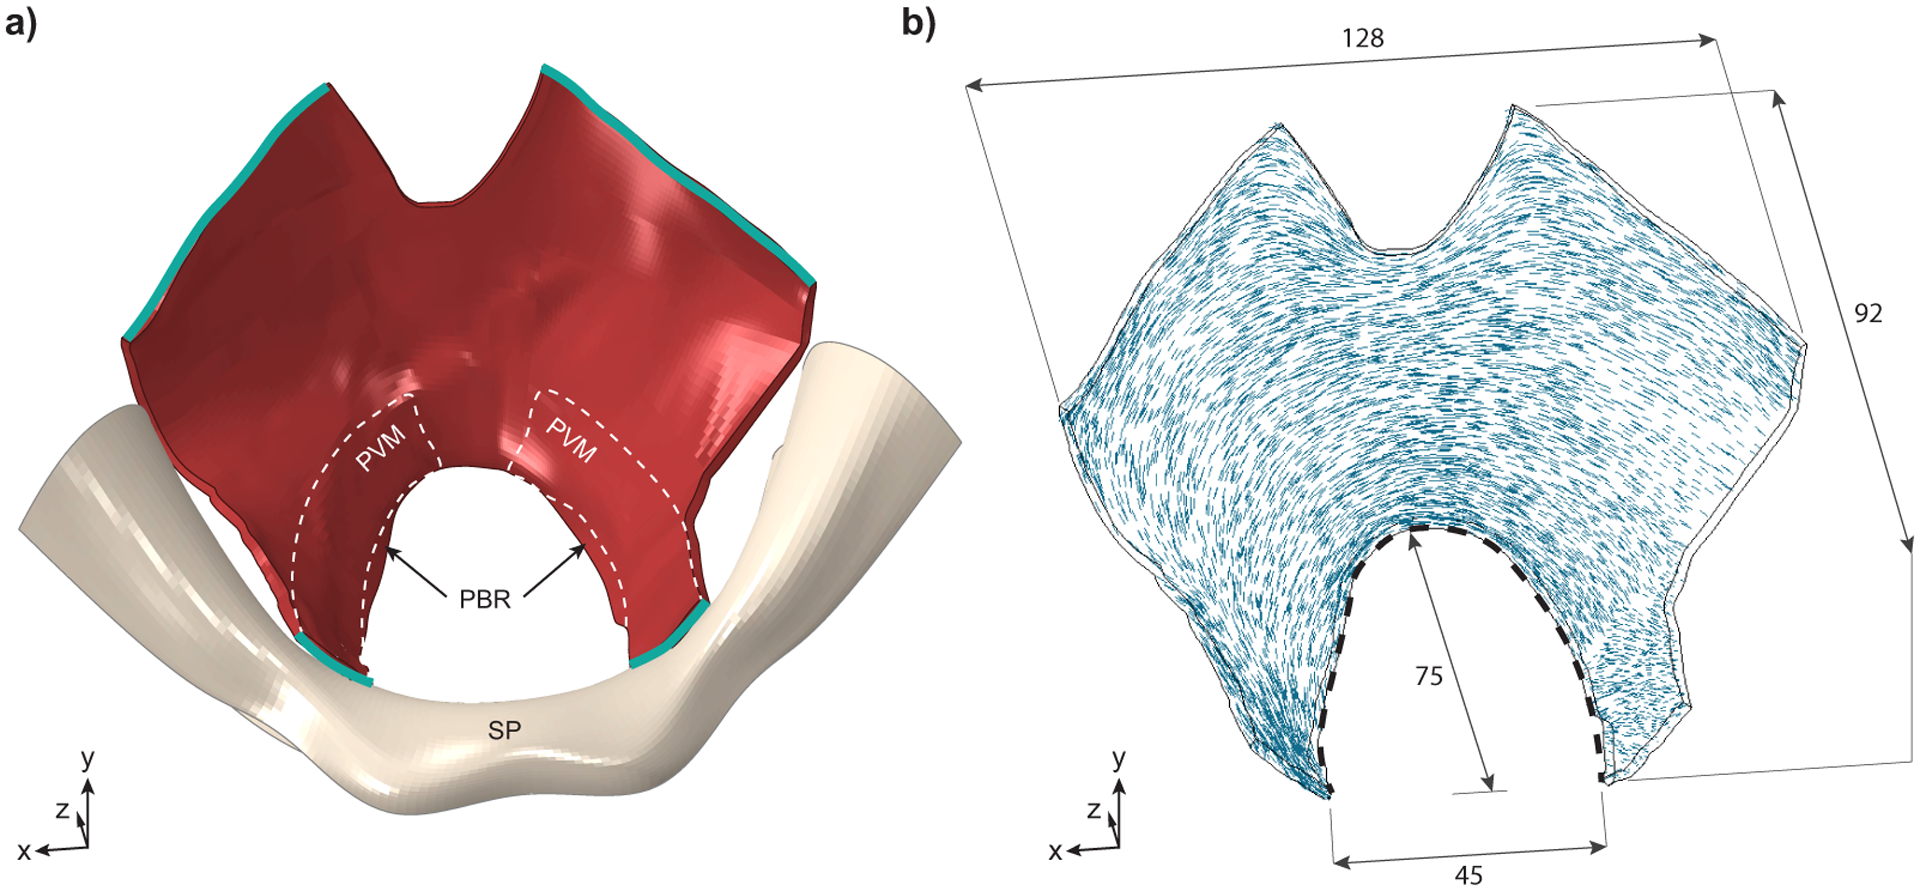
Superior view of the structure representing the levator ani muscles. a) 3-D geometry of the levator ani muscles, in red, with the pubic bone and symphysis pubis (SP) shown in ivory. The levator muscles attach laterally to the ischial spines and posteriorly to the sacrum, neither of which are shown for simplicity. The outline of the pubovisceral muscle (PVM), the most anterior and caudal portion of the levator ani muscles, is shown with dashed white lines: it takes origin from the pubic bone on either side of the symphysis pubis (SP) and inserts into the perineal body (not shown) near the midline. The vagina, anal sphincter and remaining portions of the levator ani, including the iliococcygeus, coccygeus, and puborectal muscles (PBR) are not delineated for simplicity. The nodes along the green edges were fixed. b) View of the model levator ani muscle showing fiber directions within the muscle and main dimensions (in mm). Black dotted line shows the hiatal length used to calculate the stretch.
Figure 3 shows the finite element model of the fetal head, which was obtained by a simplification of the model described by Parente et al55. This simplification removed intricate details in the fetal head, such as the nose, which often caused numeric problems without being relevant to the simulations. Despite these simplifications, the main dimensions were maintained and represent a 50th percentile full-term fetus33, with a cross-sectional area of 9199 mm2.
Figure 3–
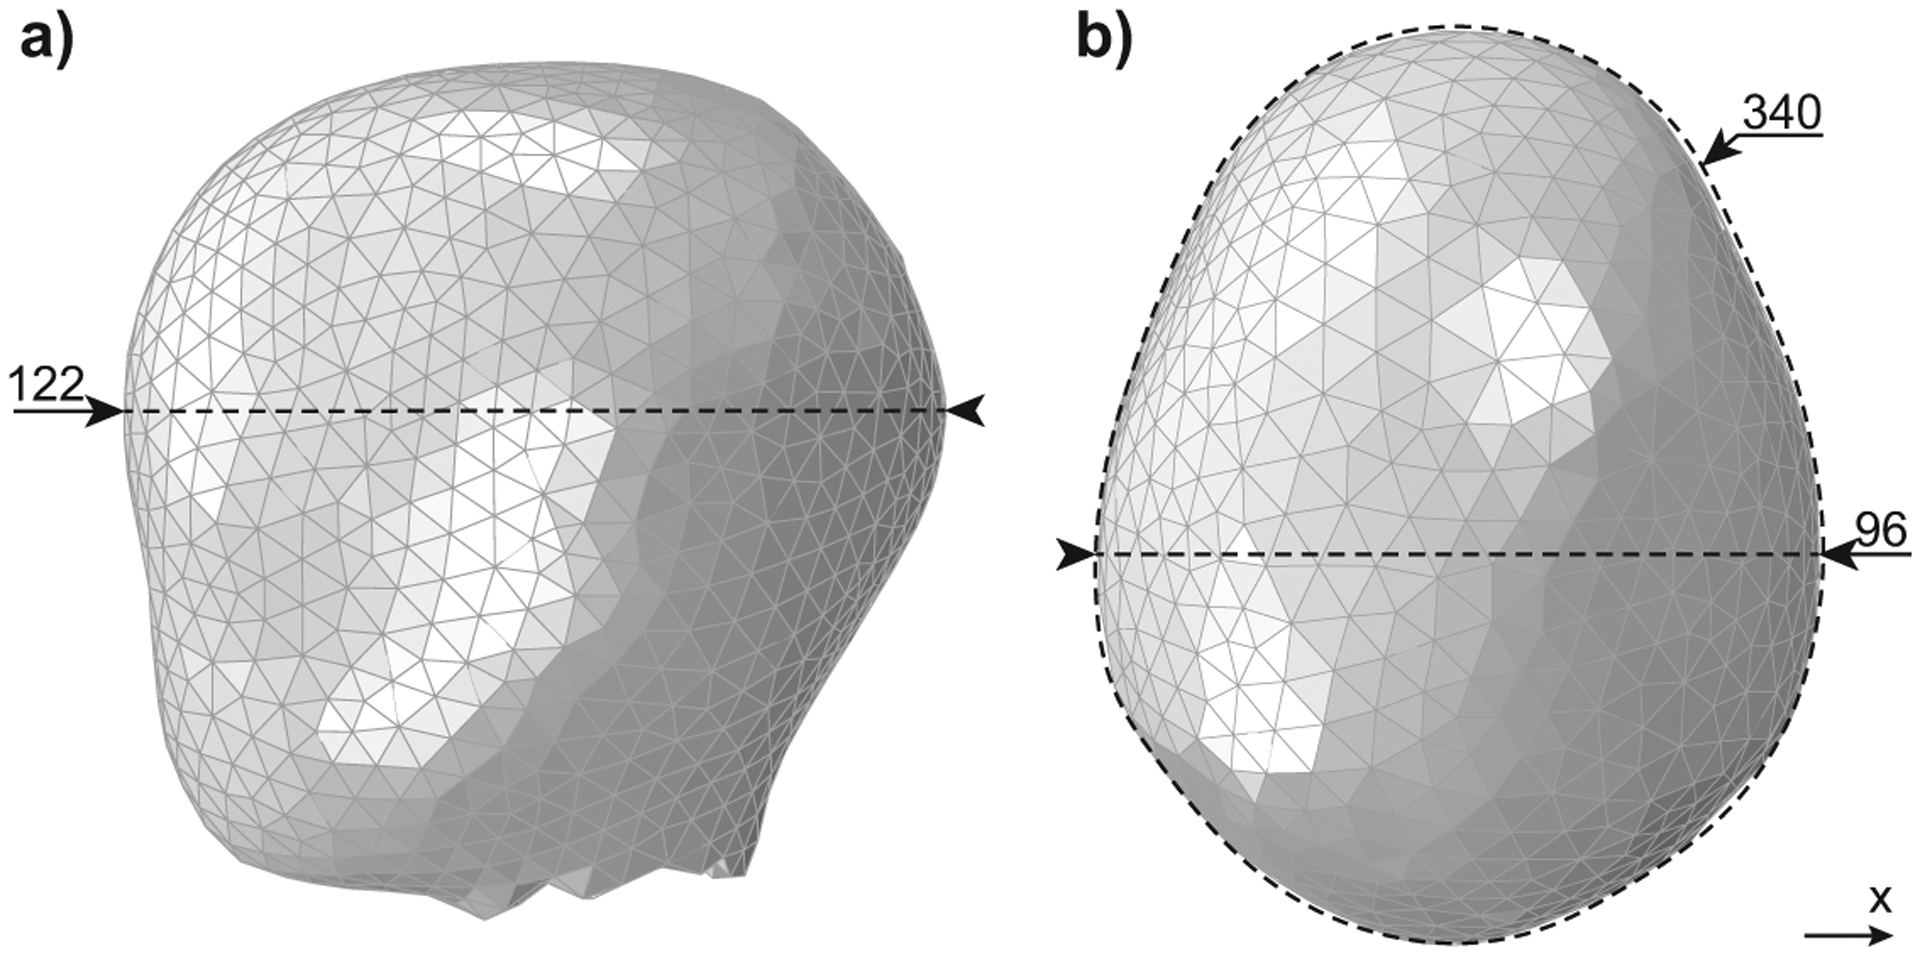
Finite element model of the fetal head showing the a) occipitofrontal diameter, and b) biparietal diameter with head circumference. All dimensions shown are in mm.
The initial position of the head was assumed as a vertex presentation with occiput anterior. The fetus descent was defined by the uterine and maternal forces, applied to a fetal head reference node. The head flexion, applied to the same reference node, was added so that the smallest head diameter was presented in the birth canal at all instances. Regarding the fetal boundary conditions, all displacements were free throughout the simulation. The lateral and transversal constraints were imposed by the rigid surface representing the pubic bone and pelvic floor muscles. Except for head flexion concerning the X-axis (Figure 3), all other rotations were otherwise fixed. Please refer to the Appendix A for further details on the finite element meshes.
2.2. Material Models
The material model for the levator ani muscles incorporated several realistic properties, such as transverse isotropy, visco-hyperelasticity, and the ability to weaken (accumulate damage) because of repetitive submaximal loadingb. In contrast, the fetal head and “pubic bone” surface, not so critical to the biomechanical model in terms of material properties, were simplified to increase computational efficiency. The fetal head was modeled as a hyperelastic material as the outer layer with a rigid interior. Hyperelasticity is a feature of all soft tissues, including the levator ani, as they can deform significantly. The “pubic bone” surface was modeled as an almost rigid elastic material with very high stiffness. Details on these material models can be found below, and in the Appendix A.
Levator ani muscles
A transversely isotropic visco-hyperelastic model, including cumulative damage with nonlocal averaging, was used to simulate the levator ani muscle behavior. The transversely isotropic hyperelastic behavior was captured by the Holzapfel-Gasser-Ogden (HGO) model27 and viscoelastic behavior by the generalized Maxwell model, as described by Holzapfel and Gasser26. These phenomenological models were chosen as they are relatively simple to implement (eg, compared with complex multiscale models) and have a reasonable number of material parameters (as the relationship between stress and strain was empirically modeled from the experimental observation). The HGO and generalized Maxwell model, although initially developed to characterize the behavior of arteries26,27, are robust and have been successfully applied to several soft biological tissues22,64. Moreover, the fatigue damage was simulated using a phenomenological model, whose evolution equation was previously developed on the basis of experimental evidence75. Briefly, the damage accumulation is a function of the energy required to deform the material, which accumulates as the material suffers several deformations (loading cycles). As such, if the material deforms significantly, the energy required to deform it will be higher as will the damage accumulation. However, if a smaller deformation is applied several times, the energy required to deform will be the sum of the energy required for each deformation, also causing a considerable damage accumulation. The damage accumulation is measured quantitatively in the muscle fibers by the damage variable , with representing the undamaged state and a complete failure. This damage variable will affect the stress response, mimicking the effect of reduced mechanical integrity observed experimentally, as approaches 1. In a previous work, these material models proved capable to capture the behavior of sheep pelvic floor muscle tissue, under repetitive submaximal loading75.
Further details and equations regarding the constitutive model can be found in the Appendix A with a table showing the material parameters used.
Fetal Head
The hyperelastic part of the fetal head was modeled following the Neo-Hookean law (equation (A.3) in the Appendix A). The parameter was obtained from the literature12, C10=0.13 MPa, to represent a skin-like behavior.
Pubic Bone Surface
The surface that constrains the fetal head, the “pubic bone,” was modeled with a Young modulus of 1000 MPa and a Poisson coefficient of 0.25.
2.3. Maternal pushing
Rempen and Kraus59 measured the uterine pressure near the fetal head in 44 spontaneous deliveries with a vertex presentation. The results showed that the basal pressure averages 2.6 kPa and that a uterine contraction increased it to an average of 8.5 kPa5,59. A maternal push added an average of 10.5 kPa, thereby increasing the total pressure to 19 kPa at the peak of the uterine contraction5,59. These intrauterine pressures apply an expulsive force on the fetal head that can be calculated by multiplying each pressure by the fetal head cross-sectional area5. The fetal head cross-sectional area is calculated in calculated in the Geometric model and boundary conditions section, and the resulting peak forces are listed in Table 2.
Table 2 -.
Calculated expulsive force acting on the fetal head at the peak of the uterine contraction, at the peak of the maternal push, and at the peak when the 2 variables are combined
| Peak Uterine Contraction (N) | 74 |
| Peak Maternal Push (N) | 101 |
| Peak Uterine Contraction + Maternal Push (N) | 175 |
To simulate directed pushing, three 10-second maternal pushes were added to the uterine contraction profile, according to the literature9,24,34,36,39,58,60. As a key feature of the directed pushing can be seen as extended use of the Valsalva maneuver36, we defined this pushing profile throughout the paper as the Valsalva-push pattern.
We assumed the volitional maternal effort would take 1 second to ramp up and 1 second to decrease (Figure 4a). The profile of the combined efforts is shown in Figure 4b.
Figure 4 -.
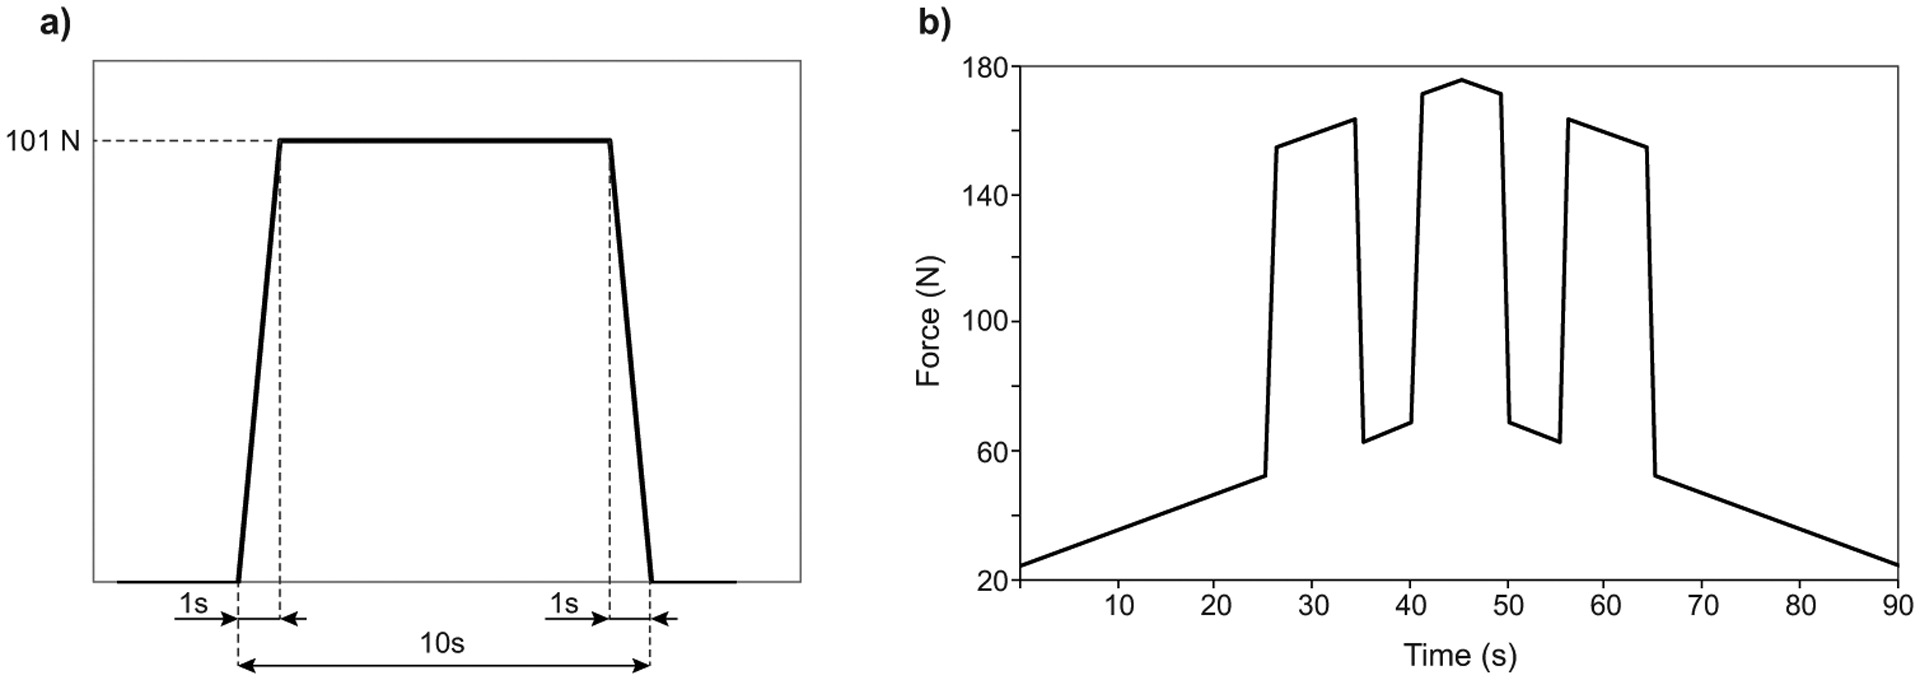
Expulsive force placed on the model fetal head during simulated directed pushing. a) Profile of a single 10 seconds push and b) Valsalva-push pattern: three 10 second pushes superposed upon the 90 s uterine contraction.
When spontaneously pushing, women reportedly push powerfully 1 time as the contraction reaches its peak39 or perform 3 to 5 smaller pushes (each lasting for 3–5 seconds with a 2-second interval)4,23,60,63. As such, we decided to standardize 3 possible spontaneous pushes, analyzing their effects separately. First, we tested the possible scenario of women pushing powerfully 1 time as the contraction reaches its peak. This is the designated 1-push pattern (Figure 5a), with 1 powerful maternal push lasting 10 seconds (Figure 4a) superposed symmetrically over the peak of the uterine contraction; moreover, for the remaining analyses, a shorter volitional maternal effort lasting 5 seconds was defined, with the profile represented in Figure 5b. As it is reported that women spontaneously perform between 3 and 5 smaller pushes, we tested separately the extremes and defined the 3-push pattern (Figure 5c), with three 5 seconds pushes superposed on the uterine contraction and the 5-push pattern (Figure 5d), with five 5-second pushes superposed on the uterine contraction.
Figure 5 -.
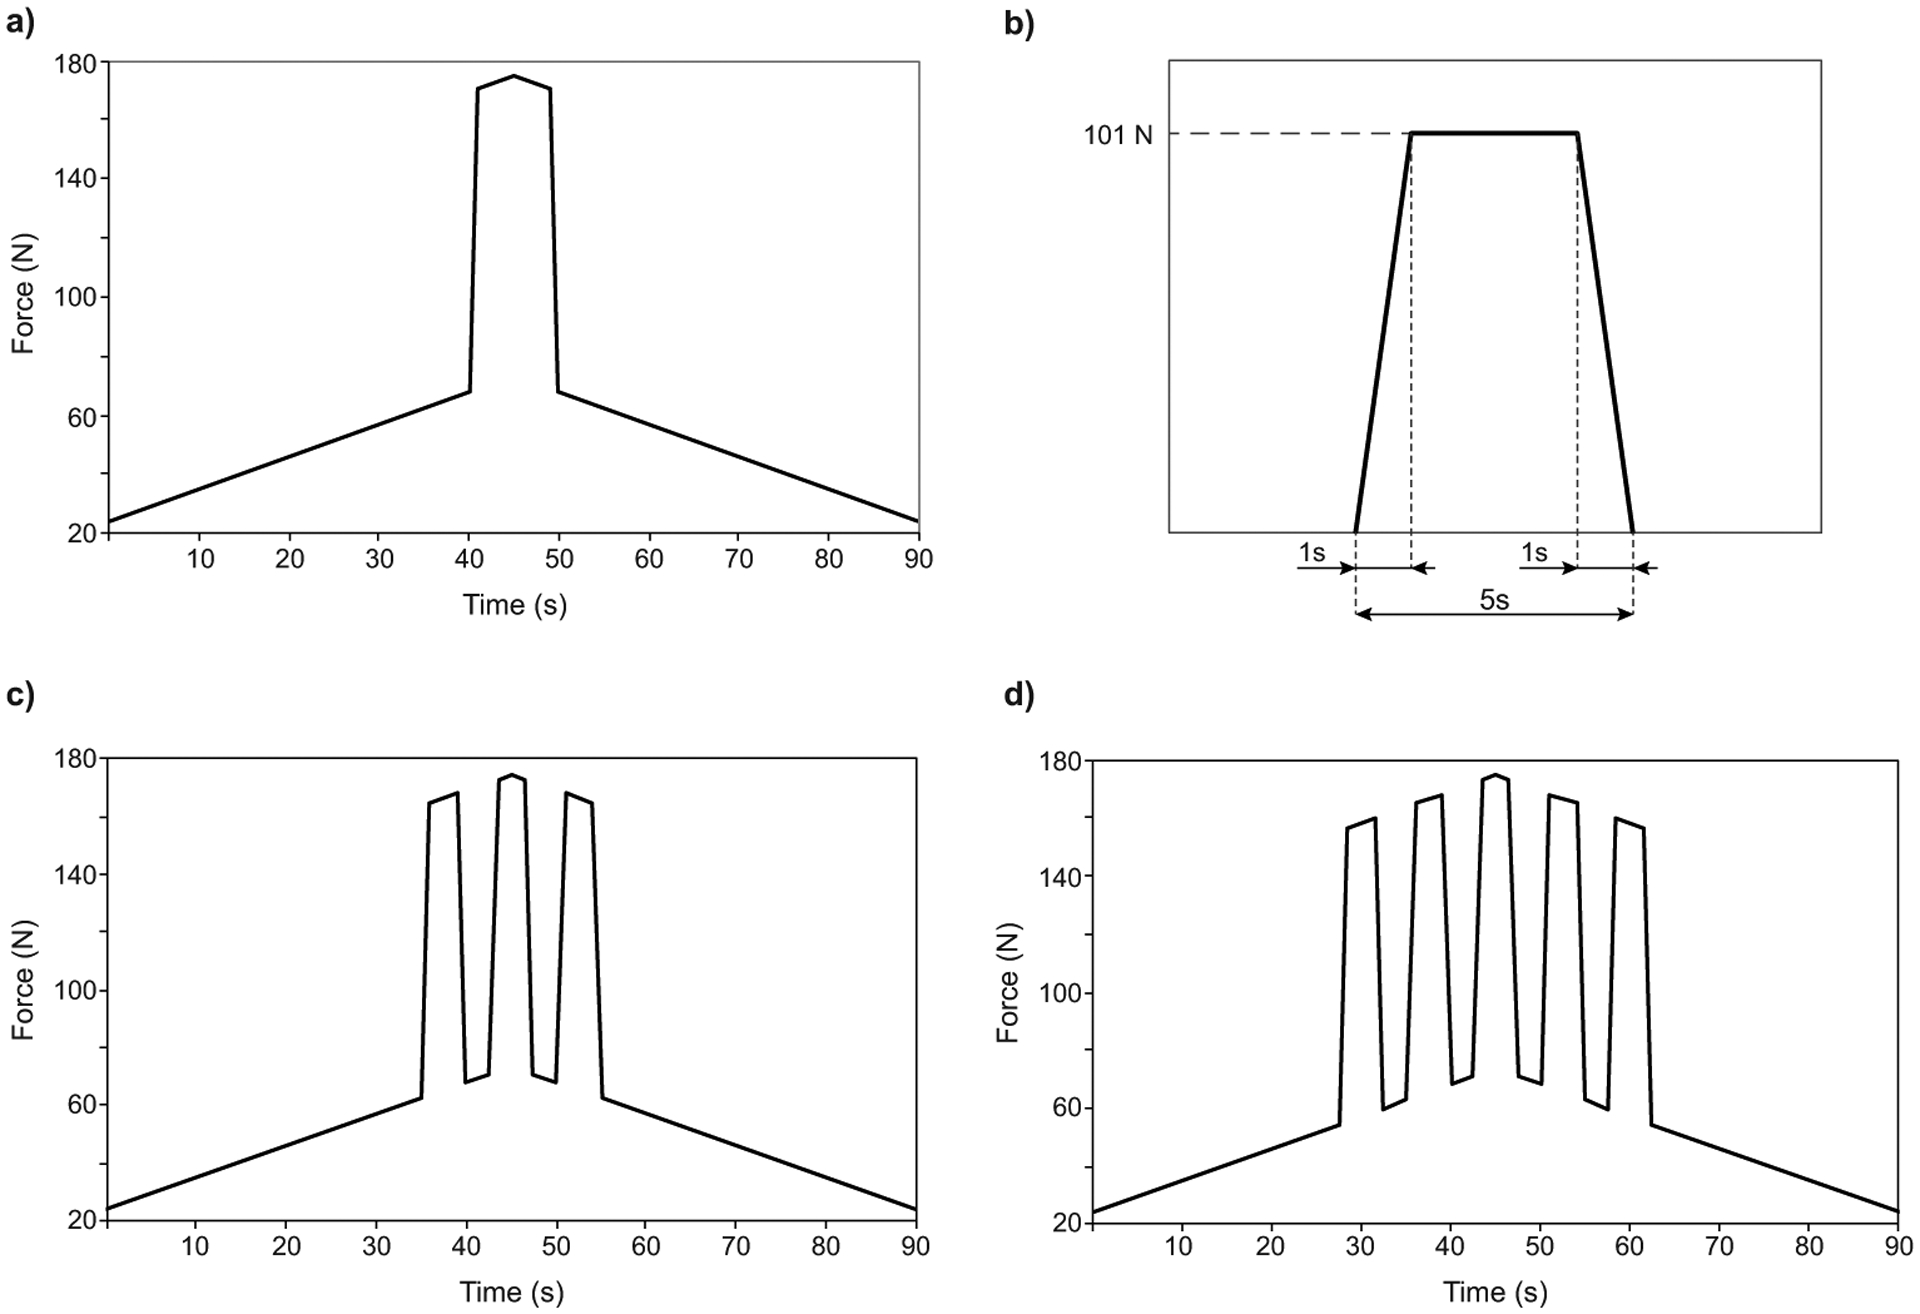
Details of the expulsive force placed on the model fetal head during simulated spontaneous pushing. a) 1-push pattern: one 10 second push superposed upon the 90 s uterine contraction b) Profile of a single 5 second push, c) 3-push pattern: three 5 second pushes superposed upon the 90 s uterine contraction. d) 5-push pattern: five 5 second pushes superposed upon the 90 s uterine contraction.
2.4. Biomechanical model evaluation
To evaluate the complete biomechanical model, we analyzed the following parameters:
The evolution of the vertical displacement of the fetal head: measured at the same reference node in the 4 simulations and plotted against time. This vertical displacement is useful for comparing the fetal descent between the 4 simulated pushing patterns; however, it does not correlate with any obstetrical measurements. We ended the simulations after the complete passage of the fetal head, which coincided with a vertical displacement of 153 mm.
The stretch ratio of the hiatus contour: the contour of the hiatus was chosen (Figure 2, B: black dotted line) as it was shown to sustain the highest stretches.40 The stretch ratio (λ) was calculated by dividing the current length by the initial length: λ = L⁄L0. This parameter can be related to strain, , as: ε = λ − 1.
The distribution of the damage variable in the muscle fibers, : This distribution is color coded as follows red: , orange: , yellow: , green: and blue . We defined a risk qualitative scale as follows: red areas represent ‘Critical’ risk, since the muscle fiber mechanical properties are affected up to 100% (complete tear), orange areas are ‘High’ risk, yellow areas are ‘Noteworthy’ risk, green areas are ‘Moderate’ risk and blue areas are ‘Low’ risk.
The damage evolution at the critical location, which is the node of maximum predicted damage. We chose this approach instead of averaging around a set of nodes because a nonlocal averaging is already performed to reduce mesh dependency (Appendix A provides further details).
The maximum damage at the critical location as a function of the total time of the simulation.
The maximum damage at the critical location as a function of the time spent in active pushing. This time was measured by counting the number of maternal pushes performed and multiplying by their duration.
3. Results
The maximum stretch ratio was 1.87 for the 1-push and 5-push patterns, 1.83 for the Valsalva-push pattern, and 1.80 for the 3-push pattern. As the difference among the 4 simulations is merely the applied maternal pushes, it was expected to result in similar values of muscle stretches.
Figure 6 shows the vertical displacement of the fetal head with time for the 4 simulated pushing patterns. The spontaneous 3-push, 5-push, and the Valsalva-push patterns needed 4 complete contractions and reached the end in the first half of the 5th contraction. The spontaneous 1-push pattern took longer to reach the final stage, which occurred in the initial stage of the 6th contraction. Overall, the progress of the fetal head was similar. We can see that in the initial stage of each contraction, when the forces are slowly increasing, the fetal head did not descend. Descent only occurred when the maternal pushes were initiated. Moreover, one can see that the fetal head did not continuously advance but retreated briefly during the unloading and resting phases of the maternal push and during the uterine contraction resting phase. For the pushing patterns involving more than one maternal push, this effect was seen occurring more than once in a contraction, whereas the spontaneous 1-push pattern had a smoother pattern of fetal advance.
Figure 6 -.
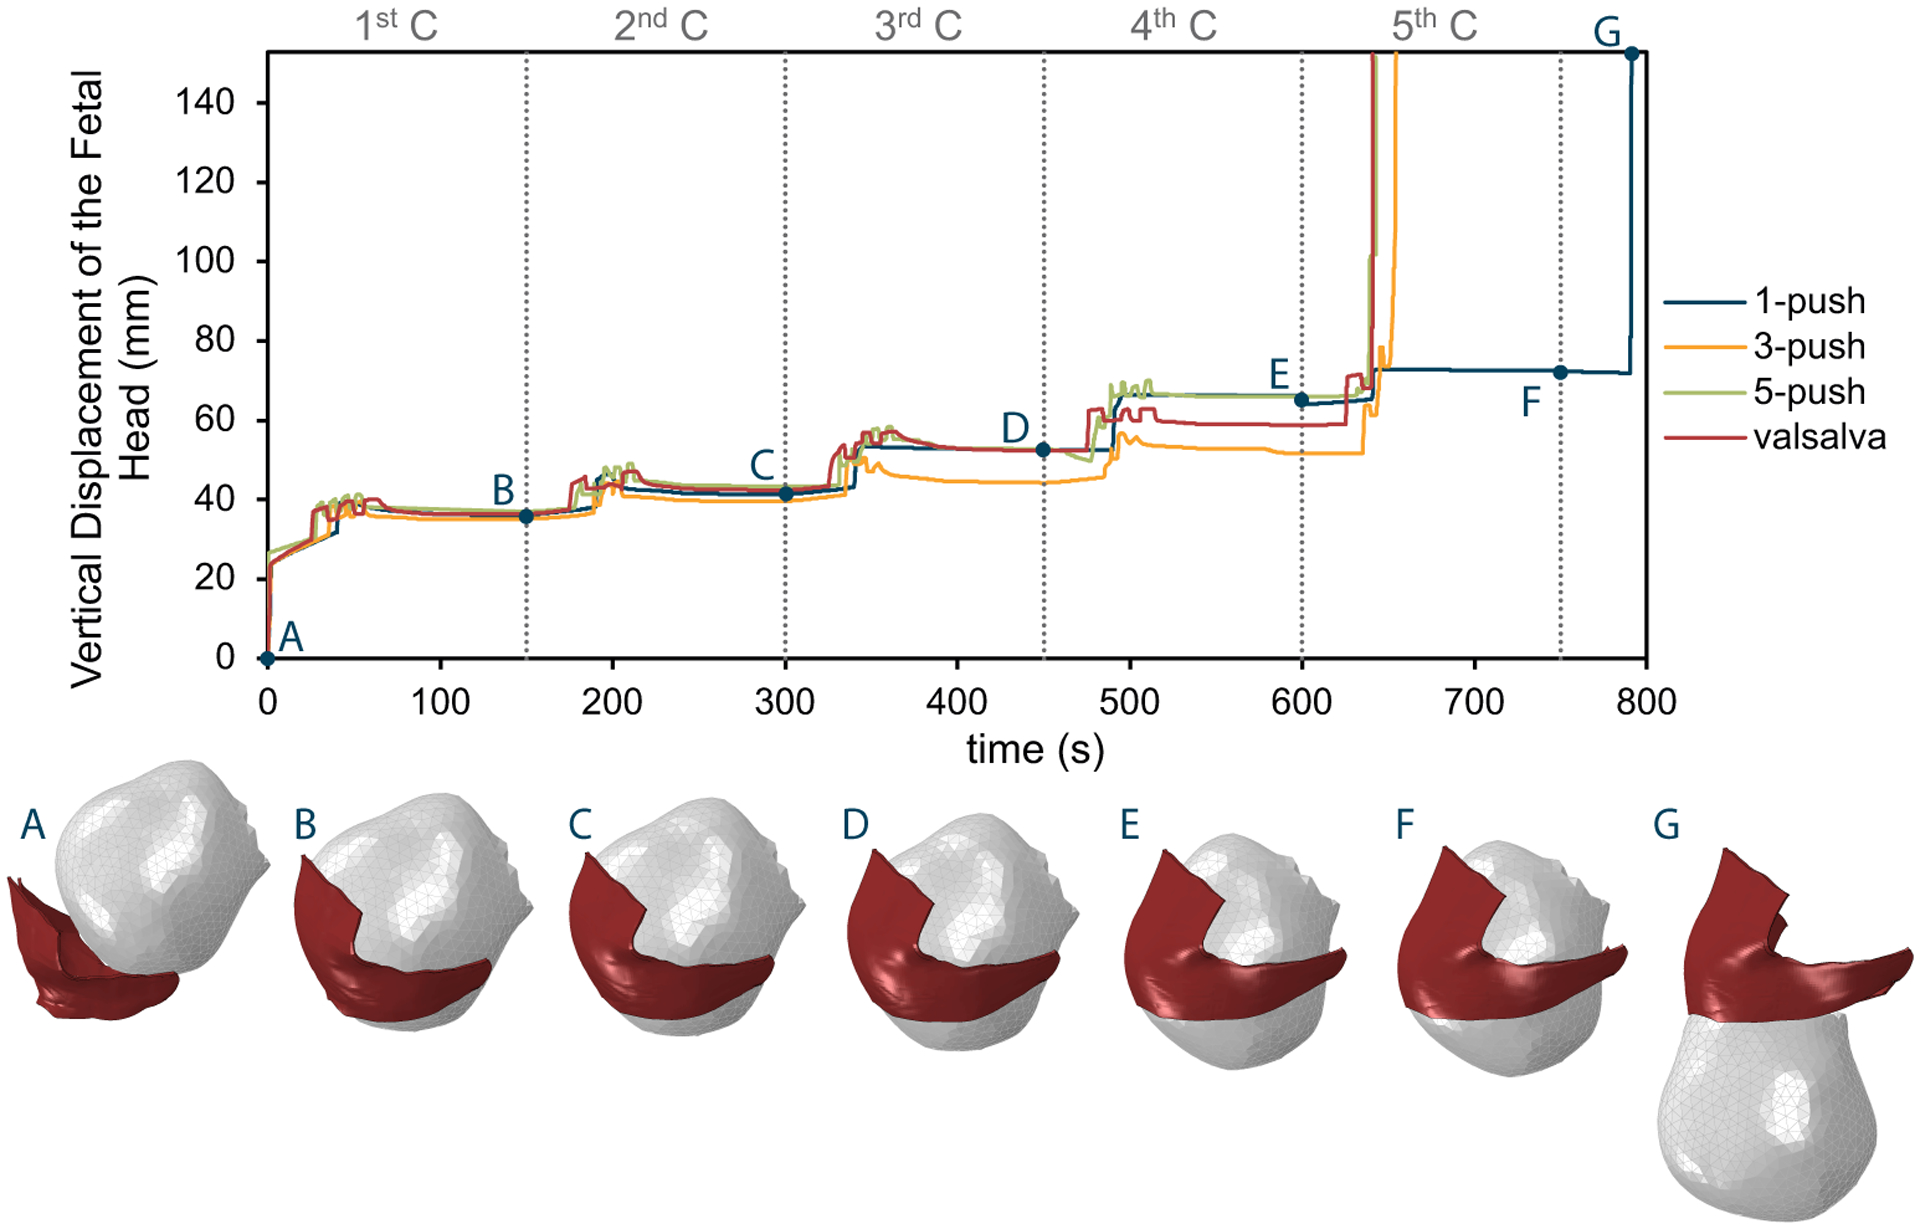
Vertical displacement of the fetal head (mm) with time (s) for the four simulated pushing patterns: 1-push, 3-push, 5-push and Valsalva-push. The pictures below show the right lateral view of the fetal head descent for the 1-push simulation at the starting point, at the end of each contraction, and in the final position. The vertical dashed grey lines represent the end of a contraction (C), labelled numerically along the top of the plot.
Figure 7 shows the damage distribution at the end of the simulation for the 4 simulated pushing patterns, with the location of the maximum value pinpointed. The critical risk location did not differ with the pushing patterns, consistently being near the right lateral origin of the PVM. The critical node is the point where the maximum damage was recorded, and this was the same for the 1-push, 3-push, and Valsalva-push patterns. The critical node of the 5-push pattern lay slightly (1.6 mm) further away from the other simulations’ critical nodes. Thus, the maximum location site was virtually the same for all tested pushing patterns.
Figure 7 -.
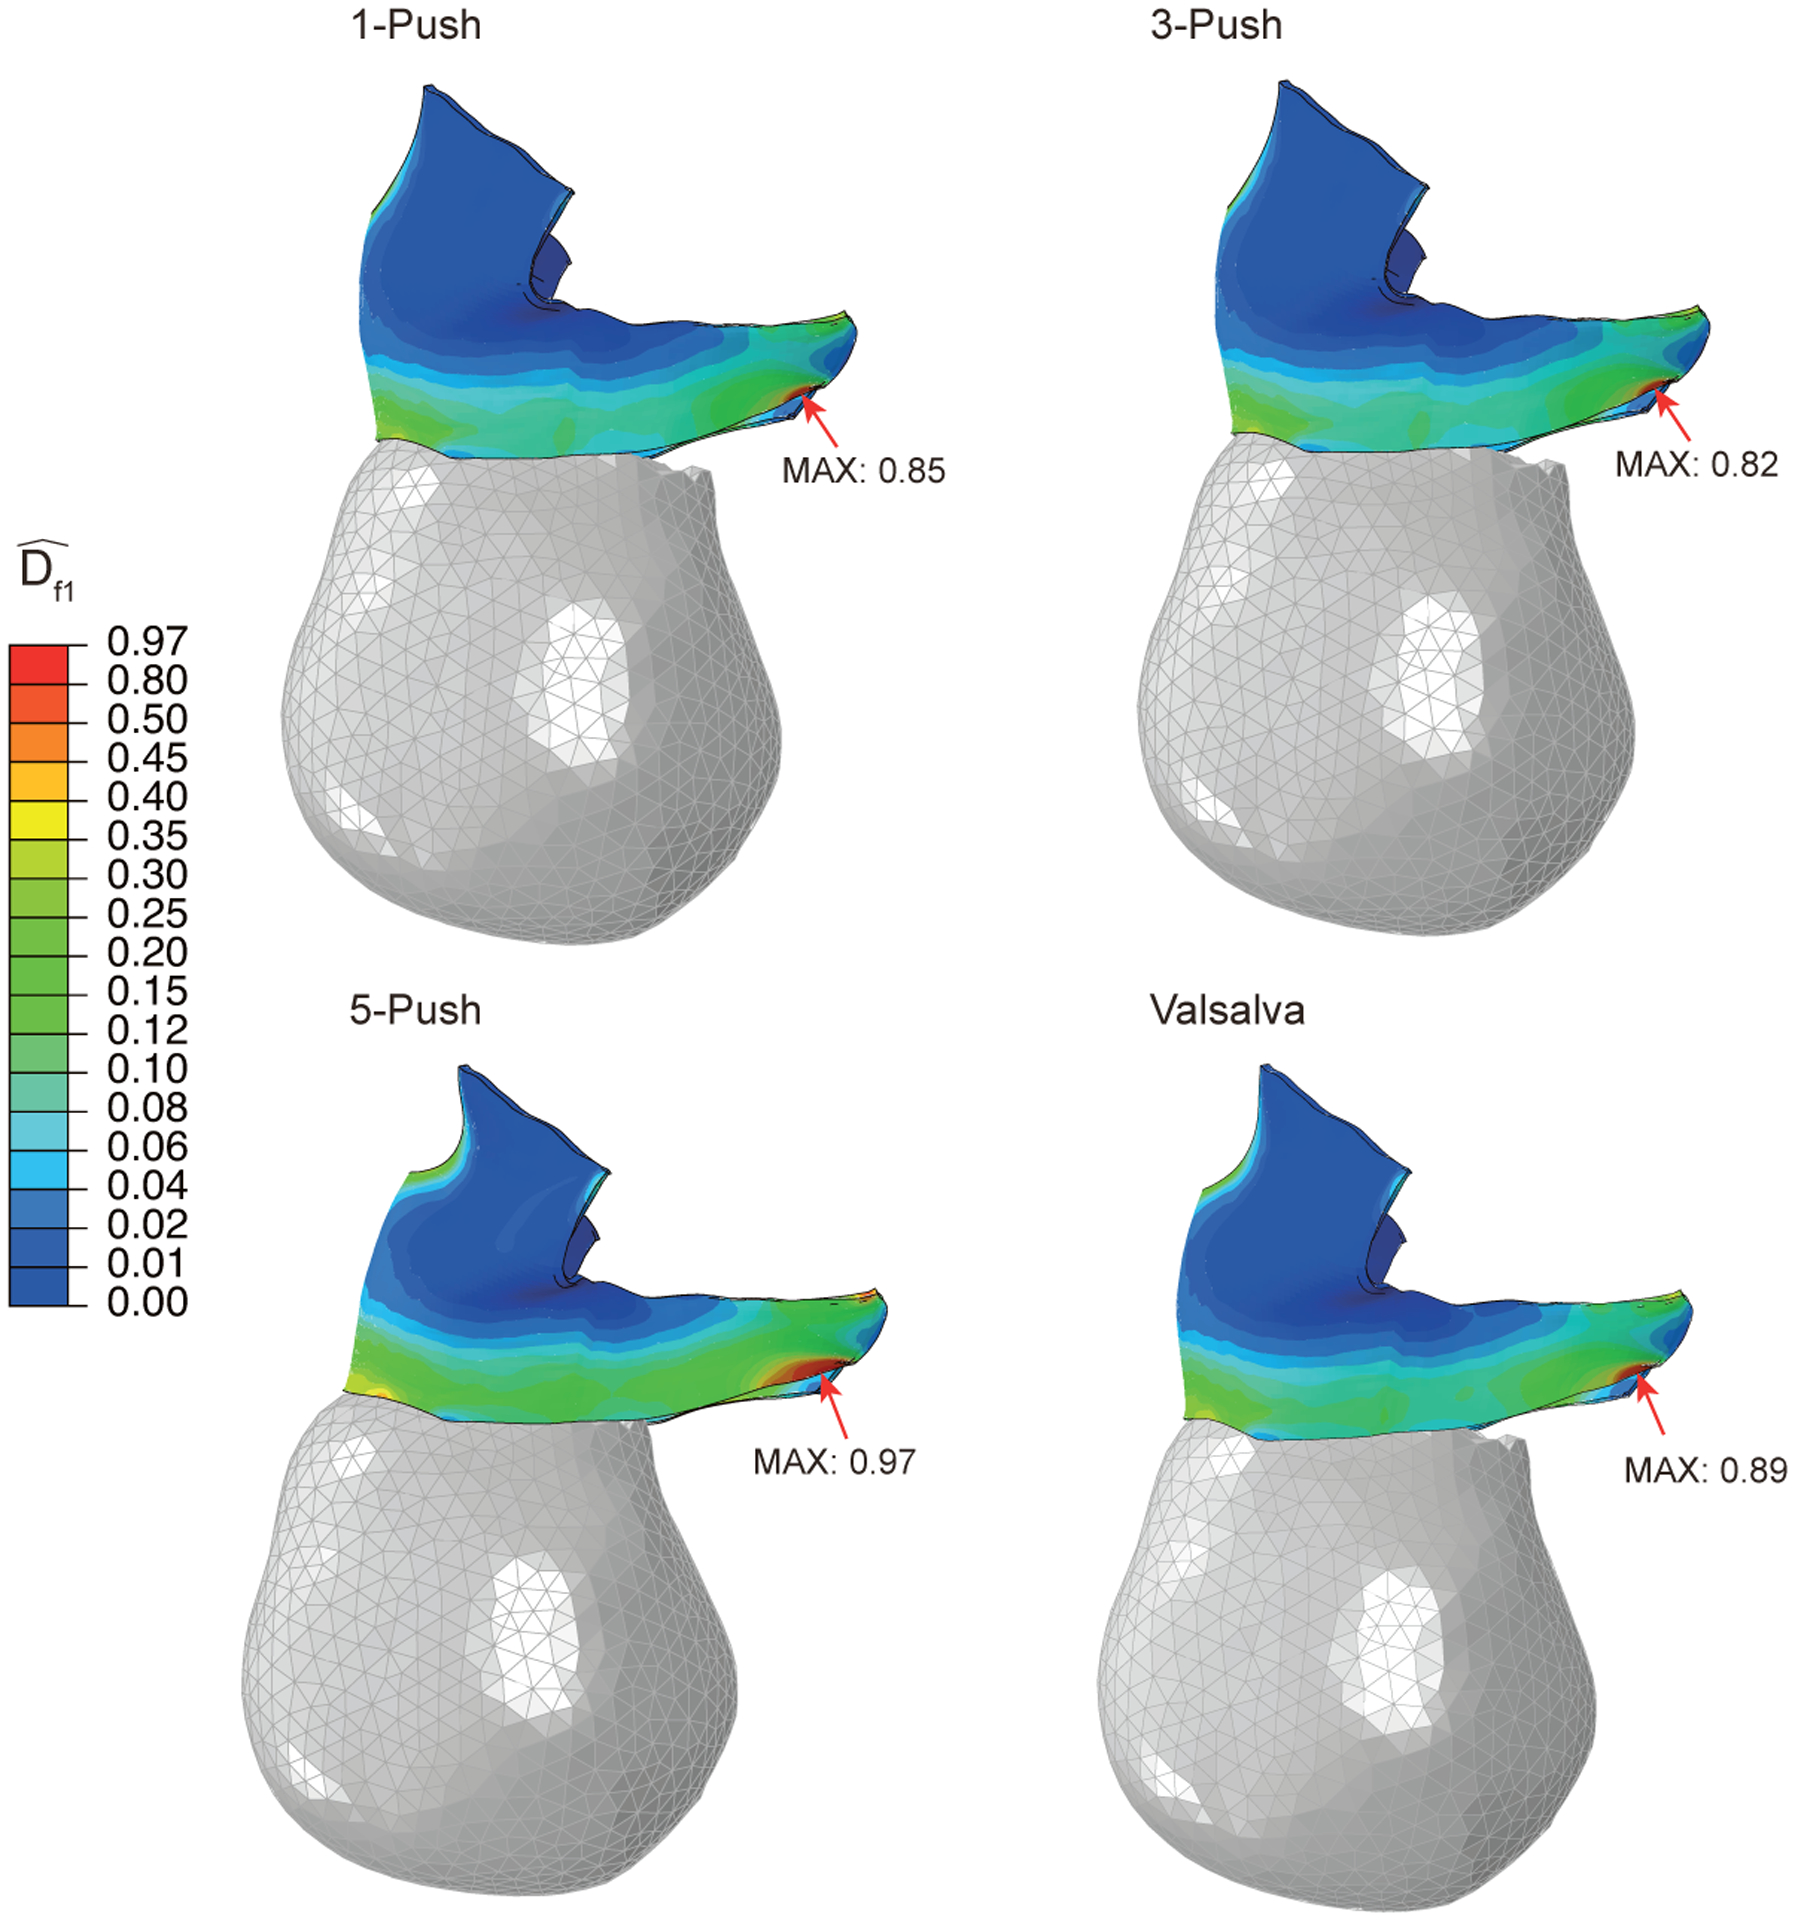
Right lateral view showing the damage distribution in the pelvic floor muscles at the end of the simulation for the four pushing patterns. The peak damage and critical node location are identified.
Figure 8 shows a quantitative view of the distribution shown in Figure 7. The boxplot includes the muscle fiber damage values predicted for every node of the pelvic floor muscles, grouping the values by the categories defined in the Materials and Methods section (critical, high, noteworthy, moderate, and low). The 5-push pattern has more critical, high, noteworthy, and moderate areas than the other pushing patterns, indicating that it is the pushing pattern that is predicted to cause the highest amount of damage accumulation. Moreover, it is followed by the Valsalva-push pattern. The 1-push pattern led to a similar damage distribution to the 3-push pattern, although more moderate-risk areas exist in the 1-push and more low-risk areas exist in the 3-push pattern.
Figure 8 –
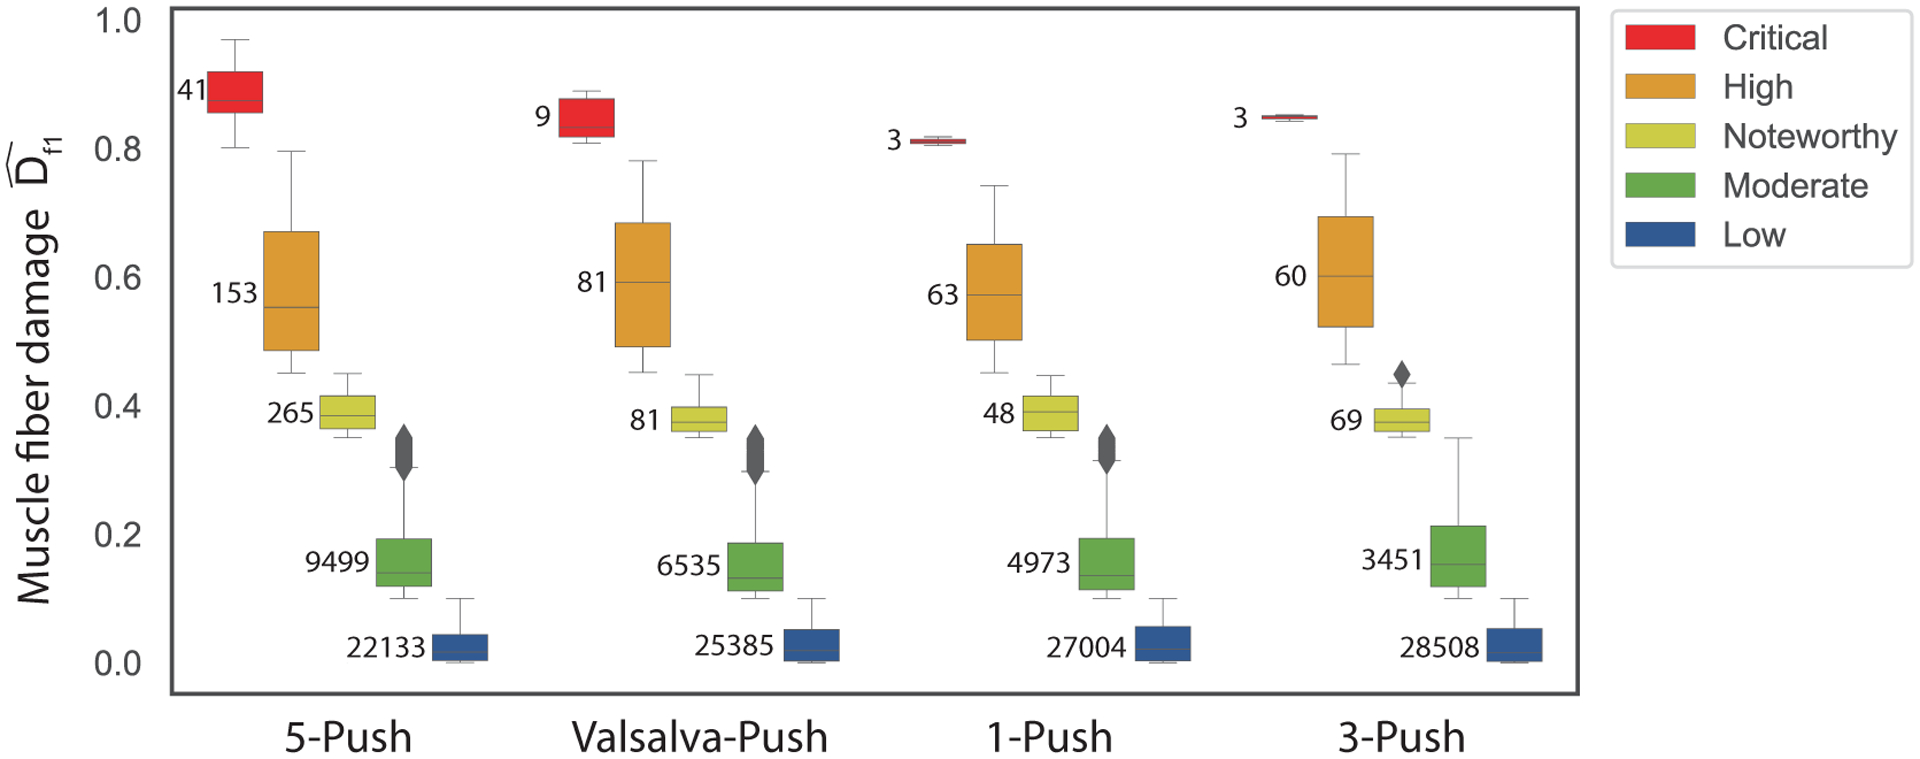
Boxplot grouping the pelvic floor nodal muscle fiber damage values at the end of the simulation for each category (Critical, High, Noteworthy, Moderate and Low) and for the four pushing patterns. Numbers inside the graph area are the number of nodes in each category. Critical: , High: , Noteworthy: , Moderate: and Low
Figure 9a shows the fatigue damage evolution at the critical node during each uterine contraction. For easier comparison, Figure 9b shows the critical node maximum value, reached at the end of the simulation. The Valsalva-push and 5-push patterns showed faster damage evolution and higher maximum values. The 3-push pattern induced the least maximum damage of all tested pushing patterns, although the damage accumulated faster than with the spontaneous 1-push pattern in almost all uterine contractions. Figure 9c and d shows an attempt to verify which time measurement is the better assessment of high-risk labor, in terms of maternal tissue damage. We can see that the simulation total time does not influence the maximum tissue damage Figure 9c), whereas the time spent in active pushing seems to exert some influence (Figure 9d). However, we did not have enough data to confirm if there was a correlation between the time spent in active pushing and the maximum tissue damage.
Figure 9 -.
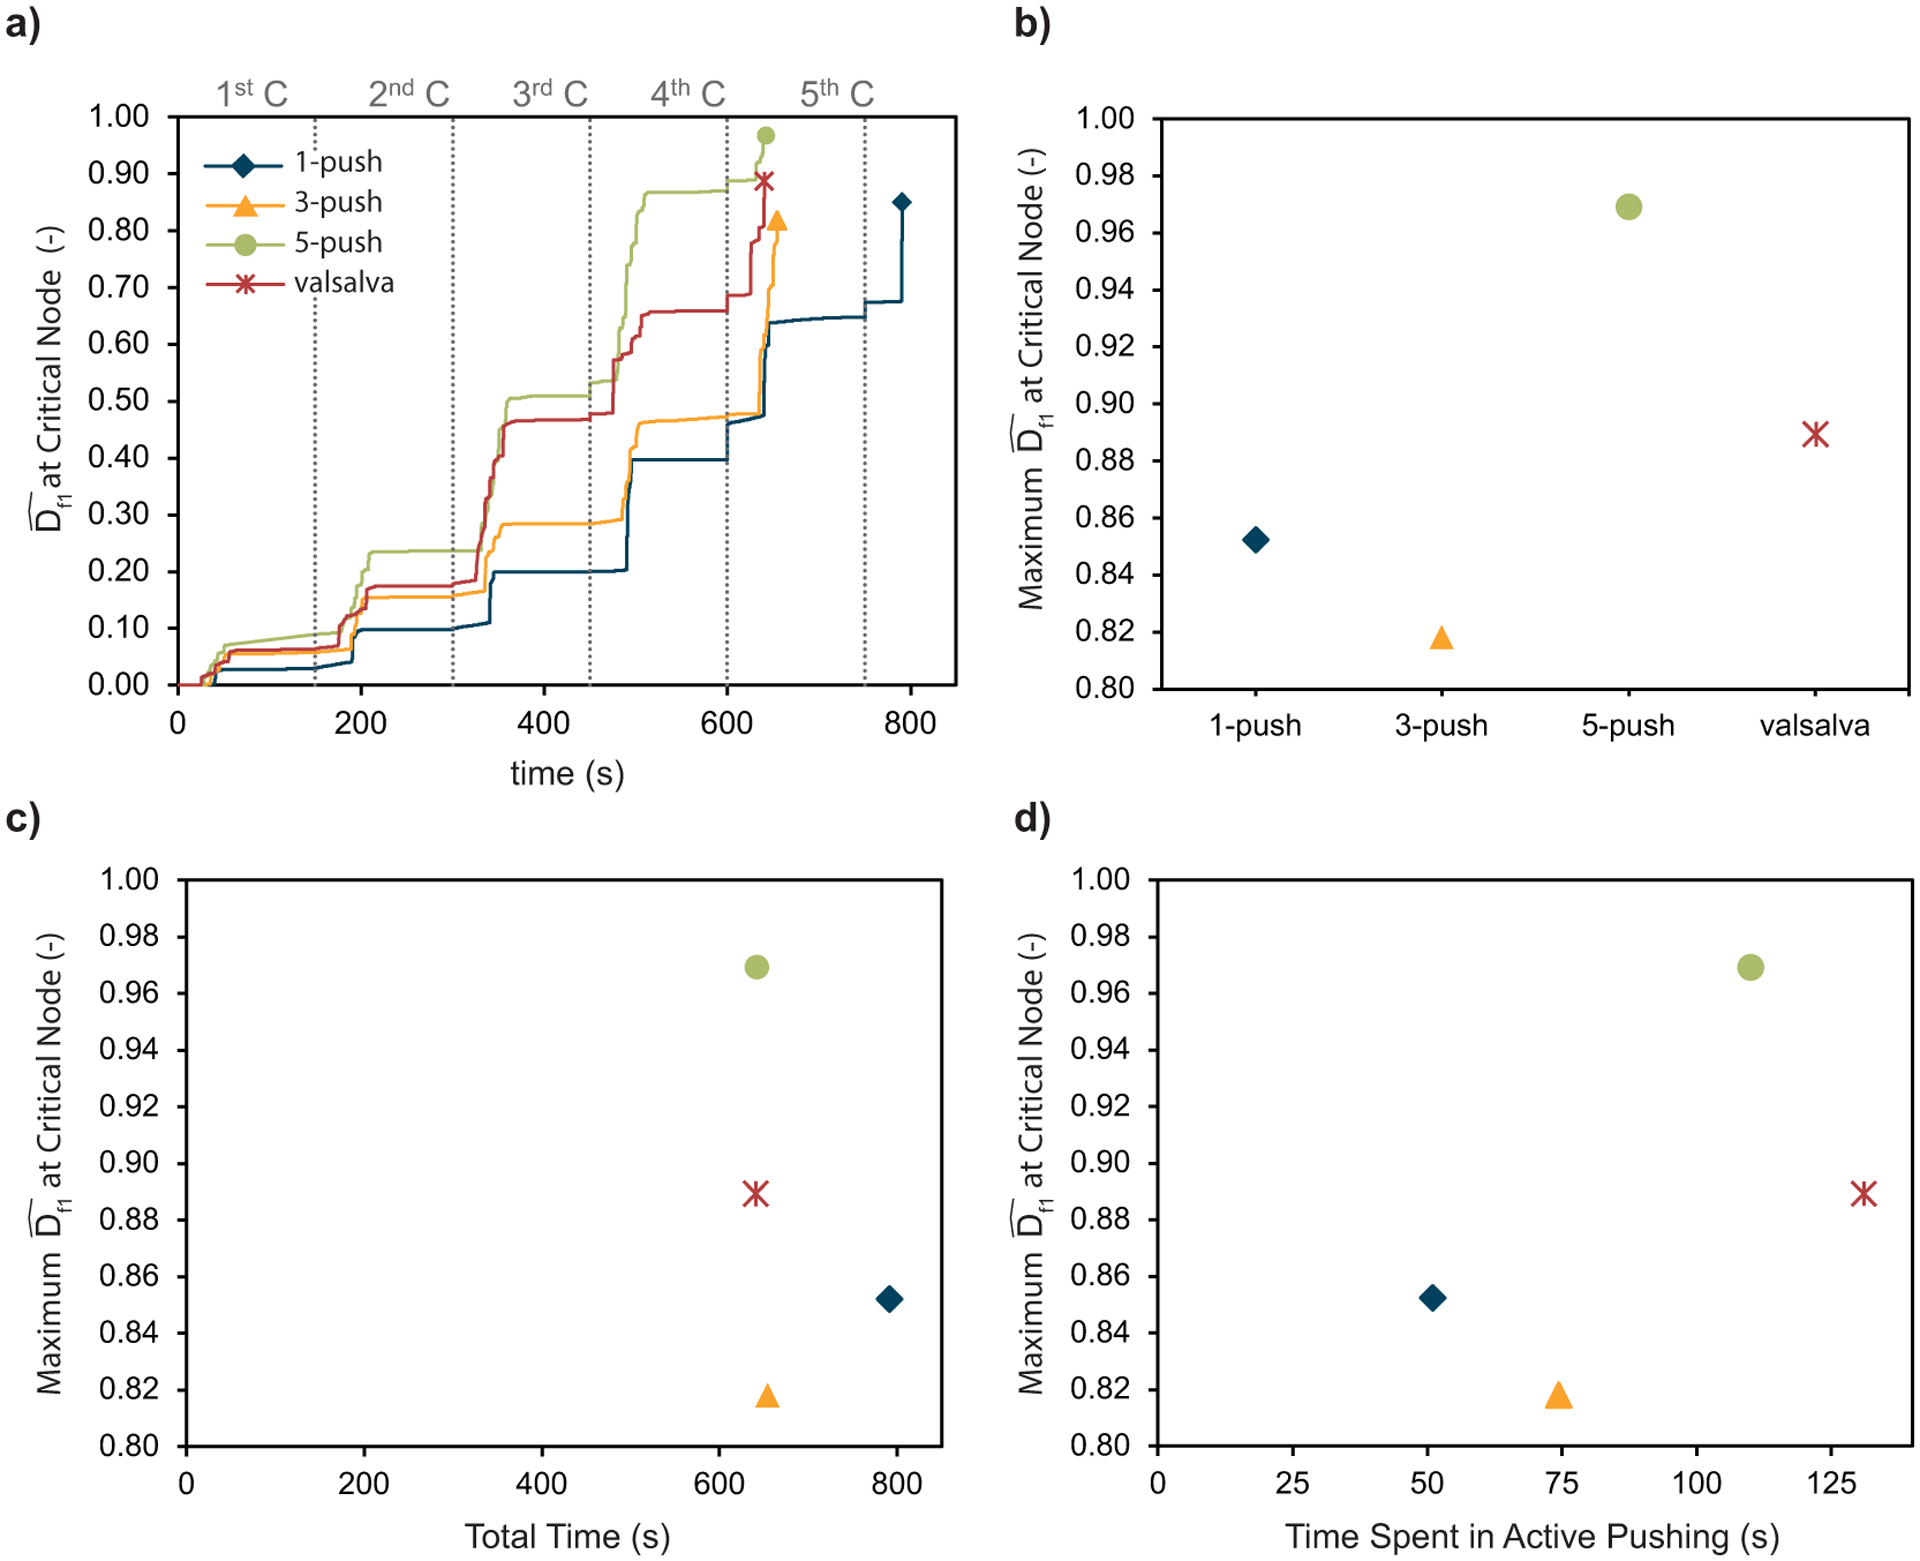
a) Fiber damage evolution at the critical node for the four simulated pushing patterns, b) Comparison of the fiber maximum damage at the critical node for the simulated pushing patterns, c) Fiber maximum damage at the critical node as a function of the simulations total time, and d) Fiber maximum damage at the critical node as a function of the time spent in active pushing, which is the sum of the duration of the maternal pushes.
4. Discussion
4.1. Principal findings
Our simulations demonstrated that maternal pushing efforts can influence the damage accumulation in the pelvic floor muscles. For all 4 maternal pushing patterns, the region with the most damage accumulation was near the origin of the PVM, which is in agreement with where the tears have been reported to occur using different imaging modalities21,35,45,48. The pushing pattern that minimized damage was, for each uterine contraction, 3 maternal pushes lasting 5 seconds. Performing the maternal effort for more than 5 seconds did not shorten the second stage of labor and caused more damage accumulation. The same happened when more than 3 pushes per contraction were performed.
4.2. Results in the context of what is known
This work allowed a quantitative view of the effect of vaginal delivery on regions of pelvic floor muscle that were under a remarkable degree of stretch, whichever maternal pushing pattern was used. The degree of tissue-stretch for all pushing patterns was above1.8, which represented strains above 80%. This value mainly depended on the geometries of both the fetal head and pelvic floor, which explains why it was similar across the 4 simulations. Moreover, it was dependent on the degree of flexion of the fetal head, which was kept consistent across the 4 scenarios. However, as there was a different progression of the fetal head in each case, this caused slight differences in the degree of tissue strain calculated in the 4 scenarios. Our muscle stretch ratio results were consistent with published values that range from 1.64 to 3.2640,55.
The predicted duration of the second stage of labor was similar for the 4 pushing patterns, ranging between 10 and 13 minutes. A systematic review that included 208,000 normal labors found the median durations for nulliparous women to range from 14 to 66 minutes (95th percentiles, 65–138 minutes) and multiparous women to range from 6 to 12 min (95th percentiles, 58–76 minutes)1. Although our results were shorter than the typical labor, they were still within the reported range, particularly for multiparous women. Moreover, our second stage of labor ended after the passage of the fetal head, and not the fetus, which would slightly increase our predicted second stage of labor duration.
All pushing patterns took the tissue to a critical point, with maximum damage values above 0.8, at the same location of the maximum damage as to where tears have been reported to occur in the literature21,35,45,48. One can argue that the differences were not substantial enough to conclude; however, this was also in agreement with the literature4,24,34. It may be one of the reasons that there is no consensus on the optimum pushing style from an injury standpoint, as there has not been a considerable difference in published studies (see section 1). However, we can still answer our working hypothesis as the type of maternal pushing style did result in different damage accumulations and different maximum critical damage values. Regarding the second part of our hypothesis, which was that the smaller pushes are beneficial for the mother, the answer was not so straightforward. We found that the spontaneous 3-push pattern caused the least damage and the 5-push pattern was the riskiest. Hence, it seems that the frequency exerts an important influence and that more than 3 pushes per contraction is substantially detrimental without shortening the duration of the second stage of labor. In contrast, performing only 1 push per contraction might also not be adequate, because it lengthened the duration of the expulsion stage of the second stage of labor and the damage values were still higher than the 3-push pattern. Thus, we concluded that 3-pushes per contraction is the best approach, but each push should be less than 10 seconds. Maintaining each maternal push for a 10-second duration (Valsalva-push pattern) did not bring any benefits in terms of the duration of labor and caused more tissue damage than the 3-push pattern, for which each push lasted 5 seconds. From a broader perspective, as women do not breathe during the maternal push, reducing the maternal push to 5 seconds can help counteract the reduced fetal oxygenation and mean cerebral oxygen concentrations associated with directed pushing with approximately 10-second maternal pushes2,13. Moreover, shorter maternal pushes may be beneficial if we consider muscle fatiguec and maternal exhaustion. The peak force in a volitional push can only be maintained for 2 seconds, after which the force will decline over time78. As such, maintaining the effort for 3 to 5 seconds will be more efficient from the point of view of maintaining a high expulsion force. Importantly, if the maternal pushes are performed for shorter periods, the intervening muscle recovery intervals are longer, helping to reduce the risk of maternal exhaustion11,42. Another interesting aspect of our results was that the total duration of the second stage of labor does not influence the maternal pelvic floor tissue damage. Although a prolonged second stage of labor is usually a factor to avoid, in terms of maternal injuries, it was not predicted to have an impact, and it might even be better than other management styles that cause a shorter stage of labor (ie, the 1-push pattern caused a longer simulated labor but showed less damage than the Valsalva-push and 5-push patterns). Although we do not have enough data to support this theory, our results did suggest that a better measurement for maternal risk is the time spent in active pushing, which is already well discussed in the literature43.
4.3. Clinical implications
There is currently no consensus as to the optimum pushing style for the management of the second stage of labor. Medical professionals usually favor the directed coaching (Valsalva-push pattern), although there is no evidence that it is the best approach. In contrast, the World Health Organization recommended that women in the expulsive phase of the second stage of labor should be supported to follow their natural desire to push as it helps them to feel more confident and in charge4. Although focused on the maternal outcomes only, this study suggested that the goal should not be to shorten the second stage of labor but rather to provide conditions for the mother to sustain less damage to the pelvic floor with less risk of exhaustion. This has immediate implications for directed pushing, which, this work suggested, should be reevaluated to consider damage accumulation in the pelvic floor muscles. At least in terms of damage accumulation, the model suggests that women might benefit from a new, more flexible, coached pushing approach that reduces the active pushing time.
As this engineering approach did not allow us to consider geometric maternal and fetal variability, we chose the standard geometries of a gynecoid pelvis and a 50th percentile fetal head. The size of the fetal head is directly related to the imposed strain, so larger fetal heads have the potential to accumulate damage at a faster rate. A non-gynecoid pelvis is known to be associated with a higher risk of labor complications, so if, as a consequence, the second stage of labor involves a higher number of maternal pushes, this would be riskier in terms of damage accumulation and tissue injury. As for the critical locations in those differently shaped pelvises, because of the large report of injuries at the origin of the PVM by different research groups, it is reasonable to assume it is most likely the critical location as well (although other levator ani muscles and pubic bone injuries have been reported to occur, although with lower incidence48).
Regarding the positioning of the fetus, it was shown by Parente et al56 that an occiput posterior presentation increases the degree of muscle strain. Hence, if in each maternal push the degree of muscle strain is higher, the damage accumulation in each contraction will also be higher. As such, an occiput posterior presentation can also be considered a riskier presentation in terms of material fatigue damage.
4.4. Research implications
We believe our study provided a visualization of the underlying mechanisms, present in the pelvic floor muscles during the second stage of labor. Unfortunately, it is beyond the scope of this article to verify the model damage predictions in vivo. However, magnetic resonance imaging already has been shown to be effective for visualizing the inflammation in the PVMs following a difficult labor,7 so higher resolution imaging could indeed be used to verify that the inflammation starts in the critical damage zones predicted by this study. These findings could undergird a clinical trial informed by these results to try to reduce the risk of these injuries in the future. In particular, we believe the outcomes of these 3 groups should be compared: directed pushing with 3 pushes per contraction lasting 10 seconds (Valsalva-push pattern), directed pushing pattern with 3 pushes per contraction lasting 5 seconds (3-push pattern), and a spontaneous pushing where the mother would be told to push when she feels the need to do so. Using G-Power and methodology described in the literature31, we estimated that the total sample size should be between 108 (effect size, 0.305; confidence level, 95%; power, 80%) and 420 (effect size, 0.152; confidence level, 95%; power, 80%). The effect sizes were obtained considering 3 of the results of maximum damage as means (0.82, 0.89, and 0.97) and equal individual standard deviations of 0.2 and 0.4. To better access maternal damage accumulation, the analyzed maternal outcomes must include follow-up appointments to assess hiatal area enlargement or other evidence of irrecoverable damage, besides levator ani tears. A clinical trial of this sort would differ from what is currently in the literature as it would compare different approaches for the directed pushing, with the potential to find a better approach for the maternal pushing style.
4.5. Strengths and limitations
The strengths of our approach included the use of a well-characterized material behavior for the pelvic floor muscles, which incorporated visco-hyperelasticity, muscle fiber directions, and, for the first time, the ability to accumulate damage under repetitive submaximal loading. Although simplified, the geometric models were based on human data. The complete biomechanical model was able to identify the weakest region of the pelvic floor during the second stage of labor, and that region is in agreement with where the literature reports tears.
Limitations of our study included the simplified bowl-shaped pelvic floor geometry having a single hiatus. Moreover, we did not consider the resting pelvic floor geometry changing with age from that of a valley to more of a bowl shape68 or that the levator plate straightens in late pregnancy61. In the future, it would be better to start the model with a pelvic floor geometry measured from a pregnant woman with both the genital and levator hiatuses represented. Nevertheless, we believe the simplifications we used would not affect the qualitative results from the four comparisons that we made. The second limitation concerned the material parameters used to describe pelvic floor tissue behavior, which were obtained from experimental data from nonpregnant ovine pelvic floor muscles75. This decision was made because of the lack of any human experimental pelvic floor data regarding low-cycle damage accumulation, thereby pointing out a current knowledge gap. Further studies are needed to characterize the damage accumulation in human pelvic floor tissue in pregnant individuals (see below). Hence, quantitatively, our results must be viewed with care because of a possible overestimation of stress levels (as material parameters came from nonpregnant individuals, with less compliant tissues compared with pregnant). Nevertheless, as we compared 4 pushing patterns while keeping the remaining conditions constant (ie, geometry and material properties), we believe that qualitatively our results were valid and our conclusions would hold for different geometries and material properties. The third limitation was that we did not consider the effect of muscle fatigue° in the simulations, specifically the decrease in the peak contractile force that happens in a maximum isometric muscle contraction over time in addition to the decrease in peak force whenever isometric muscle contractions are repeated after intervening rest intervals42. A fourth limitation was that although viscoelastic properties were included, we did not consider the effect of the large interindividual differences in levator viscoelastic properties that have been measured during labor71; these could affect the propensity for tissue injury. The fifth limitation was that we did not include the perineal body in our finite element model, which was shown to be protective15, and so it could potentially lessen the damage accumulation in the levator ani. Minor limitations included the fact that we did not differentiate between muscle fibers and collagenous fibers in carrying the load through the ground substance of the pelvic floor muscle material, although the model-predicted locations of maximum damage were the origin of the PVM, where it connects to the pubic bone via an aponeurosis32.
4.6. Conclusions
Fatigue damage accumulation was a possible PVM failure mode during the repetitive loading caused by the strenuous maternal pushing characteristic of the second stage of labor. Maternal pushing style influenced the risk of damage accumulation in the passive tissues of the PVM. Although the critical damage location did not differ across pushing styles, that location was confirmed to lie near the origin of the PVM. The optimal pushing style was 3-pushes per uterine contraction, maintaining each push for 5 seconds. That pattern caused the least amount of damage to the PVM without increasing the duration of the second stage of labor. We could not ascertain whether it is better to achieve that pushing pattern via directed or spontaneous pushing, but, if directed, the model suggests that women should sustain a push for shorter than 10 seconds.
Acknowledgements
Authors acknowledge the support from the Portuguese Foundation of Science under grant SFRH/BD/136213/2018 and under the research project UIDB/50022/2020. The funding sources were not involved in preparing the manuscript and conducting the research.
Appendix A
The finite element model of the pelvic floor muscles was comprised of 20,804 hexahedral hybrid elements (C3D8H). The average volume of each finite element was 1.16 mm3, and the tissue volume of the pelvic floor muscles is 24,088 mm3, with a ratio between the average finite element volume and the total model volume of 0.005% (Figure A.1). Hexahedral elements were chosen because of their better precision compared to other 3D finite elements.
Figure A.1 –
Finite element mesh of the levator ani muscles.
The fetal head was modeled using 19,520 tetrahedral elements (C3D4H). In this case, we consider tetrahedral elements the best choice because they perform faster, and no mechanical analysis was to be made of the fetal head. For both the fetal head and the pelvic floor, hybrid elements were used since we believe it is the best choice when the material is incompressible or near incompressible. They have a mixed formulation that allows one to overcome numerical problems caused by incompressibility, such as volume strain “locking”. More details are available in Abaqus Documentation18.
The constitutive model applied to the Levator Ani muscles include the Holzapfel-Gasser-Ogden (HGO) model27 to capture the transversely isotropic hyperelastic behavior, the Generalized Maxwell model, as described by Holzapfel and Gasser26, to capture the viscoelastic behavior and a fatigue damage model, previously developed based on experimental evidence75, to capture the damage accumulation due to sub-maximal repetitive loadings. In this work we also included a non-local damage averaging of the integral-type to attenuate the mesh influence on the damage contours.
As we wanted to simulate the behavior of a soft tissue, which is nearly incompressible due to the high water content46, we can typically express the strain energy function in a decoupled form, defining a contribution for the volumetric and the isochoric components separately. In this way, applying a penalty function to the volumetric contribution will assure the material to be incompressible. The isochoric component can also be further decoupled to add the specificities of the different constituents of the soft tissue25. In particular, this model considers the presence of a single family of muscle fibers embedded in a ground substance (or ground matrix) material (a family of fibers is a group of fibers that are assumed to have a preferred direction). As such, the complete strain energy function can be defined in a decoupled form as:
| (A.1) |
where Ψvol is the volumetric contribution, is the isochoric contribution of the ground matrix, is the isochoric contribution of the family of fibers, are the viscous effects and are the non-local continuous damage variables. Both the viscous effects and the damage variables affect each isochoric component of the strain energy. The indices m and f refer to the ground matrix and fibers contribution, respectively.
Each contribution can be defined as:
| (A.2) |
| (A.3) |
| (A.4) |
| (A.5) |
where J = det F, designated as Jacobian, represents the local rate of change of the deformed configuration volume v with respect to the reference configuration volume V, with F the deformation gradient. The symmetric right Cauchy-Green deformation tensor can be defined as C = FTF, with the corresponding first invariant I1 = tr C. The deformation gradient can be decomposed into a volumetric (dilatational) Fvol = J1/3 and volume preserving (distortional) part , with det . Accordingly, the isochoric right Cauchy-Green tensor becomes , with its first invariant now defined as . The stretch in the direction m0 of the fiber family relates with the pseudo-invariant such as . The scalar value functions may be viewed as a dissipative potential and determines the viscoelastic contribution of each process α, which is also the number of parallel elements in the Maxwell model26. Each Maxwell element can be represented by a spring in series with a dashpot. The spring represents the solid behavior and is characterized by a free energy parameter and the dashpot characterizes the viscous behavior and is function of a relaxation time 26.
The parameters of the transversely isotropic visco-hyperelastic model are: K for the volumetric contribution, C10: for the ground matrix contribution, k11, k12: for the fibers contribution and and for the viscoelastic contribution.
More details concerning this transversely isotropic visco-hyperelastic model can be found elsewhere26,27.
The continuous damage model was developed using the concept of accumulated equivalent strain , as defined by Peña et al57:
| (A.6) |
This allows for a continuous damage accumulation within the deformation process, with a simple equation of damage evolution:
| (A.7) |
The damage propagation and accumulation was defined using a modification of the Lemaitre and Plumtree nonlinear cumulative expression47. As described in our previous work75, the ratio between the number of cycles and the number of cycles to fatigue failure was replaced with the ratio between the accumulated equivalent strain and its maximum value. A parameter was also added so that the weight of the damage variable can be easily changed:
| (A.8) |
The parameters of this damage evolution are the maximum equivalent strain , the exponent and the weighting parameter . The criteria for the evolution can be defined as:
| (A.9) |
This damage model is a so-called ‘local’ model. This designation appears since the solution is dependent on the spatial discretization. In other words, the solution is mesh dependent and upon mesh refinement the effects are even more prominent3,22. To overcome this issue, non-local theory approaches can be applied to eliminate or reduce the mesh dependency. In this work, we chose to apply an integral-type averaging scheme coupled to the material law22. Using the non-local averaging of the integral type, the non-local damage variable can be expressed by means of a spatially weighted averaging integral as:
| (A.10) |
where χ(x, η) is a weighted average operator, is the local damage. represents the measurement of non-local damage at a generic material point x, which has been averaged over a finite volume V, containing a set of points η. The size of the non-local volume is dictated by a constitute parameter designated as characteristic length Lc (Figure A.2)
Figure A.2 –
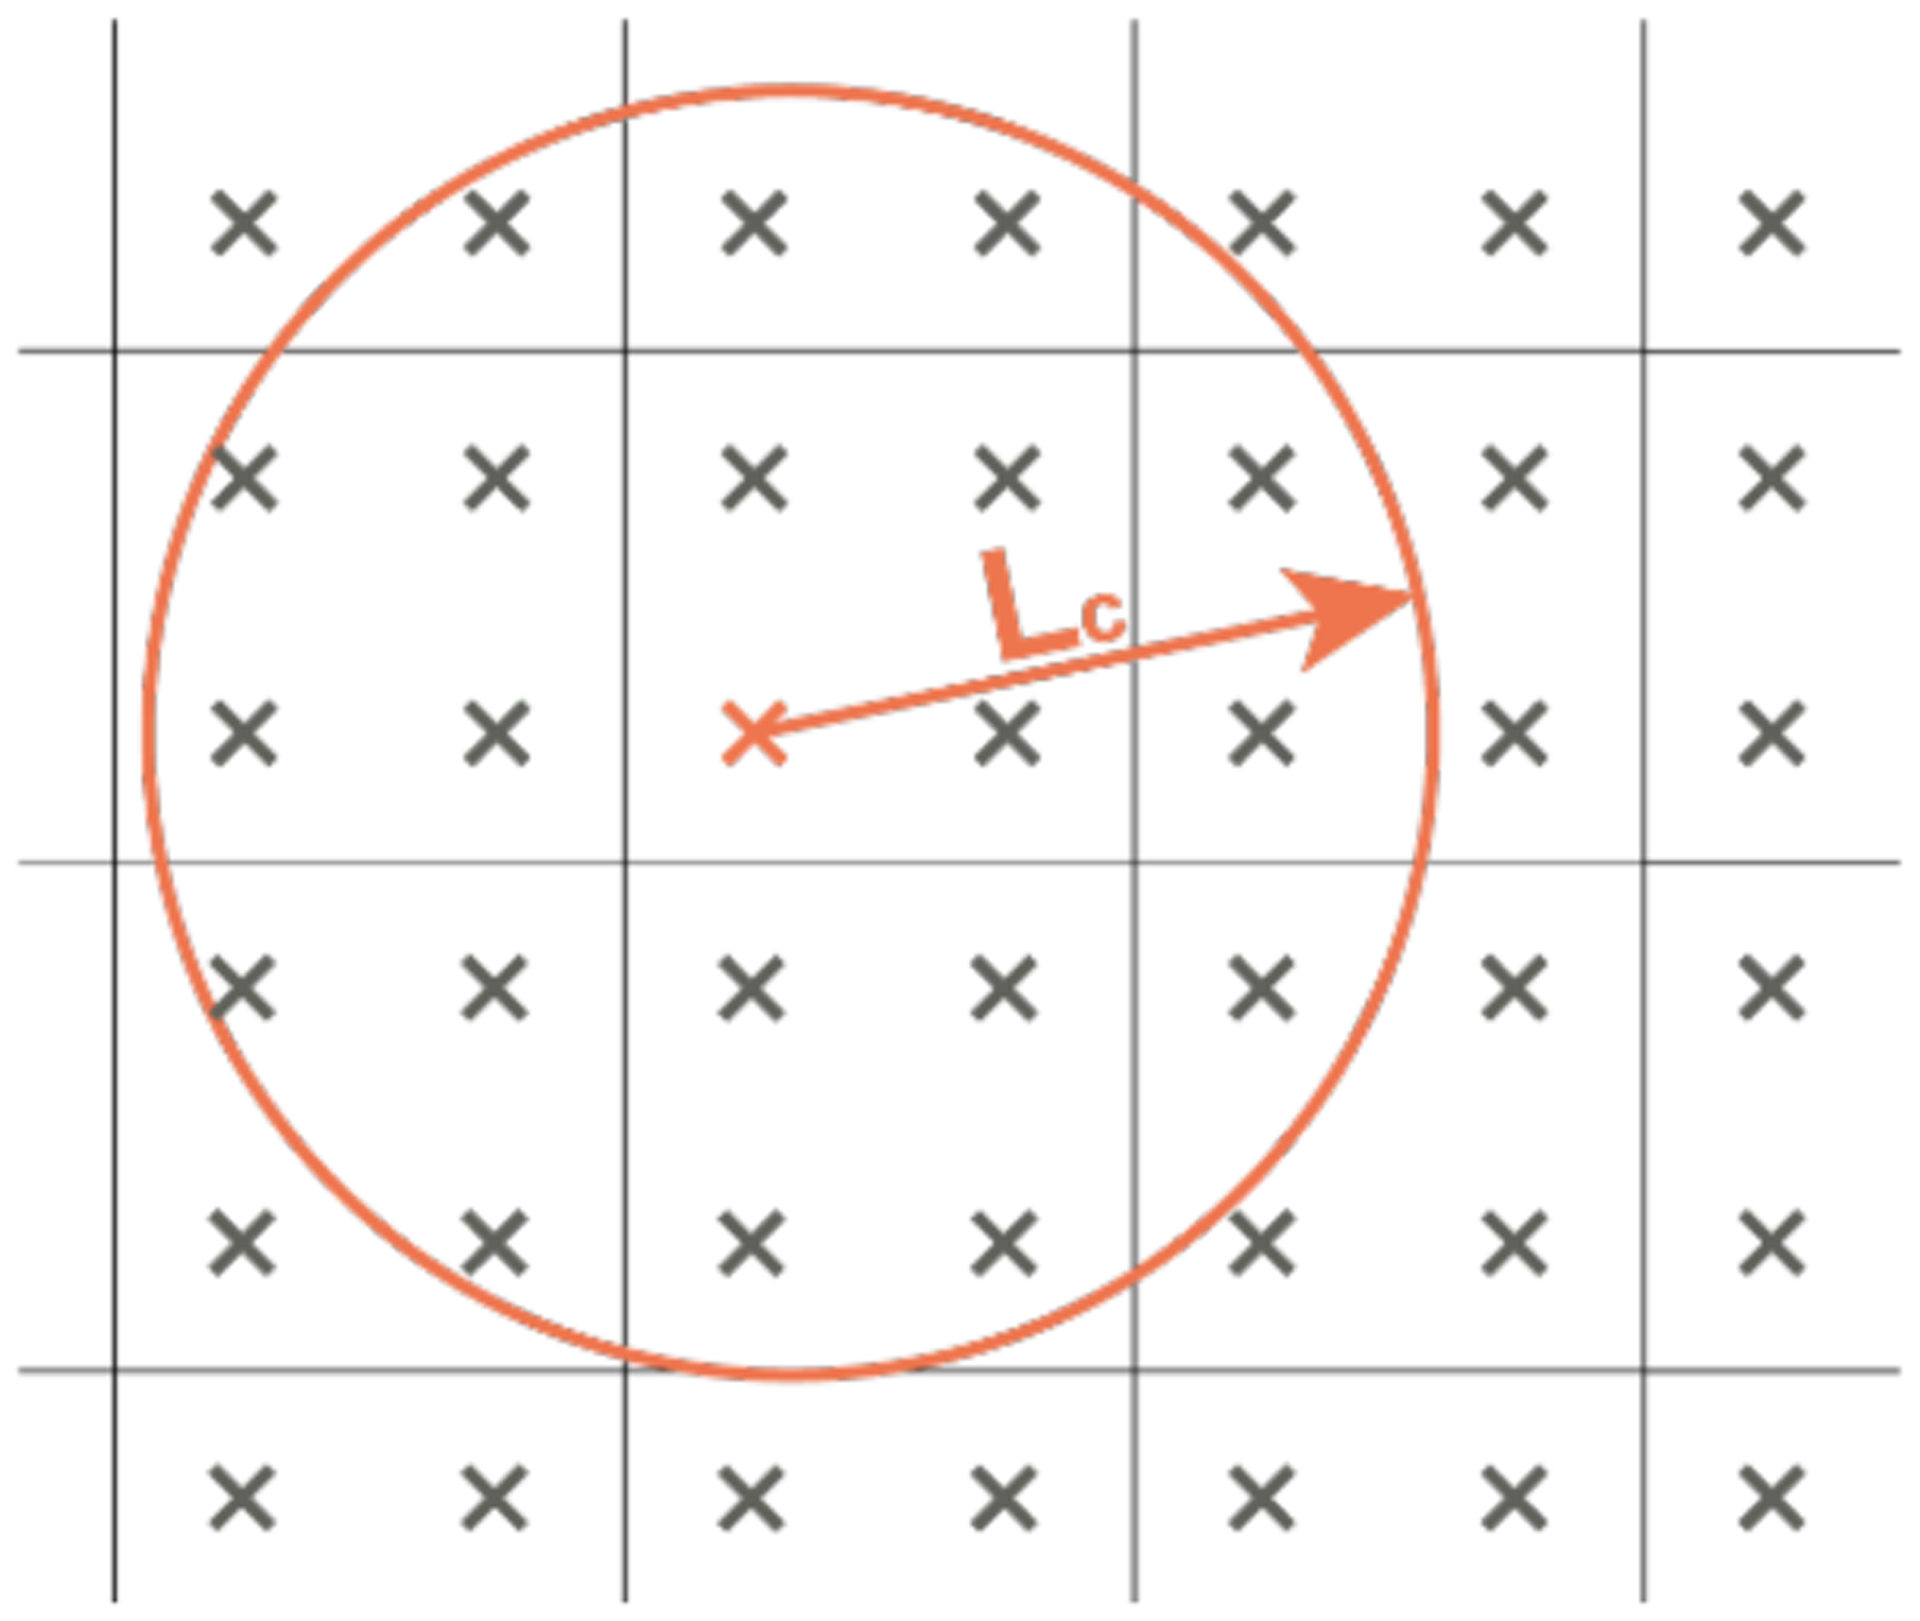
Non-local damage at a material point x results from an averaging operation of the local quantities of the material points inside the non-local averaging volume. This volume is defined by radius Lc, which is the characteristic length..
The averaging operator can be defined as:
| (A.11) |
where is the weighting function and Ωr(x) the representative volume, defined as follows:
| (A.12) |
| (A.13) |
The only parameter of the non-local implementation is the characteristic length. This parameter must be chosen with care since it can have a significant impact on the results. If too small a value is chosen, the non-local solution approaches the local solution, and the mesh dependency can still occur. On the other hand, if too large a value is chosen it will cause over-homogenization and the results will lose significance. Further details on the non-local damage averaging can be found elsewhere3,7,22.
The constitutive parameters were obtained using a custom made micro-genetic algorithm by calibrating experimental results with numerical data, as detailed in Vila Pouca et al75. No restriction to the domains of the ground matrix and muscle fibers was imposed. The only exception is the non-local damage parameter, the characteristic length Lc, which was defined to be approximately the length of three finite elements22. The calibration was performed by replicating the conditions of the laboratory experiments in the computer simulations. Then, the set of parameters was iteratively changed (randomly by the algorithm), and the experimental force-displacement curve was compared with the computational force-displacement curve until the least error was achieved. The set of material parameters that allowed the best approximation between the experimental force-displacement curve and the computational (numerical) was the set of parameters used in the simulations. Since these material models are phenomenological, the material properties do not have a physical meaning and cannot be obtained by observation.
The complete set of calibrated material parameters to simulate the levator ani muscles behavior is presented in Table A.1. Despite the lack of restrictions to the domain of the material parameters, the micro-genetic algorithm was able to capture the faster rate of the muscle fibers damage, compared to the ground matrix. This can be seen by comparing the values of and , which are respectively 4.07 and 2.25 MPa. Since this parameter represents the accumulated equivalent strain at failure, it indicates that the fiber damage accumulates at a faster rate, which agrees with our experimental observations75. This translated to the numerical results, with maximum damage values of the ground matrix of ~0.1 for all pushing patterns. As such, we decided to neglect the damage in the ground matrix in the Results section and analyze only the damage results of the muscle fibers.
Table A.1-.
Levator ani constitutive model parameters, obtained from the micro-genetic algorithm optimization75.
| Hyperelastic | Viscoelastic | Local Damage | Non-local Damage |
|---|---|---|---|
| C10 = 0.14 MPa | β1 m = β1 f1 = 5.08 (−) | Dmax m = 0.9 (−) | Lc = 3.0 mm |
| k11 = 0.05 MPa | τ1 m = τ1 f1 = 33.59 s | ||
| k12 = 0.23 (−) | β2 m = β2 f1 = 0.79 (−) | Cm = 1.65 (−) | |
| τ2 m = τ2 f1 = 44.14 s | Dmax f1 = 1.0 (−) | ||
| Cf1 = 0.27 (−) |
Footnotes
Ultimate displacement is the applied displacement that will cause the material to tear.
Transverse isotropy occurs when the material stiffness is directionally dependent, which is the case for muscular tissues because of the presence of the fibers. Viscohyperelasticity describes the materials that have a nonlinear force-displacement behavior and time-dependent (viscous) properties. These materials have a force response to strain that, importantly, depends on the strain rate: faster strain rates induce higher forces, whereas lower strain rates induce smaller forces. Moreover, they can “relax”: particularly, if subjected to the same strain over some time, the stresses (force per unit area) developed initially decrease over time. Besides these properties, the material model incorporates a cumulative damage model: when submaximal loading cycles are performed, there is damage accumulation in the material, which negatively impacts its mechanical properties by weakening the material.
Note that muscle fatigue is a completely different process than the material fatigue discussed in this paper. Muscle fatigue is the decrease in the muscle’s ability to actively develop a sustained contractile force over time, as well as when such contractions are repeated after rest intervals that prove insufficient for complete recovery of the muscle; it can result in a state of physical exhaustion. Material fatigue is a phenomenon in which structures fail when subjected to cyclic loading due to the progressive accumulation of damage at a microscopic level.
References
- 1.Abalos E, Oladapo OT, Chamillard M, et al. Duration of spontaneous labour in ‘low-risk’ women with ‘normal’ perinatal outcomes: A systematic review. Eur J Obstet Gynecol Reprod Biol. 2018;223:123–132. doi: 10.1016/j.ejogrb.2018.02.026 [DOI] [PMC free article] [PubMed] [Google Scholar]
- 2.Aldrich CJ, D’Antona D, Spencer JA, et al. The effect of maternal pushing on fetal cerebral oxygenation and blood volume during the second stage of labour. Br J Obstet Gynaecol. 1995;102(6):448–453. doi: 10.1111/j.1471-0528.1995.tb11316.x [DOI] [PubMed] [Google Scholar]
- 3.Andrade FXC, César de Sá JMA, Andrade Pires FM. A ductile damage nonlocal model of integral-type at finite strains: formulation and numerical issues. Int J Damage Mech. 2011;20(4):515–557. doi: 10.1177/1056789510386850 [DOI] [Google Scholar]
- 4.Araujo AE, Delgado A, Maia JN, et al. Efficacy of spontaneous pushing with pursed lips breathing compared with directed pushing in maternal and neonatal outcomes: a clinical trial. Authorea. Published online 2020:1–11. doi: 10.22541/au.160278519.95490262/v1 [DOI] [PubMed] [Google Scholar]
- 5.Ashton-Miller JA, DeLancey JOL. On the biomechanics of vaginal birth and common sequelae. Annu Rev Biomed Eng. 2009;11(1):163–176. doi: 10.1146/annurev-bioeng-061008-124823.On [DOI] [PMC free article] [PubMed] [Google Scholar]
- 6.Barnett MM, Humenick SS. Infant Outcome in Relation to Second Stage Labor Pushing Method. Birth. 1982;9(4):221–229. doi: 10.1111/j.1523-536X.1982.tb01667.x [DOI] [Google Scholar]
- 7.Bažant ZP, Jirásek M. Nonlocal integral formulations of plasticity and damage: survey of progress. J Eng Mech. 2002;128(11):1119–1149. doi: 10.1061/(ASCE)0733-9399(2002)128:11(1119) [DOI] [Google Scholar]
- 8.Beaulieu ML, Carey GE, Schlecht SH, Wojtys EM, Ashton-Miller JA. On the heterogeneity of the femoral enthesis of the human ACL: microscopic anatomy and clinical implications. J Exp Orthop. 2016;3(1):14. doi: 10.1186/s40634-016-0050-8 [DOI] [PMC free article] [PubMed] [Google Scholar]
- 9.Bloom SL, Casey BM, Schaffer JI, McIntire DD, Leveno KJ. A randomized trial of coached versus uncoached maternal pushing during the second stage of labor. Am J Obstet Gynecol. 2006;194(1):10–13. doi: 10.1016/j.ajog.2005.06.022 [DOI] [PubMed] [Google Scholar]
- 10.Boyles SH, Weber AM, Meyn L. Procedures for pelvic organ prolapse in the United States, 1979–1997. Am J Obstet Gynecol. 2003;188(1):108–115. doi: 10.1067/mob.2003.101 [DOI] [PubMed] [Google Scholar]
- 11.Buckthorpe M, Pain MTG, Folland JP. Central fatigue contributes to the greater reductions in explosive than maximal strength with high-intensity fatigue. Exp Physiol. 2014;99(7):964–973. doi: 10.1113/expphysiol.2013.075614 [DOI] [PubMed] [Google Scholar]
- 12.Buttin R, Zara F, Shariat B, Redarce T, Grangé G. Biomechanical simulation of the fetal descent without imposed theoretical trajectory. Comput Methods Programs Biomed. 2013;111(2):389–401. doi: 10.1016/j.cmpb.2013.04.005 [DOI] [PubMed] [Google Scholar]
- 13.Caldeyro-Barcia R The Influence of Maternal Bearing-down Efforts during Second Stage on Fetal Well-being. Birth. 1979;6(1):17–21. doi: 10.1111/j.1523-536X.1979.tb01298.x [DOI] [Google Scholar]
- 14.Casanova R, And AC, Goepfert AR, Hueppchen NA, Weiss PM, American College of Obstetricians and Gynecologists. Beckmann and Ling’s Obstetrics and Gynecology. 8th Editio. Philadelphia: Wolters Kluwer; 2019. [Google Scholar]
- 15.Cechova H, Kalis V, Havelkova L, et al. Finite element modeling of maximum stress in pelvic floor structures during the head expulsion (FINESSE) study. Int Urogynecol J. 2021;32(7):1997–2003. doi: 10.1007/s00192-021-04769-z [DOI] [PubMed] [Google Scholar]
- 16.Chan SSC, Cheung RYK, Yiu AKW, et al. Prevalence of levator ani muscle injury in Chinese women after first delivery. Ultrasound Obstet Gynecol. 2012;39(6):704–709. doi: 10.1002/uog.10132 [DOI] [PubMed] [Google Scholar]
- 17.Chen J, Kim J, Shao W, et al. An anterior cruciate ligament failure mechanism. Am J Sports Med. 2019;47(9):2067–2076. doi: 10.1177/0363546519854450 [DOI] [PMC free article] [PubMed] [Google Scholar]
- 18.Dassault Systemes Simulia Corporation. Abaqus V. 6.14 documentation.
- 19.DeLancey JOL, Kearney R, Chou Q, Speights S, Binno S. The appearance of levator ani muscle abnormalities in magnetic resonance images after vaginal delivery. Obstet Gynecol. 2003;101(1):46–53. doi: 10.1016/S0029-7844(02)02465-1 [DOI] [PMC free article] [PubMed] [Google Scholar]
- 20.DeLancey JOL, Sørensen HC, Lewicky-Gaupp C, Smith TM. Comparison of the puborectal muscle on MRI in women with POP and levator ani defects with those with normal support and no defect. Int Urogynecol J. 2012;23(1):73–77. doi: 10.1007/s00192-011-1527-8 [DOI] [PMC free article] [PubMed] [Google Scholar]
- 21.Dietz HP, Gillespie AVL, Phadke P. Avulsion of the pubovisceral muscle associated with large vaginal tear after normal vaginal delivery at term. Aust New Zeal J Obstet Gynaecol. 2007;47(4):341–344. doi: 10.1111/j.1479-828X.2007.00748.x [DOI] [PubMed] [Google Scholar]
- 22.Ferreira JPS, Parente MPL, Jabareen M, Jorge RMN. A general framework for the numerical implementation of anisotropic hyperelastic material models including non-local damage. Biomech Model Mechanobiol. 2017;16(4):1119–1140. doi: 10.1007/s10237-017-0875-9 [DOI] [PubMed] [Google Scholar]
- 23.Hanson L Second-stage labor care: challenges in spontaneous bearing down. J Perinat Neonatal Nurs. 2009;23(1):31. doi: 10.1097/JPN.0b013e318196526b [DOI] [PubMed] [Google Scholar]
- 24.Hofmeyr GJ, Singata-Madliki M. The second stage of labor. Best Pract Res Clin Obstet Gynaecol. 2020;67:53–64. doi: 10.1016/j.bpobgyn.2020.03.012 [DOI] [PubMed] [Google Scholar]
- 25.Holzapfel GA. Nonlinear Solid Mechanics: A Continuum Approach for Engineering. John Wiley & Sons; 2000. [Google Scholar]
- 26.Holzapfel GA, Gasser TC. A viscoelastic model for fiber-reinforced composites at finite strains: Continuum basis, computational aspects and applications. Comput Methods Appl Mech Eng. 2001;190(34):4379–4403. doi: 10.1016/S0045-7825(00)00323-6 [DOI] [Google Scholar]
- 27.Holzapfel GA, Gasser TC, Ogden RW. A new constitutive framework for arterial wall mechanics and a comparative study of material models. J Elast Phys Sci solids. 2000;61(1):1–48. doi: 10.1023/A:1010835316564 [DOI] [Google Scholar]
- 28.Janda S, van der Helm FCT, de Blok SB. Measuring morphological parameters of the pelvic floor for finite element modelling purposes. J Biomech. 2003;36(6):749–757. doi: 10.1016/s0021-9290(03)00008-3 [DOI] [PubMed] [Google Scholar]
- 29.Jing D Experimental and Theoretical Biomechanical Analyses of the Second Stage of Labor. Doctoral Dissertation, Department of Mechanical Engineering, University of Michigan, Ann Arbor. Published online 2010. [Google Scholar]
- 30.Kamisan Atan I, Shek KL, Langer S, et al. Does the Epi-No® birth trainer prevent vaginal birth-related pelvic floor trauma? A multicentre prospective randomised controlled trial. BJOG An Int J Obstet Gynaecol. 2016;123(6):995–1003. doi: 10.1111/1471-0528.13924 [DOI] [PubMed] [Google Scholar]
- 31.Kang H Sample size determination and power analysis using the G*Power software. J Educ Eval Health Prof. 2021;18:17. doi: 10.3352/jeehp.2021.18.17 [DOI] [PMC free article] [PubMed] [Google Scholar]
- 32.Kim J, Betschart C, Ramanah R, Ashton-Miller JA, DeLancey JOL. Anatomy of the pubovisceral muscle origin: Macroscopic and microscopic findings within the injury zone. Neurourol Urodyn. 2015;34(8):774–780. doi: 10.1002/nau.22649 [DOI] [PMC free article] [PubMed] [Google Scholar]
- 33.Kiserud T, Piaggio G, Carroli G, et al. The World Health Organization Fetal Growth Charts: A Multinational Longitudinal Study of Ultrasound Biometric Measurements and Estimated Fetal Weight. Vol 14.; 2017. doi: 10.1371/journal.pmed.1002220 [DOI] [PMC free article] [PubMed] [Google Scholar]
- 34.Koyucu RG, Demirci N. Effects of pushing techniques during the second stage of labor: A randomized controlled trial. Taiwan J Obstet Gynecol. 2017;56(5):606–612. doi: 10.1016/j.tjog.2017.02.005 [DOI] [PubMed] [Google Scholar]
- 35.Krofta L, Otcenasek M, Kasikova E, Feyereisl J. Pubococcygeus-puborectalis trauma after forceps delivery: evaluation of the levator ani muscle with 3D/4D ultrasound. Int Urogynecol J Pelvic Floor Dysfunct. 2009;20(10):1175–1181. doi: 10.1007/s00192-009-0837-6 [DOI] [PubMed] [Google Scholar]
- 36.Lee N, Gao Y, Lotz L, Kildea S. Maternal and neonatal outcomes from a comparison of spontaneous and directed pushing in second stage. Women and Birth. 2019;32(4):e433–e440. doi: 10.1016/j.wombi.2018.10.005 [DOI] [PubMed] [Google Scholar]
- 37.Lemos A, Amorim MMR, Dornelas de Andrade A, de Souza AI, Cabral Filho JE, Correia JB. Pushing/bearing down methods for the second stage of labour. Cochrane Database Syst Rev. 2017;(3). doi: 10.1002/14651858.CD009124.pub3 [DOI] [PMC free article] [PubMed] [Google Scholar]
- 38.Leombroni M, Buca D, Liberati M, et al. Post-partum pelvic floor dysfunction assessed on 3D rotational ultrasound: a prospective study on women with first- and second-degree perineal tears and episiotomy. J Matern neonatal Med Off J Eur Assoc Perinat Med Fed Asia Ocean Perinat Soc Int Soc Perinat Obstet. 2021;34(3):445–455. doi: 10.1080/14767058.2019.1609932 [DOI] [PubMed] [Google Scholar]
- 39.Lien K-C, DeLancey JOL, Ashton-Miller JA. Biomechanical analyses of the efficacy of patterns of maternal effort on second-stage progress. Obstet Gynecol. 2009;113(4):873–880. doi: 10.1097/AOG.0b013e31819c82e1 [DOI] [PMC free article] [PubMed] [Google Scholar]
- 40.Lien K-C, Mooney B, DeLancey JOL, Ashton-Miller JA. Levator ani muscle stretch induced by simulated vaginal birth. Obstet Gynecol. 2004;103(1):31–40. doi: 10.1097/01.AOG.0000109207.22354.65 [DOI] [PMC free article] [PubMed] [Google Scholar]
- 41.Lipps DB, Wojtys EM, Ashton-Miller JA. Anterior cruciate ligament fatigue failures in knees subjected to repeated simulated pivot landings. Am J Sports Med. 2013;41(5):1058–1066. doi: 10.1177/0363546513477836 [DOI] [PMC free article] [PubMed] [Google Scholar]
- 42.Looft JM, Herkert N, Frey-Law L. Modification of a three-compartment muscle fatigue model to predict peak torque decline during intermittent tasks. J Biomech. 2018;77:16–25. doi: 10.1016/j.jbiomech.2018.06.005 [DOI] [PMC free article] [PubMed] [Google Scholar]
- 43.Low LK, Zielinski R, Tao Y, Galecki A, Brandon CJ, Miller JM. Predicting birth-related levator ani tear severity in primiparous women: evaluating maternal recovery from labor and delivery (EMRLD study). Open J Obstet Gynecol. 2014;4(6):266–278. doi: 10.4236/ojog.2014.46043 [DOI] [PMC free article] [PubMed] [Google Scholar]
- 44.Mair SD, Seaber AV, Glisson RR, Garrett WE, Garrett WE Jr.. The role of fatigue in susceptibility to acute muscle strain injury. Am J Sports Med. 1996;24(2):137–143. doi: 10.1177/036354659602400203 [DOI] [PubMed] [Google Scholar]
- 45.Margulies RU, Huebner M, DeLancey JOL. Origin and insertion points involved in levator ani muscle defects. Am J Obstet Gynecol. 2007;196(3):251.e1–251.e5. doi: 10.1016/j.ajog.2006.10.894 [DOI] [PMC free article] [PubMed] [Google Scholar]
- 46.Marino M Constitutive modeling of soft tissues. In: Narayan R, ed. Encyclopedia of Biomedical Engineering. Vol 1-3. Elsevier; 2019:81–110. doi: 10.1016/B978-0-12-801238-3.99926-4 [DOI] [Google Scholar]
- 47.Milella PP. Fatigue and Corrosion in Metals. 1st ed. (Milella PP, ed.). Springer-Verlag Mailand; 2013. doi: 10.1007/978-88-470-2336-9 [DOI] [Google Scholar]
- 48.Miller JM, Low LK, Zielinski R, Smith AR, Delancey JOL, Brandon C. Evaluating maternal recovery from labor and delivery: Bone and levator ani injuries. Am J Obstet Gynecol. 2015;213(2):188.e1–188.e11. doi: 10.1016/j.ajog.2015.05.001 [DOI] [PMC free article] [PubMed] [Google Scholar]
- 49.Moura R, Borges M, Vila Pouca MCP, et al. A numerical study on fetal head molding during labor. Int j numer method biomed eng. 2021;37(1):e3411. doi: 10.1002/cnm.3411 [DOI] [PubMed] [Google Scholar]
- 50.Noonan TJ, Best TM, Seaber AV, Garrett WEJ. Identification of a threshold for skeletal muscle injury. Am J Sports Med. 1994;22(2):257–261. doi: 10.1177/036354659402200217 [DOI] [PubMed] [Google Scholar]
- 51.Oliveira DA, Parente MPL, Calvo B, Mascarenhas T, Jorge RMN. A biomechanical analysis on the impact of episiotomy during childbirth. Biomech Model Mechanobiol. 2016;15(6):1523–1534. doi: 10.1007/s10237-016-0781-6 [DOI] [PubMed] [Google Scholar]
- 52.Oliveira DA, Parente MPL, Calvo B, Mascarenhas T, Jorge RMN. The management of episiotomy technique and its effect on pelvic floor muscles during a malposition childbirth. Comput Methods Biomech Biomed Engin. 2017;20(11):1249–1259. doi: 10.1080/10255842.2017.1349762 [DOI] [PubMed] [Google Scholar]
- 53.Paine LL, Tinker DD. The effect of maternal bearing-down efforts on arterial umbilical cord pH and length of the second stage of labor. J Nurse Midwifery. 1992;37(1):61–63. doi: 10.1016/0091-2182(92)90023-v [DOI] [PubMed] [Google Scholar]
- 54.Parente M, Natal Jorge RM, Mascarenhas T, Fernandes AA, Silva-Filho AL. Computational modeling approach to study the effects of fetal head flexion during vaginal delivery. Am J Obstet Gynecol. 2010;203(3):217.e1–217.e6. doi: 10.1016/j.ajog.2010.03.038 [DOI] [PubMed] [Google Scholar]
- 55.Parente MPL, Jorge RMN, Mascarenhas T, Fernandes AA, Martins JAC. Deformation of the pelvic floor muscles during a vaginal delivery. Int Urogynecol J Pelvic Floor Dysfunct. 2008;19(1):65–71. doi: 10.1007/s00192-007-0388-7 [DOI] [PubMed] [Google Scholar]
- 56.Parente MPL, Jorge RMN, Mascarenhas T, Fernandes AA, Martins JAC. The influence of an occipito-posterior malposition on the biomechanical behavior of the pelvic floor. Eur J Obstet Gynecol Reprod Biol. 2009;144:S166–S169. doi: 10.1016/j.ejogrb.2009.02.033 [DOI] [PubMed] [Google Scholar]
- 57.Peña E Computational aspects of the numerical modelling of softening, damage and permanent set in soft biological tissues. Comput Struct. 2014;130:57–72. doi: 10.1016/j.compstruc.2013.10.002 [DOI] [Google Scholar]
- 58.Polnaszek BE, Cahill AG. Evidence-based management of the second stage of labor. Semin Perinatol. 2020;44(2):151213. doi: 10.1016/j.semperi.2019.151213 [DOI] [PubMed] [Google Scholar]
- 59.Rempen A, Kraus M. Pressures on the Fetal Head during Normal Labor. Vol 19.; 1991. doi: 10.1515/jpme.1991.19.3.199 [DOI] [PubMed] [Google Scholar]
- 60.Roberts JE. The “push” for evidence: management of the second stage. J Midwifery Womens Health. 2002;47(1):2–15. doi: 10.1016/s1526-9523(01)00233-1 [DOI] [PubMed] [Google Scholar]
- 61.Routzong MR, Rostaminia G, Moalli PA, Abramowitch SD. Pelvic floor shape variations during pregnancy and after vaginal delivery. Comput Methods Programs Biomed. 2020;194:105516. doi: 10.1016/j.cmpb.2020.105516 [DOI] [PubMed] [Google Scholar]
- 62.Sampselle CM, Hines S. Spontaneous pushing during birth. Relationship to perineal outcomes. J Nurse Midwifery. 1999;44(1):36–39. doi: 10.1016/s0091-2182(98)00070-6 [DOI] [PubMed] [Google Scholar]
- 63.Schaffer JI, Bloom SL, Casey BM, McIntire DD, Nihira MA, Leveno KJ. A randomized trial of the effects of coached vs uncoached maternal pushing during the second stage of labor on postpartum pelvic floor structure and function. Am J Obstet Gynecol. 2005;192(5):1692–1696. doi: 10.1016/j.ajog.2004.11.043 [DOI] [PubMed] [Google Scholar]
- 64.Sharifimajd B, Thore CJ, Stålhand J. Simulating uterine contraction by using an electro-chemo-mechanical model. Biomech Model Mechanobiol. 2016;15(3):497–510. doi: 10.1007/s10237-015-0703-z [DOI] [PubMed] [Google Scholar]
- 65.Shek KL, Dietz HP. Intrapartum risk factors for levator trauma. BJOG An Int J Obstet Gynaecol. 2010;117(12):1485–1492. doi: 10.1111/j.1471-0528.2010.02704.x [DOI] [PubMed] [Google Scholar]
- 66.Shek KL, Kruger J, Dietz HP. The effect of pregnancy on hiatal dimensions and urethral mobility: an observational study. Int Urogynecol J. 2012;23(11):1561–1567. doi: 10.1007/s00192-012-1795-y [DOI] [PubMed] [Google Scholar]
- 67.Sheng Y, Liu X, Low LK, Ashton-Miller JA, Miller JM. Association of pubovisceral muscle tear with functional capacity of urethral closure: evaluating maternal recovery from labor and delivery. Am J Obstet Gynecol. 2020;222(6):598.e1–598.e7. doi: 10.1016/j.ajog.2019.11.1257 [DOI] [PMC free article] [PubMed] [Google Scholar]
- 68.Swenson CW, Masteling M, DeLancey JO, Nandikanti L, Schmidt P, Chen L. Aging effects on pelvic floor support: a pilot study comparing young versus older nulliparous women. Int Urogynecol J. 2020;31(3):535–543. doi: 10.1007/s00192-019-04063-z [DOI] [PMC free article] [PubMed] [Google Scholar]
- 69.Taylor DC, Dalton JDJ, Seaber AV, Garrett WEJ. Experimental muscle strain injury. Early functional and structural deficits and the increased risk for reinjury. Am J Sports Med. 1993;21(2):190–194. doi: 10.1177/036354659302100205 [DOI] [PubMed] [Google Scholar]
- 70.Thomson AM. Pushing techniques in the second stage of labour. J Adv Nurs. 1993;18(2):171–177. doi: 10.1046/j.1365-2648.1993.18020171.x [DOI] [PubMed] [Google Scholar]
- 71.Tracy PV, Wadhwani S, Triebwasser J, et al. On the variation in maternal birth canal in vivo viscoelastic properties and their effect on the predicted length of active second stage and levator ani tears. J Biomech. 2018;74:64–71. doi: 10.1016/j.jbiomech.2018.04.019 [DOI] [PMC free article] [PubMed] [Google Scholar]
- 72.Tsuang Y-H, Sun J-S, Chen I-H, et al. The effects of cyclic stretching on tensile properties of the rabbit’s skeletal muscle. Clin Biomech (Bristol, Avon). 1998;13(1):48–53. [DOI] [PubMed] [Google Scholar]
- 73.Vila Pouca MCP, Ferreira JPS, Oliveira DA, Parente MPL, Natal Jorge RM. Viscous effects in pelvic floor muscles during childbirth: a numerical study. Int j numer method biomed eng. 2017;(September):e2927. doi: 10.1002/cnm.2927 [DOI] [PubMed] [Google Scholar]
- 74.Vila Pouca MCP, Parente MPL, Natal Jorge RM, Ashton-Miller JA. Injuries in muscle-tendon-bone units: a systematic review considering the role of passive tissue fatigue. Orthop J Sport Med. 2021;9(8). doi:DOI: 10.1177/23259671211020731 [DOI] [PMC free article] [PubMed] [Google Scholar]
- 75.Vila Pouca MCP, Parente MPL, Natal Jorge RM, Ashton-Miller JA. Investigating the birth-related caudal maternal pelvic floor muscle injury: The consequences of low cycle fatigue damage. J Mech Behav Biomed Mater. 2020;110:103956. doi: 10.1016/j.jmbbm.2020.103956 [DOI] [PMC free article] [PubMed] [Google Scholar]
- 76.Vila Pouca MCP, Parente MPL, Natal Jorge RM, DeLancey JO., Ashton-Miller JA. Pelvic floor muscle injury during a difficult labor. Can tissue fatigue damage play a role? Int J Urogynecology. 2022;(33):211–220. [DOI] [PMC free article] [PubMed] [Google Scholar]
- 77.Wojtys EM, Beaulieu ML, Ashton-Miller JA. New perspectives on ACL injury: On the role of repetitive sub-maximal knee loading in causing ACL fatigue failure. J Orthop Res. 2016;34(12):2059–2068. doi: 10.1002/jor.23441 [DOI] [PMC free article] [PubMed] [Google Scholar]
- 78.Wood DD, Fisher DL, Andres RO. Minimizing fatigue during repetitive jobs: optimal work-rest schedules. Hum Factors. 1997;39(1):83–101. doi: 10.1518/001872097778940678 [DOI] [PubMed] [Google Scholar]
- 79.Wu E, Kuehl TJ, Gendron JM, White W, Yandell PM. Pelvic floor changes in the first term pregnancy and postpartum period. Int Urogynecol J. 2021;32(7):1897–1905. doi: 10.1007/s00192-020-04456-5 [DOI] [PubMed] [Google Scholar]
- 80.Yeates DA, Roberts JE. A comparison of two bearing-down techniques during the second stage of labor. J Nurse Midwifery. 1984;29(1):3–11. doi: 10.1016/0091-2182(84)90324-0 [DOI] [PubMed] [Google Scholar]