Abstract
Mitochondria are epicenters of eukaryotic metabolism and bioenergetics. Pioneering efforts in recent decades have established the core protein componentry of these organelles1 and have linked their dysfunction to over 150 distinct disorders2,3. Still, hundreds of mitochondrial proteins lack clear functions4, and ~40% of mitochondrial disorders remain unresolved5. To establish a more complete functional compendium of human mitochondrial proteins, we profiled over 200 CRISPR-mediated HAP1 cell knockout lines using mass spectrometry-based multi-omics analyses. This effort generated ~8.3 million distinct biomolecule measurements, providing a deep survey of the cellular responses to mitochondrial perturbations, and laying a foundation for mechanistic investigations into protein function. Guided by these data, we discovered that PYURF is a SAM-dependent methyltransferase chaperone that supports both complex I assembly and coenzyme Q biosynthesis, and that is disrupted in a previously unresolved multisystemic mitochondrial disorder. We further linked the putative zinc transporter SLC30A9 to mitoribosome and OxPhos integrity and established RAB5IF as the second gene harboring pathogenic variants causing cerebrofaciothoracic dysplasia. Our data—which can be explored through an interactive online MITOMICS.app resource—suggest biological roles for many other orphan mitochondrial proteins still lacking robust functional characterization, and define a rich cell signature of mitochondrial dysfunction that can support the genetic diagnosis of mitochondrial diseases.
Mitochondria are likely remnants of an ancient endosymbiotic event between an alpha-proteobacterium and a eukaryotic progenitor6. These organelles retain a vestige of their original bacterial genome that encodes just 13 proteins in humans; the remaining proteins that comprise mitochondria are encoded by genes that have been transferred or added to the host nucleus across more than a billion years of evolution. Hundreds of these proteins remain poorly or entirely uncharacterized. This significant knowledge gap has limited our basic understanding of mitochondrial function and hampered efforts to diagnose and treat mitochondrial disease, for which there are no FDA approved drugs7.
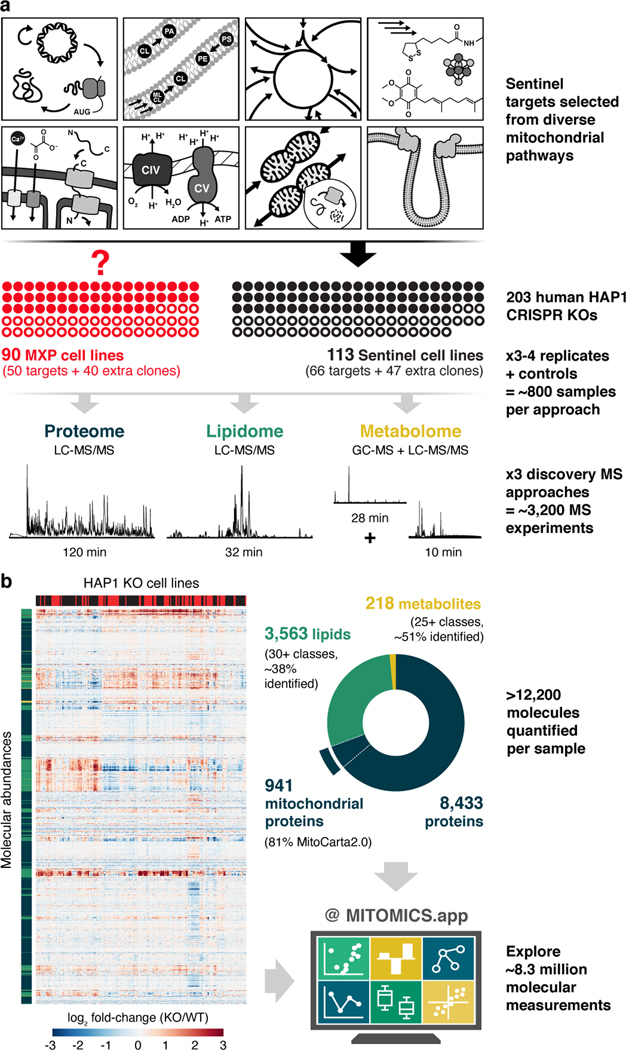
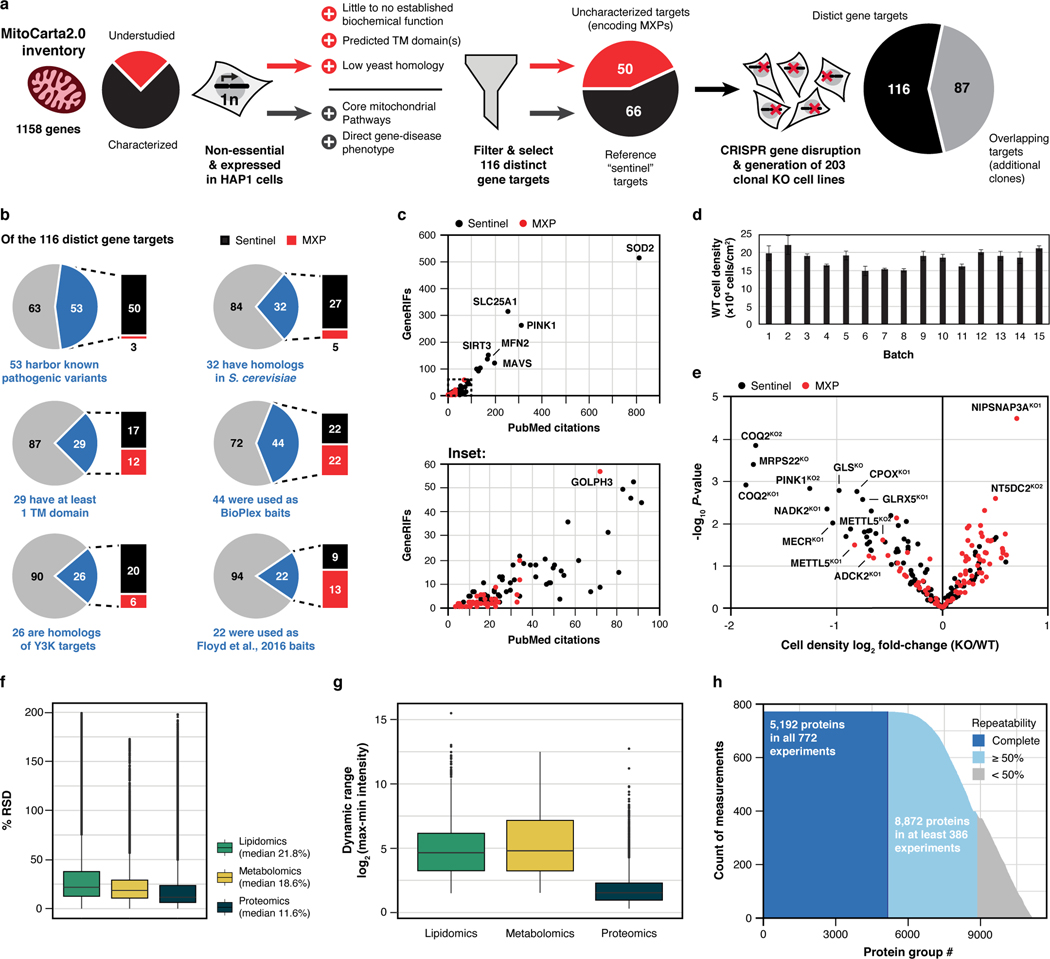
We recently devised an integrative ‘systems biochemistry8‘ approach that leverages high throughput quantitative mass spectrometry (MS)9–11 to help assign function to mitochondrial uncharacterized (x) proteins (MXPs) in Saccharomyces cerevisiae12. Here, we advanced this methodology and applied it to a set of 203 human HAP1 knockout (KO) cell lines, each with a nuclear-encoded mitochondrial gene disrupted by CRISPR/Cas9 technology. Our targeted genes include 50 encoding MXPs and another 66 encoding ‘sentinel’ proteins with more established functions (1–2 KO lines per target), most of which have been directly linked to human disease (Fig. 1a, Extended Data Fig. 1a–c, Supplementary Table 1).
Fig. 1 |. MITOMICS experimental design and data resource summary.
a, Overview of the experimental workflow, including knockout (KO) target selection, analysis strategy, and data collection. KO targets were selected to include genes coding for MXPs and for sentinel proteins known to be involved in diverse mitochondrial processes. Each cell line was analyzed using three distinct mass spectrometric approaches: proteins via LC-MS/MS shotgun proteomics, lipids via LC-MS/MS discovery lipidomics, and metabolites via GC-MS and LC-MS/MS untargeted metabolomics. MXP, Mitochondrial uncharacterized (X) protein (P). b, Hierarchical clustering of biomolecule abundances (proteins, lipids, and metabolites) in 203 knockout cell lines compared to wild-type (WT) cells (mean, n = 3–4), and breakdown of >12,200 biomolecules quantified in each cell line by class, explorable via interactive visualizations at MITOMICS.app.
We monitored the growth rates of each cell line in biological triplicate (Extended Data Fig. 1d,e, Supplementary Table 1) and profiled them in depth using high resolution and accurate mass discovery MS techniques. Overall, this mitochondrial orphan protein multi-omic CRISPR screen (MITOMICS) encompassed ~ 3,200 GC and LC-MS experiments, generating ~ 8.3 million quantitative measurements. Across each cell line we quantify 8,433 proteins, 3,563 lipids, and 218 metabolites (Fig. 1b, Supplementary Table 2, Supplementary Table 3). These measurements were of high quality as evidenced by low median relative standard deviations (11.6% protein, 21.8% lipid, 18.6% metabolite) and high dynamic range with many molecules showing regulation over 3–4 orders of magnitude (Extended Data Fig. 1f,g). Of note, our single-shot LC-MS/MS proteomics methodology that incorporated multiple technical advancements13,14 consistently quantified 5,192 proteins in all 772 experiments so that in total only 5.4 % of protein measurements in the final dataset were imputed (Extended Data Fig. 1h). Thirteen cell lines did not pass our stringent proteomics quality control filters and were not included in subsequent analyses here (see Methods). With these data, we built www.MITOMICS.app—an online interactive resource equipped with intuitive analysis tools for exploring mitochondrial protein function.
Protein-specific molecular phenotypes
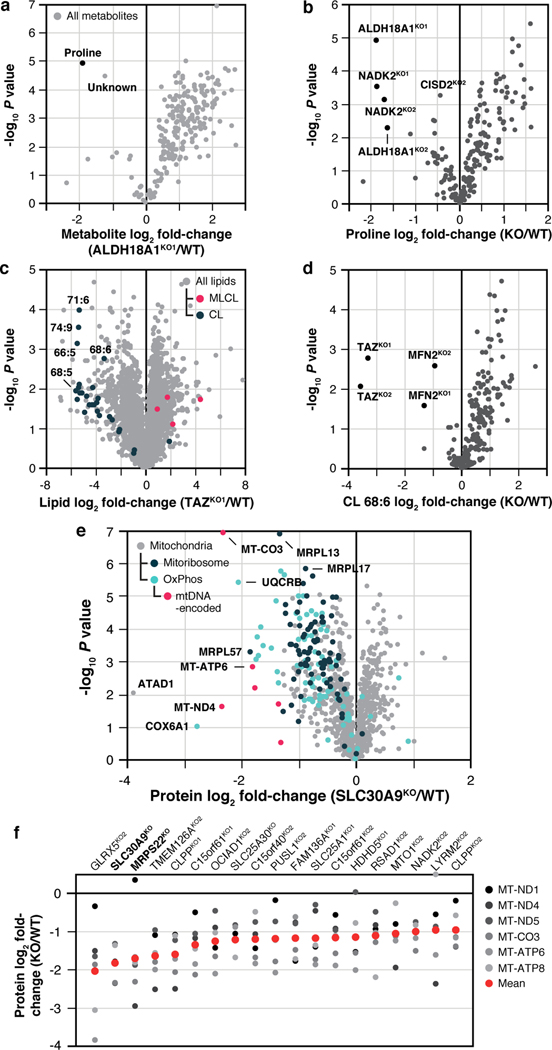
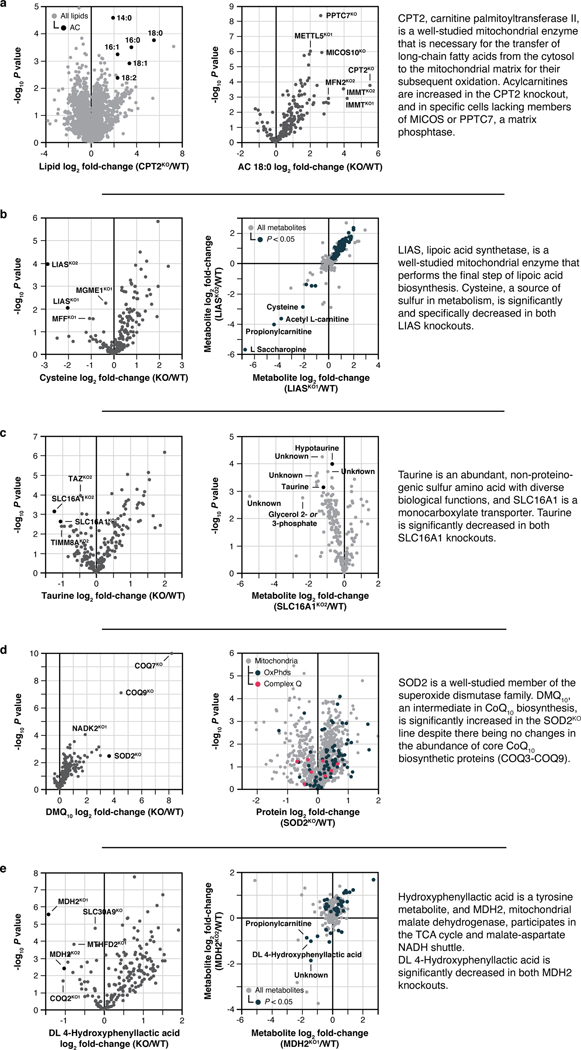
Simple molecule-centric analyses across each omic plane of the MITOMICS data can be used to recapitulate known biology and suggest new protein functions. For example, our metabolite measurements show that disruption of ALDH18A1, a critical enzyme for de novo proline biosynthesis13, leads to the expected proline deficiency (Fig. 2a). Unexpectedly, we see a comparable disruption of proline following disruption of NADK2, the mitochondrial NAD kinase (Fig. 2a). Consistently, NADK2 was linked to this pathway very recently while this work was under revision14,15. Similarly, our lipid data reveal the expected alteration of cardiolipin and acylcarnitine levels in cells lacking TAZ16 (Fig. 2c) and CPT217 (Extended Data Fig. 3a), respectively. However, we observe similar changes in these lipids from cells lacking the mitochondrial fusion regulator MFN218, and in specific acylcarnitine levels from cells lacking members of MICOS (the mitochondrial contact site and cristae organizing system)19 or PPTC7, a matrix phosphatase20 (Fig. 2d, Extended Data Fig. 3a). The connection of MFN2 and MICOS to these lipids suggests an underappreciated importance for proper interactions between mitochondrial membranes in the coordination of lipid metabolic processes. We note similar insights for cysteine, taurine, demethoxy coenzyme Q, and DL 4-hydroxyphenyllactic acid (Extended Data Fig. 2b–e).
Fig. 2 |. Molecule-centric analyses suggest new mitochondrial protein functions.
a, Relative metabolite abundance in ALDH18A1KO1 cells compared to WT cells versus statistical significance. b, Relative abundance of proline versus statistical significance across all KO lines. c, Relative lipid abundance in TAZKO1 cells compared to WT cells versus statistical significance with all CL and MLCL species highlighted. CL, cardiolipin; MLCL, Monolysocardiolipin. d, Relative abundance of CL 68:6 versus statistical significance across all KO lines. e, Relative protein abundance in SLC30A9KO cells compared to WT cells versus statistical significance with mitoribosome, OxPhos, and mtDNA-encoded proteins highlighted. f, Relative abundance of all six mtDNA-encoded proteins detected in our analyses across KO lines with ≥ 3 proteins having P < 0.05 (mean rank ordered). Data displayed as mean, n = 3–4, and two-sided Welch’s t-test for all panels.
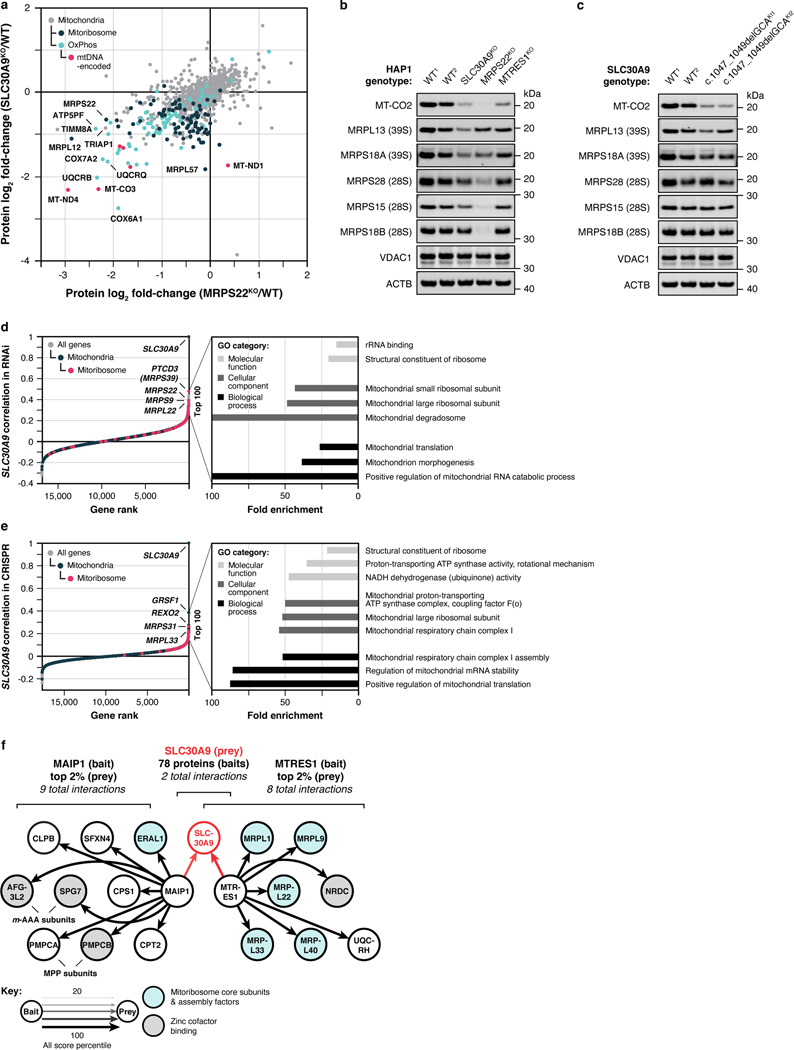
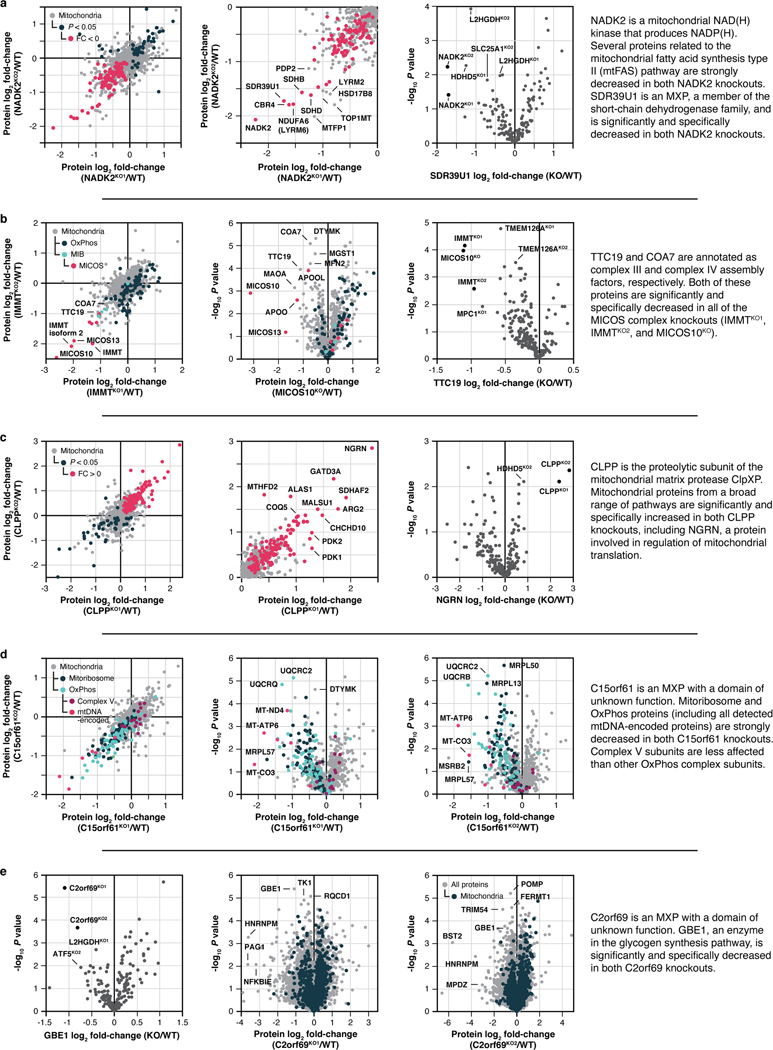
Our proteomics analyses likewise reveal new biology. A prominent example is seen for SLC30A9, a putative zinc transporter that only recently has been associated with mitochondria 21,22. Disruption of SLC30A9 resulted in significant loss of mitochondrial ribosome and OxPhos proteins (Fig. 2e). Intriguingly, recent cryo-EM studies revealed that the mitoribosome possesses unusual zinc-binding motifs proposed to stabilize the structures and quaternary interactions of subunit proteins23. Consistently, all six mtDNA-encoded OxPhos subunits detected by our MS method were strongly decreased in the SLC30A9KO line, comparable to the mitoribosome sentinel MRPS22KO line (Fig. 2f, Extended Data Fig. 3a). We further validated this finding with immunoblots of the mtDNA-encoded OxPhos subunit MT-CO2 in cells lacking SLC30A9, MRPS22, or MTRES1—a mitochondrial RNA-binding protein involved in mtDNA expression—and in cells we engineered to harbor an SLC30A9 patient mutation24 (Extended Data Fig. 3b,c). Also supporting this observation, we find that the highest-ranking genes co-essential with SLC30A9 in the DepMap project25 are strongly enriched for those encoding mitoribosome subunits (Extended Data Fig. 3d,e), and both we26 and Gopalakrishna et al.27 identified SLC30A9 as a binding partner for mitoribosome-related proteins, including MTRES1, (Extended Data Fig. 3f). These data nominate SLC30A9 as a zinc-related transporter whose function is crucial to core mitochondrial processes. Using similar profiles generated by the tools on our MITOMICS website, we propose new functions for mitochondrial proteins in diverse areas, including redox biology, MICOS integrity, protease function, mitochondrial DNA regulation, and glycogen metabolism (Extended Data Fig. 4a–e).
PYURF regulates CoQ and CI biology
As demonstrated above, our resource can be used to identify proteins involved in defined processes. Many diagnosed human mitochondrial disorders featuring coenzyme Q (CoQ)28 or complex I (CI)29 deficiencies lack apparent mutations in established CoQ- and CI-related genes, suggesting that these pathways rely on proteins that have yet to be identified.
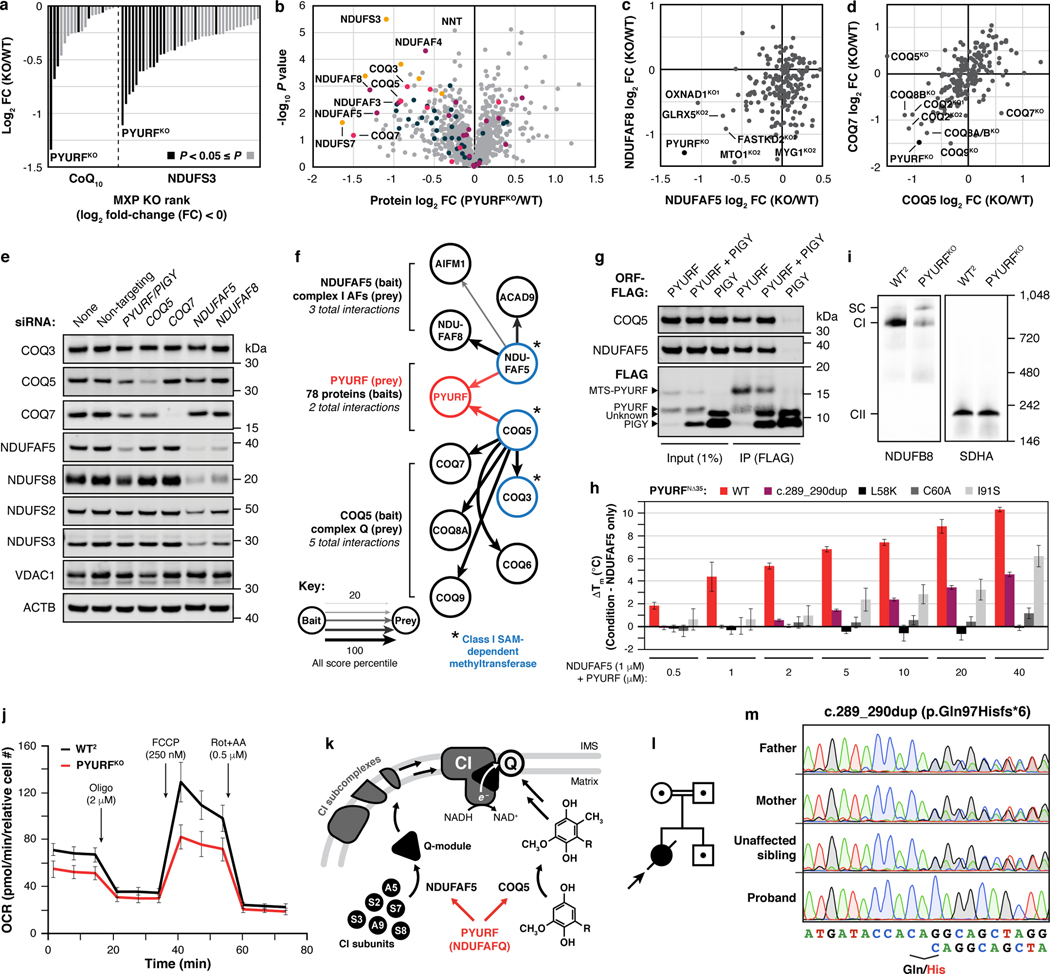
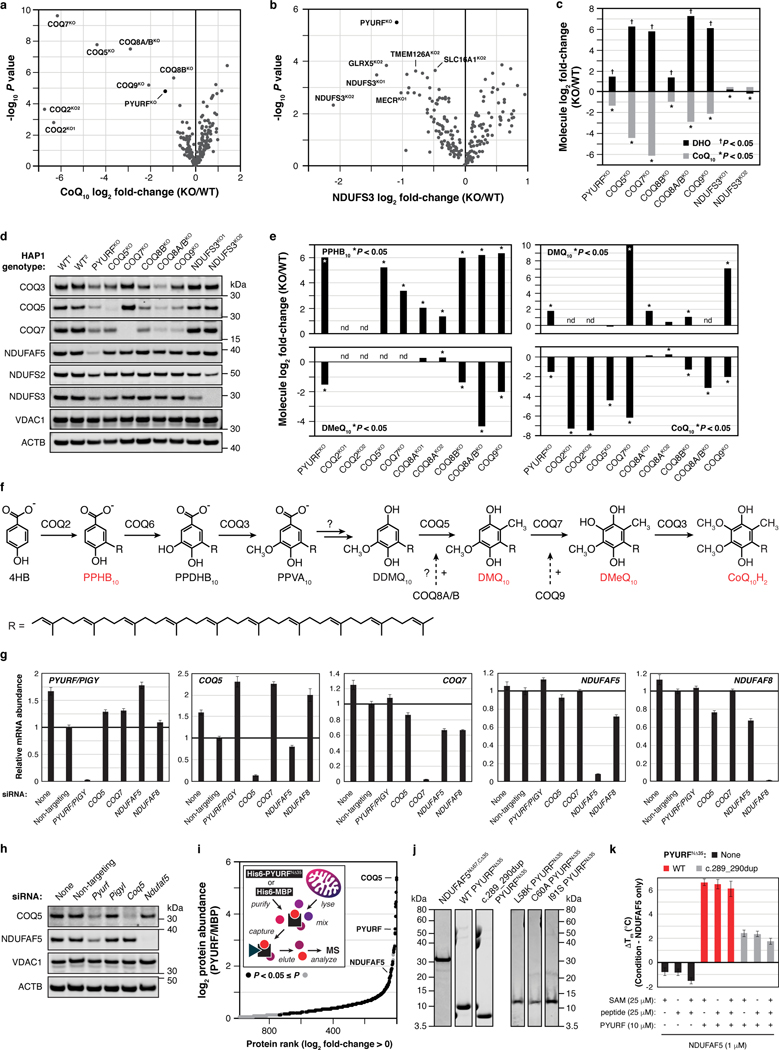
To search for MXPs involved in these processes, we first analyzed CoQ levels in each of our cell lines. As expected, the strongest losses of CoQ were seen in our sentinel lines lacking proteins required for CoQ biosynthesis (Extended Data Fig. 5a). Following these, the top hit among all MXPs was PYURF, which was recently identified in a CRISPR-based screen for genes essential for mitochondrial respiration30, but is otherwise uncharacterized (Fig. 3a). Consistently, our metabolomics data revealed that the PYURFKO line had elevated levels of dihydroorotate, whose conversion to orotate requires CoQ (Extended Data Fig. 5c). Surprisingly, our search for CI-related proteins based on NDUFS3 levels (our CI sentinel protein) again yielded PYURF as the top MXP hit (Fig. 3a, Extended Data Fig. 5b), suggesting that PYURF may somehow bridge these essential and interrelated pathways.
Fig. 3 |. PYURF (NDUFAFQ) is a CoQ- and CI-related chaperone disrupted in human disease.
a, Relative abundance of CoQ10 and NDUFS3 across MXP KOs with log2 fold-changes < 0. b, Relative protein abundance in PYURFKO cells compared to WT versus statistical significance with CoQ-related proteins (COQ3-COQ9), complex I (CI), CI Q-module, and CI-assembly factor (AF) proteins highlighted. c, d, Relative abundance of NDUFAF5 versus NDUFAF8 (c), and COQ5 versus COQ7 (d) compared to WT across all KO lines, respectively. (a-d) Data displayed as mean, n = 3–4, and two-sided Welch’s t-test. e, CI, CI-AF, and CoQ biosynthetic protein levels in 293 cells treated with indicated siRNAs for five days assessed by immunoblotting. f, Meta-analysis of protein-protein interaction data displaying the 2/78 bait proteins, NDUFAF5 and COQ5, that interact with PYURF, and related CI-AF and complex Q proteins. g, COQ5 and NDUFAF5 levels in immunoprecipitates from 293 cells transfected with PYURF-FLAG, PYURF-FLAG-PIGY-FLAG, and PIGY-FLAG constructs. h, Melting temperature of NDUFAF5 with increasing concentrations of WT PYURF, c.289_290dup patient variant, or point mutants compared to NDUFAF5 only measured by differential scanning fluorimetry (mean ± s.d., n = 3). i, Level of assembled complex I (left) and complex II (right) in HAP1 WT and PYURFKO cells assessed by BN-PAGE and immunoblotting. SC, respiratory supercomplex. j, Mitochondrial stress test profile showing cellular oxygen consumption rate normalized to relative cell number versus time for WT and PYURFKO cells (mean ± s.d., n = 10–14). k, Model of PYURF function in coordinating the CI assembly and CoQ biosynthesis pathways. l, Pedigree of consanguineous kindred and their offspring. Arrow indicates the deceased index case. Dots indicate carriers of the c.289_290dup PYURF variant. m, Sanger sequencing traces displaying heterozygous carrier status in the father, mother, and unaffected sibling, and the homozygous PYURF variant in the proband. For western source data, see Supplementary Figure 1.
To further explore the connection between PYURF and these pathways, we analyzed the full proteomic profile of the PYURFKO line. Three CoQ-related proteins (COQ3, COQ5, and COQ7) and three CI assembly factors (NDUFAF3 (AF3), NDUFAF5 (AF5), and NDUFAF8 (AF8))31 are markedly decreased in this line (Fig. 3b). The PYURFKO line stands out among all our cell lines for coordinated loss of these proteins (Fig. 3c,d). Other CI subunits were also decreased in this line, particularly those that comprise the CI Q-module where CoQ binds (Fig. 3b). We validated these large-scale analyses with targeted measurements of CoQ-and CI-related proteins and CoQ precursors (Extended Data Fig. 5d–f). To ensure that these effects are not unique to HAP1 cells, we silenced PYURF expression in HEK293 cells and observed comparable loss of CoQ- and CI-related proteins without any significant effect on their corresponding mRNA levels (Fig. 3e, Extended Data Fig. 5g). Notably, in humans, but not in mice, PYURF (PIGY Upstream Reading Frame) is bicistronic with PIGY32. To ensure that these effects are driven by PYURF, we silenced PYURF in murine C2C12 cells and observed similar depletion of COQ5 and AF5 (Extended Data Fig. 5h).
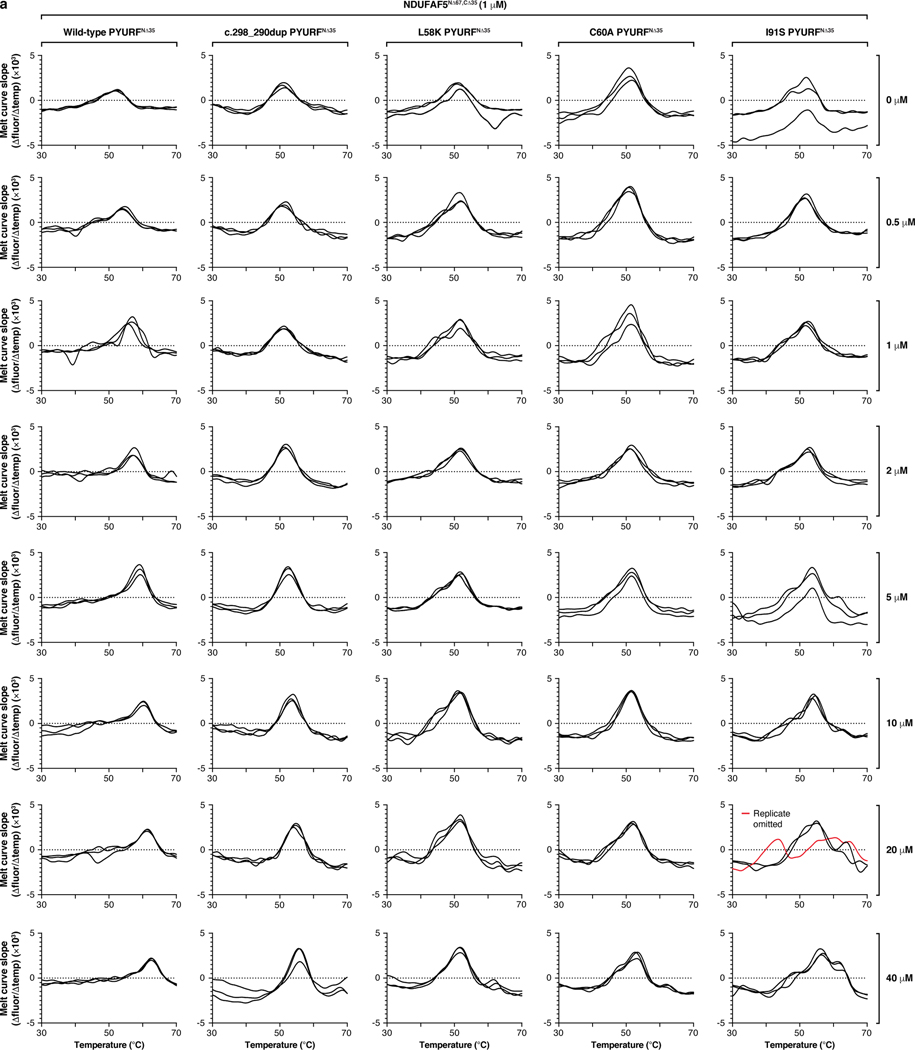
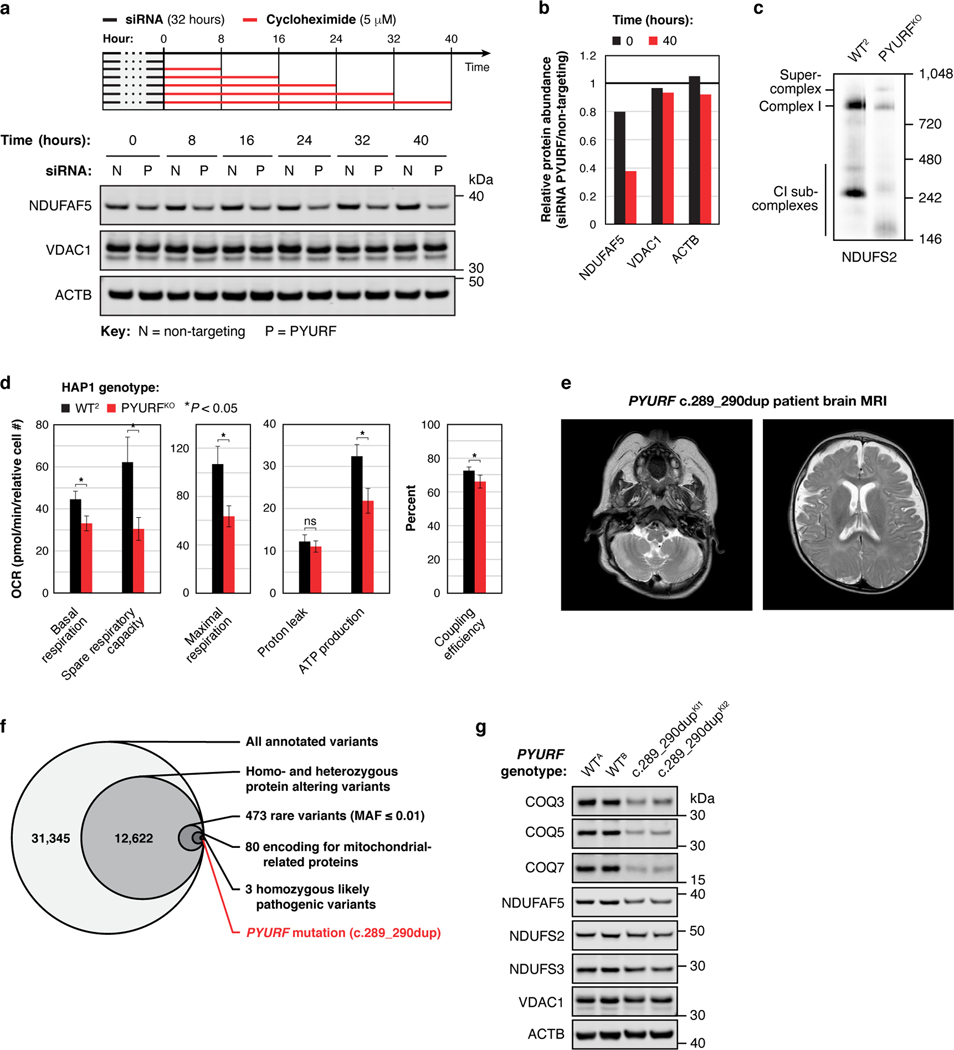
In reanalyzing our recent systematic analyses of mitochondrial protein-protein interactions26, we found PYURF to interact with just two proteins: AF5 and COQ5, which themselves interacted with AF8 and other COQ-proteins, respectively (Fig. 3f). Intriguingly, AF5, COQ5, and COQ3 are all members of the S-adenosylmethionine-dependent methyltransferase (SAM-MT) family (Fig. 3f), suggesting that PYURF selectively binds members of this protein class, likely via its Trm112-like domain33. We confirmed these interactions via immunoprecipitation of tagged PYURF from HEK293 cells (Fig. 3g) and from HAP1 mitochondria (Extended Data Fig. 5i, Supplementary Table 4), and demonstrated direct binding between purified recombinant PYURF and AF5 using differential scanning fluorimetry (DSF) (Fig. 3h, Extended Data Fig. 5j, and Extended Data Fig. 6). PYURF-AF5 binding was markedly reduced by introducing any of four mutations to conserved residues in the PYURF Trm112 domain (Fig. 3h). PYURF did not induce SAM binding or catalytic activity of AF5, consistent with a documented role for Trm112 in stabilizing a SAM-MT without contributing to substrate binding or catalysis33 (Extended Data Fig. 5k). To test the effect of PYURF on AF5 stability, we measured AF5 levels in HEK293 cells and found a marked reduction in its half-life following loss of PYURF expression (Extended Data Fig. 7a,b). Consistent with these observations, PYURFKO cells exhibit major loss of assembled CI by blue-native PAGE and diminished basal and uncoupled oxygen consumption rates (Fig. 3i,j and Extended Data Fig. 7c,d). Notably, other mitochondrial SAM-MTs in our study were not significantly affected by loss of PYURF. This selective targeting suggests a particular need to regulate these SAM-MTs, consistent with earlier findings that calibration of Coq5p levels in yeast is vital for cell health34,35. Collectively, these data support a model whereby PYURF binds and stabilizes SAM-MTs in the interconnected CI and CoQ pathways (Fig. 3k). Based on these observations, we propose renaming PYURF as NDUFAFQ.
Disruption of PYURF causes disease
Employing the MITOMICS resource to establish functional connections between MXPs and known pathways can accelerate the molecular diagnosis of orphan diseases, which remains a prominent challenge in mitochondrial medicine. Given the strong connection between PYURF and CoQ/CI processes, we explored whether such unresolved cases might harbor pathogenic PYURF variants. We identified a child born to consanguineous, first-cousin parents who presented at birth in profound metabolic acidosis (Fig. 3l). Clinical features included muscle hypotonia, failure to thrive, developmental delay, optic atrophy, persistently elevated blood and CSF lactate levels, and MRI findings highlighting abnormal cerebellar white-matter and cerebellar atrophy (Extended Data Fig. 7e, Methods).
To determine the precise genetic etiology, we performed unbiased, whole exome sequencing. We prioritized exonic (coding) or splice-site region variants with a minor allele frequency (MAF) ≤ 0.0136–38 and that were predicted to be pathogenic according to in silico tools39–41. Our analysis of autosomal recessive variants in nuclear genes encoding mitochondrial21 proteins (Extended Data Fig. 7f, Methods) revealed a homozygous frameshift variant in the second exon of PYURF (GenBank: NM_032906.4): c.289_290dup (p.Gln97Hisfs*6), a variant that was present in one allele (MAF = 0.000006287) in the Genome Aggregation Database (gnomAD)38, as the only conceivable candidate genetic cause. Sanger sequencing clearly demonstrated segregation with clinical disease in the family (Fig. 3m).
In the absence of patient cells, we engineered this mutation into HAP1 cells to test whether this PYURF variant is sufficient to disrupt CoQ- and CI-related processes. Cells harboring this mutation closely mirrored the PYURFKO line, with substantial loss of CoQ- and CI-related proteins (Extended Data Fig. 7g). Finally, we purified this mutant version of PYURF, which exhibited significantly diminished binding affinity for AF5 (Fig. 3h). Although the requisite patient cell line to absolutely prove pathogenicity is unavailable, the impairment of CI and CoQ processes in cells harboring this specific loss-of-function PYURF variant provides a molecular basis for the observed cellular phenotypes, highlighting the assistance the MITOMICS resource can provide for deorphanizing mitochondrial proteins and resolving rare diseases.
Composite analyses link MXPs to function
Beyond performing targeted searches for proteins that fill specific gaps in knowledge using select molecular queries, as with PYURF above, the MITOMICS data enable systematic, unbiased analyses that can link MXPs to proteins of related function using the full complement of our molecular measurements.
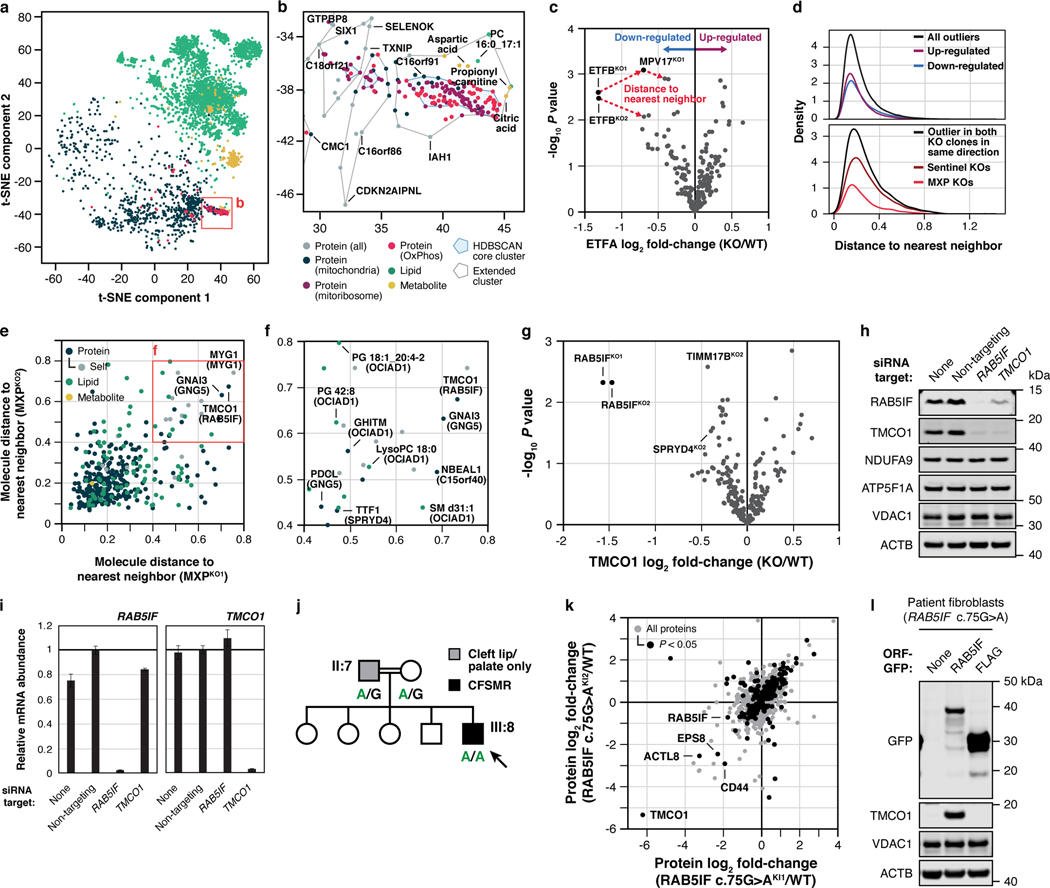
To begin, we applied t-SNE, a technique well suited for the visualization of high-dimensional datasets. In this analysis, each molecule was represented by a vector of its q-adjusted relative differences across all KO lines (see Methods). We analyzed the full t-SNE plot (Fig. 4a) using HDBSCAN42, a spatial cluster detection method that identifies dense clusters against the background distribution of points; we further identified the closest HDBSCAN cluster for each background point. This analysis revealed tight clusters for OxPhos- and mitoribosome-related proteins (Fig. 4a,b and Extended Data Fig. 8a–c). Beyond the established proteins in these pathways, these clusters include aspartic acid—consistent with the established role of cellular respiration in supporting aspartate biosynthesis43,44—a phosphatidylcholine species, and a number of poorly characterized proteins. The latter include the MXP C16orf91 and uncharacterized proteins C18orf21 and GTPBP8, among others, suggesting that these proteins are linked to these pathways in ways not yet appreciated.
Fig. 4 |. t-SNE and KO-specific phenotype analyses connect MXPs to mitochondrial functions.
a, b, t-SNE analysis of the MITOMICS data (a) (mean log2 fold-changes and associated multi-ome q-values from 191 conditions) and inset (b) showing clusters of known OxPhos and mitoribosome proteins and other biomolecules clustering with these pathways. c, Example of the KO-specific phenotype detection approach showing ETFBKO1 and ETFBKO2 as outlier KOs for ETFA (relative abundance versus statistical significance across all KO lines) (mean, n = 3–4, two-sided Welch’s t-test). d, Normalized density plot of nearest neighbor distances showing the number of KO-specific phenotypes identified as up- or down-regulated, and identified in both KO clones and in the same direction of regulation for sentinel KOs and MXP KOs. e, f, Molecule distance to nearest neighbor in MXP KO clone 1 versus KO clone 2 (e) and inset (f) showing molecules with large nearest neighbor distances detected for both MXP KO clones (KO target indicated in parentheses). g, Relative abundance of TMCO1 versus statistical significance across all KO lines (mean, n = 3–4, two-sided Welch’s t-test). h, i, Level of the indicated proteins (h) and transcripts (i) in 293 cells treated with siRNA for two days as assessed by immunoblotting and qPCR (mean ± s.d., n = 3), respectively. j, Abbreviated pedigree of affected family and associated phenotypes. Arrow indicates proband. k, Relative protein abundance in HAP1 RAB5IF c.75G>A knock-in cells (clone 1 versus clone 2) compared to WT cells (mean, n = 3, two-sided Student’s t-test). l, Level of TMCO1 in primary patient fibroblasts with the RAB5IF c.75G>A mutation transfected with RAB5IF-GFP or FLAG-GFP constructs as assessed by immunoblotting. For western source data, see Supplementary Figure 1.
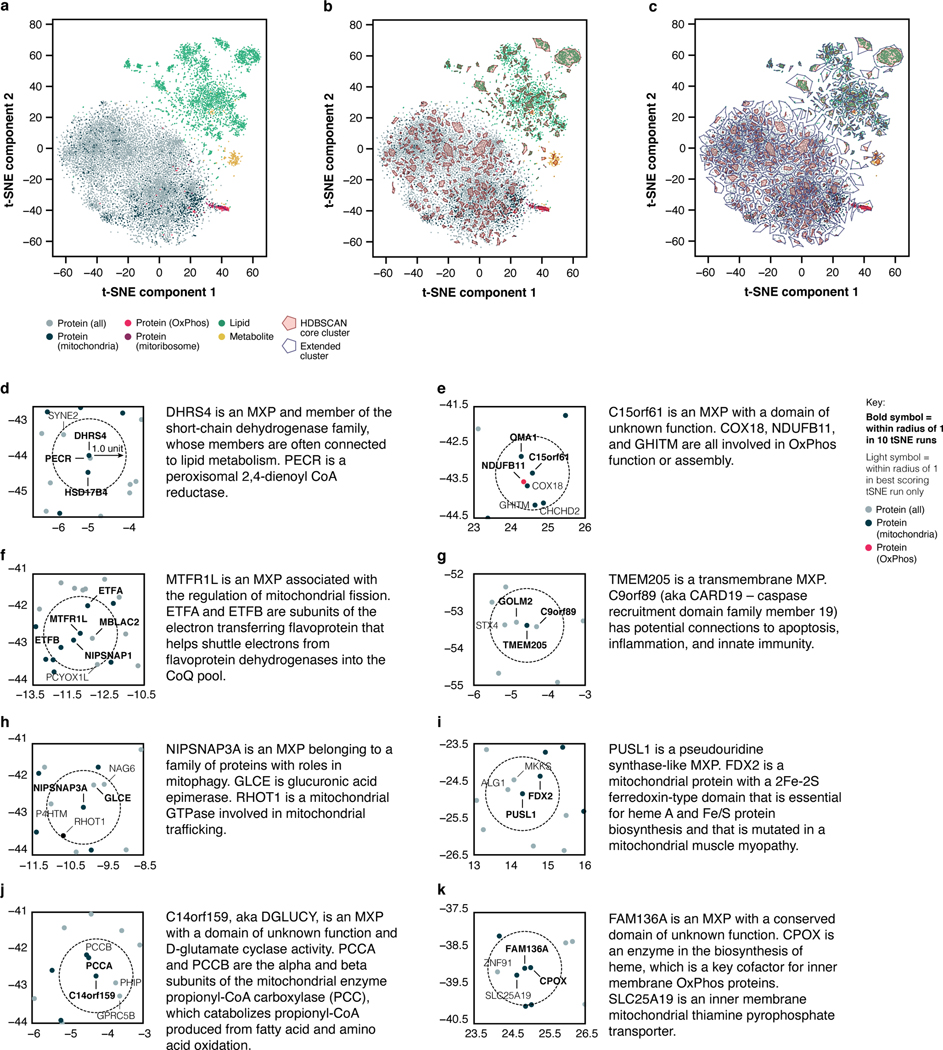
We extended this guilt-by-association analysis across the full t-SNE plot by defining a conservative plot radius of one unit (see Methods) and recording the molecules that fell within this radius for each MXP. These data suggest a range of MXP functions, including roles for DHRS4 in bridging mitochondrial and peroxisomal lipid metabolism, HDHD3 in the regulation of leucine metabolism, C14orf159 in propionyl-CoA metabolism, and various others (Extended Data Fig. 8d–k, Supplementary Table 5).
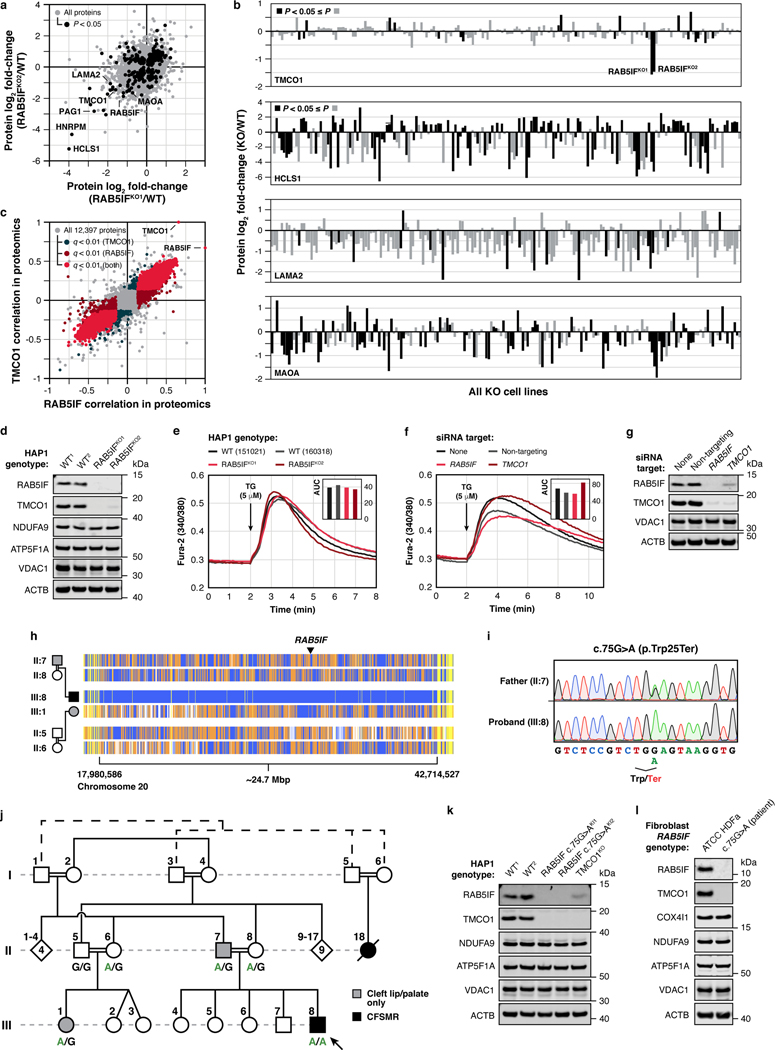
As a complementary approach, we systematically surveyed the MITOMICS data set for “outlier” molecular changes for each gene KO in the study (Fig. 4c,d, Supplementary Table 6). Molecules (proteins, lipids, or metabolites) whose abundances change substantially more in one gene KO than all others likely possess a functional relationship with that gene12. This analysis suggests multiple such gene-molecule relationships across our dataset (Fig. 4e,f), including a particularly strong connection between the MXP RAB5IF (aka C20orf24) and TMCO1. Our proteomics data reveal that TMCO1 is markedly and specifically diminished in the RAB5IFKO line, which we confirmed via western blots (Fig. 4g, Extended Data Fig. 9a,b,d). We further tested whether this relationship persists in a distinct cell line (HEK293) by using siRNA to silence either RAB5IF or TMCO1 expression. Again, loss of RAB5IF led to a near complete loss of TMCO1 protein levels without affecting TMCO1 mRNA levels (Fig. 4h,i). Moreover, the effect was reciprocal: silencing of TMCO1 had similar effects on RAB5IF protein without affecting its mRNA levels (Fig. 4h,i). These results establish a clear mutual dependence for these two poorly characterized proteins, which holds true across hundreds of cell lines within the DepMap project25 (Extended Data Fig. 9c), and further reveal how different analytical tools can be applied to the MITOMICS resource to explore protein function.
RAB5IF pathogenic variants cause CFSMR
The biological functions of TMCO1 and RAB5IF remain nebulous. Recent studies have described TMCO1 as a mitochondrial protein43, but also as a member of an ER translocon44, or an ER channel that prevents Ca2+ stores from overfilling45. However, we observed no changes to Ca2+ release in response to thapsigargin in our TMCO1KO or RAB5IFKO HAP1 cells (Extended Data Fig. 9e), or in HeLa cells (Extended Data Fig. 9f,g). RAB5IF was recently annotated as a mitochondrial respiratory chain assembly factor46, yet we also do not observe notable loss of respiratory chain proteins in its absence. Despite these unclear functions, it is well-established that mutations in TMCO1 cause cerebrofaciothoracic dysplasia, aka craniofacial dysmorphism, skeletal anomalies, and mental retardation syndrome (CFSMR, MIM: 213980)47. Given the strong connection between TMCO1 and RAB5IF in our data, we hypothesized that mutations in RAB5IF might underlie unresolved cases of CFSMR.
Previously, clinical features of five families with CFSMR were described by Alanay et al., four of which have been associated with biallelic mutations in TMCO147. In the remaining family, the TMCO1 locus had been excluded by homozygosity mapping despite a fully consistent clinical CFSMR diagnosis. We revisited these data and identified 11 distinct homozygosity regions, including the critical region on chromosome 20 where RAB5IF is located (Extended Data Fig. 9h). Sanger sequencing revealed a homozygous, loss-of-function variant in the first exon, c.75G>A (p.Trp25*) for the affected individual (Fig. 4j, Extended Data Fig. 9i), which was poorly covered by previous exome sequencing data. This variant, which presumably leads to early truncation of the protein, was not seen in the gnomAD database, while five unaffected individuals from the same family lacked this mutation in homozygosity. Notably, two of the individuals with cleft lip and/or palate were heterozygous for this mutation (Fig. 4j, Extended Data Fig. 9j), suggesting that heterozygosity for this RAB5IF variant may represent low-penetrant variation leading to cleft lip or palate, which is a component of CFSMR. Interestingly, of the 11 reported families with TMCO1-related CFSMR, only one heterozygote has cleft lip47. It is not unreasonable to speculate that cleft lip would lead to some selection pressure in RAB5IF heterozygotes for whom cleft lip seems to be more common than TMCO1 heterozygotes, a notion that is supported by gnomAD LOEUF scores, which are low for RAB5IF (0.602) and high for TMCO1 (1.362). Importantly, the loss of TMCO1 seen in the RAB5IFKO cell line was recapitulated in HAP1 cells engineered to express the patient mutation (Extended Data Fig. 9k). We performed a full proteomic analysis of two independent clones harboring this mutation, which revealed high overall correlation between the lines with TMCO1 being the most affected protein in each case (Fig. 4k).
To further probe the pathogenicity of this variant, we established a fibroblast cell culture from a patient biopsy and confirmed that these cells exhibited loss of RAB5IF and TMCO1 (Extended Data Fig. 9l). Reintroduction of wild-type RAB5IF-GFP into these cells by transfection resulted in a substantial increase in TMCO1 levels (Fig. 4l), unequivocally demonstrating that defective RAB5IF is the cause of this patient’s clinical phenotype. Overall, these data inextricably link two poorly understood proteins, RAB5IF and TMCO1, thereby providing a new route to interrogate the function of each protein and understand the underlying pathophysiology of a debilitating disorder. Interestingly, the partial localization of TMCO1 to the ER suggests that the connection between these proteins, and the etiology of CFSMR, may involve inter-organellar interactions.
Systematic analyses of MITOMICS data
In this study, we demonstrate the power of the MITOMICS resource by unveiling new proteins central to core mitochondrial pathways, presenting a range of new molecular hypotheses that will motivate further mechanistic investigations, and providing molecular diagnoses for two unresolved human diseases. Beyond what we leverage here, our dataset immediately enables a vast array of additional analyses. The MITOMICS website is equipped with built-in tools, including outlier analysis, volcano plot profiles, molecule ranking across cell lines, scatter correlations, PCA, gene ontology analyses, and t-SNE. Our full datasets can also be downloaded easily for custom analyses.
Moving forward, our deep, multi-dimensional dataset and analysis platform—especially when integrated with other large-scale biological and patient registry data—promises to help advance multiple pressing areas of mitochondrial biology and medicine48, including: accelerating the functional characterization of orphan proteins, facilitating the discovery of new disease genes, improving our understanding of genotype-phenotype correlations, improving our understanding of mitochondrial disease pathomechanisms, and devising more robust diagnostics and therapeutics for the extensive array of human disorders underpinned by mitochondrial dysfunction.
Extended Data
Extended Data Fig. 1 |. MITOMICS design, target selection, and quality control.
a, Criteria and filtering approach for knockout (KO) target selection. b, Features of each gene target and their representation in other select large-scale analyses at the time of selection. Metrics were taken from OMIM (omim.org), NCBI HomoloGene (ncbi.nlm.nih.gov/homologene), TMHMM (PMID: 11152613), The BioPlex Interactome (PMID: 28514442), The Y3K Project (PMID: 27669165), and Floyd et al., 2016 (PMID: 27499296). c, PubMed citations versus NCBI GeneRIFs (References Into Function) for each gene target at the time of selection. d, Cell density of wild-type (WT) reference cells across each analysis batch that were used to normalize cell growth measurements (mean ± s.d., n = 3–4). e, Relative cell density of each KO cell line compared to WT cells versus statistical significance (mean, n = 3–4, two-sided Welch’s t-test). f, Distribution of % relative standard deviation (% RSD) of molecular abundance measurements made in 3–4 replicates of the KO cell lines. g, Distribution of log2 range in measured molecular abundances of all analytes calculated by subtracting the minimum observed intensity from the maximum observed intensity of each molecule across all cell lines. h, Histogram illustrating the count of quantitative measurements made per protein group across all analyzed samples.
Extended Data Fig. 2 |. MITOMICS profiles suggest new mitochondrial protein functions.
a-e, Relative molecule abundance (protein, lipid, or metabolite) in the indicated KO compared to WT versus statistical significance, relative molecule abundance in KO versus KO compared to WT, or relative abundance of an individual molecule versus statistical significance across all KO lines with an accompanying summary of our observations. Data displayed as mean, n = 3–4, and two-sided Welch’s t-test for all panels.
Extended Data Fig. 3 |. SLC30A9 is necessary for mitochondrial ribosome and OxPhos protein integrity.
a, Relative protein abundance in HAP1 MRPS22KO cells versus SLC30A9KO cells compared to WT cells with mitoribosome, OxPhos, and mtDNA-encoded proteins highlighted. Data displayed as mean, n = 3–4, and two-sided Welch’s t-test. b, Level of mtDNA-encoded MT-CO2 and mitoribosome proteins in the indicated KO cell lines as assessed by immunoblotting. c, Level of the indicated proteins in HAP1 WT and SLC30A9 c.1047_1049delGCA knock-in cells (two clones) as assessed by immunoblotting. d, e, Gene correlations with SLC30A9 in DepMap project RNAi (d) and CRISPR (e) datasets with genes encoding mitochondrial and mitoribosome proteins highlighted and the top three GO annotations (most specific subclass term within a functional class) in each category for the 100 highest-ranking genes. f, Meta-analysis of protein-protein interaction data from Floyd et al., 2016 (PMID: 27499296) (Ref. #26) displaying the two bait proteins (out of 78) that interacted with SLC30A9 and the top 2% of their interactors with mitoribosome core subunits, mitoribosome assembly factors, and zinc cofactor binding proteins (based on UniProt annotations) highlighted. For western source data, see Supplementary Figure 1.
Extended Data Fig. 4 |. Additional molecule-centric analyses suggest mitochondrial protein functions.
a-e, Relative protein abundance in the indicated KO compared to WT versus statistical significance, relative protein abundance in KO versus KO compared to WT, or relative abundance of an individual protein versus statistical significance across all KO lines with an accompanying summary of our observations. Data displayed as mean, n = 3–4, and two-sided Welch’s t-test for all panels.
Extended Data Fig. 5 |. PYURF (NDUFAFQ) is a CoQ- and CI-related chaperone.
a, b, Relative abundance of CoQ10 (a) and NDUFS3 (b) versus statistical significance across all KO lines. c, Relative abundance of dihydroorotate (DHO) and CoQ10 in the indicated KO cell lines compared to WT cells. (a-c) Data displayed as mean, n = 3–4, and two-sided Welch’s t-test. d, Level of complex I (CI), CI-assembly factor, and CoQ biosynthetic proteins in the indicated KO cell lines as assessed by immunoblotting. e, Relative abundance of CoQ10 and biosynthetic pathway intermediates analyzed via targeted LC-MS (mean, n = 3–4, two-sided Welch’s t-test). PPHB, polyprenyl-hydroxybenzoate; DMQ, demethoxy-coenzyme Q; DMeQ, demethyl-coenzyme Q. f, CoQ biosynthesis pathway following polyisoprenoid tail attachment. Molecules quantified in (e) are indicated in red. 4-HB, 4-hydroxybenzoate; PPDHB, polyprenyl-dihydroxybenzoate; PPVA, polyprenyl-vanillic acid; DDMQ, demethoxy-demethyl-coenzyme Q. Supportive role for reactions is indicated by ‘+’ symbol next to arrows. g, Level of the indicated transcripts in 293 cells treated with siRNA for five days as assessed by qPCR (mean ± s.d., n = 3). h, Level of COQ5 and NDUFAF5 in mouse C2C12 cells treated with the indicated siRNAs for five days as assessed by immunoblotting. i, Relative abundance of protein interactors for WT PYURF compared to maltose-binding protein (MBP) captured from a HAP1 mitochondrial lysate detected via immunoprecipitation (IP)-LC-MS/MS analysis (mean, n = 3, two-sided Student’s t-test). j, Purity of NDUFAF5, WT PYURF, c.289_290dup patient variant, and point mutants analyzed via SDS-PAGE and Coomassie stain. k, Melting temperature of NDUFAF5 with combinations of WT PYURF or c.289_290dup mutant PYURF, peptide, and S-adenosylmethionine (SAM) compared to NDUFAF5 only as measured by differential scanning fluorimetry (mean ± s.d., n = 3). For western and gel source data, see Supplementary Figure 1.
Extended Data Fig. 6 |. Mutations to PYURF disrupt binding and stability of NDUFAF5.
a, First-derivative plots of the differential scanning fluorimetry analysis in Fig. 3h (n = 3).
Extended Data Fig. 7 |. PYURF (NDUFAFQ) is important for mitochondrial function and is disrupted in human disease.
a, b, Level of the indicated proteins in 293 cells during a cyclohexamide chase experiment following PYURF knockdown (a), and quantification of the immunoblot data (b). c, Level of assembled complex I in HAP1 WT and PYURFKO cells as assessed by BN-PAGE and immunoblotting. d, Parameters of mitochondrial function for WT and PYURFKO cells calculated from the mitochondrial stress test assay in Fig. 3j (mean ± s.d., n = 10–14, two-sided Student’s t-test). e, Brian MRI of the PYURF case demonstrating increased extra axial CSF spaces, cystic high signal cerebellar white-matter, cerebellar atrophy, and decreased myelination in the internal capsule. f, Whole exome sequencing analysis and filtering for rare, autosomal recessive variants in nuclear genes encoding mitochondrial proteins. MAF, minor allele frequency. g, Level of the indicated proteins in HAP1 unedited PYURF WT cells and PYURF c.289_290dup knock-in cells (two clones each) as assessed by immunoblotting. For western source data, see Supplementary Figure 1.
Extended Data Fig. 8 |. t-SNE analyses suggest functions for MXPs.
a-c, t-SNE analysis of the MITOMICS data (mean log2 fold-changes and associated multi-ome q-values from 191 conditions) displaying all molecules (a), core clusters (b), and extended clusters (c). d-k, Analysis of the MXP KO targets in the t-SNE plot to identify proteins that fall within their close proximity (one unit radius) with accompanying summaries of our observations.
Extended Data Fig. 9 |. RAB5IF is mutated in CFSMR.
a, Relative protein abundance in RAB5IFKO1 cells versus RAB5IFKO2 cells compared to WT. b, Relative abundance of indicated proteins across all KO lines. (a, b) Data displayed as mean, n = 3–4, and two-sided Welch’s t-test. c, Protein correlations with RAB5IF versus protein correlations with TMCO1 in the DepMap proteomics dataset. d, Level of the indicated proteins in HAP1 WT and RAB5IF KO cells assessed by immunoblotting. e, f, Fura-2 fluorescence (mean, n = 3) following thapsigargin (TG) treatment in WT and RAB5IF KO cells (e), and HeLa cells treated with indicated siRNAs for three days (f) with area under the curve (AUC) measurements. g, RAB5IF and TMCO1 levels in HeLa cells treated with indicated siRNAs for three days assessed by immunoblotting. h, Homozygosity mapping of a 24.7 Mbp candidate region in chromosome 20p11.23-q13.12. Homozygous genotypes in the index (III:8) shown in blue. In other individuals, identical homozygous genotypes are also in blue, whereas contrasting homozygous genotypes are in white. Heterozygous genotypes are orange, while non-informative genotypes resulting from heterozygous SNPs in parent-child trios are yellow. Note that the index is homozygous for the candidate region, while the cousin (III:1) is heterozygous for the entire region. i, Sanger sequencing showing the c.75G>A (p.Trp25*) mutation as homozygous in the index (III:8) and heterozygous in his father (II:7). j, Pedigree of affected family with genotypes and associated phenotypes. Note that individuals II:7 and III:1 only have cleft lip and/or palate without other clinical features of CFSMR and are heterozygous for the RAB5IF variant. k, l, Indicated protein levels in HAP1 WT and RAB5IF c.75G>A knock-in cells (2 clones) (k), and normal adult human primary dermal fibroblasts (HDFa) and primary patient fibroblasts with the RAB5IF c.75G>A mutation (l) assessed by immunoblotting. For western source data, see Supplementary Figure 1.
Supplementary Material
Acknowledgements
We thank all members of the D.J.P. and J.J.C. laboratories for helpful discussions and assistance on this project. Specifically, we thank Jonathan Stefely for suggestions on experimental design, Brendan Floyd and Natalie Niemi for advice on KO target selection, Molly McDevitt and Jonathan Stefely for guidance on lipid extraction, Zak Baker for insightful data observations, and Abigail Bartlett, Matthew Stefely, Andrew Sung, and Somi Hwang for graphic contributions. We thank Yoshiko Murakami and Taroh Kinoshita (Osaka University) for kindly providing the pRL-CMV-PreYF-PIG-YF expression constructs, Jing Fan (Morgridge Institute for Research and University of Wisconsin-Madison) for advice on metabolite extraction, and Yasemin Sancak (University of Washington) for advice on cellular calcium analysis. This work was supported by NIH awards R35 GM131795 (D.J.P.), P41 GM108538 (J.J.C. and D.J.P.), and U54 AI117924 (Y.S. and M.C.); a UW2020 award (D.J.P. and J.J.C.); funds from the BJC Investigator Program (D.J.P.); Scientific and Technological Research Council of Turkey (TUBITAK) grant number 108S420 (N.A.A.) under the framework of ERA-NET for research on Rare Disease, CRANIRARE Consortium (R07197KS); and the Wellcome Centre for Mitochondrial Research (203105/Z/16/Z), the Medical Research Council (MRC) International Centre for Genomic Medicine in Neuromuscular Disease (MR/S005021/1), the UK NIHR Biomedical Research Centre for Ageing and Age-related disease award to the Newcastle upon Tyne Foundation Hospitals NHS Trust, the Mitochondrial Disease Patient Cohort (UK) (G0800674), the Lily Foundation, the Pathological Society, and the NHS Highly Specialised Service for Rare Mitochondrial Disorders (R.W.T.).
Footnotes
Competing interest declaration
J.J.C. is a consultant for Thermo Fisher Scientific.
Supplementary Information
Supplementary Information is available for this paper.
References
- 1.Calvo SE & Mootha VK The mitochondrial proteome and human disease. Annu Rev Genomics Hum Genet 11, 25–44, doi: 10.1146/annurev-genom-082509-141720 (2010). [DOI] [PMC free article] [PubMed] [Google Scholar]
- 2.Vafai SB & Mootha VK Mitochondrial disorders as windows into an ancient organelle. Nature 491, 374–383, doi: 10.1038/nature11707 (2012). [DOI] [PubMed] [Google Scholar]
- 3.Nunnari J.& Suomalainen A.Mitochondria: in sickness and in health. Cell 148, 1145–1159, doi: 10.1016/j.cell.2012.02.035 (2012). [DOI] [PMC free article] [PubMed] [Google Scholar]
- 4.Pagliarini D.et al. A mitochondrial protein compendium elucidates complex I disease biology. Cell 134, 112–123, doi: 10.1016/j.cell.2008.06.016 (2008). [DOI] [PMC free article] [PubMed] [Google Scholar]
- 5.Frazier AE, Thorburn DR & Compton AG Mitochondrial energy generation disorders: genes, mechanisms, and clues to pathology. J Biol Chem 294, 5386–5395, doi: 10.1074/jbc.R117.809194 (2019). [DOI] [PMC free article] [PubMed] [Google Scholar]
- 6.Lane N.& Martin W.The energetics of genome complexity. Nature 467, 929–934, doi: 10.1038/nature09486 (2010). [DOI] [PubMed] [Google Scholar]
- 7.Weissig V.Drug Development for the Therapy of Mitochondrial Diseases. Trends Mol Med 26, 40–57, doi: 10.1016/j.molmed.2019.09.002 (2020). [DOI] [PubMed] [Google Scholar]
- 8.Sung AY, Floyd BJ & Pagliarini DJ Systems Biochemistry Approaches to Defining Mitochondrial Protein Function. Cell Metab 31, 669–678, doi: 10.1016/j.cmet.2020.03.011 (2020). [DOI] [PMC free article] [PubMed] [Google Scholar]
- 9.Hebert AS et al. The one hour yeast proteome. Mol Cell Proteomics 13, 339–347, doi: 10.1074/mcp.M113.034769 (2014). [DOI] [PMC free article] [PubMed] [Google Scholar]
- 10.Hutchins PD, Russell JD & Coon JJ LipiDex: An Integrated Software Package for High-Confidence Lipid Identification. Cell Syst 6, 621–625 e625, doi: 10.1016/j.cels.2018.03.011 (2018). [DOI] [PMC free article] [PubMed] [Google Scholar]
- 11.Peterson AC et al. Development of a GC/Quadrupole-Orbitrap mass spectrometer, part I: design and characterization. Anal Chem 86, 10036–10043, doi: 10.1021/ac5014767 (2014). [DOI] [PMC free article] [PubMed] [Google Scholar]
- 12.Stefely JA et al. Mitochondrial protein functions elucidated by multi-omic mass spectrometry profiling. Nat Biotechnol 34, 1191–1197, doi: 10.1038/nbt.3683 (2016). [DOI] [PMC free article] [PubMed] [Google Scholar]
- 13.Phang JM, Liu W, Hancock C.& Christian KJ The proline regulatory axis and cancer. Front Oncol 2, 60, doi: 10.3389/fonc.2012.00060 (2012). [DOI] [PMC free article] [PubMed] [Google Scholar]
- 14.Tran DH et al. Mitochondrial NADP(+) is essential for proline biosynthesis during cell growth. Nat Metab 3, 571–585, doi: 10.1038/s42255-021-00374-y (2021). [DOI] [PMC free article] [PubMed] [Google Scholar]
- 15.Zhu J.et al. Mitochondrial NADP(H) generation is essential for proline biosynthesis. Science 372, 968–972, doi: 10.1126/science.abd5491 (2021). [DOI] [PMC free article] [PubMed] [Google Scholar]
- 16.Xu Y, Malhotra A, Ren M.& Schlame M.The enzymatic function of tafazzin. J Biol Chem 281, 39217–39224, doi: 10.1074/jbc.M606100200 (2006). [DOI] [PubMed] [Google Scholar]
- 17.Kerner J.& Hoppel C.Fatty acid import into mitochondria. Biochim Biophys Acta 1486, 1–17, doi: 10.1016/s1388-1981(00)00044-5 (2000). [DOI] [PubMed] [Google Scholar]
- 18.Santel A.& Fuller MT Control of mitochondrial morphology by a human mitofusin. J Cell Sci 114, 867–874 (2001). [DOI] [PubMed] [Google Scholar]
- 19.Eramo MJ, Lisnyak V, Formosa LE & Ryan MT The ‘mitochondrial contact site and cristae organising system’ (MICOS) in health and human disease. J Biochem 167, 243–255, doi: 10.1093/jb/mvz111 (2020). [DOI] [PubMed] [Google Scholar]
- 20.Niemi NM et al. Pptc7 is an essential phosphatase for promoting mammalian mitochondrial metabolism and biogenesis. Nat Commun 10, 3197, doi: 10.1038/s41467-019-11047-6 (2019). [DOI] [PMC free article] [PubMed] [Google Scholar]
- 21.Calvo SE, Clauser KR & Mootha VK MitoCarta2.0: an updated inventory of mammalian mitochondrial proteins. Nucleic Acids Res 44, D1251–1257, doi: 10.1093/nar/gkv1003 (2016). [DOI] [PMC free article] [PubMed] [Google Scholar]
- 22.Rhee HW et al. Proteomic mapping of mitochondria in living cells via spatially restricted enzymatic tagging. Science 339, 1328–1331, doi: 10.1126/science.1230593 (2013). [DOI] [PMC free article] [PubMed] [Google Scholar]
- 23.Greber BJ & Ban N.Structure and Function of the Mitochondrial Ribosome. Annu Rev Biochem 85, 103–132, doi: 10.1146/annurev-biochem-060815-014343 (2016). [DOI] [PubMed] [Google Scholar]
- 24.Perez Y.et al. SLC30A9 mutation affecting intracellular zinc homeostasis causes a novel cerebro-renal syndrome. Brain 140, 928–939, doi: 10.1093/brain/awx013 (2017). [DOI] [PMC free article] [PubMed] [Google Scholar]
- 25.Ghandi M.et al. Next-generation characterization of the Cancer Cell Line Encyclopedia. Nature 569, 503–508, doi: 10.1038/s41586-019-1186-3 (2019). [DOI] [PMC free article] [PubMed] [Google Scholar]
- 26.Floyd BJ et al. Mitochondrial Protein Interaction Mapping Identifies Regulators of Respiratory Chain Function. Mol Cell 63, 621–632, doi: 10.1016/j.molcel.2016.06.033 (2016). [DOI] [PMC free article] [PubMed] [Google Scholar]
- 27.Gopalakrishna S.et al. C6orf203 is an RNA-binding protein involved in mitochondrial protein synthesis. Nucleic Acids Res 47, 9386–9399, doi: 10.1093/nar/gkz684 (2019). [DOI] [PMC free article] [PubMed] [Google Scholar]
- 28.Stefely JA & Pagliarini DJ Biochemistry of Mitochondrial Coenzyme Q Biosynthesis. Trends Biochem Sci 42, 824–843, doi: 10.1016/j.tibs.2017.06.008 (2017). [DOI] [PMC free article] [PubMed] [Google Scholar]
- 29.Thompson K.et al. Recent advances in understanding the molecular genetic basis of mitochondrial disease. J Inherit Metab Dis 43, 36–50, doi: 10.1002/jimd.12104 (2020). [DOI] [PMC free article] [PubMed] [Google Scholar]
- 30.Arroyo JD et al. A Genome-wide CRISPR Death Screen Identifies Genes Essential for Oxidative Phosphorylation. Cell Metab 24, 875–885, doi: 10.1016/j.cmet.2016.08.017 (2016). [DOI] [PMC free article] [PubMed] [Google Scholar]
- 31.Mimaki M, Wang X, McKenzie M, Thorburn DR & Ryan MT Understanding mitochondrial complex I assembly in health and disease. Biochim Biophys Acta 1817, 851–862, doi: 10.1016/j.bbabio.2011.08.010 (2012). [DOI] [PubMed] [Google Scholar]
- 32.Murakami Y.et al. The initial enzyme for glycosylphosphatidylinositol biosynthesis requires PIG-Y, a seventh component. Mol Biol Cell 16, 5236–5246, doi: 10.1091/mbc.e05-08-0743 (2005). [DOI] [PMC free article] [PubMed] [Google Scholar]
- 33.Li W, Shi Y, Zhang T, Ye J.& Ding J.Structural insight into human N6amt1-Trm112 complex functioning as a protein methyltransferase. Cell Discov 5, 51, doi: 10.1038/s41421-019-0121-y (2019). [DOI] [PMC free article] [PubMed] [Google Scholar]
- 34.Lapointe CP et al. Multi-omics Reveal Specific Targets of the RNA-Binding Protein Puf3p and Its Orchestration of Mitochondrial Biogenesis. Cell Syst, doi: 10.1016/j.cels.2017.11.012 (2017). [DOI] [PMC free article] [PubMed] [Google Scholar]
- 35.Veling MT et al. Multi-omic Mitoprotease Profiling Defines a Role for Oct1p in Coenzyme Q Production. Mol Cell 68, 970–977 e911, doi: 10.1016/j.molcel.2017.11.023 (2017). [DOI] [PMC free article] [PubMed] [Google Scholar]
- 36.Lek M.et al. Analysis of protein-coding genetic variation in 60,706 humans. Nature 536, 285–291, doi: 10.1038/nature19057 (2016). [DOI] [PMC free article] [PubMed] [Google Scholar]
- 37.Genomes Project C.et al. A global reference for human genetic variation. Nature 526, 68–74, doi: 10.1038/nature15393 (2015). [DOI] [PMC free article] [PubMed] [Google Scholar]
- 38.Karczewski KJ et al. The mutational constraint spectrum quantified from variation in 141,456 humans. Nature 581, 434–443, doi: 10.1038/s41586-020-2308-7 (2020). [DOI] [PMC free article] [PubMed] [Google Scholar]
- 39.Adzhubei IA et al. A method and server for predicting damaging missense mutations. Nat Methods 7, 248–249, doi: 10.1038/nmeth0410-248 (2010). [DOI] [PMC free article] [PubMed] [Google Scholar]
- 40.Kircher M.et al. A general framework for estimating the relative pathogenicity of human genetic variants. Nat Genet 46, 310–315, doi: 10.1038/ng.2892 (2014). [DOI] [PMC free article] [PubMed] [Google Scholar]
- 41.Ng PC & Henikoff S.SIFT: Predicting amino acid changes that affect protein function. Nucleic Acids Res 31, 3812–3814, doi: 10.1093/nar/gkg509 (2003). [DOI] [PMC free article] [PubMed] [Google Scholar]
- 42.Campello RJGB, Moulavi D.& Sander J.Density-Based Clustering Based on Hierarchical Density Estimates in Advances in Knowledge Discovery and Data Mining, PAKDD 2013, Lecture Notes in Computer Science. Vol. 7819 160 (Springer, Berlin, Heidelberg, 2013). [Google Scholar]
- 43.Zhang Z.et al. Molecular cloning, expression patterns and subcellular localization of porcine TMCO1 gene. Mol Biol Rep 37, 1611–1618, doi: 10.1007/s11033-009-9573-8 (2010). [DOI] [PubMed] [Google Scholar]
- 44.McGilvray PT et al. An ER translocon for multi-pass membrane protein biogenesis. Elife 9, doi: 10.7554/eLife.56889 (2020). [DOI] [PMC free article] [PubMed] [Google Scholar]
- 45.Wang QC et al. TMCO1 Is an ER Ca(2+) Load-Activated Ca(2+) Channel. Cell 165, 1454–1466, doi: 10.1016/j.cell.2016.04.051 (2016). [DOI] [PubMed] [Google Scholar]
- 46.Moutaoufik MT et al. Rewiring of the Human Mitochondrial Interactome during Neuronal Reprogramming Reveals Regulators of the Respirasome and Neurogenesis. iScience 19, 1114–1132, doi: 10.1016/j.isci.2019.08.057 (2019). [DOI] [PMC free article] [PubMed] [Google Scholar]
- 47.Alanay Y.et al. TMCO1 deficiency causes autosomal recessive cerebrofaciothoracic dysplasia. Am J Med Genet A 164A, 291–304, doi: 10.1002/ajmg.a.36248 (2014). [DOI] [PubMed] [Google Scholar]
- 48.Schlieben LD & Prokisch H.The Dimensions of Primary Mitochondrial Disorders. Front Cell Dev Biol 8, 600079, doi: 10.3389/fcell.2020.600079 (2020). [DOI] [PMC free article] [PubMed] [Google Scholar]
Associated Data
This section collects any data citations, data availability statements, or supplementary materials included in this article.


