Abstract
Nucleic acid polymers block the assembly of hepatitis B virus (HBV) subviral particles, effectively preventing hepatitis B surface antigen (HBsAg) replenishment in the circulation. Nucleic acid polymer (NAP)–based combination therapy of HBV infection or HBV/hepatitis D virus (HDV) co‐infection is accompanied by HBsAg clearance and seroconversion, HDV‐RNA clearance in co‐infection, and persistent functional cure of HBV (HBsAg < 0.05 IU/ml, HBV‐DNA target not dected, normal alanine aminotransferase) and persistent clearance of HDV RNA. An analysis of HBsAg isoform changes during quantitative HBsAg declines (qHBsAg), and subsequent treatment‐free follow‐up in the REP 301/REP 301‐LTF (HBV/HDV) and REP 401 (HBV) studies was conducted. HBsAg isoforms were analyzed from frozen serum samples using Abbott Research Use Only assays for HBsAg isoforms (large [L], medium [M], and total [T]). The relative change over time in small HBsAg relative to the other isoforms was inferred by the change in the ratio over time of T‐HBsAg to M‐HBsAg. HBsAg isoform declines followed qHBsAg declines in all participants. No HBsAg isoforms were detectable in any participants with functional cure. HBsAg declines > 2 log10 IU/ml from baseline were correlated with selective clearance of S‐HBsAg in 39 of 42 participants. Selective S‐HBsAg decline was absent in 9 of 10 participants with HBsAg decline < 2 log10 IU/ml from baseline. Mild qHBsAg rebound during follow‐up <10 IU/ml consisted mostly of S‐HBsAg and M‐HBsAg and not accompanied by significant covalently closed circular DNA activity. Conclusion: The faster observed declines in S‐HBsAg indicate the selective clearance of subviral particles from the circulation, consistent with previous mechanistic studies on NAPs. Trace HBsAg rebound in the absence of HBV DNA may reflect HBsAg derived from integrated HBV DNA and not rebound of viral infection.
Selective declines in the small isoform of HBsAg during therapy indicate the targeting of HBV subviral particles. Selective declines in the small isoform of HBsAg are observed during therapy with nucleic acid polymers, consistent with their selective targeting of the assembly and secretion of subviral particles observed in vitro and in vivo.

INTRODUCTION
Chronic hepatitis B virus (HBV) infection is accompanied by fibrosis, cirrhosis, and hepatocellular carcinoma.[ 1 ] Affecting approximately 300 million people worldwide,[ 2 ] chronic HBV infection is responsible for 887,000 deaths annually.[ 3 ] Hepatitis D virus (HDV) is a satellite infection of HBV, which requires hepatitis B surface antigen (HBsAg) to form its envelope.[ 4 ] Co‐infection with HDV affects 20–40 million people[ 5 , 6 ] worldwide and accelerates the progression of liver disease.[ 7 ] In both conditions, HBsAg is the most abundant viral antigen, >99.99% of which is derived from noninfectious subviral particles (SVPs).[ 8 ] SVPs are produced independently from viral replication and independently from covalently closed circular DNA (cccDNA) via integrated HBV DNA.[ 8 ] The SVP assembly/secretory pathway is also involved in HDV envelopment and secretion.[ 8 ]
HBsAg is linked to inhibition of the innate and adaptive immune responses to HBV infection.[ 8 ] These immunoinhibitory activities of HBV are a major factor contributing to the maintenance of chronic HBV‐mediated hepatitis. Consistent with these effects, clearance of HBsAg during therapy is the only currently established endpoint that reliably predicts functional cure of HBV,[ 9 , 10 ] in which viremia remains controlled (HBsAg < 0.05 IU/ml, undetectable HBV DNA) and liver function remains normal (alanine aminotransferase [ALT] < upper limit of normal) in the absence of any therapy.[ 9 , 11 , 12 , 13 , 14 ] As such, the inability of existing therapies to achieve HBsAg loss during therapy in more than a small fraction of patients[ 15 , 16 ] is an important limitation in achieving functional cure with HBV and HDV infection.
In the open reading frame of the HBsAg messenger RNA, three in‐frame start codons lead to the production of three HBsAg isoforms: S‐HBsAg, M‐HBsAg, and L‐HBsAg (where S indicates selective, M indicates medium, and L indicates large).[ 17 ] S‐HBsAg contains four membrane‐spanning domains as well as the “a”‐determinant, the primary antigenic site of HBsAg.[ 18 ] In addition to these domains, M‐HBsAg contains an additional amino terminal preS2 sequence, and L‐HBsAg contains both amino terminal preS1 and preS2 sequences.[ 17 ] Both preS1 and preS2 sequences are required for virion assembly[ 17 , 19 ] but are dispensable for spherical SVP[ 20 , 21 ] and HDV[ 22 , 23 ] assembly. Additionally, the preS1 sequence uniquely found in L‐HBsAg contains the interaction domain required for sodium taurocholate cotransporting peptide‐dependent viral entry.[ 24 , 25 , 26 ] In spherical SVPs, S‐HBsAg accounts for about 95% of HBsAg, with only minor traces of L‐HBsAg (<1%) present.[ 27 ] However, in virions and SVP filaments, L‐HBsAg is substantially enriched (~25%).[ 17 , 27 ] This enrichment is likely driven by L‐HBsAg by interaction with γ2‐adaptin in post–endoplasmic reticulum vesicles that transit to the multivesicular body during viral morphogenesis.[ 28 ] With spherical SVPs forming the bulk of circulating HBsAg and consisting mostly of S‐HBsAg, this isoform is the major circulating HBsAg isoform. However, while M‐HBsAg and L‐HBsAg are found during acute and chronic infection, their levels have been proposed to drop significantly in inactive HBV carriers,[ 29 ] consistent with the reduced viremia observed in this patient population. Additionally, a recent study has observed that selective declines in M‐HBsAg and L‐HBsAg precede HBsAg loss during nucleos(t)ide analog (NUC) therapy in HBeAg‐positive HBV infection.[ 30 ]
Nucleic acid polymers (NAPs) selectively target the assembly and secretion of spherical SVPs[ 31 , 32 ] from both cccDNA and integrated HBV DNA,[ 33 ] effectively blocking the replenishment of HBsAg in the circulation. This effect is accompanied by declines in intracellular HBsAg[ 31 , 32 ] and clearance of HBsAg from the liver.[ 34 , 35 ] In clinical studies, NAP monotherapy is accompanied by rapid declines of HBsAg to levels < 0.05 IU/ml, HBsAg seroconversion, and rapid declines in HBV RNA and HBV DNA.[ 36 , 37 ] In HBeAg‐positive chronic infection, rapid clearance and seroconversion of HBeAg are also observed,[ 36 ] and in HBV/HDV co‐infection, additional rapid clearance of HDV RNA occurs.[ 33 ] When combined with pegylated interferon (pegIFN) or tenofovir disoproxil fumarate (TDF) and pegIFN, NAP‐based combination therapy leads to high rates of HBsAg loss (<0.005 IU/ml) and seroconversion, host‐mediated transaminase flares, high rates of cccDNA silencing, and high rates of functional cure of HBV with persistent HBsAg seroconversion[ 38 , 39 , 40 ] and persistent undetectable HDV RNA (in co‐infected individuals).[ 41 ] A retrospective analysis of changes in HBsAg isoform composition during therapy and follow‐up from NAP‐based combination therapy was performed to establish the pattern of response in each HBsAg isoform during therapy and treatment‐free follow‐up. This analysis included all participants with HBeAg‐negative HBV infection in the REP 401 study[ 38 ] and HBeAg‐negative HBV/HDV co‐infection in the REP 301[ 33 ]/REP 301‐LTF studies.[ 41 ]
METHODS
The study design for the REP 301, REP 301‐LTF, and REP 401 studies are presented in Figure 1. The REP 301 study was a nonrandomized, noncontrolled study in 12 patients with HBeAg‐negative chronic HBV/HDV co‐infection, in which 15 weeks of REP 2139‐Ca was followed by 15 weeks of REP 2139‐Ca and pegIFN followed by 33 weeks of pegIFN. An initial 24‐week treatment‐free follow‐up was followed by an additional 3‐year follow‐up in the REP 301‐LTF study with visits every 6 months. In the REP 401 study, 40 participants with chronic HBeAg‐negative HBV infection received 24 weeks of TDF followed by randomization to receive either TDF + pegIFN or TDF + pegIFN + NAPs (REP 2139‐Mg or REP 2165‐Mg) for 48 weeks. All participants receiving 24 weeks of TDF + pegIFN were switched to TDF + pegIFN + NAPs for 48 weeks for futility. Treatment‐free follow‐up was 48 weeks. All procedures were conducted in accordance with the National Health Authority and Ethics Committee of the Republic of Moldova.
FIGURE 1.
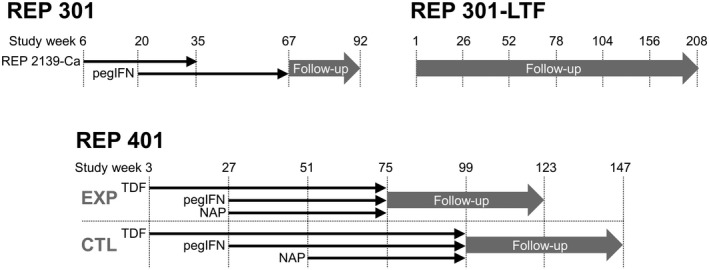
Designs of the REP 301 and REP 301‐LTF studies (top) and the REP 401 study (bottom). CTL, control; EXP, experimental; NAP, nucleic acid polymer; pgIFN, pegylated interferon; TDF, tenofovir disoproxil fumarate
Assay linearity tests with patient samples
Frozen serum samples (n = 1153) from all 52 participants in the REP 301/REP 301‐LTF and REP 401 studies were analyzed using the Abbott research use only (RUO) assays for HBsAg isoforms (large [L], medium [M] and total [T]) as previously described.[ 42 ] Each of the three RUO HBsAg isoforms assays is an automated chemiluminescent microparticle immunoassay that uses mouse monoclonal antibodies to specifically capture HBsAg from the serum. Following a wash step, L‐HBsAg, M‐HBsAg, and T‐HBsAg isoforms are revealed using acridinium labelled mouse monoclonal antibodies specific for PreS1, PreS2, and S‐HBsAg, respectively, and measured in relative light units. Signal to noise was determined for each isoform assay by running a panel of 50 HBsAg‐negative serum samples, and a cutoff (S/Co) was set at 2 S/N. The relative change over time in S‐HBsAg relative to the other isoforms was inferred by the change in the ratio over time of T‐HBsAg to M‐HBsAg S/Co results. Time points were when any of the measurements of T‐HBsAg and M‐HBsAg with S/Co < 1 were excluded from the ratio/trend analysis of S‐HBsAg. HBsAg isoform datapoints from REP 401 participants 02‐057 (study week 75) and 02‐023 (study week 87) were removed from the analysis data set, as they were inconsistent with quantitative HBsAg (qHBsAg) values from these timepoints and from isoform datapoints both before and after in these participants. Statistical analysis was performed by t‐test, single‐factor analysis of variance (ANOVA), regression ANOVA, or χ 2 test where appropriate. Statistical significance was considered met with p < 0.05.
RESULTS
HBsAg isoform results (T‐HBsAg, M‐HBsAg, and L‐HBsAg) in the current study were compared with previously published qHBsAg and alanine aminotransferase data.[ 33 , 38 , 41 ] In the REP 301 study (HBV/HDV co‐infection), individual participant responses of T‐HBsAg, M‐HBsAg, and L‐HBsAg declined similarly to those of qHBsAg early during REP 2139‐Ca monotherapy (Figure 2). However, at the end of REP 2139 monotherapy, small amounts of qHBsAg, T‐HBsAg, and M‐HBsAg persisted in 4 participants, whereas L‐HBsAg was not detectable (S/Co < 1) (Figure 2A, boxes). With the introduction of interferon and the onset of strong transaminase flares in these 4 participants, the residual qHBsAg, T‐HBsAg, and M‐HBsAg declined or became undetectable in all of these participants (Figure 3). All isoform trends followed qHBsAg throughout the rest of therapy and follow‐up (Figure 2) except for 2 participants with moderate qHBsAg response (001‐09 and 001‐22), where clearance of L‐HBsAg appeared more efficient (Figure 2B). In the 4 participants with qHBsAg < 0.05 IU/ml at the end of follow‐up, T‐HBsAg, M‐HBsAg, and L‐HBsAg were also all undetectable. In 1 participant (001‐01), rebound in qHBsAg was mirrored by rebound in T‐HBsAg and M‐HBsAg but rebound of L‐HBsAg was much weaker (Figure 2A).
FIGURE 2.
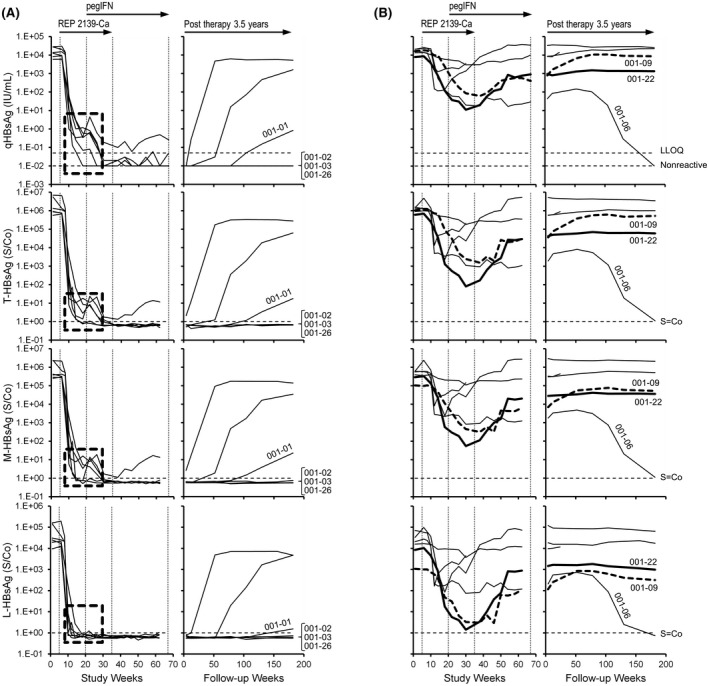
Individual participant dynamics of total hepatitis B surface antigen (T‐HBsAg), medium HBsAg (M‐HBsAg), and large HBsAg (L‐HBsAg) isoforms during therapy and follow‐up in the REP 301/301‐LTF studies. (A,B) Participants are grouped according to strong HBsAg decline (A) or more moderate HBsAg decline (B). Dashed boxes in (A) highlight the isoform composition at the end of REP 3139‐Ca monotherapy. The 2 participants with moderate quantitative HBsAg (qHBsAg) response, in whom clearance of L‐HBsAg appeared more efficient (001‐09 and 001‐22), are highlighted in bold in (B). The qHBsAg data were previously published.[ 33 , 41 ] LLOQ, lower limit of quantitation
FIGURE 3.
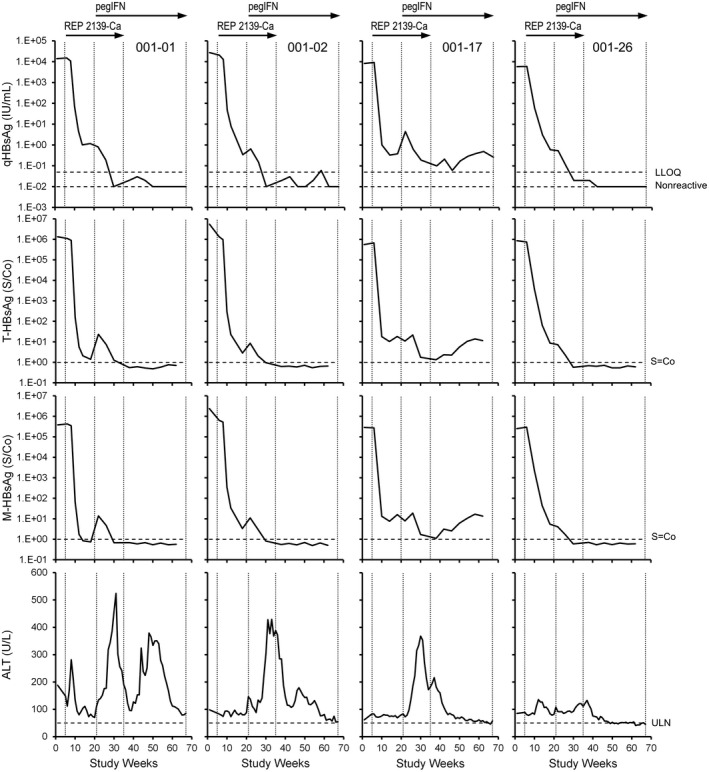
Individual participant dynamics of T‐HBsAg and M‐HBsAg isoforms and alanine aminotransferase (ALT) in the 4 REP 301 participants with residual qHBsAg present at the end of REP 2139‐Ca monotherapy. The qHBsAg and alanine aminotransferase (ALT) data were previously published[ 33 ]
In the REP 401 study (HBV infection), strong and rapid qHBsAg declines were observed only following the introduction of NAPs (Figure 4A) and became <1 IU/ml in 29 of 40 participants during 48 weeks of therapy with TDF + pegIFN + NAPs (Figure 4B). In 1 control participant receiving only TDF + pegIFN (02‐001), a more efficient clearance of L‐HBsAg was observed (Figure 4A). In participants experiencing qHBsAg decline to <1 IU/ml, declines in qHBsAg early during NAP exposure were mirrored by declines in T‐HBsAg, M‐HBsAg, and L‐HBsAg; however, clearance of L‐HBsAg tended to occur earlier (Figure 4B, boxes). Additionally, more efficient clearance of L‐HBsAg in 1 participant with more moderate HBsAg response (01‐075) was observed (Figure 4B).
FIGURE 4.
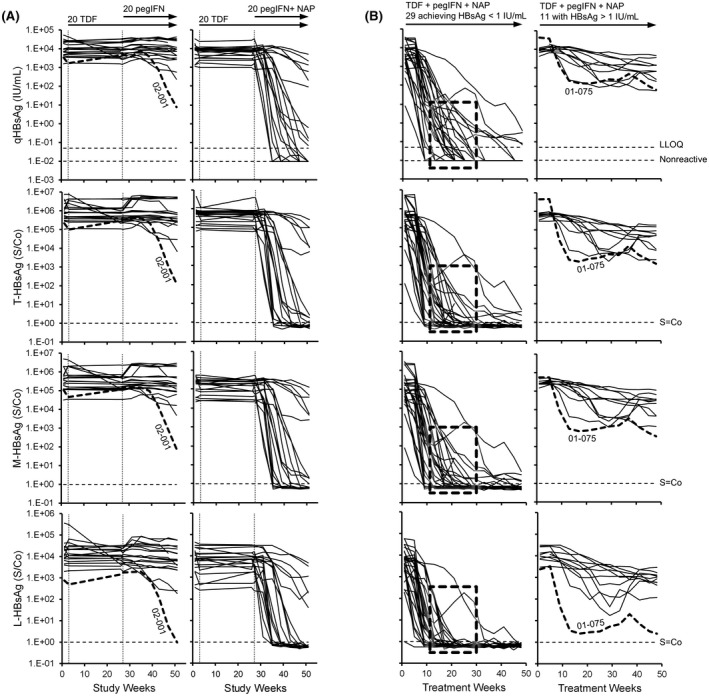
Individual participant dynamics of T‐HBsAg, M‐HBsAg, and L‐HBsAg isoforms during therapy in the REP 401 study. (A,B) Dynamics during the initial 48 weeks of therapy in control and experimental groups (A) and during 48 weeks of TDF + pegIFN + NAP therapy (B). Dashed boxes in (B) highlight the more efficient clearance of L‐HBsAg during therapy in participants achieving qHBsAg < 1 IU/ml during therapy. Isoform composition at the end of REP 3139‐Ca monotherapy. The 2 participants in whom clearance of L‐HBsAg appeared more efficient (01‐075 and 02‐001) are highlighted in bold. The qHBsAg data were previously published[ 38 ]. TDF, tenofovir disoproxil fumarate
During follow‐up, 19 participants maintained qHBsAg < 1 IU/ml throughout follow‐up (Figure 5A) but trace qHBsAg rebound observed in 3 of these participants appeared to be comprised primarily of T‐HBsAg and M‐HBsAg (Figure 5A). Delayed minor rebound in qHBsAg (~ 10 IU/ml) occurred in 4 participants and appeared to be comprised primarily of T‐HBsAg and M‐HBsAg (Figure 5B). Early qHBsAg rebound > 1 IU/ml was observed in the remaining 17 participants in whom qHBsAg rebound was mirrored by T‐HBsAg, M‐HBsAg, and L‐HBsAg (Figure 5C). In the 8 participants in the REP 301‐LTF and REP 401 studies, in whom trace qHBsAg rebound appeared devoid of L‐HBsAg, the transcriptional activity/prevalence of cccDNA appeared to be either very low or absent (Table 1).
FIGURE 5.
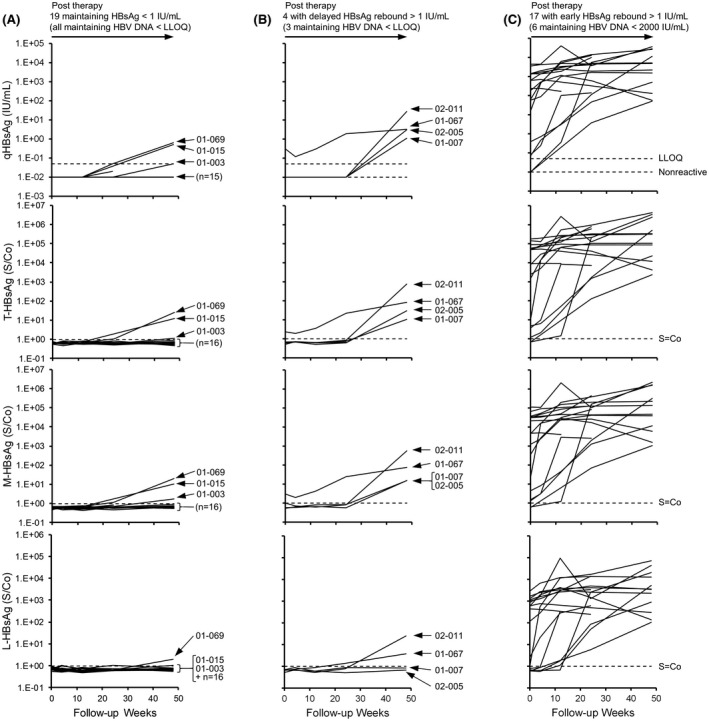
Individual participant dynamics of T‐HBsAg, M‐HBsAg, and L‐HBsAg isoforms in the REP 401 study during follow‐up. (A–C) Participants maintaining qHBsAg < 1 IU/ml (A), with delayed rebound of HBsAg > 1 IU/ml (B) or early rebound of HBsAg > 1 IU/ml (C). Individual participants in whom HBsAg rebound appeared to consist primarily of T‐HBsAg and M‐HBsAg are identified. The qHBsAg data were previously published[ 38 ]
TABLE 1.
Markers of Covalently Closed Circular DNA activity at end of follow‐up in participants with qHBsAg rebound <10 IU/ml
| Participant | HBV DNA a | HBV pgRNA a | HBcrAg a |
|---|---|---|---|
| 001‐01 | TND | 72 U/ml | <LLOQ |
| 01‐069 | <LLOQ | <LLOQ | <LLOQ |
| 01‐015 | TND | TND | <LLOQ |
| 01‐003 | TND | <LLOQ | <LLOQ |
| 02‐011 | <LLOQ | <LLOQ | <LLOQ |
| 01‐067 | 41 IU/mL | <LLOQ | <LLOQ |
| 02‐005 | <LLOQ | <LLOQ | <LLOQ |
| 01‐007 | TND | TND | <LLOQ |
Previously published.[ 38 ]
TND, target not detected.
As a prerequisite for examining selective declines in S‐HBsAg, linearity assessment was performed for the T‐HBsAg, M‐HBsAg, and L‐HBsAg assays on two external serum samples from Red Cross patients with HBV infection and one baseline serum sample from a REP 301 (01‐002) and a REP 401 (01‐024) participant (Figure S1). These analyses demonstrated good linearity in all three assays and stable T‐HBsAg–to–M‐HBsAg ratios with qHBsAg dilutions down to about 5 IU/ml, indicating that selective declines in S‐HBsAg could be examined by comparing the change over time of T‐HBsAg–to–M‐HBsAg (T:M). Analyses of changes in T:M over time in all 52 participants in the REP 301/301‐LTF and REP 401 studies revealed two distinct patterns. In participants with minimal or very slow qHBsAg response (Figure 6A,C,E), very little change in T:M was observed, indicating that no significant selective reduction in S‐HBsAg was occurring. In participants with strong qHBsAg response (Figure 6B,D,F), rapid declines in the T:M ratio were observed co‐incident with rapid reduction in qHBsAg. This indicated that the strong declines in qHBsAg in these participants was correlated with a more rapid decline in S‐HBsAg than M‐HBsAg or L‐HBsAg. An analysis of selective S‐HBsAg decline versus qHBsAg response in all 52 participants (Table 2) indicated that S‐HBsAg response was significantly correlated (p < 0.01) with HBsAg response > 2 log10 IU/ml from baseline.
FIGURE 6.
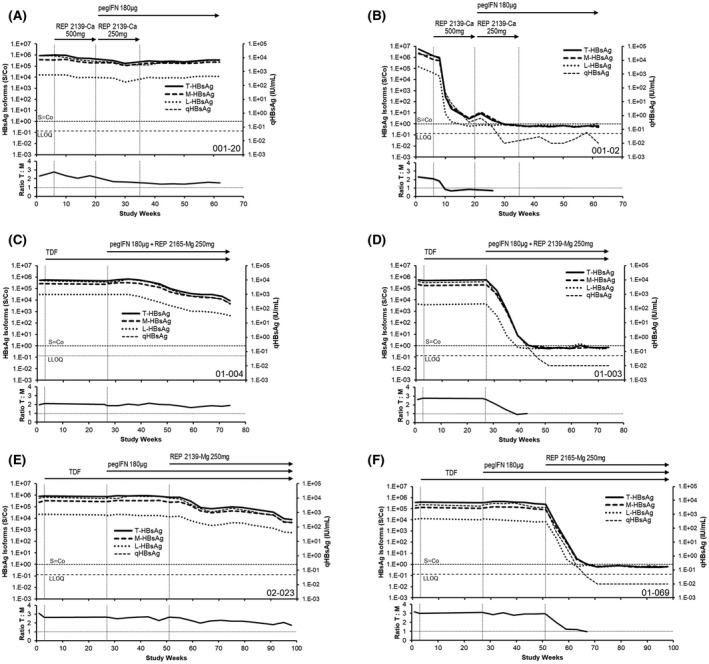
Selective decline of HBsAg (S‐HBsAg) during NAP‐based combination therapy. Representative examples of nonselective (A,C,E) and selective (B,D,F) S‐HBsAg response in the REP 301 and REP 401 studies (see Methods) are provided. Individual T‐HBsAg, M‐HBsAg, and S‐HBsAg and qHBsAg responses are provided at the top of each panel and changes in the T‐HBsAg–to–M‐HBsAg ratio during therapy are indicated in the bottom of each panel. The qHBsAg data was previously published.[ 33 , 38 ] The serum sample cutoff (S/Co) is indicated for HBsAg isoform assays, and LLOQ (0.05 IU/ml) is indicated for the qHBsAg assay
TABLE 2.
Correlation between selective S‐HBsAg clearance during therapy and qHBsAg response
| qHBsAg response during therapy (decline from baseline) | Total | S‐HBsAg decline | p value a |
|---|---|---|---|
| <2 log10 IU/ml | 10 | 1 | <0.01 |
| >2 log10 IU/ml | 42 | 39 |
Determined by χ 2 analysis.
The recent demonstration of the potential for using HBsAg isoform composition as a means to predict HBsAg loss during NUC therapy in HBeAg‐positive chronic HBV infection[ 30 ] led to the analysis of the relationship between baseline qHBsAg, T‐HBsAg, M‐HBsAg, and L‐HBsAg, and qHBsAg reduction during NAP‐based combination therapy (greater vs. <2 log10 decline from baseline) and HBV therapeutic outcome after NAP‐based combination therapy (rebound, virologic control, or functional cure) in both the REP 301/301‐LTF and REP 401 studies (Figure S2). There were no statistically significant differences between baseline qHBsAg, T‐HBsAg, M‐HBsAg, or L‐HBsAg and HBsAg response during therapy or HBV therapeutic outcome during follow‐up.
DISCUSSION
Declines in qHBsAg observed during NAP‐based combination therapy in the REP 301/301‐LTF and REP 401 studies included declines in all HBsAg isoforms and were correlated with the introduction of NAPs. A more rapid clearance of S‐HBsAg was observed in 39 of 42 participants with strong qHBsAg declines (>2log10 IU/ml from baseline) and is consistent with the selective effect of NAPs on spherical SVP assembly and secretion previously published.[ 31 , 32 ] Selective S‐HBsAg decline was absent in 9 of 10 participants with moderate (<2log10 IU/ml from baseline) qHBsAg decline, consistent with the moderate qHBsAg response typically observed with TDF + pegIFN,[ 15 ] further suggesting not only that the antiviral effect of NAPs was attenuated in these patients but also that inhibiting SVP assembly and release is required for strong and rapid HBsAg decline. Although assay linearity studies showed good linear reduction in signal across the range of HBsAg concentrations tested, the lack of suitable reference standards for the M and L proteins makes the sensitivities of these assays impossible to determine at the current time. Additionally, the T, M, and L isoform assays are not quantitative, whereas the qHBsAg assay is a quantitative assay standardized to the World Health Organization International HBsAg reference. As such, the possibility L‐HBsAg may be present in those patients with no detectable L‐HBsAg during the follow‐up cannot be excluded.
The basis for the reduced HBsAg response to NAPs in a small subset of participants[ 33 , 36 , 38 ] is not fully understood but does not appear to be due to reduced uptake into hepatocytes, as HDV‐RNA responses are similar in participants co‐infected with HBV/HDV, regardless of HBsAg response.[ 33 ] In earlier studies, mild HBsAg response was rescued by increased frequency dosing of NAPs,[ 36 ] suggesting that trafficking of NAPs to the ERGIC (the site of SVP morphogenesis[ 19 ]) may be attenuated in these participants and improved by more NAP frequent uptake into hepatocytes.
No HBsAg isoforms were detected at the end of follow‐up in all participants who achieved functional cure of HBV. However, the trace qHBsAg rebound (<10 IU/ml) in 8 participants during follow‐up appeared to consist primarily of S‐HBsAg and M‐HBsAg. Moreover, markers for cccDNA activity were either very low or absent in these participants at the end of follow‐up. Although the production of S‐HBsAg and M‐HBsAg is universally preserved in integrated HBV DNA, the production of L‐HBsAg is destroyed by disruption of the preS1 region in a significant minority of HBV‐DNA integrations.[ 23 , 43 , 44 ] Thus, the selective rebound of S‐HBsAg and M‐HBsAg in these participants may be derived from integrated HBV DNA not capable of producing L‐HBsAg.
No correlation was found between baseline levels of HBsAg isoforms and HBsAg decline during NAP‐based therapy or therapeutic outcomes during follow‐up. However, in addition to the selective S‐HBsAg declines observed early after the introduction of NAPs in the REP 301/301‐LTF and REP 401 studies, overall HBsAg clearance as qHBsAg became <10 IU/ml appeared to be more efficient for L‐HBsAg than the other HBsAg isoforms. Although this selective effect on L‐HBsAg clearance appears reminiscent of the selective declines in M‐HBsAg and L‐HBsAg, which precede HBsAg loss during NUC therapy of HBeAg‐positive HBV infection,[ 30 ] it did not include M‐HBsAg in the HBeAg‐negative patients in the REP 301 and REP 401 studies, and occurred in the absence of NUCs and before pegIFN therapy in the REP 301 study.
Recent studies have demonstrated the inactivation/degradation of cccDNA with NUCs[ 45 , 46 ] and pegIFN,[ 47 , 48 , 49 ] both of which are components of the NAP‐based therapies evaluated in this study. These effects may contribute to the more efficient clearance of L‐HBsAg through inactivation/clearance of cccDNA. The more effective clearance of L‐HBsAg in patients co‐infected with HBV/HDV may reflect lower cccDNA levels in co‐infection,[ 50 ] with subsequent clearance of T‐HBsAg and M‐HBsAg (concomitant with transaminase flares), suggesting removal of integrated HBV DNA. These open questions highlight the need for additional studies, which should preferably include quantitative HBsAg isoform assays.
The selective S‐HBsAg isoform response observed in participants experiencing strong qHBsAg declines validates the selective effects of NAPs in inhibiting the assembly and secretion of spherical SVPs in humans receiving NAP‐based therapy. Additional isoform analysis in future studies with NAPs will be useful to examine the antiviral effects of NAPs in humans in more detail.
CONFLICT OF INTEREST
MB and AV are employees of, shareholders in, and inventors of patents assigned to Replicor Inc. MA, JG, VH, MK, and GC are employees of and shareholders in Abbott Diagnostics Inc.
AUTHOR CONTRIBUTIONS
REP 401 study design: Andrew Vaillant and Michel Bazinet. Patient data collection: Victor Pântea, Gheorghe Placinta, Iurie Moscalu, Valentin Cebotarescu, Lilia Cojuhari, Pavlina Jimbei, Liviu Iarovoi, Valentina Smesnoi, Tatina Musteata, and Alina Jucov. Experimental HBV testing: Mark Anderson, Jeff Gersch, Vera Holzmayer, Mary Kuhns, and Gavin Cloherty. HBV testing supervision: Ulf Dittmer. Data analysis: Andrew Vaillant and Mark Anderson. Manuscript draft: Andrew Vaillant with assistance from all authors.
Supporting information
Fig S1
Bazinet M, Anderson M, Pântea V, Placinta G, Moscalu I, Cebotarescu V, et al. HBsAg isoform dynamics during NAP‐based therapy of HBeAg‐negative chronic HBV and HBV/HDV infection. Hepatol Commun. 2022;6:1870–1880. doi: 10.1002/hep4.1951
Funding information
REP 301, 301‐LTF and REP 401 studies sponsored by Replicor Inc. Experimental HBsAg isoform testing sponsored by Abbott Diagnostics Inc.
REFERENCES
- 1. Yuen M‐F, Chen D‐S, Dusheiko GM, Janssen HLA, Lau DTY, Locarnini SA, et al. Hepatitis B virus infection. Nat Rev Dis Primers. 2018;4:18035. [DOI] [PubMed] [Google Scholar]
- 2. Razavi‐Shearer D, Gamkrelidze I, Nguyen MH, Chen D‐S, Van Damme P, Abbas Z, et al. Global prevalence, treatment, and prevention of hepatitis B virus infection in 2016: a modelling study. Lancet Gastroenterol Hepatol. 2018;3:383–403. [DOI] [PubMed] [Google Scholar]
- 3. World Health Organization . Global Hepatitis Report. Geneva, Switzerland: World Health Organization; 2017. [Google Scholar]
- 4. Sureau C, Negro F. The hepatitis delta virus: replication and pathogenesis. J Hepatol. 2016;64:S102–S116. [DOI] [PubMed] [Google Scholar]
- 5. Wedemeyer H, Manns MP. Epidemiology, pathogenesis and management of hepatitis D: update and challenges ahead. Nat Rev Gastroenterol Hepatol. 2010;7:31–40. [DOI] [PubMed] [Google Scholar]
- 6. Chen H‐Y, Shen D‐T, Ji D‐Z, Han P‐C, Zhang W‐M, Ma J‐F, et al. Prevalence and burden of hepatitis D virus infection in the global population: a systematic review and meta‐analysis. Gut. 2019;68:512–21. [DOI] [PubMed] [Google Scholar]
- 7. Noureddin M, Gish R. Hepatitis delta: epidemiology, diagnosis and management 36 years after discovery. Curr Gastroenterol Rep. 2014;16:365. [DOI] [PMC free article] [PubMed] [Google Scholar]
- 8. Vaillant A. HBsAg, subviral particles, and their clearance in establishing a functional cure of chronic hepatitis B virus infection. ACS Infect Dis. 2021;7:1351–68. [DOI] [PubMed] [Google Scholar]
- 9. Moucari R, Mackiewicz V, Lada O, Ripault M‐P, Castelnau C, Martinot‐Peignoux M, et al. Early serum HBsAg drop: a strong predictor of sustained virological response to pegylated interferon alfa‐2a in HBeAg‐negative patients. Hepatology. 2009;49:1151–7. [DOI] [PubMed] [Google Scholar]
- 10. Anderson RT, Choi HSJ, Lenz O, Peters MG, Janssen HLA, Mishra P, et al. Association between seroclearance of hepatitis B surface antigen and long‐term clinical outcomes of patients with chronic hepatitis B virus infection: systematic review and meta‐analysis. Clin Gastroenterol Hepatol. 2021;19:463–72. [DOI] [PubMed] [Google Scholar]
- 11. Brunetto MR, Moriconi F, Bonino F, Lau GKK, Farci P, Yurdaydin C, et al. Hepatitis B virus surface antigen levels: a guide to sustained response to peginterferon alfa‐2a in HBeAg‐negative chronic hepatitis B. Hepatology. 2009;49:1141–50. [DOI] [PubMed] [Google Scholar]
- 12. Sonneveld MJ, Rijckborst V, Boucher CA, Hansen BE, Janssen HL. Prediction of sustained response to peginterferon alfa‐2b for hepatitis B e antigen‐positive chronic hepatitis B using on‐treatment hepatitis B surface antigen decline. Hepatology. 2010;52:1251–7. [DOI] [PubMed] [Google Scholar]
- 13. Rijckborst V, Hansen BE, Ferenci P, Brunetto MR, Tabak F, Cakaloglu Y, et al. Validation of a stopping rule at week 12 using HBsAg and HBV DNA for HBeAg‐negative patients treated with peginterferon alfa‐2a. J Hepatol. 2012;56:1006–11. [DOI] [PubMed] [Google Scholar]
- 14. Anderson RT, Choi HSJ, Lenz O, Peters MG, Janssen HLA, Mishra P, et al. Association between seroclearance of hepatitis B surface antigen and long‐term clinical outcomes of patients with chronic HBV infection: systematic review and meta‐analysis. Clin Gastroenterol Hepatol. 2020:S1542‐3565(1520)30748‐30745. [DOI] [PubMed] [Google Scholar]
- 15. Marcellin P, Ahn SH, Ma X, Caruntu FA, Tak WY, Elkashab M, et al. Combination of tenofovir disoproxil fumarate and peginterferon α‐2a increases loss of hepatitis B surface antigen in patients with chronic hepatitis B. Gastroenterology. 2016;150:134–44. [DOI] [PubMed] [Google Scholar]
- 16. Ahn SH, Marcellin P, Ma X, Caruntu FA, Tak WY, Elkhashab M, et al. Hepatitis B surface antigen loss with tenofovir disoproxil fumarate plus peginterferon alfa‐2a: week 120 analysis. Dig Dis Sci. 2018;63:3487–97. [DOI] [PMC free article] [PubMed] [Google Scholar]
- 17. Bruss V. Hepatitis B virus morphogenesis. World J Gastroenterol. 2007;13:65–73. [DOI] [PMC free article] [PubMed] [Google Scholar]
- 18. Brown SE, Howard CR, Zuckerman AJ, Steward MW. Affinity of antibody responses in man to hepatitis B vaccine determined with synthetic peptides. Lancet. 1984;2:184–7. [DOI] [PubMed] [Google Scholar]
- 19. Patient R, Hourioux C, Roingeard P. Morphogenesis of hepatitis B virus and its subviral envelope particles. Cell Microbiol. 2009;11:1561–70. [DOI] [PMC free article] [PubMed] [Google Scholar]
- 20. Laub O, Rall LB, Truett M, Shaul Y, Standring DN, Valenzuela P, et al. Synthesis of hepatitis B surface antigen in mammalian cells: expression of the entire gene and the coding region. J Virol. 1983;48:271–80. [DOI] [PMC free article] [PubMed] [Google Scholar]
- 21. Patient R, Hourioux C, Sizaret PY, Trassard S, Sureau C, Roingeard P. Hepatitis B virus subviral envelope particle morphogenesis and intracellular trafficking. J Virol. 2007;81:3842–51. [DOI] [PMC free article] [PubMed] [Google Scholar]
- 22. Wang CJ, Chen PJ, Wu JC, Patel D, Chen DS. Small‐form hepatitis B surface antigen is sufficient to help in the assembly of hepatitis delta virus‐like particles. J Virol. 1991;65:6630–6. [DOI] [PMC free article] [PubMed] [Google Scholar]
- 23. Freitas N, Cunha C, Menne S, Gudima SO. Envelope proteins derived from naturally integrated hepatitis B virus DNA support assembly and release of infectious hepatitis delta virus particles. J Virol. 2014;88:5742–54. [DOI] [PMC free article] [PubMed] [Google Scholar]
- 24. Yan H, Zhong G, Xu G, He W, Jing Z, Gao Z, et al. Sodium taurocholate cotransporting polypeptide is a functional receptor for human hepatitis B and D virus. Elife. 2012;1:e00049. [DOI] [PMC free article] [PubMed] [Google Scholar]
- 25. Lempp FA, Urban S. Inhibitors of hepatitis B virus attachment and entry. Intervirology. 2014;57:151–7. [DOI] [PubMed] [Google Scholar]
- 26. Yan H, Li W. Sodium taurocholate cotransporting polypeptide acts as a receptor for hepatitis B and D virus. Dig Dis. 2015;33:388–96. [DOI] [PubMed] [Google Scholar]
- 27. Heermann KH, Goldmann U, Schwartz W, Seyffarth T, Baumgarten H, Gerlich WH. Large surface proteins of hepatitis B virus containing the pre‐s sequence. J Virol. 1984;52:396–402. [DOI] [PMC free article] [PubMed] [Google Scholar]
- 28. Jürgens MC, Vörös J, Rautureau GJP, Shepherd DA, Pye VE, Muldoon J, et al. The hepatitis B virus preS1 domain hijacks host trafficking proteins by motif mimicry. Nat Chem Biol. 2013;9:540–7. [DOI] [PubMed] [Google Scholar]
- 29. Pfefferkorn M, Böhm S, Schott T, Deichsel D, Bremer CM, Schröder K, et al. Quantification of large and middle proteins of hepatitis B virus surface antigen (HBsAg) as a novel tool for the identification of inactive HBV carriers. Gut. 2018;67:2045–53. [DOI] [PubMed] [Google Scholar]
- 30. Pfefferkorn M, Schott T, Böhm S, Deichsel D, Felkel C, Gerlich WH, et al. Composition of HBsAg is predictive of HBsAg loss during treatment in patients with HBeAg‐positive chronic hepatitis B. J Hepatol. 2021;74:283–92. [DOI] [PubMed] [Google Scholar]
- 31. Blanchet M, Sinnathamby V, Vaillant A, Labonte P. Inhibition of HBsAg secretion by nucleic acid polymers in HepG2.2.15cells. Antiviral Res. 2019;164:97–105. [DOI] [PubMed] [Google Scholar]
- 32. Boulon R, Blanchet M, Lemasson M, Vaillant A, Labonte P. Characterization of the antiviral effects of REP 2139 on the HBV lifecycle in vitro. Antiviral Res. 2020;183:104853. [DOI] [PubMed] [Google Scholar]
- 33. Bazinet M, Pântea V, Cebotarescu V, Cojuhari L, Jimbei P, Albrecht J, et al. Safety and efficacy of REP 2139 and pegylated interferon alfa‐2a for treatment‐naive patients with chronic hepatitis B virus and hepatitis D virus co‐infection (REP 301 and REP 301‐LTF): a non‐randomised, open‐label, phase 2 trial. Lancet Gastroenterol Hepatol. 2017;2:877–89. [DOI] [PubMed] [Google Scholar]
- 34. Noordeen F, Scougall CA, Grosse A, Qiao Q, Ajilian BB, Reaiche‐Miller G, et al. Therapeutic antiviral effect of the nucleic acid polymer REP 2055 against persistent duck hepatitis B virus infection. PLoS One. 2015;10:e0140909. [DOI] [PMC free article] [PubMed] [Google Scholar]
- 35. Quinet J, Jamard C, Burtin M, Lemasson M, Guerret S, Sureau C, et al. Nucleic acid polymer REP 2139 and nucleos(T)ide analogues act synergistically against chronic hepadnaviral infection in vivo in Pekin ducks. Hepatology. 2018;67:2127–40. [DOI] [PMC free article] [PubMed] [Google Scholar]
- 36. Al‐Mahtab M, Bazinet M, Vaillant A. Safety and efficacy of nucleic acid polymers in monotherapy and combined with immunotherapy in treatment‐naive Bangladeshi patients with HBeAg+ chronic hepatitis B infection. PLoS One. 2016;11:e0156667. [DOI] [PMC free article] [PubMed] [Google Scholar]
- 37. Jansen L, Vaillant A, Stelma F, Koostra NA, Bazinet M, Al‐Mahtab M, Reesink HW. Serum HBV‐RNA levels decline significantly in chronic hepatitis B patients dosed with the nucleic acid polymer REP 2139‐Ca. J Hepatol. 2015;62:S250. [Google Scholar]
- 38. Bazinet M, Pantea V, Placinta G, Moscalu I, Cebotarescu V, Cojuhari L, et al. Safety and efficacy of 48 weeks REP 2139 or REP 2165, tenofovir disoproxil, and pegylated interferon alfa‐2a in patients with chronic HBV infection naive to nucleos(t)ide therapy. Gastroenterology. 2020;158:2180–94. [DOI] [PubMed] [Google Scholar]
- 39. Bazinet M, Anderson M, Pântea V, Placinta G, Moscalu I, Cebotarescu V, et al. Analysis of HBsAg Immunocomplexes and cccDNA activity during and persisting after NAP‐based therapy. Hepatol Commun. 2021;5:1873–87. [DOI] [PMC free article] [PubMed] [Google Scholar]
- 40. Bazinet M, Pântea V, Placinta G, Moscalu I, Cebotarescu V, Cojuhari L, et al. Benefit of transaminase elevations in establishing functional cure of HBV infection during NAP‐based combination therapy. J Viral Hepat. 2021;28:817–25. [DOI] [PubMed] [Google Scholar]
- 41. Bazinet M, Pantea V, Cebotarescu V, Cojuhari L, Jimbei P, Anderson M, et al. Persistent control of HBV and HDV infection following REP 2139‐Ca and pegIFN therapy in chronic HBV/HDV co‐infection. Hepatol Commun. 2020;5:189–292. [DOI] [PMC free article] [PubMed] [Google Scholar]
- 42. Rogers R, Vallari A, Gersch J, Mbanya D, Kapute L, Oliveras SS, et al. HBV surface antigen large and middle isoform composition are proportional to total HBsAg. Hepatology. 2019;70:422A. [Google Scholar]
- 43. Yang L, Ye S, Zhao X, Ji L, Zhang Y, Zhou P, et al. Molecular characterization of HBV DNA integration in patients with hepatitis and hepatocellular carcinoma. J Cancer. 2018;9:3225–35. [DOI] [PMC free article] [PubMed] [Google Scholar]
- 44. Ishii T, Tamura A, Shibata T, Kuroda K, Kanda T, Sugiyama M, et al. Analysis of HBV genomes integrated into the genomes of human hepatoma PLC/PRF/5 cells by HBV sequence capture‐based next‐generation sequencing. Genes. 2020;11:661. [DOI] [PMC free article] [PubMed] [Google Scholar]
- 45. Carey I, Gersch J, Wang B, Moigboi C, Kuhns M, Cloherty G, et al. Pre‐genomic HBV RNA and Hepatitis B core‐related antigen predict outcomes in hepatitis B e antigen‐negative chronic hepatitis B patients suppressed on nucleos(t)ide analogue therapy. Hepatology. 2020;72:42–57. [DOI] [PubMed] [Google Scholar]
- 46. Liu S, Liu Z, Li W, Zhou B, Liang X, Fan R, et al. Factors associated with the biphasic kinetics of serum HBV RNA in patients with HBeAg‐positive chronic hepatitis B treated with nucleos(t)ide analogues. Aliment Pharmacol Ther. 2020;52:692–700. [DOI] [PubMed] [Google Scholar]
- 47. Limothai U, Chuaypen N, Poovorawan K, Chotiyaputta W, Tanwandee T, Poovorawan Y, et al. Baseline and kinetics of serum hepatitis B virus RNA predict response to pegylated interferon‐based therapy in patients with hepatitis B e antigen‐negative chronic hepatitis B. J Viral Hepat. 2019;26:1481–8. [DOI] [PubMed] [Google Scholar]
- 48. Campenhout MJH, Rijckborst V, Brouwer WP, Oord GW, Ferenci P, Tabak F, et al. Hepatitis B core‐related antigen monitoring during peginterferon alfa treatment for HBeAg‐negative chronic hepatitis B. J Viral Hepat. 2019;26:1156–63. [DOI] [PubMed] [Google Scholar]
- 49. van Campenhout MJ, Brouwer WP, van Oord GW, Xie Q, Zhang Q, Zhang N, et al. Hepatitis B core‐related antigen levels are associated with response to entecavir and peginterferon add‐on therapy in hepatitis B e antigen‐positive chronic hepatitis B patients. Clin Microbiol Infect. 2016;22:e575–e579. [DOI] [PubMed] [Google Scholar]
- 50. Pollicino T, Raffa G, Santantonio T, Gaeta GB, Iannello G, Alibrandi A, et al. Replicative and transcriptional activities of hepatitis B virus in patients coinfected with hepatitis B and hepatitis delta viruses. J Virol. 2011;85:432–9. [DOI] [PMC free article] [PubMed] [Google Scholar]
Associated Data
This section collects any data citations, data availability statements, or supplementary materials included in this article.
Supplementary Materials
Fig S1


