

Summary
The impact of Apolipoprotein E ε4 (APOE4), the strongest genetic risk factor for Alzheimer’s disease (AD), on human brain cellular function remains unclear. Here we investigated the effects of APOE4 on brain cell types derived from population and isogenic human induced pluripotent stem cells (hiPSCs), post-mortem brain and APOE targeted replacement (APOE-TR) mice. Population and isogenic models demonstrate that APOE4 local haplotype rather than a single risk allele contributes to risk. Global transcriptomic analyses reveal human specific, APOE4-driven lipid metabolic dysregulation in astrocytes and microglia. APOE4 enhances de novo cholesterol synthesis despite elevated intracellular cholesterol due to lysosomal cholesterol sequestration in astrocytes. Further, matrisome dysregulation is associated with upregulated chemotaxis, glial activation and lipid biosynthesis in astrocytes co-cultured with neurons that recapitulates altered astrocyte matrisome signaling in human brain. Thus, APOE4 initiates glia-specific cell and non-cell autonomous dysregulation that may contribute to increased AD risk.
Keywords: APOE, genetic heterogeneity, haplotypes, iPSC disease modeling, Alzheimer, astrocytes, microglia, cholesterol, matrisome
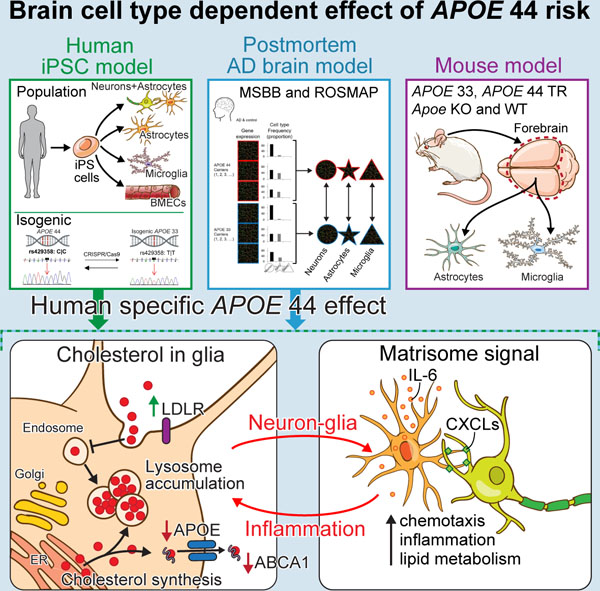
Graphical Abstract
ETOC:
Global transcriptomic analyses reveals human specific, APOE4-driven lipid metabolic dysregulation in astrocytes and microglia that may contribute to increased Alzheimer’s disease risk
Introduction
Alzheimer’s disease (AD), the most common form of dementia, is characterized by widespread neurodegeneration, gliosis and two pathological hallmarks: amyloid-β (Aβ) plaques and tau-laden neurofibrillary tangles (NFTs) (Selkoe, 2003). Most AD cases are sporadic with an age of onset >65yrs and reflect a complex genetic and environmental etiology (Karch and Goate, 2015). Notably, the APOE4 allele is the strongest genetic AD risk factor; APOE ɛ4/ɛ4 (APOE 44) increases AD risk by 15-fold in Europeans (Genin et al., 2011). Africans exhibit lower APOE4-associated AD risk while East Asians show higher APOE4 risk than Europeans (Liu et al., 2014; Tang et al., 1998).
Although the association between APOE4 and increased AD risk is well-established, the mechanisms underlying risk in particular human brain cell types are unclear. APOE-TR mice exhibit APOE genotype-dependent effects on Aβ seeding, Aβ clearance and tau-dependent neurodegeneration when crossed with APP or MAPT mutant mice (Holtzman et al., 2000; Shi et al., 2017). Astrocyte-specific APOE4 deletion rescues tau-mediated neurodegeneration (Wang et al., 2021). APOE4 also contributes to decreased synaptic plasticity and blood-brain barrier dysfunction (Chen et al., 2010; Montagne et al., 2020). These studies suggest APOE4 affects multiple cell types.
In mice, Apoe is mainly produced by astrocytes with low microglial expression (Xu et al., 2006), similarly in humans, APOE is primarily expressed in astrocytes (Zhang et al., 2016). In aging or neurodegeneration, mouse microglia adopt Apoe and Trem2-dependent disease-associated or neurodegenerative microglia phenotype (DAM, MGnD), upregulating Apoe (Keren-Shaul et al., 2017; Krasemann et al., 2017). Disease-associated astrocytes (DAA) also exhibit increased Apoe (Habib et al., 2020). While APOE is upregulated in human microglia in AD, the mouse DAM phenotype is absent or only partially overlaps, highlighting species differences between human and mouse and the importance of studying APOE4 in human systems (Galatro et al., 2017; Li et al., 2021; Srinivasan et al., 2020; Zhou et al., 2020).
To assess the impact of APOE4 on human brain cell types, we examined microglia, astrocytes, brain microvascular endothelial cells (BMECs) and mixed cortical cultures composing neurons and astrocytes derived from hiPSCs of AD and control of differing APOE genotypes. Global transcriptome analyses of hiPSC models, human brain and APOE-TR mice uncovered APOE4 human-specific astrocyte and microglia phenotypes. APOE4 drives lipid metabolic deficits in human astrocytes and microglia and enhances matrisome, associated with chemotaxis, glial activation and lipid metabolism in astrocytes through astrocyte-neuron communication. Although transcriptomic changes due to APOE4 mimic APOE knockout (KO), individual genetic background (APOE local haplotype) and cell type-specific variation greatly influence these changes, highlighting the necessity of both population and isogenic models for studying non-Mendelian disease-causing risk variants. Together, APOE4 drives both cell autonomous and non-cell autonomous cellular mechanisms that contribute to AD risk.
Results
APOE genotype-dependent haplotype in population-based model
Thirteen population hiPSC lines (6 APOE 44 and 7 APOE 33, herein defined as APOE4 and APOE3) were selected from 43 Europeans, balanced for sex, disease status, and controlled for age and AD genetic risk using a genetic risk score (GRS) excluding APOE4 and confirmed APOE4 as the main AD GRS contributor (Figures 1A, 1B, S1A, S1B and Table S1). Individuals did not carry AD risk variants in TREM2 (Guerreiro et al., 2013; Jonsson et al., 2013). Using single nucleotide polymorphisms (SNP) flanking APOE (APOE±50kbp), the local haplotypes embedded in each ε3 and ε4 allele were classified referenced to the 1000 Genome (1000G) (Figure S1A) (Genomes Project et al., 2015). By the 1000G haplotype frequencies, we defined common (hap.01–23) and rare (hap.other) haplotypes (Table S9), identifying 8 of 23 common haplotypes in 10 population lines, and 11 rare haplotypes (7 hap.other and 4 undetected haplotypes (NA)) in 8 population lines (Figure 1C). APOE4 occurred on 7 unique haplotypes, while APOE3 occurred on 12 different haplotypes (Figures 1C, and S1C); haplotypes were not shared between APOE3 and APOE4 carriers. Strikingly, without APOE4 rs429358, APOE local haplotypes clustered by APOE genotype (Figure 1D). Thus, multiple haplotypes encompassing the APOE locus exist in an APOE genotype-dependent manner.
Figure 1. APOE genotype and haplotype-based brain cell type model.
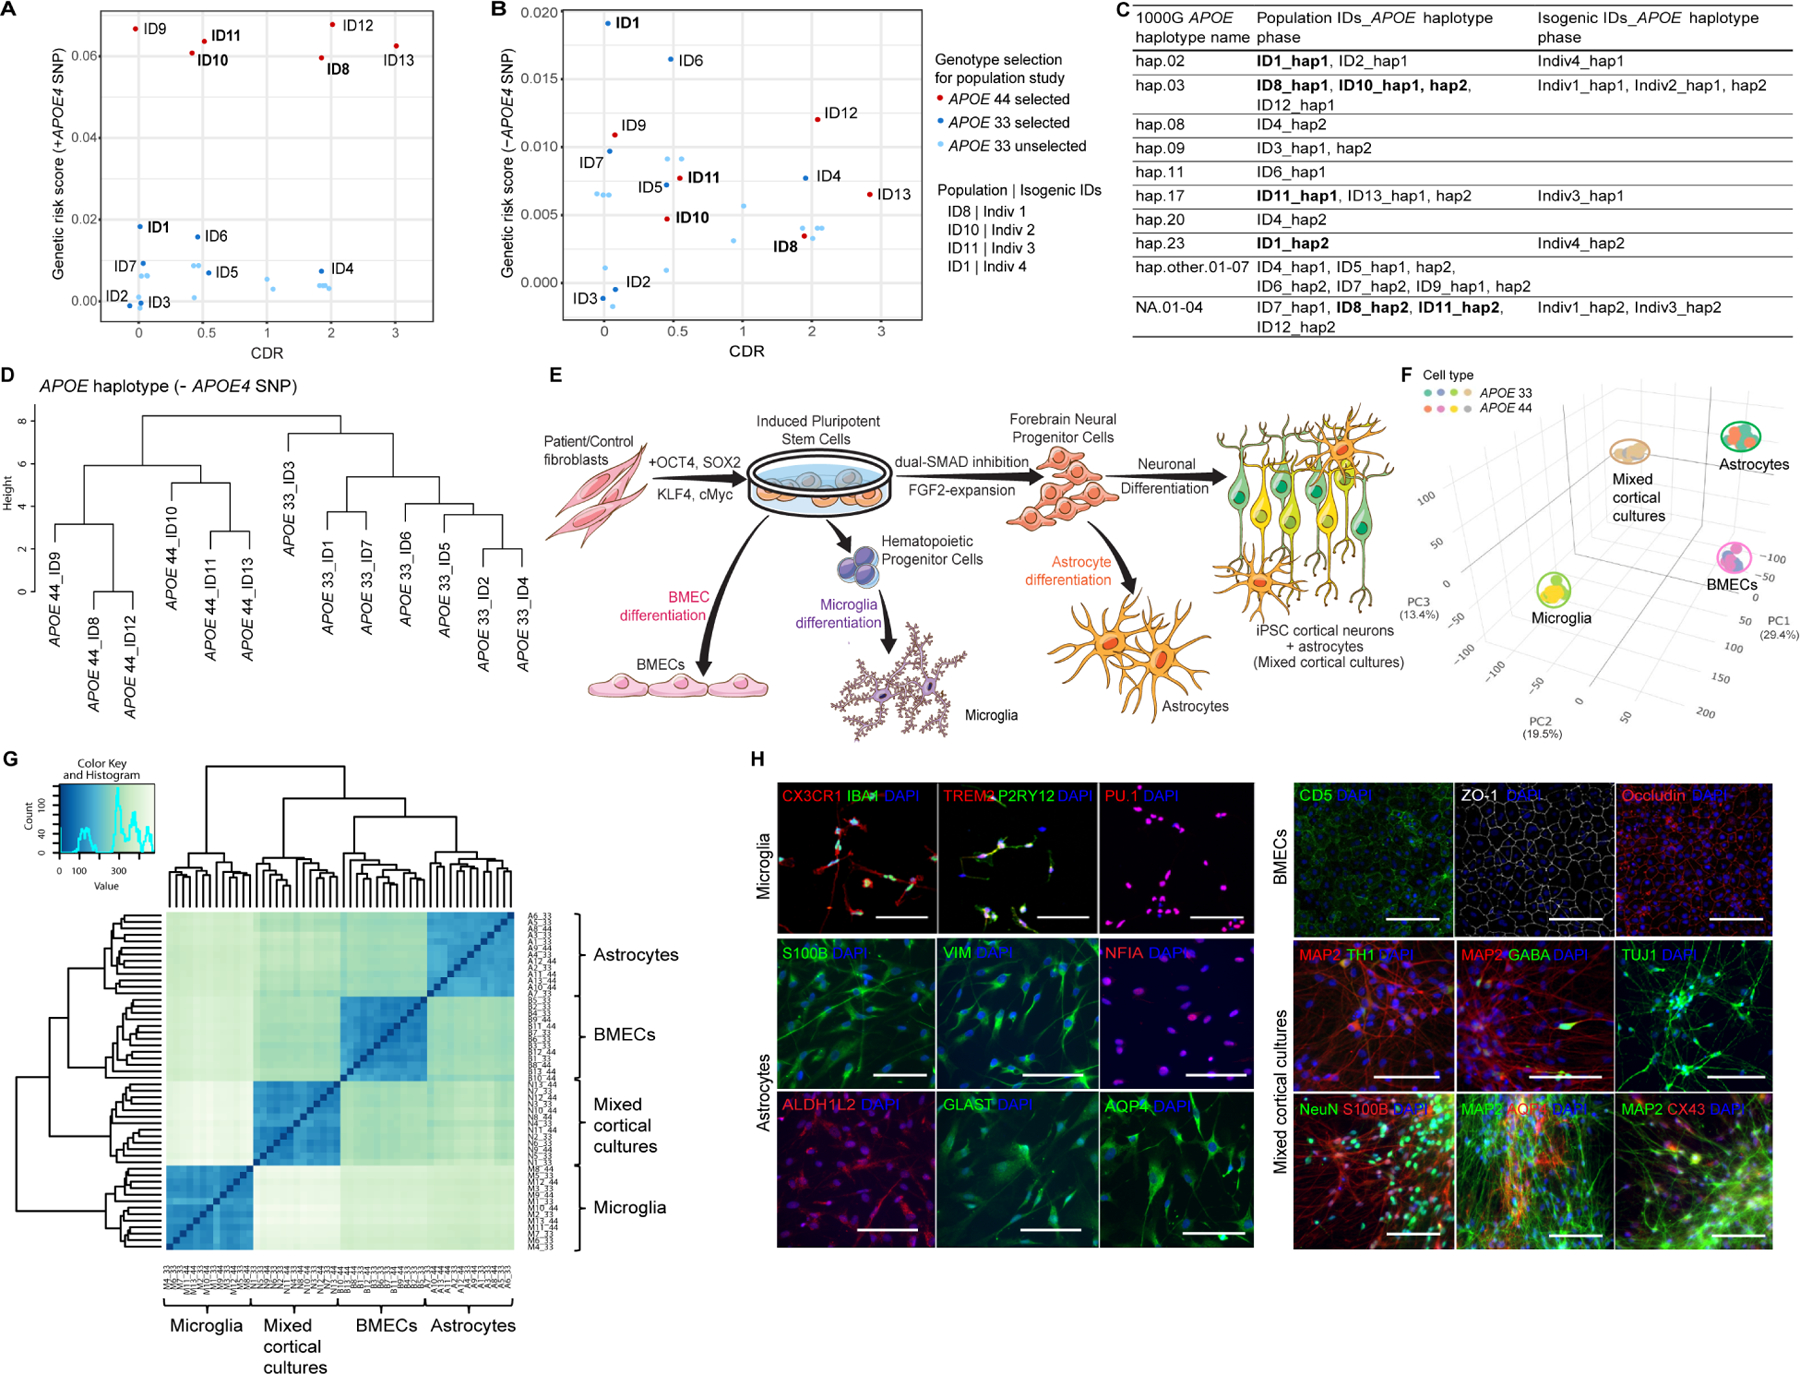
(A-B) GRS analysis with (A) or without (B) APOE4 SNP in 43 APOE iPSC lines. Labeled IDs for the population model, bolded IDs for the isogenic model. CDR, clinical dementia rating. See Table S1 for phenotypes.
(C) APOE local haplotype analysis of population (N=13) and isogenic (N=4) hiPSC lines after haplotype phasing referenced to 1000G (N=399). Bold IDs represent isogenic lines. See Table S1, S5 and S9 for detail.
(D) Hierarchical clustering analysis of APOE local haplotype without APOE4 SNP in population lines.
(E) Schematic of mixed cortical cultures, astrocytes, microglia and BMECs differentiated from APOE hiPSCs.
(F-G) PCA (F) and Spearman correlation analysis (G) of the whole transcriptome from 52 differentiated samples (N=13/cell type).
(H) Representative immunofluorescent images of microglia, astrocytes, BMECs and mixed cortical cultures markers. Scale bar=100μm.
Altered lipid metabolism in human APOE4 microglia and astrocytes
After iPSC reprogramming, which removes age-associated epigenetic signatures (Lapasset et al., 2011; Maherali et al., 2007), each hiPSC was differentiated to four cell types: microglia (Abud et al., 2017) derived from nearly pure CD43+ hematopoietic progenitor cells without sorting (Figure S1E), astrocytes (TCW et al., 2017), mixed cortical cultures (Bowles et al., 2019) and BMECs (Lippmann et al., 2012) (Figure 1E), following pluripotency and normal karyotype confirmation (Figure S1D and Table S1). Differentiated cells were validated by mRNA and protein expression of cell type specific markers (Figures 1H and S1H). Principal component analysis (PCA) and Spearman correlation of 52 transcriptomes (4 cell types, 13 lines) obtained by RNA sequencing showed samples clustered by cell type but were indistinguishable by APOE genotype (Figures 1F, 1G and S1F), suggesting robust differentiation methods independent of APOE status. Each cell type clustered with their corresponding primary human brain cell type also unaffected by APOE genotype (Figures S1G–S1J).
To examine cell type-specific effects of APOE4, differentially expressed gene (DEG) analysis was performed in each cell type comparing APOE4 to APOE3. To identify differences solely contributed by APOE4 rs429358, GRS without APOE locus (GRSnoAPOE), sex, RIN and batch were included as covariates (Figure S2A). DEGs are in astrocytes > microglia > mixed cortical cultures, but significant DEGs in BMECs were not observed, supporting no difference in tight junction formation assessed by transepithelial electrical resistance by APOE genotype (Figures 2A, 2B and S2B). Therefore, microglia and astrocytes are the major cell types affected by intrinsic APOE genotype. Fast preranked Gene Set Enrichment Analysis (fGSEA) with an enhanced permutation identified APOE4-specific pathways (Subramanian et al., 2005). The most significant positively enriched gene set in both microglia and astrocytes was Cholesterol biosynthesis and other lipid pathways (Figures 2C and 2D). In microglia, negatively enriched gene sets included HDL-mediated lipid transport, Generic transcription pathway and Lysosome (Figure 2C).
Figure 2. Enriched lipid and matrisome pathways by APOE4 in population model.
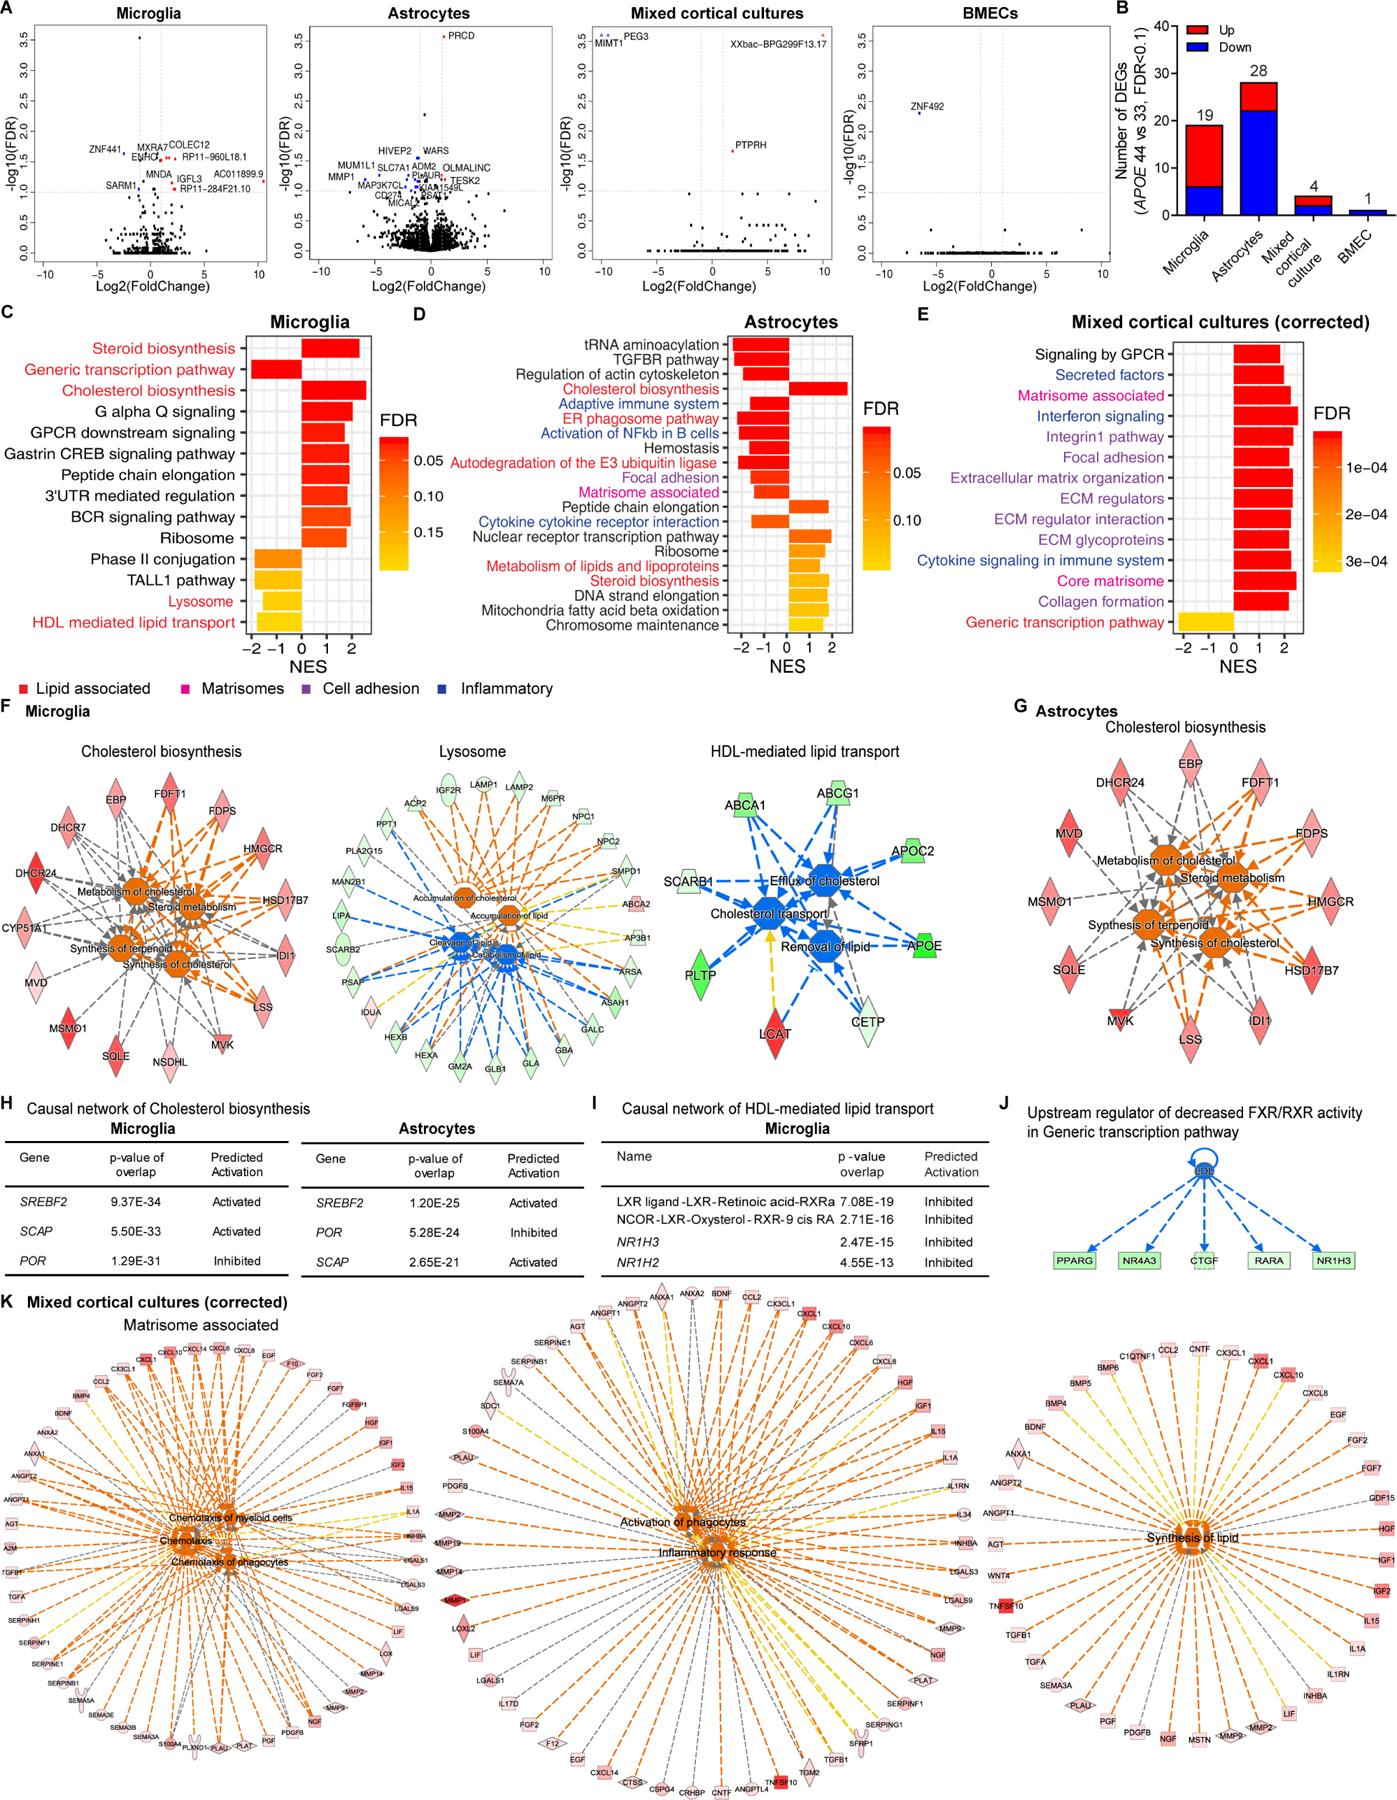
(A) Volcano plots of APOE4 vs. APOE3 in each cell type. Gene names labeled by >|2| fold change, FDR<0.1.
(B) The number of significant DEGs in each cell type.
(C-E) Top significant pathways from fGSEA of APOE4 vs. APOE3 in microglia (C), astrocytes (D) mixed cortical cultures after cell type proportion correction (E).
(F) Functional pathway analysis of Cholesterol biosynthesis, Lysosome and HDL-mediated lipid transport from fGSEA enriched in APOE4 microglia. Red/orange: upregulated, green/blue: downregulated genes/functions. See Table S2 for functional pathway statistics.
(G) Functional pathway analysis of Cholesterol biosynthesis in APOE4 astrocytes.
(H) Causal network analysis of Cholesterol biosynthesis in APOE4 microglia and astrocytes.
(I) Causal network analysis of HDL-mediated lipid transport in APOE4 microglia.
(J) Upstream regulator of downregulated FXR/RXR activity in APOE4 microglia.
(K) Functional pathway analysis of Matrisome associated in APOE4 mixed cortical cultures after proportion correction. See Table S3 for functional pathway statistics.
Next, we performed causal network analysis of enriched gene sets in APOE4 vs. APOE3 using Ingenuity Pathway Analysis (Kramer et al., 2014). Cholesterol biosynthesis (e.g., HMGCR and SQLE) predicts increased cholesterol/terpenoid synthesis and upregulated steroid metabolism in APOE4 microglia (Figure 2F). Downregulated DEGs in Lysosome (e.g., LAMP1/2, NPC1/2, SMPD1 and LIPA) predicts enhanced cholesterol accumulation, decreased lipid clearance and catabolism. Reduced cholesterol efflux including cholesterol transporters (e.g., ABCA1 and ABCG1) and proteins regulating lipoprotein secretion (e.g., APOE and APOC2) is predicted by HDL-mediated lipid transport in APOE4 microglia. APOE4 astrocytes show upregulated cholesterol synthesis and metabolism (Figure 2G). Upstream regulators, transcription factors regulating cholesterol synthesis, SREBF2 and SCAP, are activated, but POR (Cytochrome P450 oxidoreductase) is inhibited in both APOE4 microglia and astrocytes (Figure 2H)(Brown and Goldstein, 2009; Schmidt et al., 2009). In contrast, the LXR/RXR, LXR ligands and nuclear receptors NR1H2 and NR1H3 are downregulated in APOE4 microglia (Figure 2I). The most negatively enriched, Generic transcription pathway in APOE4 microglia represents decreased FXR/RXR inhibition caused by decreased low-density lipoprotein (LDL) (Figures 2C, 2J, S2C and S2D), suppressing lipid efflux potentially due to lower intracellular cholesterol. Thus, global transcriptomic analyses reveal that APOE4 is associated with higher cholesterol synthesis and lower catabolism/efflux, predicting altered intracellular cholesterol levels in APOE4 microglia and astrocytes.
Enriched matrisome in APOE4 mixed cortical cultures
In mixed cortical cultures, relatively few DEGs were identified (Figures 2A and 2B). Given the heterogeneity of these cultures (Figures 1E and 1H), cell type proportion measurement was implemented. We identified digital sorting algorithm (DSA) as the best fit algorithm among four: DSA (Zhong et al., 2013), population-specific expression analysis (PSEA) (Kuhn et al., 2011), non-negative matrix factorization (ssKL) (Brunet et al., 2004) and a PCA-based method modified from CellCODE (BRETIGEA, BRain cEll Type specIfic Gene Expression Analysis) (McKenzie et al., 2018) tested on primary or iPSC human brain cell types (neurons, astrocytes, microglia, endothelial cells and oligodendrocytes) (TCW et al., 2017; Zhang et al., 2016) (Figure S2G). The widely used neuron differentiation protocol (Bardy et al., 2015; Brennand et al., 2015) results in neurons with 5–25% astrocytes, independent of APOE status (t-test t=0.57039, p-value=0.5818) (Figure S2H). Before and after astrocyte% correction, we uncovered enriched matrisome pathways (Matrisome associated, Core matrisome, Extracellular matrix (ECM) glycoproteins, Secreted factors, Cytokine signaling) in APOE4 mixed cortical cultures (Figures 2E and S2I). The in silico ‘Matrisome’ is defined as ECM protein and associated factor ensembles (Naba et al., 2016; Naba et al., 2012). ECM proteins provide cues interpreted by membrane receptors to initiate cell survival, proliferation and differentiation signaling (Rozario and DeSimone, 2010). The ‘Core matrisome’ comprises ECM glycoproteins, collagens and proteoglycans; ‘Matrisome associated’ proteins include ECM-affiliated proteins, regulators and secreted factors like cytokines released by neurons and glia. Further, the Matrisome associated pathway predicted three functional modules: upregulated chemotaxis, activation/inflammatory responses and lipid synthesis, and Core matrisome displays increased levels of molecules supporting cell migration in APOE4 mixed cortical cultures (Figures 2K and S2J).
Isogenic lines uncover individual variability
Observed differences in population lines cannot be unambiguously attributed to APOE4 due to extensive linkage disequilibrium and haplotypic variation around the APOE locus; thus, CRISPR/Cas9 gene-edited isogenic iPSCs were created from four age-matched, sex-balanced individuals (3 APOE4 and 1 APOE3) with 5 different APOE haplotypes (the most to the least frequent in 1000G), yielding 24 isogenic hiPSCs (3 clones/genotype per individual) (Figures 1C, 3A and Table S4). Potential gRNA off-targets were negative and local APOE haplotypes remained intact; isogenic iPSCs were karyotypically normal and genetically matched the donor fibroblasts (Tables S4 and S5). PCA and Spearman correlation of isogenic hiPSC-microglia, astrocytes and mixed cortical cultures confirmed successful differentiation except for one microglia outlier (excluded from further analyses) (Figures 3B and 3C). Microglia exclusively clustered by individual but not by either sex or APOE genotype (Figures 3C and 3D). Isogenic microglia also clustered with the donor and retain individuality (Figure S3A). Thus, individual genetic background rather than culture environment or gene-editing impacts the microglia transcriptome. Inter-individual variability was recently reported from ex-vivo human microglia supporting this is a novel biological phenomenon, not a hiPSC-microglia artifact (Katia de Paiva Lopes, 2020).
Figure 3. Isogenic model revealing individual variability.
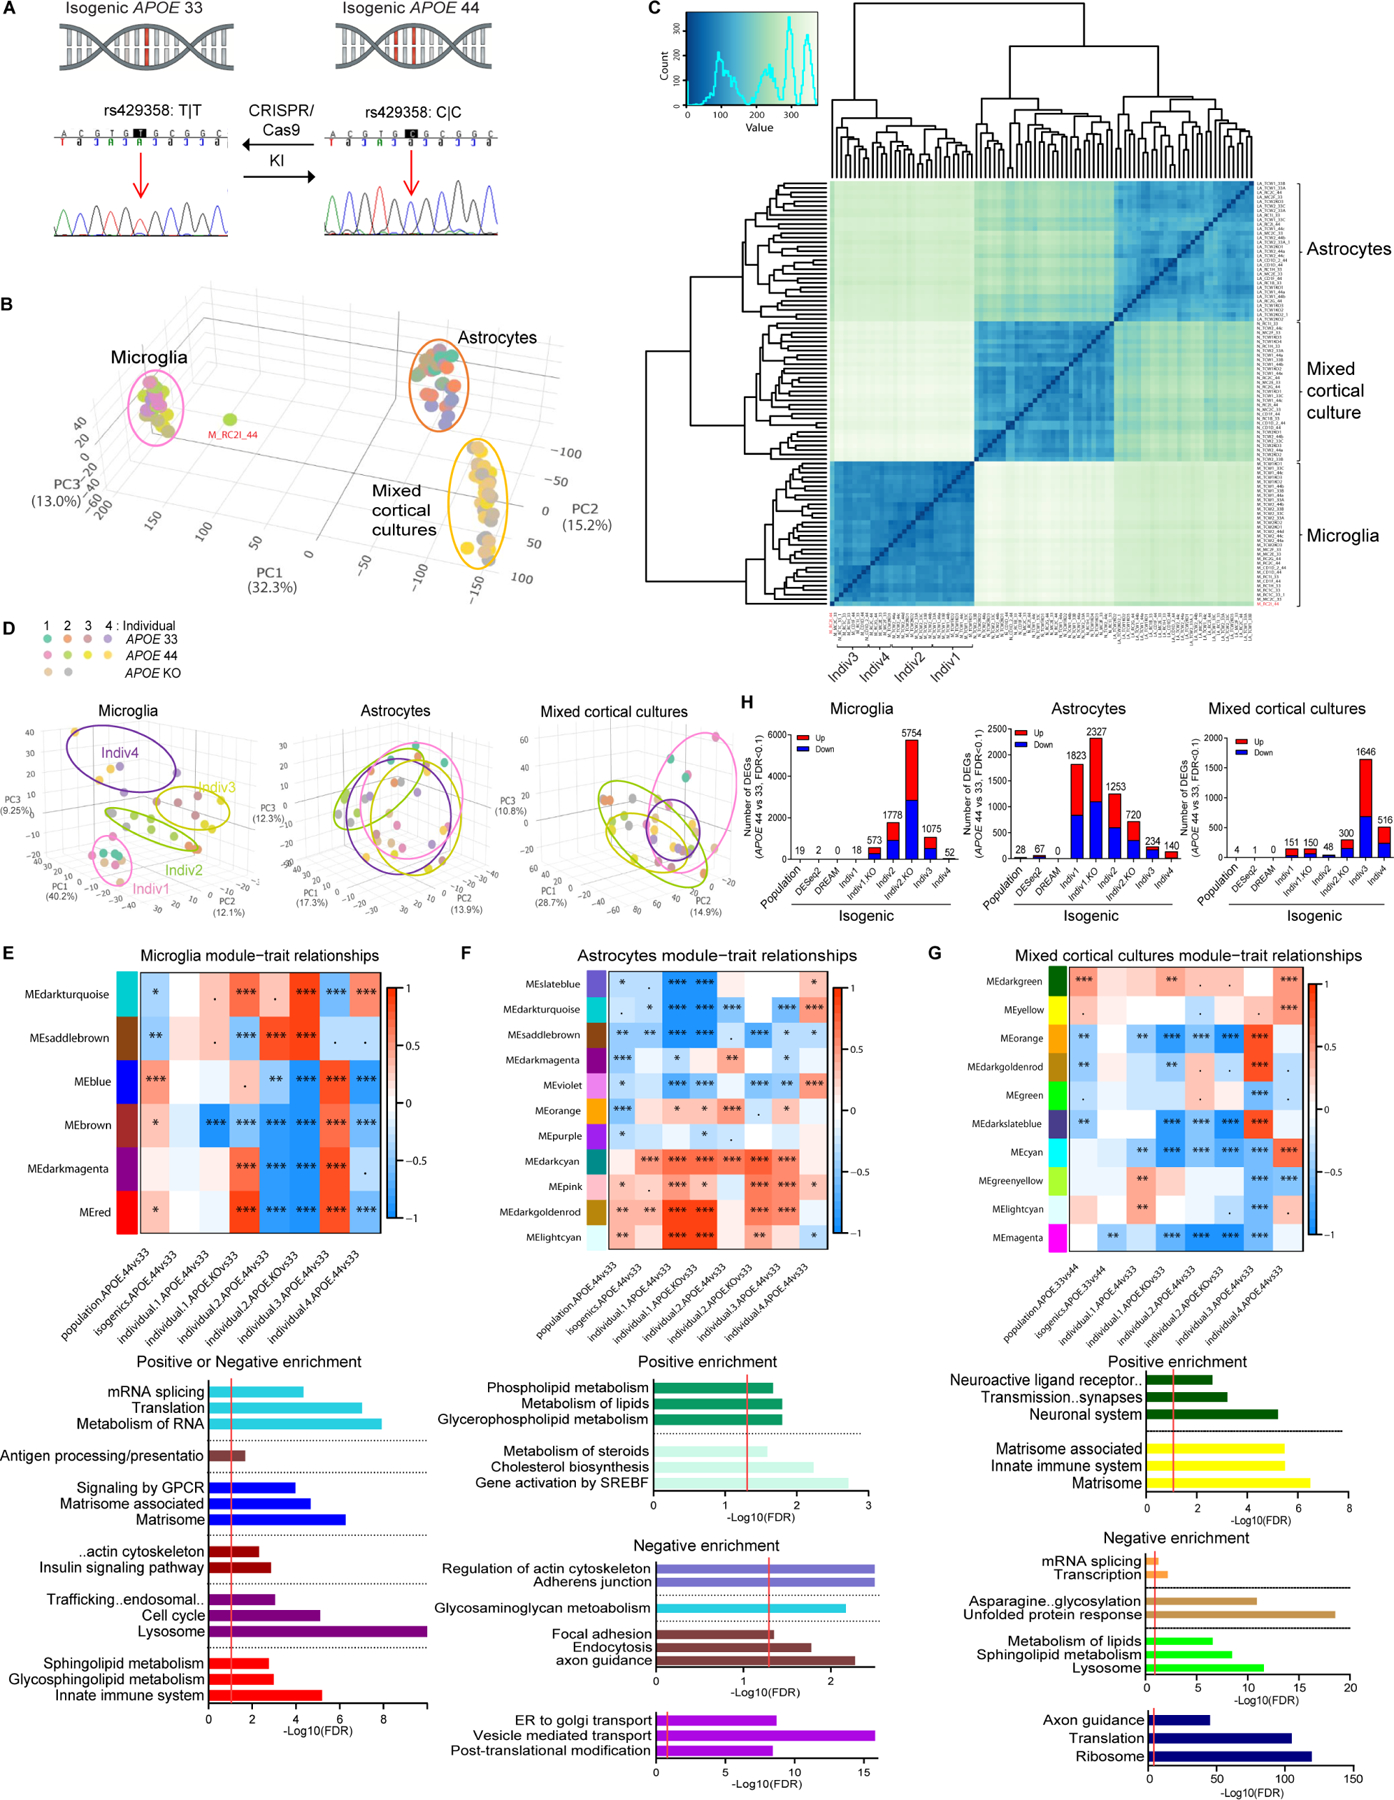
(A) DNA sequence of APOE4 SNP conversion in hiPSCs by CRISPR/Cas9 KI (Knockin). See Table S4 for established isogenic lines.
(B-C) PCA (B) and Spearman correlation analysis (C) of gene expression from 90 samples (N=30/cell type).
(D) PCA of each cell type (N=30).
(E-G) Significant module-trait relationships and pathway enrichments (by Fisher’s exact test, p<0.1; .<0.1, *<0.05, **<0.01, ***<0.005) of the ME differential expression of APOE4 vs. APOE3 and APOE KO vs. APOE3, in population and isogenic microglia (E), astrocytes (F) or mixed cortical cultures (G) after proportion correction from WGCNA. Red or blue modules indicate positive or negative correlations, respectively, of MEs with the comparison traits. FDR=0.05.
(H) The number of significant DEGs of APOE4 vs. APOE3 and APOE KO vs. APOE3 in population or isogenic individual for each cell type by DESeq2 or DREAM.
To investigate common or unique pathways across population and isogenic models, we performed an unbiased Weighted Gene Co-expression Network Analysis (WGCNA) (Langfelder and Horvath, 2008). We identified significant module eigengenes (ME), representing module expression profiles, in population and isogenic comparisons of APOE4 vs. APOE3 (Figures 3E–3G). Although the module-trait relationship of certain isogenic individuals was inconsistent with the population data due to strong microglia donor effects, similar enriched pathways, e.g., lipid metabolism, lysosome (MEred) and GPCR signaling (MEblue) were observed in APOE4 microglia (Figure 3E). Consistent with population astrocytes, upregulated lipid metabolism (MElightcyan, MEdarkcyan) was the most significant in APOE4 isogenic astrocytes (Figure 3F). Actin cytoskeleton, focal adhesion/endocytosis/axon guidance pathways (MEslatblue, MEsaddlebrown) were consistently downregulated in population and isogenic astrocytes. After cell type proportion correction, matrisome (MEyellow, MElightcyan) were upregulated, while lipid metabolism (MEgreen), transcription and translation (ME orange, MEdarkgoldenrod, MEdakrslatblue) were downregulated in APOE4 mixed cortical cultures (inconsistent in Indiv3) (Figures 3G). DEGs of APOE4 vs. APOE3 in the top dysregulated pathways, lipids and focal adhesion/endocytosis astrocytes showed similar patterns, while exhibiting individual variability (Figure S3B). fGSEA was applied to further interrogate inter-individual variation in isogenic cell types. Significantly more DEGs were observed in isogenics vs. population (Figure 3H). However, DEGs across isogenic pairs varied greatly (individually and by cell type). Also, population enriched genes were driven by specific individuals rather than an equivalent contribution from everyone, e.g. lipid pathways driven from Indiv3 and 4 microglia and matrisome from Indiv1 and 4 mixed cortical cultures and astrocytes (Figures S3C–S3E). In each isogenic pair, uniquely enriched pathways highlight genetic background including APOE local haplotype influence donor-specific APOE4 phenotypes.
Individual donor effects are greater than APOE loss-of-function (LOF) effects
WGCNA and fGSEA with population and isogenic data revealed that three of four individuals shared common microglia and astrocyte modules with a different outlier for each cell type (Indiv3 in microglia and Indiv4 in astrocytes) (Figures 3E and 3F). APOE expression was lower in APOE4 microglia and astrocytes compared to APOE3 for three individuals sharing common modules but higher in APOE4 for the outlier (Figure S3F), suggesting APOE expression underlies phenotypic variability. In APOE4 mixed-cortical-cultured astrocytes, APOE expression was lower (Figure S3F); cell type deconvolution of AD brain transcriptome uncovered APOE4-dependent decrease of APOE expression in microglia and most astrocytes (Figure S4D), implicating lower APOE levels in mediating APOE4 effects.
To test the hypothesis that decreased APOE drives APOE4-dependent dysregulation, APOE KO iPSCs were generated from Indiv1 and 2, sharing a common APOE local haplotype (hap.03) (Figure 1C). APOE KO was confirmed by sequencing and APOE protein expression in astrocytes (Figure S3G). Hierarchical clustering (top 500 DEGs) comparing APOE4 or APOE KO with APOE3 revealed that APOE KOs clustered by donor for all cell types (Figure S3H), suggesting that donor genetic background outweighs APOE LOF. Indiv1 and 2 astrocytes clustered and were most similar (Figure S3H), suggesting APOE local haplotype dictates gene expression and is a major determinant in particular cell types. Furthermore, enriched modules of APOE KO mimicked APOE4 within the same individual (Figures 3E–3G), indicating that APOE4 is a LOF; however, individual genetic background (APOE haplotype) rather than APOE LOF drives phenotype. The striking individual differences in APOE levels (Figure S3F) suggest that APOE cis-regulatory elements (APOE enhancers/promoters) or APOE4 risk modifying variants near the APOE locus rather than AD GRS (outliers do not possess high or low GRSs) contribute to the variability across cell types and individuals. It is also supported by APOE4 risk modifying variants identified in APOE local admixture backgrounds in Hispanics and African Americans (Rajabli et al., 2018) and by APOE expression modifiers such as variants in PVRL2 and APOC1 loci (Zhou et al., 2019).
Increasing power in analysis of hiPSC models
We used both population and multiple isogenic lines to evaluate each approach to increase the statistical power. Combined isogenic analysis with DESeq2 identified more DEGs than individual paired analysis using DREAM (Differential expression for REpeAted Measures) (Hoffman and Roussos, 2020) (Figure 3H). Interestingly, isogonics with 24 lines (4 individuals x 6 clones/individual) yielded less statistical significance/power compared to population with 13 lines (13 individuals x 1 clone/individual) by WGCNA (Figures 3E–3G: column 1 vs. 2). Individual clonal replicates did not increase power even after paired DREAM, which aligns with donor effects dominating transcriptomic variance, but clonal replicates per individual decreasing power in iPSC-based modeling (Germain and Testa, 2017). It stresses increasing the number of subjects rather than the number of isogenic clones from a few individuals to identify genotype-driven effects in understanding population genetics.
Astrocyte-driven matrisome uncovered in APOE4 hiPSC mixed cortical cultures and AD brain
DEG analyses of AD vs. control brain (MSBB and ROSMAP) uncovered the same matrisome enrichment found in APOE4 hiPSC-mixed cortical cultures (Figure 4A). Predicted functions of the matrisome gene set recapitulated the same modules: upregulated chemotaxis, inflammation and lipid synthesis (Figure 4B). We hypothesized that enriched matrisome in APOE4 mixed cortical cultures is associated with astrocyte-neuron communication in the APOE4 brain (Dzyubenko et al., 2016). To identify which cell induces matrisome, whole brain transcriptomes were deconvoluted by microglia, astrocytes, neurons, endothelial cells and oligodendrocytes using csSAM (Shen-Orr et al., 2010), followed by DEG analysis (APOE4 vs. APOE3) (Figure S4A). Matrisome was enriched in APOE4 astrocytes in superior temporal gyrus (STG), parahippocampal gyrus (PHG) and inferior frontal gyrus (IFG) of MSBB and dorsolateral prefrontal cortex (DLPFC) of ROSMAP AD brain (Figures 4C–4F). APOE4 microglia were positively enriched for ECM, chemokine, cytokine signaling pathways in all brain regions (Figures 4G–4J). Matrisome associated gene sets are a Matrisome subset in hiPSC-mixed cortical cultures and AD brain, and genes within the same category highly overlapped between different brain regions (~65%) (Figure S4B). After cell type deconvolution, APOE4 AD astrocytes displayed the same Matrisome associated modules: chemotaxis, inflammation and lipid synthesis (Figure 4K). Predicted function of overlapping genes from APOE4 hiPSC-mixed cortical cultures, whole brain and deconvoluted astrocytes include upregulation of the same three modules (Figure 4L). Next, we examined whether matrisome pathways were associated with AD, independent of APOE status. In APOE3 brains matrisome was the most significantly upregulated pathway in AD vs. control with lower significance compared to APOE4 (Figure S4C), confirming APOE4-driven matrisome enrichment. Combining APOE4 and AD, matrisome was enriched in deconvoluted astrocytes from all brain regions (Figures S4E–S4H and S4R). Further, cell type deconvoluted APOE4 neurons revealed positively enriched TCA cycle and respiratory electron transport and Oxidative phosphorylation, but negatively enriched Ribosome in all brain regions (Figures S4M–S4Q), predicting mitochondrial and translational dysregulation.
Figure 4. Enriched matrisome pathways by APOE4 in deconvoluted AD brain astrocytes.
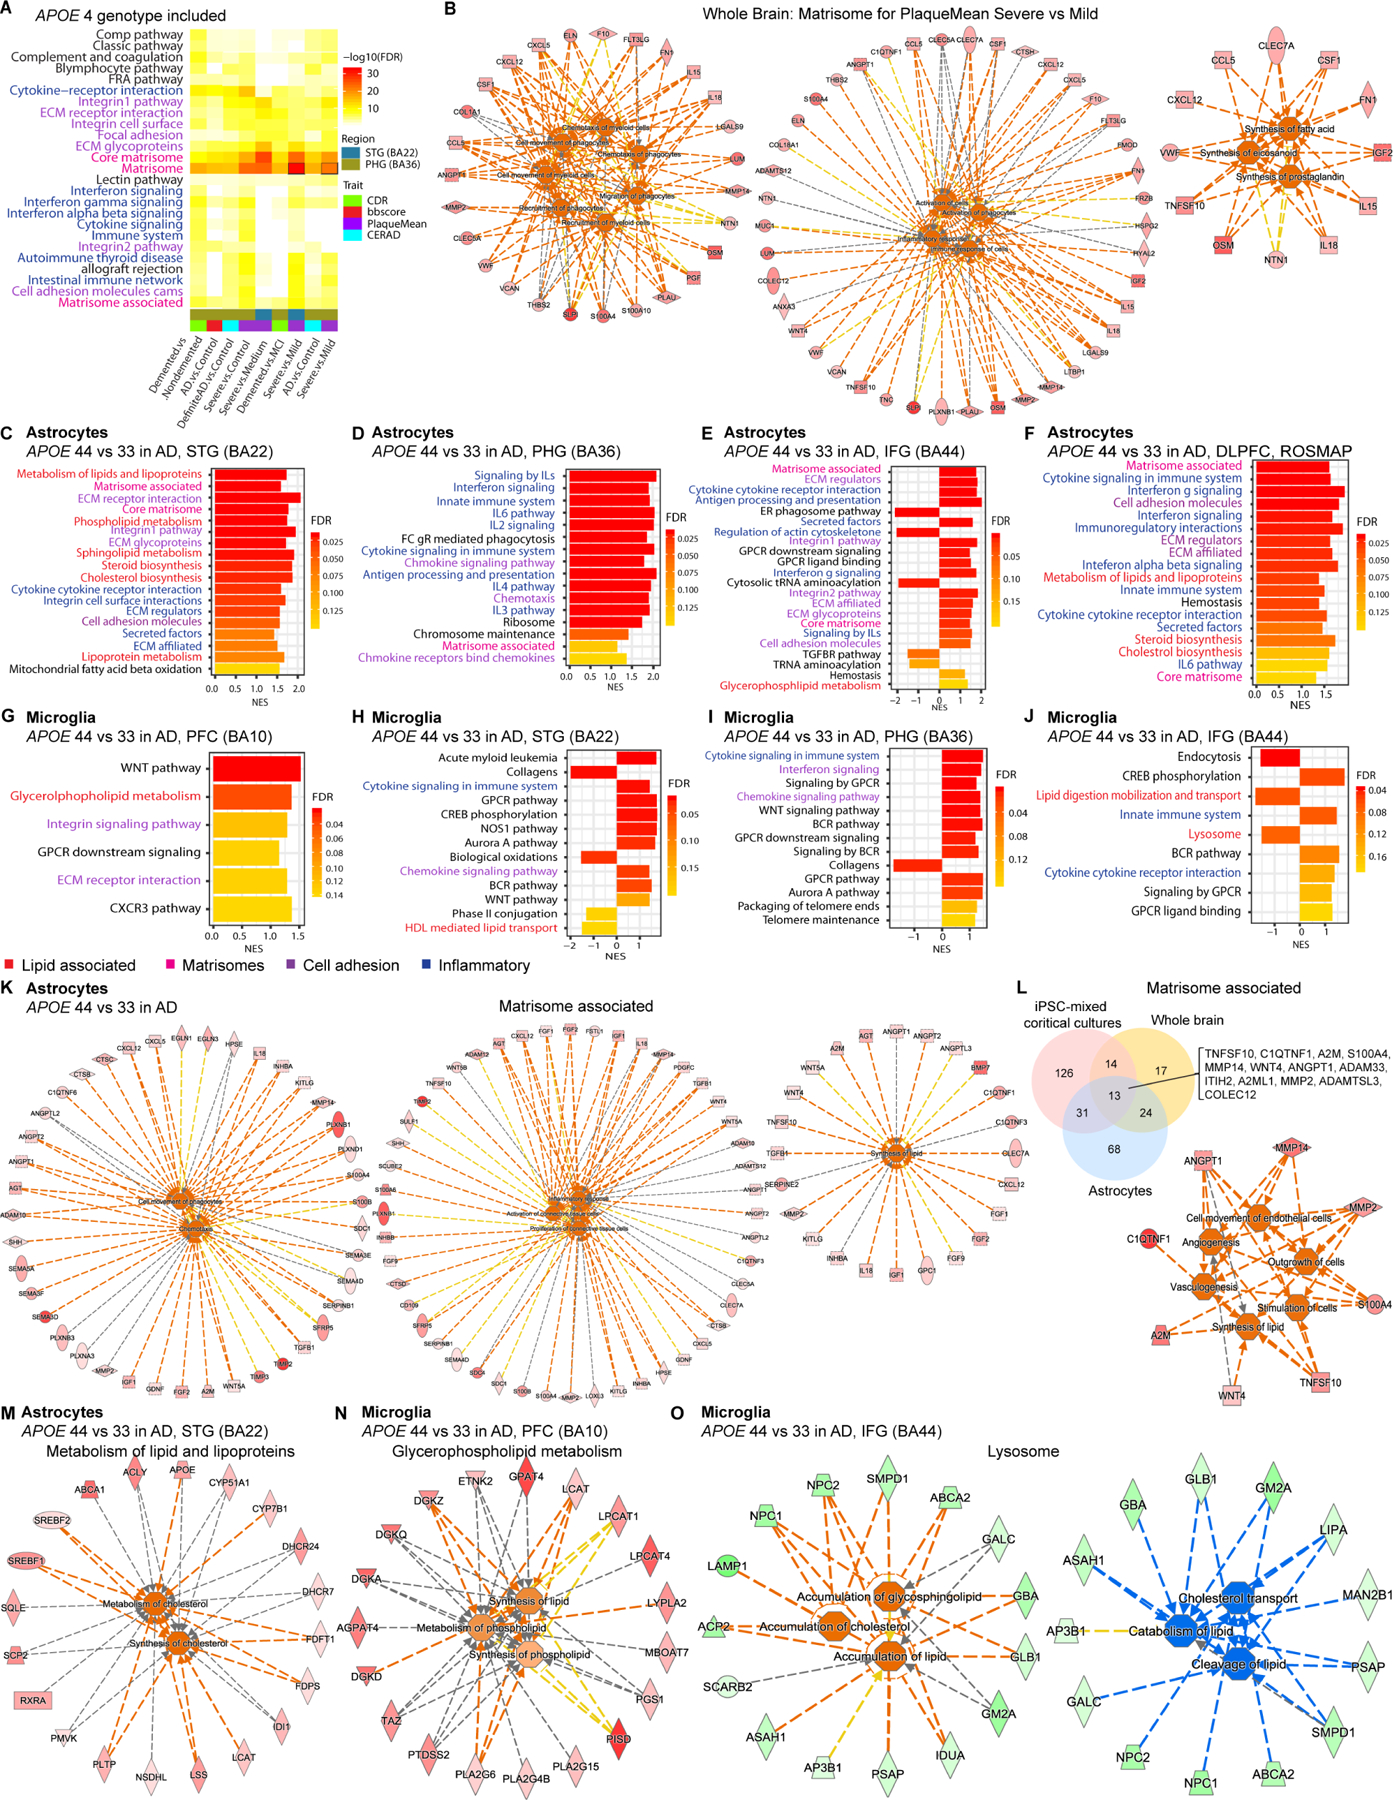
(A)Upregulated pathways of DEGs comparing various trait of AD vs. control including APOE4 carriers in different brain regions. See Table S6 for brain cohort details.
(B) Functional pathway analysis of Matrisome in severe vs. mild AD from (A). See Table S3 for functional pathway statistics.
(C-J) fGSEA of APOE4 vs. APOE3 in each cell type after cell type deconvolution in various regions of AD brain (MSBB and ROSMAP). PFC, prefrontal cortex; STG, superior temporal gyrus; PHG, parahippocampal gyrus; IFG, inferior frontal gyrus; DLPFC, dorsolateral prefrontal cortex.
(K) Functional pathway analysis of Matrisome associated in APOE4 AD astrocytes after cell type deconvolution.
(L) Overlapping genes in Matrisome associated among iPSC-mixed cortical cultures, whole brain and deconvoluted astrocytes, and predicted functional co-regulations of overlapping genes.
(M-O) Functional pathway analysis of lipid pathways in APOE4 AD brain (MSBB) astrocytes (M) and microglia (N-O).
We investigated whether enriched APOE4 hiPSC-astrocytes and microglia pathways can be identified in APOE4 AD brain cells. Deconvolved APOE4 astrocytes and microglia from the AD brain are positively enriched for Cholesterol/Steroid biosynthesis and other lipid metabolism, while negatively enriched for HDL-mediated lipid transport and Lysosome (Figures 4C–4J and S4E–S4L, S4R), consistent with the enrichment in APOE4 hiPSC-astrocytes and microglia. Further, functional predictions reveal that positively enriched genes in lipid pathways in APOE4 brain astrocytes and microglia lead to increased cholesterol synthesis (Figures 4M and 4N). Suppressed lysosomal genes in APOE4 microglia predict cholesterol/lipid accumulation, decreased lipid catabolism and cholesterol transport (Figure 4O). Thus, dysregulated lipid metabolism including cholesterol synthesis in APOE4 hiPSC-microglia and astrocytes recapitulates changes observed in APOE4 brain microglia and astrocytes. Together, APOE4 hiPSC-mixed cortical cultures resemble human APOE4 AD brain, and the enriched common matrisome is associated with support of glia migration, inflammation and lipid synthesis, derived from APOE4 astrocytes potentially via astrocyte-neuron crosstalk.
APOE4 drives human-specific microglia and astrocyte phenotypes
APOE-TR mice have been utilized to understand APOE4 risk in the context of AD pathology (Shi et al., 2017; Tai et al., 2011), where microglia Apoe KO restores homeostasis from MGnD (Krasemann et al., 2017). Apoe KO mice are used as a human atherosclerosis model, in which the loss of Apoe alters macrophage cholesterol loading (Zhang et al., 1992). To unravel glial specific APOE4 effects in mouse models, transcriptomics analyses was performed on fetal microglia and astrocytes of APOE4, APOE3, Apoe KO and Apoe WT. Cell type specific markers and Spearman correlation confirmed culture purity (Figures 5A and 5B). Apoe WT and Apoe KO cluster independently and distinctly from APOE3 and APOE4 which were indistinguishable for each cell type (Figures 5B and 5C), suggesting mouse Apoe and human APOE functionally diverge. Altered astrocyte and microglia-specific expression of Serpina3 and Wdly1 confirm prior APOE-TR whole brain studies but altered expressions of cell type-specific gene isoforms highlight increased resolution with cell type analyses (Figures 5D, 5E and S5A–S5D)(Zhao et al., 2020b). Following mouse-human gene conversion (Figure S5E), fGSEA performed on DEGs uncovered Matrisome associated, ECM affiliated, Interferon and Cytokine signaling pathways in APOE4 mouse microglia and astrocytes (Figure 5F) but lacked lipid-related dysregulation after functional analyses of the Matrisome associated pathway (Figure 5I). Thus, lipid metabolic dysregulation is human specific.
Figure 5. Mouse Apoe and human APOE4 effects in mouse astrocytes and microglia.
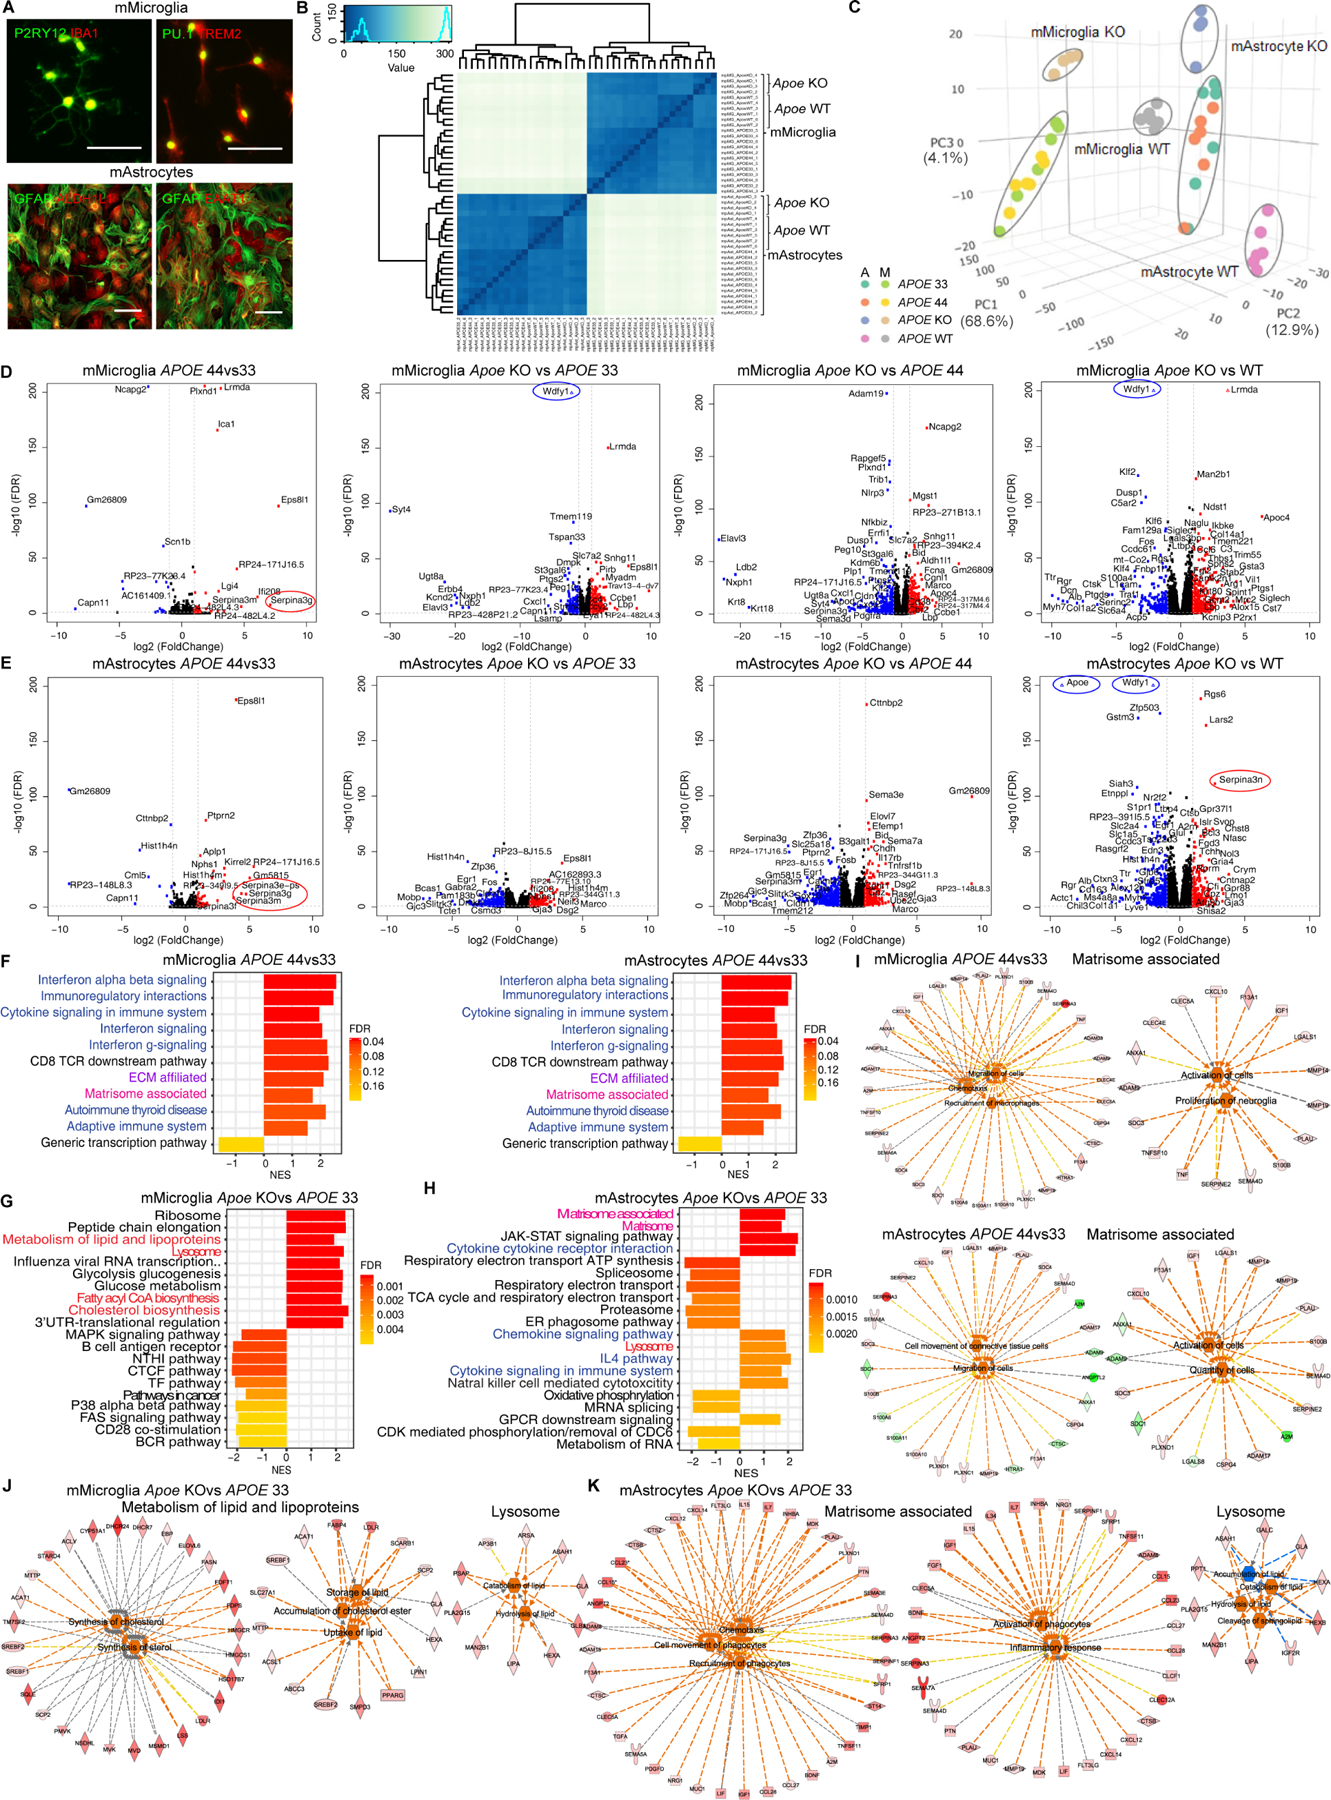
(A) Representative immunofluorescent images of purified mouse microglia (mMicroglia) and astrocytes (mAstrocytes) markers. Scale bar=100μm.
(B-C) Spearman correlation analysis (B) and PCA (C) of gene expression from 44 samples (N=22/cell type).
(D-E) Volcano plots of different APOE genotype comparisons in mMicroglia (D) or mAstrocytes (E). Gene names labeled by >|2.5| fold change, FDR<0.1.
(F-H) fGSEA of APOE4 (F) or Apoe KO (G-H) vs. APOE3 in mMicroglia and mAstrocytes.
(I) Functional pathway analysis of Matrisome associated in APOE4 mMicroglia and mAstrocytes.
(J-K) Functional pathway analysis of enriched pathways in Apoe KO mMicroglia (J) and mAstrocytes (K)
Assessment of Apoe KO vs. APOE3 mouse microglia and astrocytes revealed cell type-specific effects. Apoe KO microglia displayed enriched Cholesterol biosynthesis and other lipid pathways, predicting upregulated lipid synthesis (Figures 5G and 5J). Apoe KO astrocytes showed enriched matrisome, enhancing chemotaxis and inflammation (Figures 5H and 5K). In all comparisons, both Apoe KO mouse microglia and astrocytes were positively enriched for Lysosome with upregulated lipid catabolism (Figures 5G–5H, 5J–5K and S5F–S5I), which is discordant with APOE4 human cells. Lipid metabolic dysregulation in Apoe KO is less significant when compared to Apoe WT rather than APOE3 or APOE4, and matrisome is not enriched in Apoe KO astrocytes but in microglia (Figures S5H and S5I), suggesting mouse Apoe LOF does not mimic APOE4 in either species. Lastly, hierarchical clustering of genes expressed within the APOE locus (1Mb near APOE) showed marked differences between human and mouse microglia and astrocytes (Figures S5J and S5K), indicating that the regulatory machinery or architecture near the APOE locus differs between species.
Impaired cholesterol trafficking in APOE4 astrocytes and microglia
Transcriptome analyses revealed decoupled cholesterol metabolism in APOE4 astrocytes and microglia predicted by increased intracellular cholesterol combined with increased de novo synthesis and decreased efflux. To investigate the mechanism, we interrogated whether APOE4 causes cholesterol trafficking deficits in two isogenic lines (Indiv1 and 2) sharing the same APOE haplotype (hap.03), similar APOE4-driven expression signatures and lipid pathways enrichment (Figures 1C, 3F and S3H). Isogenic APOE4 astrocytes showed 20% increased total cholesterol, derived from a free cholesterol pool but not cholesteryl esters (CE) compared to APOE3 as measured by Gas Chromatography-Mass Spectrometry (GC-MS) (Muller et al., 2019) (Figure 6A). Further, intracellular free cholesterol levels measured with filipin (Pipalia et al., 2011) was significantly increased in APOE4 astrocytes, but donor fibroblasts did not exhibit genotype-dependent cholesterol differences (whole cells and lysosomes), potentially due to the lack of APOE (Figures 6B, 6C and S6A).
Figure 6. Decoupled lipid metabolism due to lysosomal free cholesterol sequestration in APOE4 glia.
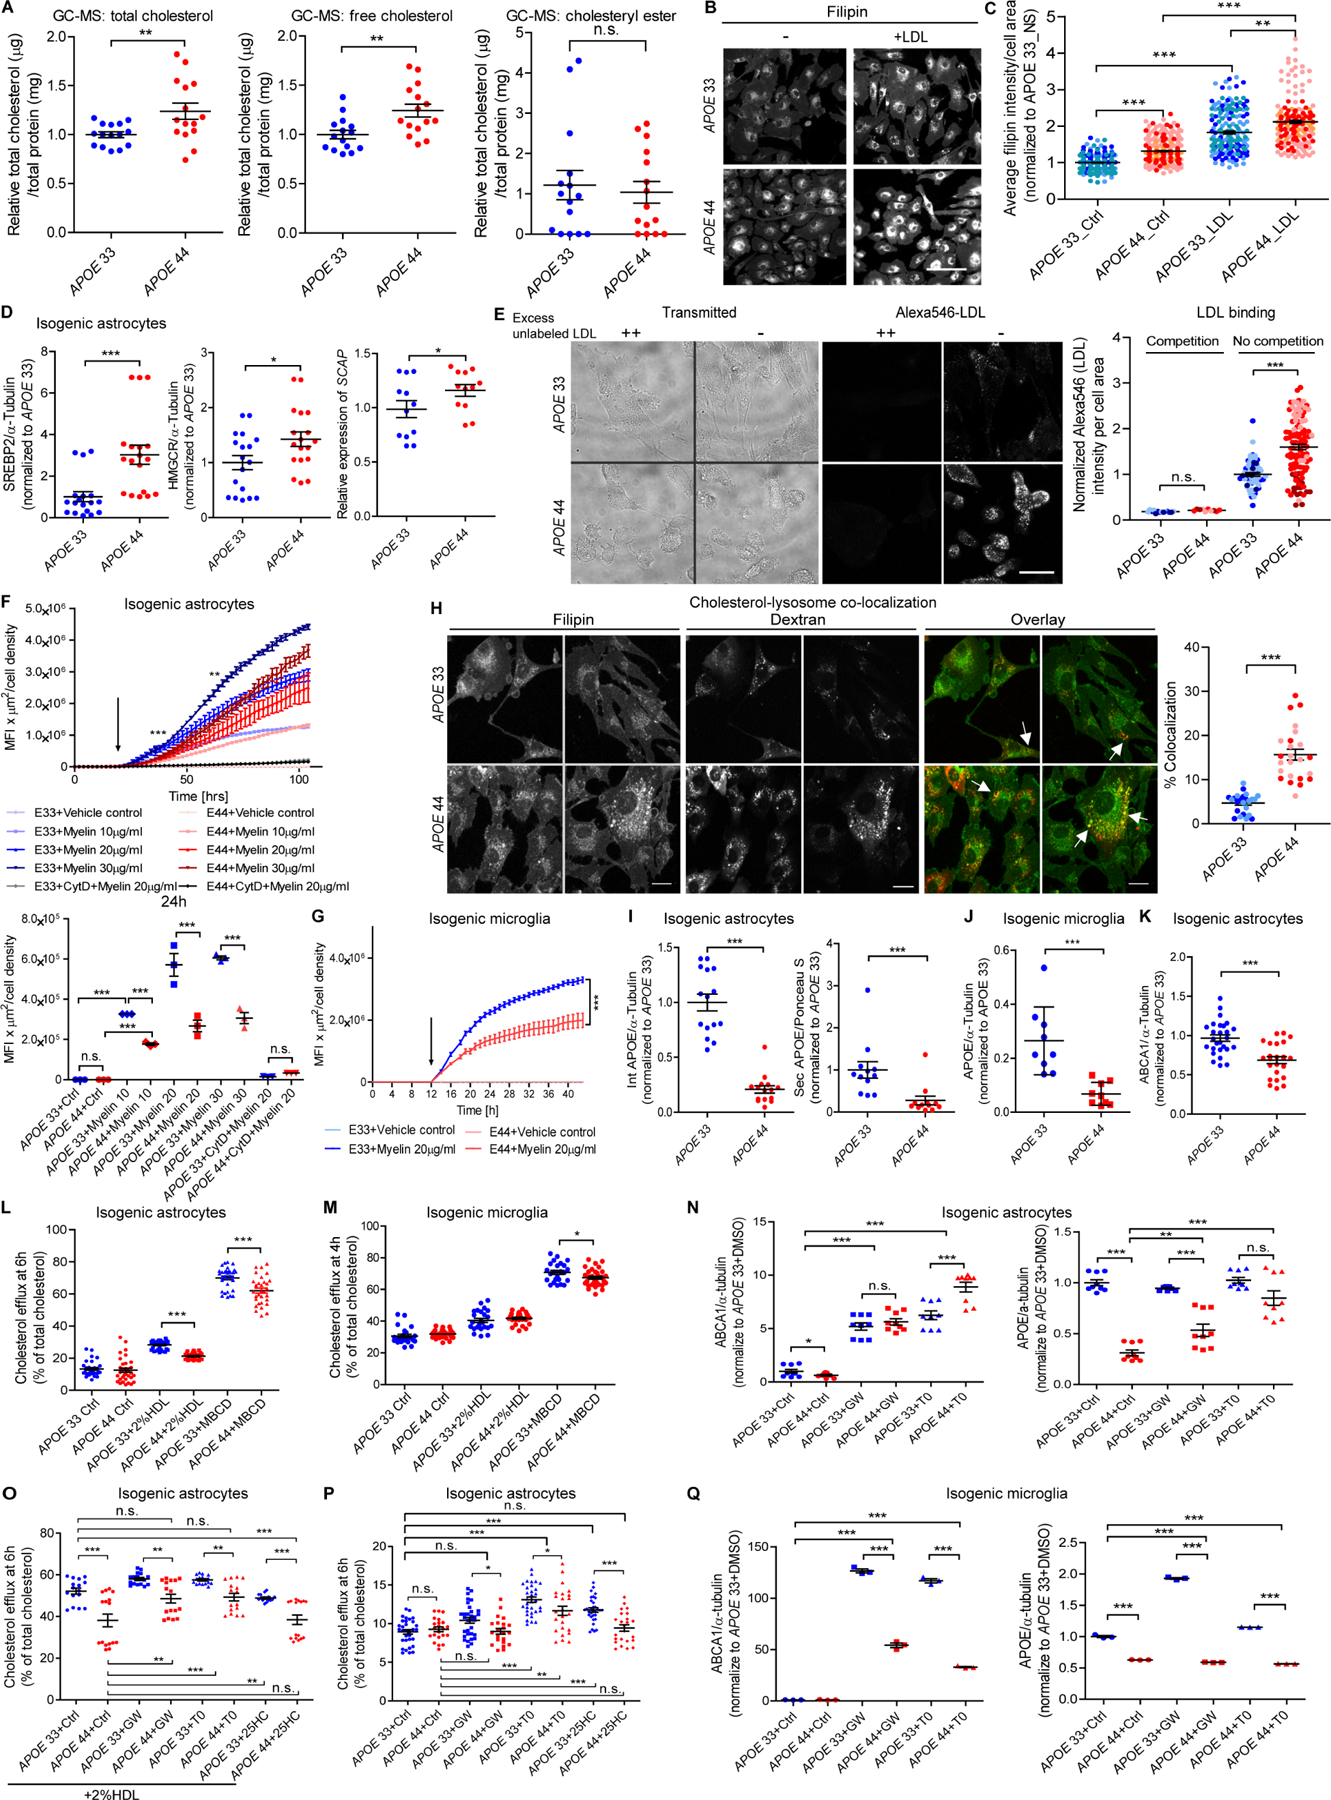
(A) Relative total cholesterol, free cholesterol and CE in isogenic APOE astrocytes measured by GC-MS (N=6 lines, 4 independent experiments, 3 replicates).
(B-C) Representative fluorescence images (B) and quantification (C) of filipin in isogenic APOE astrocytes +/− LDL. Scale bar=100μm. (N=6, 5 independent experiments, ~20 quantified areas per experiment).
(D) Relative protein/transcript levels of SREBP2, HMGCR and SCAP in isogenic APOE astrocytes (N=12, 3 independent experiments). See Figure S6C for representative Westerns.
(E) Representative brightfield and fluorescence images and quantification of Alexa546-labeled LDL binding with (competition) or without (no competition) excess unlabeled LDL in isogenic APOE astrocytes. Each dot represents fluorescent intensity in a field, and each field had 4–12 cells. Scale bar=30 µM.
(F-G) Mean fluorescent intensity (MFIxµm2) of internalized pHrodo-red-myelin normalized by cell density for 90h (top) and 24h (bottom) in isogenic APOE astrocytes (F) and for 36h in microglia (G). Arrow: treatment starting time point. (N=6, 3 independent experiments).
(H) Representative images and % co-localization of filipin and endocytosed TRITC-Dextran in isogenic APOE astrocytes (N=4, 3 independent experiments, each image=an independent line). Yellow puncta labeled arrows in overlays indicate lysosomal cholesterol localization. Scale bar=15μm.
(I-K) Relative protein levels of intracellular (int), secreted (sec) APOE (I) and ABCA1 (K) in isogenic APOE astrocytes (N=12, 3 independent experiments) and APOE (J) in microglia (N=6, 3 independent experiments). See Figures S6J, S6N and S6J for representative Westerns.
(L-M) Percent cholesterol efflux in no serum control (Ctrl), 2% HDL and methyl-β-cyclodextrin (MBCD) at 6h in isogenic APOE astrocytes (L) and at 4h in isogenic microglia (M). (N=12, 3 independent experiments).
(N, Q) Relative protein levels of ABCA1 and APOE with vehicle control (Ctrl, DMSO), GW3965 (GW) and T0901317 (T0) in isogenic APOE astrocytes (N) (N=12, 3 independent experiments) and isogenic microglia (Q) (N=6, 3 independent experiments). See Figures S6Q and S6S for representative Westerns.
(O-P) Percent cholesterol efflux at 24h with DMSO, GW, T0 and 25-hydroxycholesterol (25HC) in isogenic APOE astrocytes (N=12, 3 independent experiments).
One-way unpaired t-test for genotype comparisons, Two-way ANOVA with Bonferroni post-hoc corrections for comparisons of multiple treatments. *, p<0.05, **, p<0.01, ***, p<0.001, n.s., not significant, Error bars=SEM
Elevated cellular cholesterol sensed within endoplasmic reticulum (ER) should cause retention of Sterol Regulatory Element-Binding Protein 2 (SREBP2), a master cholesterol regulator, thereby preventing SREBP2 translocation and its associated SCAP to Golgi, where it is released by cleavage to activate genes for de novo cholesterol synthesis (e.g. HMG-CoA reductase (HMGCR)), uptake (e.g. LDLR) and efflux (e.g. ABCA1 and ABCA7). However, causal network analysis of cholesterol biosynthesis predicted activated SREBF2, SCAP and HMGCR in APOE4 astrocytes and microglia (Figure 2F–2H). Cleaved SREBP2 (p<0.001), SCAP (p<0.05) and HMGCR (p<0.05) were indeed elevated (Figures 6D, S6B and S6C), indicating increased de novo cholesterol biosynthesis despite elevated intracellular cholesterol in APOE4 astrocytes.
Although LDL significantly bound more cell surface receptors (e.g. LDLRs) in APOE4 astrocytes, highlighting increased cholesterol uptake potential (Figure 6E), LDL supplementation did not increase intracellular free cholesterol in APOE4 compared to APOE3 over baseline (Figures 6B and 6C), suggesting cholesterol uptake is not the mechanism for increased cholesterol. Furthermore, external lipid (myelin) uptake via actin-dependent phagocytosis (Gitik et al., 2011) was significantly reduced in APOE4 astrocytes and microglia (Figures 6F and 6G).
In lysosomal storage diseases, lysosomal retention of cholesterol increases total cholesterol but reduces cholesterol in other organelles (Schulze and Sandhoff, 2011). This occurs in Acid SphingoMyelinase Deficiency (SMPD1 mutations) and Niemann Pick type C disease (NPC1 and NPC2 mutations)(Parcon et al., 2018). Negatively enriched Lysosome (Figures 2F and S3D) and lower SMPD1, NPC1 and NPC2 in APOE4 vs. APOE3 astrocytes (Figure S6D) indicates cholesterol transport out of lysosomes may be impaired by APOE4. Filipin and TRITC-Dextran co-localization (yellow puncta), a measure of lysosomal cholesterol (Majumdar et al., 2007), was significantly increased (3-fold, p<0.001) in APOE4 compared to APOE3 astrocytes, indicating that intracellular free cholesterol accumulates in lysosomes (Figure 6H). Levels of LAMP1/2, which are involved in NPC2 to NPC1 cholesterol export pathway from lysosome were decreased in APOE4 astrocytes and microglia (Figures S6E and S6F) in which LAMP1 deficiency causes defective lysosome-ER cholesterol transport and lysosomal cholesterol accumulation (Li and Pfeffer, 2016). In AD brain, intracellular free cholesterol (filipin) and LAMP1 significantly co-localized in APOE4 hippocampal (vulnerable region involved in memory impairment) but not cortical astrocytes (Figures S6G and S6H)(Kerchner et al., 2014; Saeed et al., 2018).
APOE-lipoprotein secretion facilitates cholesterol efflux (Dove et al., 2005). Consistent with reduced APOE transcripts in APOE4 vs. APOE3 astrocytes and microglia, APOE protein was significantly lower (80% reduction) in APOE4 astrocytes and microglia (Figures 6I–6J, S6I–S6J and S6M–S6N). Expression of plasma membrane sterol transporters (ABCA1 and ABCA7) was significantly decreased in APOE4 astrocytes although ABCA1 was similar in APOE4 vs. APOE3 microglia (Figures 6K, S6K–S6L and S6N–S6O). Secreted APOE levels were decreased (63% reduction) in APOE4 vs. APOE3 astrocytes (Figures 6I and S6J), predicting reduced cholesterol secretion. Interestingly, the pan-APOE antibody detected differences between intracellular and extracellular APOE in astrocytes and between microglia and astrocytes (Figures S6J and S6N), indicating post-translational modifications (glycosylation) may influence cell type-specific APOE function.
When astrocytes were incubated with the cholesterol efflux acceptor HDL, the percent dehydroergosterol (DHE), a natural fluorescent sterol that mimics cellular/membrane cholesterol (Maxfield and Wustner, 2012), remained significantly increased in APOE4 astrocytes after 24h (Figure S6P), indicating that increased cholesterol is due to slower exchange to HDL. APOE4 astrocytes also exhibited reduced cholesterol efflux in the presence of 2% HDL and the cholesterol chelator methyl-β-cyclodextrin (MBCD), a measure of the total available cholesterol in the plasma membrane using fluorescently-labeled cholesterol (Figure 6L)(Lopez et al., 2011; Zhang et al., 2011). Maximal efflux (MBCD) was significantly decreased in APOE4 microglia, although HDL-mediated efflux was not impaired (Figure 6M). Together, these data support a mechanism of dysregulated cholesterol metabolism due to lysosomal sequestration of free cholesterol away from ER that misinforms APOE4 cells to respond as if intracellular cholesterol levels are low, leading to upregulated de novo cholesterol synthesis. Further, reduced APOE and lipid transporters lead to a concomitant decrease in cholesterol efflux.
Next, we investigated whether decoupled lipid metabolism could be reversed by LXR agonists (GW3965 and T0901317), known to increase cholesterol efflux (Peng et al., 2011), and 25-hydroxycholesterol (25HC), reported to decrease cholesterol synthesis and increase ABCA1 and APOE (Waltl et al., 2013). Consistent with the reported mechanism, LXR agonists increased ABCA1 and APOE, and 25HC suppressed SREBF2 in APOE4 astrocytes (Figures 6N, S6Q and S6R). LXR agonists but not 25HC restored cholesterol efflux in APOE4 cells to levels of untreated APOE3 cells (Figure 6O). However, the efflux discrepancy between APOE4 vs. APOE3 at baseline was still present after compound treatment alone or with HDL (Figures 6O and 6P). LXR agonists increased ABCA1 and APOE in APOE3 microglia but did not change APOE in APOE4 microglia (Figures 6Q and S6S), highlighting differential cell type responses to LXR agonists. Therefore, LXR agonists rescued decoupled lipid/cholesterol metabolism in APOE4 astrocytes, restoring efflux to APOE3 levels.
Actin cytoskeleton dysregulation in APOE4 astrocytes independent of external lipid exposure
One of the most significantly and negatively enriched gene sets is Regulation of actin cytoskeleton, Focal adhesion/endocytosis in population and isogenic APOE4 astrocytes (Figures 2D and 3F, MEsaddlebrown and MEslateblue) with most genes downregulated (Figure S3B, right), predicting decreased projections and microvilli affecting cell attachment (Figures S2E and S2F). While APOE4 did not affect mature astrocyte size (Figure S7A), the attached cell surface area of APOE4 astrocytes was reduced in serum lipids as well as delipidated serum (dL-S)(Figure 7A and 7B), suggesting that APOE4-driven actin cytoskeleton/focal adhesion defects manifest independently of lipid exposure. We confirmed enzymes (heat-inactivated serum (HI-S)) or other factors (knockout serum replacement (KOSR), cell density) were not driving the phenotype (Figures 7A, 7B and S7B–S7D). Furthermore, APOE4 astrocytes showed reduced expression of putative AD risk genes involved in actin cytoskeleton function (ABI3, FERMT, ELMO1, MYBPC3, ZYX and DOCK2), NCK1, which controls actin dynamics, and NCKAP1L (Figure S7E)(Buvall et al., 2013; Novikova et al., 2021). NCKAP1L (a.k.a. hematopoietic cell-specific actin regulatory protein (HEM-1)) interacts with ABI3, signals downstream of TREM2 and PLCG2 and functions in actin cytoskeleton reorganization during chemotaxis and efferocytosis (Andreone et al., 2020; Park et al., 2010). Despite reports suggesting NCKAP1L, ABI3 and DOCK2 are microglia-specific, they were expressed in human astrocytes; NCKAP1L was marked decreased (4.3-fold) in APOE4 astrocytes (Figure S7E), suggesting decreased endocytosis (Mooren et al., 2012). These results corroborate reduced phagocytic uptake of extracellular lipids (Figures 6F and 6G).
Figure 7. Actin cytoskeleton and matrisome dysregulation in APOE4 mixed cortical culture astrocytes.
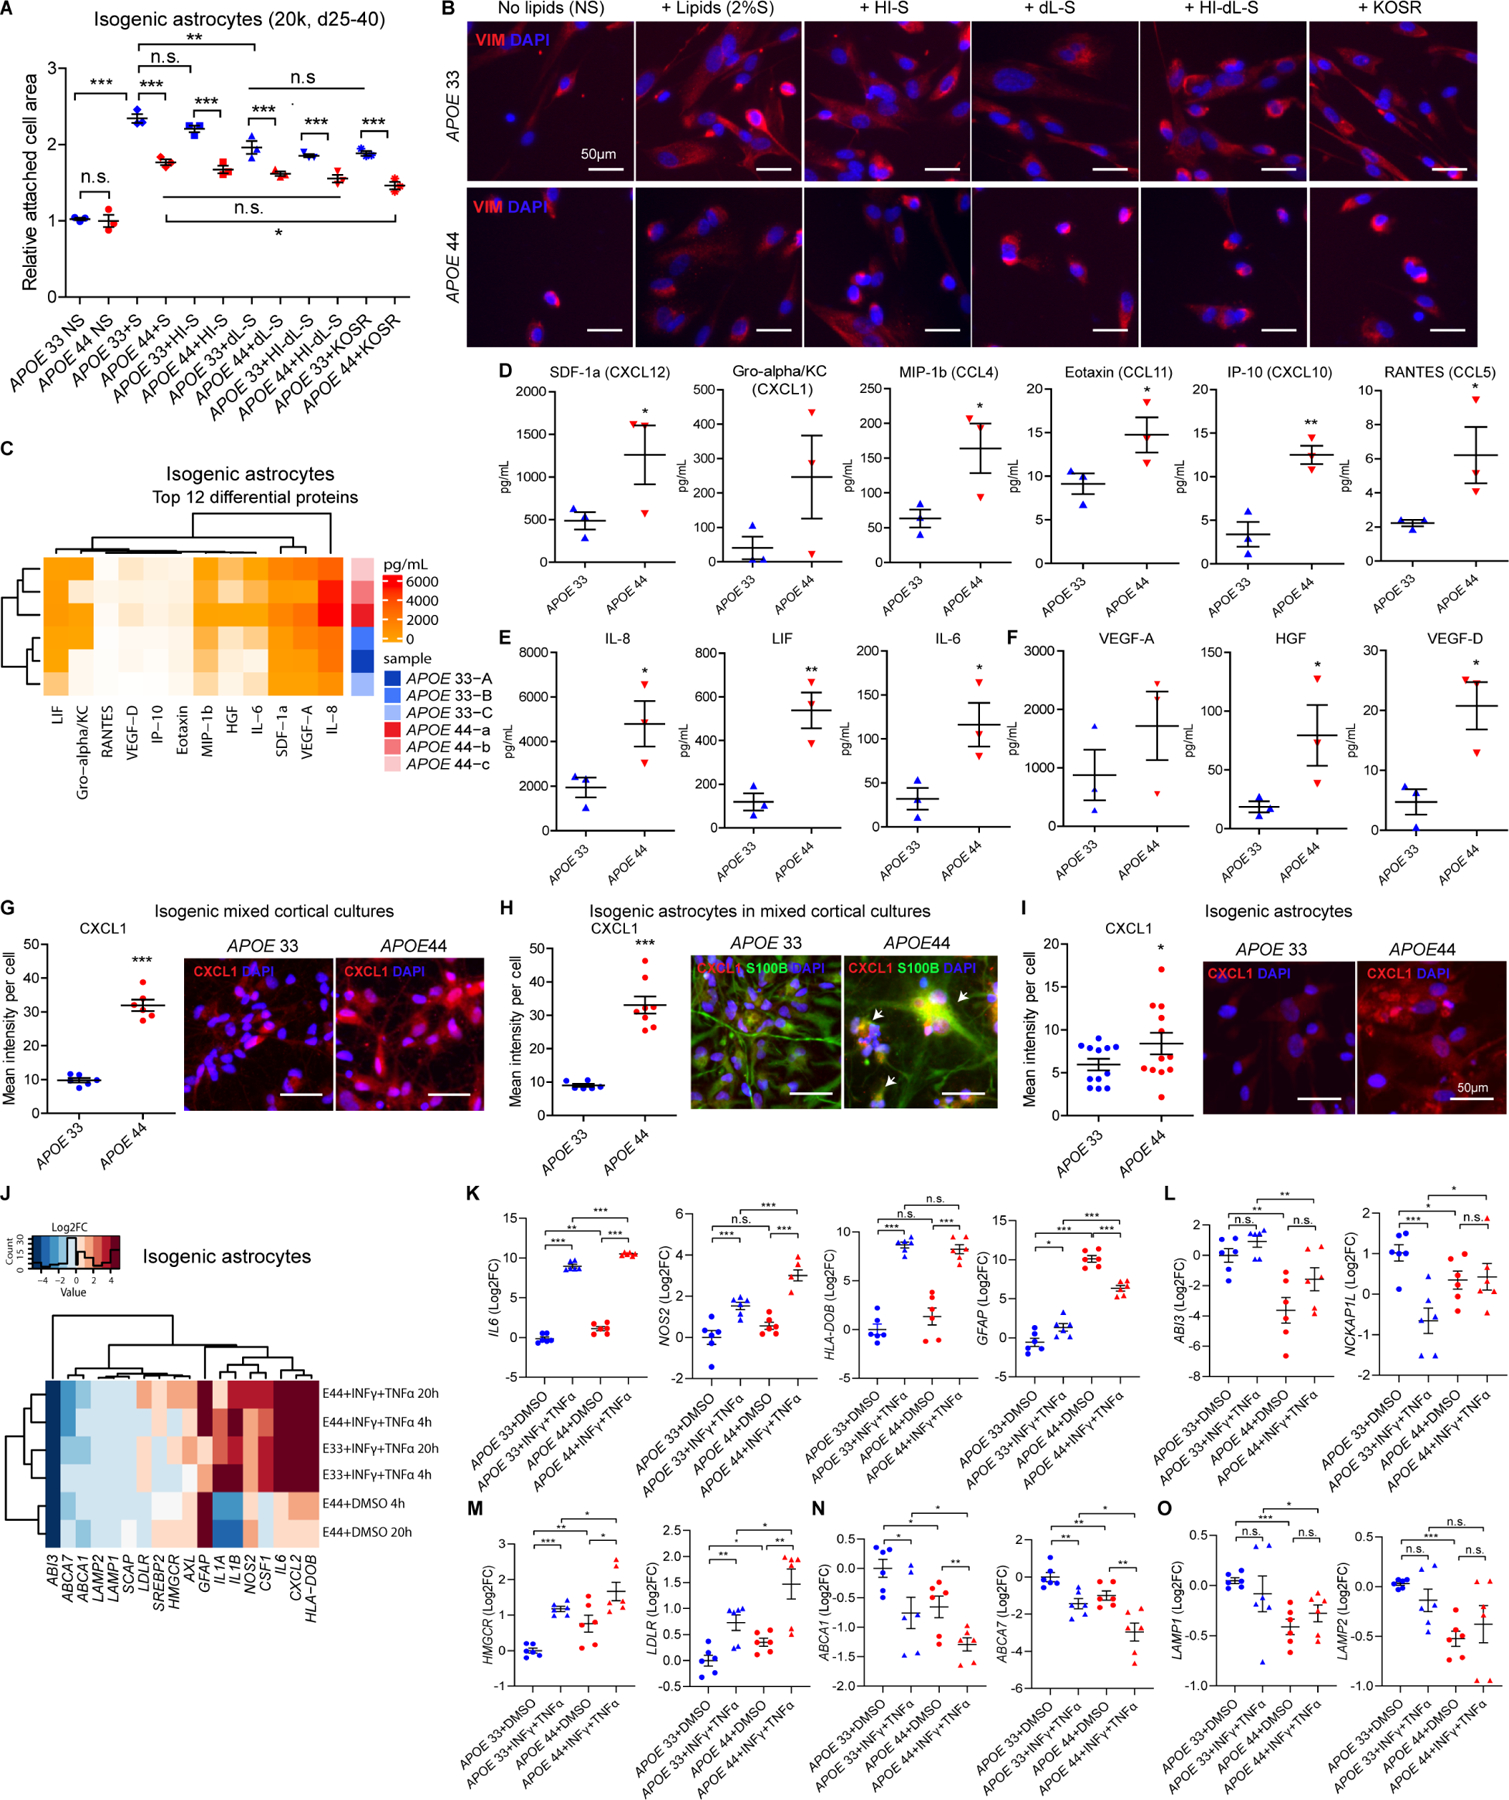
(A) Relative attached cell area on the surface measured by whole cell masks in isogenic APOE astrocytes with no serum (NS), serum (S), heat-inactivated serum (HI-S), delipidated serum (dL-S), heat-inactivated delipidated serum (HI-dL-S) and knockout serum replacement (KOSR).
(B) Representative VIM images in isogenic APOE astrocytes with NS, S, HI-S, dL-S, HI-dL-S and KOSR.
(C) Clustering heatmap for top 12 secreted proteins from 45-plex human panel 1 in isogenic APOE astrocytes (N=6, A-C, a-c, isogonics lines, 2 independent experiments, 3 replicates).
(D-F) Quantification of chemokines (D), cytokines (E) and growth factors (F) secreted by isogenic APOE astrocytes. (N=6, each dot=2 experiments).
(G-I) Representative images and quantification of chemotaxis marker, CXCL1 in isogenic APOE mixed cortical cultures (G), astrocyte ROIs in mixed cortical cultures (H) and pure astrocytes (I) (N=12).
(J-O) Clustering heatmap for representative genes (J) and relative expressions of matrisome (K), actin cytoskeleton (L), cholesterol biosynthesis (M), cholesterol efflux (N) and lysosome (O) in isogenic APOE astrocytes with or without proinflammatory activators (INFγ+TNFα) or vehicle controls (DMSO) for 4h and 20h. One-way unpaired t-test for genotype comparisons, Two-way ANOVA with Bonferroni post-hoc corrections for comparisons of multiple treatments. *, p<0.05, **, p<0.01, ***, p<0.001, n.s., not significant, Error bars=SEM
Elevated chemokine/cytokines in APOE4 mixed cortical culture astrocytes
Cell type deconvolution of AD brain uncovered enriched matrisome in APOE4 astrocytes. To narrow targets to assess in astrocytes in vitro, we designed Luminex multiplex immunoassays based on significantly enriched matrisome genes in isogenic APOE human astrocytes. Hierarchical clustering was APOE genotype-dependent and showed nearly half (24 of 45) were differentially expressed proteins (DEP)(Figures 7C, S7F and S7G). The top 12 DEPs including SDF-1a (CXCL12), Gro-alpha/KC (CXCL1), MIP-1b (CCL4), Eotaxin (CCL11), IP-10 (CXCL10), RANTES (CCL5), IL-8, LIF, IL-6, VEGF-A, HGF and VEGF-D were significantly higher in APOE4 astrocytes (Figure 7C–7F). Spearman correlation coefficient analysis of the 12 DEPs showed a stronger correlation in APOE3 relative to APOE4 astrocytes (Figures S7H–S7J).
To examine whether matrisome genes are enriched in mixed cortical cultures via astrocyte-neuron communication, chemokines were examined in mixed cortical cultures, mixed-cortical-cultured astrocytes and pure astrocytes by Luminex. CXCL1 and CXCL10, upregulated in APOE4 mixed cortical cultures (Figures 7G and S7K), were further enriched (2 to 2.5-fold) in mixed-cortical-cultured astrocytes vs. pure astrocytes (Figures 7H, 7I, S7L and S7M). Additionally, deconvoluted astrocytes from mixed cortical cultures highly correlated with pure astrocytes (95–97%)(Figure S7N), supporting the notion that astrocyte-neuron communication drives the astrocyte matrisome signal.
Matrisome exacerbates lipid dysregulation in APOE4 astrocytes
Proinflammatory factors interferon gamma (IFNγ) and tumor necrosis factor-alpha (TNFα) are secreted by microglia and astrocytes, elevated in AD, and a subset of the Matrisome signal (Barcia et al., 2011; Chung and Benveniste, 1990; Clarke et al., 2010; Wang et al., 2015). Proinflammatory mediators IL6, NOS2 and HLA-DOB were upregulated in isogenic APOE4 astrocytes treated with IFNγ and TNFα (Figure 7J and 7K). IFNγ and TNFα upregulated cholesterol biosynthesis genes (HMGCR, LDLR, SREBF2) and downregulated efflux genes (ABCA1, ABCA7), but lysosome (LAMP1, LAMP2) and actin cytoskeleton regulation (ABI3, NCKAP1L) were unchanged in APOE4 astrocytes (Figures 7J–7O). These data suggest that inflammation, as subset of matrisome enrichment in the APOE4 brain exacerbates APOE4 astrocyte lipid dysregulation.
Together, APOE4 drives lysosomal cholesterol sequestration in astrocytes which leads to lipid dysregulation by increasing cholesterol biosynthesis and decreasing efflux. Under homeostatic conditions, APOE4 astrocytes exhibit actin cytoskeletal defects independent of exogenous lipid exposure. Proinflammatory matrisome dysregulation is in part induced by APOE4 astrocyte-neuron communication and worsens lipid dysregulation including cholesterol biosynthesis and efflux.
Discussion
Global transcriptomics and in vitro functional studies were employed to determine the impact of APOE4 in hiPSC-derived brain cell types from both population and multiple CRISPR-edited isogenic lines. Individual variability from population and isogenic analyses revealed that APOE4 specific local haplotypes arise independently of APOE3, and these diverse haplotypes contribute to the transcriptomic variation. Despite the variability due to genetic heterogeneity, cell type-based transcriptomic analyses of hiPSC models, post-mortem AD brain and APOE-TR mice identified human-specific dysregulation of lipid metabolism in APOE4 astrocytes and microglia and matrisome in APOE4 mixed cortical cultures and AD brain derived from astrocyte-neuron communication.
In vitro and in vivo studies identified intracellular cholesterol accumulation in APOE4 human astrocytes. Elevated gene sets and enzymes of cholesterol synthesis in APOE4 human astrocytes contradict the mechanism by which increased free cholesterol levels suppress gene expression via SREBP2 (Brown and Goldstein, 2009). Because excess cholesterol is sequestered in lysosomes away from the ER, it prevents the appropriate SREBP2-mediated cholesterol regulation; increased cleaved SREBP2 upregulates cholesterol biosynthesis and cell surface lipid receptors to facilitate extracellular cholesterol uptake, however, uptake was dampened by actin cytoskeletal defects. Further, cholesterol accumulation is exacerbated by reduced cholesterol secretion and efflux, due to lower levels of lipid carrier protein (e.g., APOE) and sterol transporters to HDL (e.g., ABCA1).
Previous studies identified APOE-isoform specific effects on cholesterol flux and APOE levels in rodent brain cells and human periphery (Gong et al., 2002; Huang et al., 1995; Michikawa et al., 2000). Exogenous APOE4 compared to APOE3 impaired cholesterol efflux in rat neurons but not astrocytes (Michikawa et al., 2000). APOE4-TR mouse neurons and astrocytes exhibit decreased cholesterol efflux compared to APOE3, similar to our data. While APOE mRNA levels were unchanged in mouse (Gong et al., 2002), APOE4 human astrocytes and microglia exhibited a cell autonomous decrease in APOE transcript and protein in vitro and in vivo. APOE transcript levels were similar between astrocytes and microglia, but APOE protein levels were lower in microglia compared to astrocytes (Figures 6I, 6J, S6I and S6M). However, increased APOE protein degradation (Riddell et al., 2008) or reduced APOE uptake in microglia compared to astrocytes cannot be excluded. The effect of endogenous vs. exogenous APOE on cellular phenotypes, and the role of different post-translational APOE modifications in microglia and astrocytes require further studies.
Our human specific findings underscore an important caveat of studying the role of APOE genotype using APOE-TR mice, which are genetically chimeric, i.e. contain the mouse 5’ regulatory region but human exons 2–4 (Knouff et al., 1999; Sullivan et al., 1997) in which the promotor of APOE has <40% homology to humans (Maloney et al., 2007). Our study highlights gene expression, gene regulatory and functional differences exhibited between humans and mice that necessitate the examination of AD genetic risk factors, like APOE4 in human models (Geirsdottir et al., 2020; Zhang et al., 2016).
Recent studies highlight microglial lipid dysregulation attributed to AD genetic risk. TREM2 or PLCG2 KO impaired lipid metabolism and CE accumulation in microglia (Andreone et al., 2020; Nugent et al., 2020). Hypomorphic TREM2 R47H increases CE accumulation, while protective, hypermorphic PLCG2 P552R reduces CE accumulation in microglia, supporting an APOE-TREM2-PLCγ2 signaling axis required for recycling lipid-containing debris. Our observation of reduced de novo APOE synthesis and cholesterol efflux/secretion by APOE4 predisposes microglia to dampened APOE-TREM2-PLCγ2 signaling. Upon accumulation of toxic protein aggregates and neuronal debris with age, reduced APOE-TREM2 signaling in microglia accelerates lipid metabolic dysregulation and an inflammatory state that increase AD risk.
We uncovered altered matrisome, ECM and immune pathways by APOE4 in hiPSC-mixed cortical cultures and AD brain, identifying astrocytes as a key driver of this signal through cell type deconvolution analyses likely arising from astrocyte-neuron communication in APOE4 brain, stressing human astrocyte-specific non-cell autonomous dysregulation. Upregulated ECM caused by astrogliosis is associated with amyloid plaques in AD and glial scar formation after CNS injury, creating a mechanical barrier for neurite outgrowth (Bovolenta et al., 1997; Pike et al., 1995). The APOE4 mixed cortical model recapitulates some aspects of the AD brain environment and implicates a reactive astrocyte state that upregulates ECM, cytokines and growth factors. Enriched matrisome includes increased chemotaxis, inflammation and lipid synthesis (like pure astrocytes), and the proinflammatory state promotes cholesterol biosynthesis but impedes efflux, suggesting APOE4 alters matrisome signaling to exacerbate lipid dyshomeostasis.
Recent hiPSC genetic modeling efforts have utilized either a pooled patient iPSC strategy to uncover disease phenotypes in the context of patient genetic heterogeneity or a comprehensive isogenic platform to assess the effect of disease mutations by limiting genetic background variation (Lim et al., 2020; Mitchell et al., 2020; Ramos et al., 2021). We employed both population and isogenic cell type-based models and factored in GRS and APOE local haplotype to address the genetic complexity underlying human APOE4 risk to model AD. Our well-powered hiPSC study identified common and divergent pathways when compared to earlier APOE4 hiPSC studies (Lin et al., 2018; Sienski et al., 2021; Wang et al., 2018). Wang et al. characterized APOE4 neuronal phenotypes in 6 subjects and a single clone of each genotype from one isogenic pair. Using the same cortical neuron protocol as our study, the neurons studied are likely a mixed neuron/astrocyte population, although RNA sequencing was not performed. Using technical replicates from one isogenic pair, Lin et al. reported intracellular free cholesterol accumulation in APOE4 astrocytes, consistent with our data, but identified downregulated cholesterol biosynthesis, opposing our data. Examining two isogenic pairs, Sienski et al. showed that APOE4 astrocytes were choline deficient, causing increased unsaturated fatty acids and lipid droplet accumulation in which choline supplementation restored the cellular lipidome to its basal state. Population and most isogenic APOE4 astrocytes upregulate choline kinase alpha (CHKA) (Figure S3B), which incorporates choline into phosphocholine in phosphatidylcholine biosynthesis (Wu et al., 2008). Our population and isogenic studies identified common APOE genotype-phenotypes across individuals with opposing effects in certain individuals, which highlight the complexity of the interaction between APOE4 and genetic background in different cell types that cannot be examined with a single isogenic pair. Despite performing GRS analysis to select hiPSCs and further incorporating this genetic variation as a covariate in analyses to minimize the contribution of other AD risk loci, pathway divergences still emerged in which one individual showed discordance but in different cell types (Figures 3E–3G). The pathway discordance aligned with APOE expression (Figure S3F). Variation in APOE levels may be due to differences in APOE local haplotype for each individual and differing gene regulation in different cell types, leading to cell type-specific individual variance. Further functional genomic dissection of the APOE locus is needed to identify haplotype-specific differences in APOE regulation in different cell types. APOE4 resembles APOE LOF (Figure S3H); thus, modulating gene expression may be an alternative to study disease-associated polymorphisms. However, APOE LOF is limited to particular individuals, suggesting that individual donor genetics dominate over single risk allele conversion or KO in isogenics, which results in discordant outcomes among studies.
An important question that emerges from our study is how to best incorporate human genetic heterogeneity in modeling common AD genetic risk. APOE4 has a strong odds ratio (OR) in non-Hispanic Europeans (OR=14.9), whereas APOE4 risk varies substantially across populations (African Americans and Caribbean Hispanics, OR=2.2–5.7 and East Asians, OR=11.8–33.1)(Liu et al., 2014; Tang et al., 1998). Furthermore, the risk is modulated at least in part on differing ancestral haplotypes across the APOE locus (Rajabli et al., 2018). This suggests that the impact of APOE4 is haplotype dependent. Since APOE local haplotypes exist in an APOE genotype-dependent manner (Figure 1D), the generation of isogenic APOE lines creates novel haplotypes. The discordant phenotypes due to APOE4 among studies may result from introducing APOE ε3 or ε4 into different haplotypic backgrounds, while clonal variability < individual variability. These observations have important implications for modeling GWAS variants more broadly. To date most isogenic studies have focused on high-penetrance Mendelian disease-causing variants where haplotypes may not be a factor. However, we show that for a strong genetic risk factor like APOE4, genetic heterogeneity including haplotype eclipses APOE alone. This is likely more problematic for other GWAS signals with lower ORs and more ambiguous evidence for causal variants. Indeed, it is likely that for many GWAS loci the risk is imparted by haplotypes rather than individual SNPs, as is evident by high correlation of local haplotypes and SNPs at a global level of the human genome (Jakobsson et al., 2008), making isogenic approaches more challenging. Although cell type-dependent penetrance of disease risk variants and the number of individuals necessary to model the risk variants need to be resolved on a case-by-case basis, the strength of a population model over isogenics need to be considered based on haplotypes for non-Mendelian genetic risk cases.
In summary, we demonstrate human-specific and AD brain cell type-dependent transcriptional and cellular phenotypes of APOE4, uncovering major deficits in lipid homeostasis and glial activation. These studies suggest that therapeutic approaches aimed at restoring glial lipid homeostasis and inflammation may be beneficial for AD, particularly in APOE4 carriers.
Limitations of the Study
A caveat of our study arises from the nature of hiPSC models, which remove the ‘age’ associated epigenetic signatures that may contribute significantly to AD progression (Mertens et al., 2021). It is also under-investigated whether iPSC reprogramming removes ‘pathological phenotypes.’ One challenge was collecting an equal number of cases vs. controls for each APOE genotype to confirm that differences were attributed to APOE4 but not unknown effects of disease status. Other disease relevant genetic factors (GRSnoAPOE, APOE local haplotype) were considered in our model, however aging or epigenetics cannot be recapitulated in hiPSC models yet. For example, enriched Matrisome is not only driven by APOE4 genotype but also by AD pathological phenotypes in the context of APOE3, however, our hiPSC study could only model APOE genotype but not AD neuropathological phenotypes or age. Thus, how APOE4 manifests in the context of neurodegeneration and aging are important unresolved questions worth exploring to better understand human AD pathogenesis.
Since altered matrisome pathways in astrocytes from AD brain were recapitulated in APOE4 hiPSC-mixed cortical cultures, incorporating microglia in 2D may more faithfully model the in vivo context. A recent 3D organoid model exhibits increased AD-related Aβ and APOE4-dependent tau pathology, (Zhao et al., 2020a) in which adding microglia (Abreu et al., 2018; Lin et al., 2018) to such models with increasing cellular complexity may further mimic the brain environment. Moreover, BMECs did not exhibit a cell autonomous APOE4 phenotype, which is consistent with altered endothelial phenotypes that arose only after modulation by brain pericytes (Blanchard et al., 2020; Yamazaki et al., 2020). Together these observations highlight the value of co-culture and organoid systems to extract the impact of APOE4 in complex cellular environments.
STAR Methods
RESOURCE AVAILABILITY
Lead contact
Further information and requests for resources and reagents should be directed to and will be fulfilled by the Lead Contact, Julia TCW (juliatcw@bu.edu).
Materials availability
All resources and materials reported in this paper will be shared by the lead contact upon request. The human iPSC lines listed in the key resource table (Table S1 and S4) require MTAs with a waiver of IRB approval.
KEY RESOURCES TABLE
| REAGENT or RESOURCE | SOURCE | IDENTIFIER |
|---|---|---|
| Antibodies | ||
| Neural Crest Stem Cell MicroBeads | Miltenyi Biotec | Cat# 130-097-127 |
| Indirect CD133 MicroBead | Miltenyi Biotec | Cat# 130-091-895 |
| Myelin isolation beads | Miltenyi Biotec | Cat# 130-104-262 |
| Myelin Basic Protein (MBP) | Miltenyi Biotec | Cat# REA1154 |
| SOX2 | Cell signaling | Cat# 3579S, RRID:AB_2195767 |
| PAX6 | Abcam | Cat# ab5790, RRID:AB_305110 |
| FOXP2 | Abcam | Cat# ab16046, RRID:AB_2107107 |
| NESTIN | Abcam | Cat# ab22035, RRID:AB_446723 |
| CD43 (clone CD43-10G7) | BioLegend | Cat# 343206, RRID:AB_2194072 |
| CD45 (HI30) | Tonbo Biosciences | Cat# 25-0459, RRID:AB_2621631 |
| CD235a (Glycophorin A) (clone HI264) | BioLegend | Cat# 349112, RRID: AB_2562708 |
| CD41 (clone HIP8) | BioLegend | Cat# 303706, RRID:AB_314376 |
| S100β | Sigma | Cat# S2532, RRID:AB_477499 |
| Vimentin | Cell Signaling | Cat# R28#3932 |
| NFIA | Active Motif | Cat# 39398 |
| GLAST/EAAT1 | BOSTER | Cat# PA2185, RRID:AB_2665510 |
| ALDH1L2 | Novusbio | Cat# NBP1-81935, RRID:AB_11022659 |
| AQP4 | Almone Labs | Cat# AQP-004, RRID:AB_2039734 |
| MAP2AB | Sigma | Cat# M1406, RRID:AB_477171 |
| TUJ1 | Biolegend | Cat# 802001, RRID:AB_2564645 |
| TH1 | Pel-Freez Biologicals | Cat# P40101, RRID:AB_2313713 |
| GABA | Sigma | Cat# A2052, RRID:AB_477652 |
| CX3CR1 | BioRad | Cat# AHP1589, RRID:AB_2087421 |
| IBA1 | Sigma | Cat# MABN92, RRID:AB_10917271 |
| IBA1 | FujiFilm (Wako) | Cat# 019-19741 RRID:AB_839504 |
| TREM2 | R&D | Cat# AF1828, RRID:AB_2208689 |
| P2RY12 | Sigma | Cat# HPA014518, RRID:AB_2669027 |
| PU.1 | Cell Signaling | Cat# 2266, RRID:AB_10692379 |
| Claudin-5 | ThermoFisher | Cat# 4C3C2, RRID:AB_2533200 |
| ZO-1 | ThermoFisher | Cat# 402200, RRID:AB_2533456 |
| Occludin | ThermoFisher | Cat# OC-3F10, RRID:AB_2533101 |
| GFAP | Millipore | Cat# MAB3402, RRID:AB_94844 |
| GFAP | Abcam | Cat# ab194325 |
| EAAT1 | GeneTex | Cat# GTX134060 |
| ALDH1L1 | Abcam | Cat# ab190298 |
| Nanog | Cell signaling | Cat# 4903S, RRID:AB_10559205 |
| NeuN | Abcam | Cat# ab190565 RRID:AB_2732785 |
| OCT4 | Cell signaling | Cat# 2840S, RRID:AB_2167691 |
| TRA1-60 | Cell signaling | Cat# 4746P, RRID:AB_2119059 |
| TRA1-81 | Cell signaling | Cat# 4745P, RRID:AB_2119060 |
| HMG-CoA reductase | EMD Milipore | Cat# ABS229, RRID:AB_11203328 |
| APOE | Calbiochem | Cat# 178479, RRID:AB_564230 |
| LAMP1 | Abcam | Cat# ab24170, RRID:AB_775978 |
| ABCA1 | Abcam | Cat# ab18180, RRID:AB_444302 |
| SREBP2 | Abcam | Cat# 30682 RRID: AB_779079 |
| Bacterial and Virus Strains | ||
| N/A | ||
| Biological Samples | ||
| N/A | ||
| Chemicals, Peptides, and Recombinant Proteins | ||
| LDN193189 | Stemgent | Cat# 04-0074 |
| SB431542 | Stemgent | Cat# 04-0010 |
| Brain-derived neurotrophic factor (BDNF) | R&D | Cat# 248-BD-025 |
| Glia-derived neurotrophic factor (GDNF) | R&D | Cat# 212-GD-050 |
| Dibutyryl cyclic AMP sodium salt (cAMP) | Sigma | Cat# D0627 |
| L-Ascorbic acid | Sigma | Cat# A0278 |
| FGF2 | R&D | Cat# 233-FB |
| BMP4 | R&D | Cat# 314-BP |
| Activin A | R&D | Cat# 338-AC |
| VEGF | R&D | Cat# 293-VE |
| Poly-vinyl-Alcohol (PVA) | Sigma | Cat# P8136 |
| Thiazovivin (Tzv) | Millipore | Cat# 420220 |
| Human Insulin | Sigma | Cat# I2643 |
| TPO | R&D | Cat# 288-TP |
| IL-6 | R&D | Cat# 206-IL |
| SCF | R&D | Cat# 255-SC |
| IL3 | R&D | Cat# 203-IL |
| TGFβ | Peprotech | Cat# 100-21 |
| IL-34 | Peprotech | Cat# 200-34 |
| M-CSF | Peprotech | Cat# 300-25 |
| Fractalkine (CX3CL1) | PeproTech | Cat# 300-31 |
| CD200 | Novoprotein | Cat# C311 |
| Poly-L-lysine | Sigma | Cat# P2636 |
| DAPI (4’,6-diamidino-2-phenylindole | Invitrogen | Cat# D1306 |
| Hexane | Sigma | Cat# 650552 |
| Isoprophyl alcohol | Sigma | Cat# W292907 |
| NaOH | Sigma | Cat# S5881 |
| Filipin | Sigma | Cat# F9765 |
| FITC-Dextran | Home-made | N/A |
| Leupeptin | Sigma | Cat# L2884 |
| Pepstatin A | Sigma | Cat# P5318 |
| Aprotinin | Sigma | Cat# A3428 |
| ALLN | Milipore | Cat# 208719 |
| Phenylmethanesulfonyl fluoride (PMSF) | Sigma | Cat# 93482 |
| Matrigel Matrix | Corning | Cat# 354230 |
| mTeSR1 | StemCell Technologies | Cat# 85850 |
| E8 | StemCell Technologies | Cat# 05940 |
| FGF2 StemBeads | StemCultures | Cat# SB500 |
| astrocyte medium | ScienCell | Cat# 1801 |
| Accutase | Millipore | Cat# SCR005 |
| TrypLE Select Enzyme | Gibco | Cat# 15240062 |
| 0.25% trypsin | GIBCO | Cat#15090-046 |
| BrainPhys media | StemCell Technologies | Cat# 05790 |
| Antibiotic-Antimycotic | Gibco | Cat# 15240096 |
| N2 Supplement | Gibco | Cat# 17502048 |
| B27 Supplement | Gibco | Cat# 17504044 |
| IMDM | Gibco | Cat# 12440053 |
| F12 | Gibco | Cat# 11765054 |
| Monothioglycerol (MTG) | Sigma | Cat# M1753 |
| GlutaMax Supplement | Gibco | Cat# 35050061 |
| Non-essential Amino Acids (NEAA) | Gibco | Cat# 11140050 |
| Insulin-Transferrin-Selenium (ITS-G) | Gibco | Cat# 41400045 |
| Insulin-Transferrin-Selenium-Ethanolamine (ITS-X) | Gibco | Cat# 51500056 |
| Chemically-defined lipid concentrate | Gibco | Cat# 1190503 |
| Knock-Out Serum Replacement | Gibco | Cat# 10828028 |
| Beta-mercaptoethanol | Sigma | Cat# M6250 |
| Human platelet poor derived serum | Sigma | Cat# P2918 |
| Retinoic acid (RA) | Sigma | Cat# R2625 |
| Collagen IV | Sigma | Cat# C6745 |
| Fibronectin | Sigma | Cat# ECM001 |
| Hanks’ Balanced Salt solution (HBSS without Ca2+, Mg2+) | ThermoFisher | Cat# 14175-103 |
| DNase | Sigma | Cat# DN-25 |
| Penicillin-Streptomycin | Gibco | Cat# 15140122 |
| Paraformaldehyde | Electron Microscopy Sciences | Cat# 15710 |
| Triton X-100 | Sigma | Cat# T9284 |
| RIPA buffer | Sigma | Cat# R0278 |
| pHrodo-red dye | ThermoFisher | Cat# P35364 |
| TRITC-Dextran | ThermoFisher | Cat# D1818 |
| GW3965 | Sigma-Aldrich | Cat# G6295 |
| T0901317 | Sigma-Aldrich | Cat# T2320 |
| 25-hydroxycholesterol | Sigma-Aldrich | Cat# H1015 |
| DHE | Sigma-Aldrich | Cat# E2634 |
| Methyl β-cyclodextrin | Sigma-Aldrich | Cat# C4555 |
| Fluoromount-G | ThermoFisher | Cat# 00-4958-02 |
| Critical Commercial Assays | ||
| APOE rs429358 Taqman Assay | ThermoFisher | Cat# C_3084793_20 |
| APOE rs7412 Taqman Assay | ThermoFisher | Cat# C_904973_10 |
| RNeasy Mini | Qiagen | Cat# 74106 |
| DC protein Assay | Bio-Rad | Cat# 5000111 |
| BCA kit | ThermoFisher | Cat# PI-23225 |
| 45-Plex Human Panel 1 (ProcartaPlex) | Invitrogen | Cat# EPX450-12171-901 |
| DNeasy Blood & Tissue Kit | Qiagen | Cat# 69506 |
| Infinium Global Screening Array | Illumina | Cat# 20024445 |
| Cholesterol efflux fluorometric assay kit | Biovision | Cat# K582-100 |
| Deposited Data | ||
| RNA sequencing data SuperSeries | NCBI | GSE190188 |
| RNA sequencing data from human iPSC-derived population APOE brain cells | NCBI | GSE190187 |
| RNA sequencing data from human iPSC-derived isogenic APOE brain cells | NCBI | GSE190185 |
| RNA sequencing data from mouse primary mouse Apoe glial cells | NCBI | GSE190186 |
| Experimental Models: Cell Lines | ||
| Human: iPSC lines from fibroblasts | This study | ID #1-13 (Table S1) |
| Human: isogenic iPSC lines from fibroblasts | This study | ID: TCW1-4 (Table S6) |
| Experimental Models: Organisms/Strains | ||
| Mouse: human APOE targeted replacement mice | Provided by Dr. Patrick M. Sullivan | N/A |
| Mouse: Apoe knockout mice | Jackson Laboratory | Cat# 002052 |
| Mouse: Apoe wild-type mice (C57BL/6) | Charles River | Cat# 027 |
| Oligonucleotides | ||
| sgRNA 5’– CCTCGCCGCGGTACTGCACCAGG – 3’ | This study | N/A |
| Recombinant DNA | ||
| pX330-U6-Chimeric_BB-CBh-hSpCas9-GFP (PX338) | Addgene | Cat# 42230, RRID:Addgene_422 30 |
| Software and Algorithms | ||
| CRISPR Design | zhang@broadinstitute.org | http://crispr.mit.edu |
| PLINK | Chang et al., 2015 | RRID:SCR_001757 |
| GraphPad Prism | GraphPad Software | RRID:SCR_002798 |
| STAR | Dobin et al., 2013 | https://github.com/alexdobin/STAR |
| DESeq2 | Love et al., 2014 | https://bioconductor.org/packages/release/bioc/html/DESeq2.html |
| fGSEA | Subramanian et al., 2005 | https://bioconductor.org/packages/release/bioc/html/fgsea.html |
| STAR | Dobin et al., 2013 | https://github.com/alexdobin/STAR |
| Ingenuity Pathway Analysis (IPA) | Qiagen | https://www.qiagenbioinformatics.com/products/ingenuity-pathway-analysis/ |
| Rstudio | R Software | https://www.rstudio.com/ |
| ImageJ | Schneider et al., 2012 | https://imagej.nih.gov/ij/ |
| Metamorph Discovery-1 | Molecular Devices | https://www.moleculardevices.com/products/cellular-imaging-systems/acquisition-and-analysis-software/metamorph-microscopy |
| Imaris Bitplane software (version 9.7.2) | Oxford Instrument | https://imaris.oxinst.com/ |
| MAGPIX xPONENT4.2 | Cook et al., 2019 | VP-XPONENT4.2 https://www.luminexcorp.com/magpix/ |
| WGCNA | Langfelder & Horvath, 2008 | https://cran.r-project.org/web/packages/WGCNA/index.html |
Data and code availability
The data discussed in this publication have been deposited in NCBI’s Gene Expression Omnibus (GEO) and are publicly available as of the date of publication. Accession numbers are listed in the key resources table. We have used the software and algorithms cited in the key resource table in this manuscript with default parameters or minor changes, thus the paper does not report original code, but the code for these analyses is available upon request. Any additional information required to reanalyze the data reported in this paper is available from the lead contact upon request.
EXPERIMENTAL MODEL AND SUBJECT DETAILS
Generation of hiPSC-astrocytes
hiPSCs lines balanced for sex (Table S1) were generated by Icahn School of Medicine at Mount Sinai, UCI ADRC, WashU ADRC Induced Pluripotent Stem Cell Core from subject fibroblasts with approved Institutional Review Boards (IRB) and human Stem Cell Research Oversight (hSCRO) committee protocols. The consent for reprogramming human somatic cells to hiPSC was carried out on hSCRO protocol 19–04 (J.TCW.), 2013–9561 and 2017–1061 (W.W.P.). Informed consent was received by each of the participants who donated fibroblasts. hiPSCs were maintained on Matrigel (Corning) in mTeSR1 (StemCell Technologies) supplemented with 10 ng/ml FGF2 StemBeads (StemCultures). hiPSCs in passage range from 12–21 were differentiated to NPCs by dual SMAD inhibition (0.1µM LDN193189 and 10µM SB431542) in embryoid bodies (EB) media (DMEM/F12 (Invitrogen, 10565), 1x N2 (Invitrogen, 17502–048), and 1x B27-RA (Invitrogen, 12587–010)). Rosettes were selected at 14 DIV by Rosette Selection Reagent (StemCell Technologies) and patterned to forebrain NPCs with EB media containing 20 ng/ml FGF2 (Invitrogen). NPCs (CD271−/CD133+) were enriched by magnetic activated cell sorting (Miltenyi Biotec) (Bowles et al., 2019) and validated immunocytochemically using SOX2 (Cell signaling, 3579S), PAX6 (Abcam, ab5790), FOXP2 (Abcam, ab16046) and NESTIN (Abcam, ab22035). Dissociated single cell forebrain NPCs (15,000 cells/cm2) were differentiated to astrocytes in astrocyte medium (ScienCell, 1801) on Matrigel as described (TCW et al., 2017). Cells were continually passaged at 95% confluency and harvested as astrocytes at 30 DIV, validated immunocytochemically and/or by FACS for the astrocyte-specific markers and used for subsequent experiments.
Generation of hiPSC-mixed cortical cultures
Forebrain NPCs were dissociated with Accutase (Millipore) and re-plated on Matrigel at 42,000 cells/cm2. After 24 h, media was replaced with BrainPhys media (StemCell Technologies) supplemented with 1% Antibiotic-Antimycotic, 1x N2, 1x B27, 20ng/ml brain-derived neurotrophic factor (BDNF), 20ng/ml glia-derived neurotrophic factor (GDNF), 250ug/ml dibutyryl cyclic AMP sodium salt (cAMP) (Sigma) and 200µM L-Ascorbic acid (AA) (Sigma) as described (Bardy et al., 2015). Cells cultured for six weeks were used for all experiments.
Generation of hiPSC-microglia
hiPSCs cultured in either mTeSR or E8 (StemCell Technologies) were differentiated to hematopoietic progenitor cells (HPCs) and subsequently to microglia. Single cell hiPSCs were cultured in hypoxia (20% O2, 20% CO2) at 37°C with 50ng/ml FGF2 (Peprotech) and 50ng/ml BMP4 (Peprotech), 12.5ng/ml Activin A (Peprotech), 2mM LiCl (Peprotech) during days 0–2 and 50ng/ml FGF2 and 50ng/ml VEGF (Peprotech) for days 2–4 in basal HPC medium (50% IMDM (Gibco), 50% F12 (Gibco), 0.02 mg/ml insulin (Sigma), 2% v/v ITSG-X (Gibco), 64µg/ml ascorbic acid (Sigma), 400 µM monothioglycerol (MTG) (Sigma), 10 µg/ml PVA (Sigma), 1x GlutaMax (Gibco), 1x Chemically-defined lipid concentrate (Gibco), 1x non-essential amino acids (NEAA) (Gibco), 1% v/v Antibiotic-Antimycotic) to generate EBs as described previously (Abud et al., 2017). EBs were transferred to normoxia for another 6 days in basal HPC media supplemented with 50ng/ml of each FGF2, VEGF, TPO and IL6, and 10ng/ml of each SCF and IL3. At day 10, HPCs were collected in the absence of FACS, filtered through a 45µm cell strainer (Fisher Scientific), and plated onto Matrigel-coated 6-well plates (200,000 cells/well). HPCs were cultured in microglia basal medium (DMEM/F12, 1x Glutamax, 1x NEAA, 2% v/v ITS-G, 2% v/v B27, 0.5% v/v N2, 200uM MTG, 5ug/ml Insulin) with 50 ng/mL TGFβ (Peprotech), 100 ng/mL IL-34 (Peprotech) and 25 ng/mL M-CSF (Peprotech) for 25 days, and then cultured in microglia basal medium supplemented with 100 ng/mL CX3CL1 (Peprotech) and 100 ng/mL CD200 (Novaprotein) for an additional three days, and harvested on day 28 for analysis. HPCs were validated by FACS for CD43+(> 98%) and CD41+/CD235a+/CD45− (Biolegend) while microglia were validated by immunocytochemistry with microglia-specific markers.
Generation of hiPSCs-BMECs
BMECs were generated as described (Lippmann et al., 2014). Briefly, hiPSCs were plated as evenly dispersed single cells on Matrigel (Corning)-coated 6-well plates. Cells were maintained in E8 at 37°C in 5% CO2 with daily media change until 70% confluent and subsequently switched to unconditioned media (Dulbecco’s Modified Eagle’s Medium/Ham’s F12 (Gibco) with 20% Knock-Out Serum Replacement (ThermoFisher), 1% NEAA, 0.836 µM beta-mercaptoethanol (Sigma) and 5% GlutaMAX and cultured until a monolayer exhibiting distinct morphological changes formed (3–5 days). Next, cells were cultured in basal EC media (Human Endothelial Serum-Free Media (ThermoFisher) with 1% human platelet poor derived serum (Sigma)) supplemented with 20 ng/mL bFGF (Peprotech) and 10 µg/mL retinoic acid (RA) (Sigma) for 24 h, followed by incubation in EC media lacking bFGF for another 24 h, and then cultured in basal EC media for an additional 48 h. Afterward, cells were dissociated into single cells (Tryple Express (Gibco)) and plated onto either 24-well plates coated with 400 μg/mL collagen IV (Sigma)/100 μg/mL fibronectin (Sigma) in H2O mixture overnight in an incubator. Resultant BMECs were cultured in EC media for an additional 24 h prior to experiments.
Purification of primary astrocytes and microglia
All animal procedures and experiments were performed under guidelines approved by the animal studies committee at Washington University School of Medicine (D.M.H. protocol: 20180139). Mixed glia were obtained at P2 from human APOE targeted replacement mice (C57BL/6, provided by Dr. Patrick M. Sullivan) or Apoe knockout (C57BL/6, Jackson Laboratory, 002052) and wildtype mice (C57BL/6, Charles River, 027). Mouse cortices balanced for sex (52% female, sex per each brain is labeled in the GEO metadata in the key resource table) were dissected in Hanks’ Balanced Salt solution (HBSS without Ca2+, Mg2+). After meninges removal, tissue was digested in 0.25% trypsin (GIBCO, 15090–046) and 0.2mg/ml DNase (Sigma, DN-25) at 37 °C for 10 min, washed with HBSS, and dissociated in HBSS containing 0.4mg/ml DNase using fire-polished Pasteur glass pipettes followed by filtration through a 70-μm nylon mesh. Cells were pelleted (1,000 g, 5 min), washed with glial medium (DMEM, 10% FBS, 1xPen/strep, 1xGlutamax), and plated onto 10 µg/ml Poly-L-lysine (Sigma, P2636)-coated 10cm tissue culture dishes in glial medium, followed by medium replacement on the second day. After cells reached confluency, they were cultured for an additional 5–7 days with fresh glial media supplement to allow for microglia proliferation atop astrocytes. Microglia were flushed off the astrocyte layer via pipetting and plated (62,500 cells/cm2) in glial medium. Astrocytes were collected by trypsinization and replated (52,000 cells/cm2). Astrocytes and microglia were cultured in hiPSC-astrocyte (ScienCell) and hiPSC-microglia media (IL34, TGFβ, M-CSF for 4 days, followed by CX3CL and CD200 for 3 days) for 7 days respectively to mimic the human cell culture conditions. Microglia and astrocytes were purified from 22 mouse fetal brains of APOE 44 (N=6), APOE 33 (N=6), Apoe WT (N=6) and Apoe KO (N=4) mice.
Generation of isogenic CRISPR/Cas9 edited hiPSCs
TCW1 (female) and TCW2 (male) (Table S4) were generated as described (Ran et al., 2013) by the ‘CORRECT’ scarless gene-editing method (Paquet et al., 2016). Briefly, the CRISPR Design tool (http://crispr.mit.edu) was used to identify the sgRNA 5’–CCTCGCCGCGGTACTGCACCAGG–3’, which was cloned into the pX330-U6-Chimeric_BB-CBh-hSpCas9-GFP (PX338) plasmid (Addgene, 42230). The correct APOE sgRNA sequence orientation was confirmed by Sanger sequencing and CRISPR/Cas9-APOE sgRNA plasmid cleavage efficiency was determined using the Surveyor mutation detection kit in 293T cells. The single-strand oligo-deoxynucleotide (ssODN) was designed to convert APOE ε4 to APOE ε3 with a protospacer adjacent motif (PAM) silent mutation to prevent recurrent Cas9 editing. Three clones that have indel or non-homologous end-joining (NHNJ) screened by Sanger sequencing were selected as APOE knockout lines. Potential off-targets (quality score≥0.5) for the designed gRNA were confirmed negative. hiPSCs (70–80% confluent) dissociated by Accutase supplemented with 10 uM Thiazovivin (Tzv) (Millipore), were harvested (200xg, 3 min), and electroporated (Neon®, ThermoFisher) according to the manufacturer’s instructions. In brief, cells resuspended in 10µl Neon Resuspension Buffer R, 1µg CRISPR/Cas9-APOE sgRNA plasmid and 1µl of 10µM of ssODN were electroporated, then plated on Matrigel-coated plates in mTeSR media with 10 µM Tzv for 72h. GFP-expressing hiPSC were isolated by FACS (BD FACSAria). Sorted single cells were suspended in mTeSR with Tzv and plated into 96 well plates containing MEFs. Clones were expanded and transferred to a replicate plate for gDNA isolation and Sanger sequencing to identify genome edited clones. For TCW3 (male) and TCW4 (female) (Table S4), isogenics were generated via nucleofection of Cas9/sgRNA RNP complexes (Kim et al., 2014). Briefly, the sgRNA (PNAbio) and ssODN (Sigma) were designed using an online tool (https://www.deskgen.com/guidebook/). The ssODN included base pair changes to switch APOE genotype and silent mutations to remove both the PAM sequence and a Not I restriction site to facilitate homozygous gene editing and clone selection, respectively. To validate the sgRNA, hiPSC lines pre-equilibrated in E8 supplemented with 2µM Tzv for 1 h were processed to single cells, nucleofected (Amaxa) with recombinant Cas9 (PNAbio)/sgRNA complexes prepared on ice (20 min) and analyzed using the DNA Guide-it™ Mutation Detection Kit according to manufacturer. For isogenic generation, 1nmol ssODN was pre-incubated with 4.5µg Cas9/6µg sgRNA complex prior to nucleofection. Following transfection (after 48h), hiPSCs were processed into single cells and sorted by FACS into Matrigel-coated 96 well plates using SSEA4-FITC (Biolegend) and individual clones expanded in E8 supplemented with Tzv for 3d, followed by E8 only. After clonal expansion, isolated genomic DNA was used as a template to amplify an APOE fragment by PCR to screen for loss of the NotI restriction site. DNA from clones lacking a NotI restriction site were subjected to Taqman SNP genotyping and gene editing validated by Sanger sequencing to identify homozygous gene-edited hiPSCs.
Human brain tissue samples
Fixed tissue samples from the prefrontal cortex and hippocampus were obtained from the tissue repository at the Alzheimer’s Disease Research Center at the University of California Irvine. Human tissue collection and handling adhered to the University of California, Irvine, Institutional Review Board guidelines. Neuropathologic diagnosis of AD was in accordance with current NIA-AA guidelines (Hyman et al., 2012; Montine et al., 2012). Tissues were fixed in 4% paraformaldehyde, and a solution of PBS with 0.02% sodium azide was used for long-term storage. Two groups were included in this study based on their APOE status and matched for sex, age, disease status and postmortem interval (PMI) (Table S8). Clinical data were not incorporated into the present study.
METHOD DETAILS
Karyotyping
G-banding karyotyping of all iPSC lines was performed by Wicell Cytogenetics (Madison, WI).
Immunocytochemistry and image analysis
Cells were fixed in 4% paraformaldehyde in PBS at 4°C for 10 min. hiPSCs and differentiated CNS cells were permeabilized (1.0% Triton in PBS) at room temperature for 15 min and blocked in 5% donkey serum with 0.1% Triton at room temperature for 30 min. The primary antibodies used for hiPSC-astrocytes were 1:1,000 anti-S100β (Sigma-Aldrich, S2532), 1:500 anti-Vimentin (Cell Signaling, R28#3932), 1:500 anti-NFIA (Active Motif, 39398), 1:100 anti-GLAST/EAAT1 (BOSTER, PA2185), 1:100 anti-ALDH1L2 (Novusbio, NBP1–81935) and 1:500 anti-AQP4 (Alomone Labs, AQP-004), for hiPSC-mixed cortical cultures were 1: 400 anti-MAP2AB (Sigma, M1406), 1: 1,000 TUJ1 (Biolegend, 802001), 1:500 anti-TH1 (Pel-Freez Biologicals, P40101) and 1:500 anti-GABA (Sigma; A2052), for hiPSC-microglia were 2µg/ml anti-CX3CR1 (BioRad, AHP1589), for both hiPSC-microglia and mouse microglia were 1:300 anti-IBA1 (Sigma, MABN92), 10ug/ml anti-TREM2 (R&D, AF1828), 1:1,000, anti-P2RY12 (Sigma, HPA014518) and 1:100 PU.1 (Cell Signaling, 2266) and for hiPSC-BMECs were 1:100 anti-Claudin-5 (ThermoFisher, 4C3C2), 1:200 anti-ZO-1 (ThermoFisher, 402200) and 1:200 anti-Occludin (ThermoFisher, OC-3F10). For mouse astrocytes, 1:1,000 anti-GFAP (Millipore, MAB3402), 1:400 anti-EAAT1 (GeneTex, GTX134060) and 1:1,000 anti-ALDH1L1 (Abcam, ab190298). For hiPSC, anti-Nanog (Cell signaling, 4903S), anti-OCT4 (Cell signaling, 2840S), anti-TRA1–60 (Cell signaling, 4746P) and anti-TRA1–81 (Cell signaling, 4745P). For matrisome assessment, 5µg/ml IGF2 (Abcam, ab9574), 1:50 IP-10 (Abcam, ab8098), 5µg/ml GRO (Abcam, 86436). Secondary antibodies used were 1:300 Alexa donkey 488 and 568 anti-rabbit, mouse, or chicken (Life Technologies). DAPI (4’,6-diamidino-2-phenylindole, 0.5 μg/ml) was used to visualize nuclei. Images were acquired using an Olympus IX51 Fluorescence Microscope, a Zeiss LSM780 confocal microscope or Cytation 5 imager. Multiple biological and technical replicates (6 images per slide from N = 3 independent lines per genotype) of images were taken using a 20x magnification objective from mixed cortical cultures, pure astrocytes and microglia. Total integrated intensity of the whole images is measured by subtracting background intensity from total intensity and then normalized by DAPI counts to measure per cell based normalized intensity by ImageJ (Schneider et al., 2012). To capture the entire astrocyte ROIs, sum of intensity of neuron ROIs were subtracted from total integrated intensity and then corrected it by substracting background intensity. It is also normalized by astrocyte DAPI counts which is derived from neuron DAPI subtracted from total DAPI counts.
Transepithelial electrical resistance
Transepithelial electrical resistance (TEER) was measured for five consecutive days from BMECs (1,500,000 cells/cm2) grown in EC media supplemented with retinoic acid (5 µg/mL) on coated Transwells (0.33cm2, 0.4µm, Corning) using an EVOM2 Voltohmmeter (World Precision Instruments) according to manufacturer with daily media change. For each BMEC line, experiments were carried out in triplicate. TEER values were obtained by averaging two readings from each well and subtracting the blank (media only Transwells). Values are expressed as resistance per cm2.
Cellular cholesterol determination by GC-MS
Isogenic APOE astrocytes were plated (200,000 cells/well of 6-well-plate) in serum-free astrocyte media. After 48 h, cells were washed twice with HBSS, and cellular lipids extracted with hexane-isopropyl alcohol (3:2, v/v)(Shiratori et al., 1994). The extract was divided into two fractions, one-third was used for free cholesterol (FC) and remaining two-thirds was used for total cholesterol (TC) estimation. Both fractions were first dried under an Argon stream. The dried fraction retained for FC was resuspended in hexane for Gas Chromatography-Mass Spectrometry (GC-MS) analysis. The fraction retained for TC was hydrolyzed using 50% potassium hydroxide (KOH) solution to convert cholesteryl ester (CE) into FC. The FC generated was extracted by solvent separation from KOH solution using hexane. Free and total cholesterol were analyzed by GC-MS on a HP 5890 series II gas chromatograph (Hewlett-Packard) equipped with a flame-ionization detector. Lipids were separated on a HP-5 capillary column (15 m×0.53 mm) coated with 5% phenyl methyl siloxane (1.5 μm) in which the injection temperature was maintained at 255°C, the oven temperature was isothermally held at 260°C and using a helium mobile phase (30 ml/min flow rate). The astrocyte unesterified/or free cholesterol (FC) content in each well was quantified using β-sitosterol as an internal standard. After lipid extraction, cells were lysed in 0.1M NaOH, and the protein content of each well (μg protein/well) was determined using the DC protein kit (Bio-Rad). The FC content of each well was normalized to the corresponding protein concentration. The CE levels were estimated by subtracting FC from TC values. Experimental results are presented as fractions of control.
Intracellular FC measurement by filipin & analysis
Isogenic APOE astrocytes were plated (20,000 cells/cm2) in serum-free astrocyte medium and either treated with or without LDL for 24 h. Intracellular FC was determined by fluorescence. Cultured astrocytes were fixed, and FC was labeled with filipin (50 μg/ml in PBS for 45 min at room temperature), followed by 3x wash with PBS, and acquiring images by widefield fluorescence microscopy (Leica Microsystems, Germany) using a 20x objective and standard A4 UV filter with 17% neutral density to measure filipin fluorescence intensity, thus subjecting the cells to minimum exposure to avoid photobleaching. We observed less than 1% bleaching in fluorescence intensity per exposure (data not shown). In each experiment 20 images were acquired, and each image had 10 – 20 cells in the field. In order to avoid bias, different pairs of APOE3 and APOE4 clones were used. Thus, with three clones in each of the APOE3 and APOE4 lines, nine combinations were tested. Experiments were repeated at least twice per pair. For imaging, cellular FC content was determined using Metamorph Discovery-1 image-analysis software. Background was subtracted from each shading-corrected image by determining the fifth percentile intensity value of the image and subtracting this value from each pixel in the image. At the plating density used, all fields were 50–70% confluent in imaged areas. Next, a low threshold was applied to include all areas occupied by cells. The outline of cells using the selected values were comparable to cell outlines in transmitted light images. For the average cellular FC, the low threshold was used to measure total filipin intensity above the threshold and was divided by the number of pixels above the lower threshold for each field to yield the average filipin intensity/cell area. All data were normalized to APOE3 control within each experiment.
LDL binding assay
Isogenic APOE astrocytes were grown in serum free astrocyte media on poly-D-lysine-coated coverslip bottom of 35 mm dishes for 48 h. Astrocytes were then incubated with Alexa546-labeled LDL (Pipalia et al., 2017) for 5 min, washed with PBS and fixed with 2% PFA for 20 min. A stack of confocal images was acquired on a Zeiss LSM 880 confocal microscope using 40x oil immersion objective and a 561 nm laser. Sum projection images were generated, and total Alexa546 fluorescence intensity per cell area was quantified. As a control we treated the cells with 2.5-fold excess unlabeled LDL in presence of Alexa546-LDL to ensure that the Alexa546 signal was not non-specific.
Myelin uptake assay
Isogenic APOE astrocytes and microglia were grown in serum free media for 12 h on Matrigel coated 96 well plates. After pre-incubation for 12 h cells were treated with pHrodo-red dye (Thermo Fisher, P35364) conjugated myelin at different concentrations and live-imaged for 36 – 90 h using IncuCyte Live-Cell Analysis System. Myelin was purified from fresh autopsied control human brain using the gentleMACS Tissue Dissociator (Milteny Biotec), followed by myelin purification with myelin isolation beads (Milteny Biotec, 130–104-262) and confirmed >90% purity by FACS using an antibody for myelin basic protein (Milteny Biotec, REA1154). Purified myelin was conjugated with pHrodo-red dye following manufacturer’s guidelines. Using IncuCyte Live-Cell Analysis System, mean fluorescent intensity (MFI x µm2) was measured and normalized to cell density measured by whole cell mask.
DHE efflux assay
Dehydroergosterol (DHE) is a naturally-occurring sterol that closely mimics the behavior of cholesterol in cells and membranes (Hao et al., 2002; Maxfield and Wustner, 2012). Isogenic APOE astrocytes were plated in 2% serum containing astrocyte medium. After overnight incubation, the medium was replaced with serum free medium and incubated for an additional 24 h. Subsequently, astrocytes were pulsed with dehydroergosterol (DHE, Sigma cat. No. E2634–5MG) complexed with methyl β-cyclodextrin (MβCD) (Hao et al., 2002; Maxfield and Wustner, 2012) for 5 min and equilibrated in serum free media for 2 h and chased in serum free media supplemented with 0.5 mg/ml high density lipoprotein (HDL) for 24 h. As control cells were treated with 0.5 mg/ml HDL containing astrocytes media without DHE-MβCD treatment (images not shown). To maintain the same cell density and imaging at the same time another set of dishes were treated with DHE-MβCD complex for 5 min and equilibrated for 2 h as a 0 h timepoint performed on the same day of imaging. Cells were washed with M2 buffer (150 mM Sodium Chloride (NaCl), 20 mM HEPES, 1.3 mM Calcium Chloride (CaCl2), 5 mM Potassium Chloride, 1 mM Magnesium Chloride (MgCl2)) supplemented with 2 g/L glucose. Live cell images were acquired on widefield microscope from Leica GMBH at 40x magnification and equipped with special optics and DHE filter set (Hao et al., 2002). Images were recorded and analyzed to measure integrated DHE intensity retained in the cells. All data were normalized to APOE33 0 h time point within the experiment. Experiment was repeated 3 times.
Cholesterol efflux assay by LXR agonist treatments
Isogenic APOE astrocytes and microglia were seeded at 90% confluency on Matrigel-coated 96 well plates and maintained in growth media (2% serum for astrocytes, serum free for microglia). After 24 h, cells were washed with serum free media, loaded with fluorescently labeled cholesterol (Biovision, K582–100) that performs equivalently to radiolabeled cholesterol for 1 h and then equilibrated o/n in the incubator with light protection. Cells were treated with either cholesterol acceptors or methyl-β-cyclodextrin (MBCD) according to the manufacturers protocol using a cholesterol efflux fluorometric assay kit (Biovision, K582–100) and incubated an additional 4 – 6 h in the incubator with light protection. For LXR agonist treatments, cells were treated with 1x DMSO, 100nM GW3965 (Sigma-Aldrich, G6295), 8µM T0901317 (Sigma-Aldrich, T2320), 4 µM 25-hydroxycholesterol (Sigma-Aldrich, H1015) for 24 h with or without cholesterol acceptors. Further supernatants were transferred to flat-bottom 96 well plates, followed by fluorescent measurement at Ex/Em 485/523 nm. The adherent cells were solubilized by lysis buffer, and the lysates transferred to another 96 well plate where the fluorescence was again measured at the same wavelength. The fraction of total cholesterol was calculated by measuring RFU of supernatant normalized by the total RFU from cell lysate and supernatant.
Lysosome and cholesterol co-localization analysis
Isogenic astrocytes (20,000 cells/cm2) were plated in poly-D-lysine coated coverslip bottom dishes in serum free astrocyte medium. After 24 h incubation cells were labeled with 2 mg/ml TRITC labeled Dextran (ThermoFisher, D1818) and incubated for an additional 24 h to allow endocytosis and delivery to lysosomes (Mukherjee et al., 1997). Subsequently, dextran (70 KDa) labeled astrocytes were chased with fresh astrocyte media for 2 h, washed with PBS, fixed with 2% PFA, and stained with 50 μg/ml filipin as described above. Images were acquired on a Zeiss LSM 880, AxioObserver confocal microscope equipped with a Plan-Apochromat 63x oil DIC M27 objective and UV 405 and 561 lasers. Z-stacks were acquired using a step size equivalent to one airy unit.
The sum projected image from the stack of images were generated first and corrected for the background noise. The low threshold was applied to filipin signal in the images which represents total cellular cholesterol. The integrated intensity in low thresholded region was recorded. Next the threshold was applied to dextran positive puncta, mask was generated and transferred to filipin image. The intensity in the region under the mask was recorded representing co-localized region. The ratio of intensity under the dextran positive region and total low threshold region gives percent co-localization.
Immunohistochemistry and filipin co-staining
Fixed human postmortem tissue was sectioned on a vibratome (Leica Biosystems, Buffalo Grove, IL) at 30 µm. Sequential sections were collected and stored in PBS with 0.02% sodium azide until used. Following standard immunofluorescence protocols, free-floating sections were incubated in sodium citrate buffer (pH 6) heated at 80°C in a water bath for 30 min. Sections were then washed before blocking (TBS with 5% normal goat serum, 3% bovine serum albumin and 0.1% TritonX-100) for 1hr at room temperature. Primary antibodies of 1:2,000 GFAP (Abcam, ab194325), 1:1,500 Iba-1 (FujiFilm (Wako), 019–19741), 1:2,000 NeuN (Abcam, ab190565), 1:1,500 LAMP1 (Abcam, ab24170) were incubated at 4°C overnight under gentle motion. Sections were incubated in 37% formaldehyde at 37°C for 2 hours between incubation with primary antibodies of the same host. Secondary antibodies of Goat anti-rabbit 555 (ThermoFisher, A21428) and Goat anti-rabbit 647 (ThermoFisher, A21244) were diluted 1:1,000 and incubated for 1hr. When required, secondary antibody incubation was performed prior to incubation with formaldehyde. Filipin was prepared from powder form (Sigma Aldrich, F4767–5MG) and dissolved in DMSO at a concentration of 1mg/mL. Following the last step of immunostaining, sections were washed with PBS and free cholesterol was labeled with filipin (125 μg/ml in PBS for 1 hr at room temperature), followed by 3x wash with PBS. Tissue sections were mounted on glass slides using Fluoromount-G (ThermoFisher, 00–4958-02). Camera and microscope settings were adjusted at the start of the experiment and maintained for uniformity. Images were acquired within 24 hours using a 40x objective and standard DAPI filter on a Keyence BZ-X800 microscope. Filipin images were taken within 24 hours of staining to limit bleaching in fluorescence intensity per exposure. All tissue sections were processed within a single experiment to reduce variability.
Analysis of filipin/lysosome co-localization
Five image stacks of free cholesterol, microglia, astrocytes, and lysosomes were acquired from each post-mortem tissue sample and converted to 3D images with the surface-rendering feature of Imaris Bitplane software (version 9.7.2). In each image, a total number of 10 cells/image were analyzed. A surface render, or a mask over each channel corresponding to the different cell types, lysosomes, and filipin, was created, followed by a 3D render corresponding to the co-localization of all 3 channels. The intensity sum of this final mask was used for quantification and expressed as arbitrary units. All images were captured and analyzed by a blind observer using coded slides.
Western blot
Protein lysates were collected at 4 °C in RIPA buffer (Sigma) supplemented with protease inhibitors (10uM leupeptin, 5ug/ml pepstatin A, 3ug/ml aprotinin, 25ug/ml ALLN, and 0.5mM PMSF). Conditioned growth medium was collected at 4 °C with protease/phosphatase inhibitors (Cell Signaling) and concentrated with Amicon Ultra-15 filters (30-kDa cut-off, EMD Millipore). Total protein concentration was determined by BCA method (ThermoFisher) and equal amounts of total protein were loaded onto 8% or 4–12% Bis-Tris Plus Gels (ThermoFisher). Following electrophoresis (100 V, 1h), proteins were transferred to iBlot® 2 Transfer Stacks, nitrocellulose membranes (ThermoFisher Scientific). Blots were probed overnight at 4 °C with 1:500 anti-HMG-CoA reductase (EMD Milipore, ABS229), 1:1,000 anti-APOE (Calbiochem, 178479), 1:200 anti-SREBP2 (Abcam, 30682), 1:1,000 anti-LAMP1 (Abcam, ab24170), or 1:700 anti-ABCA1 (Abcam, ab18180) followed by 1:2,000 HRP-conjugated secondary (Goat, life technologies, 611620; Rabbit, Vector Laboratories, PI-1000; Mouse, Vector Laboratories, PI-2000, 1 h at room temperature) and visualized with WesternBright™ ECL HRP Substrate reagents (Advansta) on the UVP System.
Multiplex immunoassay and analysis
Isogenic APOE astrocytes incubated in serum free-conditioned media (20 h) were harvested with protease/phosphatase inhibitors, centrifuged (400 g, 4 min), and supernatant collected. There are no anti-inflammatory factors in the culture medium. Cell number was determined in order to load equal total protein. Samples were loaded in 96 well plates with standard controls containing cytokine/chemokine/growth factor 45-Plex Human Panel 1 (Invitrogen, ProcartaPlex) following manufacturer guidelines. Each well was loaded and quantified for each protein using the Luminex system (MAGPIX xPONENT4.2)(Cook et al., 2019). Hierarchical clustering and correlation coefficient analyses of differentially secreted proteins were performed using R.
Global screening array and analysis
Genetic variant screening was performed on a Global screening array (GSA) chip (Illumina Infinium Global Screening Array) using harvested genomic DNA (Qiagen, DNeasy Blood & Tissue Kit). To ensure high quality genotype data, samples passed the quality control (QC) metrics (SNP call rate > 95%, minor allele frequency (MAF) > 5%, Hardy-Weinberg equilibrium (HWE) p-value > 1E-6, sample call rate > 95%) were analyzed. Sample ancestry was confirmed by multidimensional scaling (MDS) using PLINK 1.9 (Chang et al., 2015); MDS values for each subject were compared to 1000 Genome Project (Phase 3) sample values (Genomes Project et al., 2015). Related samples were determined based on pair-wise identity-by-descent (IBD) estimation using PLINK. Duplicated samples with PI-HAT values between 0.99 to 1 were identified (see Table S1 and S4).
Genetic risk score analysis
Genetic risk scores (GRS) were obtained for the study line selection from GSA and Taqman genotype-based imputation results from subjects without APOE genotype. AD GWAS IGAP reference SNPs with their associated β(Lambert et al., 2013) were computed using PLINK and the following formula:
, where M is number of markers, S is β, and G is subject genotype.
We controlled the number of M = 28 from AD GWAS. The scored subjects are independent from the AD GWAS study used to generate the original weighted score.
APOE local haplotype analysis
For the haplotype analysis, the APOE region around the APOE gene that was broad enough to cover haplotypic backgrounds of each individual (APOE±50kbp) was defined. After selecting the APOE region, GSA samples of each line with the 1000 Genomes unrelated Europeans without EUR-FIN (Finnish) N=399 in 1000 Genome Project (Phase 3) (Genomes Project et al., 2015) were merged. Variant QC was included SNP call rate=100%, MAF>10%, HWE p-value>1E-6. Fifteen SNPs that were passed the QC were used in the haplotype analysis including rs3852856, rs519825, rs4803766, rs6859, rs157580, rs59007384, rs8106922, rs1160985, rs405509, rs439401, rs56131196, rs4420638, rs1132899, rs5167, and rs11083752. Haplotype phasing was performed using the MaCH program (Li et al., 2010). Haplotype names are based on the 1000 Genomes haplotypes (total 798 haplotypes after haplotype phasing) (Table S9). We defined common (frequencies>10, hap.01–23, hap.01 being the most frequent to hap.23 being the least frequent) and rare (frequencies<10, hap.other) haplotypes. Haplotype sequences that did not match with any of the 1000G haplotypes were grouped together and named as NA.
RNAseq analysis
hiPSC-derived brain cells and primary mouse glia:
Cells were harvested, stored in RNAlater, and RNA subsequently extracted from all cell types using RNeasy Mini (Qiagen) following manufacturer’s guidelines. Deep RNA sequencing (50–70 million reads per sample) was performed by UCI Genomics High-Throughput Facility for hiPSC-brain cells and by GeneWiz for mouse primary glia. The Illumina TruSeq mRNA stranded protocol was used to isolate poly-A mRNA from RNA (RNA integrity score≥9) and 200 ng was used to construct libraries that were quantified and normalized using the Library Quantification Kit (Kapa Biosystems) and sequenced as paired-end 100 bp reads on the Illumina HiSeq 4000. Paired-end sequencing reads were aligned to the hg38 genome using Star aligner (Dobin et al., 2013). Aligned and sorted bam files were loaded into IGV to verify APOE genotype (Robinson et al., 2011). FeatureCounts (Liao et al., 2014) was used to quantify gene expression based on GENCODE. Gene level read counts were normalized as Counts per Million mapped reads using trimmed mean of M-values (TMM) normalization to adjust for sequencing library variance. The ERCC spike-in control (Jiang et al., 2011) was used to adjust for sequencing batch effect. Sex effects were corrected by linear regression. Multi-dimensional scaling and cluster analysis was performed using R. Next, DEGs between different APOE genotypes within the same cell types were identified by linear model analysis using the Bioconductor package DESeq2 (Love et al., 2014). For multiple test adjustment, the false discovery rate (FDR) of the differential expression test was estimated using the Benjamini–Hochberg method(Reiner et al., 2003). To test if known gene ontology (GO) and pathways are enriched for DEGs, fast preranked gene set enrichment analysis (fGSEA) was performed using GO annotations and canonical pathways (Biocarta, KEGG and Reactome) available from the Molecular Signatures Database (MSigDB) with FDR<0.1 as a significance threshold (Subramanian et al., 2005), following 1 million gene set permutations. For mouse data, homology conversion of mouse to human DEGs are carried out, followed by fGSEA. The functional and causal network analyses were further performed by integrating DEGs of significantly enriched pathways into Ingenuity Pathway Analysis (IPA) (Kramer et al., 2014). Significantly enriched pathways and disease/functional annotations were identified (Table S2).
Human postmortem brain and deconvolution analysis:
DEG analysis on postmortem brain was stratified by region and disease severity: prefrontal cortex (PFC, BA10), superior temporal gyrus (STG, BA22), parahippocampal gyrus (PHG, BA36) and inferior frontal gyrus (IFG, BA44) (Wang et al., 2018b) and CDR (0–5), clinical phenotype (Cerebral AD, possible AD, probable AD and definite AD) and neuropathological plaque severity (normal, mild, medium and severe) and further plotted with significant pathways of FDR<0.05. For deconvolution analysis, digital sorting algorithm (DSA) (Zhong et al., 2013), population-specific expression analysis (PSEA) (Kuhn et al., 2011), and non-negative matrix factorization (ssKL) (Brunet et al., 2004) and a PCA-based method modified from CellCODE (BRETIGEA, BRain cEll Type specIfic Gene Expression Analysis) (McKenzie et al., 2018) were tested on available RNAseq data from human primary brain cells (Zhang et al., 2016), hiPSC-derived cells (TCW et al., 2017) and our dataset. Given the relatively clear cell type composition of the public data, they served as a reference to determine the best method and parameters. Each method required known brain cell type-specific markers to either infer the cell type composition or compute the composition-informative surrogate variables. While other cell type proportions were similarly determined between DSA and PSEA, PSEA did not properly estimate the neuron proportion (<10%) in whole brains. Further, ssKL failed to properly assign microglia and endothelial cells. Although PCA-based BRETIGIA appropriately measured cell type proportions, thus we used it as a reference, the vector value of the algorithm could not be applied to deconvolute gene expression. Based on the consistent results achieved using both BRETIGIA and DSA, we therefore chose DSA for deconvolution following cell type proportion determination. We used a consensus top ranked cell type-specific marker set from a recent meta-analysis of multiple cell type-specific and single cell RNAseq datasets (McKenzie et al., 2018). Performance was evaluated using a series of marker numbers (1, 3, 5, 10, up to 50). DSA (marker size 5) performed best and therefore was used in all subsequent deconvolution analyses. We used brain RNAseq data from the Mount Sinai Brain Bank AD (Wang et al., 2016) and ROSMAP(De Jager et al., 2018) cohorts (Table S6). Before cell type proportion inference, we corrected for: postmortem interval (PMI), age of death (AOD), RIN, exonic rate, race, rRNA rate, sex and batch. We deconvoluted the data for each brain region separately using csSAM (Shen-Orr et al., 2010) and subsequently performed DEG analysis between APOE4 and APOE3 in each cell type stratified by disease status measured by CDR (0, 0.5, 1, 2, 3, 4 and 5). GO and pathways enriched for DEGs were computed by fGSEA. Significantly enriched pathways were further investigated by IPA (Kramer et al., 2014). Significantly enriched pathways and disease/functional annotations were identified (Table S3).
Meta-analysis of brain cell type specific RNAseq data:
Downloaded raw RNAseq data of multiple brain cell types from gene expression omnibus (accession GSE73721) (Zhang et al., 2016) was processed using the same star-FeatureCounts pipeline described above. The gene level read counts were merged with the data generated in this project and normalized using the TMM approach and sex and batch corrected using linear regression. Hierarchical cluster analysis was performed using R.
Weighted Gene Co-expression Network Analysis (WGCNA):
Select genes for WGCNA.
Sequenced transcripts from three human cell-types, microglia, astrocytes and mixed cortical cultures from both population samples and isogenic samples, were prepared separately for network analysis with WGCNA v1.68. A total of 15,252 transcripts were filtered as follows: transcripts with a row sum less than 1 CPM for at least 90% of the libraries were removed from the data set. CPM expression values were transformed using log2(x + 1), and the 75% most variant genes were selected for network analysis. The sva v3.34.0 “ComBat” function was used to adjust for the following covariates: sex, RIN, batch, cell type proportion for mixed cortical cultures, and GRSnoAPOE (GRS-APOE locus) for population samples and individual for isogenic samples.
WGCNA network construction.
For each cell-line, a topological overlay map (TOM) was constructed from all samples combined using the “blockwiseModules” function. Pair-wise correlation values between genes were calculated using the biweight midcorrelation function, and correlation values were weighted by a soft-threshold power unique to each network. To pull significantly enriched module, a correlation dendrogram was built by average linkage hierarchical clustering, and densely interconnected genes were clustered into modules using average sensitivity, a minimum meta FDR-corrected q-value of 1E-8, and a merge cut-off unique to each network.
Module statistical analysis.
For each module in the networks, the module eigengene (ME) was calculated, which represented the expression profile of the module. A Student’s t-test was applied to detect ME differential expression between genotypes (APOE4 vs. APOE3) amongst the population and isogenic samples. Only modules with p<0.1 were considered to be differentially expressed. A Fisher’s exact test was performed for the differentially expressed modules to detect significant pathway enrichment (p<0.1) using the seq2pathway v1.18.0 R-package and the curated canonical pathways with gene symbols using MSigDB. Modules were related to APOE genotype as follows: APOE3 samples were assigned a 0 while APOE4 samples were assigned a 1. Spearman correlation values were then calculated between samples and module eigengenes. Modules with positive values (red) indicated positive correlation of MEs with APOE4 genotype, while modules with negative values (blue) indicated negative correlation of MEs with these traits.
QUANTIFICATION AND STATISTICAL ANALYSIS
Statistical analyses were performed using Prism 9 (GraphPad Software). One-way or two-way ANOVA followed by Bonferroni’s Multiple comparison post hoc test or unpaired one-tailed Student’s t tests were used. Data are represented as mean±SEM. The number of n and statistical tests were reported in each figure legend.
Supplementary Material
Table S9 A list of all APOE local haplotypes and description (sequences, frequencies, names) generated from the 1000 Genome project containing 399 Caucasian subjects with various frequencies of APOE genotype backgrounds, Related to Figure 1.
Highlights.
APOE local haplotypes are inherited in an APOE genotype-dependent manner.
Individual genetic heterogeneity outweighs APOE genotype in human microglia.
Lysosomal cholesterol sequestration disrupts lipid metabolism in human APOE4 glia.
Altered matrisome signaling in APOE4 astrocytes is uncovered by neuronal cues.
Acknowledgments
This study was funded by NIH NIA K01AG062683 (J.TCW.), New York Stem Cell Foundation (NYSCF) (J.TCW.-Drunkenmiller fellowship), NIA U01AG058635 (A.M.G), the JPB foundation (A.M.G., D.M.H.), NIA P50AG016573 (W.W.P.), Alzheimer’s Orange County AOC-207373 (W.W.P.), NINDS RF1NS090934 (D.M.H.), NIA RF1AG047644 (D.M.H.), NHLBI R01HL093324 (F.R.M.), Cure Alzheimer’s Fund (F.R.M.), NIA U01AG046170 (B.Z.), NIA RF1AG057440 (B.Z.), NIA RF1AG074010 (B.Z.), and NIA RF1AG054014 (B.Z., A.M.G.). We thank the NYSCF, Mount Sinai Stem Cell Core, Washington University in St. Louis Knight ADRC (P30AG066444) and University of California, Irvine ADRC (P30AG066519) for providing fibroblasts and hiPSCs, Jill K. Gregory for image illustration, Melanie Oaks and Seung-Ah Chung at the UCI Genomics High-Throughput Facility for RNAseq (NCRR 1S10RR025496-01, NIH OD 1S10OD010794-01 and 1S10OD021718-01), Louisa Normington (LCN Bioinformatics) for WGCNA assistance, Santiago Sole Domenech, Ana Maria Cuervo and Aurora Scrivo for lysosome and autophagic function discussion.
Footnotes
Publisher's Disclaimer: This is a PDF file of an unedited manuscript that has been accepted for publication. As a service to our customers we are providing this early version of the manuscript. The manuscript will undergo copyediting, typesetting, and review of the resulting proof before it is published in its final form. Please note that during the production process errors may be discovered which could affect the content, and all legal disclaimers that apply to the journal pertain.
Declaration of interests J.TCW. co-founded Asmos Therapeutics, LLC, serves on the scientific advisory board of NeuCyte, Inc, and has consulted for FIND Genomics Inc., CareCureSystems Corporation, TheWell Biosciences Inc., and Aleta Neuroscience, LLC. A.M.G. has consulted for Eisai, Biogen, Pfizer, AbbVie, Cognition Therapeutics and GSK, and served on the scientific advisory board at Denali Therapeutics from 2015–2018. D.M.H. co-founded and is on the scientific advisory board of C2N Diagnostics, LLC (licensed anti-tau antibody to AbbVie) and the scientific advisory board of Denali and consults for Genentech and Idorsia. F.R.M. has consulted for Denali Therapeutics in 2019. W.W.P. is a co-inventor of patent WO/2018/160496 (microglia differentiation). The authors declare no competing interests.
Inclusion and diversity statement
We worked to ensure sex balance in the selection of non-human subjects. One or more of the authors of this paper self-identifies as living with a disability.
References
- Abreu CM, Gama L, Krasemann S, Chesnut M, Odwin-Dacosta S, Hogberg HT, Hartung T, and Pamies D (2018). Microglia Increase Inflammatory Responses in iPSC-Derived Human BrainSpheres. Front Microbiol 9, 2766. [DOI] [PMC free article] [PubMed] [Google Scholar]
- Abud EM, Ramirez RN, Martinez ES, Healy LM, Nguyen CHH, Newman SA, Yeromin AV, Scarfone VM, Marsh SE, Fimbres C, et al. (2017). iPSC-Derived Human Microglia-like Cells to Study Neurological Diseases. Neuron 94, 278–293 e279. [DOI] [PMC free article] [PubMed] [Google Scholar]
- Andreone BJ, Przybyla L, Llapashtica C, Rana A, Davis SS, van Lengerich B, Lin K, Shi J, Mei Y, Astarita G, et al. (2020). Alzheimer’s-associated PLCgamma2 is a signaling node required for both TREM2 function and the inflammatory response in human microglia. Nature neuroscience [DOI] [PubMed] [Google Scholar]
- Barcia C, Ros CM, Annese V, Gomez A, Ros-Bernal F, Aguado-Yera D, Martinez-Pagan ME, de Pablos V, Fernandez-Villalba E, and Herrero MT (2011). IFN-gamma signaling, with the synergistic contribution of TNF-alpha, mediates cell specific microglial and astroglial activation in experimental models of Parkinson’s disease. Cell Death Dis 2, e142. [DOI] [PMC free article] [PubMed] [Google Scholar]
- Bardy C, van den Hurk M, Eames T, Marchand C, Hernandez RV, Kellogg M, Gorris M, Galet B, Palomares V, Brown J, et al. (2015). Neuronal medium that supports basic synaptic functions and activity of human neurons in vitro. Proc Natl Acad Sci U S A 112, E2725–2734. [DOI] [PMC free article] [PubMed] [Google Scholar]
- Blanchard JW, Bula M, Davila-Velderrain J, Akay LA, Zhu L, Frank A, Victor MB, Bonner JM, Mathys H, Lin YT, et al. (2020). Reconstruction of the human blood-brain barrier in vitro reveals a pathogenic mechanism of APOE4 in pericytes. Nat Med 26, 952–963. [DOI] [PMC free article] [PubMed] [Google Scholar]
- Bovolenta P, Fernaud-Espinosa I, Mendez-Otero R, and Nieto-Sampedro M (1997). Neurite outgrowth inhibitor of gliotic brain tissue. Mode of action and cellular localization, studied with specific monoclonal antibodies. The European journal of neuroscience 9, 977–989. [DOI] [PubMed] [Google Scholar]
- Bowles KR, TCW J, Qian L, Jadow BM, and Goate AM (2019). Reduced variability of neural progenitor cells and improved purity of neuronal cultures using magnetic activated cell sorting. PloS one 14, e0213374. [DOI] [PMC free article] [PubMed] [Google Scholar]
- Brennand K, Savas JN, Kim Y, Tran N, Simone A, Hashimoto-Torii K, Beaumont KG, Kim HJ, Topol A, Ladran I, et al. (2015). Phenotypic differences in hiPSC NPCs derived from patients with schizophrenia. Molecular psychiatry 20, 361–368. [DOI] [PMC free article] [PubMed] [Google Scholar]
- Brown MS, and Goldstein JL (2009). Cholesterol feedback: from Schoenheimer’s bottle to Scap’s MELADL. J Lipid Res 50 Suppl, S15–27. [DOI] [PMC free article] [PubMed] [Google Scholar]
- Brunet JP, Tamayo P, Golub TR, and Mesirov JP (2004). Metagenes and molecular pattern discovery using matrix factorization. Proceedings of the National Academy of Sciences of the United States of America 101, 4164–4169. [DOI] [PMC free article] [PubMed] [Google Scholar]
- Buvall L, Rashmi P, Lopez-Rivera E, Andreeva S, Weins A, Wallentin H, Greka A, and Mundel P (2013). Proteasomal degradation of Nck1 but not Nck2 regulates RhoA activation and actin dynamics. Nature communications 4, 2863. [DOI] [PMC free article] [PubMed] [Google Scholar]
- Chang CC, Chow CC, Tellier LC, Vattikuti S, Purcell SM, and Lee JJ (2015). Second-generation PLINK: rising to the challenge of larger and richer datasets. Gigascience 4, 7. [DOI] [PMC free article] [PubMed] [Google Scholar]
- Chen Y, Durakoglugil MS, Xian X, and Herz J (2010). ApoE4 reduces glutamate receptor function and synaptic plasticity by selectively impairing ApoE receptor recycling. Proceedings of the National Academy of Sciences of the United States of America 107, 12011–12016. [DOI] [PMC free article] [PubMed] [Google Scholar]
- Chung IY, and Benveniste EN (1990). Tumor necrosis factor-alpha production by astrocytes. Induction by lipopolysaccharide, IFN-gamma, and IL-1 beta. Journal of immunology 144, 2999–3007. [PubMed] [Google Scholar]
- Clarke DL, Clifford RL, Jindarat S, Proud D, Pang L, Belvisi M, and Knox AJ (2010). TNFalpha and IFNgamma synergistically enhance transcriptional activation of CXCL10 in human airway smooth muscle cells via STAT-1, NF-kappaB, and the transcriptional coactivator CREB-binding protein. The Journal of biological chemistry 285, 29101–29110. [DOI] [PMC free article] [PubMed] [Google Scholar]
- Cook DB, McLucas BC, Montoya LA, Brotski CM, Das S, Miholits M, and Sebata TH (2019). Multiplexing protein and gene level measurements on a single Luminex platform. Methods 158, 27–32. [DOI] [PubMed] [Google Scholar]
- De Jager PL, Ma Y, McCabe C, Xu J, Vardarajan BN, Felsky D, Klein HU, White CC, Peters MA, Lodgson B, et al. (2018). A multi-omic atlas of the human frontal cortex for aging and Alzheimer’s disease research. Sci Data 5, 180142. [DOI] [PMC free article] [PubMed] [Google Scholar]
- Dobin A, Davis CA, Schlesinger F, Drenkow J, Zaleski C, Jha S, Batut P, Chaisson M, and Gingeras TR (2013). STAR: ultrafast universal RNA-seq aligner. Bioinformatics 29, 15–21. [DOI] [PMC free article] [PubMed] [Google Scholar]
- Dove DE, Linton MF, and Fazio S (2005). ApoE-mediated cholesterol efflux from macrophages: separation of autocrine and paracrine effects. Am J Physiol Cell Physiol 288, C586–592. [DOI] [PubMed] [Google Scholar]
- Dzyubenko E, Gottschling C, and Faissner A (2016). Neuron-Glia Interactions in Neural Plasticity: Contributions of Neural Extracellular Matrix and Perineuronal Nets. Neural Plast 2016, 5214961. [DOI] [PMC free article] [PubMed] [Google Scholar]
- Galatro TF, Holtman IR, Lerario AM, Vainchtein ID, Brouwer N, Sola PR, Veras MM, Pereira TF, Leite REP, Moller T, et al. (2017). Transcriptomic analysis of purified human cortical microglia reveals age-associated changes. Nat Neurosci 20, 1162–1171. [DOI] [PubMed] [Google Scholar]
- Geirsdottir L, David E, Keren-Shaul H, Weiner A, Bohlen SC, Neuber J, Balic A, Giladi A, Sheban F, Dutertre CA, et al. (2020). Cross-Species Single-Cell Analysis Reveals Divergence of the Primate Microglia Program. Cell 181, 746. [DOI] [PubMed] [Google Scholar]
- Genin E, Hannequin D, Wallon D, Sleegers K, Hiltunen M, Combarros O, Bullido MJ, Engelborghs S, De Deyn P, Berr C, et al. (2011). APOE and Alzheimer disease: a major gene with semi-dominant inheritance. Molecular psychiatry 16, 903–907. [DOI] [PMC free article] [PubMed] [Google Scholar]
- Genomes Project C, Auton A, Brooks LD, Durbin RM, Garrison EP, Kang HM, Korbel JO, Marchini JL, McCarthy S, McVean GA, et al. (2015). A global reference for human genetic variation. Nature 526, 68–74. [DOI] [PMC free article] [PubMed] [Google Scholar]
- Germain PL, and Testa G (2017). Taming Human Genetic Variability: Transcriptomic Meta-Analysis Guides the Experimental Design and Interpretation of iPSC-Based Disease Modeling. Stem cell reports 8, 1784–1796. [DOI] [PMC free article] [PubMed] [Google Scholar]
- Gitik M, Liraz-Zaltsman S, Oldenborg PA, Reichert F, and Rotshenker S (2011). Myelin down-regulates myelin phagocytosis by microglia and macrophages through interactions between CD47 on myelin and SIRPalpha (signal regulatory protein-alpha) on phagocytes. J Neuroinflammation 8, 24. [DOI] [PMC free article] [PubMed] [Google Scholar]
- Gong JS, Kobayashi M, Hayashi H, Zou K, Sawamura N, Fujita SC, Yanagisawa K, and Michikawa M (2002). Apolipoprotein E (ApoE) isoform-dependent lipid release from astrocytes prepared from human ApoE3 and ApoE4 knock-in mice. The Journal of biological chemistry 277, 29919–29926. [DOI] [PubMed] [Google Scholar]
- Guerreiro R, Wojtas A, Bras J, Carrasquillo M, Rogaeva E, Majounie E, Cruchaga C, Sassi C, Kauwe JS, Younkin S, et al. (2013). TREM2 variants in Alzheimer’s disease. N Engl J Med 368, 117–127. [DOI] [PMC free article] [PubMed] [Google Scholar]
- Habib N, McCabe C, Medina S, Varshavsky M, Kitsberg D, Dvir-Szternfeld R, Green G, Dionne D, Nguyen L, Marshall JL, et al. (2020). Disease-associated astrocytes in Alzheimer’s disease and aging. Nature neuroscience 23, 701–706. [DOI] [PMC free article] [PubMed] [Google Scholar]
- Hao M, Lin SX, Karylowski OJ, Wustner D, McGraw TE, and Maxfield FR (2002). Vesicular and non-vesicular sterol transport in living cells. The endocytic recycling compartment is a major sterol storage organelle. The Journal of biological chemistry 277, 609–617. [DOI] [PubMed] [Google Scholar]
- Hoffman GE, and Roussos P (2020). dream: Powerful differential expression analysis for repeated measures designs. Bioinformatics [DOI] [PMC free article] [PubMed] [Google Scholar]
- Holtzman DM, Bales KR, Tenkova T, Fagan AM, Parsadanian M, Sartorius LJ, Mackey B, Olney J, McKeel D, Wozniak D, et al. (2000). Apolipoprotein E isoform-dependent amyloid deposition and neuritic degeneration in a mouse model of Alzheimer’s disease. Proceedings of the National Academy of Sciences of the United States of America 97, 2892–2897. [DOI] [PMC free article] [PubMed] [Google Scholar]
- Huang Y, von Eckardstein A, Wu S, and Assmann G (1995). Effects of the apolipoprotein E polymorphism on uptake and transfer of cell-derived cholesterol in plasma. J Clin Invest 96, 2693–2701. [DOI] [PMC free article] [PubMed] [Google Scholar]
- Hyman BT, Phelps CH, Beach TG, Bigio EH, Cairns NJ, Carrillo MC, Dickson DW, Duyckaerts C, Frosch MP, Masliah E, et al. (2012). National Institute on Aging-Alzheimer’s Association guidelines for the neuropathologic assessment of Alzheimer’s disease. Alzheimers Dement 8, 1–13. [DOI] [PMC free article] [PubMed] [Google Scholar]
- Jakobsson M, Scholz SW, Scheet P, Gibbs JR, VanLiere JM, Fung HC, Szpiech ZA, Degnan JH, Wang K, Guerreiro R, et al. (2008). Genotype, haplotype and copy-number variation in worldwide human populations. Nature 451, 998–1003. [DOI] [PubMed] [Google Scholar]
- Jiang L, Schlesinger F, Davis CA, Zhang Y, Li R, Salit M, Gingeras TR, and Oliver B (2011). Synthetic spike-in standards for RNA-seq experiments. Genome research 21, 1543–1551. [DOI] [PMC free article] [PubMed] [Google Scholar]
- Jonsson T, Stefansson H, Steinberg S, Jonsdottir I, Jonsson PV, Snaedal J, Bjornsson S, Huttenlocher J, Levey AI, Lah JJ, et al. (2013). Variant of TREM2 associated with the risk of Alzheimer’s disease. N Engl J Med 368, 107–116. [DOI] [PMC free article] [PubMed] [Google Scholar]
- Karch CM, and Goate AM (2015). Alzheimer’s disease risk genes and mechanisms of disease pathogenesis. Biological psychiatry 77, 43–51. [DOI] [PMC free article] [PubMed] [Google Scholar]
- Katia de Paiva Lopes GJLS, Humphrey Jack, Allan Amanda, Sneeboer Marjolein, Navarro Elisa, Schilder Brian M., Vialle Ricardo A., Parks Madison, Missall Roy, van Zuiden Welmoed, Gigase Frederieke, Kübler Raphael, van Berlekom Amber Berdenis, Böttcher Chotima, Priller Josef, Kahn René S., de Witte Lot D., Raj Towfique (2020). Atlas of genetic effects in human microglia transcriptome across brain regions, aging and disease pathologies. bioRxiv [DOI] [PMC free article] [PubMed] [Google Scholar]
- Kerchner GA, Berdnik D, Shen JC, Bernstein JD, Fenesy MC, Deutsch GK, Wyss-Coray T, and Rutt BK (2014). APOE epsilon4 worsens hippocampal CA1 apical neuropil atrophy and episodic memory. Neurology 82, 691–697. [DOI] [PMC free article] [PubMed] [Google Scholar]
- Keren-Shaul H, Spinrad A, Weiner A, Matcovitch-Natan O, Dvir-Szternfeld R, Ulland TK, David E, Baruch K, Lara-Astaiso D, Toth B, et al. (2017). A Unique Microglia Type Associated with Restricting Development of Alzheimer’s Disease. Cell 169, 1276–1290 e1217. [DOI] [PubMed] [Google Scholar]
- Kim S, Kim D, Cho SW, Kim J, and Kim JS (2014). Highly efficient RNA-guided genome editing in human cells via delivery of purified Cas9 ribonucleoproteins. Genome Res 24, 1012–1019. [DOI] [PMC free article] [PubMed] [Google Scholar]
- Knouff C, Hinsdale ME, Mezdour H, Altenburg MK, Watanabe M, Quarfordt SH, Sullivan PM, and Maeda N (1999). Apo E structure determines VLDL clearance and atherosclerosis risk in mice. J Clin Invest 103, 1579–1586. [DOI] [PMC free article] [PubMed] [Google Scholar]
- Kramer A, Green J, Pollard J Jr., and Tugendreich S (2014). Causal analysis approaches in Ingenuity Pathway Analysis. Bioinformatics 30, 523–530. [DOI] [PMC free article] [PubMed] [Google Scholar]
- Krasemann S, Madore C, Cialic R, Baufeld C, Calcagno N, El Fatimy R, Beckers L, O’Loughlin E, Xu Y, Fanek Z, et al. (2017). The TREM2-APOE Pathway Drives the Transcriptional Phenotype of Dysfunctional Microglia in Neurodegenerative Diseases. Immunity 47, 566–581 e569. [DOI] [PMC free article] [PubMed] [Google Scholar]
- Kuhn A, Thu D, Waldvogel HJ, Faull RL, and Luthi-Carter R (2011). Population-specific expression analysis (PSEA) reveals molecular changes in diseased brain. Nature methods 8, 945–947. [DOI] [PubMed] [Google Scholar]
- Kunkle BW, Grenier-Boley B, Sims R, Bis JC, Damotte V, Naj AC, Boland A, Vronskaya M, van der Lee SJ, Amlie-Wolf A, et al. (2019). Genetic meta-analysis of diagnosed Alzheimer’s disease identifies new risk loci and implicates Abeta, tau, immunity and lipid processing. Nat Genet 51, 414–430. [DOI] [PMC free article] [PubMed] [Google Scholar]
- Lambert JC, Ibrahim-Verbaas CA, Harold D, Naj AC, Sims R, Bellenguez C, DeStafano AL, Bis JC, Beecham GW, Grenier-Boley B, et al. (2013). Meta-analysis of 74,046 individuals identifies 11 new susceptibility loci for Alzheimer’s disease. Nat Genet 45, 1452–1458. [DOI] [PMC free article] [PubMed] [Google Scholar]
- Langfelder P, and Horvath S (2008). WGCNA: an R package for weighted correlation network analysis. BMC bioinformatics 9, 559. [DOI] [PMC free article] [PubMed] [Google Scholar]
- Lapasset L, Milhavet O, Prieur A, Besnard E, Babled A, Ait-Hamou N, Leschik J, Pellestor F, Ramirez JM, De Vos J, et al. (2011). Rejuvenating senescent and centenarian human cells by reprogramming through the pluripotent state. Genes Dev 25, 2248–2253. [DOI] [PMC free article] [PubMed] [Google Scholar]
- Li J, Pan L, Pembroke WG, Rexach JE, Godoy MI, Condro MC, Alvarado AG, Harteni M, Chen YW, Stiles L, et al. (2021). Conservation and divergence of vulnerability and responses to stressors between human and mouse astrocytes. Nature communications 12, 3958. [DOI] [PMC free article] [PubMed] [Google Scholar]
- Li J, and Pfeffer SR (2016). Lysosomal membrane glycoproteins bind cholesterol and contribute to lysosomal cholesterol export. eLife 5. [DOI] [PMC free article] [PubMed] [Google Scholar]
- Li Y, Willer CJ, Ding J, Scheet P, and Abecasis GR (2010). MaCH: using sequence and genotype data to estimate haplotypes and unobserved genotypes. Genet Epidemiol 34, 816–834. [DOI] [PMC free article] [PubMed] [Google Scholar]
- Liao Y, Smyth GK, and Shi W (2014). featureCounts: an efficient general purpose program for assigning sequence reads to genomic features. Bioinformatics 30, 923–930. [DOI] [PubMed] [Google Scholar]
- Lim ET, Chan Y, Burns MJ, Guo X, Erdin S, Tai DJC, Reichert JM, Chan YK, Chiang JJ, Meyers K, et al. (2020). Identifying cell type specific driver genes in autism-associated copy number loci from cerebral organoids. bioRxiv [Google Scholar]
- Lin YT, Seo J, Gao F, Feldman HM, Wen HL, Penney J, Cam HP, Gjoneska E, Raja WK, Cheng J, et al. (2018). APOE4 Causes Widespread Molecular and Cellular Alterations Associated with Alzheimer’s Disease Phenotypes in Human iPSC-Derived Brain Cell Types. Neuron 98, 1294. [DOI] [PMC free article] [PubMed] [Google Scholar]
- Lippmann ES, Al-Ahmad A, Azarin SM, Palecek SP, and Shusta EV (2014). A retinoic acid-enhanced, multicellular human blood-brain barrier model derived from stem cell sources. Sci Rep 4, 4160. [DOI] [PMC free article] [PubMed] [Google Scholar]
- Lippmann ES, Azarin SM, Kay JE, Nessler RA, Wilson HK, Al-Ahmad A, Palecek SP, and Shusta EV (2012). Derivation of blood-brain barrier endothelial cells from human pluripotent stem cells. Nature biotechnology 30, 783–791. [DOI] [PMC free article] [PubMed] [Google Scholar]
- Liu M, Bian C, Zhang J, and Wen F (2014). Apolipoprotein E gene polymorphism and Alzheimer’s disease in Chinese population: a meta-analysis. Scientific reports 4, 4383. [DOI] [PMC free article] [PubMed] [Google Scholar]
- Lopez CA, de Vries AH, and Marrink SJ (2011). Molecular mechanism of cyclodextrin mediated cholesterol extraction. PLoS Comput Biol 7, e1002020. [DOI] [PMC free article] [PubMed] [Google Scholar]
- Love MI, Huber W, and Anders S (2014). Moderated estimation of fold change and dispersion for RNA-seq data with DESeq2. Genome biology 15, 550. [DOI] [PMC free article] [PubMed] [Google Scholar]
- Maherali N, Sridharan R, Xie W, Utikal J, Eminli S, Arnold K, Stadtfeld M, Yachechko R, Tchieu J, Jaenisch R, et al. (2007). Directly reprogrammed fibroblasts show global epigenetic remodeling and widespread tissue contribution. Cell stem cell 1, 55–70. [DOI] [PubMed] [Google Scholar]
- Majumdar A, Cruz D, Asamoah N, Buxbaum A, Sohar I, Lobel P, and Maxfield FR (2007). Activation of microglia acidifies lysosomes and leads to degradation of Alzheimer amyloid fibrils. Mol Biol Cell 18, 1490–1496. [DOI] [PMC free article] [PubMed] [Google Scholar]
- Maloney B, Ge YW, Alley GM, and Lahiri DK (2007). Important differences between human and mouse APOE gene promoters: limitation of mouse APOE model in studying Alzheimer’s disease. Journal of neurochemistry 103, 1237–1257. [DOI] [PubMed] [Google Scholar]
- Maxfield FR, and Wustner D (2012). Analysis of cholesterol trafficking with fluorescent probes. Methods Cell Biol 108, 367–393. [DOI] [PMC free article] [PubMed] [Google Scholar]
- McKenzie AT, Wang M, Hauberg ME, Fullard JF, Kozlenkov A, Keenan A, Hurd YL, Dracheva S, Casaccia P, Roussos P, et al. (2018). Brain Cell Type Specific Gene Expression and Co-expression Network Architectures. Scientific reports 8, 8868. [DOI] [PMC free article] [PubMed] [Google Scholar]
- Mertens J, Herdy JR, Traxler L, Schafer ST, Schlachetzki JCM, Bohnke L, Reid DA, Lee H, Zangwill D, Fernandes DP, et al. (2021). Age-dependent instability of mature neuronal fate in induced neurons from Alzheimer’s patients. Cell stem cell 28, 1533–1548 e1536. [DOI] [PMC free article] [PubMed] [Google Scholar]
- Michikawa M, Fan QW, Isobe I, and Yanagisawa K (2000). Apolipoprotein E exhibits isoform-specific promotion of lipid efflux from astrocytes and neurons in culture. Journal of neurochemistry 74, 1008–1016. [DOI] [PubMed] [Google Scholar]
- Mitchell JM, Nemesh J, Ghosh S, Handsaker RE, Mello CJ, Meyer D, Raghunathan K, de Rivera H, Tegtmeyer M, Hawes D, et al. (2020). Mapping genetic effects on cellular phenotypes with “cell villages”. bioRxiv [Google Scholar]
- Montagne A, Nation DA, Sagare AP, Barisano G, Sweeney MD, Chakhoyan A, Pachicano M, Joe E, Nelson AR, D’Orazio LM, et al. (2020). APOE4 leads to blood-brain barrier dysfunction predicting cognitive decline. Nature 581, 71–76. [DOI] [PMC free article] [PubMed] [Google Scholar]
- Montine TJ, Phelps CH, Beach TG, Bigio EH, Cairns NJ, Dickson DW, Duyckaerts C, Frosch MP, Masliah E, Mirra SS, et al. (2012). National Institute on Aging-Alzheimer’s Association guidelines for the neuropathologic assessment of Alzheimer’s disease: a practical approach. Acta Neuropathol 123, 1–11. [DOI] [PMC free article] [PubMed] [Google Scholar]
- Mooren OL, Galletta BJ, and Cooper JA (2012). Roles for actin assembly in endocytosis. Annu Rev Biochem 81, 661–686. [DOI] [PubMed] [Google Scholar]
- Mukherjee S, Ghosh RN, and Maxfield FR (1997). Endocytosis. Physiol Rev 77, 759–803. [DOI] [PubMed] [Google Scholar]
- Muller C, Junker J, Bracher F, and Giera M (2019). A gas chromatography-mass spectrometry-based whole-cell screening assay for target identification in distal cholesterol biosynthesis. Nature protocols 14, 2546–2570. [DOI] [PubMed] [Google Scholar]
- Naba A, Clauser KR, Ding H, Whittaker CA, Carr SA, and Hynes RO (2016). The extracellular matrix: Tools and insights for the “omics” era. Matrix Biol 49, 10–24. [DOI] [PMC free article] [PubMed] [Google Scholar]
- Naba A, Clauser KR, Hoersch S, Liu H, Carr SA, and Hynes RO (2012). The matrisome: in silico definition and in vivo characterization by proteomics of normal and tumor extracellular matrices. Mol Cell Proteomics 11, M111 014647. [DOI] [PMC free article] [PubMed] [Google Scholar]
- Novikova G, Kapoor M, TCW J, Abud EM, Efthymiou AG, Chen SX, Cheng H, Fullard JF, Bendl J, Liu Y, et al. (2021). Integration of Alzheimer’s disease genetics and myeloid genomics identifies disease risk regulatory elements and genes. Nat Commun 12, 1610. [DOI] [PMC free article] [PubMed] [Google Scholar]
- Nugent AA, Lin K, van Lengerich B, Lianoglou S, Przybyla L, Davis SS, Llapashtica C, Wang J, Kim DJ, Xia D, et al. (2020). TREM2 Regulates Microglial Cholesterol Metabolism upon Chronic Phagocytic Challenge. Neuron 105, 837–854 e839. [DOI] [PubMed] [Google Scholar]
- Paquet D, Kwart D, Chen A, Sproul A, Jacob S, Teo S, Olsen KM, Gregg A, Noggle S, and Tessier-Lavigne M (2016). Efficient introduction of specific homozygous and heterozygous mutations using CRISPR/Cas9. Nature 533, 125–129. [DOI] [PubMed] [Google Scholar]
- Parcon PA, Balasubramaniam M, Ayyadevara S, Jones RA, Liu L, Shmookler Reis RJ, Barger SW, Mrak RE, and Griffin WST (2018). Apolipoprotein E4 inhibits autophagy gene products through direct, specific binding to CLEAR motifs. Alzheimers Dement 14, 230–242. [DOI] [PMC free article] [PubMed] [Google Scholar]
- Park H, Chan MM, and Iritani BM (2010). Hem-1: putting the “WAVE” into actin polymerization during an immune response. FEBS Lett 584, 4923–4932. [DOI] [PMC free article] [PubMed] [Google Scholar]
- Peng D, Hiipakka RA, Xie JT, Dai Q, Kokontis JM, Reardon CA, Getz GS, and Liao S (2011). A novel potent synthetic steroidal liver X receptor agonist lowers plasma cholesterol and triglycerides and reduces atherosclerosis in LDLR(−/−) mice. Br J Pharmacol 162, 1792–1804. [DOI] [PMC free article] [PubMed] [Google Scholar]
- Pike CJ, Cummings BJ, and Cotman CW (1995). Early association of reactive astrocytes with senile plaques in Alzheimer’s disease. Experimental neurology 132, 172–179. [DOI] [PubMed] [Google Scholar]
- Pipalia NH, Cosner CC, Huang A, Chatterjee A, Bourbon P, Farley N, Helquist P, Wiest O, and Maxfield FR (2011). Histone deacetylase inhibitor treatment dramatically reduces cholesterol accumulation in Niemann-Pick type C1 mutant human fibroblasts. Proceedings of the National Academy of Sciences of the United States of America 108, 5620–5625. [DOI] [PMC free article] [PubMed] [Google Scholar]
- Pipalia NH, Subramanian K, Mao S, Ralph H, Hutt DM, Scott SM, Balch WE, and Maxfield FR (2017). Histone deacetylase inhibitors correct the cholesterol storage defect in most Niemann-Pick C1 mutant cells. Journal of lipid research 58, 695–708. [DOI] [PMC free article] [PubMed] [Google Scholar]
- Rajabli F, Feliciano BE, Celis K, Hamilton-Nelson KL, Whitehead PL, Adams LD, Bussies PL, Manrique CP, Rodriguez A, Rodriguez V, et al. (2018). Ancestral origin of ApoE epsilon4 Alzheimer disease risk in Puerto Rican and African American populations. PLoS Genet 14, e1007791. [DOI] [PMC free article] [PubMed] [Google Scholar]
- Ramos DM, Skarnes WC, Singleton AB, Cookson MR, and Ward ME (2021). Tackling neurodegenerative diseases with genomic engineering: A new stem cell initiative from the NIH. Neuron 109, 1080–1083. [DOI] [PMC free article] [PubMed] [Google Scholar]
- Ran FA, Hsu PD, Wright J, Agarwala V, Scott DA, and Zhang F (2013). Genome engineering using the CRISPR-Cas9 system. Nature protocols 8, 2281–2308. [DOI] [PMC free article] [PubMed] [Google Scholar]
- Reiner A, Yekutieli D, and Benjamini Y (2003). Identifying differentially expressed genes using false discovery rate controlling procedures. Bioinformatics 19, 368–375. [DOI] [PubMed] [Google Scholar]
- Riddell DR, Zhou H, Atchison K, Warwick HK, Atkinson PJ, Jefferson J, Xu L, Aschmies S, Kirksey Y, Hu Y, et al. (2008). Impact of apolipoprotein E (ApoE) polymorphism on brain ApoE levels. The Journal of neuroscience : the official journal of the Society for Neuroscience 28, 11445–11453. [DOI] [PMC free article] [PubMed] [Google Scholar]
- Robinson JT, Thorvaldsdottir H, Winckler W, Guttman M, Lander ES, Getz G, and Mesirov JP (2011). Integrative genomics viewer. Nature biotechnology 29, 24–26. [DOI] [PMC free article] [PubMed] [Google Scholar]
- Rozario T, and DeSimone DW (2010). The extracellular matrix in development and morphogenesis: a dynamic view. Developmental biology 341, 126–140. [DOI] [PMC free article] [PubMed] [Google Scholar]
- Saeed U, Mirza SS, MacIntosh BJ, Herrmann N, Keith J, Ramirez J, Nestor SM, Yu Q, Knight J, Swardfager W, et al. (2018). APOE-epsilon4 associates with hippocampal volume, learning, and memory across the spectrum of Alzheimer’s disease and dementia with Lewy bodies. Alzheimers Dement 14, 1137–1147. [DOI] [PubMed] [Google Scholar]
- Schmidt K, Hughes C, Chudek JA, Goodyear SR, Aspden RM, Talbot R, Gundersen TE, Blomhoff R, Henderson C, Wolf CR, et al. (2009). Cholesterol metabolism: the main pathway acting downstream of cytochrome P450 oxidoreductase in skeletal development of the limb. Mol Cell Biol 29, 2716–2729. [DOI] [PMC free article] [PubMed] [Google Scholar]
- Schneider CA, Rasband WS, and Eliceiri KW (2012). NIH Image to ImageJ: 25 years of image analysis. Nature methods 9, 671–675. [DOI] [PMC free article] [PubMed] [Google Scholar]
- Schulze H, and Sandhoff K (2011). Lysosomal lipid storage diseases. Cold Spring Harbor perspectives in biology 3. [DOI] [PMC free article] [PubMed] [Google Scholar]
- Selkoe DJ (2003). Toward a remembrance of things past: deciphering Alzheimer disease. Harvey lectures 99, 23–45. [PubMed] [Google Scholar]
- Shen-Orr SS, Tibshirani R, Khatri P, Bodian DL, Staedtler F, Perry NM, Hastie T, Sarwal MM, Davis MM, and Butte AJ (2010). Cell type-specific gene expression differences in complex tissues. Nature methods 7, 287–289. [DOI] [PMC free article] [PubMed] [Google Scholar]
- Shi Y, Yamada K, Liddelow SA, Smith ST, Zhao L, Luo W, Tsai RM, Spina S, Grinberg LT, Rojas JC, et al. (2017). ApoE4 markedly exacerbates tau-mediated neurodegeneration in a mouse model of tauopathy. Nature 549, 523–527. [DOI] [PMC free article] [PubMed] [Google Scholar]
- Shiratori Y, Okwu AK, and Tabas I (1994). Free cholesterol loading of macrophages stimulates phosphatidylcholine biosynthesis and up-regulation of CTP: phosphocholine cytidylyltransferase. The Journal of biological chemistry 269, 11337–11348. [PubMed] [Google Scholar]
- Sienski G, Narayan P, Bonner JM, Kory N, Boland S, Arczewska AA, Ralvenius WT, Akay L, Lockshin E, He L, et al. (2021). APOE4 disrupts intracellular lipid homeostasis in human iPSC-derived glia. Science translational medicine 13. [DOI] [PMC free article] [PubMed] [Google Scholar]
- Srinivasan K, Friedman BA, Etxeberria A, Huntley MA, van der Brug MP, Foreman O, Paw JS, Modrusan Z, Beach TG, Serrano GE, et al. (2020). Alzheimer’s Patient Microglia Exhibit Enhanced Aging and Unique Transcriptional Activation. Cell Rep 31, 107843. [DOI] [PMC free article] [PubMed] [Google Scholar]
- Subramanian A, Tamayo P, Mootha VK, Mukherjee S, Ebert BL, Gillette MA, Paulovich A, Pomeroy SL, Golub TR, Lander ES, et al. (2005). Gene set enrichment analysis: a knowledge-based approach for interpreting genome-wide expression profiles. Proc Natl Acad Sci U S A 102, 15545–15550. [DOI] [PMC free article] [PubMed] [Google Scholar]
- Sullivan PM, Mezdour H, Aratani Y, Knouff C, Najib J, Reddick RL, Quarfordt SH, and Maeda N (1997). Targeted replacement of the mouse apolipoprotein E gene with the common human APOE3 allele enhances diet-induced hypercholesterolemia and atherosclerosis. The Journal of biological chemistry 272, 17972–17980. [DOI] [PubMed] [Google Scholar]
- Tai LM, Youmans KL, Jungbauer L, Yu C, and Ladu MJ (2011). Introducing Human APOE into Abeta Transgenic Mouse Models. Int J Alzheimers Dis 2011, 810981. [DOI] [PMC free article] [PubMed] [Google Scholar]
- Tang MX, Stern Y, Marder K, Bell K, Gurland B, Lantigua R, Andrews H, Feng L, Tycko B, and Mayeux R (1998). The APOE-epsilon4 allele and the risk of Alzheimer disease among African Americans, whites, and Hispanics. JAMA 279, 751–755. [DOI] [PubMed] [Google Scholar]
- TCW J, Wang M, Pimenova AA, Bowles KR, Hartley BJ, Lacin E, Machlovi SI, Abdelaal R, Karch CM, Phatnani H, et al. (2017). An Efficient Platform for Astrocyte Differentiation from Human Induced Pluripotent Stem Cells. Stem Cell Reports 9, 600–614. [DOI] [PMC free article] [PubMed] [Google Scholar]
- Waltl S, Patankar JV, Fauler G, Nusshold C, Ullen A, Eibinger G, Wintersperger A, Kratky D, Malle E, and Sattler W (2013). 25-Hydroxycholesterol regulates cholesterol homeostasis in the murine CATH.a neuronal cell line. Neurosci Lett 539, 16–21. [DOI] [PMC free article] [PubMed] [Google Scholar]
- Wang C, Najm R, Xu Q, Jeong DE, Walker D, Balestra ME, Yoon SY, Yuan H, Li G, Miller ZA, et al. (2018a). Gain of toxic apolipoprotein E4 effects in human iPSC-derived neurons is ameliorated by a small-molecule structure corrector. Nature medicine 24, 647–657. [DOI] [PMC free article] [PubMed] [Google Scholar]
- Wang C, Xiong M, Gratuze M, Bao X, Shi Y, Andhey PS, Manis M, Schroeder C, Yin Z, Madore C, et al. (2021). Selective removal of astrocytic APOE4 strongly protects against tau-mediated neurodegeneration and decreases synaptic phagocytosis by microglia. Neuron 109, 1657–1674 e1657. [DOI] [PMC free article] [PubMed] [Google Scholar]
- Wang M, Beckmann ND, Roussos P, Wang E, Zhou X, Wang Q, Ming C, Neff R, Ma W, Fullard JF, et al. (2018b). The Mount Sinai cohort of large-scale genomic, transcriptomic and proteomic data in Alzheimer’s disease. Scientific Data 5, 180185. [DOI] [PMC free article] [PubMed] [Google Scholar]
- Wang M, Roussos P, McKenzie A, Zhou X, Kajiwara Y, Brennand KJ, De Luca GC, Crary JF, Casaccia P, Buxbaum JD, et al. (2016). Integrative network analysis of nineteen brain regions identifies molecular signatures and networks underlying selective regional vulnerability to Alzheimer’s disease. Genome medicine 8, 104. [DOI] [PMC free article] [PubMed] [Google Scholar]
- Wang WY, Tan MS, Yu JT, and Tan L (2015). Role of pro-inflammatory cytokines released from microglia in Alzheimer’s disease. Ann Transl Med 3, 136. [DOI] [PMC free article] [PubMed] [Google Scholar]
- Wu G, Aoyama C, Young SG, and Vance DE (2008). Early embryonic lethality caused by disruption of the gene for choline kinase alpha, the first enzyme in phosphatidylcholine biosynthesis. The Journal of biological chemistry 283, 1456–1462. [DOI] [PMC free article] [PubMed] [Google Scholar]
- Xu Q, Bernardo A, Walker D, Kanegawa T, Mahley RW, and Huang Y (2006). Profile and regulation of apolipoprotein E (ApoE) expression in the CNS in mice with targeting of green fluorescent protein gene to the ApoE locus. J Neurosci 26, 4985–4994. [DOI] [PMC free article] [PubMed] [Google Scholar]
- Yamazaki Y, Shinohara M, Yamazaki A, Ren Y, Asmann YW, Kanekiyo T, and Bu G (2020). ApoE (Apolipoprotein E) in Brain Pericytes Regulates Endothelial Function in an Isoform-Dependent Manner by Modulating Basement Membrane Components. Arterioscler Thromb Vasc Biol 40, 128–144. [DOI] [PMC free article] [PubMed] [Google Scholar]
- Zhang J, Cai S, Peterson BR, Kris-Etherton PM, and Heuvel JP (2011). Development of a cell-based, high-throughput screening assay for cholesterol efflux using a fluorescent mimic of cholesterol. Assay Drug Dev Technol 9, 136–146. [DOI] [PMC free article] [PubMed] [Google Scholar]
- Zhang SH, Reddick RL, Piedrahita JA, and Maeda N (1992). Spontaneous hypercholesterolemia and arterial lesions in mice lacking apolipoprotein E. Science 258, 468–471. [DOI] [PubMed] [Google Scholar]
- Zhang Y, Sloan SA, Clarke LE, Caneda C, Plaza CA, Blumenthal PD, Vogel H, Steinberg GK, Edwards MS, Li G, et al. (2016). Purification and Characterization of Progenitor and Mature Human Astrocytes Reveals Transcriptional and Functional Differences with Mouse. Neuron 89, 37–53. [DOI] [PMC free article] [PubMed] [Google Scholar]
- Zhao J, Fu Y, Yamazaki Y, Ren Y, Davis MD, Liu CC, Lu W, Wang X, Chen K, Cherukuri Y, et al. (2020a). APOE4 exacerbates synapse loss and neurodegeneration in Alzheimer’s disease patient iPSC-derived cerebral organoids. Nature communications 11, 5540. [DOI] [PMC free article] [PubMed] [Google Scholar]
- Zhao N, Ren Y, Yamazaki Y, Qiao W, Li F, Felton LM, Mahmoudiandehkordi S, Kueider-Paisley A, Sonoustoun B, Arnold M, et al. (2020b). Alzheimer’s Risk Factors Age, APOE Genotype, and Sex Drive Distinct Molecular Pathways. Neuron 106, 727–742 e726. [DOI] [PMC free article] [PubMed] [Google Scholar]
- Zhong Y, Wan YW, Pang K, Chow LM, and Liu Z (2013). Digital sorting of complex tissues for cell type-specific gene expression profiles. BMC bioinformatics 14, 89. [DOI] [PMC free article] [PubMed] [Google Scholar]
- Zhou X, Chen Y, Mok KY, Kwok TCY, Mok VCT, Guo Q, Ip FC, Chen Y, Mullapudi N, Alzheimer’s Disease Neuroimaging, I., et al. (2019). Non-coding variability at the APOE locus contributes to the Alzheimer’s risk. Nature communications 10, 3310. [DOI] [PMC free article] [PubMed] [Google Scholar]
- Zhou Y, Song WM, Andhey PS, Swain A, Levy T, Miller KR, Poliani PL, Cominelli M, Grover S, Gilfillan S, et al. (2020). Human and mouse single-nucleus transcriptomics reveal TREM2-dependent and TREM2-independent cellular responses in Alzheimer’s disease. Nature medicine 26, 131–142. [DOI] [PMC free article] [PubMed] [Google Scholar]
Associated Data
This section collects any data citations, data availability statements, or supplementary materials included in this article.
Supplementary Materials
Table S9 A list of all APOE local haplotypes and description (sequences, frequencies, names) generated from the 1000 Genome project containing 399 Caucasian subjects with various frequencies of APOE genotype backgrounds, Related to Figure 1.
Data Availability Statement
The data discussed in this publication have been deposited in NCBI’s Gene Expression Omnibus (GEO) and are publicly available as of the date of publication. Accession numbers are listed in the key resources table. We have used the software and algorithms cited in the key resource table in this manuscript with default parameters or minor changes, thus the paper does not report original code, but the code for these analyses is available upon request. Any additional information required to reanalyze the data reported in this paper is available from the lead contact upon request.