Abstract
Aims/hypothesis
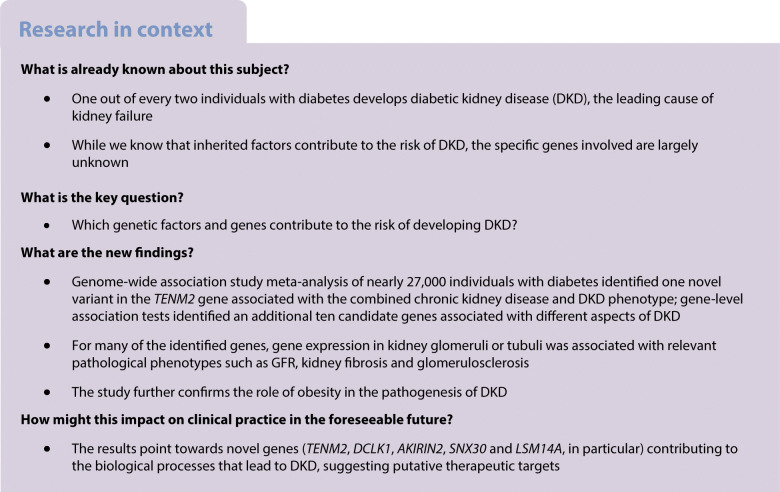
Diabetic kidney disease (DKD) is the leading cause of kidney failure and has a substantial genetic component. Our aim was to identify novel genetic factors and genes contributing to DKD by performing meta-analysis of previous genome-wide association studies (GWAS) on DKD and by integrating the results with renal transcriptomics datasets.
Methods
We performed GWAS meta-analyses using ten phenotypic definitions of DKD, including nearly 27,000 individuals with diabetes. Meta-analysis results were integrated with estimated quantitative trait locus data from human glomerular (N=119) and tubular (N=121) samples to perform transcriptome-wide association study. We also performed gene aggregate tests to jointly test all available common genetic markers within a gene, and combined the results with various kidney omics datasets.
Results
The meta-analysis identified a novel intronic variant (rs72831309) in the TENM2 gene associated with a lower risk of the combined chronic kidney disease (eGFR<60 ml/min per 1.73 m2) and DKD (microalbuminuria or worse) phenotype (p=9.8×10⁻⁹; although not withstanding correction for multiple testing, p>9.3×10⁻⁹). Gene-level analysis identified ten genes associated with DKD (COL20A1, DCLK1, EIF4E, PTPRN–RESP18, GPR158, INIP–SNX30, LSM14A and MFF; p<2.7×10⁻⁶). Integration of GWAS with human glomerular and tubular expression data demonstrated higher tubular AKIRIN2 gene expression in individuals with vs without DKD (p=1.1×10⁻⁶). The lead SNPs within six loci significantly altered DNA methylation of a nearby CpG site in kidneys (p<1.5×10⁻¹¹). Expression of lead genes in kidney tubules or glomeruli correlated with relevant pathological phenotypes (e.g. TENM2 expression correlated positively with eGFR [p=1.6×10⁻⁸] and negatively with tubulointerstitial fibrosis [p=2.0×10⁻⁹], tubular DCLK1 expression correlated positively with fibrosis [p=7.4×10⁻¹⁶], and SNX30 expression correlated positively with eGFR [p=5.8×10⁻¹⁴] and negatively with fibrosis [p<2.0×10⁻¹⁶]).
Conclusions/interpretation
Altogether, the results point to novel genes contributing to the pathogenesis of DKD.
Data availability
The GWAS meta-analysis results can be accessed via the type 1 and type 2 diabetes (T1D and T2D, respectively) and Common Metabolic Diseases (CMD) Knowledge Portals, and downloaded on their respective download pages (https://t1d.hugeamp.org/downloads.html; https://t2d.hugeamp.org/downloads.html; https://hugeamp.org/downloads.html).
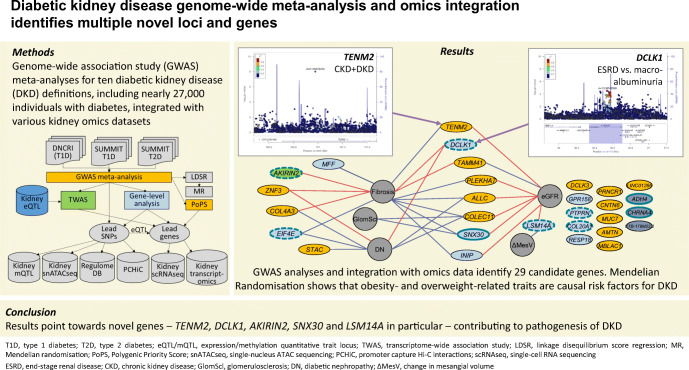
Graphical abstract
Supplementary Information
The online version contains peer-reviewed but unedited supplementary material available at 10.1007/s00125-022-05735-0.
Keywords: Diabetes complications, Diabetic kidney disease, Genetics, Genome-wide association study; Meta-analysis; Transcriptomics
Introduction
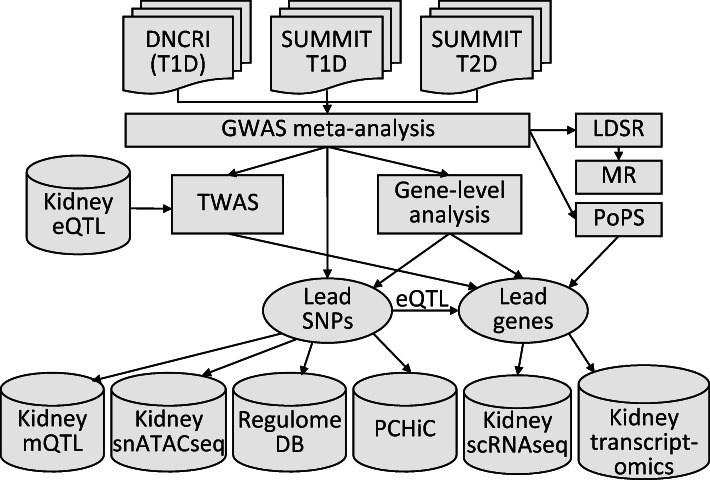
Diabetes is the leading cause of kidney disease. Diabetic kidney disease (DKD) is associated with high cardiovascular risk [1] and mortality [2] and, consequently, both diabetes and kidney disease are leading causes of death worldwide [3]. Both environmental and genetic factors have a major impact on the risk of developing DKD [4, 5]. Although more than 300 genetic loci have been associated with chronic kidney disease (CKD) in the general population, these loci show limited effect in DKD, especially in individuals with type 1 diabetes [6]. Genome-wide association studies (GWAS) have previously identified a handful of genetic loci for DKD at the genome-wide significance level (p<5×10⁻⁸) [7–11]. Recently, a meta-analysis of GWAS, including up to 19,406 individuals with type 1 diabetes from the Diabetic Nephropathy Collaborative Research Initiative (DNCRI), identified 16 loci. The strongest association was a common missense variant in the COL4A3 gene, which also showed evidence of association in individuals with type 2 diabetes [6]. A GWAS meta-analysis from The SUrrogate markers for Micro- and Macrovascular hard endpoints for Innovative diabetes Tools (SUMMIT) consortium, including 6000 individuals with type 2 diabetes from five different studies, identified three loci for DKD, including UMOD and PRKAG2 previously identified in the general population [12]. However, meta-analysis with SUMMIT type 1 diabetes studies (SUMMIT-1, N=5156) did not yield any genome-wide significant findings. To increase the power to detect novel genetic risk factors for DKD shared among diabetes subtypes, we aggregated all available data for DKD in individuals of European ancestry with type 1 or type 2 diabetes (N~27,000). Specifically, we performed GWAS meta-analyses on ten different DKD case–control definitions, meta-analysing summary statistics from DNCRI [6], SUMMIT-1 [4] and SUMMIT type 2 diabetes studies (SUMMIT-2) [12], followed by integration with diverse biological data to improve our understanding of the underlying biological mechanisms and clinical correlations (Fig. 1).
Fig. 1.
Schematic illustration of the study design, from GWAS meta-analysis to integration with various omics data sets. GWAS meta-analysis for ten different phenotypic definitions of DKD included up to 26,785 individuals with either type 1 or type 2 diabetes from the previous DNCRI and SUMMIT GWAS meta-analyses. The TWAS integrated the GWAS meta-analysis results with kidney eQTL data for tubular and glomerular compartments, identifying genes with differential expression in DKD. The mQTL data identified SNPs associated with DNA methylation at CpG sites. Single nucleus Assay for Transposase-Accessible Chromatin using sequencing (snATACseq) was informative of chromatin openness in various kidney cell types. The RegulomeDB is a database with extensive epigenetic annotation for SNPs. The promoter capture HiC (PCHiC) sequencing data identified sequence interaction with gene promoters, proposing target genes. Kidney transcriptomics provided data on gene expression in glomerular and tubular tissue in nephrectomy samples, or in Pima Indian biopsies, correlated with various renal variables. scRNAseq, single-cell RNA sequencing; T1D, type 1 diabetes; T2D, type 2 diabetes
Methods
For detailed methods, please refer to the electronic supplementary material (ESM) Methods.
Participating studies and phenotype definitions
A total of ten case–control definitions for DKD were included in DNCRI [6], based on either urinary AER (divided into controls with normal AER, and cases with microalbuminuria, macroalbuminuria or end-stage renal disease [ESRD]), eGFR, or both, and harmonised to match and include all seven phenotypic definitions assessed in SUMMIT-1 [4] and SUMMIT-2 [12] analyses (ESM Table 1). All individuals (both cases and controls) had diabetes (either type 1 or type 2 diabetes). For three phenotypic comparisons not initially part of the SUMMIT analysis, GWAS and meta-analysis were performed with three SUMMIT-2 studies and the Scania Diabetes Registry type 1 diabetes cohort. Individuals from the Finnish Diabetic Nephropathy Study (FinnDiane) were included in both the original DNCRI (N=6019) and SUMMIT-1 analyses (N=3415) and thus were excluded here from the SUMMIT-1 data (ESM Table 2). All contributing studies were performed in accordance with the Declaration of Helsinki and Declaration of Istanbul.
Genome-wide association study and meta-analysis
Genotyping and statistical analysis of the DNCRI [6] and SUMMIT [4, 12] cohorts have been previously described. Analysis plans were similar in the cohorts (ESM Table 3). Imputation was performed using 1000Genomes Phase 3 reference panel in DNCRI, and the older 1000Genomes Phase I panel in the SUMMIT cohorts. Analyses were performed in unrelated individuals using the SNPtest additive score test, adjusting for age, sex, diabetes duration, the genetic principal components, and study-specific covariates (e.g. site or genotyping batch). Variants were filtered for INFO imputation quality score ≥0.3 (DNCRI) or ≥0.4 (SUMMIT) and minor allele count ≥10 in both cases and controls. In SUMMIT, variants were further filtered to those with minor allele frequency (MAF) ≥0.01. Meta-analyses of DNCRI, SUMMIT-1 and SUMMIT-2 summary statistics were performed with inverse variance fixed effect methods based on the effect sizes. Variants were limited to those found in at least two studies.
Power calculations indicated 80% power to detect associations with p<5×10⁻⁸ and an OR of 1.20 for the combined ‘all vs ctrl’ phenotype for common variants with MAF≥10%, or with an OR of 1.28 and 1.73 for low-frequency (MAF 5%) and rare (MAF 1%) variants, respectively (ESM Fig. 1).
Correction for multiple testing was estimated with spectral decomposition of the ten DKD traits, suggesting 5.36 effective tests, leading to a corrected significance threshold of p<9.3×10⁻⁹.
Gene prioritisation analysis
Gene prioritisation at the top loci was performed using two complementary similarity-based gene prioritisation approaches (Polygenic Priority Score [PoPS] v0.1 [13] and MAGMA v1.06b [14]), which integrate GWAS with gene set enrichment based on a variety of biological annotation datasets.
Gene-level analysis
SNPs from the GWAS meta-analysis summary statistics were aggregated by gene-level regression analysis using two related programs, MAGMA v1.06b [14] and PASCAL v2016 [15], using default parameters. Gene-level significance thresholds were determined by a Bonferroni multiple testing correction based on the number of genes tested for each of the ten phenotypes (from p<2.7×10⁻⁶ to p<2.3×10⁻⁶).
Transcriptome-wide association study
In the transcriptome-wide association study (TWAS), MetaXcan [16] was applied with default parameters to integrate GWAS meta-analysis results with kidney expression quantitative trait locus (eQTL) datasets for micro-dissected human glomerular (N=119) and tubular (N=121) samples [17]. Significance threshold of p<4.1×10⁻⁶ was determined by Bonferroni correction for two tissues and 6050 genes found in either tubular or glomerular eQTL data.
Kidney eQTL, methylation quantitative trait loci, and colocalisation analysis
Kidney-specific eQTL associations were queried for glomeruli [17], tubules [17], and a meta-analysis of four eQTL studies with 451 kidney samples [17–20]. Kidney methylation quantitative trait locus (mQTL) associations were sought in 188 healthy kidney samples profiled by the Infinium MethylationEPIC Kit and BeadChips (Illumina, USA), with p<1.5×10⁻¹¹ considered significant. For the significant CpG sites, we tested association with DKD in our epigenome-wide association study (EWAS) of 1304 All Ireland-Warren 3-Genetics of Kidneys in Diabetes (GoKinD) United Kingdom (UK-ROI) collection and FinnDiane participants, analysed using the Infinium MethylationEPIC Kit and BeadChips, as previously described [21]. To estimate posterior probability that the GWAS association colocalised with the kidney eQTL and mQTL signals, we performed Bayesian multiple-trait-colocalisation analysis, with posterior probability >0.8 considered evidence of colocalisation.
Human kidney gene expression
For the 29 lead genes, we studied gene expression in kidneys in human transcriptomics data from nephrectomy samples (433 tubule and 335 glomerulus samples) [22] and kidney biopsies from the Pima Indian cohort (67 glomerular and 47 tubulointerstitial tissues) [23], and tested for correlation with relevant pathological phenotypes. The micro-dissected nephrectomy samples were from individuals with varying degree of diabetic and hypertensive kidney disease, and gene expression was defined with RNA sequencing. The study was approved by the institutional review board of the University of Pennsylvania.
In the Pima Indian cohort, gene expression profiling in the first biopsy was performed with Affymetrix gene chip arrays [23], and with Illumina RNA sequencing for the second biopsy [6]. Available phenotypes included progression to ESRD, measured GFR (mGFR), albumin/creatinine ratio (ACR), HbA1c and six kidney morphological variables for both biopsies, and change in the phenotypes between the first and the second study biopsies (27 phenotypes in total [24]). The study was approved by the Institutional Review Board of the National Institute of Diabetes and Digestive and Kidney Diseases.
Linkage disequilibrium score regression and Mendelian randomisation
Linkage disequilibrium (LD) score regression (LDSR) [25] was performed at LDhub (http://ldsc.broadinstitute.org/, accessed 22 August 2019) between our 10 DKD GWAS and 78 glycaemic, autoimmune, anthropometric, bone, smoking behaviour, lipid, kidney, uric acid, cardiometabolic and ageing-related traits (ESM Table 4). LDSR associations with Bonferroni-adjusted p<6.4×10⁻⁴ were considered significant. To identify causal relationships for significant traits in the LDSR against DKD, we performed summary-based two-sample Mendelian randomisation (MR) with inverse variance-weighted regression implemented in TwoSampleMR v0.5.6 R package [26]. Causality was further assessed using methods less sensitive to pleiotropy/heterogeneity [27].
Results
GWAS meta-analysis
The GWAS meta-analysis of the DNCRI (type 1 diabetes), and SUMMIT-1 and SUMMIT-2 meta-analyses included up to 26,785 individuals with either type 1 or type 2 diabetes from 25 studies; 11,380 individuals had any DKD (micro- or macroalbuminuria or ESRD) and 15,405 individuals had normal AER (ESM Table 2). QQ plots, λ genomic control inflation factor (λGC) and LDSR intercepts of the meta-analysis indicated no marked inflation or population stratification bias of the results (ESM Fig. 2).
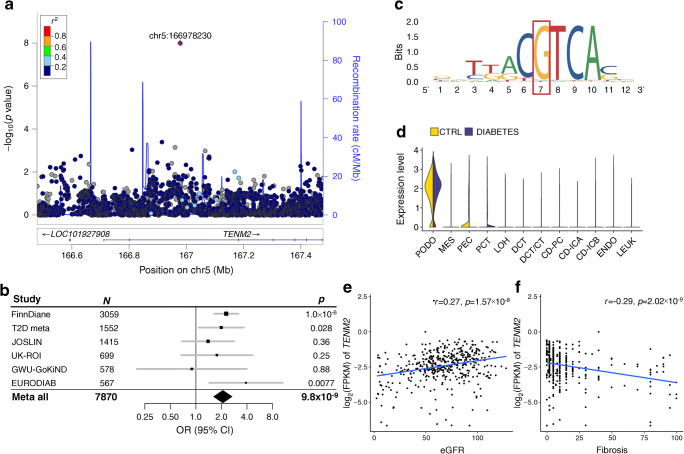
The meta-analysis identified a novel association between the combined CKD–DKD phenotype (cases with eGFR <45 ml/min per 1.73 m2 and microalbuminuria or worse, vs controls with normal AER and eGFR ≥60 ml/min per 1.73 m2) and rs72831309 (MAF=4%; OR 2.08, p=9.8×10⁻⁹; Fig. 2a, Table 1 and ESM Table 5). Of note, the association was barely above the threshold after correction for multiple testing due to multiple phenotypes (p>9.3×10⁻⁹). We observed no heterogeneity between individuals with type 1 or type 2 diabetes (pHET=0.88). The variant is located in an intron of the TENM2 gene encoding the teneurin transmembrane protein 2. The variant was imputed with moderate imputation quality across cohorts (INFO score 0.38–0.66). In the FinnDiane cohort with the strongest statistical significance, the association remained (though slightly attenuated) after re-imputation with a population-specific panel (INFO=0.92, p=2.0×10⁻⁴, OR 1.70 [95% CI 1.28, 2.24] vs INFO=0.66, p=1.0×10⁻⁶, OR 2.27 [95% CI 1.64, 3.16]).
Fig. 2.
TENM2 gene rs72831309 is associated with CKD–DKD. (a) Regional association plot of the meta-analysis results. (b) Forest plot of association across the contributing cohorts from DNCRI (FinnDiane, JOSLIN, UK-ROI, GWU_GoKinD) [6], SUMMIT-T1D (EURODIAB) [4] and SUMMIT-T2D studies [12]. (c) SNP rs72831309 overlaps a predicted CREB1 binding motif sequence; data from RegulomeDB.org (v.2.0.3). (d) Human kidney single-cell RNA expression of TENM2, showing strongest expression in podocytes, parietal epithelial cells and proximal convoluted tubules. (e, f) Tubular TENM2 expression is correlated with higher eGFR (e) and less fibrosis (f). CD, collecting duct; CT, connecting tubule; CTRL, control; DCT, distal convoluted tubule; ENDO, endothelium; FPKM, fragments per kilo base of transcript per million mapped fragments; GWU_GoKinD, George Washington University Genetics of Kidney in Diabetes; IC, intercalated cell (A/B); JOSLIN, Joslin Diabetes Center participants; LEUK, leucocyte; LOH, loop of Henle; MES, mesangial cells; PC, principal cell; PCT, proximal convoluted tubule; PEC, parietal epithelial cells; PODO, podocytes; T2D meta, meta-analysis of type 2 diabetes cohorts
Table 1.
GWAS meta-analysis result summary for loci with p<5×10⁻⁸
| Phenotype | CHR:POS | SNP | EA | NEA | EAF | OR (95% CI) | p value | Dir | N (studies) | Genes |
|---|---|---|---|---|---|---|---|---|---|---|
| Novel locus | ||||||||||
| CKD+DKD | 5:166978230 | rs72831309 | A | G | 0.039 | 2.08 (1.62, 2.67) | 9.8×10⁻⁹ | +++ | 8570 (7) | TENM2a,b |
| Previous loci | ||||||||||
| CKD | 2:3745215 | rs12615970 | A | G | 0.867 | 1.31 (1.20, 1.44) | 9.4×10⁻⁹ | +?? | 18,488 (13) | ALLCb, COLEC11 |
| All vs Ctrl | 2:228121101 | rs55703767 | T | G | 0.207 | 0.86 (0.82, 0.90) | 1.9×10⁻⁹c | −+− | 26,898 (24) | COL4A3a,b |
| CKD+DKD | 2:228121101 | rs55703767 | T | G | 0.210 | 0.81 (0.75, 0.88) | 4.7×10⁻⁸ | −+− | 17,611 (17) | COL4A3a,b |
| Severe DKD | 2:228121101 | rs55703767 | T | G | 0.208 | 0.82 (0.77, 0.87) | 3.6×10⁻¹¹c | −−− | 21,898 (23) | COL4A3a,b |
| ESRD | 3:926345 | rs115061173 | A | T | 0.014 | 9.40 (4.22, 20.93) | 4.1×10⁻⁸ | +?? | 4827 (3) | LINC01266b, CNTN6a |
| Micro | 3:11910635 | rs142823282 | A | G | 0.983 | 0.15 (0.08, 0.27) | 8.3×10⁻¹⁰c | −?? | 6076 (2) | TAMM41 |
| ESRD vs all | 3:36566312 | rs116216059 | A | C | 0.016 | 8.73 (4.13, 18.45) | 1.4×10⁻⁸ | +?? | 3667 (2) | STACb, DCLK3 |
| Severe DKD | 4:71358776 | rs191449639 | A | T | 0.005 | 32.42 (9.77, 107.59) | 1.3×10⁻⁸ | +?? | 7768 (2) | MUC7, AMTN |
| Micro | 7:99728546 | rs77273076 | T | C | 0.008 | 9.16 (4.29, 19.56) | 1.1×10⁻⁸ | +?? | 7500 (2) | MBLAC1, ZNF3 |
| ESRD vs macro | 8:128100029 | rs551191707 | CA | C | 0.122 | 1.69 (1.40, 2.04) | 4.4×10⁻⁸ | +?? | 3634 (7) | PRNCR1b |
| Micro | 11:16937846 | rs183937294 | T | G | 0.993 | 0.06 (0.02, 0.16) | 1.7×10⁻⁸ | −?? | 6076 (2) | PLEKHA7a,b |
| CKD | 18:1811108 | rs185299109 | T | C | 0.007 | 20.75 (7.30, 59.00) | 1.3×10⁻⁸ | +?? | 7223 (2) | LINC00470 |
aGene prioritised by PoPS
bGenes underlying the lead SNP
cp<9.3×10⁻⁹ (i.e. corrected for 5.36 effective tests [phenotypes])
CHR:POS, variant chromosome and basepair position; Ctrl, control; Dir, direction of association in DNCRI (type 1 diabetes), SUMMIT-2 (type 2 diabetes) and in SUMMIT-1 (type 1 diabetes), respectively; EA, effect allele; EAF, effect allele frequency; Genes, closest gene(s); Micro, microalbuminuria vs normal AER; NEA, non-effect allele; N (studies), number of contributing individuals and studies
At the previously identified COL4A3 locus, we identified a secondary association peak (rs6436688, p=1.8×10⁻⁷ for severe DKD; ESM Fig. 3) in only partial LD (D′=0.51, r2=0.08) with the lead variant rs55703767. The association at rs6436688 remained nominally significant after conditional analysis for rs55703767 (p=0.002).
In addition to the COL4A3 locus, nine other previously identified, mostly low-frequency or rare variants were associated with various kidney phenotypes (Table 1 and ESM Fig. 4). None of these variants were found in the SUMMIT meta-analyses (filtered to MAF≥1%), and thus, these associations represent the originally reported associations from the DNCRI [6]. One common (chr14q12), and four of our previously identified rare DNCRI loci (TAMM41, HAND2–AS1, DDR1–VARS2, BMP7; MAF~1%) associated with microalbuminuria demonstrated attenuated association when combined with the SUMMIT meta-analyses (with the rare variants only found in SUMMIT-2). The lack of replication across diabetes subtypes suggest either false positives or a lack of power to detect an association for rare variants in individuals with type 2 diabetes DKD (a more heterogeneous disease, particularly for the early stages of DKD [i.e. microalbuminuria]). Alternatively, this could simply represent a lack of shared biology across diabetes subtypes, again possibly due to the different underlying causes of kidney damage in individuals with type 1 vs type 2 diabetes.
Two variants, chr3:141792314:I and rs186434345, were associated with ESRD (N=940, p=4.6×10⁻¹⁰), and with the CKD–DKD phenotype (N=2571, p=4.0×10⁻⁸) in the SUMMIT-2 and SUMMIT-1 cohorts, but were absent in DNCRI. When the original SUMMIT–FinnDiane GWAS was included in the analysis, both associations were non-significant (chr3:141792314:I, p=0.056, N=3207; rs186434345, p=0.002, N=4782) and thus excluded from further consideration.
Gene prioritisation
To identify the underlying causal genes within each of our top loci, we used the PoPS [13] method that leverages genome-wide enrichment of biological annotations in combination with GWAS summary statistics to prioritise candidate genes. To increase precision, we intersected the results with both the simple nearest-gene approach and MAGMA gene prioritisation. Four genes (COL4A3, PLEKHA7, CNTN6 and TENM2) were both the PoPS prioritised gene and the nearest protein coding gene to the lead SNP (Table 1). Of note, the CNTN6 locus contained only two protein coding genes and the TENM2 locus only one. When taking the intersect between PoPS genes and genes that were within MAGMA’s top 10% of prioritised genes genome-wide, COL4A3 was the only prioritised gene (ESM Fig. 5). The gene set that prioritised COL4A3 for severe DKD was the fibulin 2 protein–protein interaction network (‘FBLN2 PPI subnetwork’), which together with 26 correlated reconstituted gene-sets makes up the ‘basement membrane’ meta-gene set derived in Marouli et al [28] (ESM Table 6).
Gene-level analysis
To improve power and jointly test all available common genetic markers within a gene, SNPs from the GWAS meta-analysis summary statistics were aggregated by gene and tested jointly for association using two similar programs, MAGMA and PASCAL. In addition to COL20A1 and SNX30 identified previously [6], we identified eight novel gene associations (p<2.7×10⁻⁶; Table 2 and ESM Fig. 6). The lead variants in these loci indicated no significant heterogeneity between type 1 and type 2 diabetes apart from the GPR158 locus (pHET=0.005; ESM Table 7). MAGMA’s gene-level analysis type 1 error was well controlled, with all but one λGC inflation factor under 1.05 (MAGMA’s ESRD vs all λGC=1.07). The genome-wide gene-level results from PASCAL showed slightly more inflation (λGC up to 1.15 for ESRD vs all).
Table 2.
Significant gene-level DKD association results from MAGMA and PASCAL
| Phenotype | Gene | Chr | bp start | bp end | N SNPs | p value | Method | Genes |
|---|---|---|---|---|---|---|---|---|
| CKD | PTPRN | 2 | 220149345 | 220179295 | 72 | 2.13×10⁻⁶ | MAGMA | 18,461 |
| CKD | RESP18 | 2 | 220187131 | 220202899 | 62 | 2.27×10⁻⁶ | MAGMA | 18,461 |
| Severe DKD | MFF | 2 | 228189866 | 228222552 | 439 | 2.07×10⁻⁶ | PASCAL | 21,790 |
| ESRD vs macro | EIF4E | 4 | 99794607 | 99856786 | 150 | 5.79×10⁻⁷ | MAGMA | 18,442 |
| ESRD vs macro | EIF4E | 4 | 99799606 | 99851786 | 269 | 9.28×10⁻⁷ | PASCAL | 21,762 |
| All vs Ctrl | INIP | 9 | 115443786 | 115485387 | 111 | 4.89×10⁻⁷ | MAGMA | 18,475 |
| All vs Ctrl | INIP | 9 | 115448790 | 115480387 | 248 | 1.87×10⁻⁶ | PASCAL | 21,784 |
| All vs Ctrl | SNX30 | 9 | 115506911 | 115642267 | 505 | 1.30×10⁻⁶ | MAGMA | 18,475 |
| Severe DKD | GPR158 | 10 | 25459290 | 25896158 | 1875 | 1.63×10⁻⁶ | MAGMA | 18,467 |
| ESRD vs macro | DCLK1 | 13 | 36337789 | 36710514 | 1162 | 1.39×10⁻⁶ | MAGMA | 18,442 |
| Severe DKD | LSM14A | 19 | 34658352 | 34725420 | 180 | 1.90×10⁻⁶ | MAGMA | 18,467 |
| CKD extremes | COL20A1 | 20 | 61919538 | 61967285 | 146 | 1.94×10⁻⁷ | MAGMA | 18,440 |
| ESRD vs all | COL20A1 | 20 | 61919538 | 61967285 | 145 | 5.26×10⁻⁷ | MAGMA | 18,439 |
bp start/end, bp position of the start and the end of the gene region; Ctrl, control; Genes, number of genes tested; macro, macroalbuminuria; N SNPs, no. of SNPs in the gene region
Integration of GWAS with kidney eQTL data
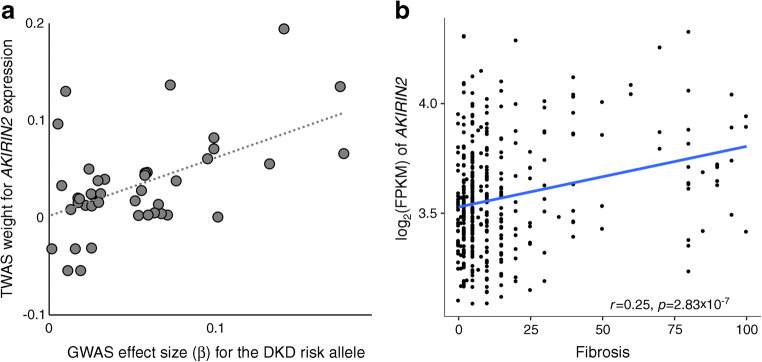
We performed TWAS for each of the ten DKD meta-analyses to predict differential gene expression between cases and controls based on eQTL data in glomerular and tubulointerstitial samples from histologically normal kidneys [17]. The type 1 error was well controlled (λGC 0.968–1.097; ESM Fig. 7). Expression levels of AKIRIN2 were predicted to be higher in the tubular tissue of cases with severe DKD (or macroalbuminuria alone), as compared with controls with normal AER (p values 1.1×10⁻⁶ and 1.7×10⁻⁶, respectively; Fig. 3a and ESM Tables 8, 9).
Fig. 3.
TWAS indicates increased AKIRIN2 expression in severe DKD. (a) The GWAS SNP effect sizes for association with severe DKD (normal AER vs macroalbuminuria or ESRD) are correlated with TWAS eQTL weights to predict AKIRIN2 expression, suggesting that elevated AKIRIN2 levels in tubules are associated with severe DKD (p=1.1×10⁻⁶). The eQTL data for 39 SNPs explained 5% of the variance in tubular AKIRIN2 expression (p=0.01). (b) AKIRIN2 expression is correlated with renal fibrosis. FPKM, fragments per kilo base of transcript per million mapped fragments
Kidney eQTL and mQTL associations
Kidney eQTL and mQTL data were queried for the top three variants at each lead locus from the GWAS meta-analyses and gene-level analyses. Kidney eQTL data suggested SNX30 as the target gene in the INIP–SNX30 region (rs786959 eQTL p=4.6×10⁻⁷), and the GWAS association colocalised with the eQTL signal with moderate evidence (posterior probability 0.70; ESM Table 10). Altogether, 17 variants were significantly associated with kidney DNA methylation levels at six CpG sites (p<1.5×10⁻¹¹; ESM Table 11), of which the mQTL colocalised with the GWAS association in LSM14A, DCLK1 and COL20A1 (posterior probability for colocalisation >0.80). SNPs in the LSM14A gene were associated with severe DKD and cg14143166 methylation levels (p=1.9×10⁻²⁸). Interestingly, cg14143166 methylation in blood was nominally associated with DKD status in our EWAS in the UK-ROI and FinnDiane cohorts (p=0.03), suggesting that the DKD association at LSM14A is mediated through methylation changes. Similarly, blood methylation levels at significant kidney mQTL CpG sites (rs7664964–cg25974308 p=1.1×10⁻¹¹) in EIF4E were nominally associated with eGFR slope in diabetes (p=0.04) [29].
Gene expression and pathological phenotypes
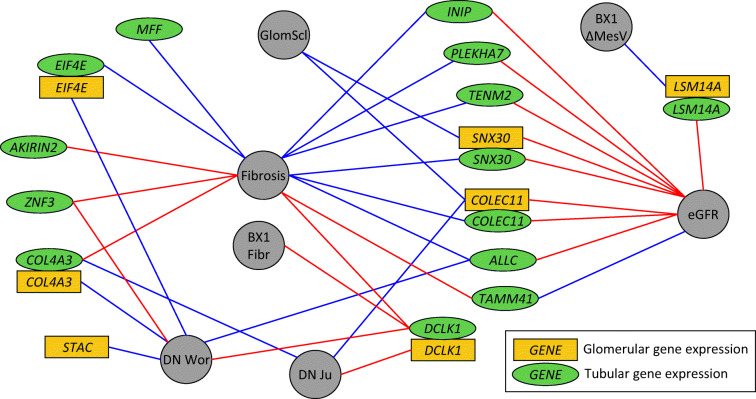
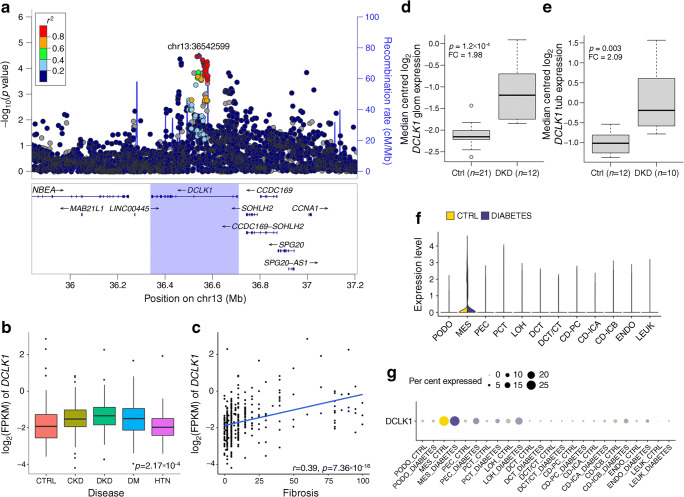
Altogether, we identified 29 lead genes or transcripts from GWAS, gene prioritisation, gene-level analyses, kidney eQTL data or TWAS. Among these, the expression levels of 14 genes significantly correlated with eGFR, glomerulosclerosis or fibrosis in transcriptomics data obtained from 433 tubular and 335 glomerular nephrectomy samples with varying degree of diabetic and hypertensive kidney disease (p<2.2×10⁻⁴; Fig. 4 and ESM Table 12) [22]. For example, tubular TENM2 expression correlated positively with eGFR (p=1.6×10⁻⁸; Fig. 2e) and negatively with tubulointerstitial fibrosis (p=2.0×10⁻⁹; Fig. 2f), tubular DCLK1 expression correlated positively with fibrosis (p=7.4×10⁻¹⁶; Fig. 7c), and tubular SNX30 expression correlated positively with eGFR (p=5.8×10⁻¹⁴) and negatively with fibrosis (p<2.0×10⁻¹⁶). In the Pima Indian kidney biopsy data, tubular DCLK1 expression was suggestively correlated (p<8.6×10⁻⁴, corrected for 29 genes and two tissues) with higher level of fibrosis, and LSM14A negatively correlated with the change in mesangial volume between the two study biopsies (non-significant after further conservative correction for 27 tested phenotypes). Multiple genes were nominally (p<0.05) correlated with these renal variables (ESM Fig. 8, ESM Table 13).
Fig. 4.
Tubular and glomerular gene expression of the lead genes correlates with multiple morphological and pathological renal variables and with DKD. Golden rectangles indicate glomerular gene expression, green ellipses tubular gene expression, and grey circles the morphological phenotypes. Blue lines indicate negative correlation and red lines indicate positive correlation. Correlation with fibrosis, glomerulosclerosis (GlomScl) and eGFR were measured in the nephrectomy samples [22]; correlations with p<2.2×10⁻⁴ (corrected for 29 genes, two tissues and four tests) are shown. For the biopsy data in Pima Indians, suggestive correlations with p<8.6×10⁻⁴ are shown (corrected only for 29 genes and two tissues), including fibrosis at first biopsy and change in the mesangial volume between the first and the second biopsies. Association with DKD (diabetic nephropathy) was queried in two data sets (Woroniecka et al [36] and Ju et al [35]), with p<4.3×10⁻⁴ or p<0.05 and fold change>1.5. BX1 Fibr, fibrosis at first biopsy; BX1 ΔMesV, change in the mesangial volume between the first and the second biopsies; DN Wor, diabetic nephropathy in Woroniecka et al [36]; DN Ju, diabetic nephropathy in Ju et al [35]; GlomScl, glomerulosclerosis
Fig. 7.
DCLK1 is associated with ESRD. (a) The DCLK1 gene region was associated with ESRD vs macroalbuminuria in the MAGMA gene-level analysis (p=1.39×10⁻⁶). (b, c) Tubular DCLK1 expression is highest in DKD (p=2.17×10⁻⁴) (b) and correlated with the level of fibrosis (c) in the nephrectomy samples. (d) Glomerular DCLK1 expression is higher in DKD than in healthy controls (Ju et al [35]: fold change 1.98, p=1.2×10⁻⁴). (e) Tubular DCLK1 expression is higher in DKD than in healthy controls (Woroniecka et al [36]: fold change 2.09, p=0.003). (f, g) Kidney DCLK1 expression is strongest in mesangial cells in human single-cell RNA sequencing data from individuals with diabetes and healthy controls [34]. In boxplots (b, d, e) the centrelines show the medians; box limits indicate the 25th and 75th percentiles; whiskers extend from the hinge to the most extreme value no further than 1.5 × the IQR (i.e. the distance between the first and third quartiles). CD, collecting duct; CT, connecting tubule; CTRL, control; DCT, distal convoluted tubule; DM, diabetes mellitus; ENDO, endothelium; FC, fold change; FPKM, fragments per kilobase of transcript per million mapped fragments; glom, glomerular; HTN, hypertension; IC, intercalated cell (A/B); LEUK, leucocyte; LOH, loop of Henle; MES, mesangial cells; PC, principal cell; PCT, proximal convoluted tubule; PEC, parietal epithelial cells; PODO, podocytes; tub, tubular
Genetic correlation of DKD between type 1 and type 2 diabetes and general population kidney traits
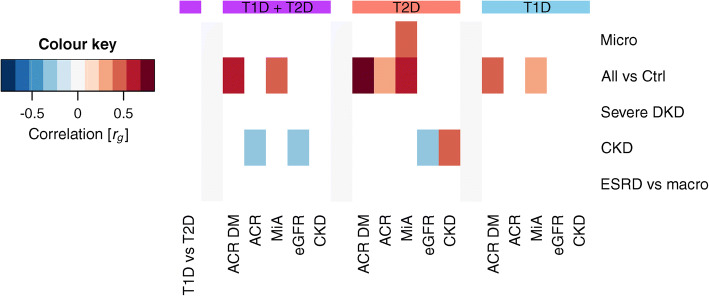
We performed LDSR to study the genetic correlation of DKD traits between individuals with type 1 and type 2 diabetes but, likely due to limited sample size, no significant correlations were observed. When compared with the kidney traits from the CKDgen consortium, the ‘All vs Ctrl’ phenotype was correlated with microalbuminuria in the general population [30] and ACR in diabetes [30], both in the main meta-analysis and for type 1 and type 2 diabetes separately (p<0.01). In addition, microalbuminuria in type 2 diabetes was correlated with microalbuminuria in the general population [30], and CKD in type 2 diabetes was positively correlated with CKD in the general population [31] and negatively with eGFR in the general population [32]; these were not significantly correlated in individuals with type 1 diabetes despite a larger number of samples (Fig. 5).
Fig. 5.
Genetic correlation between DKD phenotypes (y-axis) and kidney phenotypes in the general population (x-axis). Correlations were calculated with LD score regression for the whole meta-analysis (any diabetes, purple), type 2 diabetes only (red), and type 1 diabetes only (blue). The first column (purple) indicates genetic correlation for the DKD phenotypes between individuals with type 1 or type 2 diabetes (none significant). Only significant correlations (p<0.01) are shown. General population GWAS results were taken from CKDgen consortium: ACR [30]; ACR in diabetes [30]; microalbuminuria [30]; eGFR [32]; and CKD [31]. ACR DM, ACR in diabetes; Ctrl, control; ESRD vs macro, ESRD vs macroalbuminuria comparison; MiA, microalbuminuria; Micro, microalbuminuria (in current study); T1D, type 1 diabetes; T2D, type 2 diabetes
Genetic correlation and MR with related traits
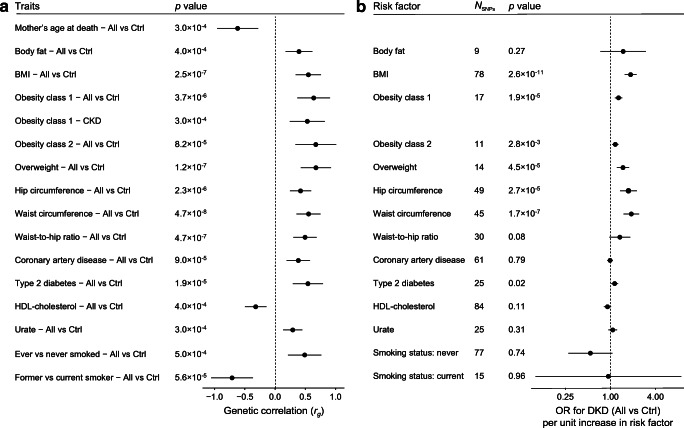
LDSR of related metabolic traits revealed significant genetic correlation (p<6.4×10⁻⁴) between DKD and 15 traits including multiple obesity-related traits, mother’s age at death, type 2 diabetes, coronary artery disease, HDL-cholesterol, urate, and two smoking-related traits (Fig. 6 and ESM Fig. 9). MR of these traits suggested that being overweight or obese was a causal risk factor for DKD (Fig. 6b and ESM Table 14). The causal effects were directionally consistent across methods, with no evidence of heterogeneity (I2=0–42.9%, p>0.05; ESM Table 14) or unbalanced horizontal pleiotropy (ESM Table 15). The MR Egger method, more robust for pleiotropic effects, further supported a causal role for higher BMI, waist circumference and hip circumference in DKD risk (p<0.05; ESM Table 14, ESM Fig. 10).
Fig. 6.
Genetic correlation between DKD phenotypes and various traits based on LDSR, and estimates of causal associations based on MR. (a) For LDSR only significant trait combinations are shown (p<0.05/78=6.4×10−4). (b) MR results for DKD (All vs Ctrl comparison) with inverse variance-weighted method for the traits significant in LDSR (‘mother’s age at death’ had fewer than than five genome-wide significant SNPs and thus, was not included in MR). Horizontal bars represent 95% CI. Ctrl, control
Discussion
We have performed the largest GWAS meta-analysis to date on kidney complications in diabetes, including ten different phenotypic definitions in up to 26,785 individuals with either type 1 or type 2 diabetes, and integrated the results with emerging kidney omics data (Fig. 1). In the single-variant analysis with the combined CKD–DKD phenotype, we identified one novel locus, rs72831309, intronic in TENM2. TENM2 encodes the teneurin transmembrane protein 2 involved in cell–cell adhesion. The variant rs72831309 alters a predicted CREB1 transcription factor binding site (Fig. 2c), and is nominally associated with expression of a TENM2 antisense transcript TENM2-AS1 in kidneys (p=0.007; ESM Table 10). Furthermore, chromatin conformation data in the GM12878 cell line indicated that the rs72831309 region interacts with the TENM2 transcription start site, as well as with three antisense transcripts (CTB-180C19.1 [Ensembl ENSG00000254365], CTB–105L4.2 [Ensembl ENSG00000253527] and CTB–78F1.1 [Ensembl ENSG00000254187]) within the TENM2 gene [33]. Whereby kidney single-cell RNA sequencing indicated TENM2 expression particularly in podocytes (Fig. 2d) [34], lower tubular TENM2 expression was associated with renal fibrosis (p=2.0×10⁻⁹) and lower eGFR (p=1.6×10⁻⁸) in the nephrectomy samples. Despite multiple supporting lines of evidence, the locus still needs further validation as the imputation quality of rs72831309 was on the low end across our cohorts (0.38–0.66), and the association did not remain significant after correction for multiple testing (p>9.3×10⁻⁹).
Gene-level analysis identified ten genes associated with DKD. The DCLK1 gene encodes a doublecortin-like kinase. The histone modification-based ChromHMM 15-state model for fetal kidney indicated strong transcription overlapping one of the three lead SNPs in the DCLK1 locus (rs61948262), and ChIP-seq data supported ZSCAN4 binding to the locus in the HEK293 kidney epithelial cell line. In addition, the lead SNPs were kidney mQTLs for DCLK1 CpG sites (p=6.8×10⁻²²). Furthermore, multiple lines of evidence highlight the importance of DCLK1 in DKD. The correlation between tubular DCLK1 expression and fibrosis was among the strongest correlations both in the nephrectomy samples (p=7.4×10⁻¹⁶; Fig. 7) and in the Pima Indian biopsies (p=3.0×10⁻⁴), and glomerular DCLK1 expression was nominally associated with glomerular width, mesangial volume and podocyte foot process width in the Pima Indian biopsies (p<0.05; ESM Table 13). Furthermore, both glomerular and tubular DCLK1 expression were elevated in DKD in two additional datasets (fold change 1.98, p=1.2×10⁻⁴ for glomeruli [35]; fold change 2.09, p=0.003 for tubules [36]; Fig. 7). Finally, we previously identified a subset of transcripts, including DCLK1, targeted by the early growth response-1 transcription factor in a murine model of DKD. In that study, Dclk1 expression was upregulated in diabetic vs non-diabetic Apoe−/− mouse kidneys [37]. Taken together, these expression data in human and experimental DKD identify DCLK1 as a novel target.
Kidney eQTL data for the top SNPs in the INIP–SNX30 locus pointed towards SNX30, encoding the sorting nexin family member 30, with the DKD risk-associated rs786959 A allele associated with higher SNX30 expression (p=4.6×10⁻⁷). On the contrary, in our transcriptomics data higher tubular SNX30 was correlated with higher eGFR (p=5.8×10⁻¹⁴) and lower level of fibrosis (p<2.0×10⁻¹⁶); glomerular expression was correlated with less glomerulosclerosis (p=8.0×10⁻⁵). Finally, kidney SNX30 expression was associated with higher eGFR in the general population using TWAS based on kidney tubular eQTL [17] and GWAS on eGFR [31] (p=0.046; ESM Table 8).
The TWAS analysis based on our GWAS results, integrated with micro-dissected tubular and glomerular eQTL data, predicted that AKIRIN2 gene expression is elevated in tubules in individuals with severe DKD compared with individuals with normal AER (p=1.1×10⁻⁶). AKIRIN2 gene expression was highly correlated with the level of fibrosis (p=2.8×10⁻⁷). AKIRIN2 encodes a conserved nuclear factor that is a downstream effector of the toll-like receptor, TNF and IL-1β signalling pathways, involved in stimulating proinflammatory pathways [38]. This factor binds to nuclear NF-κB complexes and is required for the transcription of a subset of NF-κB-dependent genes such as IL6, CXCL10 and CCL5 [39]; NF-κB activation drives inflammatory responses and is activated in DKD [40].
The strongest regulatory evidence in RegulomeDB was obtained for rs1260634 intronic in the LSM14A gene: rs1260634 exerts strong transcription in 125 tissues including fetal kidney chromatin state model, is located in a ZNF362 binding sequence in HEK293 cell line, and affects a predicted transcription factor binding motif for Kruppel-like factors 4 and 12 (KLF4 and KLF12) and Sp8 transcription factor (ESM Fig. 11). Furthermore, in our kidney mQTL data, rs1260634 showed strong association (p=2.1×10⁻²⁸) with cg14143166, where methylation in blood was associated with DKD in our EWAS data (p=0.03). Tubular LSM14A expression correlated with higher eGFR (p=2.9×10⁻⁶), and glomerular expression with the decrease in mesangial volume (p=6.5×10⁻⁴; significant after correction for 29 tested genes and two tissues, but not for 27 phenotypes). LSM14A encodes an Sm-like protein, thought to participate in pre-mRNA splicing, and implicated in innate antiviral responses [41].
Other noteworthy novel genes include EIF4E and PTPRN. EIF4E encodes a common mRNA translation initiation factor; its activation and/or suppression are influenced by mTOR signalling cascades involved in DKD [42] as well as high glucose and high insulin environments in renal epithelial cells [43]. PTPRN encodes islet antigen 2 (IA-2), a major type 1 diabetes autoantigen involved in glucose-stimulated insulin secretion [44]. In mice, IA-2 is required to maintain normal levels of renin expression in kidneys [45]. Finally, the MFF gene identified in our gene-level analysis has been previously related to DKD [46]. However, the association may be driven by the neighbouring COL4A3 association, as suggested previously [6].
Indeed, one limitation of our gene-level analysis is the inability to confidently assign genes to a given set of correlated SNPs within a region. While it is reasonable to prioritise the gene in which the SNPs lie, it remains possible that extended LD patterns are tagging other nearby genes. Similarly, assigning a causal gene for the lead SNPs is not straightforward. We have utilised the eQTL and other data when available but also used a simple nearest-gene approach to name the associated region.
In the transcriptomics analyses, as expected, all 13 significant correlations with the level of fibrosis were observed for tubular gene expression, and the two observed correlations for glomerulosclerosis were for glomerular expression of SNX30 and COLEC11 (Fig. 4). Interestingly, eight out of ten correlations with eGFR were obtained for tubular rather than glomerular gene expression, supporting the importance of tubular damage in the loss of renal function.
While there is a strong epidemiological link between DKD and coronary artery disease in diabetes [1], our LDSR is the first study to report a genetic correlation between these major diabetic complications. Among the lipid traits, significant correlation with DKD was found only for lower HDL-cholesterol, despite previous MR of kidney disease in the general population implicating HDL as a marker of dyslipidaemia rather than a causal factor [47]. Indeed, our subsequent MR found no evidence of causality between HDL and DKD; in concordance with our previous MR on BMI [48], only obesity-related traits were causal risk factors for DKD. However, we cannot exclude that the associations detected in our studies might partly reflect collider bias. Of note, our current MR was in line with our previous MR in type 1 diabetes suggesting that serum urate levels are not a causal risk factor for DKD [49]; similar negative results were also reported for non-diabetic CKD [50].
Most kidney disease in individuals with type 1 diabetes is considered to occur due to diabetic nephropathy, histologically characterised by thickening of the glomerular basement membrane and mesangial expansion, as well as renal tubular, interstitial and arteriolar lesions. In individuals with type 2 diabetes, only a proportion of DKD is purely due to diabetic nephropathy, whereas ageing, obesity and hypertension also contribute to kidney decline. These differences were also seen in our genetic correlation analysis, with CKD in type 2 diabetes genetically resembling CKD and eGFR in the general population, and no significant correlation observed in individuals with type 1 diabetes. Thus, including individuals with type 2 diabetes in the meta-analysis increases the heterogeneity of the underlying disease. However, as type 2 diabetes represents 95% of all diabetes cases, including those individuals increases statistical power for our current work and future GWAS meta-analyses integrating multiple subtypes of diabetes to identify shared genetic risk factors for DKD.
Supplementary information
(PDF 8564 kb)
Acknowledgements
We are indebted to the late Carol Forsblom (1964–2022), the international coordinator of the FinnDiane Study Group, for his considerable contribution. Part of the data were presented as an abstract at the 57th EASD Annual Meeting in 2021.
Authors’ relationships and activities
NvZ is currently an employee and a shareholder of AstraZeneca PLC. MIM is now an employee of Genentech and a holder of Roche stock. P-HG reports receiving lecture honoraria from Astellas, AstraZeneca, Boehringer Ingelheim, Eli Lilly, Medscape, MSD, Mundipharma, Novo Nordisk, PeerVoice, Sanofi and SCIARC, and being an advisory board member of Astellas, AstraZeneca, Bayer, Boehringer Ingelheim, Eli Lilly, Elo Water, Medscape, MSD, Mundipharma, Nestlé, Novo Nordisk, PeerVoice, Sanofi and SCIARC. JCF has received consulting honoraria from Goldfinch Bio and AstraZeneca, speaking honoraria from AstraZeneca, Merck and Novo Nordisk for scientific talks over which he had full control of content. All other authors declare that there are no relationships or activities that might bias, or be perceived to bias, their work.
Contribution statement
NS and JBC performed the main analyses and drafted the manuscript. VN, XS, HL, EA, NvZ, EHD, DF and LJS performed statistical analyses, contributed to interpretation of the results, and revised the manuscript. RMS, CF, EV, VH, EPB, GJM, DA, RD, HCL, RGN, AJM, CP, CG, APM, LG, MIM, MK, KS, JNH, JCF and PHG contributed to the data acquisition and interpretation of the results, and critically revised the manuscript. All authors gave their approval for the final version to be published. PHG is the guarantor of this work.
Abbreviations
- ACR
Albumin/creatinine ratio
- CKD
Chronic kidney disease
- DKD
Diabetic kidney disease
- DNCRI
Diabetic Nephropathy Collaborative Research Initiative
- eQTL
Expression quantitative trait locus
- ESRD
End-stage renal disease
- EWAS
Epigenome-wide association study
- FinnDiane
Finnish Diabetic Nephropathy Study
- GWAS
Genome-wide association studies
- LD
Linkage disequilibrium
- LDSR
Linkage disequilibrium score regression
- MAF
Minor allele frequency
- mGFR
Measured GFR
- mQTL
Methylation quantitative trait locus
- MR
Mendelian randomisation
- PoPS
Polygenic Priority Score
- SUMMIT
SUrrogate markers for Micro- and Macrovascular hard endpoints for Innovative diabetes Tools
- SUMMIT-1
SUMMIT type 1 diabetes studies
- SUMMIT-2
SUMMIT type 2 diabetes studies
- TWAS
Transcriptome-wide association study
- UK-ROI
All Ireland-Warren 3-Genetics of Kidneys in Diabetes (GoKinD) United Kingdom
- λGC
λ genomic control inflation factor
Funding
Open Access funding provided by University of Helsinki including Helsinki University Central Hospital. This study was funded by JDRF (grants S-SRA-2014-276-Q-R and 17-2013-7) and by NIDDK R01 DK105154. Research in FinnDiane was supported by Folkhälsan Research Foundation, Wilhelm and Else Stockmann Foundation, ‘Liv och Hälsa’ Society, Helsinki University Central Hospital Research Funds (EVO TYH2018207), Academy of Finland (299200 and 316664) and Novo Nordisk Foundation (NNF OC0013659). Acquisition of clinical data and samples from the Pima Indians was supported by the Intramural Research Program of the National Institute of Diabetes and Digestive and Kidney Diseases and by the ADA (Clinical Science Award 1-08-CR-42). JBC was funded by the National Institute of Diabetes and Digestive and Kidney Diseases (K99DK127196). EA was funded by grants from the Swedish Research Council (2017-02688, 2020-02191) and the Novo Nordisk Foundation (NNF18OC0034408). The study funders were not involved in the design of the study; the collection, analysis, and interpretation of data; writing the report; and did not impose any restrictions regarding the publication of the report.
Data availability
The GWAS meta-analysis results can be accessed via the type 1 and type 2 diabetes (T1D and T2D, respectively) and Common Metabolic Diseases (CMD) Knowledge Portals, and downloaded on their respective download pages (https://t1d.hugeamp.org/downloads.html; https://t2d.hugeamp.org/downloads.html; https://hugeamp.org/downloads.html).
Footnotes
Publisher’s note
Springer Nature remains neutral with regard to jurisdictional claims in published maps and institutional affiliations.
Niina Sandholm and Joanne B. Cole contributed equally to this work.
Dr C. Forsblom, who contributed to the data acquisition and interpretation, died on 2 April 2022 before publication of this work.
Contributor Information
Joel N. Hirschhorn, Email: Joel.Hirschhorn@childrens.harvard.edu
Per-Henrik Groop, Email: per-henrik.groop@helsinki.fi.
References
- 1.Harjutsalo V, Thomas MC, Forsblom C, Groop P-H, FinnDiane Study Group Risk of coronary artery disease and stroke according to sex and presence of diabetic nephropathy in type 1 diabetes. Diabetes Obes Metab. 2018;20(12):2759–2767. doi: 10.1111/dom.13456. [DOI] [PubMed] [Google Scholar]
- 2.Groop PH, Thomas MC, Moran JL, et al. The presence and severity of chronic kidney disease predicts all-cause mortality in type 1 diabetes. Diabetes. 2009;58(7):1651–1658. doi: 10.2337/db08-1543. [DOI] [PMC free article] [PubMed] [Google Scholar]
- 3.World Health Organization (2020) The top 10 causes of death. https://www.who.int/news-room/fact-sheets/detail/the-top-10-causes-of-death. 9 Dec 2020
- 4.Sandholm N, Van Zuydam N, Ahlqvist E, et al. The Genetic Landscape of Renal Complications in Type 1 Diabetes. J Am Soc Nephrol. 2017;28(2):557–574. doi: 10.1681/ASN.2016020231. [DOI] [PMC free article] [PubMed] [Google Scholar]
- 5.Harjutsalo V, Katoh S, Sarti C, Tajima N, Tuomilehto J. Population-based assessment of familial clustering of diabetic nephropathy in type 1 diabetes. Diabetes. 2004;53(9):2449–2454. doi: 10.2337/diabetes.53.9.2449. [DOI] [PubMed] [Google Scholar]
- 6.Salem RM, Todd JN, Sandholm N, et al. Genome-Wide Association Study of Diabetic Kidney Disease Highlights Biology Involved in Glomerular Basement Membrane Collagen. J Am Soc Nephrol. 2019;30(10):2000–2016. doi: 10.1681/ASN.2019030218. [DOI] [PMC free article] [PubMed] [Google Scholar]
- 7.Sandholm N, Salem RM, McKnight AJ, et al. New susceptibility Loci associated with kidney disease in type 1 diabetes. PLoS Genet. 2012;8(9):e1002921. doi: 10.1371/journal.pgen.1002921. [DOI] [PMC free article] [PubMed] [Google Scholar]
- 8.Sandholm N, McKnight AJ, Salem RM, et al. Chromosome 2q31.1 associates with ESRD in women with type 1 diabetes. J Am Soc Nephrol. 2013;24(10):1537–1543. doi: 10.1681/ASN.2012111122. [DOI] [PMC free article] [PubMed] [Google Scholar]
- 9.Pezzolesi MG, Poznik GD, Skupien J, et al. An intergenic region on chromosome 13q33.3 is associated with the susceptibility to kidney disease in type 1 and 2 diabetes. Kidney Int. 2011;80(1):105–111. doi: 10.1038/ki.2011.64. [DOI] [PMC free article] [PubMed] [Google Scholar]
- 10.Sandholm N, Forsblom C, Makinen VP, et al. Genome-wide association study of urinary albumin excretion rate in patients with type 1 diabetes. Diabetologia. 2014;57(6):1143–1153. doi: 10.1007/s00125-014-3202-3. [DOI] [PubMed] [Google Scholar]
- 11.Iyengar SK, Sedor JR, Freedman BI, et al. Genome-Wide Association and Trans-ethnic Meta-Analysis for Advanced Diabetic Kidney Disease: Family Investigation of Nephropathy and Diabetes (FIND) PLoS Genet. 2015;11(8):e1005352. doi: 10.1371/journal.pgen.1005352. [DOI] [PMC free article] [PubMed] [Google Scholar]
- 12.van Zuydam NR, Ahlqvist E, Sandholm N, et al. A Genome-Wide Association Study of Diabetic Kidney Disease in Subjects With Type 2 Diabetes. Diabetes. 2018;67(7):1414–1427. doi: 10.2337/db17-0914. [DOI] [PMC free article] [PubMed] [Google Scholar]
- 13.Weeks EM, Ulirsch JC, Cheng NY et al (2020) Leveraging polygenic enrichments of gene features to predict genes underlying complex traits and diseases. medRxiv 2020.09.08.20190561 (Preprint). 10 Sep 2020. Available from: 10.1101/2020.09.08.20190561 (accessed 21 Jun 2022) [DOI] [PMC free article] [PubMed]
- 14.de Leeuw CA, Mooij JM, Heskes T, Posthuma D. MAGMA: generalized gene-set analysis of GWAS data. PLoS ComputBiol. 2015;11(4):e1004219. doi: 10.1371/journal.pcbi.1004219. [DOI] [PMC free article] [PubMed] [Google Scholar]
- 15.Lamparter D, Marbach D, Rueedi R, Kutalik Z, Bergmann S. Fast and Rigorous Computation of Gene and Pathway Scores from SNP-Based Summary Statistics. PLoS Comput Biol. 2016;12(1):e1004714. doi: 10.1371/journal.pcbi.1004714. [DOI] [PMC free article] [PubMed] [Google Scholar]
- 16.Barbeira AN, Dickinson SP, Bonazzola R, et al. Exploring the phenotypic consequences of tissue specific gene expression variation inferred from GWAS summary statistics. Nat Commun. 2018;9(1):1825. doi: 10.1038/s41467-018-03621-1. [DOI] [PMC free article] [PubMed] [Google Scholar]
- 17.Qiu C, Huang S, Park J, et al. Renal compartment-specific genetic variation analyses identify new pathways in chronic kidney disease. NatMed. 2018;24(11):1721–1731. doi: 10.1038/s41591-018-0194-4. [DOI] [PMC free article] [PubMed] [Google Scholar]
- 18.Ko Y-A, Yi H, Qiu C, et al. Genetic-Variation-Driven Gene-Expression Changes Highlight Genes with Important Functions for Kidney Disease. Am J Hum Genet. 2017;100(6):940–953. doi: 10.1016/j.ajhg.2017.05.004. [DOI] [PMC free article] [PubMed] [Google Scholar]
- 19.GTEx Consortium The GTEx Consortium atlas of genetic regulatory effects across human tissues. Science. 2020;369(6509):1318–1330. doi: 10.1126/science.aaz1776. [DOI] [PMC free article] [PubMed] [Google Scholar]
- 20.Gillies CE, Putler R, Menon R, et al. An eQTL Landscape of Kidney Tissue in Human Nephrotic Syndrome. Am J Hum Genet. 2018;103(2):232–244. doi: 10.1016/j.ajhg.2018.07.004. [DOI] [PMC free article] [PubMed] [Google Scholar]
- 21.Smyth LJ, Kilner J, Nair V, et al. Assessment of differentially methylated loci in individuals with end-stage kidney disease attributed to diabetic kidney disease: an exploratory study. ClinEpigenetics. 2021;13(1):99-021-01081–x. doi: 10.1186/s13148-021-01081-x. [DOI] [PMC free article] [PubMed] [Google Scholar]
- 22.Guan Y, Liang X, Ma Z, et al. A single genetic locus controls both expression of DPEP1/CHMP1A and kidney disease development via ferroptosis. Nat Commun. 2021;12(1):5078. doi: 10.1038/s41467-021-25377-x. [DOI] [PMC free article] [PubMed] [Google Scholar]
- 23.Nair V, Komorowsky CV, Weil EJ, et al. A molecular morphometric approach to diabetic kidney disease can link structure to function and outcome. Kidney Int. 2018;93(2):439–449. doi: 10.1016/j.kint.2017.08.013. [DOI] [PMC free article] [PubMed] [Google Scholar]
- 24.Looker HC, Mauer M, Saulnier P-J, et al. Changes in Albuminuria But Not GFR are Associated with Early Changes in Kidney Structure in Type 2 Diabetes. J Am Soc Nephrol. 2019;30(6):1049–1059. doi: 10.1681/ASN.2018111166. [DOI] [PMC free article] [PubMed] [Google Scholar]
- 25.Bulik-Sullivan BK, Loh PR, Finucane HK, et al. LD Score regression distinguishes confounding from polygenicity in genome-wide association studies. NatGenet. 2015;47(3):291–295. doi: 10.1038/ng.3211. [DOI] [PMC free article] [PubMed] [Google Scholar]
- 26.Hemani G, Zheng J, Elsworth B, et al. The MR-Base platform supports systematic causal inference across the human phenome. Elife. 2018;7:e34408. doi: 10.7554/eLife.34408. [DOI] [PMC free article] [PubMed] [Google Scholar]
- 27.Bowden J, Davey Smith G, Haycock PC, Burgess S. Consistent Estimation in Mendelian Randomization with Some Invalid Instruments Using a Weighted Median Estimator. Genet Epidemiol. 2016;40(4):304–314. doi: 10.1002/gepi.21965. [DOI] [PMC free article] [PubMed] [Google Scholar]
- 28.Marouli E, Graff M, Medina-Gomez C, et al. Rare and low-frequency coding variants alter human adult height. Nature. 2017;542(7640):186–190. doi: 10.1038/nature21039. [DOI] [PMC free article] [PubMed] [Google Scholar]
- 29.Sheng X, Qiu C, Liu H, et al. Systematic integrated analysis of genetic and epigenetic variation in diabetic kidney disease. PNAS. 2020;117(46):29013–29024. doi: 10.1073/pnas.2005905117. [DOI] [PMC free article] [PubMed] [Google Scholar]
- 30.Teumer A, Li Y, Ghasemi S, et al. Genome-wide association meta-analyses and fine-mapping elucidate pathways influencing albuminuria. Nat Commun. 2019;10(1):4130. doi: 10.1038/s41467-019-11576-0. [DOI] [PMC free article] [PubMed] [Google Scholar]
- 31.Wuttke M, Li Y, Li M, et al. A catalog of genetic loci associated with kidney function from analyses of a million individuals. Nat Genet. 2019;51(6):957–972. doi: 10.1038/s41588-019-0407-x. [DOI] [PMC free article] [PubMed] [Google Scholar]
- 32.Stanzick KJ, Li Y, Schlosser P, et al. Discovery and prioritization of variants and genes for kidney function in >1.2 million individuals. Nat Commun. 2021;12(1):4350. doi: 10.1038/s41467-021-24491-0. [DOI] [PMC free article] [PubMed] [Google Scholar]
- 33.Mifsud B, Tavares-Cadete F, Young AN, et al. Mapping long-range promoter contacts in human cells with high-resolution capture Hi-C. NatGenet. 2015;47(6):598–606. doi: 10.1038/ng.3286. [DOI] [PubMed] [Google Scholar]
- 34.Wilson PC, Wu H, Kirita Y, et al. The single-cell transcriptomic landscape of early human diabetic nephropathy. Proc Natl Acad Sci U S A. 2019;116(39):19619–19625. doi: 10.1073/pnas.1908706116. [DOI] [PMC free article] [PubMed] [Google Scholar]
- 35.Ju W, Greene CS, Eichinger F, et al. Defining cell-type specificity at the transcriptional level in human disease. Genome Res. 2013;23(11):1862–1873. doi: 10.1101/gr.155697.113. [DOI] [PMC free article] [PubMed] [Google Scholar]
- 36.Woroniecka KI, Park AS, Mohtat D, Thomas DB, Pullman JM, Susztak K. Transcriptome analysis of human diabetic kidney disease. Diabetes. 2011;60(9):2354–2369. doi: 10.2337/db10-1181. [DOI] [PMC free article] [PubMed] [Google Scholar]
- 37.Brennan EP, Mohan M, McClelland A, et al. Lipoxins Regulate the Early Growth Response-1 Network and Reverse Diabetic Kidney Disease. J Am Soc Nephrol. 2018;29(5):1437–1448. doi: 10.1681/ASN.2017101112. [DOI] [PMC free article] [PubMed] [Google Scholar]
- 38.Tartey S, Matsushita K, Vandenbon A, et al. Akirin2 is critical for inducing inflammatory genes by bridging IκB-ζ and the SWI/SNF complex. EMBO J. 2014;33(20):2332–2348. doi: 10.15252/embj.201488447. [DOI] [PMC free article] [PubMed] [Google Scholar]
- 39.Goto A, Matsushita K, Gesellchen V, et al. Akirins are highly conserved nuclear proteins required for NF-kappaB-dependent gene expression in drosophila and mice. NatImmunol. 2008;9(1):97–104. doi: 10.1038/ni1543. [DOI] [PMC free article] [PubMed] [Google Scholar]
- 40.Mezzano S, Aros C, Droguett A, et al. NF-κB activation and overexpression of regulated genes in human diabetic nephropathy. Nephrology Dialysis Transplantation. 2004;19(10):2505–2512. doi: 10.1093/ndt/gfh207. [DOI] [PubMed] [Google Scholar]
- 41.Li Y, Chen R, Zhou Q, et al. LSm14A is a processing body-associated sensor of viral nucleic acids that initiates cellular antiviral response in the early phase of viral infection. Proc Natl Acad Sci U S A. 2012;109(29):11770–11775. doi: 10.1073/pnas.1203405109. [DOI] [PMC free article] [PubMed] [Google Scholar]
- 42.Lieberthal W, Levine JS. The role of the mammalian target of rapamycin (mTOR) in renal disease. Journal of the American Society of Nephrology. 2009;20(12):2493–2502. doi: 10.1681/ASN.2008111186. [DOI] [PubMed] [Google Scholar]
- 43.Mariappan MM, Feliers D, Mummidi S, Choudhury GG, Kasinath BS. High glucose, high insulin, and their combination rapidly induce laminin-beta1 synthesis by regulation of mRNA translation in renal epithelial cells. Diabetes. 2007;56(2):476–485. doi: 10.2337/db05-1334. [DOI] [PubMed] [Google Scholar]
- 44.Saeki K, Zhu M, Kubosaki A, Xie J, Lan MS, Notkins AL. Targeted Disruption of the Protein Tyrosine Phosphatase-Like Molecule IA-2 Results in Alterations in Glucose Tolerance Tests and Insulin Secretion. Diabetes. 2002;51(6):1842–1850. doi: 10.2337/diabetes.51.6.1842. [DOI] [PubMed] [Google Scholar]
- 45.Kim SM, Theilig F, Qin Y, et al. Dense-core vesicle proteins IA-2 and IA-2{beta} affect renin synthesis and secretion through the {beta}-adrenergic pathway. Am J Physiol Renal Physiol. 2009;296(2):F382–F389. doi: 10.1152/ajprenal.90543.2008. [DOI] [PMC free article] [PubMed] [Google Scholar]
- 46.Sheng J, Li H, Dai Q, et al. NR4A1 Promotes Diabetic Nephropathy by Activating Mff-Mediated Mitochondrial Fission and Suppressing Parkin-Mediated Mitophagy. Cell Physiol Biochem. 2018;48(4):1675–1693. doi: 10.1159/000492292. [DOI] [PubMed] [Google Scholar]
- 47.Voight BF, Peloso GM, Orho-Melander M, et al. Plasma HDL cholesterol and risk of myocardial infarction: a mendelian randomisation study. Lancet. 2012;380(9841):572–580. doi: 10.1016/S0140-6736(12)60312-2. [DOI] [PMC free article] [PubMed] [Google Scholar]
- 48.Todd JN, Dahlstrom EH, Salem RM, et al. Genetic Evidence for a Causal Role of Obesity in Diabetic Kidney Disease. Diabetes. 2015;64(12):4238–4246. doi: 10.2337/db15-0254. [DOI] [PMC free article] [PubMed] [Google Scholar]
- 49.Ahola AJ, Sandholm N, Forsblom C, et al. The serum uric acid concentration is not causally linked to diabetic nephropathy in type 1 diabetes. Kidney Int. 2017;91(5):1178–1185. doi: 10.1016/j.kint.2016.11.025. [DOI] [PubMed] [Google Scholar]
- 50.Jordan DM, Choi HK, Verbanck M, et al. No causal effects of serum urate levels on the risk of chronic kidney disease: A Mendelian randomization study. PLoS medicine. 2019;16(1):e1002725. doi: 10.1371/journal.pmed.1002725. [DOI] [PMC free article] [PubMed] [Google Scholar]
Associated Data
This section collects any data citations, data availability statements, or supplementary materials included in this article.
Supplementary Materials
(PDF 8564 kb)
Data Availability Statement
The GWAS meta-analysis results can be accessed via the type 1 and type 2 diabetes (T1D and T2D, respectively) and Common Metabolic Diseases (CMD) Knowledge Portals, and downloaded on their respective download pages (https://t1d.hugeamp.org/downloads.html; https://t2d.hugeamp.org/downloads.html; https://hugeamp.org/downloads.html).
The GWAS meta-analysis results can be accessed via the type 1 and type 2 diabetes (T1D and T2D, respectively) and Common Metabolic Diseases (CMD) Knowledge Portals, and downloaded on their respective download pages (https://t1d.hugeamp.org/downloads.html; https://t2d.hugeamp.org/downloads.html; https://hugeamp.org/downloads.html).


