Abstract
Polymerization degree theory and traditional charge compensation theory are the most fundamental principles to understand the structure and properties of oxide melts. It can well explain the behavior characteristics of acidic oxides and basic oxides in a melt. However, the amphoteric behavior of oxides cannot be explained well by these two theories. Herein, the octahedral connection mode and the behavior of the amphoteric transition of TiO2 are analyzed by molecular dynamics simulation, and then, a calculation model which can quantitatively calculate the amphoteric transition of the oxide is established by analyzing a large number of data. On the basis of the model, a novel theory of supply and demand is put forward, which can explain the amphoteric transition behavior of oxides very well. To a great extent, the supply and demand theory makes up for the deficiency of the atomic structure theory of oxide melts and provides mechanism explanation and model prediction for the oxide amphoteric transformation behavior.
1. Introduction
Ti4+ ions tend to form TiO6 octahedrons,1 and Si4+ ions tend to form SiO4 tetrahedrons. The stability of the SiO4 tetrahedron is much higher than that of the TiO6 octahedron. When the system is surrounded by certain ions, the TiO6 octahedrons will disappear. Therefore, the stability of the TiO6 octahedron also reflects the proportion of network modifier components in the system. In addition, there are many kinds of oxides in the melt and the production is pretty huge (more than one billion tons per year2−4), which makes it extremely important to clarify the behavior characteristics of various oxides in the oxide melt. The structure of silicate melts provides a basis for understanding the relations between the structure and the physical, chemical, and thermal properties of the melts. The recovery and utilization of silicate melt resources have been widely concerned. In addition to the silicate melt industry, the formation and evolution conditions of magma on the earth and terrestrial planets also need to clarify the atomic structure and physical and chemical properties of silicate melt. The metal cations in silicate melts may be divided into network formers and network modifiers,5 and the transition between the property of network formation and the property of network destruction is called amphoteric transition.
There are generally two types of octahedral connection of perovskite oxide with ABO3 structures, namely, corner-sharing connection and edge-sharing connection.6,7 In the CaO–SiO2–TiO2 (CST) systems, TiO2 is regarded as a network former when the content of TiO2 exceeds 28 wt % in the CST system.8 As the pressure increases, the bond-lengths of Ti–O1(2) and Ti–O3 in TiO6 octahedrons decrease with different speeds and equal to each other at about 22.0 GPa, forming a normal octahedron.9 Polymerization degree theory10,11 and charge compensation theory12,13 are the most fundamental theories to explain the structure of oxide melts. Polymerization degree theory is based on the microscopic calculations of the intermolecular structure of dense polymer melts with the nonperturbative continuum theory.10,11 The degree of polymerization theory is based on the complexity of the system’s atomic structure, the use of melt activity, ion distribution, and other properties to construct a function that predicts the thermodynamic properties of the melt.10,11 At the early development of the establishment of the degree of polymerization theory, only the binary system of SiO2–MO (M is a metal element) was studied and focused on the prediction of thermodynamic properties. Therefore, the degree of polymerization theory does not apply to the amphoteric behavior of oxides.14 When the Si4+ ions in the center of the SiO4 tetrahedrons in the melt are replaced by Al3+ ions or Na+ ions, the polyhedral structure will generate excess negative charges. The charge compensation theory assumes that the alkaline earth metal oxide cations would balance the excess negative charges. The Al2O3 content of the system studied at the initial stage of the establishment of the charge compensation theory has not reached the turning point of the amphoteric transition. Therefore, the charge compensation theory does not possess a good role in explaining the amphoteric behavior of oxides. These two theories can well explain the behavior characteristics of acidic oxides15,16 and basic oxides17−19 in melts. The latest research results showed that Al2O3 and B2O3 represent an obvious amphoteric behavior in oxide melts.20−22 It should be emphasized that the amphoteric transition of oxide refers to the transition between the network former and network modifier. However, the amphoteric behavior of oxides cannot be well explained by both the polymerization degree theory and charge compensation theory.
On the basis of confirming that TiO2 does have an obvious amphoteric behavior, through the analysis of the radial distribution functions (RDFs), coordination numbers (CNs), bond angle, and the statistical analysis of a large number of data, a set of calculation model of supply and demand balance is established, and a novel theory of oxygen supply and demand balance of oxygen is proposed. This model and theory can essentially explain the causes of the oxide amphoteric behavior and quantitatively calculate and predict the turning point of amphoteric transformation.
2. Simulation Methods
Initially, the software PACKMOL23 was employed to do the simulations. Subsequently, the software LAMMPS package [version 2019] was employed, with a time step of 1 fs.24 The long-range Coulomb interactions were evaluated by the Ewald summation method with a cut-off distance of 10 Å and the corresponding cut-off distances for the short-range Born and van der Waals was chosen to be 8.0 Å. Initially, the system was heated to 5000 K for 100 ps, then cooled down to 2273 K within 322.7 ps, and then kept at 2273 K for more than 500 ps. This cycle was repeated to ensure equilibrium of the system. After reaching equilibrium, the system was kept system at 2273 K and data were collected. In order to ensure a long enough time to collect data, the whole system was balanced and iterated at 2273 K for 1 ns.
All molecular dynamics simulations were carried out using the Born Mayer Huggins model.25,26 This potential can be written as
| 1 |
The first term on the right side of the equation is long-term Coulomb potential, the second term is the van der Waals forces, and the latter two terms represent repulsive forces. Where i and j represent two interacting atoms, respectively; Zi and Zj are the effective charge numbers of atoms i and j, respectively. The rij is the interatomic distance between atoms i and j, Aij, Bij, Cij, and Dij are the special parameters between atomic pairs. Various parameters used have been listed in Table S2.
3. Results and Discussion
3.1. Structural Factor Curve
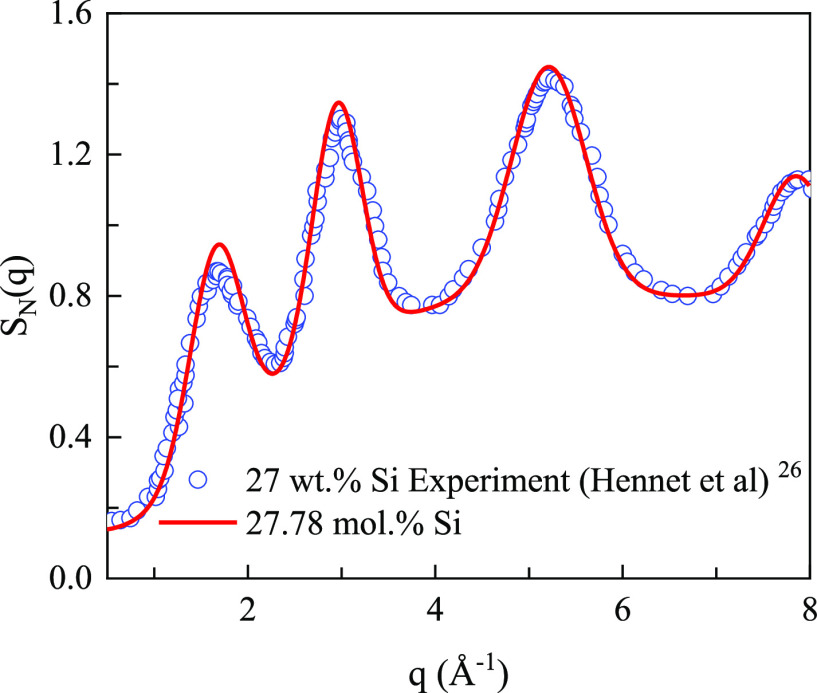
In order to verify the simulation, the total structural factor curve of the sample is drawn, as shown in Figure 1. In addition, the high-temperature neutron diffraction experimental result of Hennet et al.’s experimental system27 is also plotted in Figure 1. The high-temperature neutron diffraction experimental results and the structural factor curve obtained by the simulation overlap well with each other, which also proves the effectiveness of the simulation.
Figure 1.
Comparison of the total structural factor of sample B4T4 (sample number details shown in the Supporting Information) with the results of the high-temperature neutron diffraction experiment. The SiO2 content in the Hennet’s experimental system is 27 wt % which is similar to the that of sample B4T4 (27.78 mol % SiO2). The test temperature for Hennet’s molten systems is 1823 K.
3.2. Local Atomic Structure
The distribution state of TiO6 octahedron in the system is shown in Figure 2a. It can be estimated that the volume of the octahedron is about 9.89 (Å3) and that of the tetrahedron is about 2.10 (Å3) according to the bond length (Ti–O 1.95 Å,28 Si–O 1.6 Å,29Figure S1). The large difference in volume makes the Ti–O–Si bond angle only 74.5° (Figure S6d), which will produce a larger bond angle tension and destroy the stability of the structure. It should be emphasized that the atoms and their display colors are in one-to-one correspondence in all figures, that is, Si-blue, Ca-silver, Ti-yellow, and O-red.
Figure 2.
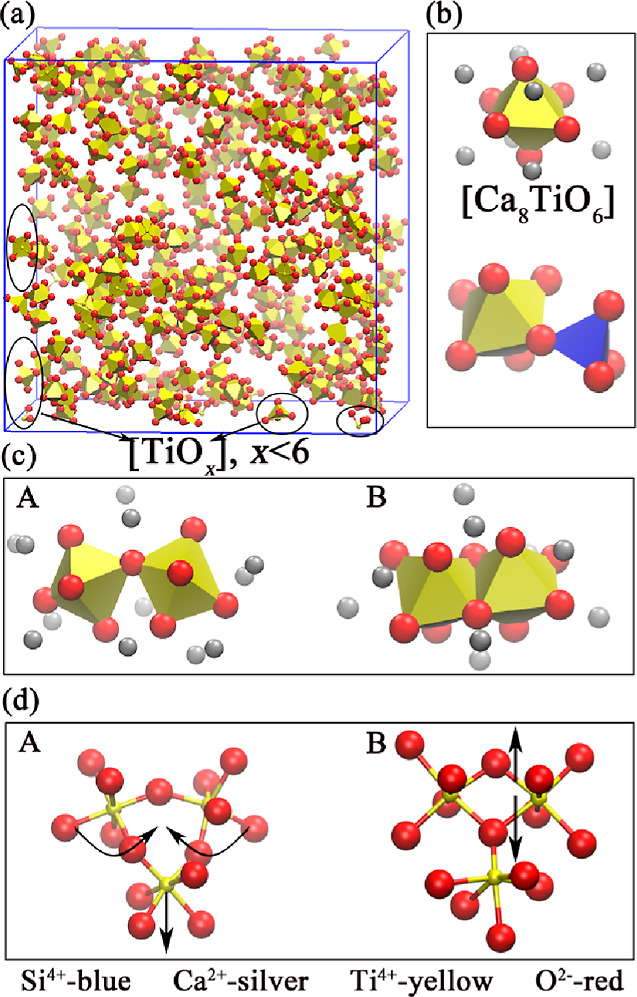
Visualization of the global atomic structure and local atomic structure: (a) global atomic structure of the sample with the TiO2 content of 35 wt % and the basicity (CaO/SiO2, mol %) of 1.7; (b) the basic unit of the atomic structure of the system with the sufficient CaO; (c) the basic unit of the atomic structure of the system with gradual decrease of CaO; and (d) influence of TiO6 tetrahedrons on TiO6 octahedrons’ bond angles.
The previous results indicate that the TiO6 octahedron tends to be connected with another TiO6 octahedron. Meanwhile, a large number of structures as shown in Figure 2b will be produced. With the increase of TiO2, the structure in Figure 2c(A) gradually changes to the structure in Figure 2c(B). When the oxygen atoms of the system cannot meet the oxygen atom number demanded by the corner-sharing connection, the TiO6 octahedrons are forced to share two BO atoms to reach the equilibrium state of the system, thus producing the two connection forms in Figure 2c. Figure 2d(A) shows that the Ti–O–Ti bond angle is reduced from 148.5 to 131° by TiO6 tetrahedrons pulling as the TiO2 content increases (Figure 4a). It can be seen that there is no significant change of the Ti–O–Ti bond angle in Figure 2d(B).
Figure 4.
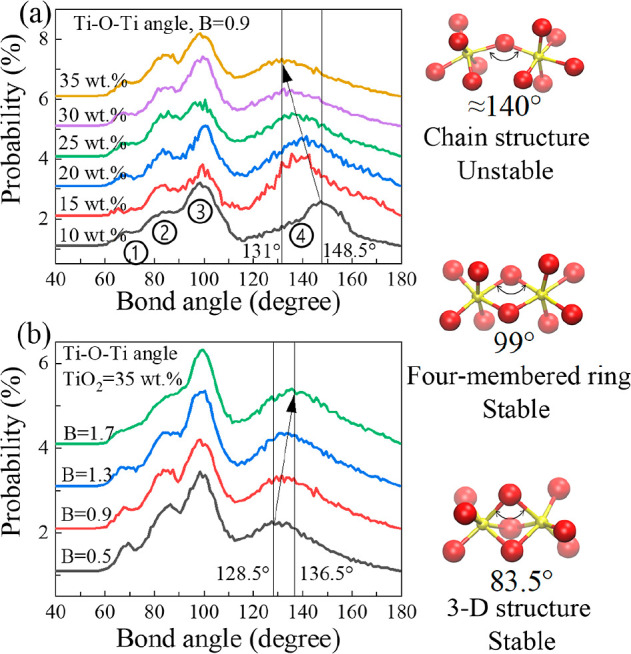
Change situation of Ti–O–Ti bond angle under different TiO2 contents and basicity surroundings. The atomic structure corresponded to the bond angle has been drawn in each figure: (a) change of bond angle with TiO2 contents when basicity is fixed at 0.9; (b) change of bond angle with basicity when TiO2 content is fixed at 35 wt %.
3.3. RDFs and CNs
It can be found from the partial enlarged view in Figure 3a that with the increase of TiO2 contents, the bond length of Ti–O chemical bonds in TiO6 octahedrons tends to decrease, indicating that both the bond energy and strength increase. The same trend appears in Figure S1. The bond lengths of all samples in this simulation are plotted in Figure 3b. Increasing the concentration of TiO2 promotes a decrease of the bond length of the Ti–O bond. Ca2+ ion is an indispensable factor to stabilize the octahedral structure and get charge balance. With the increase of the Ca2+ ion (increase in basicity), its stabilizing effect increases. As the basicity increases and reaches a value of 1.7, the influence of TiO2 is eliminated. The details of the RDFs of more samples are drawn, as shown in Figure S1. According to the existing publications,6,30,31 the most stable structure of the Ti atom with oxygen atom is TiO6 octahedron and the most stable coordination number is six-coordination. There is a common feature of the graphs in Figures 3c and S2 that the coordination number decreases with the increase of TiO2 content. The reduction of the coordination number is due to the appearance of TiOx (x < 6) type structure, shown in Figure 2. Combined with the analysis of RDFs (Figure 3b), it can be seen that the bond energy of the Ti–O chemical bond increases with the increase of TiO2 contents, but the stability of the TiO6 octahedron decreases with the increase of TiO2 contents. This is because the stability of the TiO6 octahedron is affected not only by bond energy but also by bond angular tension32 and the existing state of charge compensation ions. It can also be observed that with the increase of basicity, the average value and maximum value of the coordination number keep increasing trends (Figure 3d). This shows that with the increase of basicity, the TiO6 octahedron gradually tends to the most stable state. The increase of basicity mainly leads to the increase of Ca2+ ions in the system, while Ca2+, as the charge compensation ion of the octahedron structure, is directly related to the charge stability of octahedrons, affecting the structural stability of the octahedrons.
Figure 3.
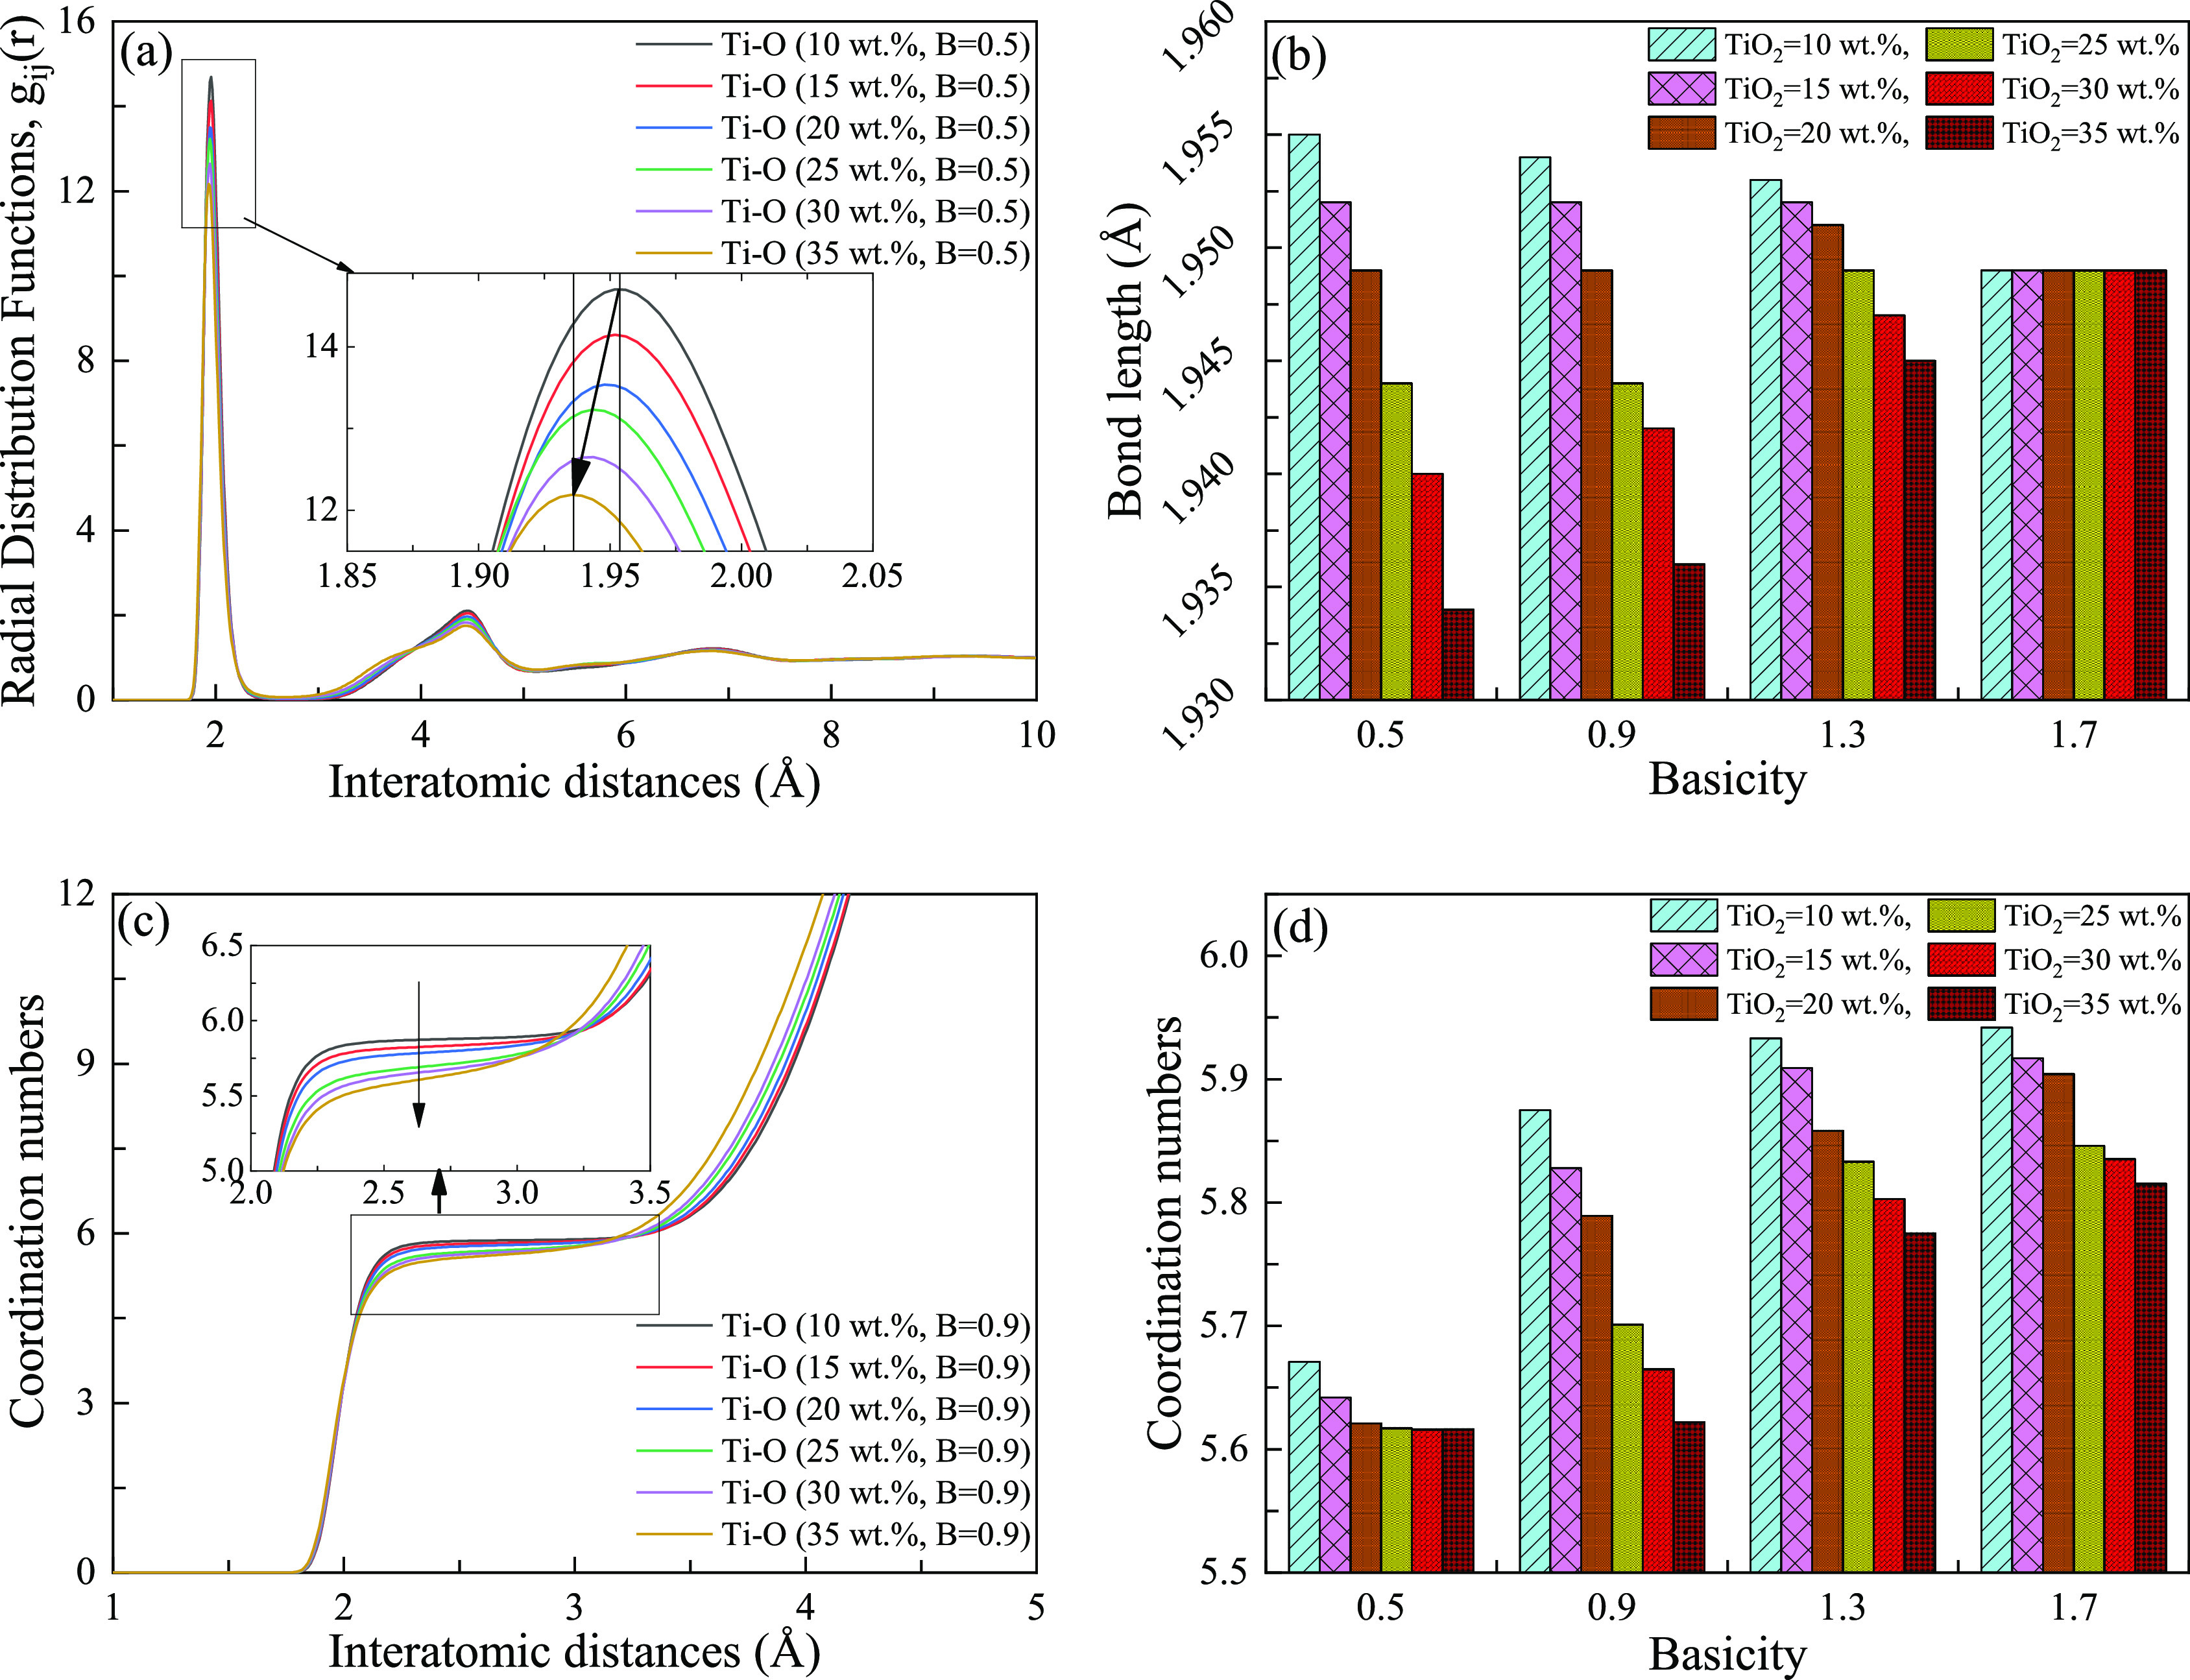
RDFs and CNs under different TiO2 contents and basicity. The first peak of each graph in figure is the most probable bond distance of the corresponding ion-pair, which is used to estimate the corresponding bond length. The first peak in figure (a) is enlarged and the vertical lines perpendicular to the abscissa axis in the enlarged view highlight the peak value under the corresponding RDFs. It should be emphasized that B represents the basicity (CaO/SiO2, mol %): (a) the RDFs of Ti–O atoms (B = 0.9); (b) Ti–O bond length under different TiO2 contents and basicity; (c) the CNs (B = 0.9); and (d) the CNs under different TiO2 contents and basicity.
3.4. TiO6 Octahedron Bond Angle and Connection Form
It can be seen from Figure 4 that there are four obvious sizes of Ti–O–Ti bond angles33 in the simulated system, namely, ①, ②, ③, and ④. On the premise that there are enough cations in the system, oxygen ions would not form chemical bonds with each other. According to the analysis of O–O RDFs (Figure S3), the calculated Ti–O–Ti bond angle should be greater than 80° when the distance between O–O reaches the limit value. Therefore, only ②, ③, and ④ are true and effective. For the bond angle ④ depicted in Figure 3a, due to the large volume of TiO6 octahedron, the system will become saturated with TiO2 content, and the Ti–O–Ti bond angle will obviously decrease during the attraction of external cations to BO atoms and the mutual extrusion of TiO6 octahedrons itself. It can be seen from Figure 4b that the influence of basicity on the bond angle ④ is just the opposite. As the internal stress of octahedron, bond angular tension is related to the extension direction of electrons. Ca2+ ions are used to stabilize the charge balance of an octahedron. When Ca2+ ions are sufficient, the bond angular tension of the octahedron will be partially eliminated. Therefore, the bond angle will increase with the increase of basicity. Further details of more bond angles are shown in Figure S4.
3.5. Supply–Demand Relationship Calculation Model
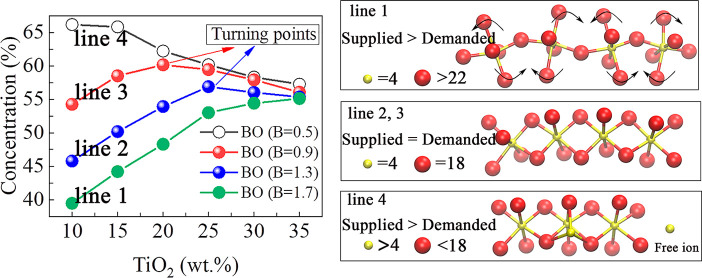
BO is defined as the middle oxygen atom connecting two polyhedrons. It should be noted that both polyhedrons can only form one chemical bond with this BO atom. The number of BO atoms in the system can directly reflect the complexity of the atomic structure of the system. Therefore, the components that can increase the BO content of the system are regarded as the network forming components and increase the degree polymerization; the components that can reduce the BO content of the system are regarded as the network modifier components and reduce the degree of polymerization of the system. In summary, the turning point of the BO curve is the turning point of the transition of the properties of the components.
As shown in Figure 5a, when the basicity is 1.7, the BO35 contents of the system increase with the increase of TiO2 contents. Under these conditions, the role of the Ti4+ ion in the system is to form TiO6 octahedrons and increase the BO contents of the system. The concentration of BO is always higher for acid melts. When the basicity decreases to 0.5, the BO of the system under the same TiO2 content is higher than when the basicity is 1.7. There will be more Ca2+ ions in the system with high basicity, and Ca2+ ions will destroy the BO structure of the system, making the BO content of the system with 1.7 basicity lower than that of another system with 0.5 basicity. However, the BO of the system with 0.5 basicity decreases with the increase of TiO2 contents. In this case, the O2– ions in the system cannot meet the demand from all cations in the polyhedral structure. This is because TiO2, as an amphoteric oxide, possesses an electronegativity weaker than that of SiO2. Due to the influence of Si4+ ions and the global structural balance36 (stability and balance of the whole system network structure) of the system, most of TiO2 has to change from capturing O2– ions to providing O2– ions, which makes the BO contents of the system decrease at all TiO2 values. Just as the basicity is low (Figure S2), the coordination number decreases with the increase of the TiO2 content. The decrease of the coordination number is due to the appearance of TiOx (x < 6) type structure in Figure 2a. As the basicity increases from 0.5 to 0.9 and 1.3, the O2– ion concentration in the system basically meets the needs of polyhedron formation when the content of TiO2 is low. Therefore, the BO contents of the system will first show an upward trend. However, when the TiO2 content exceeds the maximum load of the system (a limit when all Ti4+ ions can be allocated to the value of sufficient O2– ions), the excess Ti4+ ions begin to interact with other polyhedral structures because they cannot distribute O2– ions, trying to compete for O2– ions, resulting in the decrease of BO contents (Figure 5b).
Figure 5.

Concentrations of various types of oxygen under different TiO2 contents and basicity: (a) effect of basicity and TiO2 contents on BO contents; (b) the unification of local octahedral structural changes and global BO content changes, ① represented that the non-bridge oxygen (NBO)34 transforms into BO, ② represented that corner-sharing transforms into edge-sharing, and ③ represented that edge-sharing transforms into tri-cluster; and (c) quantitative calculation of supply and demand relationship of oxygen atoms in the system.
The behavior just observed suggests the development of a calculation model of oxide amphoteric transformation (more details in the Supporting Information). There are three basic facts or assumptions in this model. First: the oxygen ion is the only negative charge carrier of the system. The balance between supply and demand of oxygen ions, ΔN(O), is the basic relationship of the supply and demand theory. Second: all polyhedral structures of the system are connected by oxygen ions. Third: NBO is equivalent to 0.5 BO, and TO oxygen is equivalent to 1.5 BO. The balance between supply and demand of oxygen ions is as follows
| 2 |
In which ΔN(O) is the function of oxygen atoms supplied and demanded. N(O)supplied and N(O)demanded represent the number of equivalent oxygen atoms supplied and demanded in the supply–demand relationship, respectively.
| 3 |
In which NO represents the initial number of oxygen atoms. R represents the limit factor, that is, the maximum ratio of all oxygen atoms equivalent to BO. The basic idea of R is that all types of oxygen atoms in all samples are assumed to be BO, and then, the percentage of all samples is taken as an average value. The NBO is equivalent to 0.5 BO, and the TO is equivalent to 1.5 BO. Data statistics of NBO, BO, and TO are performed for all samples, and the equivalent calculation in eq 4 is performed.
| 4 |
In which NSample represents the sample size. The larger the sample size, the closer the limit factor is to reality. PNBO, PBO, and PTO, respectively, represents the percentage content of NBO, BO, and TO in the sample.
| 5 |
In which Ni is the total number of cations corresponding to different coordination structures. Pi is the percentage content, and the i is the coordination number of polyhedrons.
The core of the supply–demand relationship model is to break the complex network structure of the system (as shown on the right side of Figure 6a). Through N(O)demanded, the number of equivalent oxygen atoms demanded by the polyhedron in the system can be clarified, then defining N(O)supplied to calculate the number of equivalent oxygen atoms that the system can supply. The difference is the balance between the supply and demand. First, we equate all initial oxygen atoms as BO atoms, and two polyhedrons share a BO atom. Therefore, the equivalent oxygen atom that the system can supply is the product of twice the initial oxygen atoms and a limit factor. It should be emphasized that the initial oxygen atom is the number of oxygen atoms when the system is set; however, not all oxygen atoms in the system are BO atoms, so the limit factor R is used for correction.
Figure 6.
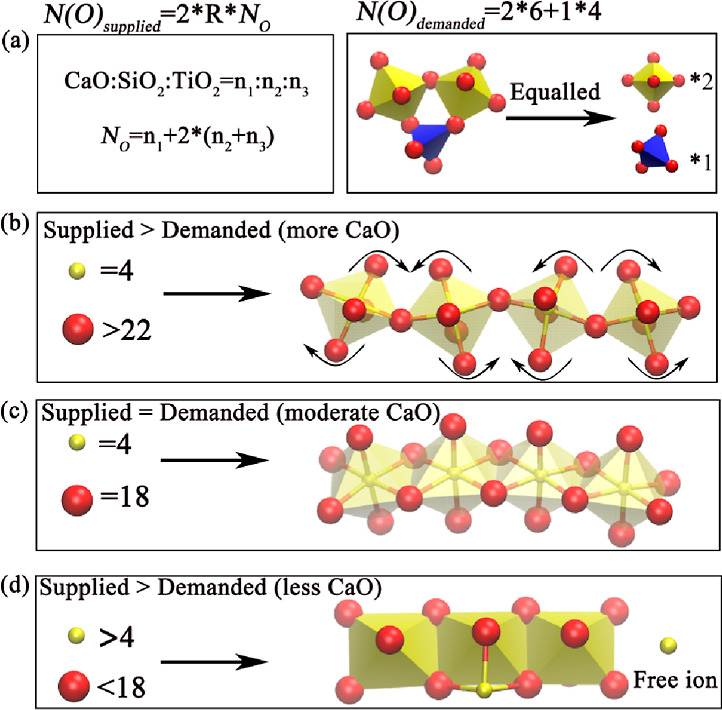
Theory of supply and demand and amphoteric transformation of TiO2: (a) oxygen atoms supplied by the system and oxygen atoms demanded by the network structure, the demand of oxygen atoms in the relationship between supply and demand is determined by the coordination polyhedrons and the ratio of different coordination structures; (b–d) the difference between the oxygen atoms supplied by the system and the oxygen atoms demanded by the network structure.
Figure 5c is the result of the supply–demand model, in which the calculation result of R is 0.93 (more details in the Supporting Information). In Figure 5c, there are two zero points of ΔN(O), which are two curves with basicity values of 0.9 and 1.3. Remarkably, the position of these points coincides with the turning point of BO in Figure 5a, which validates the calculations in the model. By taking parameters from different systems, the turning point position of the corresponding system could be calculated and predicted. As shown in Figure S6, it can be proved that the supply–demand model is also applicable to the amphoteric transformation in existing publications.21,22
3.6. Supply–Demand Relationship Theory and Essential Mechanism
Based on Figure 6a, there are three situations regarding the supply–demand model, as shown in Figure 6b–d. When the number of free oxygen ions supplied by the system is larger than that demanded by polyhedral connections, Ti4+ ions perform as network forming, increasing the BO content and polymerization degree of the system (Figure 6b). With the increase of TiO2, the octahedral angle connection structure will rotate and the connection gradually changes from corner-sharing to an edge-sharing connection structure, until the free oxygen ions supplied by the system balance the oxygen number required by the octahedral edge connection structure (Figure 6c). At this point, if TiO2 continues to increase, the TiOx (x < 6) structure in Figures 2a and 6d will be produced, and even free Ti4+ ions will appear. Combined with the previous calculation model of amphoteric transition, it can be seen that when the number of free oxygen ions supplied by the system is larger than the number of oxygen ions demanded by simple chain structure, both acidic oxides and amphoteric oxides in the system act as network forming components, and conversely, amphoteric oxides or oxides with weak electronegativity (significantly smaller than the electronegativity of silicon, which is 1.837,38) will change from network formers to network modifiers. However, the essence of this destruction is still to compete with the existing network structure for oxygen ions, resulting in the destruction of the network structure.
According to the analysis of Figures 5 and 6, a theory suitable for the amphoteric transformation of melt atomic structure is proposed. The principle is that the essence of oxide amphoteric transformation (from network former to network modifier) is that the supply of oxygen atoms cannot meet the demand of the oxygen atoms to achieve sufficient polyhedral connections. Therefore, the oxides with an electronegativity weaker than SiO2 are forced to change from obtaining oxygen atoms to providing oxygen atoms. Then, they are in low coordination or free state, affecting other BO structures.
The previous analysis proved the amphoteric transition behavior of oxides from the point of view of the atomic structure. By comparing the experimental values and calculated results of viscosity, it can be shown that the amphoteric properties of oxides have an opposite influence on not only the atomic structure but also other certain properties of the melt.
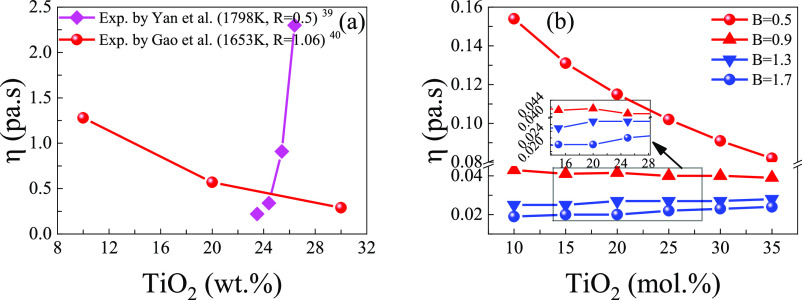
As shown in Figure 7a, when the value of R (CaO/SiO2, wt %) is 0.5, it can be clearly observed that the viscosity of the system decreases with the increase of TiO2, as also shown in the curves in Figure 7b for B (CaO/SiO2, mol %) at 0.5 and 0.9. In addition, the viscosity is greatly affected by the atomic structure. Through the previous analysis, it can be known that when the value of R or B is small, Ti4+ ions act as network modifiers corresponding with a decrease of viscosity. In Figure 7a, when the value of R is greater than 1, it can be clearly observed that the viscosity of the system increases with the increase of TiO2, as shown by the curves in Figure 7b with B values at 1.3 and 1.7. When the value R or B is larger, Ti4+ ions act as network formers, increasing the BO structure of the system, corresponding to the increase in viscosity. On the one hand, TiO2 ions could increase the BO structure and increase the viscosity of the system; on the other hand, Ti4+ ions could destroy the existing [SiO4]–[SiO4] structure of the system, generate [SiO4]–[TiO6] structure, and reduce the viscosity of the system. When the TiO2 content is less than 20 wt %, Ti4+ ions possess a stronger ability to reduce the viscosity than to increase the viscosity of the system; when the TiO2 content is higher than 20 wt % and less than 30 wt %, Ti4+ ions possess the stronger ability to increase the viscosity than to reduce the viscosity of the system. In addition, when the TiO2 content exceeds 30 wt %, both opposite effects result in a decrease in the viscosity of the system.
Figure 7.
Comparison between experimental values39,40 and calculated results of viscosity showing that as the ratio of CaO/SiO2 increases, the effect of TiO2 on viscosity presents an opposite trend. It should be noted that R represents the ratio of the mass fraction of CaO and SiO2, and B represents the ratio of the mole fraction of CaO and SiO2: (a) single trend experimental values of viscosity; (b) calculated results of viscosity. (a) Reprinted (adapted or reprinted in part) with permission from [Yan, Z.; Lv, X.; He, W.; Xu, J. effect of TiO2 on the liquid zone and apparent viscosity of SiO2–CaO-8 wt % MgO-14 wt % Al2O3 system. ISIJ International. 2017, 57, 31–36], Copyright [2017], with permission from [ISIJ International]; reprinted (adapted or reprinted in part) with permission from [Gao, Y.; Bian, L.; Liang, Z. influence of B2O3 and TiO2 on viscosity of titanium-bearing blast furnace slag. Steel Research International. 2015, 86, 386–390.] Copyright [2015], with permission from [Steel Research International].
4. Conclusions
In summary, it can be seen that TiO2 does have the ability to show amphoteric behavior. When the basicity of the system is 0.9 and 1.3, the content of TiO2 is over 20 and 25 mol % respectively, the amount of oxygen atoms that can be supplied by the system cannot meet the demand of octahedral formation of all Ti4+ ions, so excessive Ti4+ acts as the network destruction component and attacks other polyhedral structures. Through the analysis of RDFs, CNs, bond angle, and a large amount of data analysis, a set of calculation models that can quantitatively calculate and predict the turning point of the amphoteric transition of oxides is established, and the theory of supply and demand of the melt atomic structure is proposed. When ΔN(O) is always greater than or less than zero, there is no amphoteric transformation process in the system. When ΔN(O) has a zero point, the zero point is the turning point of amphoteric transformation.
Acknowledgments
The authors acknowledge the financial support of the National Natural Science Foundation of China (51974019 and 51774032), the National Natural Science Foundation for Young Scientists of China (51804025), the Chinese Fundamental Research Funds for the Central Universities (FRF-TP-20-005A2), and the National Key Research and Development Program of China (2017YFB0304300 and 2017YFB0304303). Computations were performed on the Niagara supercomputer at the SciNet HPC Consortium in the Compute/Calcul Canada national computing platform. SciNet is funded by the Canada Foundation for Innovation under the auspices of Compute Canada, the Government of Ontario, Ontario Research Fund—Research Excellence, and the University of Toronto. The authors acknowledge the technical support of Prof. M.B. of the University of Toronto.
Supporting Information Available
The Supporting Information is available free of charge at https://pubs.acs.org/doi/10.1021/acsomega.2c02252.
Simulation methods, components of the studied blast furnace slag system, BMH model parameters used in this simulation, calculation methods, RDFs and bond length, bond angle and local structure evolution, oxygen network structure and global structural stability, content of different types of oxygen atoms, calculation results of N(O)supplied and N(O)demanded, results of model calculation, applicability verification of the supply–demand model, and results of the supply–demand relationship model (PDF)
Author Contributions
Zhisheng Bi: conceptualization, methodology, and writing-original draft; Kejiang Li: investigation, supervision, and funding acquisition; Chunhe Jiang: supervision, software; Jianliang Zhang: resources; Shufang Ma: software; Conejo Alberto: analysis, language modification; Minmin Sun: supervision; Yushan Bu: software; Mansoor Barati: resources; Shan Ren: investigation, supervision.
The authors declare no competing financial interest.
Supplementary Material
References
- Ganguli N.; Kelly P. J. Tuning ferromagnetism at interfaces between insulating perovskite oxides. Phys. Rev. Lett. 2014, 113, 127201. 10.1103/physrevlett.113.127201. [DOI] [PubMed] [Google Scholar]
- Ma Z.; Tian X.; Liao H.; Guo Y.; Cheng F. Improvement of fly ash fusion characteristics by adding metallurgical slag at high temperature for production of continuous fiber. J. Clean. Prod. 2018, 171, 464–481. 10.1016/j.jclepro.2017.10.031. [DOI] [Google Scholar]
- Bellmann F.; Stark J. Activation of blast furnace slag by a new method. Cem. Concr. Res. 2009, 39, 644–650. 10.1016/j.cemconres.2009.05.012. [DOI] [Google Scholar]
- Tsakiridis P. E.; Papadimitriou G. D.; Tsivilis S.; Koroneos C. Utilization of steel slag for Portland cement clinker production. J. Hazard. Mater. 2008, 152, 805–811. 10.1016/j.jhazmat.2007.07.093. [DOI] [PubMed] [Google Scholar]
- Mysen B. O. The structure of silicate melts. Annu. Rev. Earth Planet. Sci. 1983, 11, 75–97. 10.1146/annurev.ea.11.050183.000451. [DOI] [Google Scholar]
- Ren Z.; Xu G.; Liu Y.; Wei X.; Zhu Y.; Zhang X.; Lv G.; Wang Y.; Zeng Y.; Du P.; Weng W.; Shen G.; Jiang J. Z.; Han G. PbTiO3 nanofibers with edge-shared TiO6 octahedra. J. Am. Chem. Soc. 2010, 132, 5572–5573. 10.1021/ja1011614. [DOI] [PubMed] [Google Scholar]
- Frenkel A. I.; Ehre D.; Lyahovitskaya V.; Kanner L.; Wachtel E.; Lubomirsky I. Origin of polarity in amorphous SrTiO3. Phys. Rev. Lett. 2007, 99, 215502. 10.1103/physrevlett.99.215502. [DOI] [PubMed] [Google Scholar]
- Yao T.-H.; He S.-P.; Wu T.; Wang Q. Molecular dynamics simulations of microstructural properties of CaO-SiO2-TiO2 fluorine-free slag systems. Ironmak. Steelmak. 2017, 44, 551–558. 10.1080/03019233.2016.1222111. [DOI] [Google Scholar]
- Cai L.; Liu C. First-principle calculations of electronic structure and dielectric function of rutile TiO2 under hydrostatic pressure. Solid State Sci. 2020, 106, 106330. 10.1016/j.solidstatesciences.2020.106330. [DOI] [Google Scholar]
- Masson C. R.; Smith I. B.; Whiteway S. G. Activities and ionic distributions in liquid silicates: application of polymer theory. Can. J. Chem. 1970, 48, 1456–1464. 10.1139/v70-238. [DOI] [Google Scholar]
- Schweizer K. S.; Curro J. G. Integral-equation theory of the structure of polymer melts. Phys. Rev. Lett. 1987, 58, 246. 10.1103/physrevlett.58.246. [DOI] [PubMed] [Google Scholar]
- Chartrand P.; Pelton A. D. Modeling the charge compensation effect in silica-rich Na2O-K2O-Al2O3-SiO2 melts. Calphad 1999, 23, 219–230. 10.1016/s0364-5916(99)00026-7. [DOI] [Google Scholar]
- Couet A.; Motta A. T.; Ambard A. The coupled current charge compensation model for zirconium alloy fuel cladding oxidation: I. Parabolic oxidation of zirconium alloys. Corros. Sci. 2015, 100, 73–84. 10.1016/j.corsci.2015.07.003. [DOI] [Google Scholar]
- Masson C. R. An approach to the problem of ionic distribution in liquid silicates. Proc. Math. Phys. Eng. Sci. 1965, 287, 201–221. 10.1098/rspa.1965.0176. [DOI] [Google Scholar]
- Li K.; Khanna R.; Bouhadja M.; Zhang J.; Liu Z.; Su B.; Yang T.; Sahajwalla V.; Singh C. V.; Barati M. A molecular dynamic simulation on the factors influencing the fluidity of molten coke ash during alkalization with K2O and Na2O. Chem. Eng. J. 2017, 313, 1184–1193. 10.1016/j.cej.2016.11.011. [DOI] [Google Scholar]
- Du Y.; Yuan Y.; Li L.; Long M.; Duan H.; Chen D. Insights into structure and properties of P2O5-based binary systems through molecular dynamics simulations. J. Mol. Liq. 2021, 339, 116818. 10.1016/j.molliq.2021.116818. [DOI] [Google Scholar]
- Jiang C.; Li K.; Zhang J.; Qin Q.; Liu Z.; Liang W.; Sun M.; Wang Z. The effect of CaO (MgO) on the structure and properties of aluminosilicate system by molecular dynamics simulation. J. Mol. Liq. 2018, 268, 762–769. 10.1016/j.molliq.2018.07.123. [DOI] [Google Scholar]
- Jiang C.; Li K.; Zhang J.; Liu Z.; Niu L.; Liang W.; Sun M.; Ma H.; Wang Z. The effect of CaO and MgO on the structure and properties of coal ash in the blast furnace: A molecular dynamics simulation and thermodynamic calculation. Chem. Eng. Sci. 2019, 210, 115226. 10.1016/j.ces.2019.115226. [DOI] [Google Scholar]
- Ma S.; Li K.; Zhang J.; Jiang C.; Bi Z.; Sun M.; Wang Z.; Li H. The effects of CaO and FeO on the structure and properties of aluminosilicate system: A molecular dynamics study. J. Mol. Liq. 2021, 325, 115106. 10.1016/j.molliq.2020.115106. [DOI] [Google Scholar]
- Chen Y.; Pan W.; Jia B.; Wang Q.; Zhang X.; Wang Q.; He S. Effects of the amphoteric behavior of Al2O3 on the structure and properties of CaO-SiO2-Al2O3 melts by molecular dynamics. J. Non-Cryst. Solids 2021, 552, 120435. 10.1016/j.jnoncrysol.2020.120435. [DOI] [Google Scholar]
- Bi Z.; Li K.; Jiang C.; Zhang J.; Ma S.; Sun M.; Wang Z.; Li H. Performance and transition mechanism from acidity to basicity of amphoteric oxides (Al2O3 and B2O3) in SiO2-CaO-Al2O3-B2O3 system: A molecular dynamics study. Ceram. Int. 2021, 47, 12252–12260. 10.1016/j.ceramint.2021.01.074. [DOI] [Google Scholar]
- Bi Z.; Li K.; Jiang C.; Zhang J.; Ma S. Effects of amphoteric oxide (Al2O3 and B2O3) on the structure and properties of SiO2-CaO melts by molecular dynamics simulation. J. Non-Cryst. Solids 2021, 559, 120687. 10.1016/j.jnoncrysol.2021.120687. [DOI] [Google Scholar]
- Martínez L.; Andrade R.; Birgin E. G.; Martínez J. M. PACKMOL: A package for building initial configurations for molecular dynamics simulations. J. Comput. Chem. 2009, 30, 2157–2164. 10.1002/jcc.21224. [DOI] [PubMed] [Google Scholar]
- Plimpton S. Fast parallel algorithms for short-range molecular dynamics. J. Comput. Phys. 1995, 117, 1–19. 10.1006/jcph.1995.1039. [DOI] [Google Scholar]
- Zhang S.; Zhang X.; Bai C.; Wen L.; Lv X. Effect of TiO2 content on the structure of CaO-SiO2-TiO2 system by molecular dynamics simulation. ISIJ Int. 2013, 53, 1131–1137. 10.2355/isijinternational.53.1131. [DOI] [Google Scholar]
- Busing W. R. Interpretation of the Crystal Structure of Li2BeF4 in Terms of the Born-Mayer-Huggins Model. J. Chem. Phys. 1972, 57, 3008–3010. 10.1063/1.1678699. [DOI] [Google Scholar]
- Hennet L.; Drewitt J. W. E.; Neuville D. R.; Cristiglio V.; Kozaily J.; Brassamin S.; Zanghi D.; Fischer H. E. Neutron diffraction of calcium aluminosilicate glasses and melts. J. Non-Cryst. Solids 2016, 451, 89–93. 10.1016/j.jnoncrysol.2016.05.018. [DOI] [Google Scholar]
- Allegretti F.; O’Brien S.; Polcik M.; Sayago D. I.; Woodruff D. P. Adsorption bond length for H2O on TiO2 (110): A key parameter for theoretical understanding. Phys. Rev. Lett. 2005, 95, 226104. 10.1103/physrevlett.95.226104. [DOI] [PubMed] [Google Scholar]
- Demkov A. A.; Sankey O. F. Growth Study and Theoretical Investigation of the Ultrathin Oxide SiO2–Si Heterojunction. Phys. Rev. Lett. 1999, 83, 2038. 10.1103/physrevlett.83.2038. [DOI] [Google Scholar]
- Zhao Y.; Chen P.; Zhang B.; Su D. S.; Zhang S.; Tian L.; Lu J.; Li Z.; Cao X.; Wang B.; Wei M.; Evans D. G.; Duan X. Highly dispersed TiO6 units in a layered double hydroxide for water splitting. Chem. Eur J. 2012, 18, 11949–11958. 10.1002/chem.201201065. [DOI] [PubMed] [Google Scholar]
- Hao K.; Ge W.; Ren Z.; Liu X.; Luo L.; Li X.; Luo H.; Viehland D. Combining effects of TiO6 octahedron rotations and random electric fields on structural and properties in Na0.5Bi0.5TiO3. J. Am. Ceram. Soc. 2020, 103, 3349–3360. 10.1111/jace.16986. [DOI] [Google Scholar]
- Zhao C.-Y.; Zhang Y.; You X.-Z. Theoretical evaluation of strain, bent bonds, and bonding behavior of strained organic molecules. J. Phys. Chem. A 1997, 101, 5174–5182. 10.1021/jp9634262. [DOI] [Google Scholar]
- Wang Y.; Sakamaki T.; Skinner L. B.; Jing Z.; Yu T.; Kono Y.; Park C.; Shen G.; Rivers M. L.; Sutton S. R. Atomistic insight into viscosity and density of silicate melts under pressure. Nat. Commun. 2014, 5, 3241. 10.1038/ncomms4241. [DOI] [PubMed] [Google Scholar]
- Stebbins J. F.; Xu Z. NMR evidence for excess non-bridging oxygen in an aluminosilicate glass. Nature 1997, 390, 60–62. 10.1038/36312. [DOI] [Google Scholar]
- Farnan I.; Stebbins J. F. The nature of the glass transition in a silica-rich oxide melt. Science 1994, 265, 1206–1209. 10.1126/science.265.5176.1206. [DOI] [PubMed] [Google Scholar]
- Li Q.; Zhou D.; Zheng W.; Ma Y.; Chen C. Global structural optimization of tungsten borides. Phys. Rev. Lett. 2013, 110, 136403. 10.1103/physrevlett.110.136403. [DOI] [PubMed] [Google Scholar]
- Hinze J.; Jaffe H. H. Orbital electronegativity of neutral atoms. J. Am. Chem. Soc. 1962, 84, 540–546. 10.1021/ja00863a008. [DOI] [Google Scholar]
- Onoda J.; Ondráček M.; Jelínek P.; Sugimoto Y. Electronegativity determination of individual surface atoms by atomic force microscopy. Nat. Commun. 2017, 8, 15155. 10.1038/ncomms15155. [DOI] [PMC free article] [PubMed] [Google Scholar]
- Yan Z.; Lv X.; He W.; Xu J. Effect of TiO2 on the liquid zone and apparent viscosity of SiO2-CaO-8 wt % MgO-14 wt % Al2O3 system. ISIJ Int. 2017, 57, 31–36. 10.2355/isijinternational.isijint-2016-420. [DOI] [Google Scholar]
- Gao Y.; Bian L.; Liang Z. Influence of B2O3 and TiO2 on viscosity of titanium-bearing blast furnace slag. Steel Res. Int. 2015, 86, 386–390. 10.1002/srin.201400039. [DOI] [Google Scholar]
Associated Data
This section collects any data citations, data availability statements, or supplementary materials included in this article.


