

Abstract
The COVID-19 pandemic has disproportionately affected the elderly. This Article provides a detailed analysis of those effects, drawing primarily on individual-level mortality data covering almost three million persons aged 65+ in three Midwest states (Indiana, Illinois, and Wisconsin). We report sometimes surprising findings on population fatality rates (“PFR”), the ratio of COVID to non-COVID deaths, reported as a percentage, which we call the “Covid Mortality Percentage,” and mean life expectancy loss (“LEL”). We examine how these COVID-19 outcomes vary with age, gender, race/ethnicity, socio-economic status, and time period during the pandemic.
For all persons in the three Midwest areas, COVID PFR through year-end 2021 was 0.22%, mean years of life lost (“YLL“) was 13.0 years, the COVID Mortality Percentage was 12.4%, and LEL was 0.028 years (eleven days). In contrast, for the elderly, PFR was 1.03%; YLL was 8.8 years, the COVID Mortality Percentage was 13.2%, and LEL was 0.091 years (thirty-four days). Controlling for gender, PFR and LEL were substantially higher for Blacks and Hispanics than for Whites at all ages. Racial/ethnic disparities for the elderly were large early in the pandemic but diminished later. Although COVID-19 mortality was much higher for the elderly, the COVID Mortality Percentage over the full pandemic period was only modestly higher for the elderly, at 13.2%, than for non-elderly adults aged 25–64, at 11.1%. Indeed, in 2021, this ratio was lower for the elderly than for the middle-aged, reflecting higher elderly vaccination rates.
Keywords: COVID-19, life expectancy, COVID mortality rates
I. Introduction
The COVID-19 pandemic has not been kind to the elderly. By year-end 2021, about 825,000 Americans had died of COVID-19.1 Of these, 615,000 (75%) were elderly (persons aged 65+). The number of deaths attributed to COVID-19 during 2020 and 2021 trailed only those due to cancer and heart disease.2 Nursing homes were especially hard hit, with at least 151,000 deaths through March 13, 2022.3 We present here evidence on how the pandemic affected the elderly. Some of this evidence comports with conventional wisdom, but some will be surprising.
We report results primarily for three Midwest areas for which we have individual-level death data: Cook County, Illinois (which includes Chicago), the state of Wisconsin, and the state of Indiana. We combine this individual-level data with life-expectancy data for the elderly, measured using Medicare data. The COVID-19 population fatality rate (the fraction of the population which has died of COVID-19, “PFR”) for the three Midwest areas through year-end 2021 was 0.22%, with mean years of life lost per decedent (“YLL”) of 13.0 years. The ratio of COVID to non-COVID deaths, reported as a percentage, which we call the “Covid Mortality Percentage,” was 12.4%. Mean population life expectancy loss (“LEL”) was 0.028 years (eleven days). In contrast, for the elderly in the three Midwest areas, PFR was 1.03%; YLL was 8.8 years, the COVID Mortality Percentage was 13.2%, and LEL was 0.091 years (thirty-four days). National estimates for the elderly were similar to those for the three Midwest areas.4
Because we have individual-level data on age, gender, race/ethnicity, and zip code of residence for decedents in these three Midwest areas, we can estimate how PFR, YLL, the COVID Mortality Percentage, and LEL vary for subgroups of the elderly defined by age, gender, race/ethnicity, and socio-economic status (based on zip code). We can also estimate the predictive effect of each of these factors, controlling for the other factors, and assess how the pandemic’s effects have varied over time. This decomposition is not possible with national data, which is less granular.
We summarize here some surprising results, to encourage the reader to read further. First, PFR is a useful measure of pandemic severity. PFR is small for the young, but rises monotonically with age, to nearly six percent for those aged 95+. Yet, mortality rates from all other causes also rise with age and are higher for men than for women at any given age. One might then ask, controlling for age and gender, by what percentage did COVID-19 increase overall mortality? We call this measure the “COVID Mortality Percentage.” We find that over the full pandemic period, this percentage was only modestly higher for the elderly (13.2%) than for non-elderly adults aged 25–64 (11.1%). In 2021, after vaccines become available, the COVID Mortality Percentage is highest for ages 45–54, and drops as age increases (Figure 5).
FIGURE 5: COVID Mortality Percentage by Age and Gender: Three Midwest Areas.
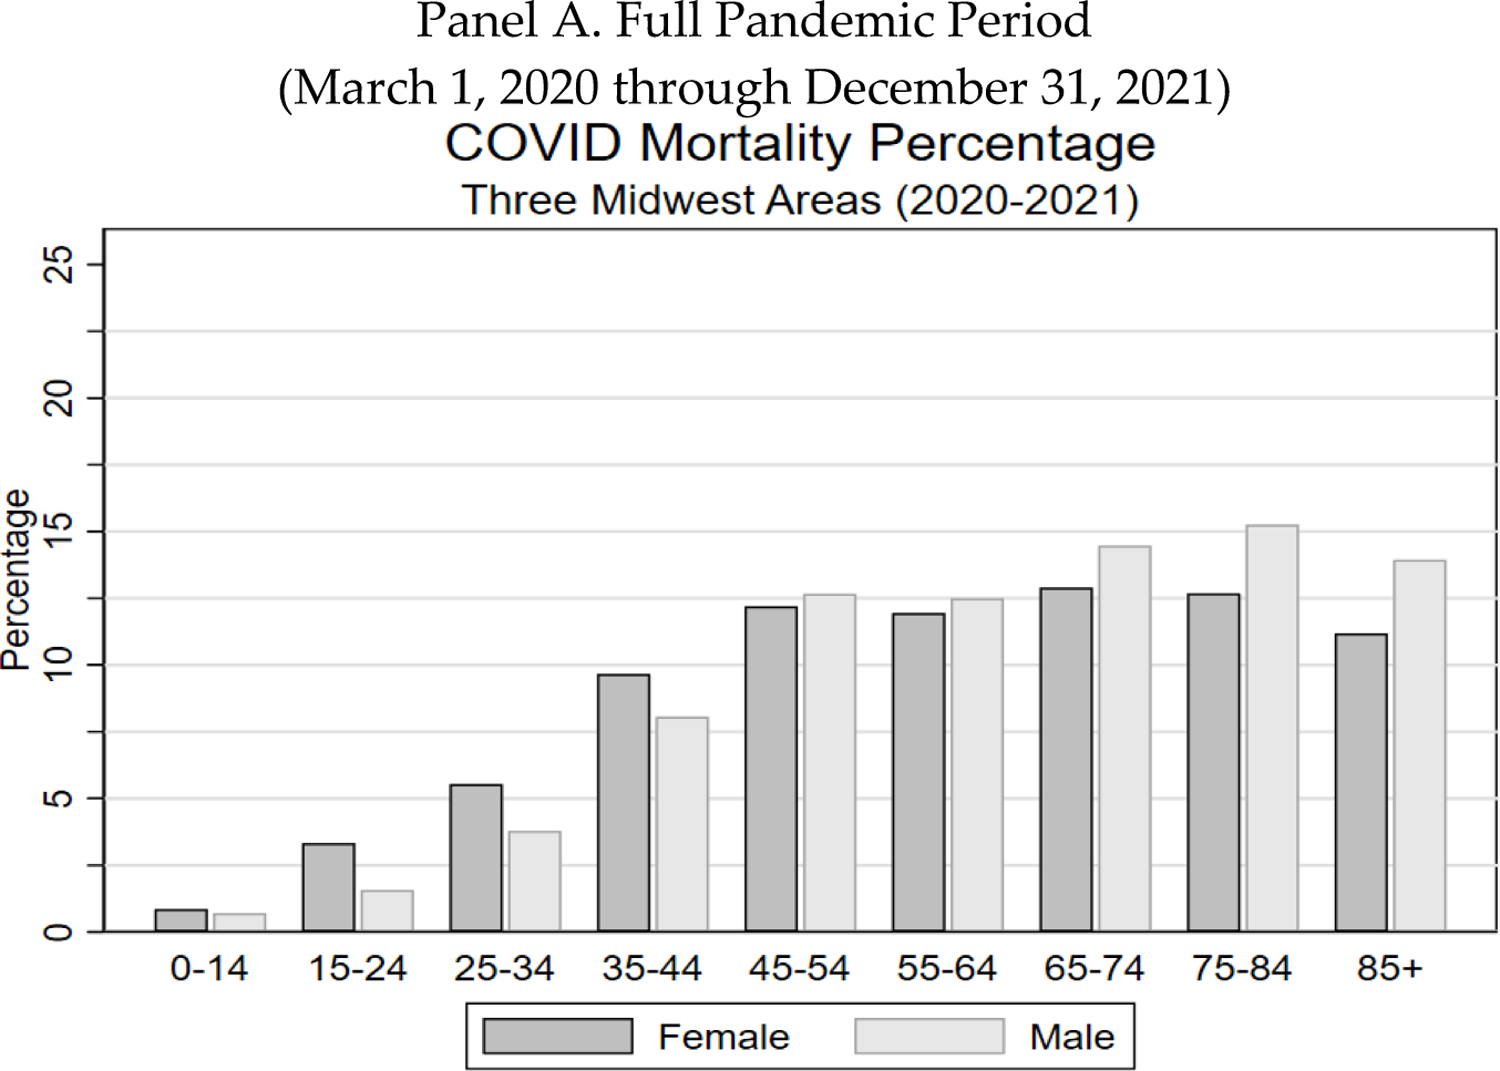
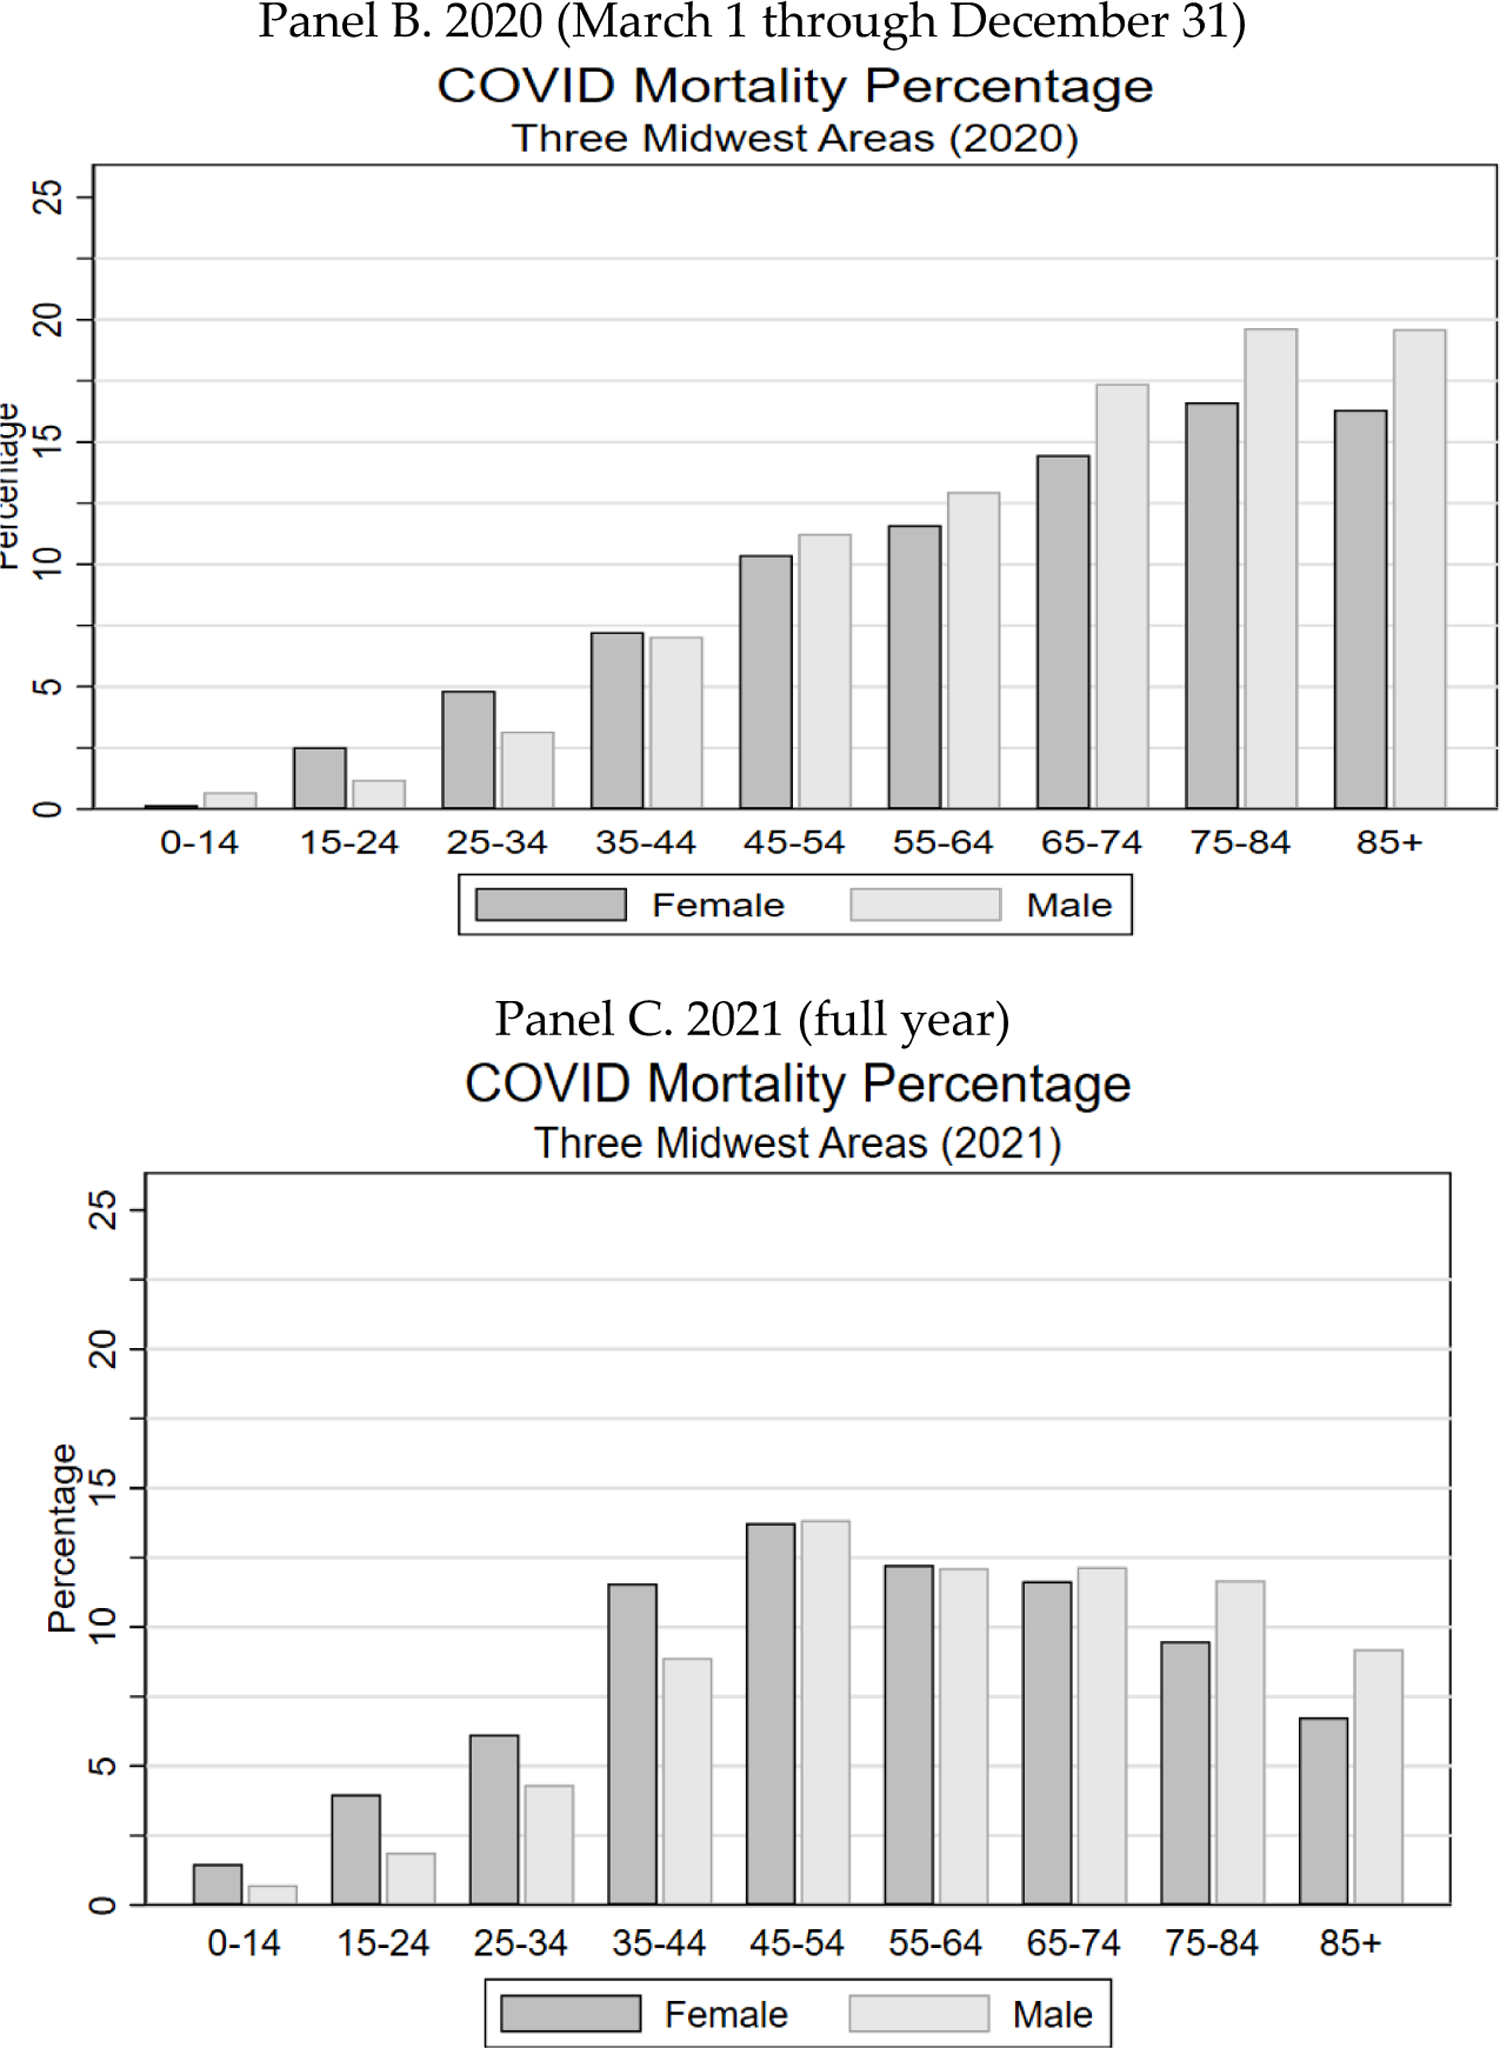
Figure shows COVID mortality percentage (ratio of COVID/non-COVID deaths) for the three Midwest areas, by age range and gender for indicated time periods. Panel A. Full pandemic period from March 1, 2020 through December 31, 2021. Panel B. 2020 (March 1–December 31). Panel C. All of 2021. Panel D. Second half of 2021.
Second, multiple published estimates of the impact of COVID-19 mortality on U.S. population life expectancy during 2020 reported LEL of 1–2 years overall, with substantially higher estimates for Blacks and Hispanics.5 One might assume that LEL during 2020 was higher than this for the elderly. This is not, however, how these life-expectancy estimates work. The published estimates use the period-based life-expectancy method.6 This method assumes that 2020 mortality rates will persist indefinitely and produces estimates that mechanically decline with age, as illogical as that sounds.7 Moreover, assuming that COVID-19 mortality declines in 2022 and thereafter, as is widely expected, estimates of COVID-19’s impact on life expectancy should assess the impact of a limited period of high mortality, rather than assume that pandemic-period levels will persist indefinitely. We therefore measure LEL using the cohort-based life expectancy approach, which treats the pandemic as a time-limited event.8 The cohort-based LEL estimates for the elderly through year-end 2021, reported above, can exceed three months.9 While substantial, this is a fraction of period-based estimates.
Third, COVID-19 is often seen as a pandemic mostly of the elderly, many of whom had limited life expectancy in any case. The view of COVID-19 as a disease of the elderly was an oversimplification even in 2020. As we show below, it became much less true in 2021, once vaccines became available. The elderly were eligible for vaccination earlier in 2021, and a higher percentage of the elderly chose to become vaccinated.10 As a result, the proportion of COVID-19 deaths occurring among the non-elderly rose. As noted above, the COVID Mortality Percentage in 2021 was highest for ages 45–54, for both men and women.11
Fourth, racial/ethnic disparities in COVID mortality rates, with higher mortality rates for Blacks and Hispanics, have been well-documented.12 We confirm those disparities and quantify them, controlling for age, gender, location, and socio-economic status (“SES”). But we also show that for the elderly, these disparities were largest early in the pandemic, and largely disappeared in the second half of 2021.13
Fifth, nursing homes suffered huge mortality rates early in the pandemic.14 However, the ratio of the PFR for nursing home residents to that for non-elderly adults plunged in the first half of 2021, although it began to rise again in September 2021, and rose further with the onset of the Omicron variant in early 2022.15
We discuss selected implications of our findings with regard to past COVID-19 policy successes and failures, as well as implications for current policies.
Two important cautions: first, we report associations, which may or may not be causal. Second, our estimates are for deaths that were recorded as COVID-related in death certificates. Total excess deaths during the pandemic, relative to those predicted from pre-COVID mortality rates, are significantly above those recorded as COVID-related. Our mortality estimates thus are not directly comparable to studies of all-cause excess mortality.16 The multivariate decomposition of COVID-19 mortality that we undertake here is not feasible for excess mortality, which is measured using less-granular national data. However, we have no reason to think that our conclusions would materially change if it were possible to study a broader measure of COVID-19-related deaths.
Some of the figures in this Article do not render well in black and white. Color versions of all figures are available in the working paper version of this article, available on SSRN.17
II. Sample and Research Methods
We provide here an overview of the dataset and methods for this study. The Appendix, available on SSRN,18 provides additional methodology details and supplemental results.
A. Study population
We rely on several datasets, covering different populations. We study primarily three Midwest areas (Cook County, Illinois, including the City of Chicago and nearby suburbs); the State of Indiana, and the State of Wisconsin), for which we are able to obtain individual-level COVID-19 mortality data from death certificates, from the onset of the pandemic in March 1, 2020, through December 31, 2021. These three areas have diverse and different demographics and a combined population of around eighteen million, including three million elderly.19 We have data on age, gender, race/ethnicity (White [non-Hispanic], Black, Hispanic [White], Asian, and other), and 5-digit residence zip code for the decedents. This data lets us conduct a detailed decomposition of how COVID mortality varies with age, gender, race/ethnicity, location (one of the three areas), and socio-economic status.
We combine this COVID-19-mortality data with data on elderly life expectancy obtained from a Medicare dataset described below, population data (from the American Community Survey [“ACS”] and the Census); and data on measures of socio-economic status (“SES”) from the ACS.
We use ACS data to calculate quintiles of the Graham Social Deprivation Index (“SDI”), as a measure of SES at the 5-digit zip-code level (call this “zip-SES”). The Graham SDI elements are percentages of: households who do not own a car; homes not owner-occupied; homes with more than one person per room, population aged 16–64 years unemployed, single-parent families, population aged 25+ with less than twelve years of education, and population below poverty line.20 Note that we observe zip-SES as an average for all persons living in a particular zip code, but do not observe individual-level SES.
Overview of Research Approach for the Three Midwest Areas
We study four principal outcomes of the COVID-19 pandemic:
PFR (the fraction of the population which died from COVID-19 during the pandemic, through Dec. 31, 2021);
the COVID Mortality Percentage (the ratio of deaths from COVID-19 to deaths from all other causes or, equivalently the COVID-19 PFR relative to the PFR from all other causes), converted to a percentage;
YLL for the decedents (mean years of life lost by the COVID decedents, based on their life expectancy if they had not died of COVID); and
LEL (the mean life expectancy lost by a population of persons; we compute this by summing life-years lost for each decedent, but it approximately equals PFR * YLL).
To estimate the COVID Mortality Percentage for a particular group, defined by a combination of age, gender, race/ethnicity and location, we divide COVID deaths by deaths from other causes, and then convert to a percentage. These percentages will underestimate the pandemic’s effect on mortality to the extent that COVID-19 deaths are underreported, or COVID-19 infection increases post-infection mortality from other causes. However, there is no obvious reason why an overall undercount would substantially affect relative percentages, say between subgroups defined by age or gender.
To estimate YLL for the elderly, we rely on a second unique dataset: Longitudinal data on a 5% random sample of Medicare fee-for-service (“FFS”) beneficiaries over 1999–2019, including gender, race/ethnicity, 5-digit zip code of residence, date of birth, and date of death. We use this dataset to estimate life expectancy (“LE”) for a group of persons with the same age, gender, race/ethnicity, location, and zip-SES as the decedent. We use this measure to estimate the life expectancy of each individual decedent, had that person not died of COVID.
To estimate LEL for the three Midwest areas, we first estimate LE for each COVID decedent at the time of death. Summing these values over all COVID decedents gives total years-of-life-lost due to COVID. We then divide years of life lost by the number of decedents to get YLL for that population, and we divide total years of life lost for all COVID-9 decedents by population to get LEL for that population.
For some results, we drop ages 0–19, 95+, or both, due to imprecise estimates for these ages. For racial/ethnic groups, we generally report results for Whites, Blacks, Hispanics, and Asians. Results for “other” race are generally similar to those for Blacks. For Hispanics and Asians age 85+, when we report estimates by year of age, we generally combine adjacent years (for example, 85–86, 87–88), because the smaller population for these groups produces noisy single-year estimates.
B. Overview of Research Approach for National Data
We also present some national estimates of PFR and LEL, for comparison with the estimates for the three Midwest areas. For the national estimates, we use state-level data (including the District of Columbia and Puerto Rico) on COVID-19 deaths by age, gender, and race/ethnicity from the Centers for Disease Control and Prevention (“CDC”). We obtain data on the population of each state, including distribution by age, gender, and race/ethnicity, from the U.S. Census Bureau. We can estimate PFR and YLL for groups, but not individuals. To estimate LEL for any particular group (for example, women aged 75–79), we multiply group PFR times group YLL.
C. Estimating Life Expectancy without COVID
For persons aged 65+, we estimate life expectancy using national Medicare data covering 2000–2018 for a 5% random sample of Medicare FFS beneficiaries aged 65+ in 2000. We first estimate survival through 2018 (thus, a 19-year estimation period), as a function of age in years, gender, age interacted with gender, race/ethnicity, state, and SDI, using the semi-parametric Cox proportional hazard model. We use this model to estimate mean survival time for persons aged 65+ in 2000. Since we only have nineteen years of survival data, we extrapolate the survival curves estimated during our observation period to age 100. Note that we estimate life expectancy for Medicare beneficiaries based on their age, gender, race/ethnicity, and residence zip-code), but not other individual characteristics, such as health status.
These estimates are based on the longevity of Medicare beneficiaries alive in 2000. We adjust them for changes in life expectancy from 2000–2018 by adding the increase in life expectancy over this period, if any (by age, gender, and race/ethnicity), using national data from the National Center for Health Statistics (“NCHS”), to the Cox-model estimates.22 In robustness checks, we obtained similar results with the Cox model and the parametric Gompertz model (see Appendix).
For persons aged 20–64, we use life expectancy reported by the NCHS, which is available by age, gender, and race/ethnicity (for Black, White, and Hispanic, but not Asian).23 For Asians, we use the NCHS average for Whites plus the Asian-White difference in life expectancy at age sixty-five measured from the Medicare data. For “other” race (who have survival times similar to Blacks in the Medicare sample), we use the NCHS data for Blacks.
D. Estimating COVID-19 PFR
To estimate COVID-19 PFR for the three Midwest areas, we obtain the number of COVID-19 related deaths from mortality records. For national estimates, we use state-level data. We do not estimate PFR for ages 0–19 because of the small number of COVID-19 deaths in this age range. For the elderly, to obtain the population denominator (recall that PFR = deaths divided by population) we construct a synthetic population by inflating our five percent Medicare random sample to match the ACS population in age, gender, and race/ethnicity for each zip code (in the Midwest areas analysis) or for each state (in the national analysis). The denominator for the non-elderly comes from ACS population estimates by age, gender, and race/ethnicity. When ACS does not provide population by individual year of age, we estimate population by year of age within an age group (e.g., age 22–24) using annual survival probabilities from NCHS.
We estimate COVID-19 mortality COVmort, using the following logit regression. The covariate vector X includes age (for which we use a cubic functional form (in age—sixty-five for the elderly; and age— twenty for the non-elderly), gender (female is the baseline), race/ethnicity (White is the baseline), SDI quintile (quintile one (highest zip-SES) is the baseline), and location (Indiana is the baseline). We observe in the data gender differences in the association of COVID-19 mortality with age and with race/ethnicity. We therefore also include in the covariate vector X interactions between gender and race/ethnicity and between gender and age. Equation (1) presents our regression model:
| (1) |
For the regression results reported in Table 2, we use this interaction model, which includes the two-way interactions gender*race/ethnicity and gender*age. For figures in which we that show PFR or LEL by race/ethnicity, we apply eqn. (1) to White, Black, and Hispanic subsamples separately, in order to obtain more accurate estimates of the effects of age on PFR and LEL within these subsamples.24
TABLE 2:
Dependence of COVID PFR on by Gender, Race/Ethnicity and Zip-SES: Three Midwest Areas
| Age 65+ (n=2,876,677) Decedents = 29,775 | |||
|---|---|---|---|
| (1) | (2) | (3) | |
| Male | 0.0053*** | 0.0053*** | 0.0053*** |
| (0.00013) | (0.00013) | (0.00013) | |
| SES Status | |||
| SDI Quintile = 2 | 0.0017*** | 0.0018*** | |
| (0.00021) | (0.00020) | ||
| SDI Quintile = 3 | 0.0028*** | 0.0029*** | |
| (0.00019) | (0.00018) | ||
| SDI Quintile = 4 | 0.0024*** | 0.0027*** | |
| (0.00019) | (0.00018) | ||
| SDI Quintile = 5 | 0.0040*** | 0.0061*** | |
| (0.00021) | (0.00020) | ||
| Race/Ethnicity | |||
| Black | 0.0052*** | 0.0070*** | |
| (0.00029) | (0.00028) | ||
| Hispanic | 0.0095*** | 0.0110*** | |
| (0.00046) | (0.00048) | ||
| Asian | 0.0022*** | 0.0025*** | |
| (0.00050) | (0.00050) | ||
| Other | 0.0113*** | 0.0114*** | |
| (0.00105) | (0.00105) | ||
| Race/Ethnicity by Gender | |||
| Black Male | 0.0063*** | 0.0084*** | |
| (0.00045) | (0.00046) | ||
| Hispanic Male | 0.0137*** | 0.0158*** | |
| (0.00074) | (0.00078) | ||
| Asian Male | 0.0026*** | 0.0029*** | |
| (0.00079) | (0.00080) | ||
| Other Male | 0.0168*** | 0.0168*** | |
| (0.00183) | (0.00182) | ||
| Black Female | 0.0042*** | 0.0058*** | |
| (0.00032) | (0.00033) | ||
| Hispanic Female | 0.0061*** | 0.0072*** | |
| (0.00054) | (0.00057) | ||
| Asian Female | 0.0018*** | 0.0022*** | |
| (0.00063) | (0.00064) | ||
| Other Female | 0.0069*** | 0.0071*** | |
| (0.00121) | (0.00121) | ||
| Mean PFR | 0.0122 (men); 0.0089 (women); 0.0104 (all elderly) | ||
Table 2 shows marginal effects from logit regressions for the three Midwest areas, for period from March 1, 2020, through December. 31, 2021. SES status is measured at 5-digit zip code level using Graham Social Deprivation Index. Omitted groups are female, white, live in Indiana, and SDI quintile 1 (highest SES). Regression includes coefficients on location (Wisconsin, Indiana, Cook County), and age (estimated using a cubic polynomial in (age–65), coefficients are suppressed. Data on SDI is only available for ages 65+. Standard errors (clustered on person to account for use of one Medicare beneficiary multiple times in the synthetic population for age 65+) are shown in parentheses.
indicates statistical significance at the 10%, 5%, and 1% levels, respectively.
We use the coefficients from the logit model above to construct the conditional PFR for persons in the three Midwest areas, through December 31, 2021, within a group that is based on combination of a (age), g (gender), r (race/ethnicity), D (SDI quintile, only available for the elderly),25 and l (location, one of the three areas), as, with individuals indexed by i:
| (2) |
For national estimates, we proceed similarly, except location is a state (including D.C. and Puerto Rico) and we cannot condition on SES.
E. Estimating the COVID Mortality Percentage
We estimate the COVID Mortality Percentage by dividing COVID-19 deaths by all other deaths (generally, total deaths minus COVID-19 deaths), and then converting to a percentage:
For the denominator for the three Midwest areas, we use actual non-COVID-19 deaths for Indiana and Wisconsin and county-level estimates for Cook County, Illinois.26
F. Calculating Life Expectancy Loss (LEL) Due to COVID Using the Cohort Approach
For any group, defined by a combination of age, gender, race/ethnicity, zip-SES, and location, we can estimate both life expectancy without COVID (“LE”) and PFR. We can combine these estimates to estimate life expectancy loss due to COVID (“LEL”). This is simple multiplication:
| (3) |
For the three Midwest areas, we instead determine LEL by estimating life expectancy for each individual decedent, summing these values, and then dividing by population. This will be similar to, but more accurate than, the estimate using group-based approach reflected in eqn. (3). For national estimates, we have only group-level data, so rely on eqn. (3).
The cohort approach is based on mortality during a defined period of time—in our case, the COVID-19 pandemic period from March 1, 2020, through December 31, 2021. This is both a limitation and a strength. The limitation is that the cohort approach does not include COVID-19 deaths in 2022 or after. One could address this limitation by a combination of updating the dataset to a more recent date, and modeling future COVID-19 deaths after that date.27 The strength of the cohort approach is the flip side of this limitation. Unlike the period approach, the cohort approach does not require extrapolating COVID-9 mortality into the far future.
G. The Period Approach to Life Expectancy Loss
To compare our LEL estimates, which use the cohort-based approach to life expectancy, to the period-based approach used in other studies, we compute period-based LEL, using our own data for the three Midwest areas. The period-based approach assumes that current mortality risk, whether from COVID-19 or anything else, will persist at the same level throughout a person’s lifetime.28 Thus, to estimate the effect of COVID-19 on mortality in 2020, one would assume that a person aged twenty (say) in 2020 faced the actual 2020 risk of COVID-19 mortality for persons of this age; that this person would face in 2021 the 2020 risk of COVID mortality for persons aged twenty-one (assuming survival to twenty-one, based on all other causes of death); that this person would face in 2022 the 2020 risk of COVID-19 mortality for persons aged twenty-two (assuming survival from twenty to twenty-two, based on all other causes of death), and so on. One would sum LEL for this person from COVID-19 at age twenty, plus LEL for this person at age twenty-one (assuming survival to age twenty-one), plus LEL for this person at age twenty-two (assuming survival to age twenty-two), and so on. The summation is conventionally carried out to age 100.
More formally, consider a person aged a; let PFRa denote COVID mortality risk in 2020 from age a to age a+1, LEa be life expectancy at age a, LELa be life expectancy loss due to COVID from age a to age a+1 (LELa = LEa * PFRa); sa be probability of survival from age a to age a+1 due to all other causes of death; and surva be the total probability of survival from age a to age a+1 (surva = sa * (1-PFRa)). The period-based approach measures total LEL (call this LEL-pera) by summing the annual LELa values over an expected future lifetime. More formally:
| (4) |
In this example, LEL depends solely on age, but one can also define period-based LEL for a narrower group; for example, a group defined by age, gender, and race/ethnicity. We use national estimates of survival probabilities as of 2018, from NCHS.29
It should be apparent from this formula that period-based LEL is mechanically decreasing with age. The higher the initial age a, the fewer the terms in the sum. We discuss below the counterintuitive nature of this result, when applying the period-based approach to COVID-19.
III. Results
A. Summary Statistics for the Three Midwest Areas
Table 1 presents summary statistics for the population of the three Midwest areas, including COVID decedents, for the major racial/ethnic groups we consider here. The three areas combined have substantial minority populations, sufficient to let us estimate COVID-19 metrics for the principal groups we study here: Whites, Blacks, Hispanics, and Asians. The combined estimated population of Cook County, Wisconsin, and Indiana in 2019 was 17,704,887, including 10,407, 493 aged 20–64 and 2,880,502 aged 65+. Through December 31, 2021, 38,075 residents of these areas aged 20+ had died of COVID, of whom 29,775 (78.2%) were aged 65+.
TABLE 1:
Summary Statistics for Population and Covid Decedents: Three Midwest Areas
| Age range | 20–64 | 65+ | ||||||
|---|---|---|---|---|---|---|---|---|
| COVID deaths | Population | COVID deaths | Population | |||||
| No. | % | No. | % | No. | % | No. | % | |
| Cook County | ||||||||
| White | 728 | 24.53 | 1,412,662 | 44.99 | 3,912 | 47.63 | 458,330 | 59.05 |
| Black | 1,053 | 35.48 | 721,275 | 22.97 | 2,369 | 28.84 | 181,387 | 23.37 |
| Hispanic | 1,055 | 35.55 | 727,346 | 23.16 | 1,345 | 16.38 | 82,791 | 10.67 |
| Asian | 76 | 2.56 | 232,513 | 7.40 | 352 | 4.29 | 46,890 | 6.04 |
| Other | 56 | 1.89 | 46,342 | 1.48 | 235 | 2.86 | 6,732 | 0.87 |
| Total | 2,968 | 100.00 | 3,140,138 | 100.00 | 8,213 | 100.00 | 776,130 | 100.00 |
| Indiana | ||||||||
| White | 2,443 | 73.50 | 3,167,531 | 81.52 | 11,753 | 88.83 | 984,937 | 90.82 |
| Black | 504 | 15.16 | 354,985 | 9.14 | 1,033 | 7.81 | 63,696 | 5.87 |
| Hispanic | 331 | 9.96 | 223,783 | 5.76 | 319 | 2.41 | 18,862 | 1.74 |
| Asian | 34 | 1.02 | 81,005 | 2.08 | 100 | 0.76 | 8,372 | 0.77 |
| Other | 12 | 0.36 | 58,085 | 1.49 | 26 | 0.20 | 8,614 | 0.79 |
| Total | 3,324 | 100.00 | 3,885,389 | 100.00 | 13,231 | 100.00 | 1,084,481 | 100.00 |
| Wisconsin | ||||||||
| White | 1,395 | 69.72 | 2,829,470 | 83.66 | 7,391 | 88.90 | 958,326 | 93.96 |
| Black | 255 | 12.74 | 206,460 | 6.10 | 449 | 5.40 | 29,018 | 2.85 |
| Hispanic | 231 | 11.54 | 189,423 | 5.60 | 262 | 3.15 | 14,576 | 1.43 |
| Asian | 71 | 3.55 | 87,253 | 2.58 | 108 | 1.30 | 8,923 | 0.87 |
| Other | 49 | 2.45 | 69,360 | 2.05 | 104 | 1.25 | 9,048 | 0.89 |
| Total | 2,001 | 100.00 | 3,381,966 | 100.00 | 8,314 | 100.00 | 1,019,891 | 100.00 |
| All Three Areas | ||||||||
| White | 4,570 | 55.06 | 7,409,663 | 71.20 | 23,073 | 77.49 | 2,401,593 | 83.37 |
| Black | 1,813 | 21.84 | 1,282,720 | 12.32 | 3,851 | 12.93 | 274,101 | 9.52 |
| Hispanic | 1,619 | 19.51 | 1,140,552 | 10.96 | 1,926 | 6.47 | 116,229 | 4.04 |
| Asian | 181 | 2.18 | 400,771 | 3.85 | 560 | 1.88 | 64,185 | 2.23 |
| Other | 117 | 1.41 | 173,787 | 1.67 | 365 | 1.23 | 24,394 | 0.85 |
| Total | 8,300 | 100.00 | 10,407,493 | 100.00 | 29,775 | 100.00 | 2,880,502 | 100.00 |
Table 1 shows number of persons, who died of COVID-19 in the three Midwest areas over March 1, 2020 - December 31, 2021, and the population of each area in 2019, separately for ages 20–64 and age 65+; by race/ethnicity (White, Black, Hispanic (white), Asian, other).
As is true for the U.S. as a whole, the white population of the three Midwest areas is older than those for other racial/ethnic groups. Conversely the Asian and especially the Hispanic population is relatively young. This makes it crucial to control for age when assessing of the predictive power of race/ethnicity for COVID-19 metrics.
B. An Overview of the COVID Waves
In Figure 1, we provide an overview of the COVID waves that were relevant to the three Midwest areas: a large initial wave in March-April 2020, an even larger wave in winter 2020/2021, another large wave in summer 2021 reflecting the Delta variant, which was more infectious and more severe than earlier variants, and a fourth wave in winter 2021/2022, which began with Delta as the dominant variant, but with the Omicron variant becoming dominant by January 2022. Nationally, there was an additional wave in summer 2020 which was important in a number of southern states, but not for the three Midwest areas. Both panels show six lines, for ages 35–44, 45–54, 55–64, 65–74, 75–84, and 85+. Panel A shows total deaths. Panel B shows PFR.
FIGURE 1: The COVID Waves.
Panel A shows monthly COVID-19 deaths in the three Midwest areas for indicated age ranges over March 1, 2020 through December 31, 2021. Panel B shows monthly COVID PFR (per 100,000 people) for these age ranges over the same period.
A striking feature of Panel A is that the lines shift places over time. Early in the pandemic, before vaccines were available, the absolute numbers of deaths were in strict age order. In contrast, during the Delta wave in summer 2021, deaths for those 85+ were below those for (depending on the specific month) two or three of the next younger groups: 55–64, 65–74, and 75–84. In Panel B, PFR is always in age order, but the differences between age groups are much smaller by mid-2021 than earlier in the pandemic.
C. Population Fatality Rate and Life Expectancy Loss for the Elderly
1. THREE MIDWEST AREAS: REGRESSION RESULTS FOR PFR
In Table 2, we present results from a multivariate analysis of the predictive power of age, location, gender, race/ethnicity, and zip-SES on elderly PFR, for the three Midwest areas. In column (1) we control for both SES and race/ethnicity; in column (2) we control only for race/ethnicity, and in column (3) we control only for SES. We report marginal effects. Thus, for example, the coefficient of 0.0053 for Male in column (1) means that other things equal, PFR is 0.53% higher for men than for women. We report the marginal effects of race/ethnicity separately for men and women because of a significant interaction between those factors.
Men have higher COVID-19 mortality than women, at all ages (See Figure 2). This is reflected in the mean PFR for all elderly men of 1.22%, versus mean PFR for all elderly women of 0.89% (bottom rows of Table 2), and in the marginal effect of male gender of 0.0053 (0.53%), which indicates 0.53% higher PFR controlling for age, race/ethnicity, and zip-SES. One potential reason for higher male COVID-19 mortality is that men tend to have more comorbidities than women, controlling for age. A number of comorbidities, including obesity, diabetes, and kidney disease, are associated with higher COVID-19 mortality risk.30
FIGURE 2: PFR by Age, Gender, and Race/Ethnicity, Three Midwest Areas, Ages 65–95.
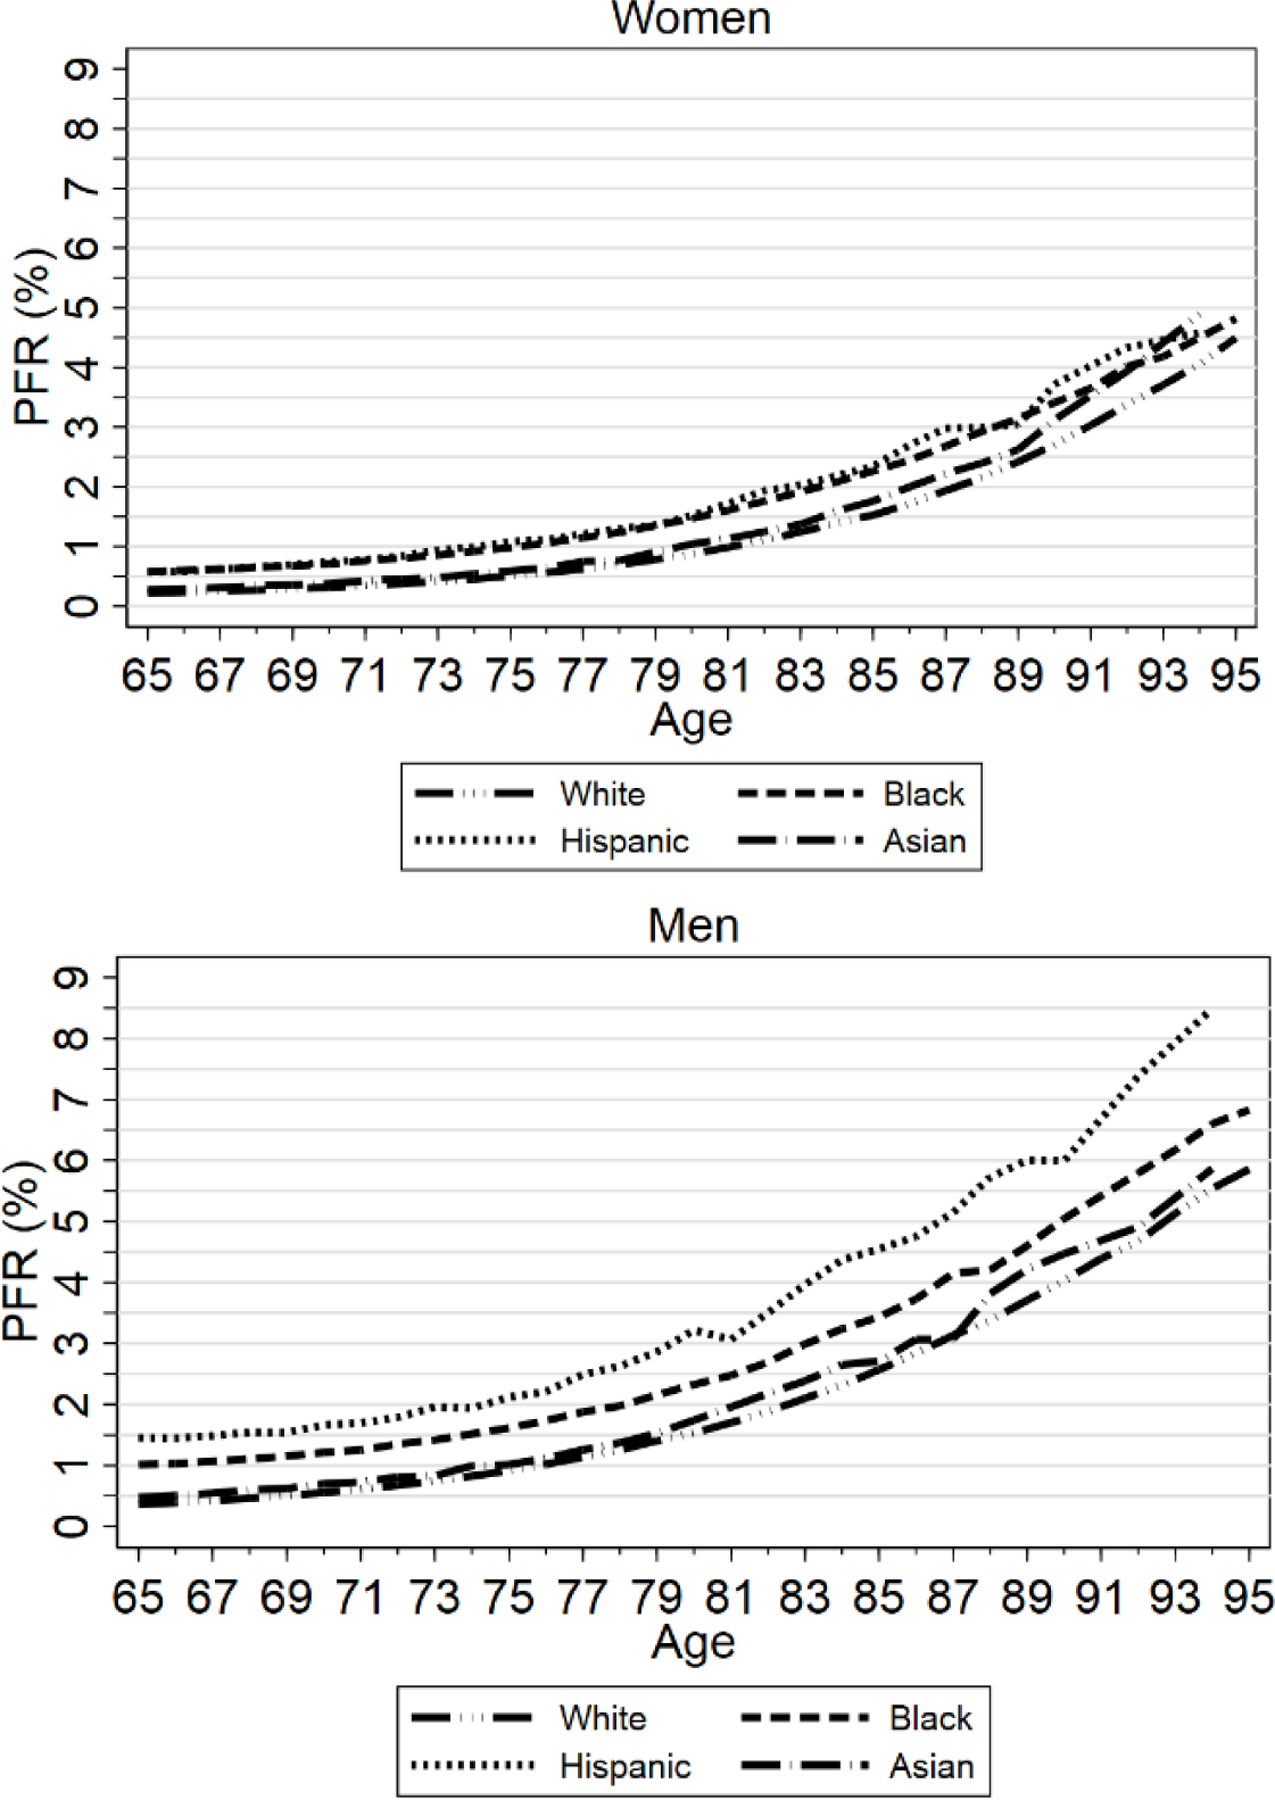
Figure shows estimated COVID PFRs, modeled using eqn. (2), by age and race/ethnicity, pooled across the three Midwest areas and across zip-SES quintiles, separately for women (top graph) and men (bottom graph). PFR by race/ethnicity is estimated within the appropriate subsamples. For Hispanics and Asians, data for ages 90+ is two-year average (data point for age 90 covers ages 90–91, and so on).
Living in a lower-SES zip code predicts higher mortality. COVID-19 PFR is lowest for zip-SES quintile one (the omitted group), and highest for zip-SES quintile five, even if we separately control for race/ethnicity, which is correlated with zip-SES. The magnitudes are roughly 20% higher mortality for zip-SES quintile two, compared to quintile one, 25–30% higher mortality for quintiles three and four, and 50% higher mortality for quintile five. The extra risk for persons living in a quintile five zip code is similar to the extra mortality risk from being male or from being Black (averaged across genders). Higher mortality in lower-SES areas could plausibly reflect some combination of lower-SES persons being more likely to become infected, having more comorbidities, and perhaps receiving lower-quality health care. However, essentially all elderly U.S. citizens and permanent residents have Medicare insurance,31 and we can measure comorbidities in the Medicare data. We find only a modest increase in the number of comorbidities as one moves from zip-SES quintile one to quintile five (see Appendix Figure App-1).
Being Hispanic, “other” race, Black, or to a lesser extent Asian, predicts higher COVID-19 mortality. The coefficients on the race/ethnicity variables in column (1) are substantially larger for men than for women. We lack a good explanation for this gender difference, which is in addition to the generally higher mortality from being male. The race/ethnicity coefficient is largest for men of “other” race. For this group, the 0.0168 coefficient, relative to mean PFR of 0.0122 for all elderly men, implies that elderly men of “other” race have more than twice the average PFR of all elderly men. The marginal effect for Hispanic men is also large at 0.0137. The marginal effect for Black men is about half of that for Hispanic men. “Other” race, Hispanic, and Black women also faced higher mortality than Whites (the omitted group), but less sharply than for men.
The marginal effects of race/ethnicity are somewhat smaller, but still substantial if we control for zip-SES, as in column (1), versus not doing so in column (2). This provides evidence that zip-SES differences can explain only a fraction of the higher mortality of racial/ethnic minorities.
In Column (3), we study the predictive effect of SES, without controlling for race/ethnicity. For zip-SES quintiles two and three, extra mortality relative to the omitted quintile one is almost unchanged. For the lowest zip-SES quintile (quintile five), the coefficient is higher in column (3). Black and Hispanic representation in quintile five is well above the national average. This leads to the coefficient on zip-SES capturing some of the predictive effect of the omitted race/ethnicity variables.
2. THREE MIDWEST AREAS: PFR BY AGE, GENDER, AND RACE/ETHNICITY:
Figure 2 presents PFR by age, gender, and race/ethnicity for the elderly aged 65–95. We end the graphs at age ninety-five because small numbers of decedents at higher ages lead to erratic estimates. For Hispanics and Asians, we provide biannual rather than annual estimates for ages 85–95 for similar reasons. The left-hand graph presents results for women; the right-hand graph presents results for men.
We show lines for Whites, Blacks, Hispanics, and Asians. A line for all decedents would be visually similar to the already-overlapping White and Asian lines. PFR rises with age. Most elderly persons know they face greater COVID-19 risk. The elderly generally have higher vaccination rates than the non-elderly (Figure 6) and may be more careful in other ways, and thus, are less likely to be infected than younger persons.32 However, their lower infection rate is not sufficient to offset higher mortality if infected. For women, PFR rises from under 0.5% on average at age sixty-five to 4.5% at age ninety-five. For men, PFR rises with age from around 0.5% at age sixty-five to around 6% at age ninety-five.
FIGURE 6: National Vaccination Rates by Age and Time (Jan. 1, 2021 through Mar. 25, 2022).
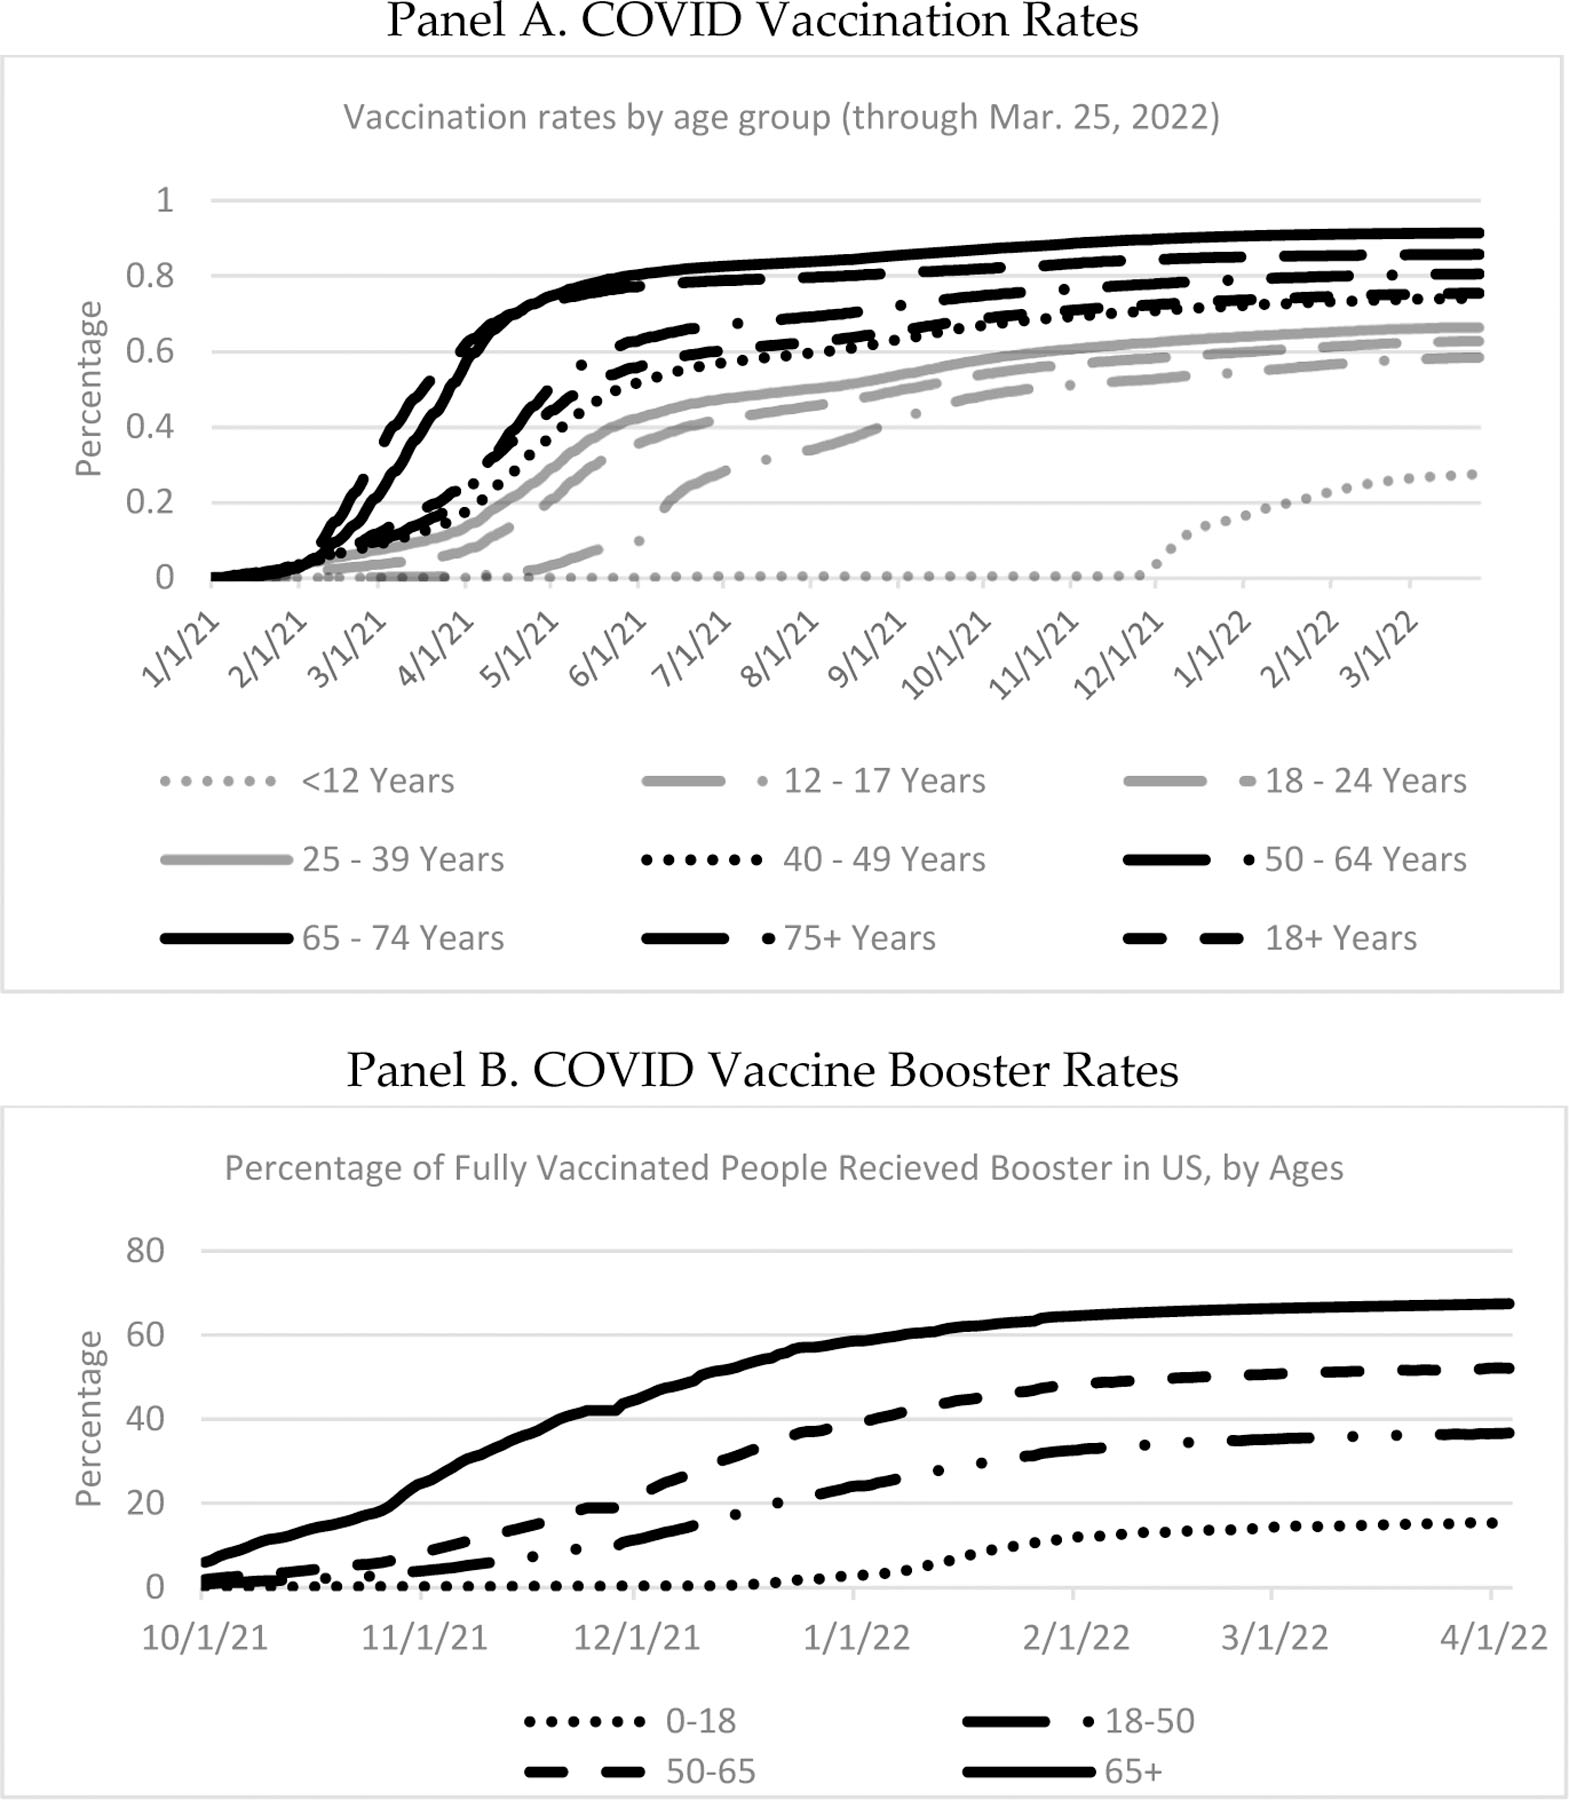
Source: CDC. Panel A. National estimates of vaccination rates by age group, from Jan. 1, 2021, through Mar. 25, 2022. Vaccination is two doses for the Pfizer and Moderna vaccines; one dose for the Johnson & Johnson vaccine. Panel B. National estimates of vaccine booster rates by age group, from Oct. 1, 2021 through Apr. 4, 2022. Both panels. The age ranges are those available from the CDC and are different for booster doses than for primary vaccination.
For women, White and Asian mortality is similar, as is Black and Hispanic mortality, but mortality for Black and Hispanic women is higher than White or Asian mortality at most ages, before converging in one’s early 90’s. For men, mortality is highest for Hispanics, next highest for Blacks, and similar for Whites and Asians.
It is difficult to assess from Figure 2 how the ratio of, say, Hispanic to White or Black to White PFR varies with age. We therefore present these differences as ratios in Figure 3. We group the sample into 5-year age ranges because annual or biannual ratios are erratic; the highest data point covers ages 90+. For women, the Black/White and Hispanic/White ratios are generally around 1.5 but converge to around 1.0 for ages 90+; conversely, the Asian/White ratio rises with age and is around 1.5 for ages 85+. For men, the Black/White and Hispanic/White ratios generally decline with age. Asian-to-White ratios are close to one, but rise to above one at high ages.
FIGURE 3: Ratios of Black, Hispanic, and Asian to White PFR by Age, Three Midwest Areas, Ages 65+.
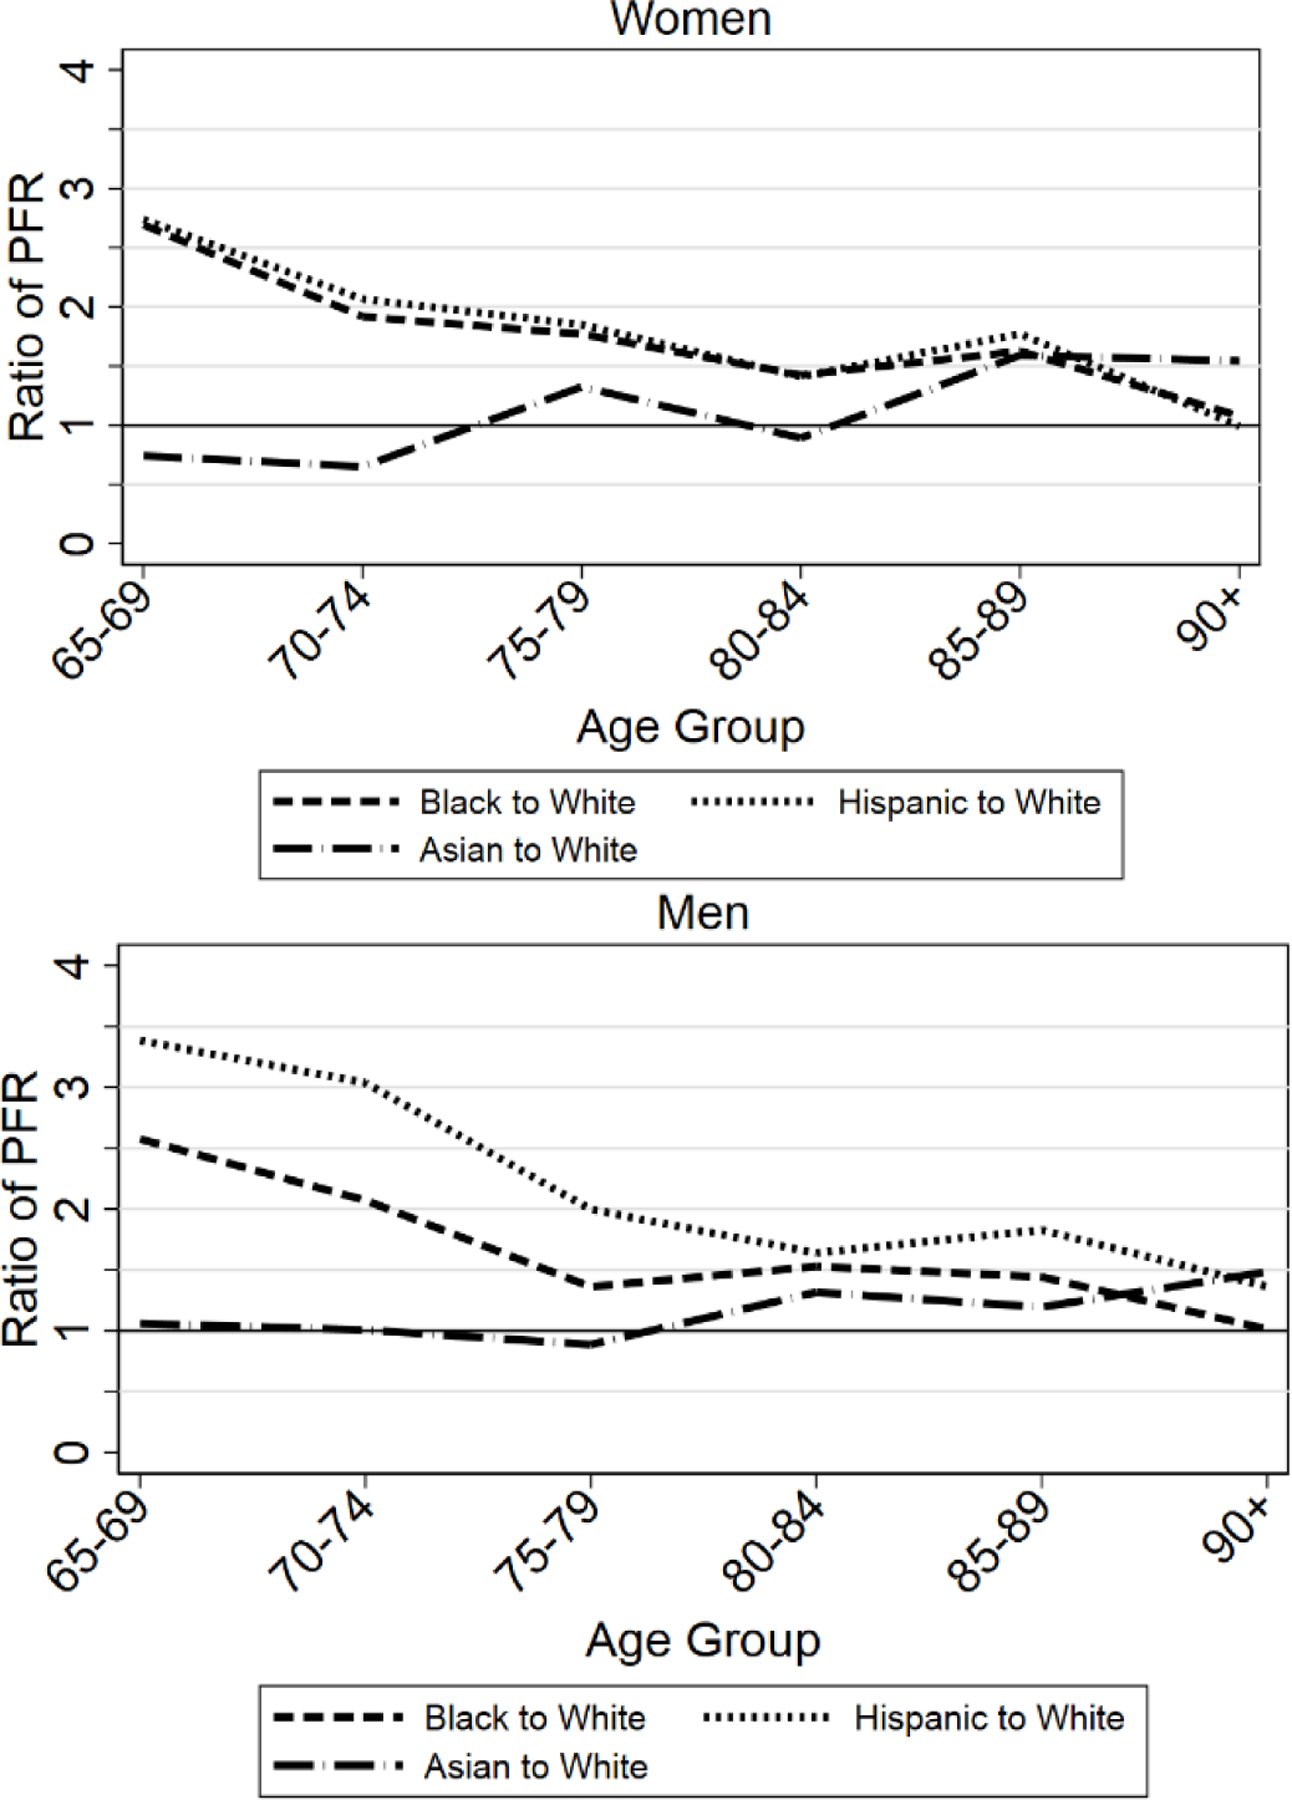
Figure shows ratio of COVID PFRs for Blacks, Hispanics, and Asians relative to Whites, pooled across the three Midwest areas, for women (top graph) and men (bottom graph), for ages 65–95.
3. PFR RATIOS OVER TIME
In Figure 4, we examine the Hispanic/White, Black/White, and Asian/White PFR ratios from a different perspective, by studying them over time during the pandemic. We present these ratios by calendar quarter. The first data points, for the second quarter of 2020 (2Q 2020) include the first four pandemic months, March-June 2020. The ratios vary a fair amount. The Black/White ratio is well above one in the second quarter of 2020 and the second quarter of 2021, but close to one in other quarters. The Hispanic/White ratio is well above one through the first half of 2021, but around one after this. The Asian/White ratio is meaningfully above one only in the second quarter of 2020, is often below one after that, and is substantially below one in the second half of 2020.
FIGURE 4: Ratios of Black, Hispanic, and Asian to White PFR by Calendar Quarter, Three Midwest Areas, Ages 65+.
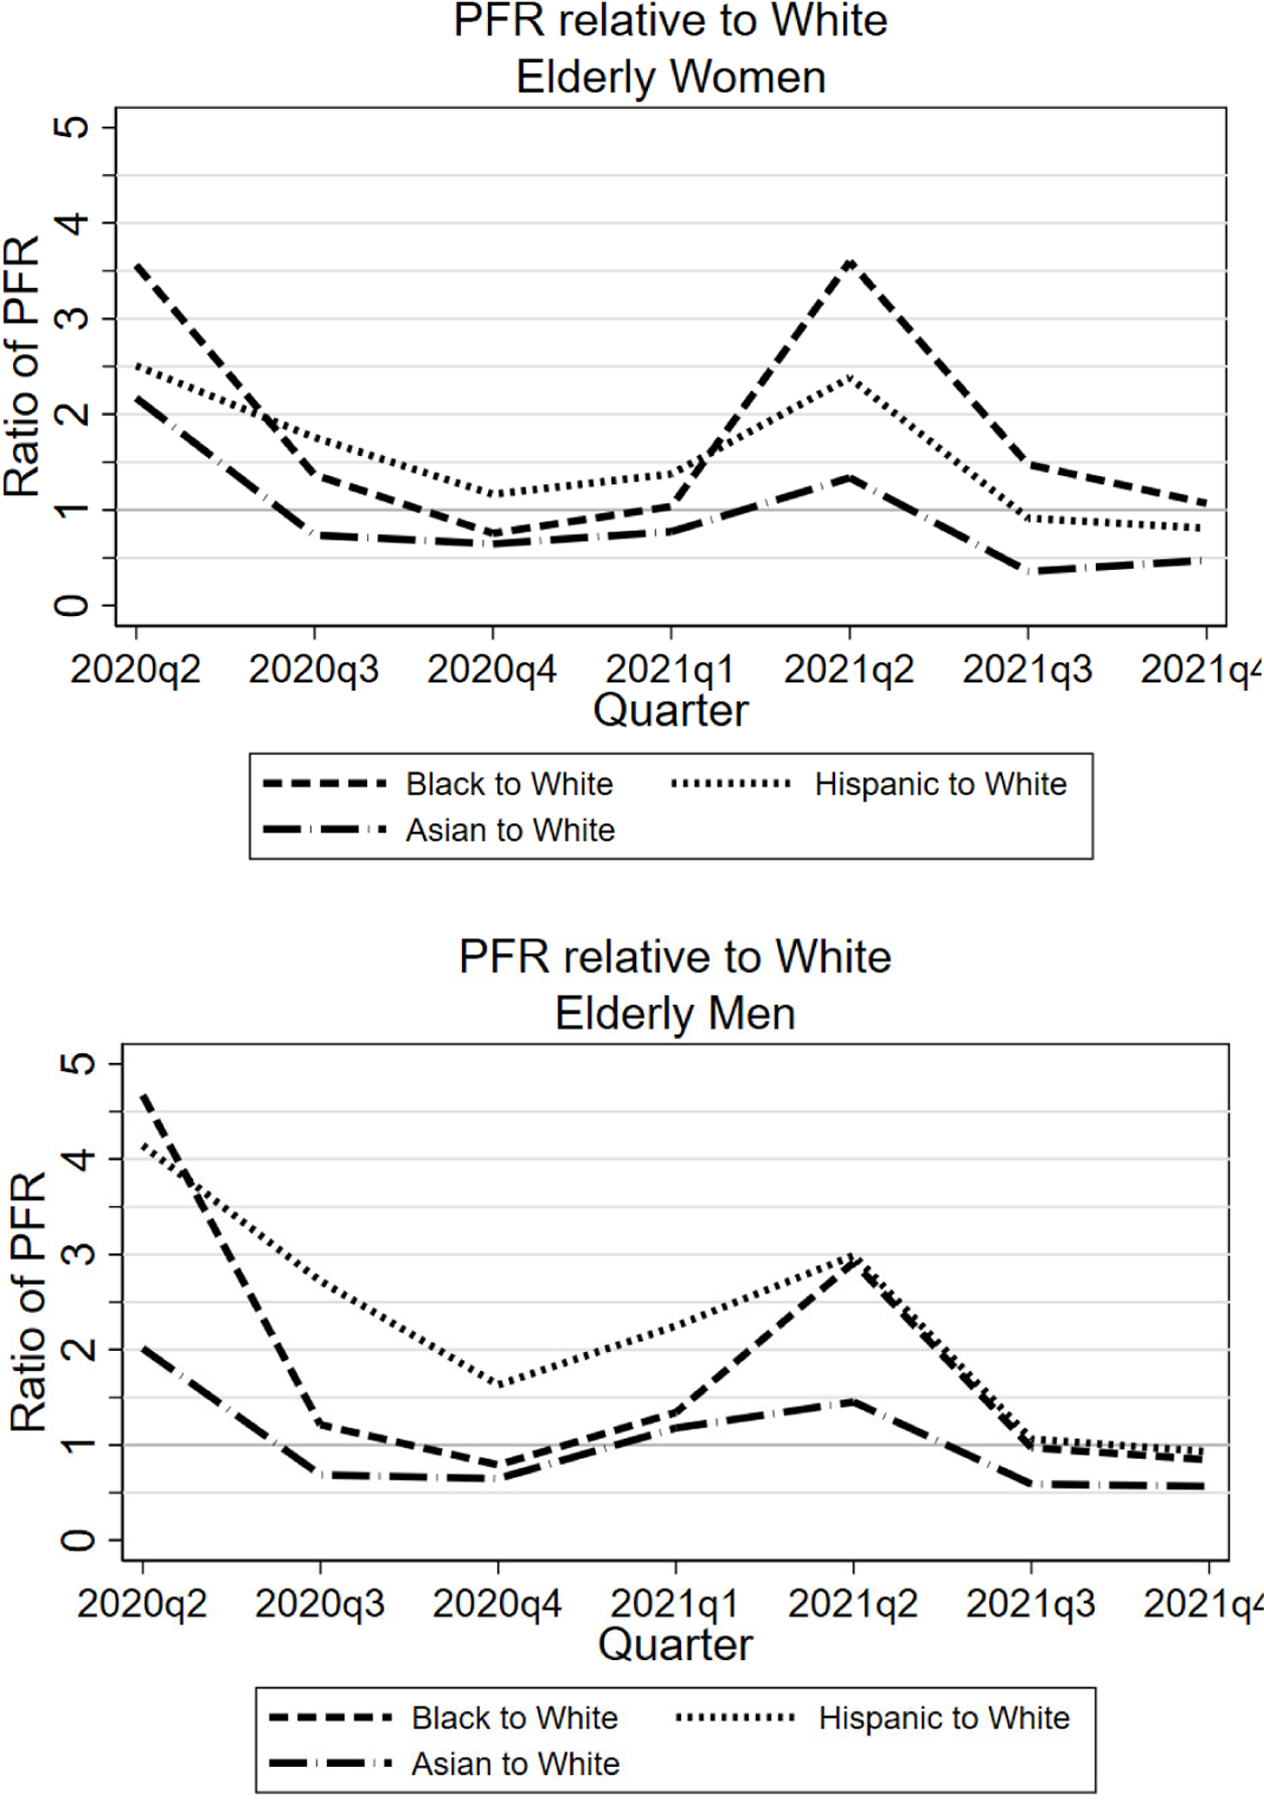
Figure shows, by calendar quarter, ratio of COVID PFRs for Blacks, Hispanics, and Asians relative to Whites, pooled across the three Midwest areas, for women (top graph) and men (bottom graph). Data points for 2Q 2020 covers March-June.
D. COVID Mortality Percentage Over Time
1. COVID-19 MORTALITY PERCENTAGE BY AGE AND GENDER
COVID-19 mortality rises rapidly with age. But so does mortality from other causes. COVID-19 mortality is higher for men than for women. But men face higher mortality from other causes as well. It can be informative, in understanding the extent to which COVID-19 made the world a riskier place for the elderly, to ask by what percentage did the COVID-19 pandemic cause mortality to increase?
We present information on that question in Figure 5. Panel A presents the COVID Mortality Percentage by age range, separately for men and women, for the full pandemic period; panel B presents results for 2020, panel C for all of 2021, and panel D for the second half of 2021.
For the full period, male extra mortality rises rapidly with age to about 20% for ages 75–84, and falls to 14% for ages 85+. For women, COVID-19 mortality as a percentage of non-COVID-19 mortality also initially rises with age to around 12% for ages 45–54, is roughly flat though age eighty-four, and falls at higher ages, to around 11% for ages 85+. COVID-19 is often viewed as a disease principally of the old. Yet by this measure—the COVID Mortality Percentage—it is also very much a disease of the middle-aged.
2. COVID MORTALITY PERCENTAGE OVER TIME: IMPACT OF VACCINATION
In Figure 5, Panels B and C, we present similar information, for 2020 and 2021 respectively. For 2020, the COVID Mortality Percentage gradually rises with age through ages 65–74 for women and 75–84 for men, but then flattens or declines. Female rates are higher up to age 44, similar to male rates for ages 45–74, and lower for ages 75+. The pattern across age ranges is quite different for 2021. The COVID Mortality Percentage rises much more rapidly with age to a peak of around 14% for both genders at ages 45–54, and then falls.
What might explain the differences in the age patterns between 2020 and 2021 for the COVID Mortality Percentage? A natural factor to consider is the COVID-19 vaccines. These became available in early 2021, initially primarily for the elderly, but with availability for all adults by April or May.33 Booster doses became available starting in October 2021, again initially for the elderly, but with availability for all adults about two months later.34 However, as discussed in the next section, the middle-aged have lower vaccination rates. This could explain their higher COVID Mortality Percentage in 2021, relative to the elderly.
In practice, vaccine supply was limited in early 2021, during the second COVID wave, even for the elderly. By the time vaccines were widely available, we were well past the peak of that wave. Thus, the effect of vaccination on mortality rates can be more clearly seen beginning with the summer 2021 wave. In Panel D, we capture that wave, and the start of the fourth wave, by focusing on the second half of 2021. The peak for ages 45–54 is sharper and higher than for the full year. This group has a COVID Mortality Percentage of around 20% (both genders), versus around 9% for men and 6% for women for ages 85+.
E. Vaccination Rates by Age and Their Effect on COVID-19 Mortality
We report in Figure 6 vaccination data by age range, obtained from the CDC, for both initial vaccination and a booster dose for the fully vaccinated.35 The reported age ranges are the ones available from the CDC, which are different than the age ranges for which mortality is available and also differ between primary vaccination and booster dose.
Both primary vaccination rates and booster rates rise with age, except that the rate for age 75+ is somewhat below that for ages 65–74. The different vaccination rates by age can go far toward explaining the differing patterns in the COVID Mortality Percentage by age for 2020 versus the second half of 2021.
If different vaccination rates by age are driving changes in COVID-19 mortality by age, another way to see this should be to compare elderly to nonelderly COVID-19 mortality rates, over the course of the pandemic. We would expect the ratio of elderly/nonelderly mortality rates to be high in 2020, when no vaccines were available, but to fall in the first half of 2021, both because vaccines were available earlier on to the elderly, and because elderly vaccination rates were higher. The ratio might rise again in the second half of 2021, because non-elderly vaccination rates rose more rapidly than elderly rates during this period.
In Figure 7, we confirm these expectations. The figure report three ratios of PFRs in the three Midwest areas by month during the pandemic: for age 85+, ages 65–84, and all elderly, each relative to middle-aged adults aged 45–64. Consider first the PFR ratio for elderly aged 85+ to adults aged 45–64. This ratio is generally above 20 during 2020 and is over 40 in December 2020. It then plunges in early 2021, a period in which the eldest were offered vaccines, generally ahead of everyone else other than health care workers and continues to fall to about 5 by June 2021. For persons aged 65–84, there is a modest fall during the first quarter of 2021, a period in which many people in this age group could not obtain vaccines, and a sharper fall in the second quarter of 2021, as the vaccines became widely available. The ratios then rise somewhat in the second half of 2021, as vaccination rates for the non-elderly rise faster than rates for the elderly. This is association, not causation, but strongly supports the protective effect of vaccination.
FIGURE 7. Elderly/Nonelderly PFR Ratios: Three Midwest Areas.
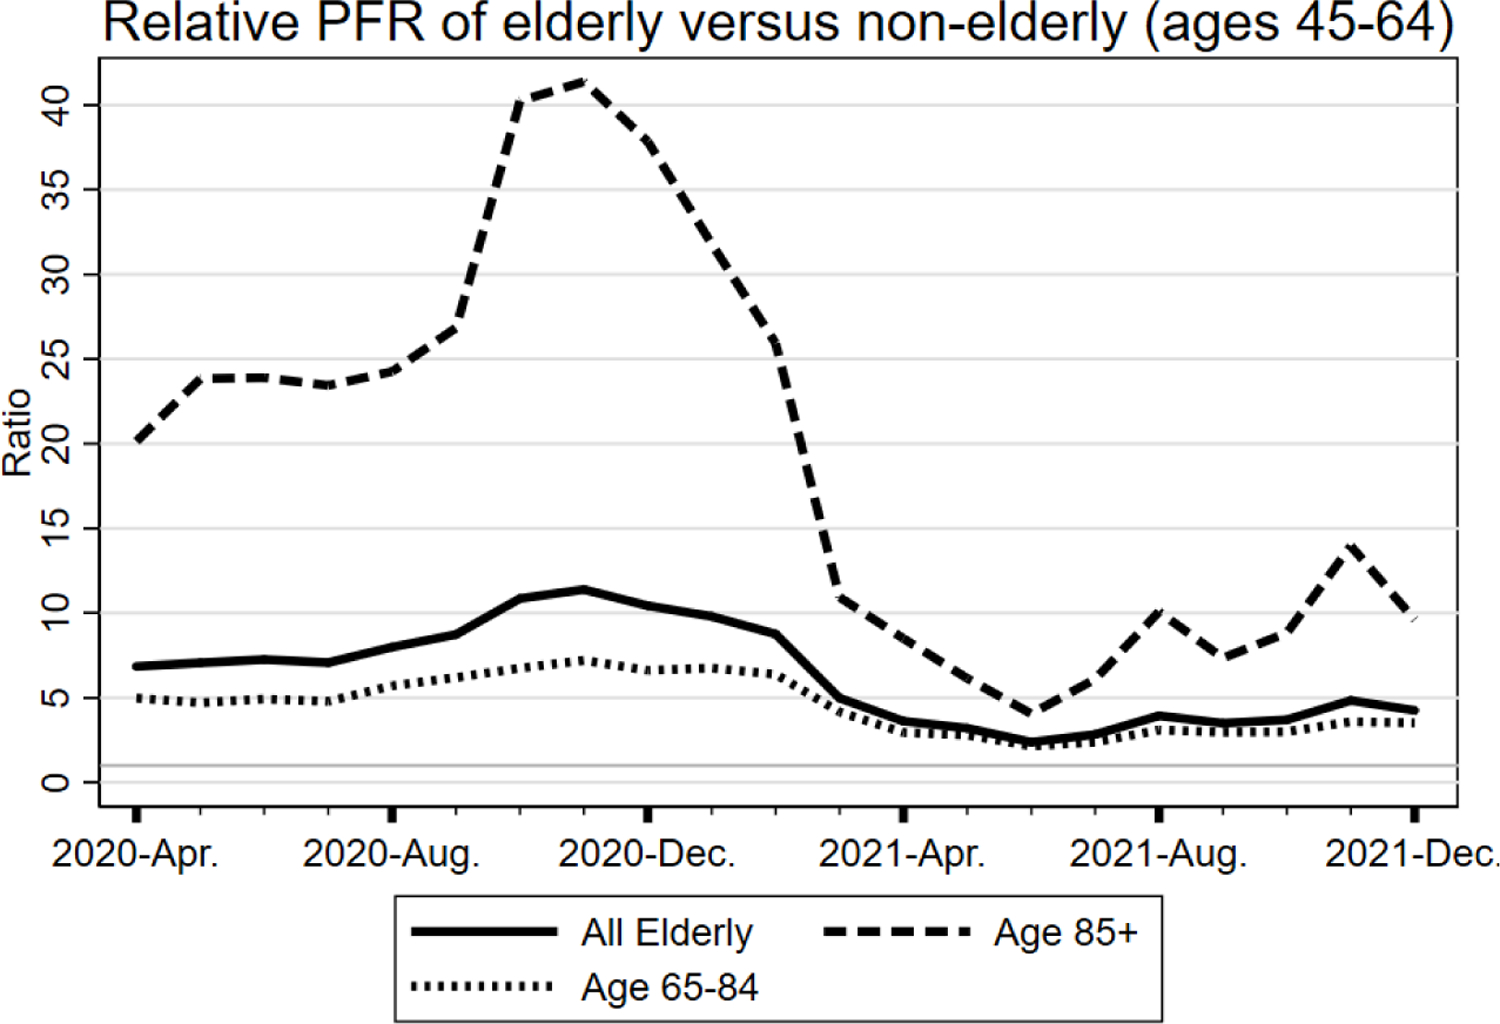
Figure shows the monthly ratios of PFR in the three Midwest areas for (i) ages 85+, and (ii) ages 65–84, in each case relative to PFR for adults aged 45–64, by month during the pandemic period, using national from April 1, 2020, through Dec. 31, 2021.
Another source of evidence on vaccine efficacy for the elderly is mortality rates in nursing homes. We report data from CMS in Figure 8.36 These rates plunged in early 2021, as vaccines became available to nursing home residents. Panel A shows weekly nursing home deaths, both counts and PFR as a fraction of nursing home residents. Nursing home mortality rates plunge in early 2021 and remain well below 2020 levels for the remainder of 2021, despite an uptick in late 2021, due to the Delta variant and a further uptick in early 2022, due to the Omicron variant. Vaccination of most nursing home residents is a likely explanation. Despite stumbles in the early rollout of vaccines to nursing homes, the CDC now estimates that 87% of nursing home residents were vaccinated.37
FIGURE 8: National PFR Over Pandemic Period for Nursing Home Residents.
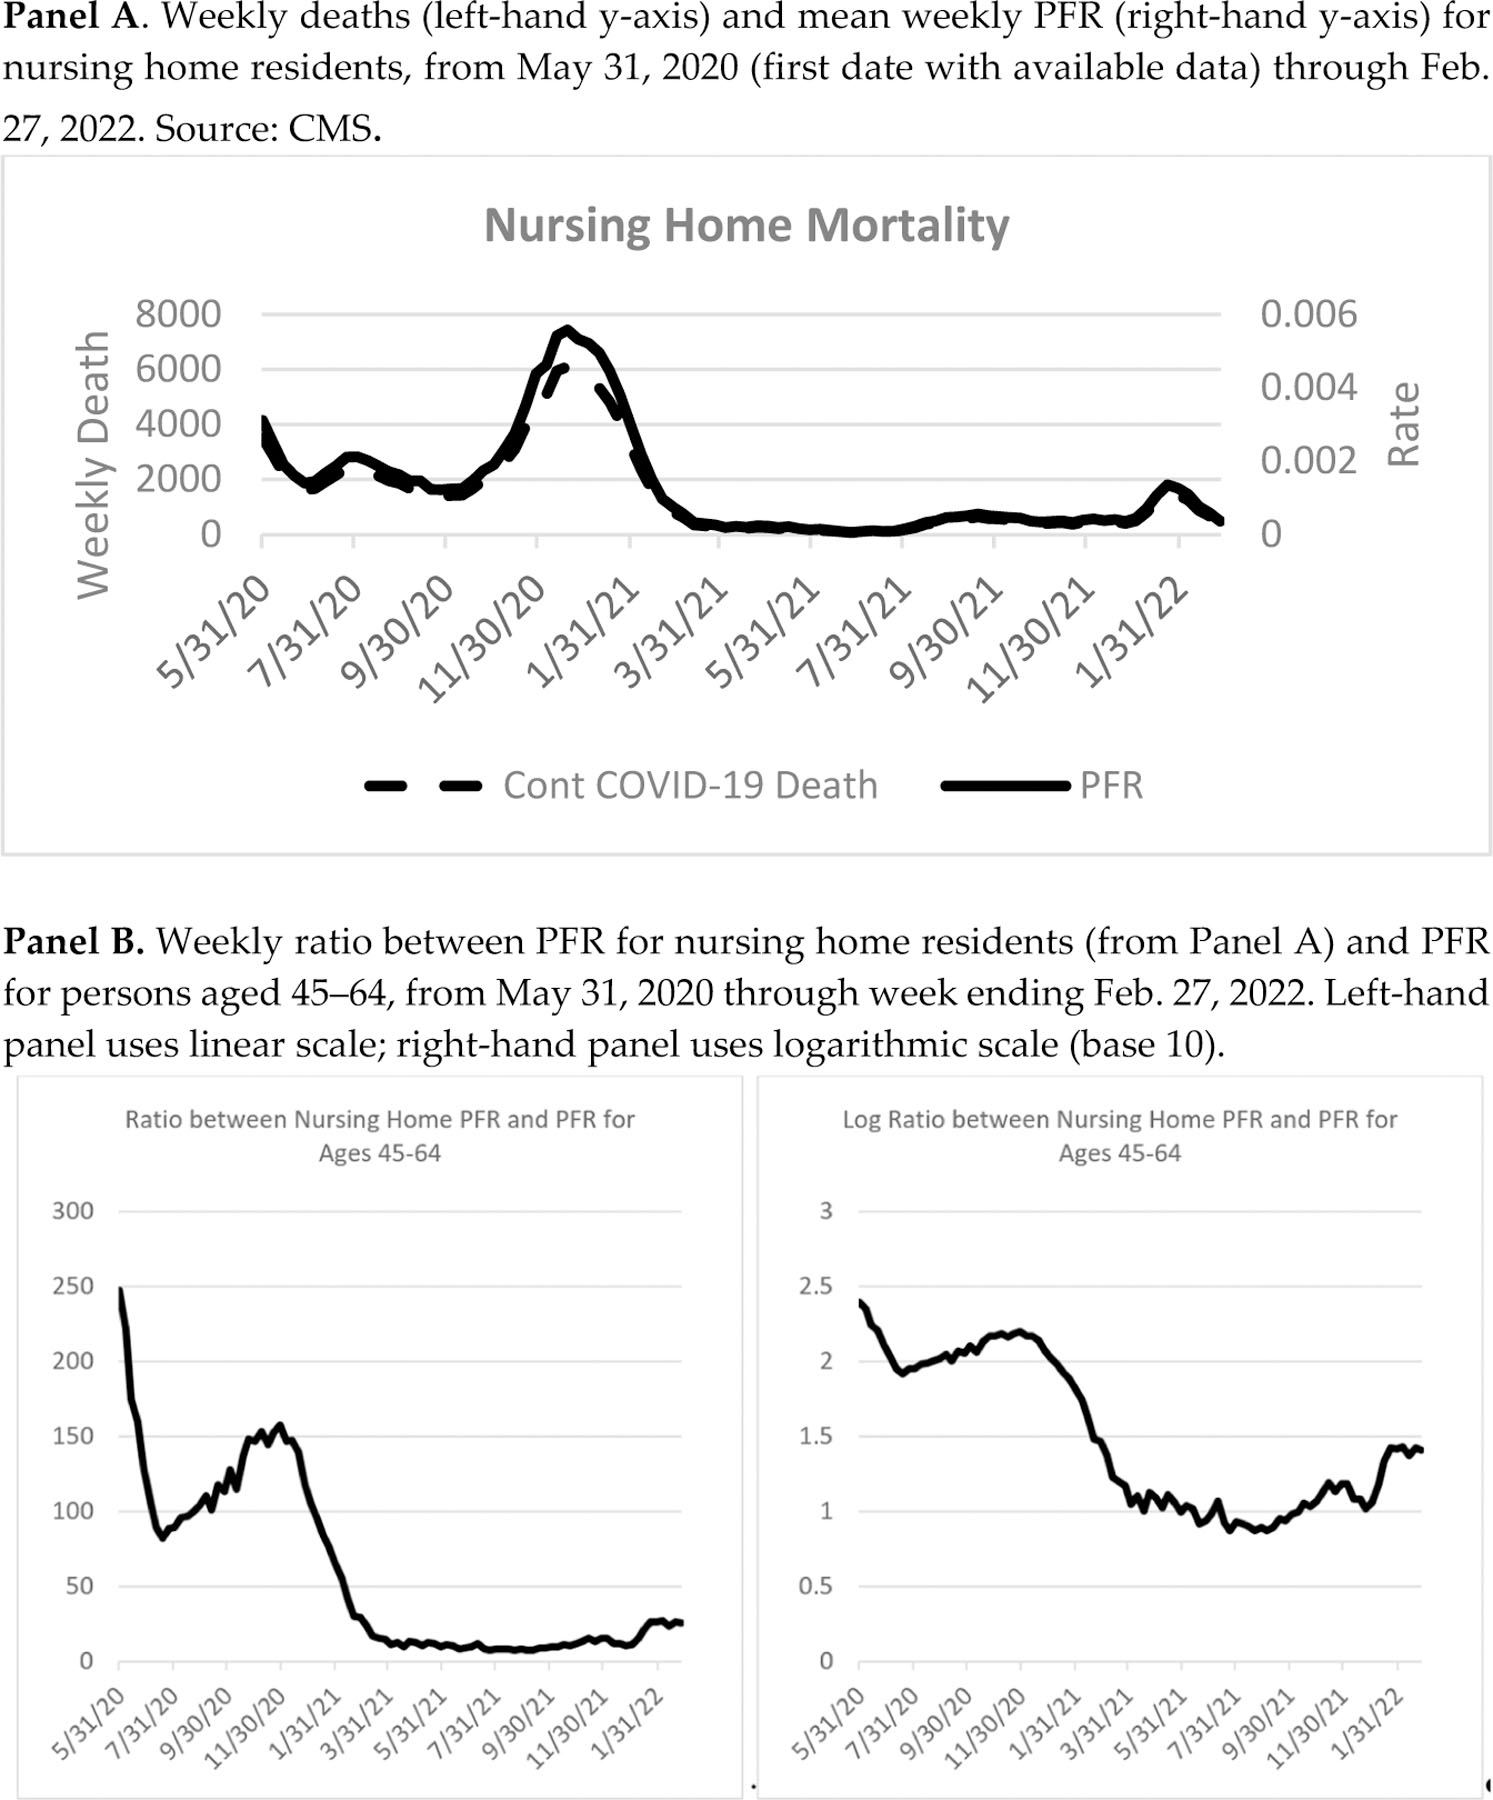
To be sure, nursing home deaths will be higher during periods with high infection rates, as in early 2021 and again in early 2022, and lower when overall infection rates are lower, as in mid-2021. We control for the wave nature of COVID-19 infection rates in Panel B, by showing the ratio between the nursing home PFR and the PFR for middle-aged adults aged 45–64. This ratio of PFRs was an astonishing 250 when the nursing home data begins in May 2020 and was around 150 at year-end 2020. After that, the ratio plummets as nursing home residents increasingly become vaccinated, to around ten by late April 2021, with a further decline to a ratio of 7–8 by August, before rising later in 2021. The rising ratio in late 2021 is hard to see using a linear scale, so we show in Panel B both a linear scale (left-hand panel) and a logarithmic scale (right-hand panel, using base 10). The late-2021 rise could reflect waning vaccine efficacy, as well as the ability of the Delta variant and then the much greater ability of the Omicron variant to be transmitted to even vaccinated nursing home residents by vaccinated staff members and visitors, and Omicron’s much greater ability to infect both the previously vaccinated and the previously infected.
Others have estimated the lives saved by vaccination, and the additional lives that could have been saved with more complete vaccination.38 We have chosen a more graphical approach. But our analysis makes clear that vaccinating the elderly made a huge difference in reducing nursing home deaths, all elderly deaths, and total deaths.
F. Mean Age at Death and Years of Life Lost
We turn next from measures of PFR to mean age at death and YLL. In Figure 9, we present mean age at death for COVID-19 decedents in Panel A and YLL in Panel B, separately for women and men. We present separate lines for White, Black, Hispanic, Asian, and all decedents (thicker line), by calendar quarter. In Panel A, mean age at death decreases in the first half of 2021. For all women, for example, mean age at death drops from around eighty-three during 2020 to 79 by the second quarter of 2021. In Panel B, there is a corresponding increase in YLL.
FIGURE 9: Three Midwest Areas: Mean Age at Death and YLL by Calendar Quarter.
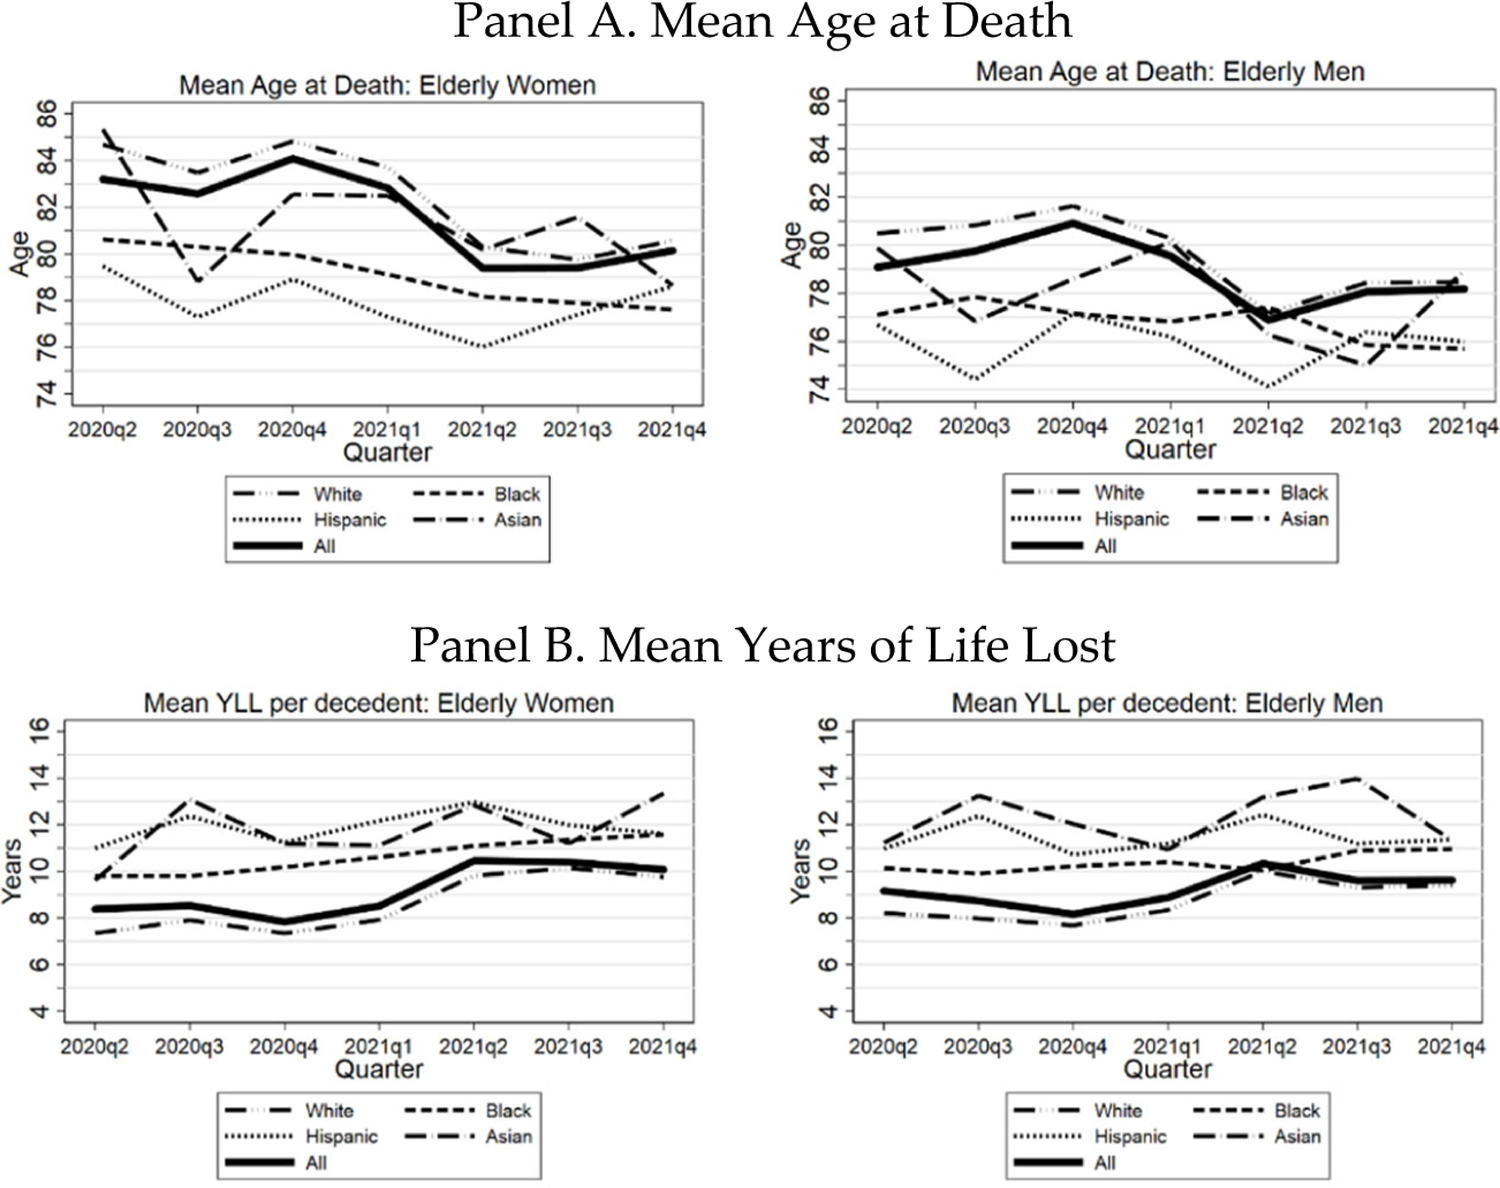
Figure shows, by calendar quarter, mean age at death (Panel A) and mean years of life lost (Panel B) for elderly COVID-19 decedents by race/ethnicity, separately for women (left hand side) and men (right hand side), from March 1, 2020 through Dec. 31, 2021. Data points for 2Q 2020 cover March-June.
The drop in mean age at death and rise in YLL in 2021 is consistent with the evidence presented above on the efficacy of vaccination, and with the older old being more highly vaccinated than the younger old.
G. Life Expectancy Loss Due to COVID-19
Figure 10, Panel A, shows LEL for the three Midwest areas due to the COVID-19 pandemic, through December 31, 2021, by age, gender, and race/ethnicity. The predictive effect of age on LEL depends on the balance between two opposing effects. PFR generally rises with age, but YLL per decedent falls. For the adult nonelderly, the effect of rising PFR dominates, so LEL rises rapidly with age (see Table 3). For the elderly, the predictive effect of age is smaller, and the net effect depends on race/ethnicity. For all elderly and for Whites, LEL rises with age through around age eighty-five, but then falls. In contrast, LEL is largely flat for Hispanics, is first flat and then declining for Blacks, but rises steadily for Asians.
FIGURE 10: Three Midwest Areas: Life Expectancy Loss (LEL) Due to COVID.
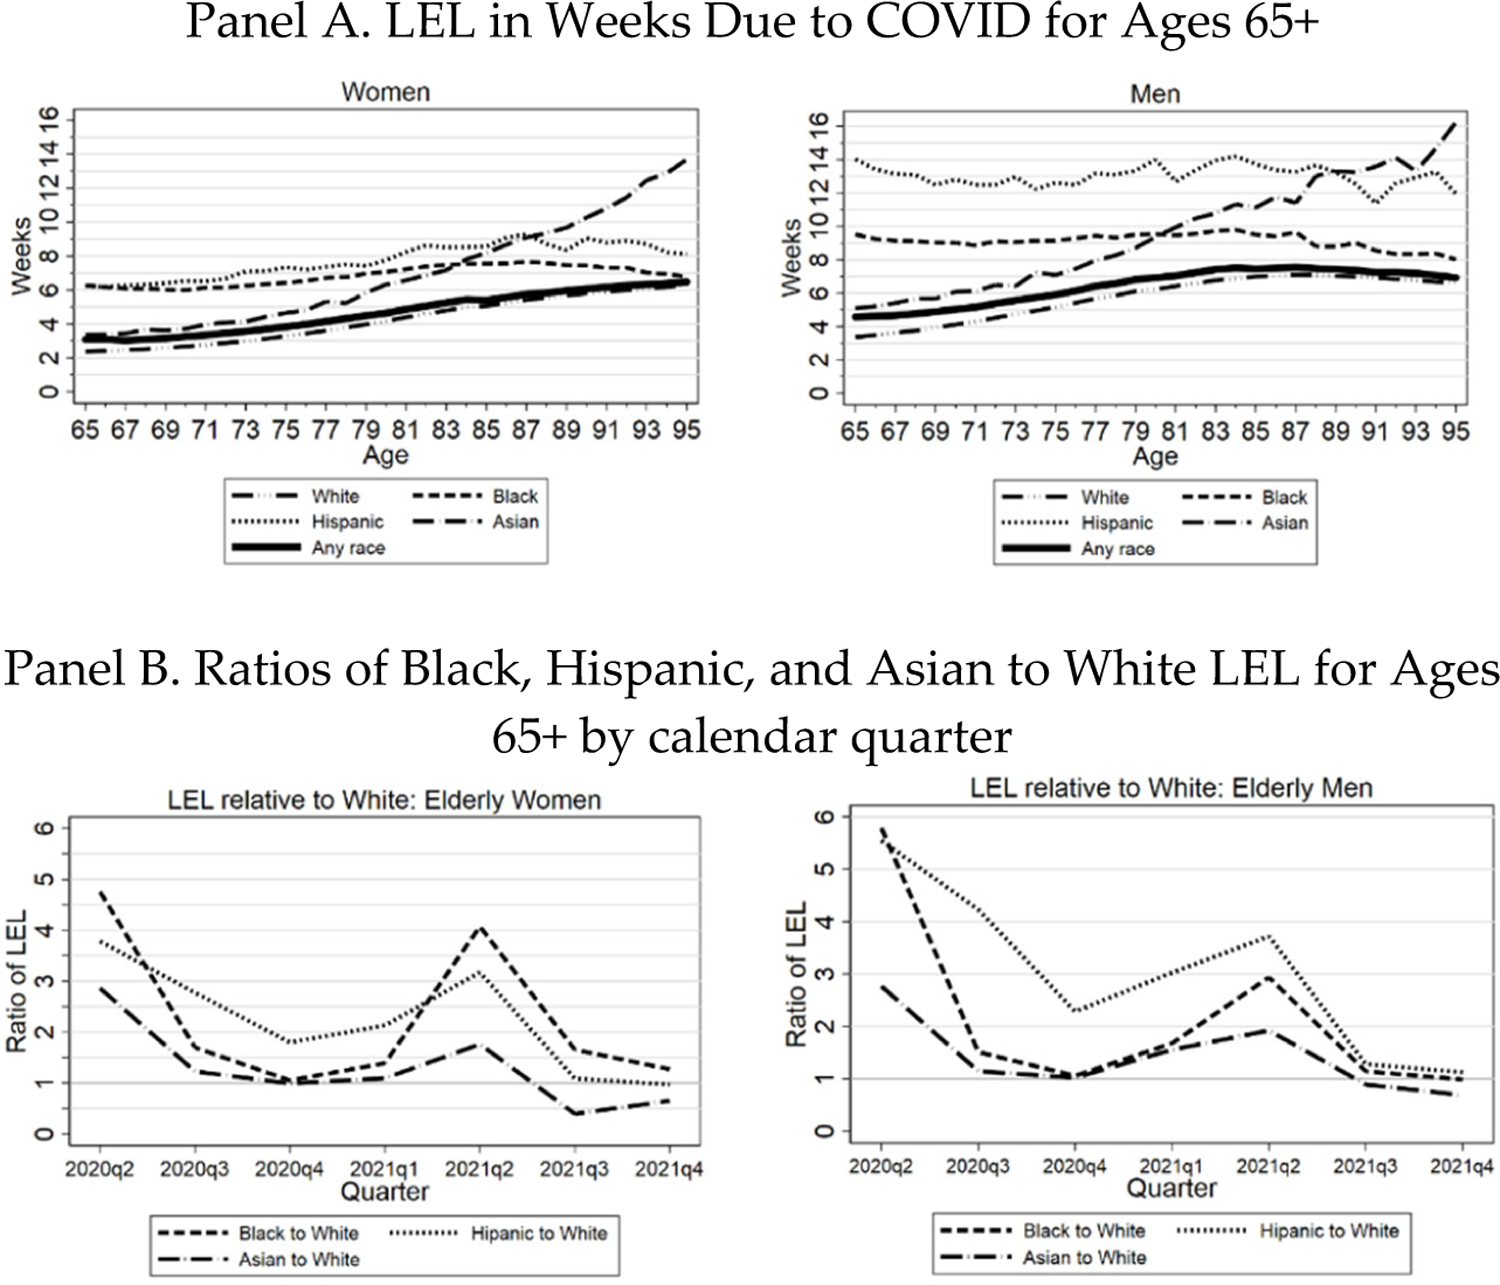
Panel A: LEL in weeks due to COVID-19 by race/ethnicity for the elderly (ages 65+), from March 1, 2020 through Dec. 31, 2021, for three Midwest areas. Individual lines show population-weighted estimates for all persons, Whites, Blacks, Hispanics, and Asians. Panel B: Uses same data as Panel A, but shows LEL ratios (Black, Hispanic, and Asian relative to White) by calendar quarter. Both panels: Separate figures for women (left hand figures) and men (right hand figures). LEL by race/ethnicity is estimated within the appropriate subsamples for Whites, Blacks, and Hispanics.
TABLE 3:
Life Expectancy, PFR, and LEL: Three Midwest Area and National Estimates
| Three Midwest Areas |
National |
|||||||
|---|---|---|---|---|---|---|---|---|
| Age | COVID Decedents | COVID PFR (%) | Life expectancy | LEL (years) | COVID Decedents | COVID PFR (%) | Life Expectancy | LEL (years) |
| By age | ||||||||
|
| ||||||||
| 0–14 | 22 | 0.001 | 72.97 | 0.000 | 464 | 0.001 | 73.23 | 0.001 |
| 15–19 | 29 | 0.003 | 59.24 | 0.001 | 497 | 0.002 | 59.35 | 0.001 |
| 20–24 | 48 | 0.004 | 56.67 | 0.002 | 1,630 | 0.008 | 56.85 | 0.004 |
| 25–29 | 110 | 0.009 | 51.36 | 0.004 | 2,981 | 0.01 | 51.64 | 0.007 |
| 30–34 | 207 | 0.02 | 47.04 | 0.008 | 6,034 | 0.03 | 46.88 | 0.012 |
| 35–39 | 316 | 0.03 | 42.95 | 0.012 | 8,671 | 0.04 | 42.85 | 0.018 |
| 40–44 | 535 | 0.05 | 38.09 | 0.019 | 14,230 | 0.07 | 38.12 | 0.026 |
| 45–49 | 836 | 0.08 | 33.49 | 0.026 | 22,384 | 0.11 | 33.79 | 0.037 |
| 50–54 | 1,283 | 0.12 | 29.27 | 0.034 | 32,993 | 0.16 | 29.39 | 0.048 |
| 55–59 | 1,917 | 0.16 | 24.88 | 0.040 | 45,862 | 0.21 | 25.05 | 0.053 |
| 60–64 | 3,048 | 0.26 | 21.07 | 0.056 | 74,476 | 0.36 | 21.22 | 0.076 |
| 65–69 | 3,841 | 0.41 | 17.30 | 0.070 | 85,352 | 0.52 | 17.47 | 0.091 |
| 70–74 | 4,598 | 0.62 | 13.57 | 0.085 | 102,870 | 0.68 | 13.96 | 0.095 |
| 75–79 | 4,995 | 0.99 | 10.26 | 0.102 | 105,923 | 1.19 | 10.76 | 0.128 |
| 80–84 | 5,082 | 1.49 | 7.40 | 0.110 | 106,203 | 1.50 | 7.92 | 0.118 |
| 85–89 | 5,081 | 2.40 | 5.02 | 0.121 | 98,330 | 2.51 | 5.67 | 0.142 |
| 90–94 | 4,055 | 3.77 | 3.35 | 0.126 | 77,308 | 3.86 | 3.90 | 0.150 |
| 95+ | 2,123 | 5.87 | 2.36 | 0.138 | 38,877 | 5.73 | 3.27 | 0.188 |
| Elderly | 29,775 | 1.03 | 8.79 | 0.091 | 614,863 | 1.14 | 9.58 | 0.109 |
| All Ages | 38,126 | 0.22 | 12.97 | 0.028 | 825,085 | 0.25 | 14.37 | 0.036 |
|
| ||||||||
| Elderly by gender | ||||||||
| Men | 15,547 | 1.22 | 8.90 | 0.109 | 324,128 | 1.35 | 9.50 | 0.128 |
| Women | 14,228 | 0.89 | 8.67 | 0.077 | 290,735 | 0.97 | 9.68 | 0.094 |
|
| ||||||||
| Elderly by race/ethnicity | ||||||||
| White | 23,073 | 0.96 | 8.25 | 0.079 | 437,712 | 1.03 | 8.93 | 0.092 |
| Black | 3,851 | 1.40 | 10.33 | 0.145 | 78,967 | 1.67 | 10.54 | 0.176 |
| Hispanic | 1,926 | 1.66 | 11.29 | 0.187 | 83,657 | 2.09 | 12.09 | 0.253 |
| Asian | 560 | 0.87 | 11.34 | 0.099 | 20,915 | 0.99 | 11.71 | 0.116 |
| Other | 365 | 1.50 | 9.95 | 0.149 | 9,751 | 1.28 | 10.64 | 0.136 |
Left-hand side of table shows for the three Midwest areas: Number of COVID-19 decedents COVID PFR, life expectancy for COVID decedents (in years), life-years lost, and life expectancy loss (in years), over March 1, 2020–Dec. 31, 2021. Right-hand side shows national data, including national COVID decedents, over same period, except that national race/ethnicity data is through January 15, 2022. Decedents by race/ethnicity sum to slightly less than national totals due to persons with missing race/ethnicity information. For the national data, we assume that the COVID mortality age gradient for the three Midwest areas within each 5-year age group applies nationally. We compute separate estimates within each age group for men and women and for each race/ethnicity and combine them as needed to generate the rows in the table.
In Figure 10, Panel B, we present LEL ratios by calendar quarter for Black, Hispanic, and Asian to White. Similar to the graphs above of PFR over time, the highest LEL ratios are early in the pandemic, especially for Black and Hispanic men. All ratios, however, shrink toward one by the third quarter of 2021, with the Asian/White ratio dropping well below one.
In Figure 11, we present cumulative LEL by race/ethnicity over the course of the pandemic. Panel A includes all elderly; Panel B examines ages 65–84, and Panel C examines ages 85+. For all elderly and for ages 65–84, Hispanics have the highest LEL, then Blacks, Asians, and Whites. For ages 85+, however, the pattern is very different. Asians now have much higher LEL than the other groups. This reflects a combination of longer Asian life expectancy at any given age and higher PFR for Asians in this age range (Figure 3).
FIGURE 11: Three Midwest Areas: Cumulative Life Expectancy Loss.
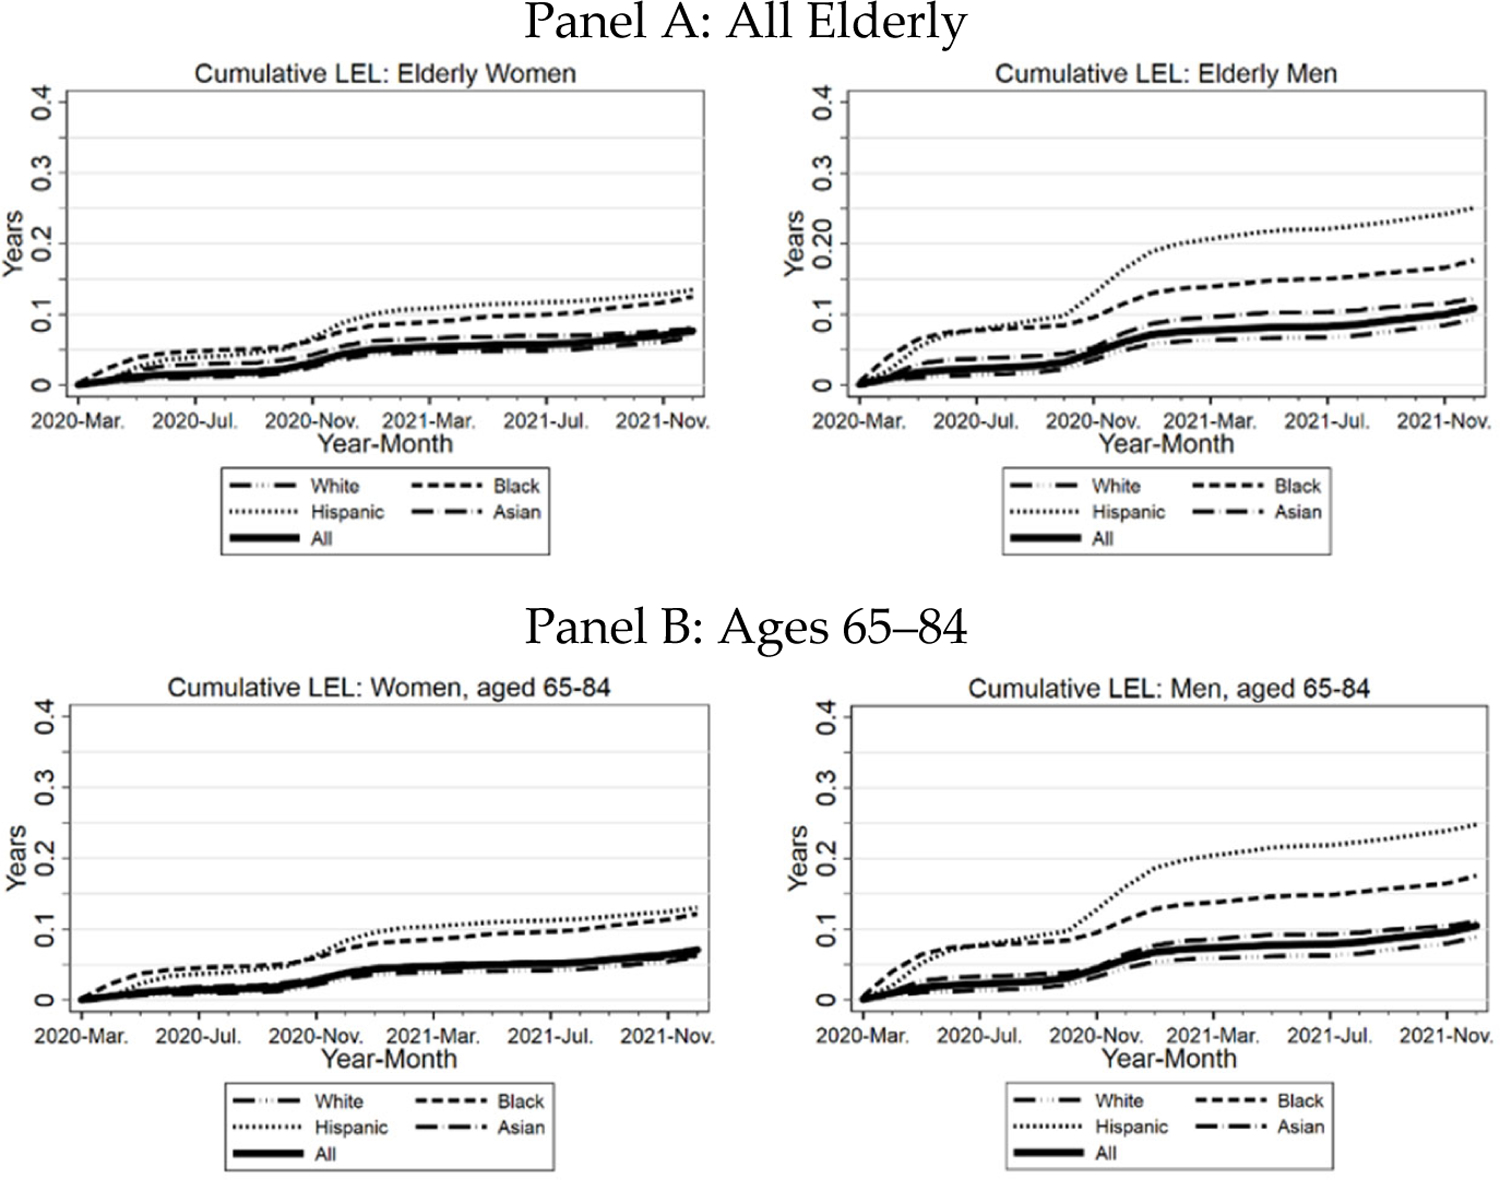
Panel A. Cumulative LEL for all elderly (thick line), Blacks, Hispanics, Whites, and Asians, separately for women (left-hand graph) and men (right-hand graph. Panel B. similar to Panel A, but limited to ages 65–84. Panel C. Similar to Panel A, but limited to ages 85+.
H. Cohort-Versus Period-Based Life Expectancy Loss
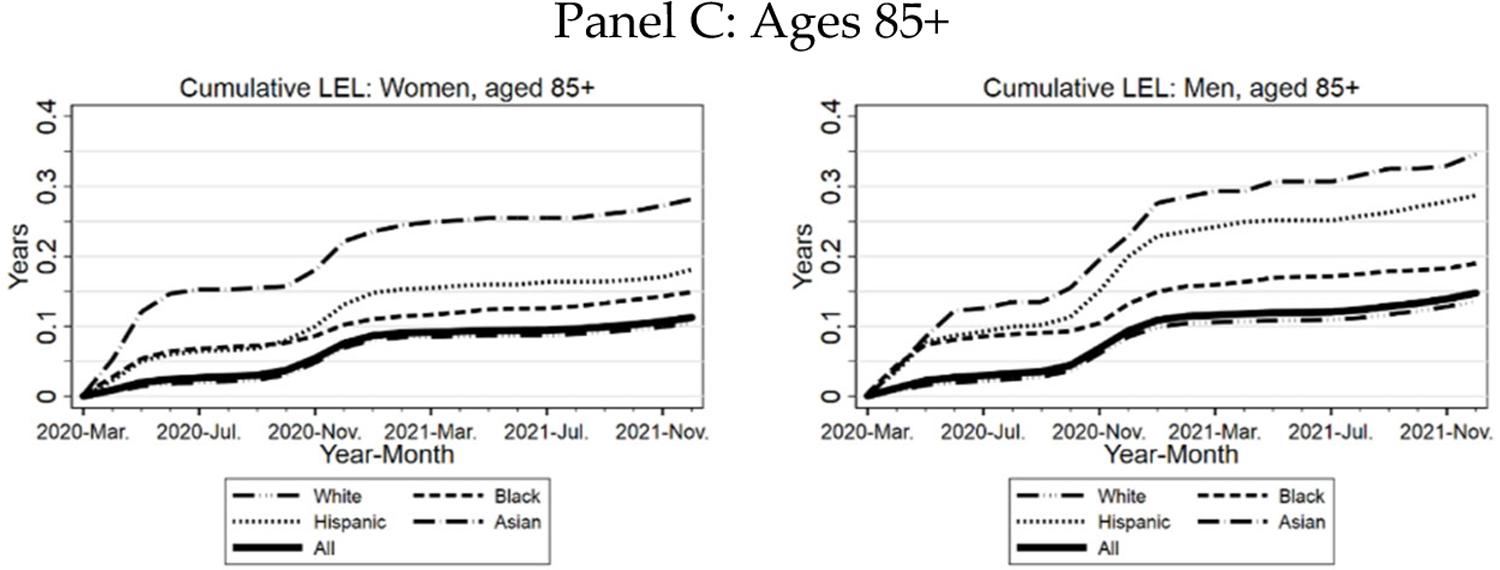
In Figure 12, we compare our estimates of LEL due to COVID-19 using the cohort-based method to estimates using the period-based method, which assumes that the U.S. population will continue to suffer COVID-19 mortality in the future at the same rate as in 2020. In Panel A, the left-hand panel reproduces the cohort-based estimates from Figure 10. The right-hand panel presents the period-based estimates. The period-based estimate declines with age. As noted above, this decline is mechanically driven by the definition of period-based life expectancy, which assumes that individuals will face 2020 rates for COVID-19 mortality throughout their remaining lifetimes. The more complex pattern for the cohort-based estimate reflects the tradeoff between higher mortality rates, but fewer life-years lost as decedent age increases.
FIGURE 12: Three Midwest Areas: Cohort vs. Period Estimates of Life Expectancy Loss.
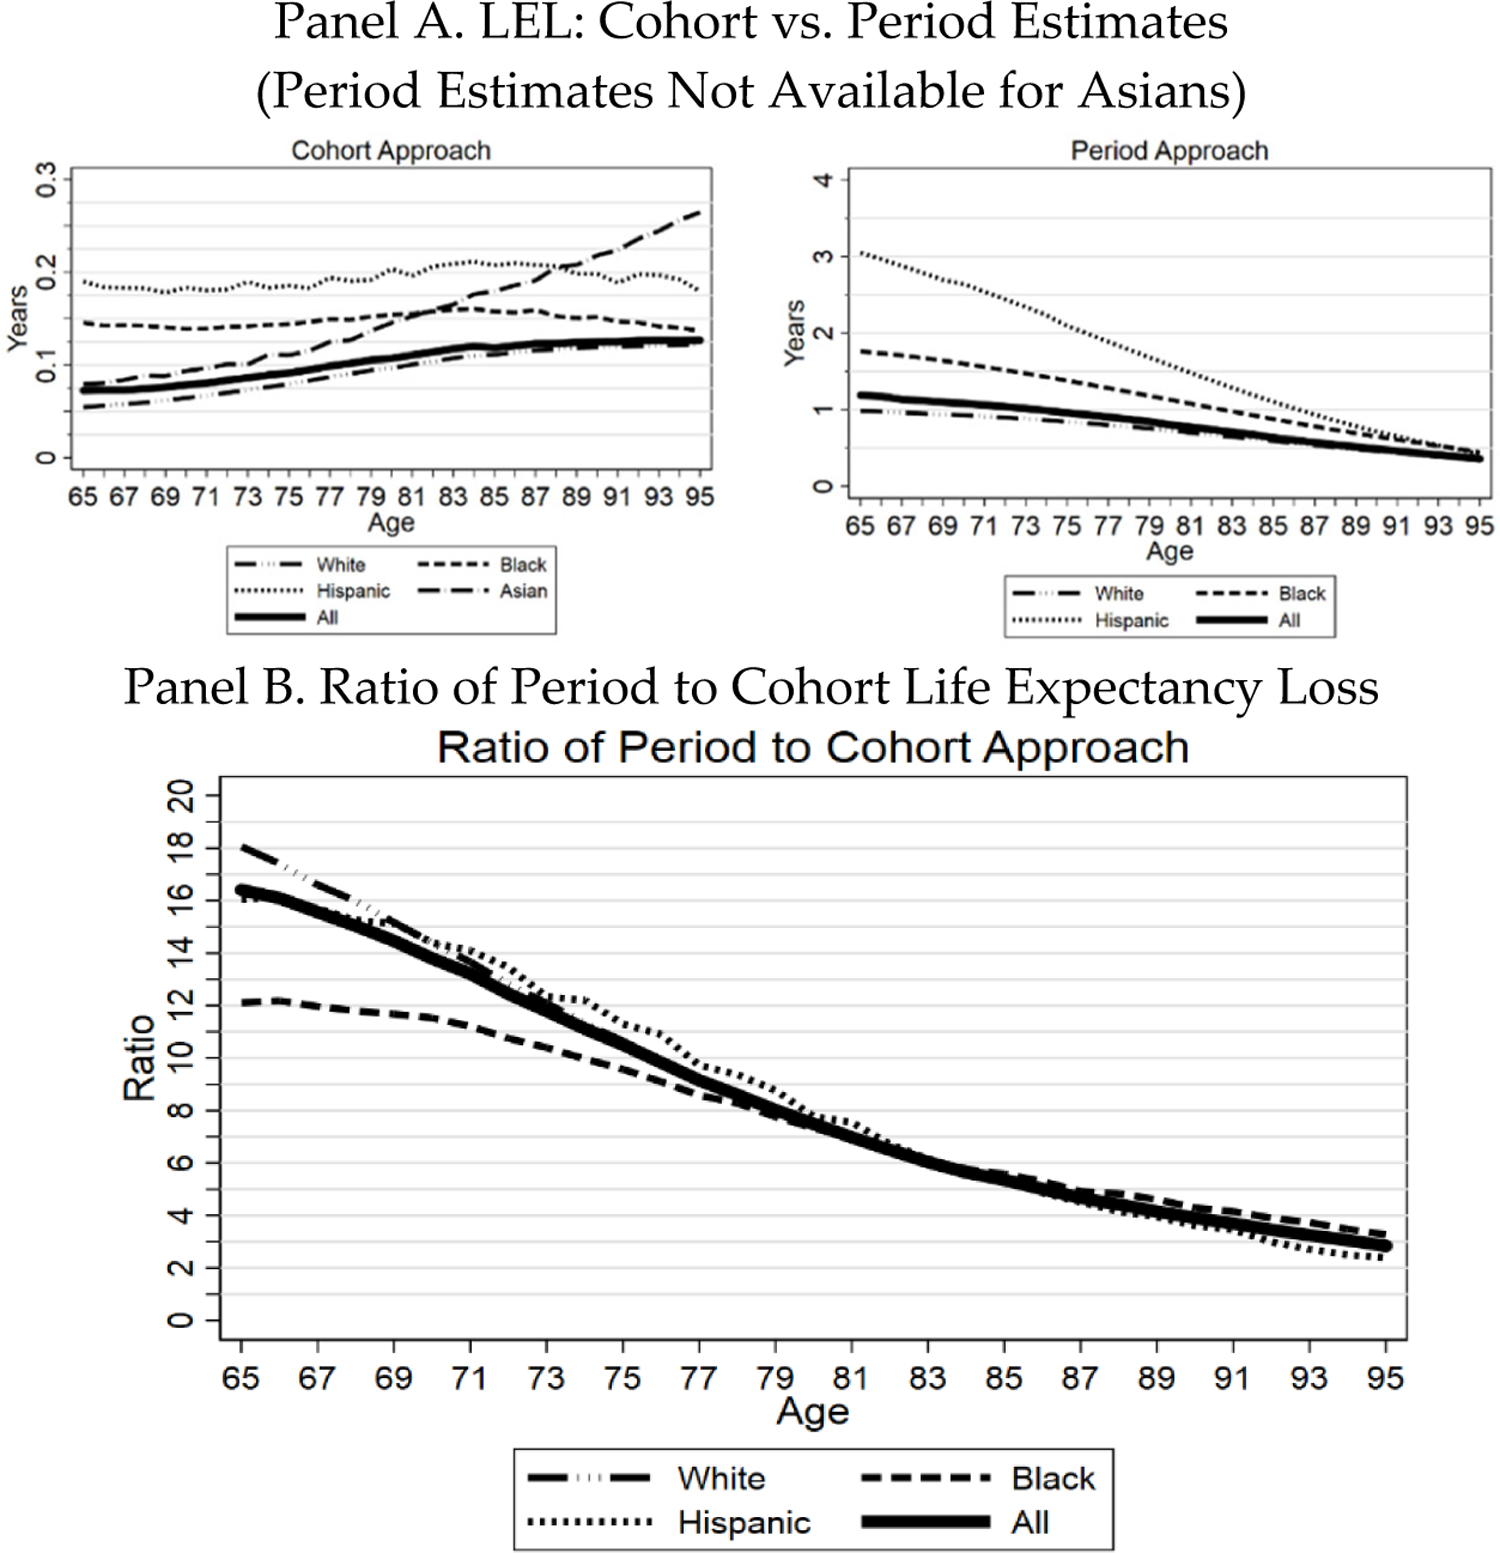
Panel A. Figure shows elderly LEL due to COVID, over March 1, 2020 through December 31, 2021, by age and race/ethnicity for the three Midwest areas using the cohort-based approach (left-hand graph); and compares this to LEL computed using the period life expectancy approach using data for 2020 (right-hand graph). Individual lines show population-weighted estimates for all elderly (thick line) and for Whites, Blacks, Hispanics, and Asians. Asian estimates are only available for the cohort-based approach because the National Center for Health Statistics does not report Asian life expectancy tables. Panel B. Ratio of period-based to cohort-based estimate of LEL. Both panels: LEL by race/ethnicity is estimated within the appropriate subsamples.
The assumption in the period-based approach of constant severity over an extended future period also drives the much higher LEL estimates generated by this approach; for example, 3 years for sixty-five-year-old Hispanics versus 0.16 years for the cohort-based approach. Panel B shows the ratio of the period-based to the cohort-based estimate. This ratio falls steadily with age but remains substantial at all ages.
I. Regional versus National Estimates of PFR and LEL
Table 3 shows PFR and LEL in years by age, gender, and race/ethnicity, separately for the three Midwest areas (left-hand columns) and nationally (right-hand columns). PFR rises rapidly with age. LEL rises rapidly with age for the non-elderly, but more gradually thereafter and declines at advanced ages (see also Figure 10). The average LEL for the three Midwest areas across all ages is 0.028 years, or about 11 days. For the elderly, YLL is 8.8 years and LEL is 0.091 years (thirty-four days). By race/ethnicity, LEL is highest for elderly Hispanics (0.187 years, or sixty-eight days), next highest for elderly Blacks (0.145 years, or fifty-three days), is 0.099 years (thirty-six days) for Asians, and is lowest for Whites (0.079 years, or twenty-nine days). LEL is substantially higher for elderly men (0.109 years or forty days) than for women (0.077 years or twenty-eight days). Higher male LEL arises because for any specific age, the higher male mortality rate matters more than lower male life expectancy at that age.
Table 3 compares estimates for the three Midwest regions to national estimates. National estimates for the elderly are somewhat higher than those for the three Midwest areas, with national elderly PFR of 1.14%, YLL of 9.6 years, and LEL to date of 0.109 years (forty days). National patterns for the elderly by gender, and race/ethnicity are similar to those in the Midwest areas. This suggests that the detailed analyses that we were able to conduct for the Midwest areas are likely to be representative of national trends.
IV. Discussion
A. Multivariate Decomposition of PFR
Having access to individual-level death data for the three Midwest areas permits us to carry out a multivariate analysis of the factors that predict COVID-19 mortality. This decomposition is not possible using only national data, nor could we estimate the impact of zip-SES without the Medicare data. We are able to estimate the separate predictive effects for the elderly of age, gender, race/ethnicity, and zip-SES, and confirm that there are substantial racial/ethnic disparities cannot be explained by zip-SES and vice-versa. Our PFR and LEL measures for the elderly, because they are calculated at the individual-level, can be aggregated to study outcomes of interest for groups defined by any combination of demographic and social characteristics.
B. Cohort-Based LEL as a Metric for Pandemic Effects
We have described several aspects of the impact of the COVID-19 pandemic on elderly Americans in general and nursing home residents in particular, through the lens of different measures of pandemic severity. PFR is one useful measure of the greater impact of the pandemic on the elderly. However, where available (it is not available for nursing home residents), we believe that LEL will often be a preferred measure because it accounts for both the higher mortality rate of the elderly and their shorter remaining life expectancy. Our cohort-based approach to estimating LEL illustrates the greater impact of the pandemic on older Americans. For example, in the three Midwest areas, 30–34-year-olds suffered average LEL of 0.008 years (three days), while the elderly as a whole lost 0.091 years (thirty-four days). Among the elderly, those aged 65–69 lost an average of 0.070 years (twenty-six days), compared to 0.121 years (forty-four days) for those aged 85–89.
In our view, the cohort-based measure of life expectancy is a sensible measure to apply to the COVID-19 pandemic. In contrast, life-expectancy loss is greatly exaggerated if one uses the period-based measure which has dominated the literature on the life expectancy effects of COVID-19 and news reports about those effects.
It may be instructive to compare these estimates to those for life-years saved from universal colonoscopy (repeated every 10 years, with polypectomy and appropriate followup if cancer is detected). A 2010 survey estimated savings of 0.24 years (eighty-nine days).39 These life-expectancy savings are on the same order as the COVID-19 losses.
C. COVID Mortality Percentage: A New Metric for Pandemic Effects
A further innovation in this project is to study not only PFR and LEL, but also the COVID Mortality Percentage, which provides a different window into the pandemic’s effects on mortality. Data for this metric from 2020, a period when vaccines were not available, shows a gradually rising percentage, somewhat higher for men than for women, reaching around 15% for elderly women and close to 20% for elderly men (Figure 5, Panel B). In contrast, during 2021, when many people were vaccinated, this percentage is highest for ages 45–54, at around 14% for both men and women, and falls at higher ages. These percentages are a lower bound on actual COVID mortality, both because COVID-19 deaths have been under-recorded to some extent and because people who have recovered from COVID-19 are at higher risk for mortality from other causes.40
The hump shape for the COVID Mortality Percentage by age in the second half of 2021, compared to the rising shape with age for 2020, almost surely reflects the protective effects of vaccination, coupled with higher vaccination rates for the elderly. But it provides evidence of more than this. Many of the middle-aged did get vaccinated. But for the vaccinations that did happen, the COVID Mortality Percentage for this group would have been higher still—and yet higher for the more-highly-vaccinated elderly.
Data on both mortality and vaccination rates over time, by age group, could be used to estimate the COVID Mortality Percentage for the unvaccinated by age group, and what the number of COVID-19 deaths would have been if no one were vaccinated, or conversely, if everyone were vaccinated. It is beyond the scope of this elderly-focused paper, however, to undertake that modeling effort.41
It is hard to know what public health messages might have persuaded more people to get vaccinated. But the message to the middle-aged—if you stay unvaccinated, you increase your overall mortality risk by X%—might have persuaded some who otherwise believed they faced low COVID-19 risk and were balancing that low perceived risk against their fears of vaccine side effects.
D. Time-Varying Effects During the Pandemic
A further important innovation in this project is to study the pandemic effects over time, using ratio metrics (for example, Black/White or Hispanic/White PFR or LEL), which are less sensitive to the rises and ebbs of COVID-19 infection waves (see Figures 4 and 7–10). Some interesting patterns emerge from this analysis.
First, at least for the elderly, the large racial/ethnic disparities that were present early in the pandemic are greatly diminished in 2021, with Asian/White ratios falling well below one. Any account of the root causes of these disparities must take this time variation into account. The large literature documenting various disparities as yet has not considered time series evidence, such as that presented here.42 For example, one potential explanation for higher Black and Hispanic mortality is higher uninsurance rates. This cannot easily explain disparities for the elderly, almost all of whom are insured through Medicare, with the poor often also eligible for Medicaid.43 Another potential explanation for higher Black and Hispanic mortality is lower-quality health care, even if insured.44 This cannot easily explain the much smaller disparities in the second half of 2021. Nor can quality differences readily explain the lower mortality rates for Asians in the second half of 2021, but not earlier.
E. Limited LEL Losses for the Non-Elderly
Although the focus of this paper is on the elderly, we also estimate PFR and LEL for the non-elderly. While middle-aged COVID-19 mortality is substantial, it is easier to understand the decisions of the young not to get vaccinated. For people under 30, the risk of dying of COVID-9 has been under 1 in 10,000 (Table 3). This is below their annual risk of dying in a car crash.45 The corresponding LEL is around a day.
For risk levels like this, it would not take much fear of the unknown, in the form of a new vaccine, to persuade some younger people that the risk from the vaccine, and the disutility of potential side effects (including the risk of simply being sick for a few days) exceeds the risk from COVID-19. All available data on vaccine safety and efficacy says that this is a wrong judgment, but it is one that is easy to understand. All that we know about not only mRNA vaccines, but indeed any vaccines suggests that if side effects do not emerge soon, they will not emerge at all. But the general public may not know or believe that, in the face of often inconsistent public health messaging from the CDC and other national and state health agencies.46
F. Nursing Homes: The Effects of Vaccinating Residents versus Staff
We show that PFR for nursing home residents was horrendous in 2020 relative to the middle-aged (ages 45–64), but greatly improved in 2021, before rising again starting in September 2021. Both the fall and the rise are instructive.
The ratio of nursing home resident PFR to that for those aged 45–64 fell from 150 at year-end 2020, to around 7.5 by late summer 2021. This huge decline offers compelling proof of the efficacy of the nursing home vaccination efforts, even though not all nursing home residents were vaccinated, and many younger adults (the denominator for this ratio) were vaccinated.
There was much public concern during 2021 about many nursing home staffers remaining unvaccinated, and the unwillingness of many nursing homes to require vaccination.47 There is evidence that lower staff vaccination rates predict higher resident infections and deaths.48 But the bigger story, which we are (to our knowledge) the first to tell in such a compelling way is the great success of the vaccination campaign in reducing the death toll among nursing home residents in 2021 to a fraction of the toll in 2020. If the residents are vaccinated, the extent to which the staff are also vaccinated matters less than we might have thought.
The late-2021 rise is also instructive, but in a different way. Many of the elderly were vaccinated early in 2021. But we learned over the course of 2021 that vaccine efficacy wanes substantially, and a booster dose is appropriate 5–6 months after initial vaccination.49 The Israelis, who were among the first in the world to vaccinate much of their population, figured this out and launched a booster campaign in late July.50 The U.S. had access to the Israeli data, but the FDA and CDC did not authorize a booster dose for the elderly until two months later, and even then with mixed messaging on how badly the booster was needed.51
Most nursing home residents were vaccinated early in 2021. Thus, the rising relative mortality rate in late 2021 and early 2022 for nursing home residents (Figure 8) provides evidence of the cost in elderly mortality of the delayed U.S. response to vaccine waning. So does the rise at about the same time in the relative elderly/nonelderly PFR. This rise was stronger for those aged 85+, who were often among the earliest to be vaccinated.
G. Male/Female Disparities
Men suffered substantially higher COVID-19 fatality rates than women throughout the pandemic.52 This disparity is not surprising; men are more susceptible than women to many diseases.53 But it is nonetheless important yet has received little public attention.54 One can imagine, for example, a vaccination or booster campaign targeted at men that highlighted their greater risk. Those campaigns largely did not happen.
H. Racial/Ethnic Disparities
We find substantially higher age-adjusted COVID mortality rates for Hispanics (especially men) and Blacks than for Whites, and modestly higher mortality for Asians, over the full pandemic period (Table 2). But we also find that in the second half of 2021, the Hispanic-to-White and Black-to-White disparities in COVID mortality rates greatly diminish, and Asian mortality falls well below White mortality. Any explanation for the Hispanic-White and Black-White disparities earlier in the pandemic must account for the shrinking of these disparities later in the pandemic. Similarly, any explanation for higher Asian mortality earlier in the pandemic must account for lower mortality later in the pandemic.
These explanations are not easy to find. Differential exposure to infection could be part of the story, but why did this factor disappear in the second half of 2021? Differential vaccination rates could be part of the story. The available data, albeit crude, suggests somewhat higher White than Black or Hispanic vaccination rates in the first half of 2021, with the differences becoming small by September 2021.55 Asian vaccination rates might also be higher than White rates;56 this is true for Wisconsin, which provides this data, but the differences are modest. Conversely, differential access to health care cannot readily explain similar mortality rates later in the pandemic, nor lower rates for Asians than for Whites.
The time and age patterns for Asians are puzzling. It is not apparent why Asians aged 65–84 have PFR and LEL below or similar to Whites, yet Asians age 85+ have substantially higher PFR and LEL (Figures 3 and 11).
I. The Vaccinations That Did and Did Not Happen and Their Consequences
Using the COVID Mortality Percentage as a metric, 2021 mortality due to COVID-19 was similar to 2020 mortality for the elderly as a whole, substantially better for those in nursing homes, but substantially worse for the middle-aged. The most likely explanation: the elderly were more likely to be vaccinated, especially those in nursing homes, to whom we directed early, targeted vaccination campaigns. That success of that effort for nursing home residents, however, highlights the tragedy of the many lives lost, especially for the middle-aged, who chose not to be vaccinated when vaccines became available.
We cannot know what messages would have been better received than those which were delivered, but perhaps data on increased risk for people like you, targeted to the non-elderly, might have reduced the death toll once vaccines were readily available.
J. Limitations of Our Analysis
Our analysis has a number of limitations. First, our estimate is retrospective—we examine PFR and LEL to date, yet these levels will increase over time. At the same time, however, our estimates do not rely on predicting the future course of the pandemic—an exercise that has proven challenging for both scientists and politicians. Our estimates can also be readily extended to cover a longer time period.57
Second, we rely primarily on data for three Midwest areas to estimate of the impact of age, gender, and race/ethnicity on PFR, YLL, the COVID Mortality Percentage, and LEL. Those three areas may not reflect national experience. Indeed, LEL for these areas is somewhat below national estimates. The three areas, however, are diverse in income, race, and ethnicity, and estimates for the three areas are similar enough to national estimates (Table 3) so that extrapolation outside the three areas should be reasonable, especially when comparing different groups, rather than looking at absolute levels.
Third, we likely overestimate YLL and thus, LEL for two reasons. First, we lack data about decedent comorbidities, and thus cannot estimate how comorbidities affect LEL. Studies from the U.K. and Hungary provide evidence that adjusting for comorbidities would reduce YLL by 1–2 years.58 We likely also overestimate YLL because nursing home residents suffered a disproportionate number of COVID-19 deaths, but had much lower life expectancy than non-residents of similar age.59
Fourth, death certificates do not always collect race/ethnicity data in a consistent fashion. Moreover, news stories provide evidence that medical examiners and coroners in some areas may be systematically undercounting COVID-19 deaths.60 Partly because of this undercounting, our estimates of COVID-19 mortality are not directly comparable to those for all-cause excess mortality during the pandemic period.61 However, data permitting, our approach is readily adaptable to estimating all-cause LEL.62
V. Conclusion
We have provided detailed analysis of the effects of the COVID-19 pandemic on the elderly, relying on two unique datasets: individual-level mortality data for three Midwest areas; and longitudinal Medicare data. Both our analytical methods and our results can inform a retrospective assessment of policy successes and failures during the pandemic period, mid-course policy corrections, while the pandemic remains important, national approaches to living with endemic COVID-19,63 and advance planning for the next pandemic.
Supplementary Material
Funding
This project was funded by the National Institutes of Health, award 3 UL1 TR001436-06S1, and was approved by the Medical College of Wisconsin Human Research Review Board.
Footnotes
Competing Interest Statement: The authors have no competing interests.
See Provisional COVID-19 Deaths by Sex and Age, NATĽ CTR. FOR HEALTH STATS., https://data.cdc.gov/NCHS/Provisional-COVID-19-Death-Counts-by-Sex-Age-and-S/9bhg-hcku (last updated Apr. 13, 2022) (for state level COVID mortality data by age and gender); Provisional COVID-19 Deaths by Race and Hispanic Origin, and Age, NATĽ CTR. FOR HEALTH STATS., https://data.cdc.gov/NCHS/Provisional-COVID-19-Deaths-by-Race-and-Hispanic-O/ks3g-spdg (last updated Apr. 13, 2022) (for data by age and race/ethnicity). See also infra Table 3 below.
See Sherry L. Murphy, Kenneth D. Kocanek, Jiaquan Xu, & Elizabeth Arias, Mortality in the United States, 2020, NATĽ CTR. FOR HEALTH STATS. Data Brief 427 (Dec. 2021), available at https://www.cdc.gov/nchs/products/databriefs/db427.htm (last visited Apr. 2, 2022). Mortality data for 2021 is not yet available but a similar ranking of the leading causes of death is expected.
See COVID-19 Nursing Home Data, CTRS. FOR MEDICAID & MEDICARE SERVS. [hereinafter COVID-19 Nursing Home Data], https://data.cms.gov/covid-19/covid-19-nursing-home-data (last visited Apr. 2, 2022).
See infra Table 3.
See, e.g., Jose Manuel Aburto et al., Quantifying impacts of the COVID-19 pandemic through life-expectancy losses: a population-level study of 29 countries, 51 INT’L J. EPIDEMIOLOGY 63 (2021); Theresa Andrasfay & Noreen Goldman, Reductions in 2020 US life expectancy due to COVID-19 and the disproportionate impact on the Black and Latino populations, 118 PROCEEDINGS NAT’L ACAD. SCI. U.S. 5 (2021); Elizabeth Arias et al., United States Life Tables, 2018, 69 NAT’L VITAL STAT. REP. 12 (2021); Eva Dugoff et al., The Impact of COVID-19 on Years of Life Lost, HEALTH CARE COST INST. Oct. 14, 2020; Steven H. Woolf et al., Effect of the covid-19 pandemic in 2020 on life expectancy across populations in the USA and other high income countries: simulations of provisional mortality data, THE BMJ (May 24, 2021).
See Joshua R. Goldstein & Kenneth W. Wachter, Relationships between Period and Cohort Life Expectancy: Gaps and Lage, 60 POPULATION STUD. 257–69 (2006) (explaining the period-based and cohort-based approaches to measuring life expectancy).
See infra Figure 12, Panel A.
See Goldstein & Wachter (2006), supra note 6.
See, e.g., infra Figure 10 (data for Hispanic and Asian men).
See infra Figure 6 (vaccination rates for different age groups over time).
See infra Figure 5.
See, e.g., Andrasfay & Goldman (2021), supra note 5.
See infra Figure 4.
See infra Figure 8.
See id. Panel B.
See generally Woolf et al. (2021), supra note 5; Aburto et al. (2021), supra note 5; Maria Polyakova et al., Racial Disparities in Excess All-Cause Mortality During the Early COVID-19 Pandemic Varied Substantially Across States, 40 HEALTH AFFS., 307–16 (2021); Sarah Miller et al., Estimated Mortality Increases during the COVID-19 Pandemic by Socioeconomic Status, Race, and Ethnicity, 40 HEALTH AFF., 1252–60 (2021); Eunice Y.S. Chan et al., Impact of COVID-19 on Excess Mortality, Life Expectancy, and Years of Life Lost in the United States, 16 PLOS ONE, https://doi.org/10.1371/journal.pone.0256835 (2021); Murphy et al. (2021), supra note 2.
See working paper version of this Article, Paula Natalia Barreto Parra et al., The Effect of the COVID-19 Pandemic on the Elderly: Population Fatality Rates, COVID Mortality Percentage, and Life Expectancy Loss, available at http://ssrn.com/abstract=4030029.
Appendix to Paula Natalia Barreto Parra et al., The Effect of the COVID-19 Pandemic on the Elderly: Population Fatality Rates, COVID Mortality Percentage, and Life Expectancy Loss, 30 ELDER L.J. 33–84 (2022), available at http://ssrn.com/astract=4030030.
See infra Table 1.
Danielle C. Butler et al., Measures of Social Deprivation That Predict Health Care Access and Need within a Rational Area of Primary Care Service Delivery, 48 HEALTH SERVS. RSCH. 539, 543 (2013).
See, e.g., Elizabeth Arias & Jianquan Xu, United States Life Tables, 2018, 69 NAT’L VITAL STATS. REPS. 1 (2020); Elizabeth Arias, United States Life Tables, 2000, NAT’L VITAL STATS. REPS. 51, No. 3 (2002), https://www.cdc.gov/nchs/data/nvsr/nvsr51/nvsr51_03.pdf.
See, e.g., Arias & Xu (2020), supra note 22.
For Asians, we found that an Asian-specific model overestimated actual PFRs for old ages, so we estimate Asian mortality using the full sample with two-way interactions between gender*race/ethnicity and gender*age.
For the non-elderly, we obtain population estimates from the ACS. The ACS data allows us to estimate population by age, gender, and either SES or race/ethnicity but not both. We choose to drop SES rather than race/ethnicity in estimating PFR, based on observing for the elderly that race/ethnicity is a more powerful predictor of COVID-19 mortality than SES (see Table 1).
We have NCHS data for Cook County for 2020, including cause of death. We assume non-COVID-19 deaths for 2021 were the same as for 2020.
See Coronavirus in the U.S.: Latest Map and Case Count, N.Y. TIMES (Apr. 17, 2022), https://www.nytimes.com/interactive/2021/us/covid-cases.html (As of this Article’s publication, the New York Times reported over 992,000 total COVID-19 deaths).
See Joshua R. Goldstein & Ronald D. Lee, Demographic Perspectives on the Mortality of COVID-19 and Other Epidemics, 117 PNAS 22035, 22041 (2020).
Arias & Xu (2020), supra note 22.
See, e.g., Julia Hippisley-Cox et al., Risk prediction of covid-19 related death and hospital admission in adults after covid-19 vaccination: national prospective cohort study, BMJ, BMJ 374:n2244 (2021); Matthew T. Oetjens et al., Electronic health record analysis identifies kidney disease as the leading risk factor for hospitalization in confirmed COVID-19 patients, PLOS ONE 15(11): e0242182.
Karen Davis et al., Medicare: 50 Years of Ensuring Coverage and Care, THE COMMONWEALTH FUND, 9 (2015), https://www.commonwealthfund.org/sites/default/files/documents/media_files_publications_fund_report_2015_apr_1812_davis_medicare_50_years_coverage_care.pdf.
COVID-19 Vaccination and Case Trends by Age Group, United States, CTRS. FOR DISEASE CONTROL & PREVENTION, https://data.cdc.gov/Vaccinations/COVID-19-Vaccination-and-Case-Trends-by-Age-Group-/gxj9-t96f (last updated Apr. 15, 2022) (The CDC reports confirmed infections by age range for 2021, although with substantial undercounting, since age is known for only about two-thirds of cases). Confirmed infection rates in 2021 for the elderly are well below those for the adult nonelderly. See COVID-19 Weekly Cases and Deaths per 100,000 Population by Age, Race/Ethnicity, and Sex, CTRS. FOR DISEASE CONTROL & PREVENTION, https://covid.cdc.gov/covid-data-tracker/#demographicsovertime (select age-all groups) (For 2020, downloadable data is not available, but this CDC chart shows higher infection rates at younger ages (except very early in the pandemic, when testing was very limited)).
Jill Diesel et al., COVID-19 Vaccination Coverage Among Adults—United States, December 14, 2020-May 22, 2021, CTRS. FOR DISEASE CONTROL & PREVENTION (June 25, 2021), https://www.cdc.gov/mmwr/volumes/70/wr/mm7025e1.htm#suggestedcitation.
Hannah E. Fast et al., Booster and Additional Primary Dose COVID-19 Vaccinations Among Adults Aged 65 Years—United States, August 13, 2021-November 19, 2021, CTRS. FOR DISEASE CONTROL & PREVENTION (Dec. 17, 2021), https://www.cdc.gov/mmwr/volumes/70/wr/mm7050e2.htm.
COVID-19 Vaccination and Case Trends by Age Group, United States, CTRS. FOR DISEASE CONTROL & PREVENTION (Feb. 25, 2022), https://data.cdc.gov/Vaccinations/COVID-19-Vaccination-and-Case-Trends-by-Age-Group-/gxj9-t96f; COVID-19 Vaccinations in the United States, Jurisdiction, CTRS. FOR DISEASE CONTROL & PREVENTION (Feb. 26, 2022), https://data.cdc.gov/Vaccinations/COVID-19-Vaccinations-in-the-United-States-Jurisdi/unsk-b7fc. For the CDC, “fully vaccinated” means two doses of the Pfizer or Moderna mRNA vaccine, or a single dose of the less-effective Johnson & Johnson (“J&J”) adenovirus vector vaccine. As a practical matter, however, the percentage of people receiving the J&J vaccine was well under 5%.
See COVID-19 Nursing Home Data, supra note 3.
Id. The CDC does not report which vaccine nursing home residents received, or the percentage of nursing home residents who have received a booster dose.
See, e.g., Eric C. Schneider et al., The U.S. COVID-19 Vaccination Program at One Year: How Many Deaths and Hospitalizations Were Averted? COMMONWEALTH FUND. (Dec. 14, 2021), https://www.commonwealthfund.org/publications/issue-briefs/2021/dec/us-covid-19-vaccination-program-one-year-how-many-deaths-and; Nicholas Holtkamp et al., COVID-19 Vaccination Associated with Reductions in COVID-19 Mortality and Morbidity in the United States, and an Approach to Valuing these Benefits, U.S. DEP’T OF HEALTH & HUMAN SERVS. OFFICE OF THE ASSISTANT SEC’Y FOR PLAN. & EVALUATION RSCH. (Dec. 2021), available at https://aspe.hhs.gov/sites/default/files/documents/cfae1f63ba6d7eeda21d3fcf2a35c6bc/aspe-ib-association-of-vaccination-select-outcomes.pdf.
Ann G. Zauber, Cost-Effectiveness of Colonoscopy, 20 GASTROINTESTINAL ENDOSCOPY CLINICS NORTH AM. 751–70 (2010), cf. Amnon Sonnenberg et. al, Cost-Effectiveness of Colonoscopy in Screening for Colorectal Cancer, 133 ANNALS INTERNAL MED. 573–84 (2000) (0.08 years or 29 days).
See, e.g., Anneliese N. Luck et al., The unequal burden of the Covid-19 Pandemic: Capturing racial/ethnic disparities in US cause-specific mortality, 17 SSM – POPULATION HEALTH 101012 (Mar. 2022), available at https://doi.org/10.1016/j.ssmph.2021.101012 (discussing rise in leading causes of death in 2020).
Rates of COVID-19 Cases or Deaths by Age Group and Vaccination Status and Booster Dose, CTRS. FOR DISEASE CONTROL & PREVENTION, https://data.cdc.gov/Public-Health-Surveillance/Rates-of-COVID-19-Cases-or-Deaths-by-Age-Group-and/d6p8-wqjm (last updated Apr. 15, 2022) (The data currently available from the CDC that could support such an effort is crude in various ways (for example, the only age groups are 18–49; 50–64, and 65+), and begins only in September 2021).
See, e.g., D. Phuong (Phoenix) Do & Reanne Frank, Using Race- and Age-specific COVID-19 Case Data to Investigate the Determinants of the Excess COVID-19 Mortality Burden Among Hispanic Americans, 44 DEMOGRAPHIC RSCH. 699, 706 (2021); Katherine Mackey et al., Racial and Ethnic Disparities in COVID-19–Related Infections, Hospitalizations, and Deaths 174 ANNALS INTERNAL MED. 362 (2021).
See generally, James B. Kirby & Toshiko Kaneda, Unhealthy and Uninsured: Exploring Racial Differences in Health and Health Insurance Coverage Using a Life Table Approach, 47 DEMOGRAPHY 1035, 1037–39 (2010); Medicare Health Insurance for Senior Citizens, ELDERCARE DIRECTORY, https://www.eldercaredirectory.org/medicare.htm (last visited Feb. 28, 2022); see also Seniors & Medicare and Medicaid Enrollees, MEDICAID.GOV, https://www.medicaid.gov/medicaid/eligibility/seniors-medicare-and-medicaid-enrollees/index.html (last visited Feb. 28, 2022).
See Andrasfay & Goldman (2021), supra note 14, at 4.
Facts + Statistics: Mortality Risk, INS. INFO. INST., https://www.iii.org/fact-statistic/facts-statistics-mortality-risk (last visited Feb. 28, 2022).
See, e.g., David A. Hyman & Charles Silver, Regulating Health Care: Perspectives from Government Failure During the COVID-19 Pandemic, DEPAUL L. REV. (forthcoming), working paper at https://papers.ssrn.com/abstract=3961732 (on the missteps taken by the CDC in 2020).
Tony Pugh, ‘Flat-Out Resistant’ Staffers Imperil Nursing Home Vaccine Goal, BLOOMBERG L. (June 21, 2021), https://news.bloomberglaw.com/health-law-and-business/flat-out-resistant-staffers-imperil-nursing-home-vaccine-goal.
Brian E. McGarry et al., Nursing Home Staff Vaccination and Covid-19 Outcomes, 386 NEW ENGLAND J. MED. 397–98 (2022).
Jill M. Ferdinands et al., Waning 2-Dose and 3-Dose Effectiveness of mRNA Vaccines Against COVID-19–Associated Emergency Department and Urgent Care Encounters and Hospitalizations Among Adults During Periods of Delta and Omicron Variant Predominance—VISION Network, 10 States, August 2021–January 2022, CTRS. FOR DISEASE CONTROL & PREVENTION (Feb. 11, 2022), https://www.cdc.gov/mmwr/volumes/71/wr/mm7107e2.htm.
Yinon M. Bar-On et al., Protection of BNT162b2 Vaccine Booster against COVID-19 in Israel, NEW ENGLAND J. MED. (Oct. 7, 2021), https://www.nejm.org/doi/full/10.1056/NEJMoa2114255; Tania Kramer, Israel’s bet on early COVID booster shots pays off, DEUTSCHE WELLE (Nov. 11, 2021), https://www.dw.com/en/israels-bet-on-early-covid-booster-shots-pays-off/a-59787257.
FDA News Release: Coronavirus (COVID-19) Update: FDA Expands Eligibility for COVID-19 Vaccine Boosters, FED. DRUG ADMIN. (Nov. 19, 2021), https://www.fda.gov/news-events/press-announcements/coronavirus-covid-19-update-fda-expands-eligibility-covid-19-vaccine-boosters.
Richard V. Reeves & Beyond Deng, At least 65,000 more men than women have died from COVID-19 in the US, BROOKINGS INST. (Nov. 4, 2021), https://www.brookings.edu/blog/up-front/2021/10/19/at-least-65000-more-men-than-women-have-died-from-covid-19-in-the-us/.
See generally id.; Francisco Ubeda & Vincent A.A. Jansen, The evolution of sex-specific virulence in infectious diseases, 7(13849) NATURE COMMC’NS 1, 2 (Dec. 16, 2016), https://pubmed.ncbi.nlm.nih.gov/27959327/.
An exception is Richard V. Reeves & Beyond Deng, At least 65,000 more men than women have died from COVID-19 in the US, BROOKINGS INST. (Nov. 4, 2021), https://www.brookings.edu/blog/up-front/2021/10/19/at-least-65000-more-men-than-women-have-died-from-covid-19-in-the-us/.
See Liz Hamel et al., COVID-19 Vaccine Monitor: September 2021, KAISER FAM. FOUND. (Sept. 28, 2021), https://www.kff.org/coronavirus-covid-19/poll-finding/kff-covid-19-vaccine-monitor-september-2021/.
COVID-19: Vaccine Data, WIS. DEP’T OF HEALTH SERVS., https://www.dhs.wisconsin.gov/covid-19/vaccine-data.htm (visited Apr. 24, 2022) (vaccination rate of 67.0% for Asians vs. 59.0% for Whites).
We expect, for some period of time, to provide quarterly updates on the Fight COVID Milwaukee website (https://fightcovidmilwaukee.org).
Peter Hanlon et al., COVID-19–Exploring the Implications of Long-Term Condition Type and Extent of Multimorbidity on Years of Life Lost: A Modelling Study, 5 WELCOME OPEN RSCH. (2020), available at https://www.ncbi.nlm.nih.gov/pmc/articles/PMC7927210/; Tamás Ferenci, Different approaches to quantify years of life lost from COVID-19, 36 EUR. J. EPIDEMIOLOGY 589–97 (2021), available at https://www.ncbi.nlm.nih.gov/pmc/articles/PMC8192042/.
Anne Kelly et al., Length of Stay for Older Adults Residing in Nursing Homes at the End of Life, 58 J. AM. GERIATRICS SOC’Y 1701–06 (Aug. 24, 2010), https://doi-org.proxy2.library.illinois.edu/10.1111/j.1532-5415.2010.03005.x.
See Minyvonne Burke, County coroner in Missouri says he omits Covid-19 from some death certificates, NBC NEWS (Aug. 4, 2021), https://www.nbcnews.com/health/health-news/county-coroner-missouri-says-he-omits-covid-19-some-death-n1275929; The Documenting COVID-19 Project, Uncounted: Inaccurate Death Certificates Across the Country Hide the True Toll of COVID-19, USA TODAY (Dec. 22, 2021), https://www.usatoday.com/in-depth/news/nation/2021/12/22/covid-deaths-obscured-in-accurate-death-certificates/8899157002/; America’s elected coroners are too often a public-health liability: The politics of death, THE ECONOMIST (Jan. 29, 2022), https://www.economist.com/united-states/2022/01/29/americas-elected-coroners-are-too-often-a-public-health-liability.
See generally Steven Woolf et al., Excess Deaths from COVID-19 and Other Causes in the US, March 1, 2020 to January 2, 2021, 325 J. AM. MED. ASS’N 1786, 1786–89 (Mar. 8, 2021), https://jamanetwork.com/journals/jama/fullarticle/2778361; Maria Polyakova et al., Racial Disparities in Excess All-Cause Mortality During the Early COVID-19 Pandemic Varied Substantially Across States, 40(2) HEALTH AFFS. 307, 307–16 (Feb. 2021), https://www.healthaffairs.org/doi/abs/10.1377/hlthaff.2020.02142; Sarah Miller et al., Estimated Mortality Increases During The COVID-19 Pandemic By Socioeconomic Status, Race, And Ethnicity, 40(8) HEALTH AFFS. 1252, 1252–60 (Aug. 2021), https://doi.org/10.1377/hlthaff.2021.00414; Eunice Y.S. Chan et al., Impact of COVID19 on excess mortality, life expectancy, and years of life lost in the United States, 16(9) PLOS ONE (Sept. 1, 2021), https://doi.org/10.1371/journal.pone.0256835; Sherry L. Murphy et al., Mortality in the United States, 2020, NAT’L CTR. FOR HEALTH STAT. (Dec. 2021), https://www.cdc.gov/nchs/products/databriefs/db427.htm.
We are in the process of obtaining individual-level mortality data for our three areas for all causes of death, not just COVID-19, which will permit us to conduct a multivariate decomposition of all-cause mortality during the pandemic period.
See, e.g., Ezekiel Emmanuel et al., A Natrional Strategy for the “New Normal” of Life with COVID, 327 J. AM. MED. ASS’N 211–12 (2022).
Contributor Information
Paula Natalia Barreto Parra, Northwestern University.
Vladimir Atanasov, William & Mary, Mason School of Business.
Jeff Whittle, Medical College of Wisconsin.
John Meurer, Medical College of Wisconsin.
Qian (Eric) Luo, George Washington University.
Ruohao Zhang, Northwestern University, Kellogg School of Management.
Bernard Black, Northwestern University, Pritzker School of Law and Kellogg School of Management.
References
- Aburto José Manuel, Jonas Schöley Ilya Kashnitsky, Zhang Luyin, Rahal Charles, Missov Trifon I., Mills Melinda C., Dowd Jennifer B, & Kashyap Ridhi (2021), Quantifying impacts of the COVID-19 pandemic through life-expectancy losses: a population-level study of 29 countries, 51 INT’L J. EPIDEMIOLOGY (Feb. 2022), doi: 10.1093/ije/dyab207. [DOI] [PMC free article] [PubMed] [Google Scholar]
- Andrasfay Theresa & Goldman Noreen (2021), Reductions in 2020 US Life Expectancy due to COVID-19 and the Disproportionate Impact on the Black and Latino Populations, 118 PROCEEDINGS NAT’L ACAD. SCI. OF U.S. OF AM (Jan. 14, 2021), 10.1073/pnas.2014746118. [DOI] [PMC free article] [PubMed] [Google Scholar]
- Arias Elizabeth, United States Life Tables, 2000, NAT’L VITAL STATS. REPS 51, No. 3 (2002), https://www.cdc.gov/nchs/data/nvsr/nvsr51/nvsr51_03.pdf. [PubMed] [Google Scholar]
- Arias Elizabeth, Betzaida Tejada-Vera Fariday Ahmad, & Kochanek Kenneth D., Provisional Life Expectancy Estimates for 2020, VITAL STATS. RAPID RELEASE REP 15 (July 2021). [Google Scholar]
- Arias Elizabeth, & Xu Jiaquan, United States Life Tables, 2018, 69(12) NAT’L VITAL STATS. REPS (Nov. 17, 2020). [PubMed] [Google Scholar]
- Bach Peter B., CDC Estimated a One-Year Decline in Life Expectancy in 2020. Not So—Try Five Days, STAT NEWS (Feb. 25, 2021), https://www.statnews.com/2021/02/25/cdc-one-year-decline-life-expectancy-really-five-days/.
- Parra Barreto, Natalia Paula, Atanasov Vladimir, Meurer John, Whittle Jeff, Luo Eric, Zhang Ruohao, & Black Bernard, The COVID-19 Pandemic and Life Expectancy: Decomposition Using Individual-Level Mortality Data (working paper 2022), available at http://ssrn.com/abstract=3795801.
- Butler Danielle C., Petterson Stephen, Phillips Robert L., & Bazemore Andrew W., Measures of Social Deprivation that Predict Health Care Access and Need within a Rational Area of Primary Care Service Delivery, 48 HEALTH SERVS. RSCH 539–59 (2012). [DOI] [PMC free article] [PubMed] [Google Scholar]
- CTRS. FOR DISEASE CONTROL & PREVENTION, Estimated Disease Burden of COVID-19 (Apr. 29, 2021), https://www.cdc.gov/coronavirus/2019-ncov/cases-updates/burden.html.
- Chan Eunice Y.S., Cheng Davy, & Martin Janet, Impact of COVID-19 on Excess Mortality, Life Expectancy, and Years of Life Lost in the United States, 16 PLOS ONE (Sept. 1, 2021), available at 10.1371/journal.pone.0256835. [DOI] [PMC free article] [PubMed] [Google Scholar]
- Do D. Phuong & Frank Reanne, Using Race- and Age-Specific COVID-19 Case Data to Investigate the Determinants of the Excess COVID-19 Mortality Burden Among Hispanic Americans, 44 DEMOGRAPHIC RSCH 699–718 (Apr. 1, 2021), https://www.demographic-research.org/Volumes/Vol44/29/. [Google Scholar]
- DuGoff Eva, Fenelon Andy, Pupino Angela, Hargraves John, Segal Misha, & Brennan Niall, The Impact of COVID-19 on Years of Life Lost, HEALTH CARE COST INST (Oct. 14, 2020), available at https://healthcostinstitute.org/hcci-research/the-impact-of-covid-19-on-years-of-life-lost.
- Ferenci Tamás, Different approaches to quantify years of life lost from COVID-19, 36 EUROPEAN J. EPIDEMIOLOGY 589–97 (2021), available at 10.1007/s10654-021-00774-0. [DOI] [PMC free article] [PubMed] [Google Scholar]
- Goldstein Joshua R & Lee Ronald D., Demographic Perspectives on the Mortality of COVID-19 and Other Epidemics, 117 PROCEEDINGS NAT’L ACAD. SCI. OF U.S. OF AM 22035–41 (Sept. 8, 2020), 10.1073/pnas.2006392117. [DOI] [PMC free article] [PubMed] [Google Scholar]
- Goldstein Joshua R. & Wachter Kenneth W. (2006), Relationship Between Period and Cohort Life Expectancy: Gaps and Lags, 60 POPULATION STUDIES 257–69 (Nov. 3, 2006), available at http://www.jstor.org/stable/30040491?origin=JSTOR-pdf. [DOI] [PubMed] [Google Scholar]
- Hanlon Peter, Chadwick Fergus, Shah Anoop, Wood Rachael, Minton Jon, Gerry McCartney Colin Fischbacher, Mair Frances S., Husmeier Dirk, Matthiopoulos Jason, & McAllister David A., COVID-1–Exploring the Implications of Long-Term Condition Type and Extent of Multimorbidity on Years of Life Lost: A Modelling Study, WELCOME OPEN RSCH (2020), available at https://www.ncbi.nlm.nih.gov/pmc/articles/PMC7927210/. [DOI] [PMC free article] [PubMed]
- Kelly Anne, Jessamyn Conell-Price Kenneth Covinsky, Center Irena, Chang Anna, John Boscardin W, & Smith Alexander, Length of Stay for Older Adults Residing in Nursing Homes at the End of Life, 58 J. AM. GERIATRIC SOC’Y 1701–06 (Aug. 24, 2010), 10.1111/j.1532-5415.2010.03005.x. [DOI] [PMC free article] [PubMed] [Google Scholar]
- Mackey Katherine, Ayers Chelsea K., Kondo Karli K., Saha Somnath, Advani Shailesh M., Young Sara, Spencer Hunter, Rusek Max, Anderson Johanna, Veazie Stephanie, Smith Mia, & Kansagara Devan, Racial and ethnic disparities in COVID-19–related infections, hospitalizations, and deaths: A systematic review, 189(11) ANNALS INTERNAL MED 1244–53, at doi: 10.7326/M20-6306. [DOI] [PMC free article] [PubMed] [Google Scholar]
- Miller Sarah, Wherry Laura, & Mazumder Bhashkar, Estimated Mortality Increases during the COVID-19 Pandemic by Socioeconomic Status, Race, and Ethnicity, 40 HEALTH AFFS 1252–60 (Aug. 2021), available at 10.1377/hlthaff.2021.00414. [DOI] [PubMed] [Google Scholar]
- Murphy Sherry L., Kochanek Kenneth D., Xu Jiaquan, & Arias Elizabeth, Mortality in the United States, 2020, NAT’L CTR. FOR HEALTH STAT (Dec. 2021), available at https://www.cdc.gov/nchs/products/databriefs/db427.htm. [PubMed]
- Polyakova Maria, Udalova Victoria, Kocks Geoffrey, Geadek Katie, Finlay Keith, & Finkelstein Amy N., Racial Disparities in Excess All-Cause Mortality During the Early COVID-19 Pandemic Varied Substantially Across States, 40 HEALTH AFFS, 307–16 (Feb. 2021), available at 10.1377/hlthaff.2020.02142. [DOI] [PMC free article] [PubMed] [Google Scholar]
- Wilson Linus, Risks Mortality and Life Expectancy Losses from COVID-19 Infections by Age in the United States, working paper (2021), available at http://ssrn.com/abstract=3776422.
- Woolf Steven H., Masters Ryan, & Aron Laudan, Effect of the Covid-19 Pandemic on Life Expectancy Across Populations in the USA and Other High Income Countries: Simulations of Provisional Mortality Data, The BMJ (May 24, 2021), 10.1136/bmj.n1343. [DOI] [PMC free article] [PubMed] [Google Scholar]
- Woolf Steven, Chapman Derek, Sabo Roy, & Zimmerman Emily, Excess Deaths from COVID-19 and Other Causes in the US, March 1, 2020 to January 2, 2021, 325 J. AM. MED. ASS’N 1786–89 (Mar. 8, 2021), https://jamanetwork.com/journals/jama/fullarticle/2778361. [DOI] [PMC free article] [PubMed] [Google Scholar]
Associated Data
This section collects any data citations, data availability statements, or supplementary materials included in this article.