

Summary
Melanoma is a highly aggressive skin cancer that frequently metastasizes, but current therapies only benefit some patients. Here, we demonstrate that the serine/threonine kinase cell division cycle 7 (CDC7) is overexpressed in melanoma, and patients with higher expression have shorter survival. Transcription factor ELK1 regulates CDC7 expression, and CDC7 inhibition promotes cell cycle arrest, senescence, and apoptosis, leading to inhibition of melanoma tumor growth and metastasis. Our chemical genetics screen with epigenetic inhibitors revealed stronger melanoma tumor growth inhibition when XL413 is combined with the EZH2 inhibitor GSK343 or BRPF1/2/3 inhibitor OF1. Mechanistically, XL413 with GSK343 or OF1 synergistically altered the expression of tumor-suppressive genes, leading to higher apoptosis than the single agent alone. Collectively, these results identify CDC7 as a driver of melanoma tumor growth and metastasis that can be targeted alone or in combination with EZH2 or BRPF1/2/3 inhibitors.
Subject areas: Chemistry, Epigenetics, Cell biology, Cancer
Graphical abstract
Highlights
-
•
CDC7 is overexpressed in melanoma and predicts reduced patient survival
-
•
ELK1 regulates CDC7 expression in melanoma
-
•
CDC7 inhibition attenuates melanoma tumor growth and metastasis
-
•
XL413 co-operates with GSK343 and OF1 to potently inhibit melanoma growth
Chemistry; Epigenetics; Cell biology; Cancer
Introduction
Melanoma is a highly aggressive form of skin cancer that accounts for over 85% of all skin-cancer-related deaths (Miller and Mihm, 2006). Although current therapies targeting the BRAF→MEK→ERK pathway and cancer immunotherapies are effective for a subset of melanoma patients (Shin et al., 2020), not all benefit and many display intrinsic or extrinsic resistance. There is an unmet medical need for treating these patients.
A common characteristic of cancer cells is cell-cycle dysregulation, including defects in cell-cycle checkpoints, which can lead to uncontrolled proliferation even under unfavorable conditions (Fouad and Aanei, 2017; Hanahan and Weinberg, 2000). Cell-cycle deregulation can result from inactivation of tumor suppressors (e.g., p53, RB) (Sherr and McCormick, 2002) or from other changes such as the overexpression or activation of cell-cycle-related kinases (Diallo and Prigent, 2011; Ding et al., 2020). Deregulated cell-cycle regulators contribute to uncontrolled proliferation in various cancers including melanoma (Asghar et al., 2015; Sandhu and Slingerland, 2000; Vermeulen et al., 2003). Several cell-cycle regulators have been successfully targeted for cancer therapy for various cancers, including cyclin-dependent kinase (CDK)4/6 (Kikuchi et al., 2019; Spring et al., 2020), CDK2 (Bayes et al., 2004), and CDK1 (Aly et al., 2020).
Cell division cycle 7 (CDC7) is a highly conserved serine-threonine kinase that regulates the cell cycle by phosphorylating chromatin-bound minichromosome maintenance complex component 2 (MCM2) at the G1–S transition in the cell cycle (Montagnoli et al., 2010; Swords et al., 2010). This phosphorylation is required to initiate DNA replication (Tsuji et al., 2006). CDC7 was previously reported to be overexpressed in several cancer types and was also associated with poor prognosis (Bonte et al., 2008; Huggett et al., 2016; Kulkarni et al., 2009). CDC7 also regulates therapeutic responses to anti-cancer therapy (Gad et al., 2019), and CDC7 inhibitors have progressed to phase I clinical trials for several cancer types (Cheng et al., 2018; Gallagher et al., 2019; Montagnoli et al., 2010).
Epigenetic regulators have shown to play an important role in both normal and cancer cells (Sharma et al., 2010). In particular, epigenetic regulators influence multiple aspects of tumorigenesis, which includes regulating the expression of tumor suppressor genes and oncogenes, modulating signaling pathways resulting in enhanced cancer growth, invasion, and metastases (Cheng et al., 2019). They have also been associated with drug resistance and predicting response to treatment (Hayashi and Konishi, 2021). Therefore, targeting epigenetic regulators can be used as an alternative cancer therapy (Cheng et al., 2019). Based on this rationale, several drugs targeting epigenetic regulators have received approval for clinical use (Rius and Lyko, 2012).
Here, we demonstrate that CDC7 is overexpressed in melanoma, and this overexpression is associated with reduced survival in patients with melanoma. We also show that pharmacological inhibition of CDC7 suppresses melanoma tumor growth and metastasis in cell culture and a mouse xenograft model. Furthermore, guided by these previous observations and successful clinical translation of drugs targeting epigenetic regulators, we performed an epigenetic-regulator-targeting small molecule screen, which revealed that the CDC7 inhibitor XL413 cooperates with the EZH2 inhibitor GSK343 or BRPF1/2/3 inhibitor OF1 to more potently inhibit melanoma tumor growth. Collectively, our study identifies CDC7 as a target for melanoma therapy that can inhibit tumor growth either alone or in combination with other targets such as EZH2 and BRPF1/2/3.
Results
CDC7 is overexpressed in melanoma samples and predicts poor prognosis
Previous studies have shown cancer-promoting roles for CDC7 and suggested that it can be therapeutically targeted to inhibit tumor growth and metastasis (Ito et al., 2008; Sawa and Masai, 2009). However, the role of CDC7 in melanoma tumor growth and/or metastasis is not known, and it is not clear if CDC7 inhibitors can be used for melanoma therapy. Therefore, with the goal of understanding the role of CDC7 in melanoma, we analyzed several publicly available cancer and melanoma mRNA expression datasets. This assessment revealed that CDC7 was significantly overexpressed in many cancer types including melanoma (Figure S1). We then focused our analysis of CDC7 on several other available melanoma datasets (Haqq et al., 2005; Riker et al., 2008; Talantov et al., 2005), and these extensive analyses uncovered that CDC7 mRNA was significantly overexpressed in melanoma tissues compared with normal skin (Figures 1A and 1B). Furthermore, CDC7 mRNA expression was higher in metastatic melanoma than primary melanoma (Figure 1C) (Riker et al., 2008; Xu et al., 2008). In agreement with their higher expression, we observed that high CDC7 expression was associated with poor melanoma patient survival (Figure 1D). Collectively, these results demonstrated that CDC7 is overexpressed in melanoma samples and predicts poor patient prognosis.
Figure 1.

CDC7 is overexpressed in patient-derived melanoma samples
(A) The indicated patient melanoma patient datasets were analyzed for CDC7 mRNA expression using Oncomine, which was upregulated in CDC7 in melanoma samples relative to expression in normal skin.
(B) CDC7 mRNA expression was plotted using Gene Expression Profiling Interactive Analysis (GEPIA).
(C) CDC7 mRNA expression levels at primary sites and metastasis were plotted for the indicated datasets.
(D) Survival analysis (3 years) of patients with melanoma in Human Protein Atlas datasets based on CDC7 expression (low, n = 47; high, n = 55) with p = 0.022.
(E) The indicated melanoma patient datasets were analyzed for ELK1 mRNA expression, which was upregulated in melanoma samples relative to normal skin.
(F and G) ELK1 mRNA expression levels at primary sites and metastases were plotted for the indicated melanoma datasets using Oncomine.
(H) A375 and M14 melanoma cells expressing NS or ELK1 shRNAs were analyzed for ELK1 and CDC7 mRNA expression by RT-qPCR and normalized to ACTB.
(I) A375 melanoma cells expressing NS or ELK1 shRNAs were analyzed for ELK1 and CDC7 protein expression by immunoblotting and normalized to ACTINB levels.
(J) ELK1 protein enrichment on the CDC7 promoter measured by CUT&RUN assay. ACTB gene promoter regions were used as negative controls. Percent enrichments relative to immunoglobulin G (IgG) under the indicated conditions for each promoter (CDC7 and ACTB) are shown.
Data represent the mean ± standard error of three biological replicates. ns = not significant, ∗p < 0.05, ∗∗p < 0.01, ∗∗∗p < 0.001. See also Figures S1 and S2.
The transcription factor ELK1 is necessary for CDC7 overexpression in melanoma
Our analysis showed that CDC7 expression was overexpressed at the mRNA level in patient-derived melanoma samples; therefore, we aimed to determine the mechanism that drives CDC7 overexpression in melanoma. We first analyzed the CDC7 promoter DNA sequence (∼2 kb) for transcription factor consensus DNA binding sites using PROMO search (Messeguer et al., 2002) and identified several transcription factors that were perfect matches for the consensus DNA binding sequence (Figure S2A). To prioritize transcription factors for further analysis, we next asked which transcription factors, similar to CDC7, were also overexpressed in patient-derived melanoma samples in publicly available melanoma mRNA expression datasets (Talantov et al., 2005). Among the shortlisted transcription factors, only ELK1 was significantly co-overexpressed with CDC7 in melanoma patient samples (Figures 1E and S2B). In addition, similar to CDC7, ELK1 expression was higher in metastatic melanoma samples compared with primary melanoma samples (Riker et al., 2008; Xu et al., 2008) (Figures 1F and 1G).
We then knocked down ELK1 mRNA expression in melanoma cells (A375 and M14) using short hairpin RNAs (shRNAs) to determine if it was necessary for transcriptional upregulation of CDC7. We used melanoma cells expressing nonspecific (NS) shRNA as controls. Our results showed that ELK1 knockdown reduced CDC7 mRNA and protein levels in melanoma cells (Figures 1H and 1I). Next, to determine if CDC7 is a direct target of ELK1, we performed CUT&RUN assays (Skene and Henikoff, 2017) to monitor ELK1 enrichment on the CDC7 promoter and observed increased levels (Figure 1J) of ELK1 on CDC7 promoter. Collectively, these results demonstrated that the transcription factor ELK1 is necessary for the CDC7 upregulation in melanoma.
CDC7 inhibition blocks melanoma cell proliferation and metastatic characteristics in cell culture
Genes that are upregulated in cancer cells may play a role in their tumor growth and metastasis. To examine the role of CDC7 in melanoma tumor growth and metastasis, we tested the effect of XL413 on melanoma tumor growth and metastatic characteristics in cell culture. XL413 is a highly selective small molecule inhibitor of CDC7, with a half-maximal inhibitory concentration (IC50) of 3.4 nM. By comparison, the IC50 values of XL413 for the kinases CK2 and PIM1 are 215 nM (>30-fold lower) and 42 nM (>12-fold lower), respectively (Koltun et al., 2012).
Melanoma cell lines (A375, M14, and SKMEL-239) were treated with different concentrations of XL413. To confirm that the concentrations used were effective in inhibiting CDC7 function, we measured the phosphorylation levels of MCM2 (p-MCM2), which is a substrate of CDC7’s kinase activity (Chuang et al., 2009). As expected, melanoma cells treated with XL413 showed reduced p-MCM2 levels compared with control cells treated with dimethyl sulfoxide (DMSO) (Figure 2A). We next tested the effect of XL413 on melanoma cell viability using MTT assays and found that XL413 treatment inhibited the short-term survival of melanoma cells (Figure 2B). We also tested the effect of XL413 on the long-term growth of melanoma cells using clonogenic assays and found that XL413 inhibited the colony-forming ability of melanoma cells in a concentration-dependent manner (Figure 2C). Finally, we tested the effect of XL413 on melanoma cell growth in soft agar assays, which is a surrogate assay for in vivo tumor growth (Borowicz et al., 2014; Horibata et al., 2015). The results showed that XL413 significantly inhibited melanoma cell growth in soft agar in a concentration-dependent manner (Figures 2D and 2E). Similar results were obtained in melanoma cells expressing CDC7 shRNAs (Figure S3).
Figure 2.

Pharmacological inhibition of CDC7 inhibits melanoma growth and progression
(A) The indicated melanoma cell lines were treated with various concentrations of the CDC7 inhibitor XL413 for 24 h. Then, phosphorylated MCM2 (Ser 40) and total MCM2 were measured via immunoblotting and normalized to ACTINB.
(B) The indicated melanoma cell lines were treated with different concentrations of XL413 for 3 days and subjected to MTT assays. Relative cell viability was plotted with respect to vehicle-treated cells.
(C) The indicated melanoma cell lines were treated with the different concentrations of XL413 for 1–2 weeks, and cell survival was measured in clonogenic assays. Representative images are shown.
(D) The indicated melanoma cell lines were treated with the different concentrations of XL413 and analyzed for their ability to grow in soft agar. Representative images are shown; scale bar, 500 μm.
(E) Relative colony size for the images shown in panel D.
(F) The indicated melanoma cell lines were treated with different concentrations of XL413 and analyzed for invasion ability in Matrigel-based Boyden chamber assays. Representative images are shown; scale bar, 500 μm.
(G) Percentage invasions plotted for the images shown in panel F.
Data represent the mean ± standard error of three biological replicates. ns = not significant, ∗p < 0.05, ∗∗p < 0.01, ∗∗∗p < 0.001, ∗∗∗∗p < 0.0001. See also Figure S3 and S4A–S4E.
Because we observed that CDC7 expression was higher in metastatic melanoma than in primary melanoma, we also asked if CDC7 contributes to the metastatic characteristics of melanoma cells. To this end, we treated melanoma cells with XL413 and performed Matrigel-invasion assays to monitor melanoma cell invasion ability. We observed that XL413 treatment significantly inhibited the invasion ability of melanoma cells in a concentration-dependent manner (Figures 2F and 2G).
Because we had found that the transcription factor ELK1 regulates CDC7 expression, we also determined the effect of ELK1 knockdown on the ability of melanoma cells to grow in an anchorage-independent manner using soft agar assays and to invade using Matrigel-invasion assay. ELK1 knockdown inhibited the ability of the melanoma cells to form colonies in soft agar assay and also invade in Matrigel-invasion assay (Figures S4A–S4E), mimicking the effect of CDC7 inhibition in melanoma cells. Collectively, these results established that CDC7 inhibition blocks melanoma cell growth and their metastatic characteristics in cell culture.
CDC7 inhibition blocks melanoma tumor growth and metastasis in mice
We next tested whether XL413 could inhibit melanoma tumor growth and metastasis in vivo in mice. The melanoma cell line A375 was subcutaneously injected into the dorsal flank of athymic nude mice, and tumor growth was monitored after treating them with vehicle or the CDC7 inhibitor XL413. We found that XL413 treatment inhibited melanoma tumor growth in mice (Figure 3A).
Figure 3.

Pharmacological inhibition of CDC7 inhibits melanoma tumor growth and metastasis in vivo
(A) A375 cells were subcutaneously injected into the flanks of nude mice (n = 6). The mice were treated with vehicle or XL413 (50 mg/kg body weight) intraperitoneally every other day. The average tumor volumes were plotted each week.
(B) Firefly-luciferase-labeled A375-MA2 cells were subcutaneously injected into the flanks of NSG mice (n = 6). The mice were treated with vehicle or XL413 (50 mg/kg body weight) intraperitoneally every other day, and tumor growth was measured. The average tumor volumes were plotted each week.
(C) Relative luminescence measured in vehicle- and XL413-treated NSG mice at 2 and 6 weeks.
(D) Representative whole-body bioluminescence images of NSG mice at 2 and 6 weeks after the start of XL413 treatment.
(E) Bioluminescence images of lungs from vehicle-treated or XL413-treated NSG mice after 6 weeks of treatment.
(F) Percentages of mice with spontaneous metastasis to lungs were plotted for the control and XL413-treated groups.
(G) PDXs were subcutaneously injected into the flanks of NSG mice (n = 6). The mice were then treated with vehicle or XL413 (50 mg/kg body weight) intraperitoneally every other day, and tumor growth was measured. The average tumor volumes were plotted each week.
Data represent the mean ± standard error of three biological replicates. ns = not significant, ∗p < 0.05, ∗∗p < 0.01, ∗∗∗∗p < 0.0001.
Next, we measured the ability of XL413 in blocking spontaneous metastasis to distal organs using a metastatic derivative of A375 cells, A375-MA2 cells. For this purpose, A375-MA2 cells were labeled with the firefly luciferase gene (A375-MA2-F-Luc) and injected subcutaneously into the dorsal flank of NOD scid gamma (NSG) mice. These mice were treated with either vehicle or XL413 and then subcutaneous tumor volume was measured and bioluminescence imaging was performed to measure metastasis in the presence and absence of XL413. Both tumor volumes and metastasis as measured by the bioluminescence level were reduced in XL413-treated mice compared with vehicle-treated mice (Figures 3B–3D). We also observed that XL413 treatment significantly inhibited the spontaneous metastasis of A375-MA2-F-Luc cells into the lungs (Figures 3E and 3F). Notably, in the control group, all five mice (100%) showed spontaneous metastasis to the lungs, compared with only one of five mice (20%) in the XL413-treated group (Figures 3E and 3F).
To further enhance the clinical relevance of CDC7 as a target for melanoma therapy, we tested the efficacy of XL413 in a melanoma-patient-derived xenograft (PDX)-based mouse model. PDX models of cancer closely resemble tumors in human patients and are used to determine the efficacy of investigational cancer therapeutic agents (Goto, 2020). We found that XL413 treatment significantly inhibited melanoma PDX growth in mice compared with vehicle-treated mice (Figure 3G). Collectively, these studies demonstrated that CDC7 inhibition by XL413 blocks melanoma tumor growth and metastasis in mice, including in a clinically relevant PDX-based model of melanoma.
CDC7 regulates pathways associated with DNA replication and cell cycle
We next investigated the mechanism behind CDC7 inhibition-driven melanoma growth suppression by determining whether major signaling pathways that drive melanoma growth were inhibited after XL413 treatment. We found that XL413 had a modest effect on levels of phosphorylated AKT (p-AKT) (phosphoinositide 3-kinase-AKT signaling) and p-p70S6 kinase (mammalian target of rapamycin signaling) levels (Figure S4F), indicating that CDC7 likely regulates melanoma tumor growth and metastasis by a mechanism independent of these pathways.
Because CDC7 regulates both DNA replication and replication stress (Rainey et al., 2020), we next tested whether CDC7 inhibition causes replication stress. Our results showed that XL413 treatment of melanoma cells led to reduced numbers of ongoing DNA replication forks and increased numbers of stalled forks (Figures S5A and S5B), which were indicative of enhanced DNA replication stress.
Finally, to more comprehensively determine the mechanism of CDC7 action in melanoma, we performed mRNA expression profiling of the melanoma cell line A375 after XL413 treatment using RNA sequencing. We identified significant downregulation of 180 genes and upregulation of 50 genes by ≥ 1.5-fold (Figures 4A, 4B, Tables S1 and S2). We analyzed these genes for biological pathway enrichment and found that the pathways that were significantly upregulated after XL413 treatment were associated with cell cycle and included G2/M checkpoint, mitotic spindle formation, G2/M transition, and DNA replication, among others (Evan and Vousden, 2001; Kastan and Bartek, 2004; Visconti et al., 2016) (Figures 4C, S6 and S7). These results indicated that CDC7 primarily regulates pathways associated with DNA replication and the cell cycle.
Figure 4.

Pharmacological inhibition of CDC7 alters the expression of multiple genes that cause cell-cycle arrest, senescence, and apoptosis in melanoma cells
(A) Volcano plot showing genes that were upregulated (n = 50) or downregulated (n = 180) ≥1.5 fold after 24-h treatment with XL413 (1 μM).
(B) Heatmaps showing the overall alterations of gene expression in A375 cells treated with XL413 (1 μM) for 24 h compared with vehicle-treated cells (C). Pathways that were significantly activated or suppressed in A375 cells treated with XL413 (1 μM) for 24 h.
(D) Flow cytometric analysis was performed with melanoma cells after treatment with DMSO or 1 μM or 2 μM XL413 for 24 h stained with propidium iodide. The percentages of cells in each phase of the cell cycle are shown.
(E) The indicated melanoma cell lines were treated with DMSO or 1 or 2 μM XL413 for 7 days before senescence was measured with fluorescence-based assays. Representative images are shown (scale bar, 200 μm).
(F) The indicated melanoma cell lines were treated with DMSO or 1 or 2 μM XL413 for 7 days before apoptosis was measured. Relative apoptosis rates in XL413-treated cells were plotted with respect to vehicle-treated cells.
Data represent the mean ± standard error of three biological replicates. ∗p < 0.05, ∗∗p < 0.01, ∗∗∗p < 0.001, ∗∗∗∗p < 0.0001. See also Figures S4F, S5–S8, Tables S1 and S2.
CDC7 inhibition induced cell-cycle arrest, senescence, and apoptosis in melanoma cells
Based on the gene-expression profiling and pathway analysis results, we performed a cell-cycle analysis of melanoma cells. Compared with DMSO-treated control cells, XL413-treated melanoma cells showed reduced percentages of cells in the G1/S phase, increased percentages of cells in the G2/M phase, and increased percentages of apoptotic cells (Figure 4D). Our RNA sequencing data showed altered expression of many cyclins and CDKs that regulate the cell cycle after XL413 treatment. Supporting the cell-cycle results, RNA sequencing analysis showed that XL413 treatment downregulated cyclins (cyclin D and cyclin E) and CDKs (CDK2, CDK4, and CDK6) that are involved in the G1 and S phase and upregulated cyclins (cyclin A and cyclin B) and CDKs (CDK1) involved in the G2 and G2/M phase in multiple melanoma cell lines (Figures S8A–S8D).
Previous studies have shown that cell-cycle inhibition and mitotic checkpoint defects can cause cellular senescence and apoptosis (Choi and Anders, 2014; Evan and Vousden, 2001; Laphanuwat et al., 2018; Siu et al., 2012). Therefore, we asked if XL413-induced disruption of the cell cycle translates into cellular senescence and apoptosis in melanoma cells. To this end, we performed a fluorescence-based, senescence-associated beta-galactosidase (SA β-gal) assay to measure senescence and Annexin V staining to monitor apoptosis. The SA β-gal assays confirmed that XL413 treatment of melanoma cells induced senescence (Figures 4E and S8E). There were also increased numbers of Annexin V-positive cells after XL413 treatment, demonstrating that CDC7 inhibition by XL413 induced apoptosis (Figure 4F). Collectively, these results showed that CDC7 inhibition causes cell-cycle arrest, senescence, and apoptosis induction to block melanoma growth.
EZH2 or BRPF1/2/3 inhibitors enhanced the melanoma-suppressive effects of the CDC7 inhibitor XL413
Epigenetic regulators play important roles in melanoma tumor growth and metastases (Cheng et al., 2019; Giunta et al., 2021; Lee et al., 2014). They are also implicated in determining the outcomes of cancer therapeutics and conferring drug resistance (Brown et al., 2014), so they represent effective cancer therapeutic targets (Feng and De Carvalho, 2022; Kelly et al., 2010). Consistent with this, many inhibitors targeting epigenetic regulators are in clinical use either as a single agent or in combination with other anti-cancer agents (Kim and Roberts, 2016; Yamagishi and Uchimaru, 2017).
On this basis, we asked if epigenetic inhibitors could be combined with the CDC7 inhibitor XL413 to enhance its therapeutic efficacy. We first looked at specific epigenetic regulators targeted by 32 different small molecule inhibitors that are available from the Structural Genome Consortium (SGC) (Figure S9A) and asked which were upregulated in melanoma cells, similar to CDC7. To determine this, we analyzed publicly available melanoma datasets. We identified 30 epigenetic regulators that can be targeted by SGC epigenetic regulator library that were overexpressed in melanoma (Figures 5A and S9B). However, only 11 of these epigenetic regulators were also significantly co-overexpressed with CDC7 in melanoma patient tissue samples (Figures 5A and S9C). Based on these analyses, we shortlisted 9 epigenetic inhibitors targeting 11 epigenetic regulators (Figure S9C) to further test their effect on melanoma growth in combination with the CDC7 inhibitor XL413.
Figure 5.

Pharmacological inhibition of CDC7 along with inhibitors targeting epigenetic regulators decrease melanoma cell growth
(A) Venn diagram showing the epigenetic regulators that were expressed with or without CDC7 in melanoma samples compared with primary skin using the Oncomine dataset.
(B) A schematic illustration of the druggable screening approach using 9 different epigenetic regulators with or without XL413 in A375 melanoma cell line.
(C) A375 and M14 melanoma cell lines were treated with GSK343 or OF1 in combination with or without XL413 for 2 weeks. Cell survival was then measured using clonogenic assays; representative images are shown.
(D) A375 and M14 cells were treated with GSK343 or OF1 in combination with or without XL413 and analyzed for their ability to grow in an anchorage-independent manner in soft agar assays; representative images are shown (scale bar, 500 μm).
(E) Bar diagram showing the relative colony sizes for each condition in panel (D). Data represent the mean ± standard error of three biological replicates. ns = not significant, ∗p < 0.05, ∗∗p < 0.01, ∗∗∗p < 0.001. See also Figures S9 and S10.
We performed MTT assays to assess the effects of these 9 small molecule inhibitors alone or with XL413 on melanoma cell viability (Figure 5B). We found that out of the 9 inhibitors tested, only the EZH2 inhibitor GSK343 and the BRPF1/2/3 inhibitor OF1 enhanced the inhibitory effect of XL413 on melanoma growth (Figure S10) in concentration-dependent manners in short-term survival assays. We then set out to verify the effects of GSK343 and OF1 on enhancing XL413-induced melanoma growth inhibition using long-term clonogenic and soft-agar assays. The results further confirmed that both GSK343 and OF1 enhanced the therapeutic benefits of XL413 in clonogenic assays (Figure 5C) and soft agar assays (Figures 5D and 5E).
Next, we determined the efficacy of GSK343 or OF1 in combination with XL413 in a xenograft mouse model using human melanoma cells (Figure 6A). We first tested the various concentrations of XL413, OF1, and GSK343 in a pilot experiment. The melanoma cell line A375 was subcutaneously injected into the flanks of NSG mice, and tumor growth was monitored in mice treated with vehicle, XL413 (15 mg/kg or 30 mg/kg), OF1 (10 mg/kg or 20 mg/kg), or GSK343 (10 mg/kg and 20 mg/kg). We found that the XL413 concentration of 30 mg/kg (∼43% tumor growth inhibition), the OF1 concentration of 20 mg/kg (∼50% tumor growth inhibition), and the GSK343 concentration of 20 mg/kg (∼45% tumor growth inhibition) caused modest but significant melanoma tumor growth inhibition (Figure 6B). Based on these results, we then tested the effect of XL413 (30 mg/kg) in combination with GSK343 (20 mg/kg) or OF1 (20 mg/kg). We observed that the combined treatments of XL413 + GSK343 and XL413 + OF1 caused ∼64% and ∼74% tumor growth inhibition, respectively, as compared with when these inhibitors were used alone (Figure 6C). These results demonstrate that the EZH2 inhibitor GSK343 or BRPF1/2/3 inhibitor OF1 enhanced the melanoma tumor-suppressive effects of the CDC7 inhibitor XL413.
Figure 6.

Combined treatment with XL413 and GSK343 or OF1 synergistically inhibited tumor growth in an in vivo xenograft mouse model of melanoma growth
(A) A schematic illustration of in vivo experiments with all three inhibitors.
(B) A375 cells were subcutaneously injected into the flanks of NSG mice (n = 6), which were then treated with either vehicle or the indicated inhibitors (two different doses) via intraperitoneal injection three times a week. The average tumor volumes for each week were plotted.
(C) A375 cells were subcutaneously injected into the flanks of NSG mice (n = 6). The mice were treated with either vehicle or XL413 in combination with GSK343 or OF1 via intraperitoneal injection three times a week. The average tumor volumes for each week were plotted.
Data represent the mean ± standard error of three biological replicates. ns = not significant, ∗p < 0.05, ∗∗p < 0.01.
Transcriptome-wide mRNA expression profiling revealed the mechanism behind enhanced melanoma growth suppression with combination treatment
To understand the more potent melanoma inhibitory effects of XL413 + GSK343 and XL413 + OF1 combination treatments, we performed mRNA expression profiling of A375 melanoma cells treated with DMSO (control), XL413, GSK343, OF1, XL413 + GSK343, or XL413 + OF1. We found that seven genes were downregulated ≥1.5-fold and sixty-three were upregulated ≥1.5-fold following XL413 + GSK343 combination treatment as compared with single treatment (Figures 7A, 7C, and Table S3). The sixty-three genes that were upregulated ≥1.5-fold after combination treatment included MMP3, HIST1H2AC, HIST1H2BD, CCL2, PADI3, PCSK, CERS4, and ANXA8, among others. Expression levels of many of these genes were significantly lower in melanoma patient samples as compared with normal skin (Figure S11A). Based on previous studies, many upregulated genes exert tumor-suppressive effects by decreasing cell proliferation and tumorigenicity and also regulating immune responses (Chai et al., 2019; Fekry et al., 2016; Hao et al., 2020; Kim et al., 2010; Li et al., 2017; Shu et al., 2021; Si-Tayeb et al., 2006; Singh et al., 2013; Vecchi et al., 2018). Thus, they were associated with better prognosis and longer patient survival (Figure S11B). We also performed biological pathway enrichment for the altered genes and found that oncogenic pathways such as MYC targets and Hippo pathway were downregulated in melanoma cells that were treated with both XL413 and GSK343 (Figure 7E).
Figure 7.

Combined treatment with XL413 and GSK343 or OF1 synergistically upregulates the expression of several genes that promote tumor growth inhibition
(A) A375 cells were treated for 24 h with DMSO, XL413 (1 μM), GSK343 (1 μM), or XL413 + GSK343 (both 1 μM), and mRNA expression changes were assessed with RNA sequencing. Heatmaps showing the top differentially expressed mRNAs for the indicated conditions.
(B) A375 cells were treated for 24 h with DMSO, XL413 (1 μM), OF1 (1 μM), or XL413 + OF1 (both 1 μM), and mRNA expression changes were assessed with RNA sequencing. Heatmaps showing the top differentially expressed mRNAs for the indicated conditions.
(C) Volcano plot showing genes that were upregulated (n = 50) or downregulated (n = 180) ≥1.5-fold after 24-h treatment with DMSO, XL413 (1 μM), GSK343 (1 μM), or XL413 + +GSK343 (both 1 μM).
(D) Volcano plot showing genes that were upregulated (n = 50) or downregulated (n = 180) ≥1.5-fold after 24-h treatment of cells with DMSO, XL413 (1 μM), OF1 (1 μM), or XL413 + OF1 (both 1 μM).
(E) Pathways that were significantly activated or suppressed in A375 cells treated with XL413 + GSK343 (both 1 μM) for 24 h.
(F) Pathways that were significantly activated or suppressed in A375 cells treated with XL413 + OF1 (both 1 μM) for 24 h. See also Figure S11, Tables S3 and S4.
Similarly, the combination of XL413 and OF1 resulted in ≥1.5-fold downregulation of five genes and ≥1.5-fold upregulation of twenty-two genes (Figures 7B, 7D, and Table S4). Expression levels of genes that were upregulated after combination treatment were lower in melanoma patient samples compared with normal skin (Figure S11C) along with previous studies confirming their roles in mediating tumor-suppressive effects and promoting apoptosis (Figure S11D) (Chow et al., 2006; Li et al., 2017; Mahajan et al., 2016; Singh et al., 2013; Vejda et al., 2003). When these altered genes were analyzed for the biological pathway enrichment, we found that the combination of XL413 + OF1 inhibited oncogenic pathways such as MYC targets, the HIF1-TF pathway, and IGF1R pathways (Figure 7F). Genes in several of these pathways can likely mediate the more potent growth inhibitory effect of XL413 + OF1 compared with either inhibitor alone.
We previously observed that XL413 treatment caused cell-cycle arrest and induced apoptosis in melanoma cells. Following that, we examined cell-cycle proportions and apoptosis in melanoma cells treated with XL413, GSK343, OF1, XL413 + GSK343, or XL413 + OF1. Both combination treatments led to more melanoma cells in the G2/M phase and significantly increased apoptosis compared with when these inhibitors were used alone (Figures 8A and 8B). These results demonstrate that GSK343 and OF1 enhance the melanoma tumor-suppressive effect of XL413 by inhibiting pro-oncogenic pathways and inducing apoptosis that cause potent tumor-suppressive effect of XL413 + GSK343 and XL413 + OF1 combination therapy in melanoma.
Figure 8.

Combined treatment with XL413 and GSK343 or OF1 enhanced cell-cycle arrest and apoptosis in melanoma cells
(A) Flow cytometric analysis of melanoma cells after 24-h treatment with DMSO, XL413 (1 μM), GSK343 (1 μM), OF1 (1 μM), XL413 + GSK343 (both 1 μM), or XL413 + OF1 (both 1 μM). The percentages of cells in each phase of the cell cycle are shown.
(B) Percentages of apoptotic cells as measured by FACS-based Annexin-V positive staining of melanoma cells after 24-h treatment with DMSO, XL413 (1 μM), GSK343 (1 μM), OF1 (1 μM), XL413 + GSK343 (both 1 μM), or XL413 + OF1 (both 1 μM).
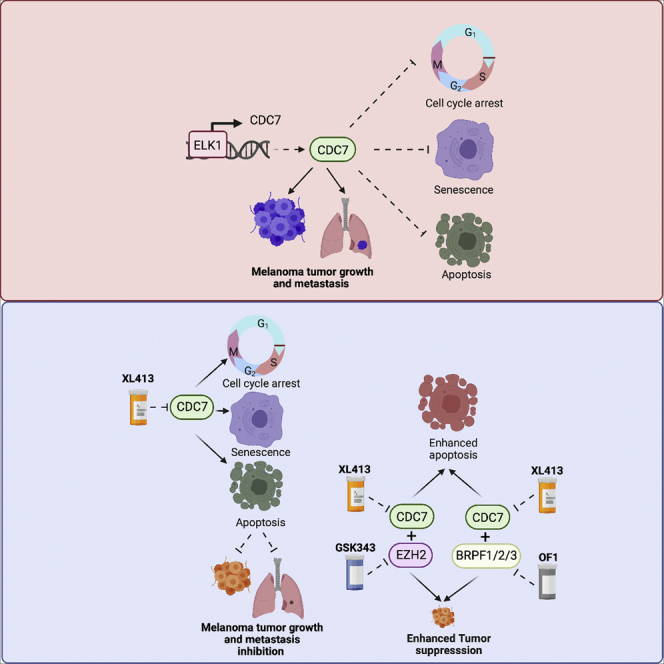
(C) A model depicting how CDC7 functions to regulate melanoma tumor growth and metastasis and also how pharmacological targeting of CDC7 alone or in combination with an epigenetic inhibitor potently inhibits melanoma tumor growth and proliferation.
Data represent the mean ± standard error of three biological replicates. ∗p < 0.05, ∗∗p < 0.01, ∗∗∗p < 0.001, ∗∗∗∗p < 0.0001, ns = not significant.
Discussion
Although BRAF/MEK pathway-targeting therapies and cancer immunotherapies—especially immune checkpoint blockade therapies—provide strong clinical benefits in a subset of melanoma patients (Hu-Lieskovan et al., 2014; Prieto et al., 2016; Tanda et al., 2020), many do not benefit from currently available treatments, highlighting the need for new therapeutic agents (Merlino et al., 2016; Moreira et al., 2021). Here, we demonstrated that inhibiting CDC7 with XL413 blocked melanoma tumor growth and metastasis. Furthermore, the EZH2 inhibitor GSK343 and BRPF1/2/3 inhibitor OF1 significantly potentiated the melanoma-suppressive effect of XL413. Collectively, our findings suggest that administered XL413 in combination with GSK343 or OF1 could be a superior therapeutic approach for melanoma. The results are summarized in Figure 8C and discussed below.
CDC7 is a highly conserved cell-cycle regulator with an important role in DNA replication (Ito et al., 2019). During the transition from late G1 phase to S phase, the regulatory protein DBF4 binds and activates CDC7, which then phosphorylates MCM2 proteins on chromatin to initiate DNA synthesis (Bruck and Kaplan, 2009; Sheu and Stillman, 2006). CDC7 is also involved in the maintenance of DNA replication forks and DNA damage-response pathways (Ito et al., 2008; Sawa and Masai, 2009). CDC7 was shown to be overexpressed in several cancer types and is associated with poor prognoses of patients with diffuse large B cell lymphoma, liver cancer, pancreatic cancer, ovarian cancer, and triple-negative breast cancer (Bonte et al., 2008; Huggett et al., 2016; Kulkarni et al., 2009). We showed that CDC7 was overexpressed in melanoma samples from patients, and high expression was predictive of poor prognosis. We further showed that the transcription factor ELK1 is upregulated and necessary for enhanced CDC7 expression in melanoma.
CDC7 is important for tumor growth and progression in some cancers (Li et al., 2018; Melling et al., 2015; Rodriguez-Acebes et al., 2010). In particular, CDC7 is necessary for the growth of p53-mutant liver cancer cells, and its inhibition induces their senescence (Wang et al., 2019). Similarly, a screen of kinase inhibitors identified a dual CDC7/CDC9 inhibitor that sensitizes triple-negative breast cancer to epidermal growth-factor-receptor-targeted therapies (McLaughlin et al., 2019). Pharmacological inhibition of CDC7 induced apoptosis in multiple cancer cell types and inhibited tumor growth in preclinical cancer models (Montagnoli et al., 2010). Our study shows that CDC7 inhibition blocked melanoma tumor growth and metastatic progression, indicating that CDC7 might be a useful melanoma therapy target. One of the limitations of our study was that the survival of drug-treated mice compared with vehicle treated mice was not assessed because death of mice was not used as an experimental endpoint. Further, mRNA expression profiling of CDC7-inhibitor-treated melanoma cells and additional experiments showed that CDC7 inhibition blocked melanoma growth by causing cell-cycle arrest, senescence, and apoptosis. Consistent with our findings, previous studies have shown that pharmacological inhibition of CDC7 inhibited multiple pro-oncogenic pathways to cause cellular senescence and apoptosis (Wang et al., 2019).
Several CDC7 inhibitors were developed for cancer treatment and showed effectiveness in preclinical models. Based on these results, several clinical trials for testing CDC7 inhibitors in different cancer types have been initiated. Examples include an ongoing CR-UK phase I trial of CDC7 inhibitor LY3143921 (NCT03096054) for treating various solid tumors and a clinical study of the CDC7 inhibitor TQB3824 in patients with advanced cancers (NCT05028218). Other CDC7 inhibitors have been used for the treatment of other cancer types (Montagnoli et al., 2010; Sawa and Masai, 2009; Swords et al., 2010). Our findings suggest that CDC7 inhibitors such as XL413 and others should also be tested for treating patients with metastatic melanoma.
Because of highly heterogeneous and complex nature of solid tumors, combination therapies are more effective in clinical use. It has been shown that several epigenetic regulators control multiple biological processes that affect cancer growth and progression, and therefore, targeting epigenetic regulators recently emerged as new approach for treating a variety of cancers (Feng and De Carvalho, 2022; Kelly et al., 2010). Our chemical genetics screen demonstrates that the EZH2 inhibitor GSK343 and BRPF1/2/3 inhibitor OF1 enhanced the melanoma growth-suppressive effect of XL413. In fact, EZH2 deregulation has been observed in several cancer type and is shown to be important for cancer growth, metastasis (Adhikary et al., 2015; Li et al., 2020; Varambally et al., 2002; Zingg et al., 2015), and determining therapeutic response (Bao et al., 2020; Zingg et al., 2017). Based on its important role, EZH2 targeting has also been tested for treating a variety of cancers in clinic (Italiano et al., 2018; Zauderer et al., 2022). Consistent with the effectiveness of EZH2 inhibitor, the US Food and Drug Administration (FDA) has approved tazemetostat, an EZH2 inhibitor for patients with follicular lymphoma who have had at least two previous treatments and harbor the EZH2 mutations or for patients with follicular lymphoma who have no other therapeutic options. In addition, EZH2 inhibitors have also entered clinical trials for the treatment of several cancer types such as rhabdoid tumors (NCT02601937), lymphomas (NCT01897571, NCT03010982, NCT03028103, NCT02395601), advanced solid tumors (NCT01897571, NCT03525795) and mesothelioma (NCT02860286). Similarly, BRPF1 has been shown to be important for cancer development (Yan et al., 2020) and also shown to be a potential cancer target in liver cancer (PMID: 34285329 (Cheng et al., 2021). Mechanistically, we found that combining either compound with XL413 enhanced the expression of several tumor-suppressive genes and pathways while attenuating the expression of genes that promote cancer growth, which led to increased apoptosis and tumor growth suppression in melanoma. Overall, our studies underscore the importance of CDC7 as a melanoma tumor-growth- and metastasis-promoting gene that can be used to treat melanoma either alone or in combination with other anti-cancer agents such as EZH2 and BRPF1/2/3 inhibitors.
Limitations of the study
In this study, we tested the effect of CDC7 inhibition alone or in combination with other anti-cancer agents on melanoma tumor growth and metastatic progression. We used cell-culture-based in vitro model and mouse xenograft model using human melanoma cells and melanoma-patient-derived xenograft (PDX)-based in vivo mouse model. One of the limitations of our in vivo study was that the survival of drug-treated mice compared with vehicle-treated mice was not assessed because death of mice was not used as an experimental endpoint. It is possible that drug treatment will also affect survival of the mice, and therefore, future study that can compare survival of the mice in different treatment condition can be tested. Another interesting observation that we made was that CDC7 inhibition in combination with drugs targeting epigenetic regulators altered the expression of genes that exert tumor-suppressive effects by decreasing cell proliferation and tumorigenicity and also regulating immune responses. This raises an exciting possibility that CDC7 in part may exert its effect by noncanonical cell-cycle-independent mechanisms. Future studies may be able to address this more comprehensively.
STAR★Methods
Key resources table
| REAGENT or RESOURCE | SOURCE | IDENTIFIER |
|---|---|---|
| Antibodies | ||
| CDC7 | Cell Signaling Technology | Cat# 3603; RRID:AB_2276095 |
| Phospho-MCM2 (Ser40) | Abcam | Cat# ab133243; RRID:AB_1115496 |
| Total MCM2 | Cell Signaling Technology | Cat# 4007; RRID:AB_2142134 |
| ACTINB | Cell Signaling Technology | Cat#4970; RRID:AB_2223172 |
| pAKT (Ser473) | Cell Signaling Technology | Cat#4060; RRID:AB_2315049 |
| Total AKT | Cell Signaling Technology | Cat#9272; RRID:AB_329827 |
| Phospho-p70 S6 Kinase (Thr389) | Cell Signaling Technology | Cat# 9205; RRID:AB_330944 |
| p70 S6 Kinase | Cell Signaling Technology | Cat# 9202; RRID:AB_331676 |
| ELK1 | Cell Signaling Technology | Cat# 9182; RRID:AB_2277936 |
| Biological samples | ||
| CDC7 mRNA expression in normal and cancer samples were analyzed and represented as box plot | Oncomine Research Premium Edition | https://www.oncomine.org/resource/login.html |
| CDC7 mRNA expression in normal and SKCM samples | Gene Expression Profiling Interactive Analysis (GEPIA) |
http://gepia.cancer-pku.cn |
| Chemicals, peptides, and recombinant proteins | ||
| XL413 | MedChemExpress | Cat# HY-15260A |
| OF1 | MedChemExpress | Cat# HY-12518 |
| GSK343 | MedChemExpress | Cat# HY-13500 |
| IdU | Sigma-Aldrich | Cat# I7125 |
| CldU | Sigma-Aldrich | Cat# C6891 |
| Structural Genome Consortium’s epigenetic chemical probe inhibitor library | Cayman chemicals | Cat# 17525 |
| DMEM | GIBCO | Cat# 11965-092 |
| RPMI | GIBCO | Cat# 11875-093 |
| Fetal Bovine Serum | GIBCO | Cat# 10437-028 |
| Trypsin-EDTA | GIBCO | Cat# 25200-056 |
| Penicillin-Streptomycin | GIBCO | Cat# 15140-122 |
| Effectene Transfection Reagent | QIAGEN | Cat# 301427 |
| Agarose, Low gelling | Sigma-Aldrich | Cat# A9045 |
| Matrigel Invasion Chambers | BD Biosciences | Cat# 354483 |
| VECTASHIELD Hardset Antifade Mounting Medium with DAPI | Vector Laboratories | Cat# H-1500 |
| XenoLight D-Luciferin - K+ Salt Bioluminescent Substrate | Perkin Elmer | Cat# 122799 |
| Critical commercial assays | ||
| CUT&RUN Assay Kit | Cell Signaling Technology | Cat# 86652 |
| Cell Event Senescence Green Detection Kit | Thermo Fisher Scientific | Cat# C10850 |
| Real Time-Glo Annexin V apoptosis reagent | Promega | Cat# JA1011 |
| Annexin V assay kit | BD Pharmingen | Cat#556547 |
| BioCoat Growth Factor Reduced Matrigel Invasion Chambers | Corning | Cat #354483 |
| Deposited data | ||
| RNA-Seq performed with XL413-treated A375-MA2-F-Luc cells | This paper | GEO: GSE158621 |
| RNA-Seq performed with XL413 and GSK343 treated A375-MA2-F-Luc cells | This paper | GEO: GSE186276 |
| RNA-Seq performed with XL413 and OF1 treated A375-MA2-F-Luc cells | This paper | GEO: GSE185976 |
| Experimental models: Cell lines | ||
| HEK293T | ATCC | ATCC CRL-3216 |
| A375-MA2 | ATCC | ATCC CRL-3223 |
| A375 | ATCC | ATCC CRL-1619 |
| M14 | NCI-60 | |
| SKMEL-239 | MSKCC | |
| Melanoma PDX | Jackson Laboratory | TM01386 |
| Experimental models: Organisms/strains | ||
| Mouse: NU/J homozygous | Jackson Laboratory | Stock No. 002019 |
| Mouse: NSG | Jackson Laboratory | Stock No. 005557 |
| Oligonucleotides | ||
| ACTINB | GCATGGAGTCCTGTGGCATC | TTCTGCATCCTGTCGGCAAT |
| CDC7 | GGTTTGGCCCAAGGAACCCA | AGAGCGCTGGACAGAAAGGC |
| ELK1 | AATGTGGAGCCGGGTTTGGG | GCTCGGCCTTGGTGGTTTCT |
| CCND1 | AGATCGTCGCCACCTGGATG | CATTTGCAGCAGCTCCTCGG |
| CCND3 | ACCGACAGGCCTTGGTCAAA | CTGAGAGGCTTCCCTGAGGC |
| CDK4 | GCCAGCCGAAACGATCAAGG | CTTCGGGAGCTCGGTACCAG |
| CDK6 | GTTTGGTTCTGGCGGCTCAG | TGGCCCCAAGCTTTCTTCCA |
| CCNE1 | TGCTACTGCCGCAGTATCCC | GCATCTTCATCAGCGACGCC |
| CCNE2 | CTGACTGCTGCTGCCTTGTG | TGCCTCCATTGCACACTGGT |
| CDK2 | TACTGCGTTCCATCCCGACC | GTTCTCCATGAAGCGCCAGC |
| CCNA2 | CTAGCATTGCAGCAGACGGC | TTCCCGGACTTCAGTACCGC |
| CDK1 | AGCCGCCCTTTCCTCTTTCT | TAAAGGGCCCCGGATTCACC |
| CCNB1 | GATCAACATGGCAGGCGCAA | TCTGGCACTGGCTCAGACAC |
| CCNB2 | AGGGTCCTTCTCCCACACCT | GCAAAACCTCCAGCTGCCTG |
| CCNB3 | TGTCTCACCACAGGCCAAGG | TCCACCAGCTTCACTGCCAA |
| CDC7 (CUT & RUN Primer) | CGGGAAGAAACCCCACCCTC | ACATGCGCACACTAAAGCCC |
| ACTINB (CUT & RUN Primer) | TCTTGGCTGGGCGTGACTGT | AAGGTGGGCTCTACAGGGCA |
| Recombinant DNA | ||
| piggyBac GFP-Luc | Ding et al., 2005 | N/A |
| Act-P-Base | Ding et al., 2005 | N/A |
| ELK1 shRNA#1 | RHS3979-9576412 | TRCN0000007450 |
| ELK1 shRNA#2 | RHS3979-9576415 | TRCN0000007453 |
| CDC7 shRNA#1 | RHS3979-9571798 | TRCN0000003169 |
| CDC7 shRNA#2 | RHS3979-9571799 | TRCN0000003170 |
| Software and algorithms | ||
| Prism 8.0 | GraphPad | www.graphpad.com/scientificsoftware/prism |
| ImageJ | https://imagej.nih.gov/ij | N/A |
| Reactome pathway analysis from RNA sequencing data | Reactome Pathway Database | https://reactome.org/ |
Resource availability
Lead contact
Further information about the protocols and requests for resources and reagents should be directed to and will be fulfilled by the lead contact, Romi Gupta (romigup@uab.edu).
Materials availability
All the materials and reagents described in this paper are available upon request from the lead contact.
Experimental model and subject details
Cell culture
The melanoma cell lines A375, A375-MA2, SKMEL-239, M14 and HEK293T were obtained from the sources listed in Key resources table and maintained in a humidified atmosphere of 5% CO2 at 37°C in Dulbecco’s modified Eagle medium (Life Technologies, Carlsbad, CA, USA) or Roswell Park Memorial Institute-1640 Medium (Life Technologies), each supplemented with 10% fetal bovine serum and 1% penicillin/streptomycin (both from Life Technologies).
Mouse subcutaneous tumorigenesis experiments
A375 (5×10⁶) cells were injected subcutaneously into 5–6-week-old male athymic nude (NU/J) mice (stock no. 002019, Jackson Laboratory). Tumor volume was measured every week and plotted, and tumor size was calculated using the following formula: length×width2×0.5. When the tumor volumes reached 80–100 mm3, the mice were intraperitoneally injected with either vehicle (0.5% methyl cellulose in water), XL413 (15, 30, or 50 mg/kg body weight), GSK343 (10 or 20 mg/kg body weight), OF1 (10 or 20 mg/kg body weight), the combination of XL413 and GSK343 (30 mg/kg and 20 mg/kg body weight, respectively), or the combination of XL413 and OF1 (30 mg/kg and 20 mg/kg body weight, respectively) every other day until the end of the experimental period. Subcutaneous tumors from individual groups were harvested and imaged. All protocols for mouse experiments were approved by the Institutional Animal Care and Use Committee of the University of Alabama at Birmingham (UAB) (approval number IACUC-21684). Non-parametric Student’s t-tests were used to calculate p values.
Spontaneous metastasis experiment
A375-MA2 cells stably expressing firefly luciferase under the control of a cytomegalovirus promoter were generated by co-transfection of the transposon vector piggyBac GFP-Luc and the helper plasmid Act-PBase as described previously (Ding et al., 2005). Cells with stable transposon integration were selected using blasticidin S (Thermo Fisher Scientific, Waltham, MA, USA). A375-MA2-F-Luc cells (5 × 10⁶) were then injected subcutaneously into male 5–6-week-old NSG mice (stock no. 005557, Jackson Laboratory). Tumor volume was measured every week. Tumor size was calculated using the following formula: length×width2×0.5. When the tumor volumes reached 80–100 mm3, vehicle (0.5% methyl cellulose in water) or XL413 (50 mg/kg body weight) was administered intraperitoneally every other day until the end of the experimental period. To monitor spontaneous metastasis, imaging was performed every week using the Spectrum In Vivo Imaging System (PerkinElmer, Waltham, MA, USA). Total luminescence counts of the tumor-bearing areas were measured using the Living Image in vivo imaging software (PerkinElmer). At the end of the experiment (4 weeks after treatment initiation), the mice were sacrificed, images of the tumors were captured, and the lungs were imaged using the IVIS Spectrum (PerkinElmer). All protocols were approved by the UAB Institutional Animal Care and Use Committee.
Mouse tumorigenesis experiment in the PDX model
Melanoma PDXs (Stock No. TM01386, Jackson Laboratory) were obtained in donor NSG PDX-engrafted mice. After 6–8 weeks, the PDXs were harvested, and implanted into 5–6-week-old female NSG mice (stock no. 005557, Jackson Laboratory). In brief, F1-generation tumor tissues were minced to a size of 2 × 2 mm and subcutaneously implanted through a tiny incision in the right flank of anesthetized NSG mice. Tumor volume was measured every week. When the tumor volumes reached 80–100 mm3, the mice were randomized (n = 6 per group) and injected with vehicle (0.5% methyl cellulose in water) or XL413 (50 mg/kg body weight) intraperitoneally every other day until the end of the experimental period. All protocols were approved by the UAB Institutional Animal Care and Use Committee.
Method details
shRNA, lentivirus preparation, and stable cell line generation
Gene-specific shRNAs were obtained from the Open Biosystems. The catalogue numbers for the shRNAs are provided in the Key resources table. For lentivirus production, plasmids were transfected into HEK-293T cells along with the PDM2.G and pSPAX2 packaging plasmids. After 48 h, the lentivirus/retrovirus-containing supernatants were harvested, filtered, and used for infections. Lentiviral shRNA-infected A375 and M14 cells were selected using 0.5 μg/mL puromycin.
RNA preparation, cDNA preparation, and quantitative polymerase chain reaction (qPCR)
Total RNA was extracted with TRIzol Reagent (Invitrogen, Carlsbad, CA, USA) and purified using the RNeasy Mini Kit (Qiagen, Hilden, Germany). Then, cDNA was generated using the M-MuLV First Strand cDNA Synthesis Kit (New England Biolabs, Ipswich, MA, USA) according to the manufacturer’s instructions. Next, qPCR was performed with gene-specific primers using Power SYBR-Green Master Mix (Applied Biosystems, Foster City, CA, USA) according to the manufacturer’s instructions. Beta actin (ACTB) levels were used as a normalization control. The primer sequences are provided in Key resources table.
CUT&RUN assay
CUT&RUN assays were performed with A375 cells using the CUT&RUN Assay Kit (Cat#86652; Cell Signaling Technology Danvers, MA, USA) according to the manufacturer’s instructions. Briefly, 2×10⁵ cells were harvested, washed, bound to activated Concanavalin A-coated magnetic beads, and permeabilized. The bead–cell complexes were incubated overnight with the appropriate antibody at 4°C. Then, the complexes were washed three times, and the cells were resuspended in 100 μL protein A and G/micrococcal nuclease (pAG/MNase) and incubated for 1 h at room temperature. The samples were then washed three times with digitonin buffer with protease inhibitors, resuspended in 150 μL digitonin buffer, and incubated for 5 min on ice. MNase was activated by adding calcium chloride, and the samples were incubated at 4°C for 30 min. The reaction was stopped by adding 150 μL stop buffer, and the samples were incubated at 37°C for 10 min to release the DNA fragments. The DNA was extracted using the DNA purification columns included in the CUT&RUN Assay Kit. Quantitative PCR was then performed using CDC7 promoter-specific primers, and relative fold-change was calculated as the ratio of immunoprecipitated DNA to IgG-precipitated DNA. The primer sequences and antibodies used for the CUT&RUN assays are listed in Key resources table.
Immunoblot analysis
Whole-cell protein extracts were prepared using IP Lysis Buffer (Pierce Chemical, Rockford, IL, USA) containing Protease Inhibitor Cocktail (Roche, Basel, Switzerland) and Phosphatase Inhibitor Cocktail (Sigma-Aldrich, St. Louis, MO, USA). Lysed samples were centrifuged at 12,000 rpm for 40 min, and clarified supernatants were stored at −80°C. Protein concentrations were determined using Bradford Protein Assay Reagent (Bio-Rad Laboratories, Hercules, CA, USA). Equal amounts of protein samples were electrophoresed on 10% or 12% sodium dodecyl sulfate (SDS)-polyacrylamide gels and transferred onto polyvinylidene difluoride membranes (Millipore, Burlington, MA, USA) using a wet-transfer apparatus (Bio-Rad). Membranes were blocked in 5% skim milk prepared in Tris-buffered saline containing 0.1% Tween-20 and probed with primary antibodies. After washing, the membranes were incubated with the appropriate horseradish peroxidase-conjugated secondary antibodies (1:2,000) (GE Healthcare Life Sciences, Chicago, IL, USA). The blots were developed using SuperSignal West Pico or Femto Chemiluminescent Substrate (Thermo Fisher Scientific, Waltham, MA, USA). All antibodies used for immunoblotting are listed in Key resources table.
Chemical inhibitors
Epigenetic inhibitors used for chemical genetic screen was purchased from Cayman Chemicals. Relevant information is provided in Figure S9A. XL413, OF1, and GSK343 for in vivo experiments were purchased from MedChemExpress (Monmouth Junction, NJ, USA) and dissolved for cell culture and in vivo experiments as suggested in the data sheet. Relevant information is provided in Key resources table. The treatment conditions are described in the corresponding figure legends.
Soft agar assay
Soft agar assays were performed by seeding 5×10³–1×10⁴ melanoma cells (A375, M14, and SKMEL-239) onto 0.4% low melting-point agarose (Sigma-Aldrich) layered on top of 0.8% agarose. The melanoma cells treated with dimethyl sulfoxide (DMSO, control), 1 μM XL413, 1 μM GSK343, 1 μM OF1, or combinations of 1 μM XL413 + 1 μM GSK343 and 1 μM XL413 + 1 μM OF1. After 3–4 weeks of incubation, colonies were stained with 0.005% crystal violet and imaged under a microscope. Colony sizes were measured using ImageJ software (https://imagej.nih.gov/ij/; National Institutes of Health, Bethesda, MD, USA) and plotted as percent relative colony size compared with control colonies. Statistical analysis was performed by Student’s t-tests in GraphPad Prism 8.0 (GraphPad, San Diego, CA USA).
Clonogenic assay
Clonogenic assays were performed by seeding 1×10³ cells in six-well plates in triplicate. After 24 h, the cells were treated with DMSO, XL413 (1 μM), GSK343 (1 μM), OF1 (1 μM), or combinations of XL413 (1 μM) + GSK343 (1 μM) or XL413 (1 μM) + OF1 (1 μM). After 2 weeks of treatment, colonies were fixed in a solution containing 50% methanol and 10% acetic acid and then stained with 0.05% Coomassie blue (Sigma-Aldrich). After staining, the plates were scanned and the representative images were presented.
MTT assay
For MTT assays, 3×10³ melanoma cells (A375, M14, and SKMEL-239) were plated in triplicate in a volume of 100 μL on 96-well plates. After 24 h, the cells were treated with different concentrations of inhibitors as shown in the respective figures. Cell viability was evaluated 3 days after treatment. To measure cell viability, 20 μL 5 mg/mL MTT solution dissolved in 1× phosphate-buffered saline (PBS) was added to each well of the 96-well plate and incubated for 2 h at 37°C. The MTT solution was then removed, and 100 μL DMSO was added to each well. After the contents were mixed by pipetting, absorbance was measured at 590 and 630 nm using the Biotek Synergy MX Multi Format Microplate Reader (Biotek, Winooski, VT, USA). The average absorbance at 630 nm was subtracted from the average absorbance at 590 nm, and the relative growth rates were plotted with respect to vehicle-treated cells.
Senescence-associated beta-galactosidase assay
A375, SKMEL-239, and M14 cells were cultured in a humidified atmosphere of 5% CO2 at 37°C in DMEM (Life Technologies, Carlsbad, CA, USA) or RPMI-1640 medium (Life Technologies), each supplemented with 10% fetal bovine serum (Life Technologies) and 1% penicillin/streptomycin (Life Technologies). The percentage of senescent cells was measured using the Cell Event™ Senescence Green Detection Kit (Thermo Fisher Scientific, cat. no. C10850) according to the manufacturer’s instructions. The cells were seeded on 96-well plates at a density of 300 cells/well and allowed to adhere overnight. Then the cells were treated with vehicle or XL413 at concentrations of 1 μM and 2 μM for 7 days. The cells were then washed with PBS and fixed with 100 μL 2% paraformaldehyde solution per well for 10 min at room temperature. The cells were then washed with 100 μL 1% bovine serum albumin (BSA) in PBS, and 100 μL 1× working solution was added. The plate was incubated for 2 h at 37°C without CO2 in the dark. Then, the wells were washed three times with PBS to remove the working solution, 100 μL PBS/well was added, and 10× images (Scale: 200 μm) were captured using an Alexa FluorTM 488/fluorescein isothiocyanate (FITC) Filter Olympus Florescence microscope (IX73, Olympus, Tokyo, Japan).
Apoptosis measurement
A375, SKMEL-239, and M14 cells were seeded at a density of 3,000 cells/75 μL medium in white, tissue culture-treated, clear-bottom 96-well plates (Costar Cat. No. #3610) and incubated for 24 h at 37°C, 95% relative humidity, and 5% CO2. The cells were then treated with vehicle (DMSO) or 1 μM or 2 μM XL413, followed by immediate addition of Real Time-Glo Annexin V apoptosis reagent (Cat. No. # JA1011, Promega Corp., Madison, WI, USA). Luminescence signals were monitored up to 48 h using a Biotek Synergy MX Multi Format Microplate Reader.
Annexin V/propidium iodide (PI) fluorescence-activated cell sorting (FACS) assay
Annexin V binding to cells was measured with the use of an Annexin V staining kit (BD PharmingenTM #556547, BD Pharmingen, San Diego, CA, USA) according to the manufacturer’s protocol. In brief, A375 cells were treated with DMSO (control), XL413 (1 μM), GSK343 (1 μM), OF1 (1 μM), or combinations of XL413 (1 μM) + GSK343 (1 μM) and XL413 (1 μM) + OF1 (1 μM) for 24 h. After treatment, cells were collected, washed twice with 1× PBS and resuspended in 1× Binding buffer and stained with 5 μL FITC-Annexin V and 5 μL of PI and incubated for 15 min in the dark. After incubation, cells were analyzed with FACS using LSR Fortessa (BD Biosciences, Franklin Lakes, NJ, USA).
Cell cycle analysis
A375, M14 and SKMEL-239 cells were treated with either DMSO or XL413 (1 and 2 μM) for 24 h and cell cycle was performed. Further, A375 cells were treated with DMSO (control), XL413 (1 μM), GSK343 (1 μM), OF1 (1 μM), or combinations of XL413 (1 μM) + GSK343 (1 μM) and XL413 (1 μM) + OF1 (1 μM) for 24 h. Cells were collected, washed twice with ice-cold 1× PBS, and fixed in 70% ethanol overnight. The cells were then washed three times with 1× PBS and resuspended in 400 μL PI/Triton X-100 staining solution [0.1% (v/v) Triton X-100 in PBS with 2 mg DNAse-free RNAse and 0.40 mL 500 μg/mL PI]. The samples were then incubated for 15 min at 37°C. Flow cytometry analysis was performed using a BD LSRFortessa (BD Biosciences, San Jose, CA, USA) and FlowJo software (Ashland, OR, USA).
DNA fiber assay
DNA fiber assays were performed as described previously (Merrick et al., 2004). Briefly, cells were plated in the appropriate medium until they reached 30–40% confluency. After 48 h, iododeoxyuridine (IdU; Sigma-Aldrich: I7125) was added to the exponentially growing cells (final concentration: 25 μM), and the cells were incubated for 30 min at 37°C in 5% CO2. Then, the cells were washed with PBS and incubated with a second label, chlorodeoxyuridine (CldU; Sigma-Aldrich: C6891), at a final concentration of 250 μM for an additional 30 min at 37°C. The cells were then trypsinized and counted. Then, 3 μL cell suspension containing 2×10³ cells was applied to the end of a glass slide and air-dried for 5 min. The cells were lysed by adding 7 μL lysis solution (50 mM ethylenediaminetetraacetic acid and 0.5% SDS in 200 mM Tris-HCl, pH 7.6). The glass slides were placed at a 15° angle to allow the DNA fibers to spread across the length of the slide and then placed horizontally to air dry. The slides were fixed with methanol:acetic acid (3:1) for 10 min, washed with double-distilled water, and treated with 2.5 M HCl for 30 min. The fixed cells were blocked with 5% BSA for 30 min at room temperature and incubated with primary antibodies (anti-BrdU [mouse antibody, BD Biosciences #347580] for IdU at a 1:25 dilution and anti-BrdU [rat antibody, Abcam, Cambridge, UK #ab6326] for CldU at a 1:400 dilution, each in 5% BSA) for 1 h at room temperature in a humidified chamber. The slides were then washed three times with 1× PBS for 5 min and incubated with secondary antibodies (1:500 sheep anti-mouse Cy3, Sigma, Cat# C218-M for IdU; and 1:400 goat anti-rat Alexa Fluor 488, Invitrogen, cat A11006 for CldU) in 5% BSA for 1 h at room temperature in the dark. The glass slides were then washed and visualized at 60× magnification to locate the fibers. Pictures were captured with one color channel, and data were analyzed with ImageJ software.
Matrigel invasion assay
Invasion assays were performed in BioCoat Growth Factor Reduced Matrigel Invasion Chambers (Cat #354483, Corning, Corning, NY, USA) using melanoma cells expressing the indicated shRNAs and melanoma samples treated for 24 h with XL413. The cells were serum-starved for 6 h, and 5×10⁴ cells/insert were seeded in triplicate in the top chamber containing low-serum medium. The cells were then incubated for 20 h to allow invasion toward the serum-rich medium in the bottom well. The number of cells invading the Matrigel was quantified by DAPI staining and imaging; 8–12 fields per membrane were counted, and nuclei quantification was performed using ImageJ software.
mRNA expression analysis of patient-derived melanoma patient samples
Gene Expression Profiling Interactive Analysis (GEPIA; http://gepia.cancer-pku.cn) was used to analyze CDC7 expression in a total of 461 melanoma samples and 558 normal skin samples. Datasets of gene expression in melanoma and normal skin samples were identified by a search of the Oncomine cancer profiling database. The Haqq, Riker, Talantov, and Xu datasets were used for the analyses (Haqq et al., 2005; Riker et al., 2008; Talantov et al., 2005; Xu et al., 2008). The Haqq dataset includes paired samples of melanoma (n = 6) and normal skin (n = 3) from 37 patients. The Riker dataset includes cutaneous melanoma samples (n = 14) and normal skin samples (n = 4) from 87 patients analyzed on a Human Genome U133 Plus 2.0 Array. The Talantov dataset includes 70 samples, including 45 cutaneous melanoma samples and 7 normal skin samples analyzed on a Human Genome U133A Array. The Xu dataset includes 52 metastasis samples and 31 primary-site samples from 154 patients analyzed on a Human Genome U133A Array. The Riker dataset includes 40 metastasis samples and 16 primary-site samples from 87 patients analyzed on a Human Genome U133 Plus 2.0 Array. The Human Tissue Atlas Dataset was used to calculate the survival high and survival low rates for patients based on CDC7 expression. cBioportal was used to determine the co-occurrence or mutual exclusivity of the candidate genes in melanoma samples.
To analyze the correlation of the mRNA expression levels of CDC7 and epigenetic regulators, we downloaded the expression data for CDC7 and the epigenetic regulators from the Talantov melanoma datasets (Talantov et al., 2005). We calculated the Pearson correlation coefficients using GraphPad Prism, version 9.0 for Macintosh (GraphPad Software, San Diego, California, USA; www.graphpad.com).
Transcription factor analysis using PROMO
Transcription factor binding with 100% sequence identity on the promoter region of CDC7 was identified using the PROMO tool (http://alggen.lsi.upc.es/cgi-bin/promo_v3/promo/promoinit.cgi?dirDB=TF_8.3) (Messeguer et al., 2002). We selected a 2-kB upstream promoter region of the CDC7 gene to find human transcription factors that bound with 0% dissimilarity using PROMO.
RNA sequencing and data analysis
A375 cells were treated with DMSO (control), XL413 (1 μM), GSK343 (1 μM), OF1 (1 μM), or combinations of XL413 (1 μM) + GSK343 (1 μM) and XL413 (1 μM) + OF1 (1 μM) for 24 h. Total RNA was extracted using TRIzol® reagent (Invitrogen, Carlsbad, CA, USA) according to the manufacturer’s instructions and purified on RNAeasy mini columns (Qiagen, Hilden, Germany) according to the manufacturer’s instructions. Then, mRNA was purified from approximately 500 ng total RNA using oligo-dT beads and sheared by incubation at 94°C. Following first-strand synthesis with random primers, second-strand synthesis was performed with dUTP to generate strand-specific libraries. The cDNA libraries were then end-repaired and A-tailed. Adapters were ligated, and second-strand digestion was performed using uracil-DNA-glycosylase. Indexed libraries that met appropriate cutoffs for both were measured by quantitative reverse transcription polymerase chain reaction (qRT-PCR) using a commercially available kit (KAPA Biosystems, Wilmington, MA, USA). The insert-size distribution was determined using LabChip GX (PerkinElmer, Waltham, MA, USA) or an Agilent Bioanalyzer (Agilent Technologies, Santa Clara, CA, USA). Samples with a yield ≥0.5 ng/μL were used for sequencing on the Illumina HiSeq 2,500 system (Illumina, San Diego, CA, USA). Images were converted into nucleotide sequences by the base-calling pipeline RTA 1.18.64.0 and stored in FASTQ format. For data analysis, the reads were first mapped to the latest UCSC transcript set using Bowtie2 version 2.1.0, and the gene expression level was estimated using RSEM v1.2.15. The Trimmed Mean of the M-values method was used to normalize the raw count. Differentially expressed genes were identified using the edgeR program. Genes showing altered expression with p < 0.05 and more than 1.5-fold changes were considered differentially expressed. Clusterprofiler was used for the Gene Ontology and pathway enrichment analyses. RNA-sequencing data presented in this paper are submitted to Gene Expression Omnibus (Accession No. GSE158621, GSE186276, GSE185976) and available publicly without restrictions.
Quantification and statistical analysis
All experiments were conducted with at least three biological replicates. Results for individual experiments are expressed as mean ± standard error of the mean (SEM). For the analysis of tumor progression in mice, the statistical assessment was performed using the area under the curve method on GraphPad Prism, version 9.0 (GraphPad Software, San Diego, CA, USA; www.graphpad.com). The p values for the other experiments were calculated with two-tailed unpaired Student’s t-tests. To analyze the incidences of spontaneous metastasis to the lungs, contingency analysis was performed using chi-square tests in GraphPad Prism version 9.0.
Acknowledgments
We gratefully acknowledge the following grants from the National Institutes of Health: R03CA221926 (R.G.), R21CA229927 (R.G. and N.W.), R03CA230815 (R.G.), R03CA248913 (R.G.), and R01CA233481-01A1 (R.G.).
Author contributions
R.G. conceived the project and designed the experiments. S.C. performed the majority of the experiments with the help of S.B. and P.M. R.G. interpreted the data and wrote the manuscript. All authors read and commented on the paper and approved the final manuscript.
Declarations of interests
The authors declare no competing interests.
Published: August 19, 2022
Footnotes
Supplemental information can be found online at https://doi.org/10.1016/j.isci.2022.104752.
Supplemental information
Data and code availability
RNA-sequencing data presented in this paper are submitted to Gene Expression Omnibus (Accession No. GSE158621, GSE186276, GSE185976) and available publicly without restrictions. This paper does not report original code. Any additional information required to reanalyze the data reported in this paper is available from the lead contact upon request.
References
- Adhikary G., Grun D., Balasubramanian S., Kerr C., Huang J.M., Eckert R.L. Survival of skin cancer stem cells requires the Ezh2 polycomb group protein. Carcinogenesis. 2015;36:800–810. doi: 10.1093/carcin/bgv064. [DOI] [PMC free article] [PubMed] [Google Scholar]
- Aly A.A., Bräse S., Hassan A.A., Mohamed N.K., El-Haleem L.E.A., Nieger M., Morsy N.M., Alshammari M.B., Ibrahim M.A.A., Abdelhafez E.M.N. Design, synthesis, and molecular docking of paracyclophanyl-thiazole hybrids as novel CDK1 inhibitors and apoptosis inducing anti-melanoma agents. Molecules. 2020;25:E5569. doi: 10.3390/molecules25235569. [DOI] [PMC free article] [PubMed] [Google Scholar]
- Asghar U., Witkiewicz A.K., Turner N.C., Knudsen E.S. The history and future of targeting cyclin-dependent kinases in cancer therapy. Nat. Rev. Drug Discov. 2015;14:130–146. doi: 10.1038/nrd4504. [DOI] [PMC free article] [PubMed] [Google Scholar]
- Bao Y., Oguz G., Lee W.C., Lee P.L., Ghosh K., Li J., Wang P., Lobie P.E., Ehmsen S., Ditzel H.J., et al. EZH2-mediated PP2A inactivation confers resistance to HER2-targeted breast cancer therapy. Nat. Commun. 2020;11:5878. doi: 10.1038/s41467-020-19704-x. [DOI] [PMC free article] [PubMed] [Google Scholar]
- Bayés M., Rabasseda X., Prous J.R. Gateways to clinical trials. Methods Find. Exp. Clin. Pharmacol. 2004;26:211–244. [PubMed] [Google Scholar]
- Bonte D., Lindvall C., Liu H., Dykema K., Furge K., Weinreich M. Cdc7-Dbf4 kinase overexpression in multiple cancers and tumor cell lines is correlated with p53 inactivation. Neoplasia. 2008;10:920–931. doi: 10.1593/neo.08216. [DOI] [PMC free article] [PubMed] [Google Scholar]
- Borowicz S., Van Scoyk M., Avasarala S., Karuppusamy Rathinam M.K., Tauler J., Bikkavilli R.K., Winn R.A. The soft agar colony formation assay. J. Vis. Exp. 2014:e51998. doi: 10.3791/51998. [DOI] [PMC free article] [PubMed] [Google Scholar]
- Brown R., Curry E., Magnani L., Wilhelm-Benartzi C.S., Borley J. Poised epigenetic states and acquired drug resistance in cancer. Nat. Rev. Cancer. 2014;14:747–753. doi: 10.1038/nrc3819. [DOI] [PubMed] [Google Scholar]
- Bruck I., Kaplan D. Dbf4-Cdc7 phosphorylation of Mcm2 is required for cell growth. J. Biol. Chem. 2009;284:28823–28831. doi: 10.1074/jbc.M109.039123. [DOI] [PMC free article] [PubMed] [Google Scholar]
- Chai Z., Wang L., Zheng Y., Liang N., Wang X., Zheng Y., Zhang Z., Zhao C., Zhu T., Liu C. PADI3 plays an antitumor role via the Hsp90/CKS1 pathway in colon cancer. Cancer Cell Int. 2019;19:277. doi: 10.1186/s12935-019-0999-3. [DOI] [PMC free article] [PubMed] [Google Scholar]
- Cheng A.N., Lo Y.K., Lin Y.S., Tang T.K., Hsu C.H., Hsu J.T.A., Lee A.Y.L. Identification of novel Cdc7 kinase inhibitors as anti-cancer agents that target the interaction with Dbf4 by the fragment complementation and drug repositioning approach. EBioMedicine. 2018;36:241–251. doi: 10.1016/j.ebiom.2018.09.030. [DOI] [PMC free article] [PubMed] [Google Scholar]
- Cheng C.L.H., Tsang F.H.C., Wei L., Chen M., Chin D.W.C., Shen J., Law C.T., Lee D., Wong C.C.L., Ng I.O.L., Wong C.M. Bromodomain-containing protein BRPF1 is a therapeutic target for liver cancer. Commun. Biol. 2021;4:888. doi: 10.1038/s42003-021-02405-6. [DOI] [PMC free article] [PubMed] [Google Scholar]
- Cheng Y., He C., Wang M., Ma X., Mo F., Yang S., Han J., Wei X. Targeting epigenetic regulators for cancer therapy: mechanisms and advances in clinical trials. Signal Transduct. Target. Ther. 2019;4:62. doi: 10.1038/s41392-019-0095-0. [DOI] [PMC free article] [PubMed] [Google Scholar]
- Choi Y.J., Anders L. Signaling through cyclin D-dependent kinases. Oncogene. 2014;33:1890–1903. doi: 10.1038/onc.2013.137. [DOI] [PubMed] [Google Scholar]
- Chow L.S.N., Lam C.W., Chan S.Y.Y., Tsao S.W., To K.F., Tong S.F., Hung W.K., Dammann R., Huang D.P., Lo K.W. Identification of RASSF1A modulated genes in nasopharyngeal carcinoma. Oncogene. 2006;25:310–316. doi: 10.1038/sj.onc.1209001. [DOI] [PubMed] [Google Scholar]
- Chuang L.C., Teixeira L.K., Wohlschlegel J.A., Henze M., Yates J.R., Méndez J., Reed S.I. Phosphorylation of Mcm2 by Cdc7 promotes pre-replication complex assembly during cell-cycle re-entry. Mol. Cell. 2009;35:206–216. doi: 10.1016/j.molcel.2009.06.014. [DOI] [PMC free article] [PubMed] [Google Scholar]
- Diallo A., Prigent C. [The serine/threonine kinases that control cell cycle progression as therapeutic targets] Bull. Cancer. 2011;98:1335–1345. doi: 10.1684/bdc.2011.1467. [DOI] [PubMed] [Google Scholar]
- Ding L., Cao J., Lin W., Chen H., Xiong X., Ao H., Yu M., Lin J., Cui Q. The roles of cyclin-dependent kinases in cell-cycle progression and therapeutic strategies in human breast cancer. Int. J. Mol. Sci. 2020;21:E1960. doi: 10.3390/ijms21061960. [DOI] [PMC free article] [PubMed] [Google Scholar]
- Ding S., Wu X., Li G., Han M., Zhuang Y., Xu T. Efficient transposition of the piggyBac (PB) transposon in mammalian cells and mice. Cell. 2005;122:473–483. doi: 10.1016/j.cell.2005.07.013. [DOI] [PubMed] [Google Scholar]
- Evan G.I., Vousden K.H. Proliferation, cell cycle and apoptosis in cancer. Nature. 2001;411:342–348. doi: 10.1038/35077213. [DOI] [PubMed] [Google Scholar]
- Fekry B., Esmaeilniakooshkghazi A., Krupenko S.A., Krupenko N.I. Ceramide synthase 6 is a novel target of methotrexate mediating its antiproliferative effect in a p53-dependent manner. PLoS One. 2016;11:e0146618. doi: 10.1371/journal.pone.0146618. [DOI] [PMC free article] [PubMed] [Google Scholar]
- Feng S., De Carvalho D.D. Clinical advances in targeting epigenetics for cancer therapy. FEBS J. 2022;289:1214–1239. doi: 10.1111/febs.15750. [DOI] [PubMed] [Google Scholar]
- Fouad Y.A., Aanei C. Revisiting the hallmarks of cancer. Am. J. Cancer Res. 2017;7:1016–1036. [PMC free article] [PubMed] [Google Scholar]
- Gad S.A., Ali H.E.A., Gaballa R., Abdelsalam R.M., Zerfaoui M., Ali H.I., Salama S.H., Kenawy S.A., Kandil E., Abd Elmageed Z.Y. Targeting CDC7 sensitizes resistance melanoma cells to BRAF(V600E)-specific inhibitor by blocking the CDC7/MCM2-7 pathway. Sci. Rep. 2019;9:14197. doi: 10.1038/s41598-019-50732-w. [DOI] [PMC free article] [PubMed] [Google Scholar]
- Gallagher P.F., Coyle V., Evans T.J., Plummer E.R., Clive S., McGuigan L., Roxburgh P., Haris N.M., Symeonides S.N., Naylor G., et al. A CRUK first-in-human phase I trial of a CDC7 Inhibitor, LY3143921 hydrate, in patients with advanced solid tumors. J. Clin. Oncol. 2019;37:TPS3167. [Google Scholar]
- Giunta E.F., Arrichiello G., Curvietto M., Pappalardo A., Bosso D., Rosanova M., Diana A., Giordano P., Petrillo A., Federico P., et al. Epigenetic regulation in melanoma: facts and hopes. Cells. 2021;10:2048. doi: 10.3390/cells10082048. [DOI] [PMC free article] [PubMed] [Google Scholar]
- Goto T. Patient-derived tumor xenograft models: toward the establishment of precision cancer medicine. J. Pers. Med. 2020;10:E64. doi: 10.3390/jpm10030064. [DOI] [PMC free article] [PubMed] [Google Scholar]
- Hanahan D., Weinberg R.A. The hallmarks of cancer. Cell. 2000;100:57–70. doi: 10.1016/s0092-8674(00)81683-9. [DOI] [PubMed] [Google Scholar]
- Hao Q., Vadgama J.V., Wang P. CCL2/CCR2 signaling in cancer pathogenesis. Cell Commun. Signal. 2020;18:82. doi: 10.1186/s12964-020-00589-8. [DOI] [PMC free article] [PubMed] [Google Scholar]
- Haqq C., Nosrati M., Sudilovsky D., Crothers J., Pulliam B.L., Federman S., Miller J.R., 3rd, Allen R.E., Singer M.I., Allen R.E., Singer M.I., Khodabakhsh D., et al. The gene expression signatures of melanoma progression. Proc. Natl. Acad. Sci. USA. 2005;102:6092–6097. doi: 10.1073/pnas.0501564102. [DOI] [PMC free article] [PubMed] [Google Scholar]
- Hayashi T., Konishi I. Correlation of anti-tumour drug resistance with epigenetic regulation. Br. J. Cancer. 2021;124:681–682. doi: 10.1038/s41416-020-01183-y. [DOI] [PMC free article] [PubMed] [Google Scholar]
- Horibata S., Vo T.V., Subramanian V., Thompson P.R., Coonrod S.A. Utilization of the soft agar colony formation assay to identify inhibitors of tumorigenicity in breast cancer cells. J. Vis. Exp. 2015:e52727. doi: 10.3791/52727. [DOI] [PMC free article] [PubMed] [Google Scholar]
- Huggett M.T., Tudzarova S., Proctor I., Loddo M., Keane M.G., Stoeber K., Williams G.H., Pereira S.P. Cdc7 is a potent anti-cancer target in pancreatic cancer due to abrogation of the DNA origin activation checkpoint. Oncotarget. 2016;7:18495–18507. doi: 10.18632/oncotarget.7611. [DOI] [PMC free article] [PubMed] [Google Scholar]
- Hu-Lieskovan S., Robert L., Homet Moreno B., Ribas A. Combining targeted therapy with immunotherapy in BRAF-mutant melanoma: promise and challenges. J. Clin. Oncol. 2014;32:2248–2254. doi: 10.1200/JCO.2013.52.1377. [DOI] [PMC free article] [PubMed] [Google Scholar]
- Italiano A., Soria J.C., Toulmonde M., Michot J.M., Lucchesi C., Varga A., Coindre J.M., Blakemore S.J., Clawson A., Suttle B., et al. Tazemetostat, an EZH2 inhibitor, in relapsed or refractory B-cell non-Hodgkin lymphoma and advanced solid tumours: a first-in-human, open-label, phase 1 study. Lancet. Oncol. 2018;19:649–659. doi: 10.1016/S1470-2045(18)30145-1. [DOI] [PubMed] [Google Scholar]
- Ito S., Goto H., Kuniyasu K., Shindo M., Yamada M., Tanaka K., Toh G.T., Sawa M., Inagaki M., Bartek J., Masai H. Cdc7 kinase stimulates Aurora B kinase in M-phase. Sci. Rep. 2019;9:18622. doi: 10.1038/s41598-019-54738-2. [DOI] [PMC free article] [PubMed] [Google Scholar]
- Ito S., Taniyami C., Arai N., Masai H. Cdc7 as a potential new target for cancer therapy. Drug News Perspect. 2008;21:481–488. doi: 10.1358/dnp.2008.21.9.1290818. [DOI] [PubMed] [Google Scholar]
- Kastan M.B., Bartek J. Cell-cycle checkpoints and cancer. Nature. 2004;432:316–323. doi: 10.1038/nature03097. [DOI] [PubMed] [Google Scholar]
- Kelly T.K., De Carvalho D.D., Jones P.A. Epigenetic modifications as therapeutic targets. Nat. Biotechnol. 2010;28:1069–1078. doi: 10.1038/nbt.1678. [DOI] [PMC free article] [PubMed] [Google Scholar]
- Kikuchi M., Tanaka Y., Yokota M., Nishimiya H., Katoh H., Sengoku N., Kosaka Y. Analysis of the selection of CDK4/6 inhibitors based on experience using palbociclib. Biomed. Rep. 2019;11:253–256. doi: 10.3892/br.2019.1248. [DOI] [PMC free article] [PubMed] [Google Scholar]
- Kim E.M., Shin E.J., Choi J.H., Son H.J., Park I.S., Joh T.H., Hwang O. Matrix metalloproteinase-3 is increased and participates in neuronal apoptotic signaling downstream of caspase-12 during endoplasmic reticulum stress. J. Biol. Chem. 2010;285:16444–16452. doi: 10.1074/jbc.M109.093799. [DOI] [PMC free article] [PubMed] [Google Scholar]
- Kim K.H., Roberts C.W.M. Targeting EZH2 in cancer. Nat. Med. 2016;22:128–134. doi: 10.1038/nm.4036. [DOI] [PMC free article] [PubMed] [Google Scholar]
- Koltun E.S., Tsuhako A.L., Brown D.S., Aay N., Arcalas A., Chan V., Du H., Engst S., Ferguson K., Franzini M., et al. Discovery of XL413, a potent and selective CDC7 inhibitor. Bioorg. Med. Chem. Lett. 2012;22:3727–3731. doi: 10.1016/j.bmcl.2012.04.024. [DOI] [PubMed] [Google Scholar]
- Kulkarni A.A., Kingsbury S.R., Tudzarova S., Hong H.K., Loddo M., Rashid M., Rodriguez-Acebes S., Prevost A.T., Ledermann J.A., Stoeber K., Williams G.H. Cdc7 kinase is a predictor of survival and a novel therapeutic target in epithelial ovarian carcinoma. Clin. Cancer Res. 2009;15:2417–2425. doi: 10.1158/1078-0432.CCR-08-1276. [DOI] [PubMed] [Google Scholar]
- Laphanuwat P., Likasitwatanakul P., Sittithumcharee G., Thaphaengphan A., Chomanee N., Suppramote O., Ketaroonrut N., Charngkaew K., Lam E.W.F., Okada S., et al. Cyclin D1 depletion interferes with oxidative balance and promotes cancer cell senescence. J. Cell Sci. 2018;131:jcs214726. doi: 10.1242/jcs.214726. [DOI] [PubMed] [Google Scholar]
- Lee J.J., Murphy G.F., Lian C.G. Melanoma epigenetics: novel mechanisms, markers, and medicines. Lab. Invest. 2014;94:822–838. doi: 10.1038/labinvest.2014.87. [DOI] [PMC free article] [PubMed] [Google Scholar]
- Li Q., Xie W., Wang N., Li C., Wang M. CDC7-dependent transcriptional regulation of RAD54L is essential for tumorigenicity and radio-resistance of glioblastoma. Transl. Oncol. 2018;11:300–306. doi: 10.1016/j.tranon.2018.01.003. [DOI] [PMC free article] [PubMed] [Google Scholar]
- Li X., Tian R., Gao H., Yang Y., Williams B.R.G., Gantier M.P., McMillan N.A.J., Xu D., Hu Y., Gao Y. Identification of a histone family gene signature for predicting the prognosis of cervical cancer patients. Sci. Rep. 2017;7:16495. doi: 10.1038/s41598-017-16472-5. [DOI] [PMC free article] [PubMed] [Google Scholar]
- Li Z., Wang D., Lu J., Huang B., Wang Y., Dong M., Fan D., Li H., Gao Y., Hou P., et al. Methylation of EZH2 by PRMT1 regulates its stability and promotes breast cancer metastasis. Cell Death Differ. 2020;27:3226–3242. doi: 10.1038/s41418-020-00615-9. [DOI] [PMC free article] [PubMed] [Google Scholar]
- Mahajan S.D., Tutino V.M., Redae Y., Meng H., Siddiqui A., Woodruff T.M., Jarvis J.N., Hennon T., Schwartz S., Quigg R.J., Alexander J.J. C5a induces caspase-dependent apoptosis in brain vascular endothelial cells in experimental lupus. Immunology. 2016;148:407–419. doi: 10.1111/imm.12619. [DOI] [PMC free article] [PubMed] [Google Scholar]
- McLaughlin R.P., He J., van der Noord V.E., Redel J., Foekens J.A., Martens J.W.M., Smid M., Zhang Y., van de Water B. A kinase inhibitor screen identifies a dual cdc7/CDK9 inhibitor to sensitise triple-negative breast cancer to EGFR-targeted therapy. Breast Cancer Res. 2019;21:77. doi: 10.1186/s13058-019-1161-9. [DOI] [PMC free article] [PubMed] [Google Scholar]
- Melling N., Muth J., Simon R., Bokemeyer C., Terracciano L., Sauter G., Izbicki J.R., Marx A.H. Cdc7 overexpression is an independent prognostic marker and a potential therapeutic target in colorectal cancer. Diagn. Pathol. 2015;10:125. doi: 10.1186/s13000-015-0360-7. [DOI] [PMC free article] [PubMed] [Google Scholar]
- Merlino G., Herlyn M., Fisher D.E., Bastian B.C., Flaherty K.T., Davies M.A., Wargo J.A., Curiel-Lewandrowski C., Weber M.J., Leachman S.A., et al. The state of melanoma: challenges and opportunities. Pigment Cell Melanoma Res. 2016;29:404–416. doi: 10.1111/pcmr.12475. [DOI] [PMC free article] [PubMed] [Google Scholar]
- Merrick C.J., Jackson D., Diffley J.F.X. Visualization of altered replication dynamics after DNA damage in human cells. J. Biol. Chem. 2004;279:20067–20075. doi: 10.1074/jbc.M400022200. [DOI] [PubMed] [Google Scholar]
- Messeguer X., Escudero R., Farré D., Núñez O., Martínez J., Albà M.M. PROMO: detection of known transcription regulatory elements using species-tailored searches. Bioinformatics. 2002;18:333–334. doi: 10.1093/bioinformatics/18.2.333. [DOI] [PubMed] [Google Scholar]
- Miller A.J., Mihm M.C., Jr. Melanoma. N. Engl. J. Med. 2006;355:51–65. doi: 10.1056/NEJMra052166. [DOI] [PubMed] [Google Scholar]
- Montagnoli A., Moll J., Colotta F. Targeting cell division cycle 7 kinase: a new approach for cancer therapy. Clin. Cancer Res. 2010;16:4503–4508. doi: 10.1158/1078-0432.CCR-10-0185. [DOI] [PubMed] [Google Scholar]
- Moreira A., Heinzerling L., Bhardwaj N., Friedlander P. Current melanoma treatments: where do we stand? Cancers. 2021;13:E221. doi: 10.3390/cancers13020221. [DOI] [PMC free article] [PubMed] [Google Scholar]
- Prieto P.A., Reuben A., Cooper Z.A., Wargo J.A. Targeted therapies combined with immune checkpoint therapy. Cancer J. 2016;22:138–146. doi: 10.1097/PPO.0000000000000182. [DOI] [PMC free article] [PubMed] [Google Scholar]
- Rainey M.D., Bennett D., O'Dea R., Zanchetta M.E., Voisin M., Seoighe C., Santocanale C. ATR restrains DNA synthesis and mitotic catastrophe in response to CDC7 inhibition. Cell Rep. 2020;32:108096. doi: 10.1016/j.celrep.2020.108096. [DOI] [PubMed] [Google Scholar]
- Riker A.I., Enkemann S.A., Fodstad O., Liu S., Ren S., Morris C., Xi Y., Howell P., Metge B., Samant R.S., et al. The gene expression profiles of primary and metastatic melanoma yields a transition point of tumor progression and metastasis. BMC Med. Genomics. 2008;1:13. doi: 10.1186/1755-8794-1-13. [DOI] [PMC free article] [PubMed] [Google Scholar]
- Rius M., Lyko F. Epigenetic cancer therapy: rationales, targets and drugs. Oncogene. 2012;31:4257–4265. doi: 10.1038/onc.2011.601. [DOI] [PubMed] [Google Scholar]
- Rodriguez-Acebes S., Proctor I., Loddo M., Wollenschlaeger A., Rashid M., Falzon M., Prevost A.T., Sainsbury R., Stoeber K., Williams G.H. Targeting DNA replication before it starts: cdc7 as a therapeutic target in p53-mutant breast cancers. Am. J. Pathol. 2010;177:2034–2045. doi: 10.2353/ajpath.2010.100421. [DOI] [PMC free article] [PubMed] [Google Scholar]
- Sandhu C., Slingerland J. Deregulation of the cell cycle in cancer. Cancer Detect. Prev. 2000;24:107–118. [PubMed] [Google Scholar]
- Sawa M., Masai H. Drug design with Cdc7 kinase: a potential novel cancer therapy target. Drug Des. Devel. Ther. 2009;2:255–264. doi: 10.2147/dddt.s4303. [DOI] [PMC free article] [PubMed] [Google Scholar]
- Sharma S., Kelly T.K., Jones P.A. Epigenetics in cancer. Carcinogenesis. 2010;31:27–36. doi: 10.1093/carcin/bgp220. [DOI] [PMC free article] [PubMed] [Google Scholar]
- Sherr C.J., McCormick F. The RB and p53 pathways in cancer. Cancer Cell. 2002;2:103–112. doi: 10.1016/s1535-6108(02)00102-2. [DOI] [PubMed] [Google Scholar]
- Sheu Y.J., Stillman B. Cdc7-Dbf4 phosphorylates MCM proteins via a docking site-mediated mechanism to promote S phase progression. Mol. Cell. 2006;24:101–113. doi: 10.1016/j.molcel.2006.07.033. [DOI] [PMC free article] [PubMed] [Google Scholar]
- Shin M.H., Kim J., Lim S.A., Kim J., Lee K.M. Current insights into combination therapies with MAPK inhibitors and immune checkpoint blockade. Int. J. Mol. Sci. 2020;21:E2531. doi: 10.3390/ijms21072531. [DOI] [PMC free article] [PubMed] [Google Scholar]
- Shu J., Gu Y., Jin L., Wang H. Matrix metalloproteinase 3 regulates angiotensin IIinduced myocardial fibrosis cell viability, migration and apoptosis. Mol. Med. Rep. 2021;23:151. doi: 10.3892/mmr.2020.11790. [DOI] [PMC free article] [PubMed] [Google Scholar]
- Singh R., Mortazavi A., Telu K.H., Nagarajan P., Lucas D.M., Thomas-Ahner J.M., Clinton S.K., Byrd J.C., Freitas M.A., Parthun M.R. Increasing the complexity of chromatin: functionally distinct roles for replication-dependent histone H2A isoforms in cell proliferation and carcinogenesis. Nucleic Acids Res. 2013;41:9284–9295. doi: 10.1093/nar/gkt736. [DOI] [PMC free article] [PubMed] [Google Scholar]
- Si-Tayeb K., Monvoisin A., Mazzocco C., Lepreux S., Decossas M., Cubel G., Taras D., Blanc J.F., Robinson D.R., Rosenbaum J. Matrix metalloproteinase 3 is present in the cell nucleus and is involved in apoptosis. Am. J. Pathol. 2006;169:1390–1401. doi: 10.2353/ajpath.2006.060005. [DOI] [PMC free article] [PubMed] [Google Scholar]
- Siu K.T., Rosner M.R., Minella A.C. An integrated view of cyclin E function and regulation. Cell Cycle. 2012;11:57–64. doi: 10.4161/cc.11.1.18775. [DOI] [PMC free article] [PubMed] [Google Scholar]
- Skene P.J., Henikoff S. An efficient targeted nuclease strategy for high-resolution mapping of DNA binding sites. Elife. 2017;6:e21856. doi: 10.7554/eLife.21856. [DOI] [PMC free article] [PubMed] [Google Scholar]
- Spring L.M., Wander S.A., Andre F., Moy B., Turner N.C., Bardia A. Cyclin-dependent kinase 4 and 6 inhibitors for hormone receptor-positive breast cancer: past, present, and future. Lancet. 2020;395:817–827. doi: 10.1016/S0140-6736(20)30165-3. [DOI] [PubMed] [Google Scholar]
- Swords R., Mahalingam D., O'Dwyer M., Santocanale C., Kelly K., Carew J., Giles F. Cdc7 kinase - a new target for drug development. Eur. J. Cancer. 2010;46:33–40. doi: 10.1016/j.ejca.2009.09.020. [DOI] [PubMed] [Google Scholar]
- Talantov D., Mazumder A., Yu J.X., Briggs T., Jiang Y., Backus J., Atkins D., Wang Y. Novel genes associated with malignant melanoma but not benign melanocytic lesions. Clin. Cancer Res. 2005;11:7234–7242. doi: 10.1158/1078-0432.CCR-05-0683. [DOI] [PubMed] [Google Scholar]
- Tanda E.T., Vanni I., Boutros A., Andreotti V., Bruno W., Ghiorzo P., Spagnolo F. Current state of target treatment in BRAF mutated melanoma. Front. Mol. Biosci. 2020;7:154. doi: 10.3389/fmolb.2020.00154. [DOI] [PMC free article] [PubMed] [Google Scholar]
- Tsuji T., Ficarro S.B., Jiang W. Essential role of phosphorylation of MCM2 by Cdc7/Dbf4 in the initiation of DNA replication in mammalian cells. Mol. Biol. Cell. 2006;17:4459–4472. doi: 10.1091/mbc.E06-03-0241. [DOI] [PMC free article] [PubMed] [Google Scholar]
- Varambally S., Dhanasekaran S.M., Zhou M., Barrette T.R., Kumar-Sinha C., Sanda M.G., Ghosh D., Pienta K.J., Sewalt R.G.A.B., Otte A.P., et al. The polycomb group protein EZH2 is involved in progression of prostate cancer. Nature. 2002;419:624–629. doi: 10.1038/nature01075. [DOI] [PubMed] [Google Scholar]
- Vecchi L., Alves Pereira Zóia M., Goss Santos T., de Oliveira Beserra A., Colaço Ramos C.M., França Matias Colombo B., Paiva Maia Y.C., Piana de Andrade V., Teixeira Soares Mota S., Gonçalves de Araújo T., et al. Inhibition of the AnxA1/FPR1 autocrine axis reduces MDA-MB-231 breast cancer cell growth and aggressiveness in vitro and in vivo. Biochim. Biophys. Acta. Mol. Cell Res. 2018;1865:1368–1382. doi: 10.1016/j.bbamcr.2018.06.010. [DOI] [PubMed] [Google Scholar]
- Vejda S., Erlach N., Peter B., Drucker C., Rossmanith W., Pohl J., Schulte-Hermann R., Grusch M. Expression of activins C and E induces apoptosis in human and rat hepatoma cells. Carcinogenesis. 2003;24:1801–1809. doi: 10.1093/carcin/bgg154. [DOI] [PubMed] [Google Scholar]
- Vermeulen K., Van Bockstaele D.R., Berneman Z.N. The cell cycle: a review of regulation, deregulation and therapeutic targets in cancer. Cell Prolif. 2003;36:131–149. doi: 10.1046/j.1365-2184.2003.00266.x. [DOI] [PMC free article] [PubMed] [Google Scholar]
- Visconti R., Della Monica R., Grieco D. Cell cycle checkpoint in cancer: a therapeutically targetable double-edged sword. J. Exp. Clin. Cancer Res. 2016;35:153. doi: 10.1186/s13046-016-0433-9. [DOI] [PMC free article] [PubMed] [Google Scholar]
- Wang C., Vegna S., Jin H., Benedict B., Lieftink C., Ramirez C., de Oliveira R.L., Morris B., Gadiot J., Wang W., et al. Inducing and exploiting vulnerabilities for the treatment of liver cancer. Nature. 2019;574:268–272. doi: 10.1038/s41586-019-1607-3. [DOI] [PMC free article] [PubMed] [Google Scholar]
- Xu L., Shen S.S., Hoshida Y., Subramanian A., Ross K., Brunet J.P., Wagner S.N., Ramaswamy S., Mesirov J.P., Hynes R.O. Gene expression changes in an animal melanoma model correlate with aggressiveness of human melanoma metastases. Mol. Cancer Res. 2008;6:760–769. doi: 10.1158/1541-7786.MCR-07-0344. [DOI] [PMC free article] [PubMed] [Google Scholar]
- Yamagishi M., Uchimaru K. Targeting EZH2 in cancer therapy. Curr. Opin. Oncol. 2017;29:375–381. doi: 10.1097/CCO.0000000000000390. [DOI] [PubMed] [Google Scholar]
- Yan K., Rousseau J., Machol K., Cross L.A., Agre K.E., Gibson C.F., Goverde A., Engleman K.L., Verdin H., De Baere E., et al. Deficient histone H3 propionylation by BRPF1-KAT6 complexes in neurodevelopmental disorders and cancer. Sci. Adv. 2020;6:eaax0021. doi: 10.1126/sciadv.aax0021. [DOI] [PMC free article] [PubMed] [Google Scholar]
- Zauderer M.G., Szlosarek P.W., Le Moulec S., Popat S., Taylor P., Planchard D., Scherpereel A., Koczywas M., Forster M., Cameron R.B., et al. EZH2 inhibitor tazemetostat in patients with relapsed or refractory, BAP1-inactivated malignant pleural mesothelioma: a multicentre, open-label, phase 2 study. Lancet. Oncol. 2022;23:758–767. doi: 10.1016/S1470-2045(22)00277-7. [DOI] [PubMed] [Google Scholar]
- Zingg D., Arenas-Ramirez N., Sahin D., Rosalia R.A., Antunes A.T., Haeusel J., Sommer L., Boyman O. The histone methyltransferase Ezh2 controls mechanisms of adaptive resistance to tumor immunotherapy. Cell Rep. 2017;20:854–867. doi: 10.1016/j.celrep.2017.07.007. [DOI] [PubMed] [Google Scholar]
- Zingg D., Debbache J., Schaefer S.M., Tuncer E., Frommel S.C., Cheng P., Arenas-Ramirez N., Haeusel J., Zhang Y., Bonalli M., et al. The epigenetic modifier EZH2 controls melanoma growth and metastasis through silencing of distinct tumour suppressors. Nat. Commun. 2015;6:6051. doi: 10.1038/ncomms7051. [DOI] [PubMed] [Google Scholar]
Associated Data
This section collects any data citations, data availability statements, or supplementary materials included in this article.
Supplementary Materials
Data Availability Statement
RNA-sequencing data presented in this paper are submitted to Gene Expression Omnibus (Accession No. GSE158621, GSE186276, GSE185976) and available publicly without restrictions. This paper does not report original code. Any additional information required to reanalyze the data reported in this paper is available from the lead contact upon request.